Article

Statistical Analysis and Fatigue Life Estimations for Quenched and Tempered Steel at Different Tempering Temperatures

1
School of Mechanical Engineering and Automation, Northeastern University, Shenyang 110004, China
2
North Automatic Control Technology Institute, Taiyuan 030006, China
3
Shenyang Machine Tool Co., Ltd., Shenyang 110142, China
*
Author to whom correspondence should be addressed.
Metals 2017, 7(8), 312; https://doi.org/10.3390/met7080312
Submission received: 6 July 2017 / Revised: 8 August 2017 / Accepted: 9 August 2017 / Published: 16 August 2017

Abstract

:
In this paper, the statistical properties and fatigue life estimations of 0.44% carbon steel at different tempering temperatures are presented. The specimens were austenized at 900 °C for 10 min, quenched in water, tempered at different temperatures, and then machined to the design geometry and average surface roughness of Ra = 0.4 μm. The effect of tempering temperature on the fatigue life of 0.44% carbon steel was investigated using 75 fatigue tests, divided into three groups at temperatures 500 °C, 600 °C, and 700 °C. S–N and P–S–N curves were established. Two methods of estimating the mean fatigue life are presented. One is based on dislocation dipole accumulation and Paris’ law; another is based on the kriging model. Six more fatigue tests were carried out to validate the presented methods. Test results showed that the first method is superior to the second in terms of estimating accuracy from the validation datum. However, the second method could estimate the mean fatigue life of quenched and tempered 0.44% carbon steel with an average surface roughness of Ra = 0.4 μm when the tempering temperature was set to a value other than 500 °C, 600 °C, or 700 °C, with no additional fatigue test needed.

1. Introduction

Quenched and tempered constructional steel has a higher ratio of yield strength to tensile strength, a higher elongation, a less reduction of area, and a greater impact strength than steel without any heat treatment [1]. Steel quenching is defined as “cooling of steel workpieces at a rate faster than still air” [2]. The cooling rate is so fast that austenite is mainly transformed into martensite and bainite [3]. Mei and Morris’ study [4] showed that due to the influence of martensite, the fatigue crack growth rate of austenitic stainless steels 304 L was 10 times slower than that of 304 LN in the given condition. It has been reported that microstructure and residual stress relief are affected by tempering temperature in dual phase steels [5,6]. Moreover, the fatigue life of structures is mainly dependent on surface roughness, residual stress, and microstructure [7]. Therefore, it is important to investigate the fatigue property and life estimation of quenched and tempered steel at different tempering temperatures to improve the safety and reliability of the carbon steel in service.
The fatigue properties of quenched and tempered steel have been investigated by some researchers. Murakami et al. [8] investigated the effects of non-metallic inclusions on the fatigue properties of quenched and tempered 0.46% carbon steel in the range of super-high cycle fatigue life, and proposed an endurance limit prediction method by the area parameter model [9] with three parameters: the Vickers hardness of the matrix, the square root of the projected area of inclusions, and residual stress. Starke et al. [10,11] analyzed the fatigue behavior of quenched and tempered SAE (Society of Automotive Engineers) 4140 steel using three types of data: Stress–strain hysteresis, temperature, and electrical resistance. They proposed a fatigue life calculation method, PHYBAL, using data from only three fatigue tests. Gauland and Duquette [12] observed significant reductions in the fatigue resistance of quenched and tempered 4130 steel, with fretting cracks that deviated into the alloy becoming initiated fatigue cracks when the specimen was simultaneously subjected to cyclic stress and fretting of the surface.
The effects of tempering temperature on fatigue properties have been reported by some researchers. It was observed by London et al. [13] that in cantilevered bending fatigue samples, the growth rate of small surface cracks slowed slightly at the same cyclic stress intensity with an increase of the tempering temperature from 200 °C to 700 °C. Moreover, at tempering temperatures of 200 °C and 400 °C, the threshold of cyclic stress intensity for small crack propagation was above that for a long crack; at tempering temperatures of 550 °C and 700 °C, the threshold for small cracks was below corresponding long crack thresholds, with cracks at 700 °C tempering showing the small crack effect. Amirat et al. [14] showed that for W1.6753 (A high strength alloy steel Werkstoff 1.6753) steel near the threshold of its stress intensity factor, lowering the tempering temperature (500 °C vs. 200 °C) resulted in increased fatigue crack growth at 0.6 Hz and 78 Hz. Similar conclusions were also obtained by Tsay et al. [15], with fatigue crack growth rates decreasing as the tempering temperature increased from 400 °C to 600 °C for both D6AC steel plates and laser welds. They also showed that the endurance limit was also affected by the tempering temperature.
Opposing conclusions were obtained by Sultan [16] for carburized steel, where fatigue resistance was increased with an increase in tempering temperature: tested tempering temperatures were 200 °C, 300 °C, and 400 °C. Yu et al. [17] reported that the endurance limit of center-notched specimens increased as the tempering temperature decreased, and notch sensitivity and absolute notch fatigue strength were not significantly dependent on tempering temperature. Using uniaxial tension–compression fatigue tests of high-strength steel tempered at different tempering temperatures (433 K and 573 K), Oguma and Nakamura [18] found: (1) In the 104–105 cycle range, the endurance limit for both tempering conditions was proportional to the Vickers hardness S e 1.6   Hv ; (2) In the 105–108 cycle range, the material tempered at a lower temperature showed a lower endurance limit. In Reference [19], the results of fatigue tests of high-strength spring steel showed that the highest endurance limit, ductility, and toughness were achieved when the tempering temperature was 450 °C. For the experiment, the material was austenized at 900 °C for 40 min and quenched in oil, and then tempered for 30 min at temperatures of 300 °C, 350 °C, 400 °C, 450 °C, and 500 °C. Another report [20] found that material tempered at 250 °C exhibited superior fatigue properties in short life regions when steel was heated up to 950 °C for 5 min and quenched using water. Tempering treatments at temperatures of 100 °C, 250 °C, and 340 °C were performed for 30 min and followed by air cooling. The effects of tempering temperature on 4300 sintered steel have been investigated by Williams et al. [21], who found that an increase in tempering temperature of 54% resulted in a 2% increase in the endurance limit when specimens were tempered for one hour in air at either 205 °C or 315 °C. The experimental results of Siddiqui et al. [22] showed an initial increase in the number of cycles to fail when tempering was changed from 100 °C to 200 °C for 30 min, but that further increase in tempering time and temperature reduced the resistance to fatigue failure. It was also seen by Anctil and Kula [23] that the crack growth rates of 4340 steel decreased as the tempering temperature increased to 600 F, and then increased again with higher tempering temperatures.
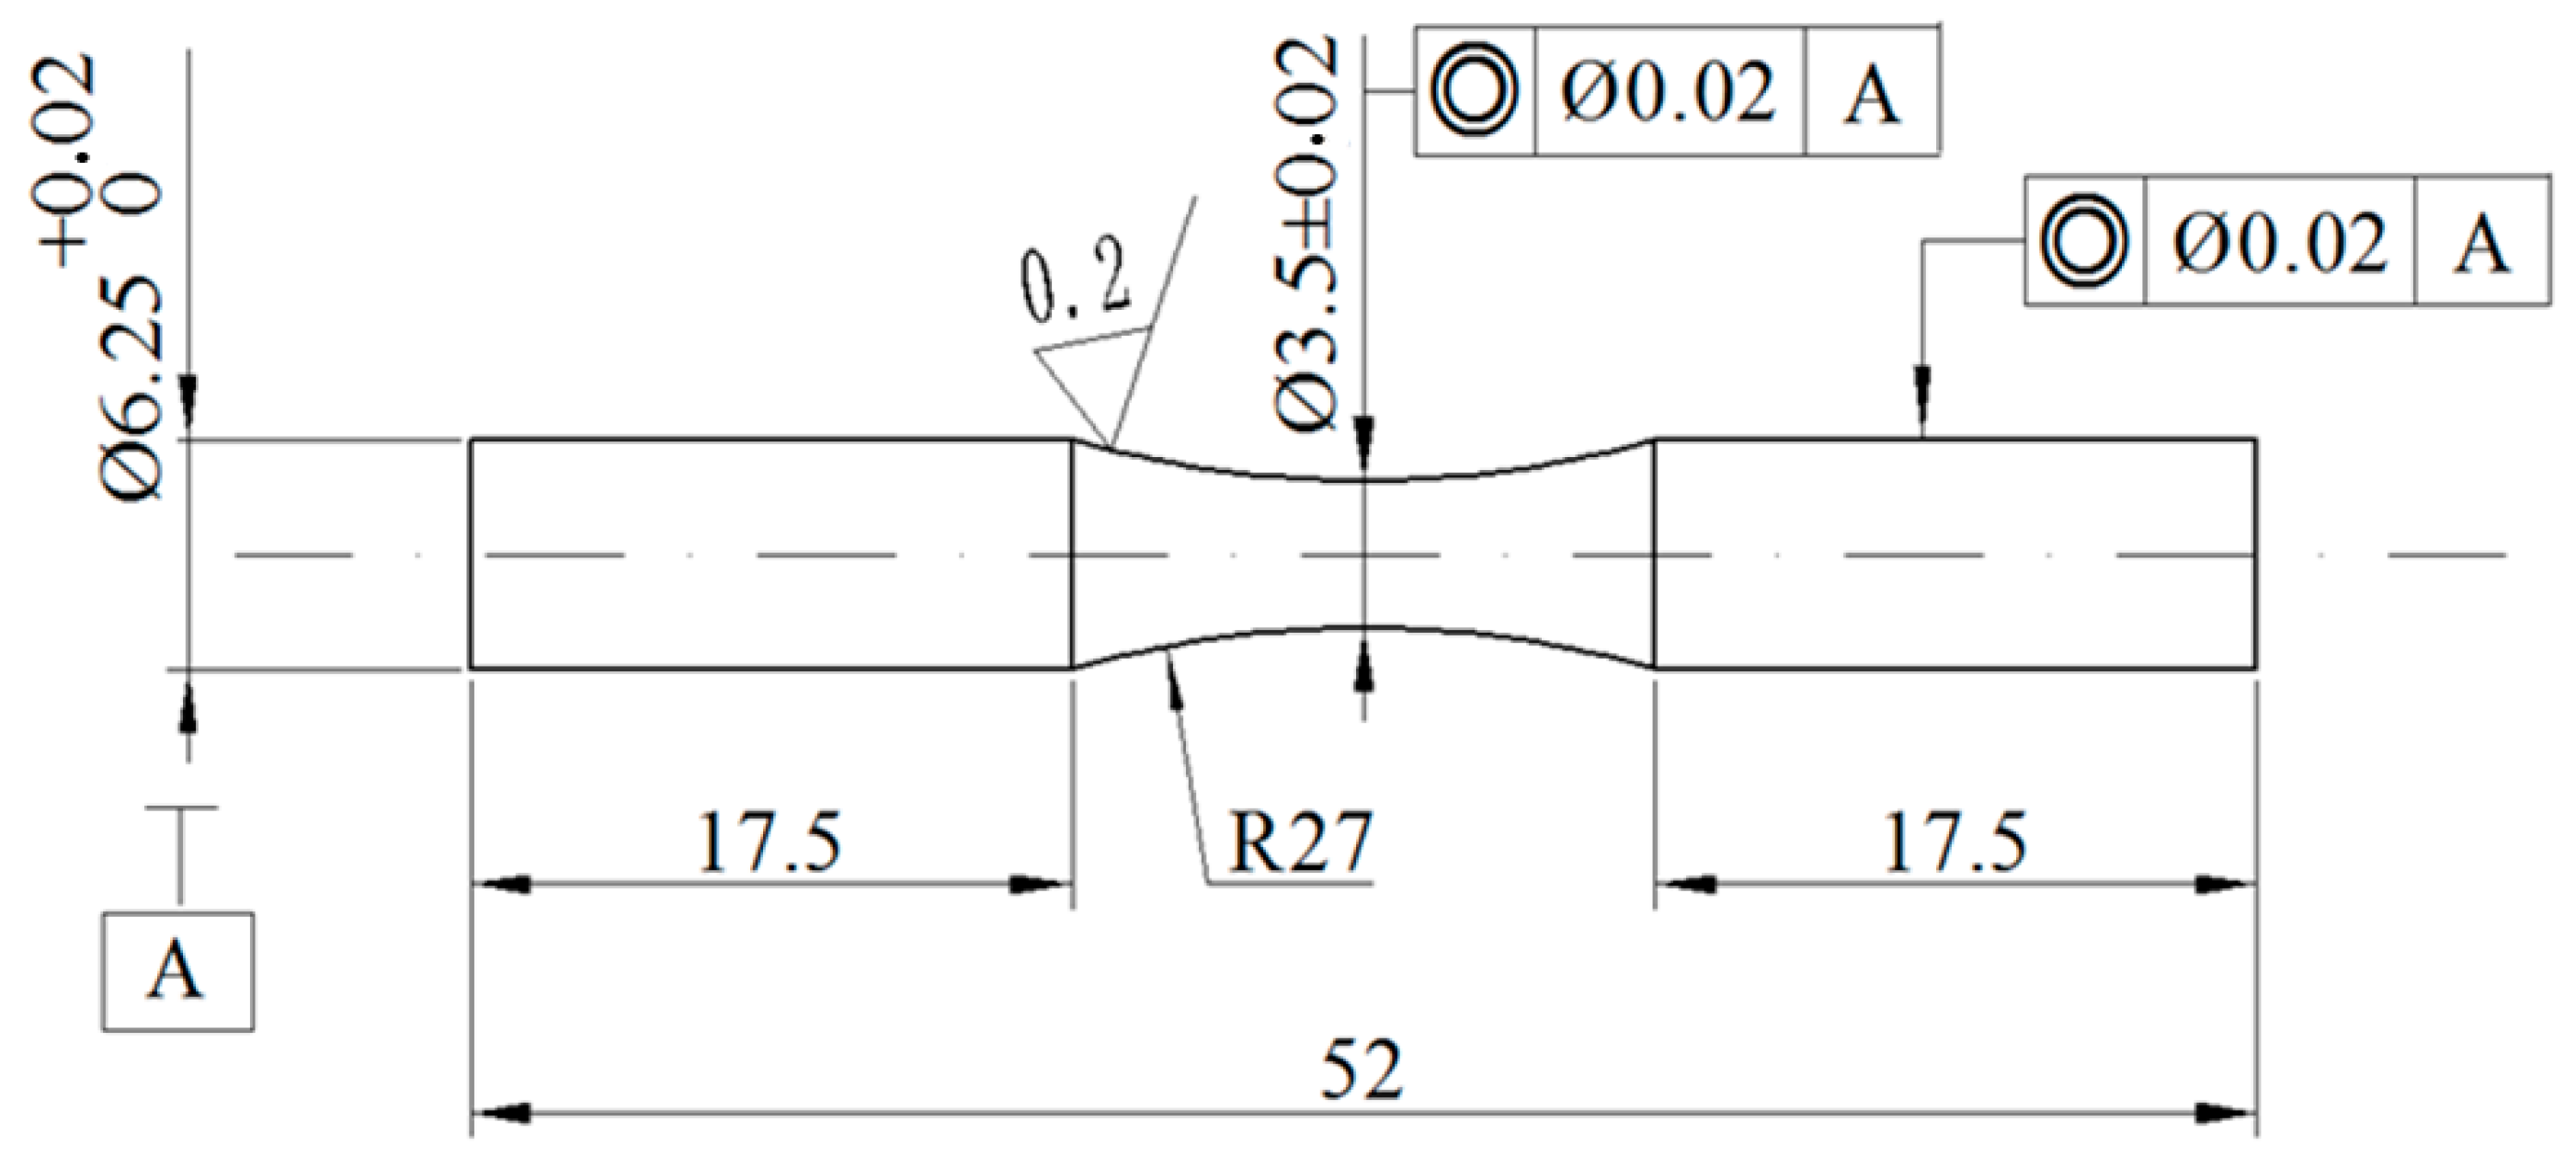
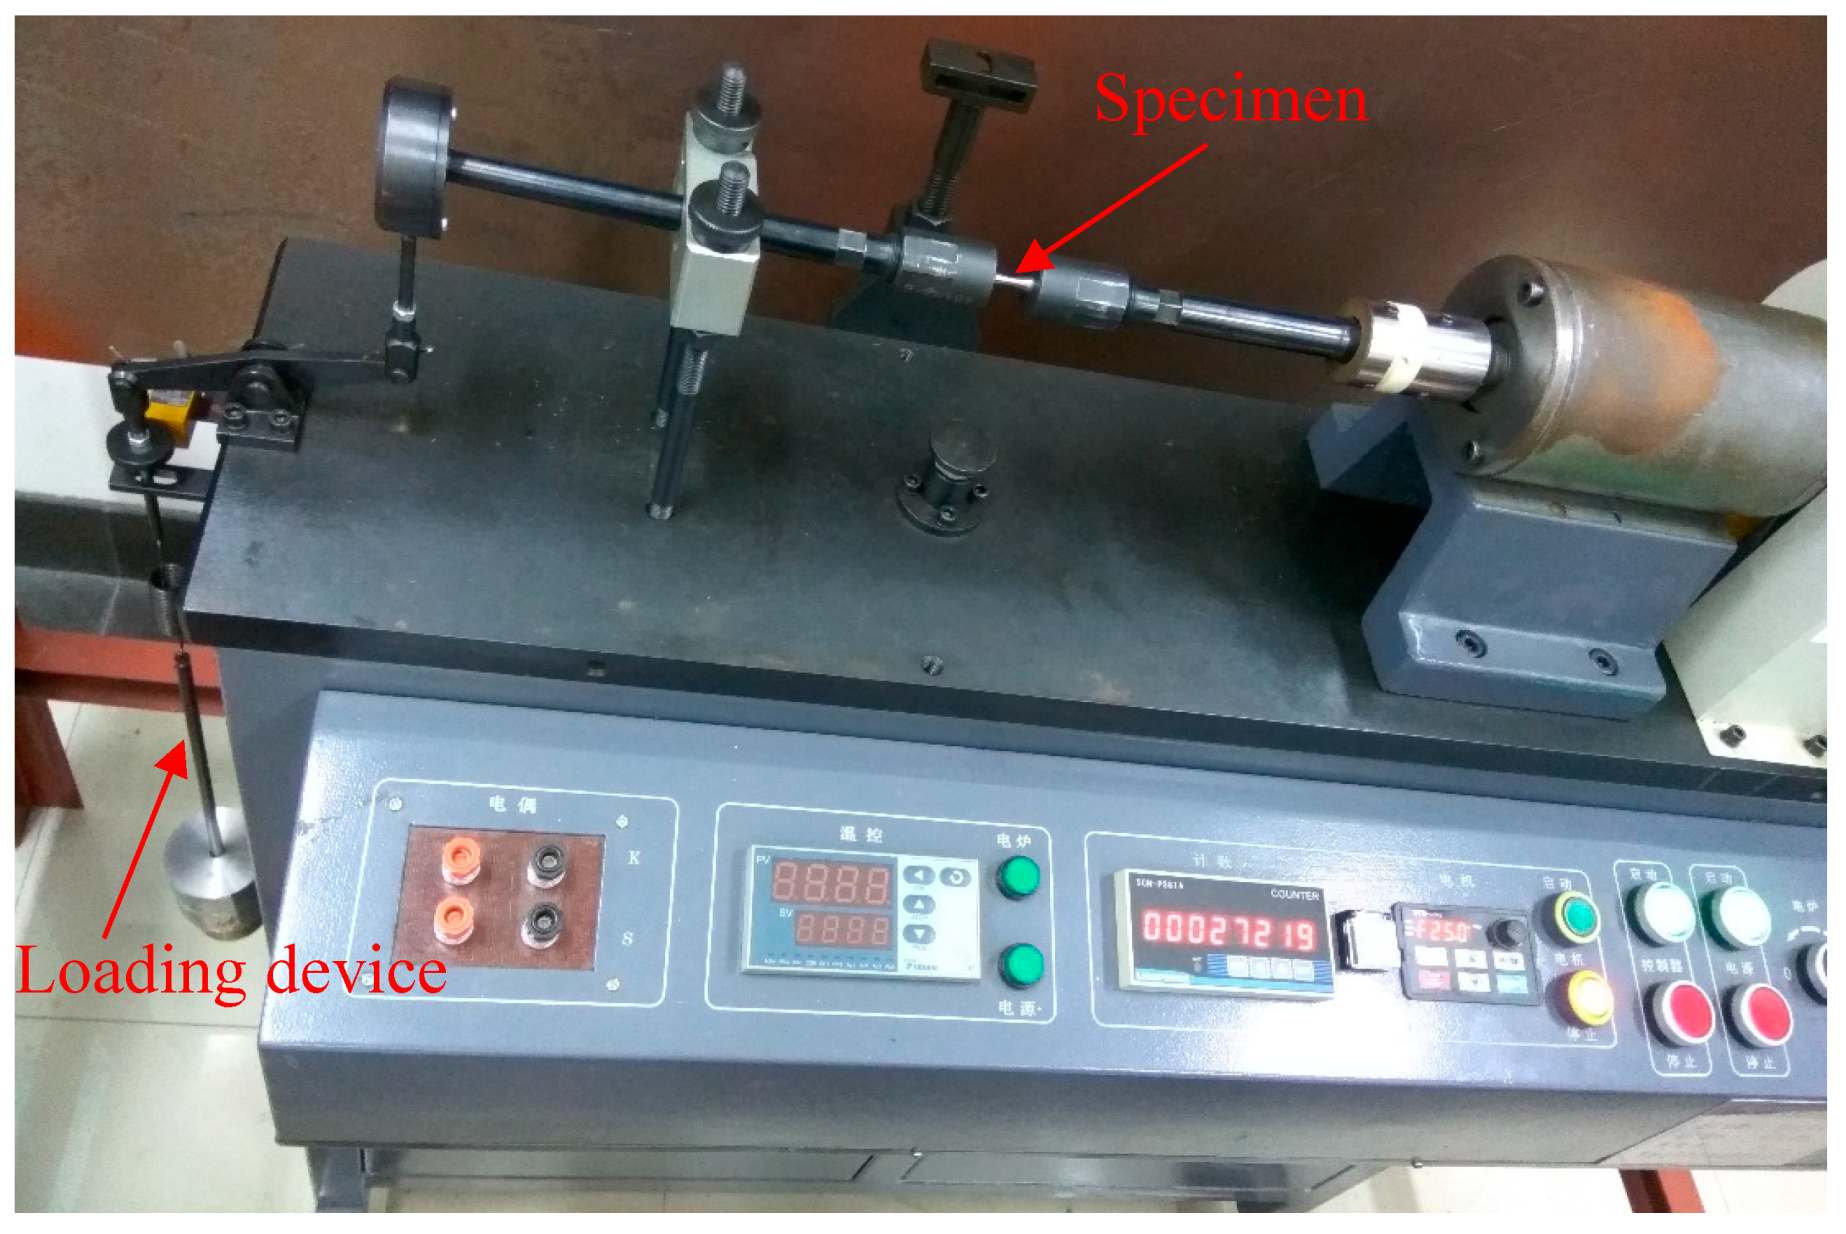
For this work, the statistical properties of the fatigue life for quenched and tempered 0.44% carbon steel are analyzed and the fatigue life is estimated. The specimens were austenized at 900 °C and quenched in water, and subsequently tempered at different tempering temperatures. The chemical composition of the material, specimen geometry, and the testing machine are described, and the mechanical properties of specimens tempered at different tempering temperatures are shown in 
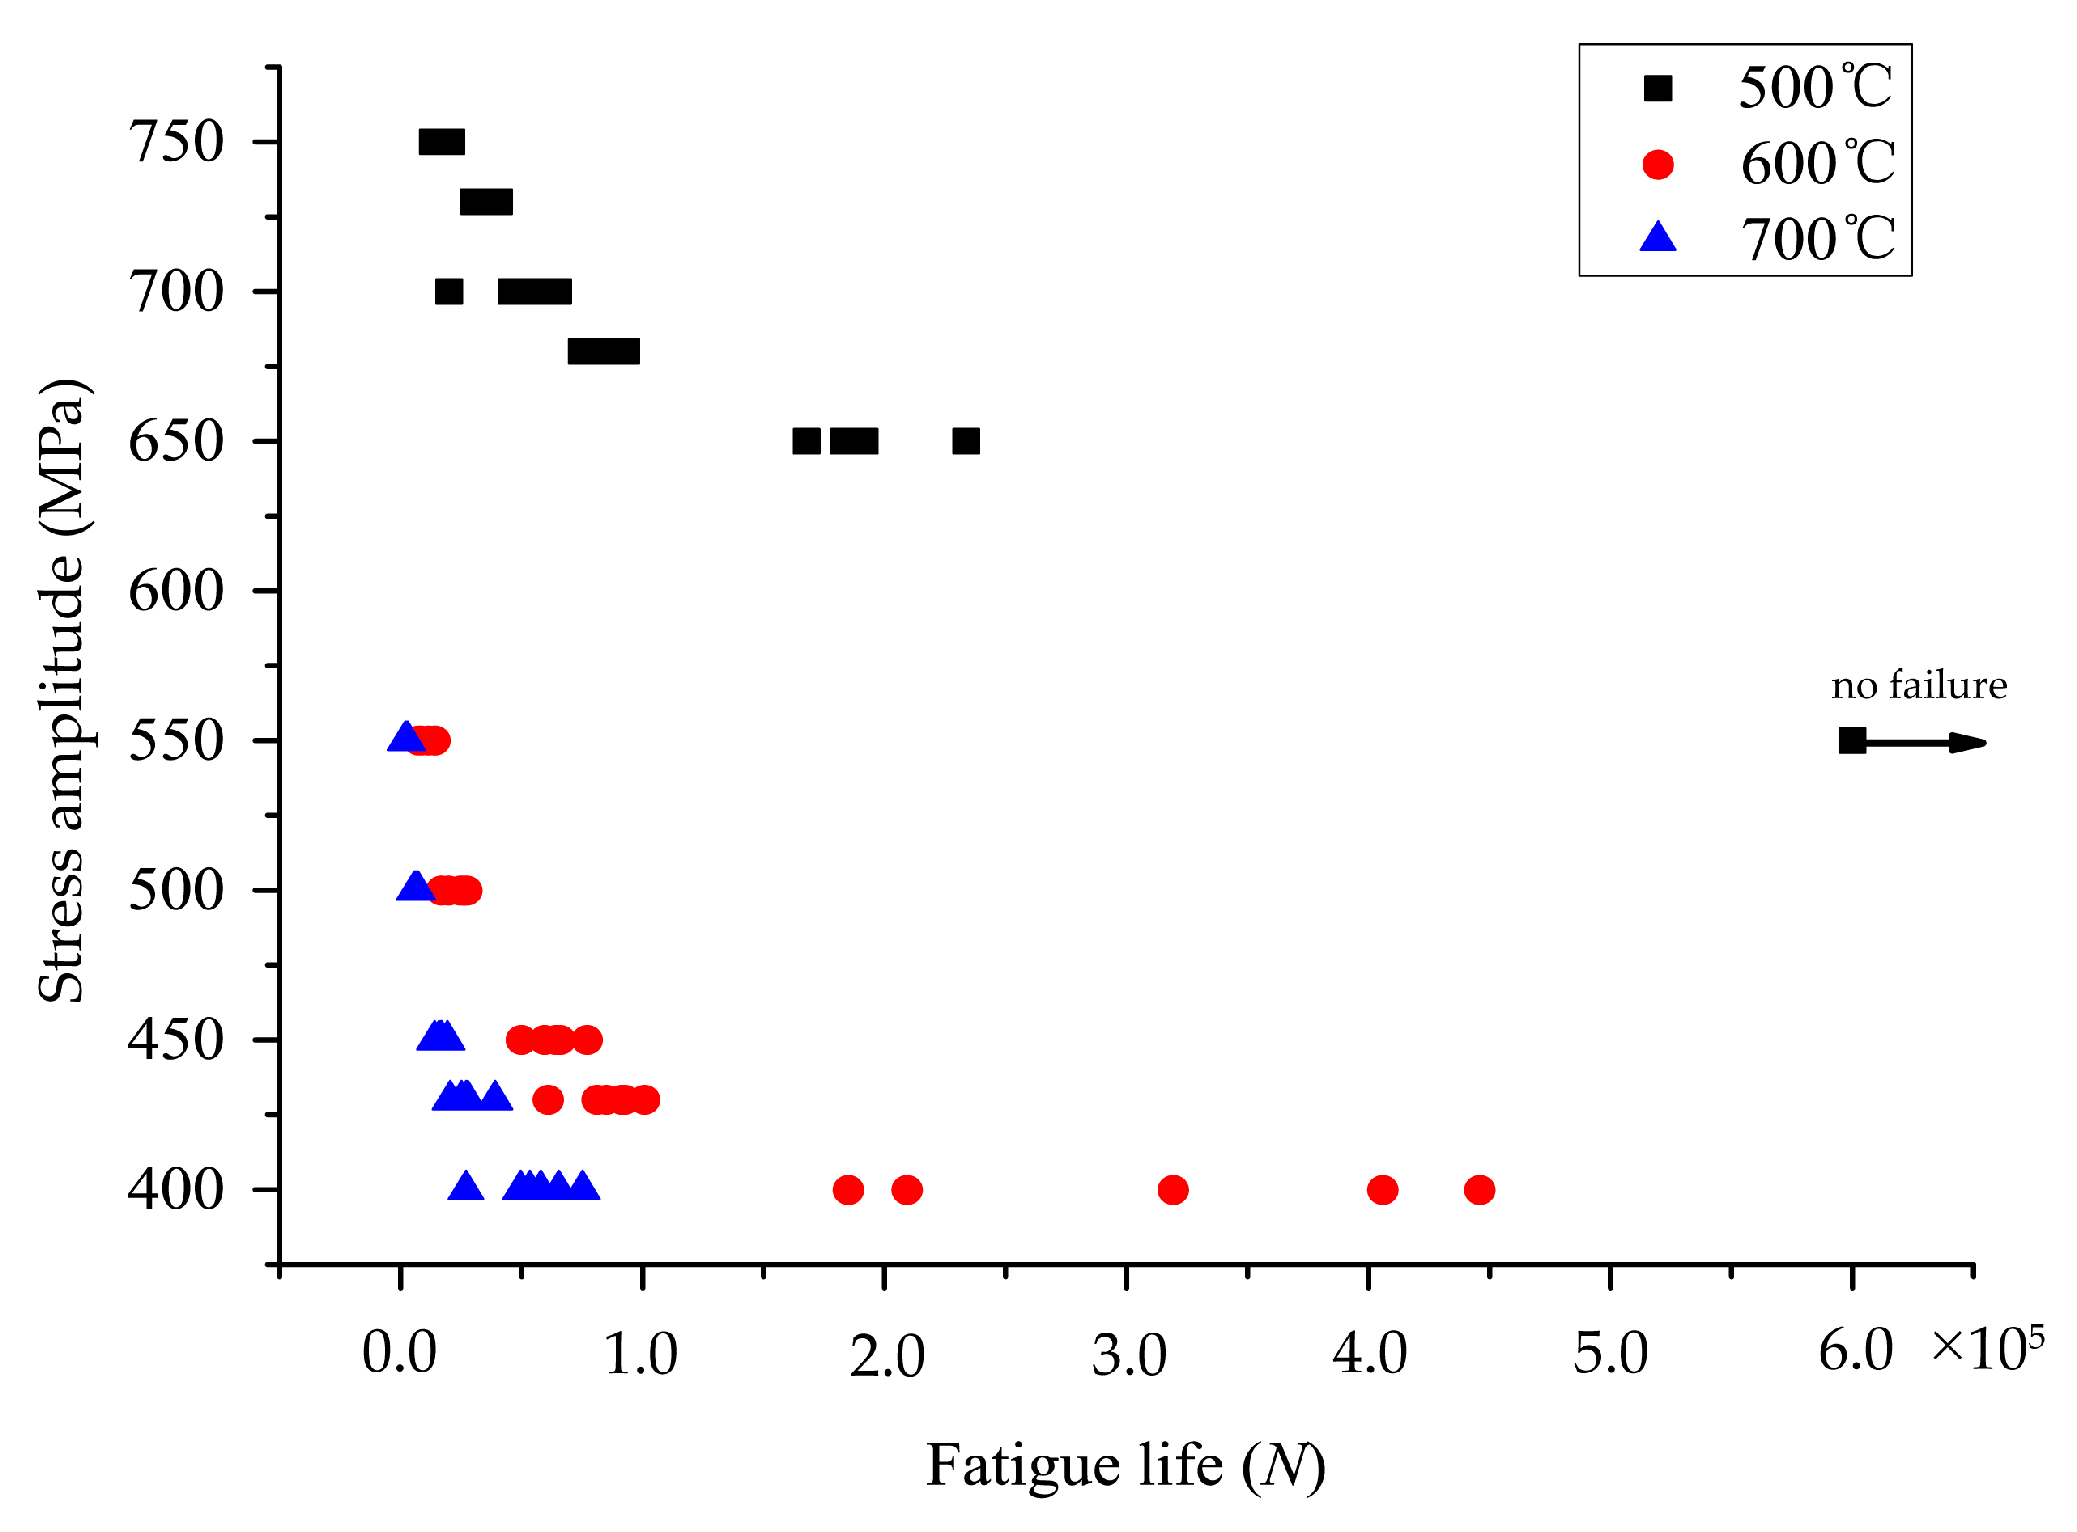
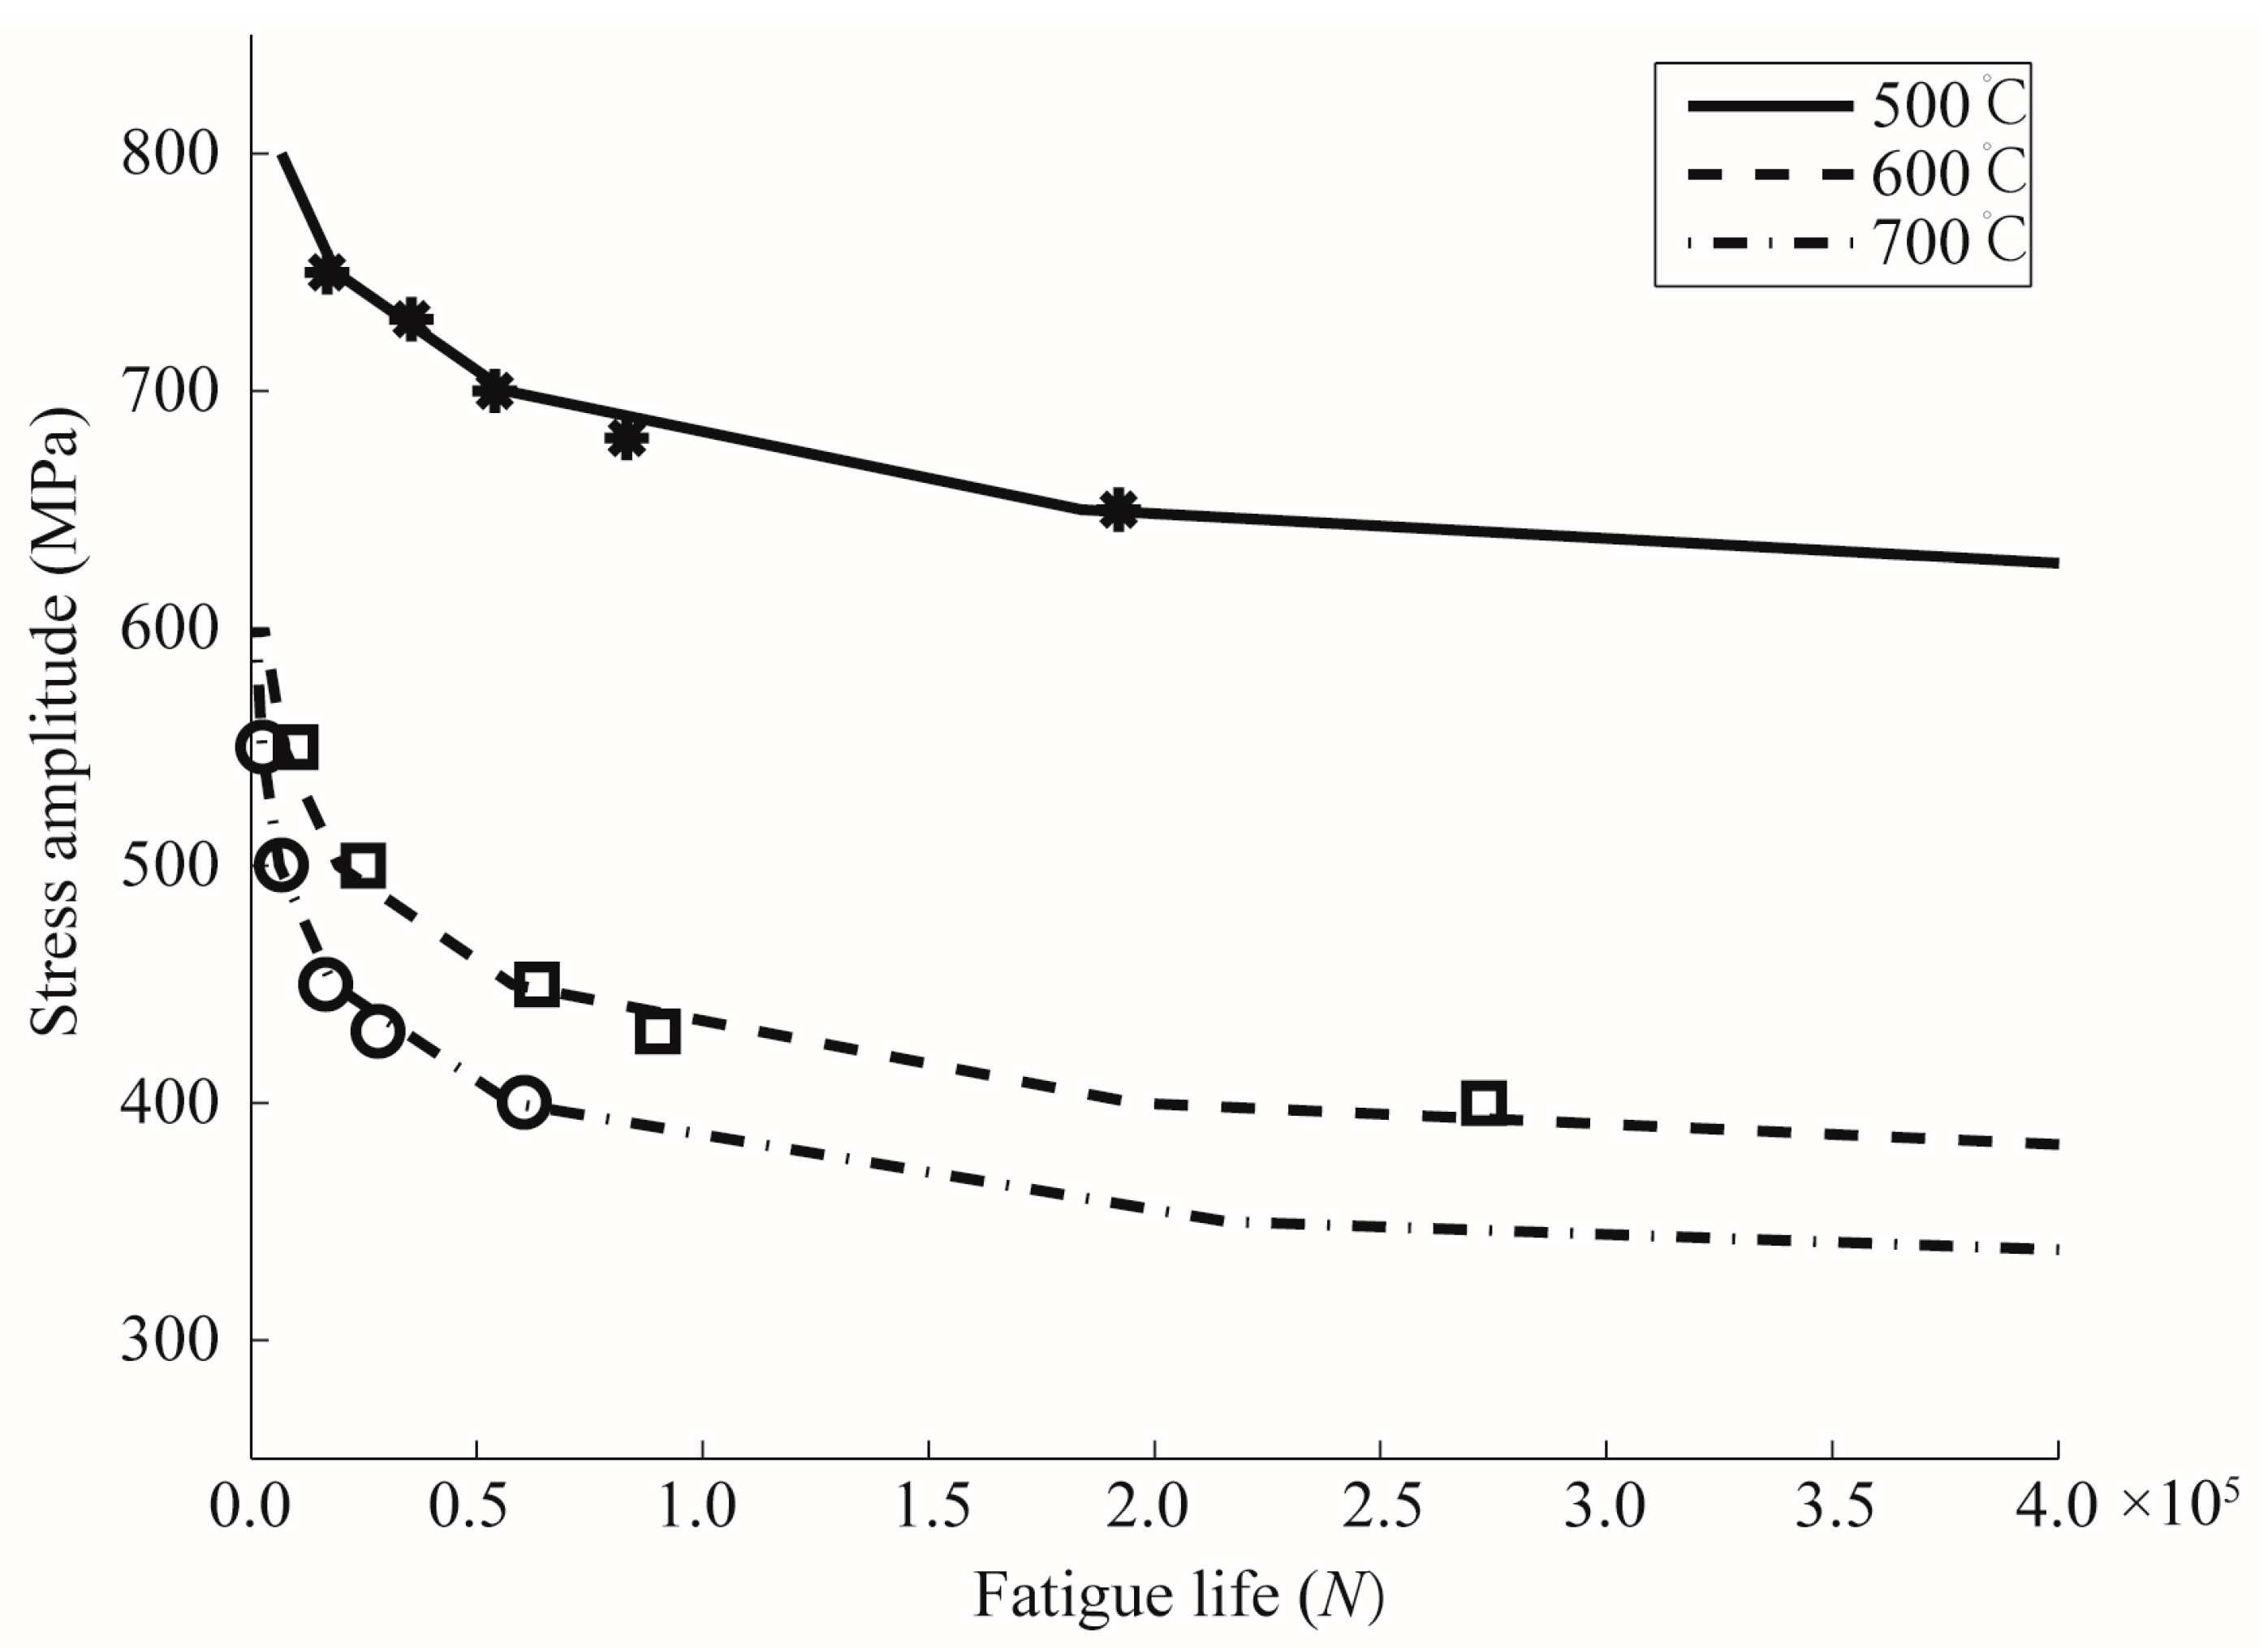
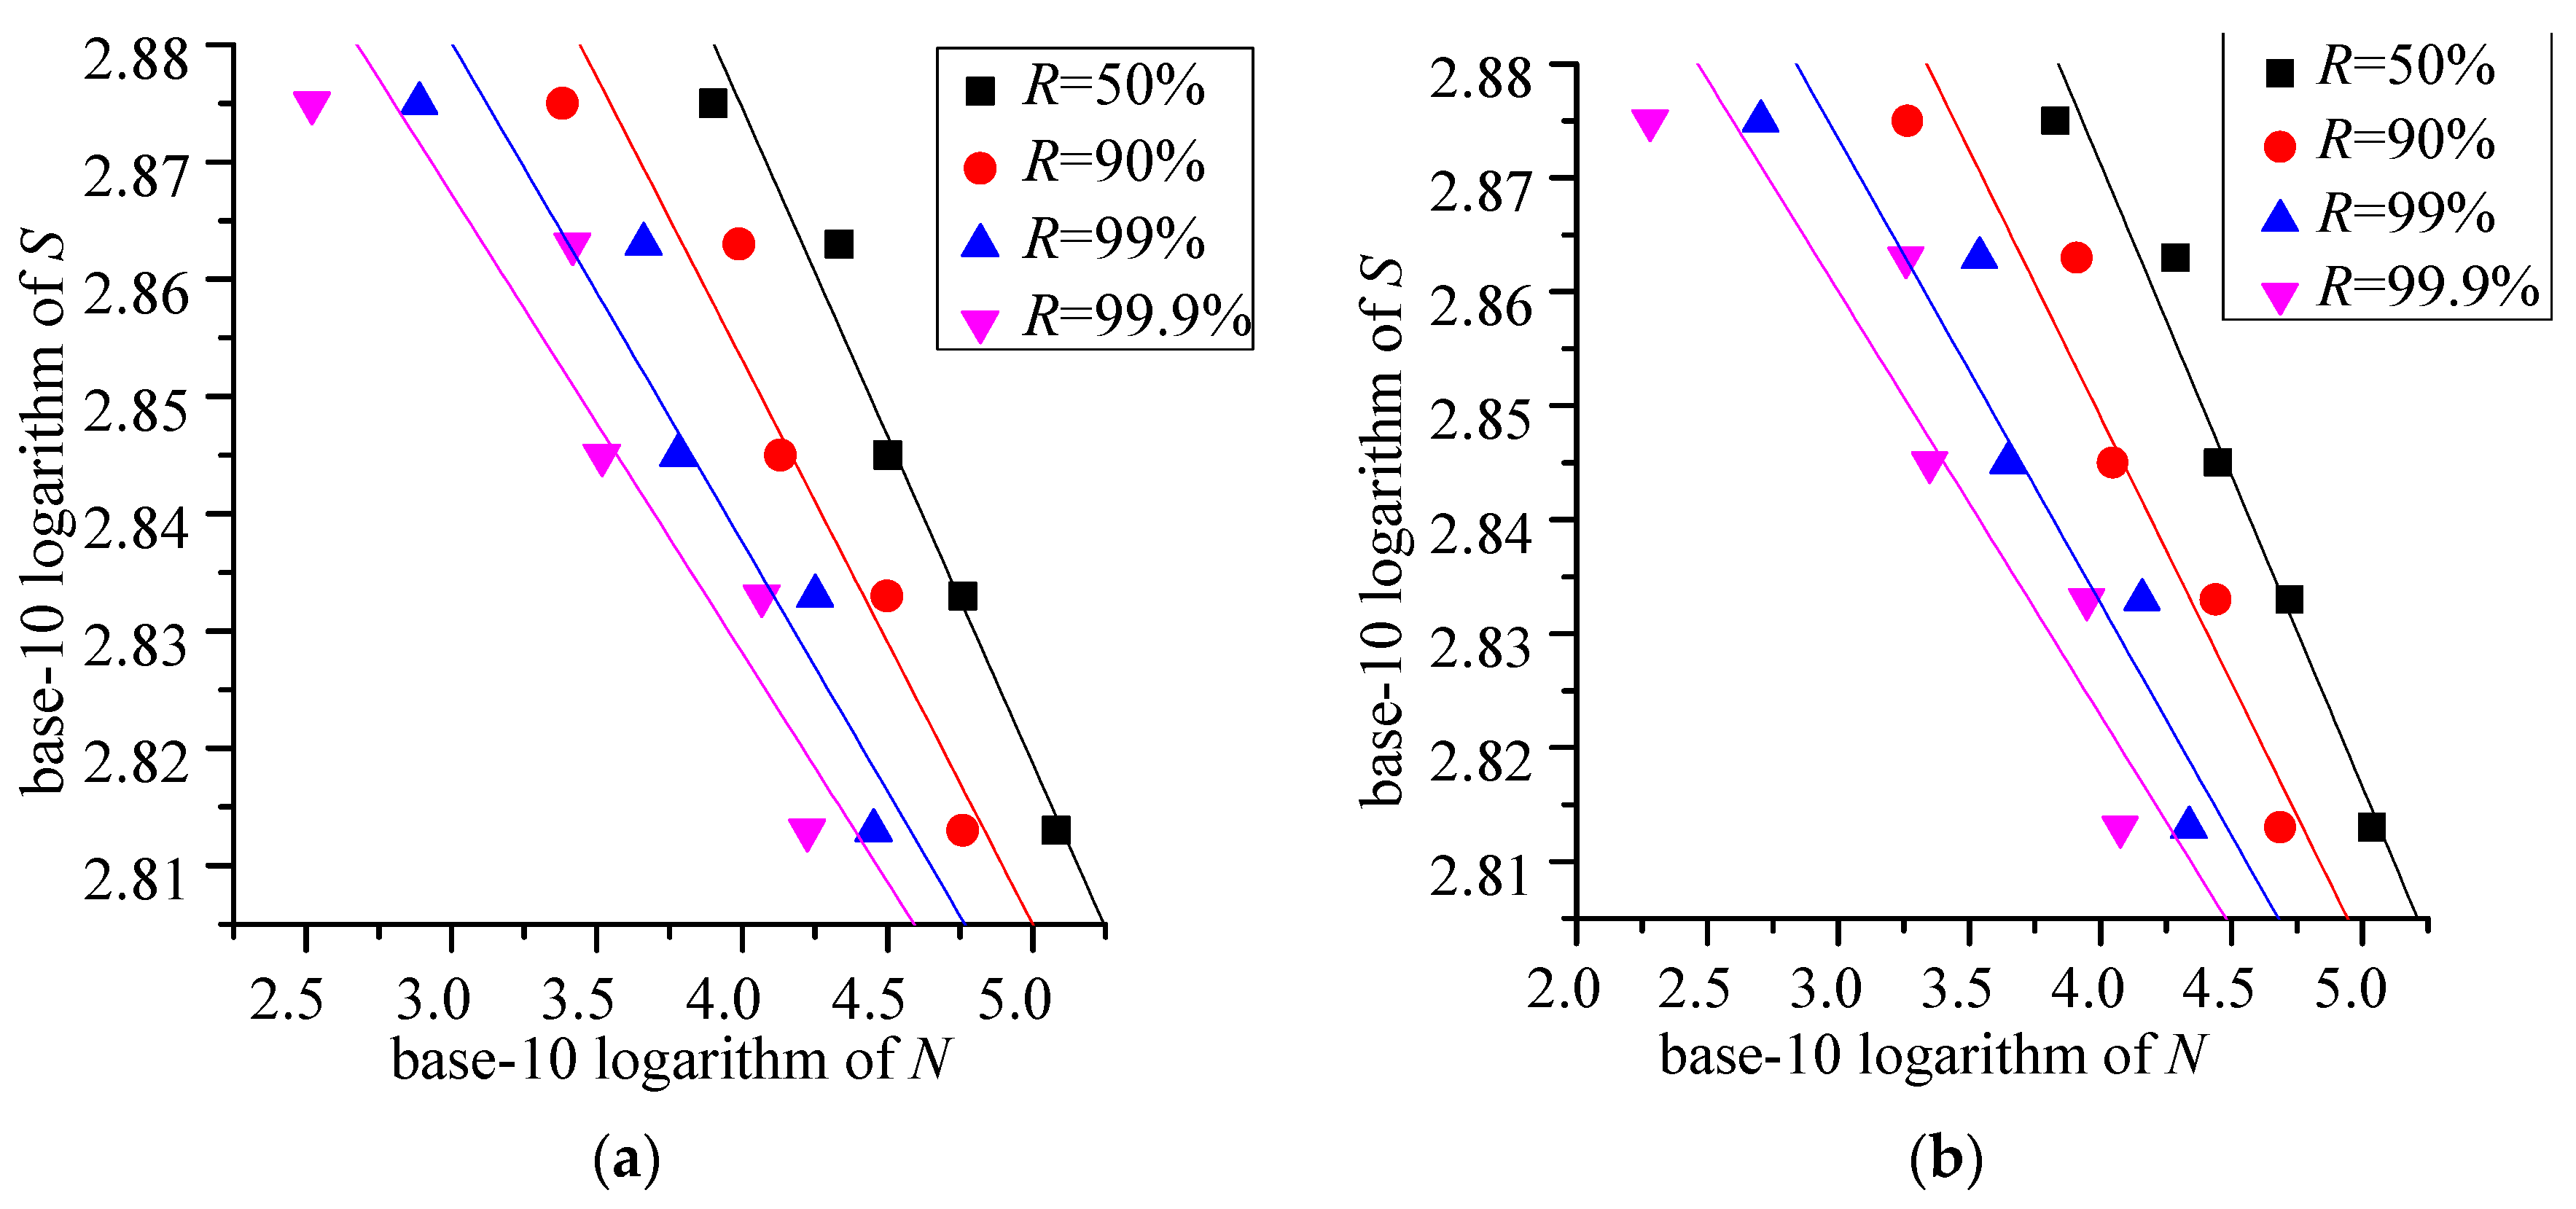
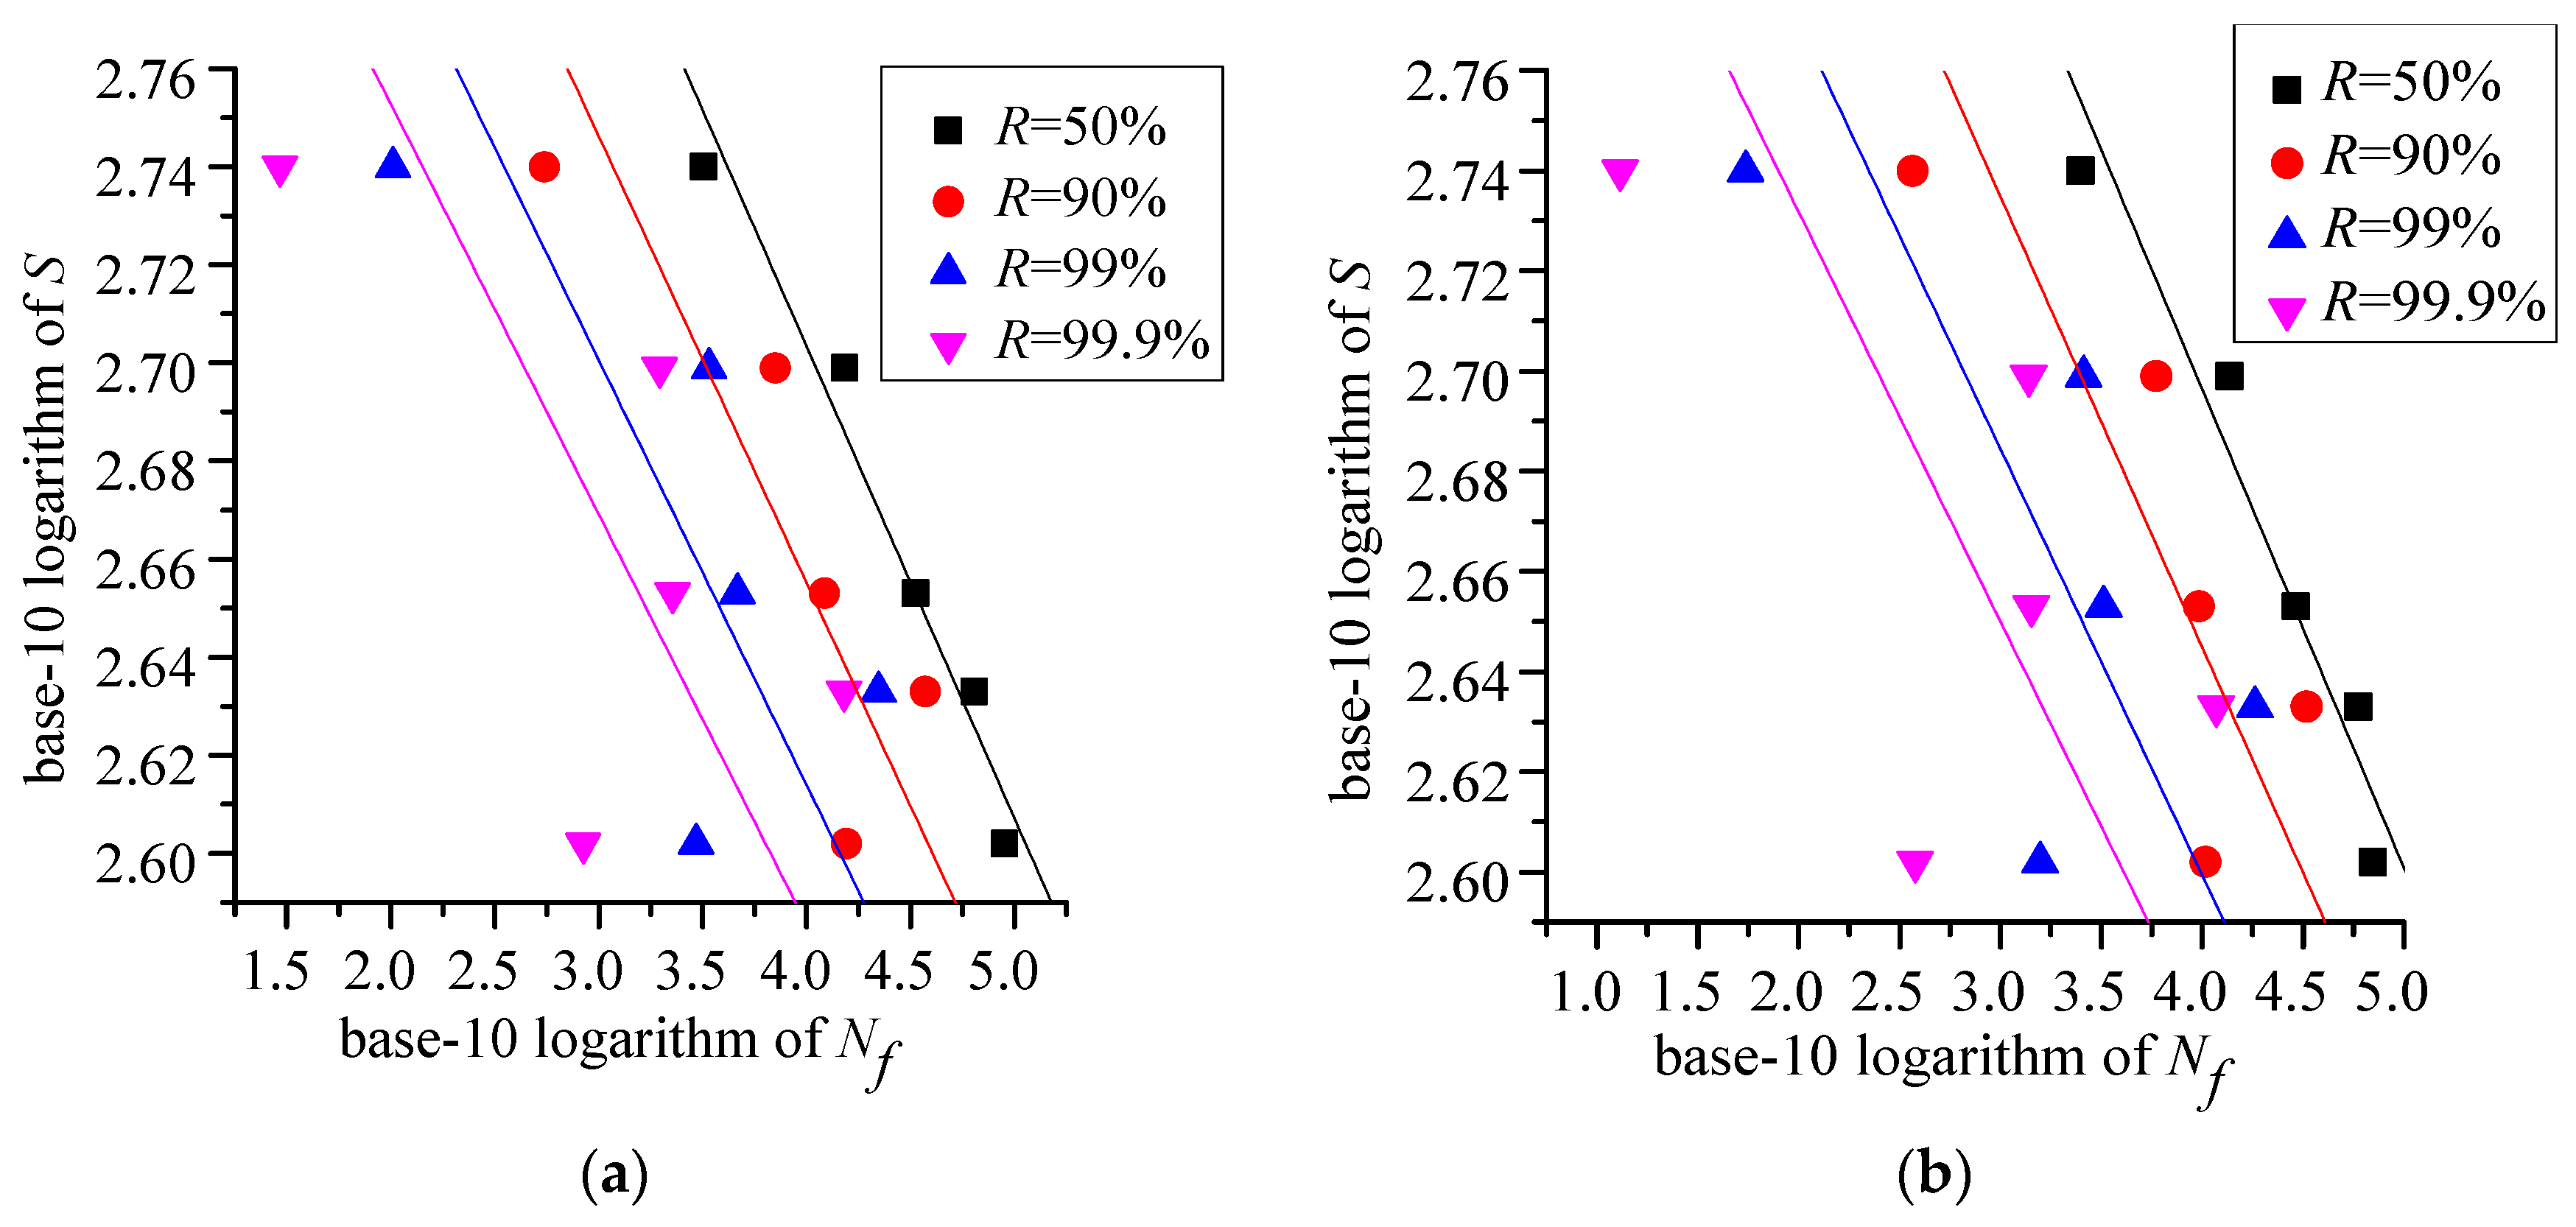
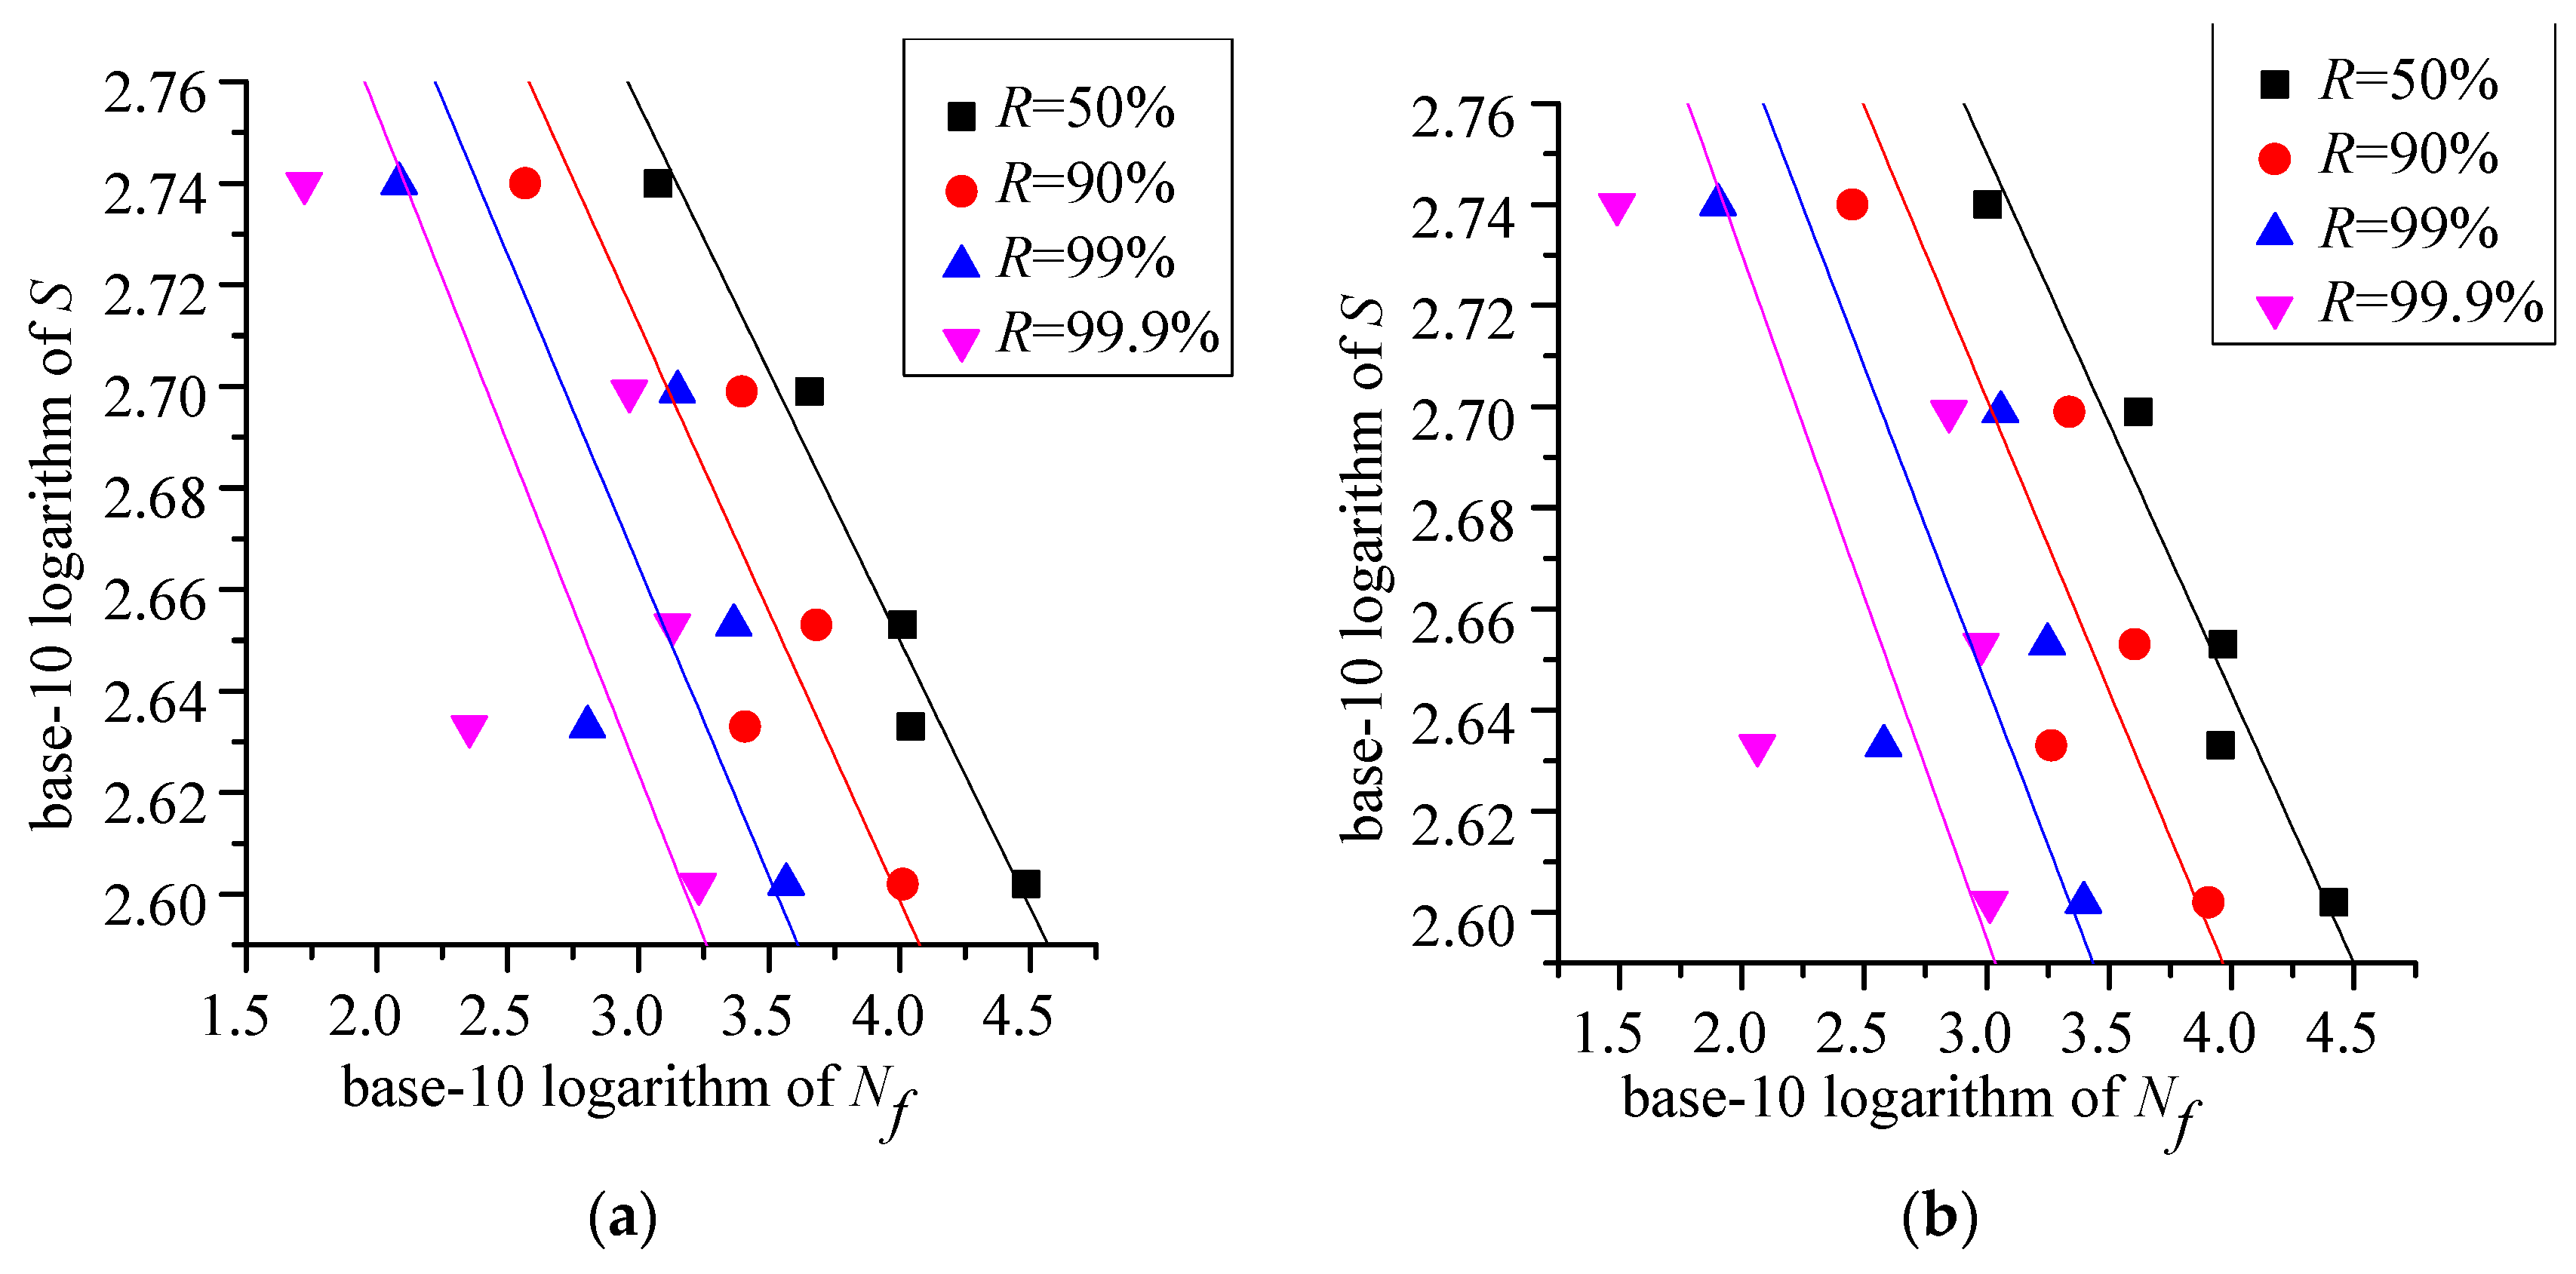
Section 2. S–N curves, P–S–N curves, and their estimated parameters are presented in Section 3. In 
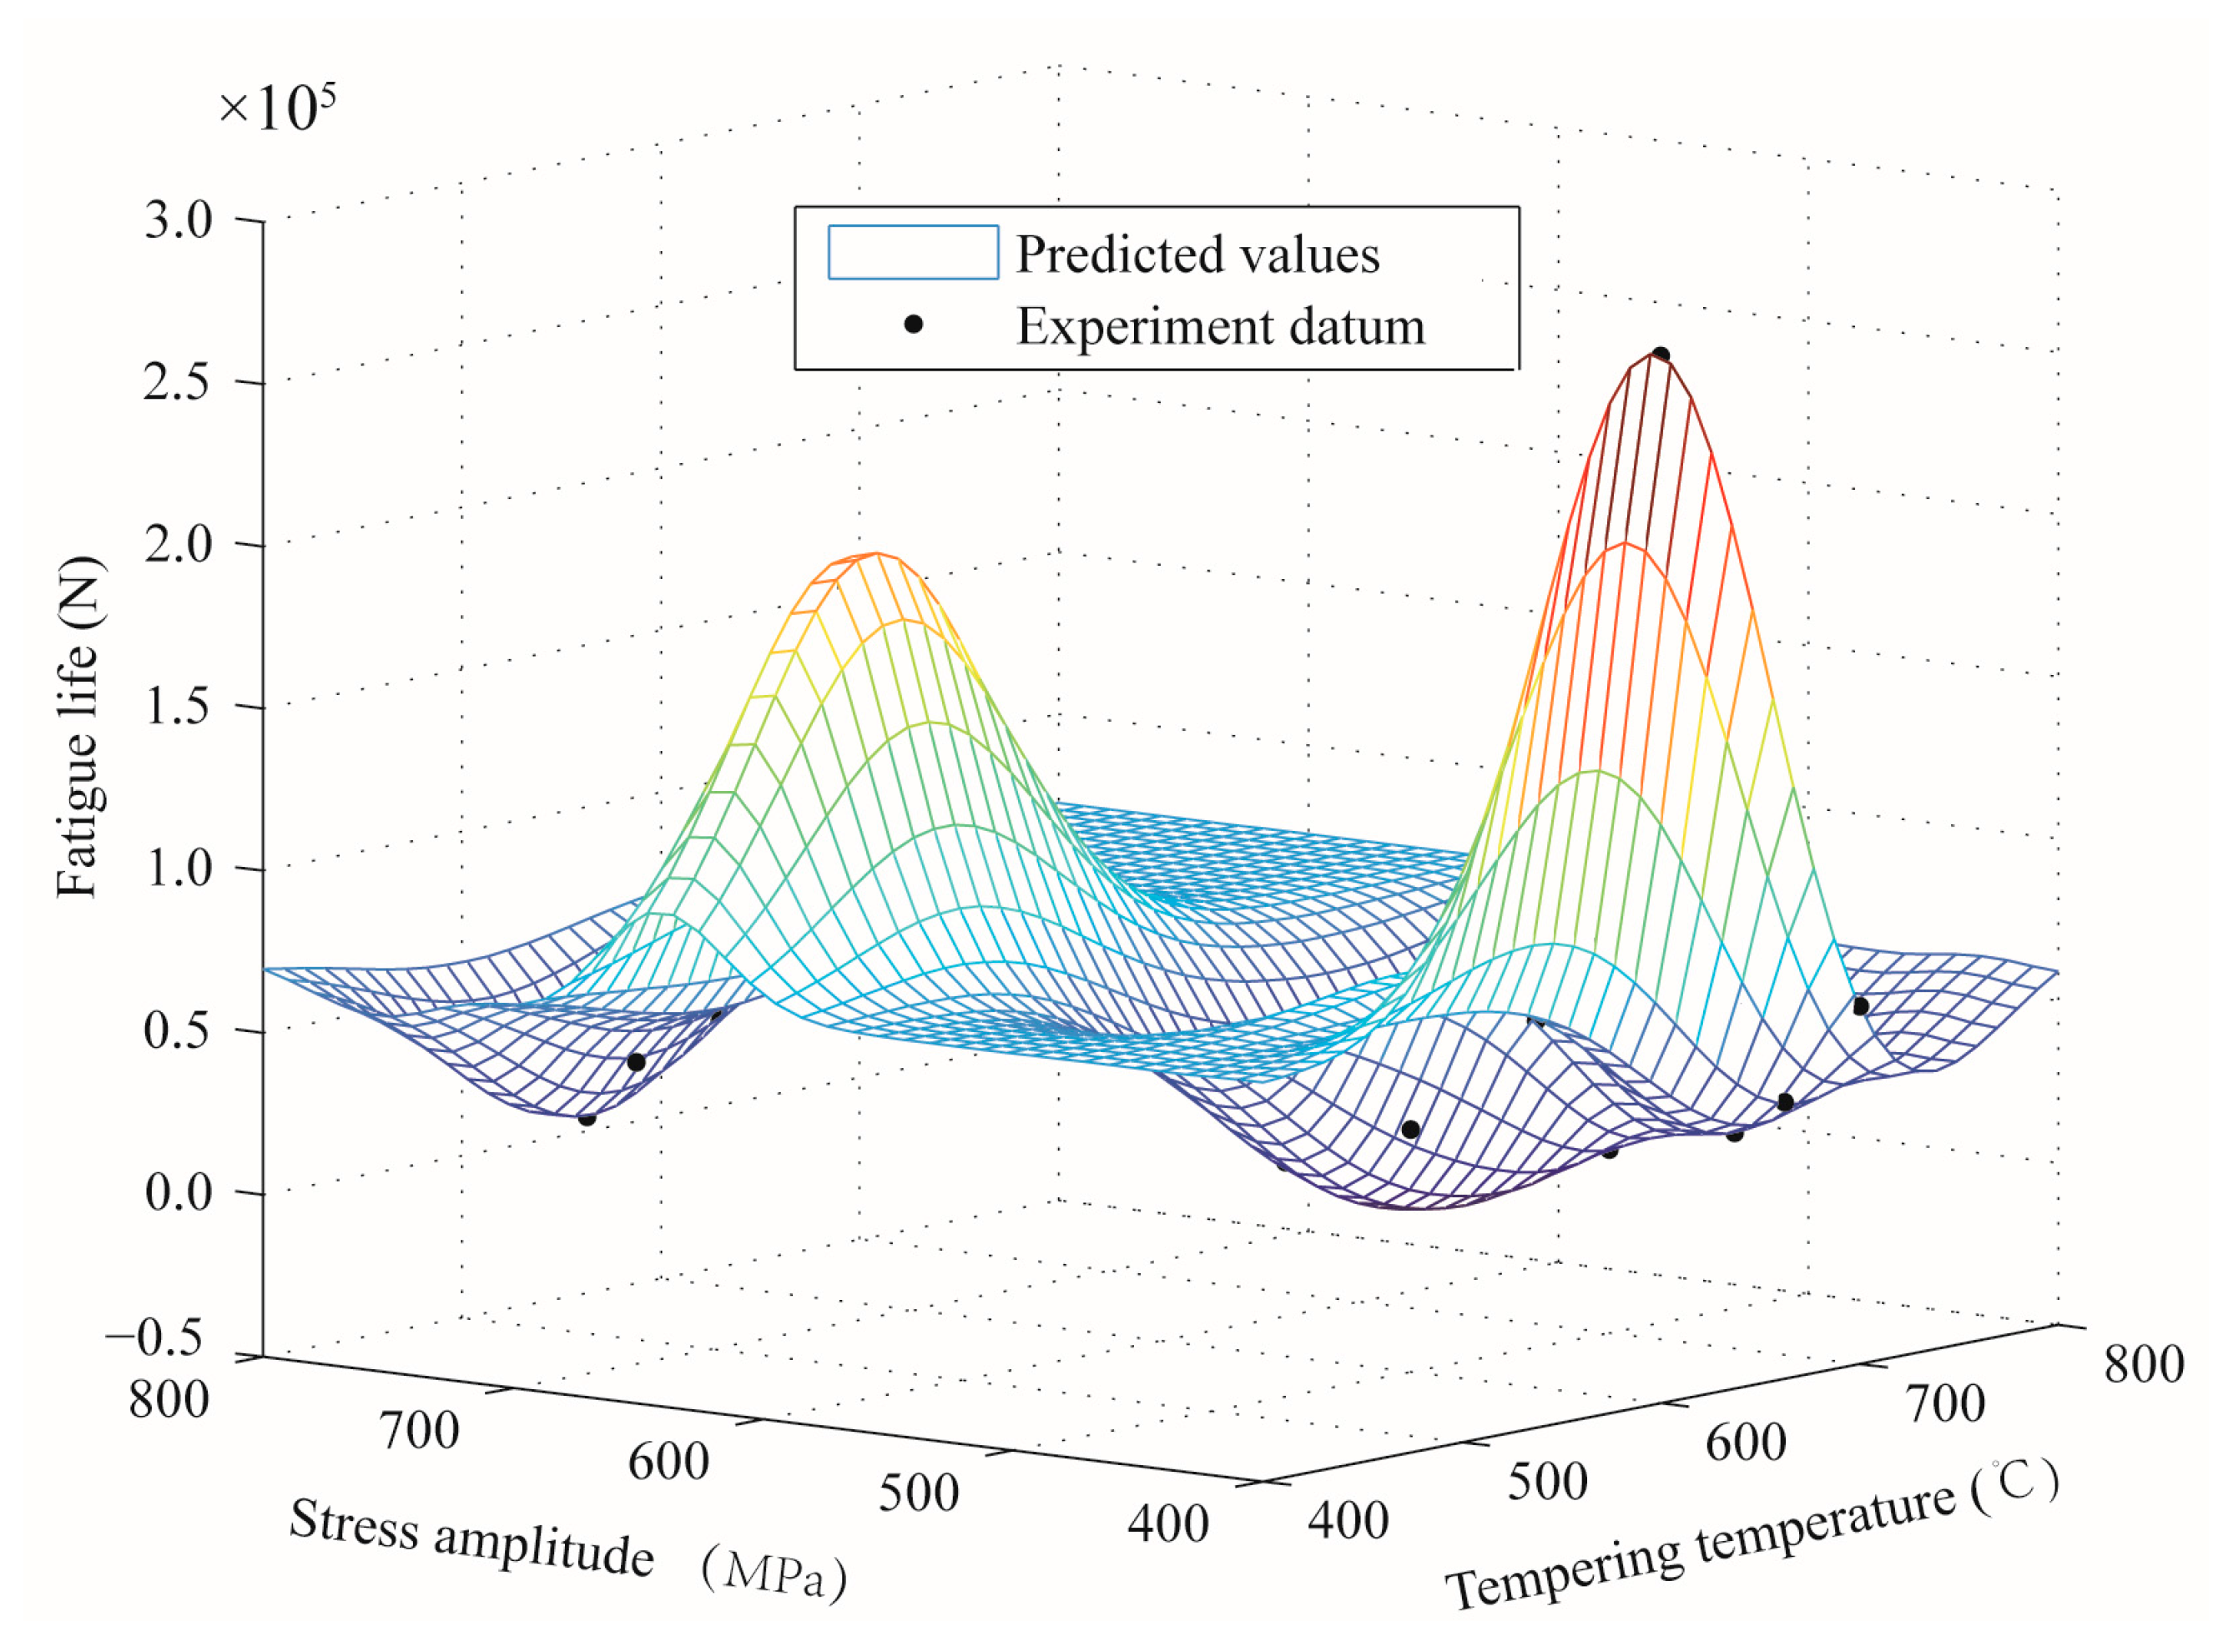
Section 4, two methods for estimating the mean fatigue life of quenched and tempered 0.44% carbon steel are presented: One is based on dislocation dipole accumulation and Paris’ law, and the other is based on the kriging model. Finally, conclusions are drawn.

2. Material and Fatigue Test Results

2.1. Material, Specimens, and Fatigue Tests

The chemical composition of the material investigated in this work is shown in Table 1. The raw material was a hot rolled steel bar of 14 mm diameter. A total of 75 steel bars with lengths of 52 mm were firstly turned to 10 mm. They were austenized at 900 °C for 10 min and quenched in water. To investigate the effect of tempering temperature (T) on fatigue life, specimens were divided into three groups of 25 specimens each. The 25 specimens of the first group were tempered at 500 °C for 60 min, the 25 specimens of the second group were tempered at 600 °C for 60 min, and the others were tempered at 700 °C for 60 min. Subsequently, specimens were machined into an hourglass shape. The geometry of the specimens is shown in Figure 1. The central part of the specimen was polished to an average surface roughness (Ra) of 0.4 μm, and rotating bending fatigue tests were performed. The testing machine is shown in Figure 2. The cycle frequency was 25 Hz. The cycle stress amplitudes of the first group were 750, 730, 700, 680, and 650 MPa, respectively. Those of the second and third group were 550, 500, 450, 430, and 400 MPa. A total of five fatigue tests were performed under each stress amplitude. When the crack of the specimen grew to a length which resulted in the test machine not rotating properly due to excessive bending deformation, or the specimen failed due to fracture, the corresponding cycle number was defined as the fatigue life of the specimen. Table 2 lists the tensile strength, yield strength, and elongation at break of specimens tempered at different tempering temperatures. It can be observed that tensile and yield strength decreased, and the elongation at break increased, as the tempering temperature increased from 500 °C to 700 °C.

2.2. Fatigue Test Results

The scatter plot of fatigue test results is shown in Figure 3. It is shown that: (1) When the same cycle stress amplitude was applied to the specimens, the fatigue life of the first group (tempering temperature 500 °C) was much longer than that of the second (tempering temperature 600 °C) or third groups (tempering temperature 700 °C); (2) The fatigue life of the second group was slightly greater than that of the third group when cycle stress amplitude was 500 or 550 MPa; (3) The fatigue life of the second group was significantly greater than that of the third group when cycle stress amplitude was 450, 430, or 400 MPa. These results might be due to the fact that fatigue crack growth rates increase or fatigue life decreases when the tempering temperature is increased above a certain value [22,23]. The mean and standard deviations of fatigue life of the first, second, and third group are listed in Table 1, Table 2 and Table 3, respectively. In Table 3, Table 4 and Table 5 and Figure 3, it is shown that fatigue life is dispersive, and the dispersion is increasingly significant with a decrease of the applied cycle stress amplitude for three kinds of tempering temperature. This could be because: (1) Fatigue life is rarely affected by the stochastic surface groove of the specimen, due to the manufacturing process when the cycle stress amplitude is large; (2) An opposite effect when the specimen is exposed to a relatively small cyclic stress amplitude. Similar results have been observed in Reference [24].

3. S–N and P–S–N Curves

To obtain S–N curves for specimens from the first, second, and third group, the logarithm stress amplitudes and means of the fatigue life with respect to base 10 were taken first, and then a simple linear regression model was used, where the dependent variable and the independent variable were the base 10 logarithm of means of the fatigue life and stress amplitudes, respectively. Material constants (the base 10 logarithm of the parameters of the simple linear regression model) c and n were estimated by the least square method, and are listed in Table 6. They satisfy the logarithmic Basquin equation:
lg N   =   lg c     n lg S ,
S and N are the cycle stress amplitude and fatigue life, respectively.
S–N curves at tempering temperatures of 500 °C, 600 °C, and 700 °C, and corresponding experimental fatigue lives, are shown in Figure 4. As can be seen, the S–N curve agrees very well with the experimental data for the three tempering temperatures. Similar conclusions to those described in Section 2.2 can be observed: The decrease of the tempering temperature from 700 °C to 500 °C can greatly result in increasing fatigue life for quenched and tempered 0.44% carbon steel with Ra = 0.4 μm.
Using the Lilliefors test method, the fatigue lives of specimens from each group, for the same cycle stress amplitude, were verified as following a normal distribution. The P–S–N curves at tempering temperatures 500 °C, 600 °C, and 700 °C are shown in Figure 5, Figure 6 and Figure 7, respectively. R is defined as survival probability and γ is confidence level. In Figure 5, Figure 6 and Figure 7, the blue triangle, pink inverted triangle, black square, and red dot are the calculated data points of the confidence lower limit, and are calculated as described in Reference [24]:
x R L = x ¯ + h σ x ,
where x ¯ is the mean, σ x is the standard deviation of experimental fatigue life, and h is the one-sided tolerance factor. Next, the P–S–N curve is fitted using the similar logarithmic Basquin equation:
l g ( N f ) = a 1     a 2 lg S .
Parameters a1 and a2 are estimated by the least square method, and a1 and a2 for the fatigue life datum at tempering temperatures of 500 °C, 600 °C, and 700 °C are shown in Table 7, Table 8 and Table 9, respectively.
As shown in Figure 5, Figure 6 and Figure 7 and Table 7, Table 8 and Table 9, for all P–S–N curves and their parameters a1 and a2, there is no significant difference between confidence levels γ = 95 % and γ = 99 % when the survival probability R is 50%, 90%, 99%, or 99.9%. This implies that the confidence lower limit in Equation (2) is almost unaffected whether the confidence level is 95% or 99%. However, it is very clear that the estimated P–S–N curve could not agree closely to the corresponding confidence lower limit when R ≥ 90%. That is, the relationship between l g ( N f ) and lg S is no longer proportional. This is because the standard deviation of fatigue life is increasingly significant as the applied cycle stress amplitude decreases for the three tempering temperatures described in Section 2.2, while the mean of l g ( N f ) is proportional to the mean of lg S for a P–S–N curve or S–N curve with R = 50%.

4. Fatigue Life Estimation

4.1. Fatigue Life Estimation Based on Dislocation Dipole Accumulation Model and Paris’ Law

The fatigue life N is
N = N i + N p ,
where Ni and Np are crack initiation life and crack propagation life, respectively. Ni has an analytic formulation and was presented by Tanaka and Mura [25,26]. The formulation was based on the dislocation dipole accumulation model. On this basis, Wang et al. [27] presented the formula of Ni for a specimen with different surface roughness in References [25,26,27,28]:
N i = 9 Δ K t h 2 G E ( S S e ) 2 π ( 1 υ ) a 0 ,
where Δ K t h , G, E, and Se are the threshold of stress intensity factor, shear modulus, elastic modulus, and endurance limit, respectively; υ is the Poisson’s ratio; and a0 is the equivalent initial micro-defect size where a 0 = 2.97 R a [24].
Np has also an analytic expression, obtained by integrating Paris’ law; asc is a threshold for identifying long and short cracks; and af is defined as the crack size of final failure. Generally, cycles from a0 to asc are much greater than cycles from asc to af. Then, Np can be taken as described in Reference [29]:
N p = a 0 ( 1 n 2 ) C S n β 1 n π n 2 ( n 2 1 ) ,
where β 1 = 0.5 π . The parameter C can be calculated by
C   =   a 0 ( 1     n 2 ) C β 1 n π n 2 ( n 2     1 ) .
The material constants n and c are listed in Table 6 in Section 3. The material constants C can be calculated by solving Equation (7), and are listed in Table 10.
Using the material constants C and n, the mean fatigue life N of the quenched and tempered 0.44% carbon steel with different tempering temperatures and the average surface roughness of Ra = 0.4 μm is:
N   =   { 49895 ( S     530 ) 2   +   1 . 1702   ×   10 50 S 15 . 9280 ,   ( T   =   500   ° C ,   R a   =   0 . 4   μ m ) 49895 ( S     300 ) 2   +   1 . 4152   ×   10 32 S 10 . 3150 ,   ( T   =   600   ° C ,   R a =   0 . 4   μ m ) 49895 ( S     255 ) 2   +   3 . 0187   ×   10 30 S 9 . 8840 ,   ( T   =   700   ° C ,   R a   =   0 . 4   μ m )   .

4.2. Fatigue Life Estimation Based on the Kriging Model

If the tempering temperature T is set to a value other than 500 °C, 600 °C, or 700 °C, many fatigue tests must be completed again to estimate the mean fatigue life N of the quenched and tempered 0.44% carbon steel using Equation (8) when average surface roughness Ra is still 0.4 μm. Therefore, a new fatigue life estimation method based on the kriging model is presented in this work. Kriging modeling has become a popular method of approximating a deterministic computer model. It has been used in a wide variety of applications, including conceptual design, structural optimization, multidisciplinary design optimization, aerospace engineering, and mechanical engineering [30].
Given a set of m design sites S = [ s 1 , , s m ] T with s i R n and responses Y = [ y 1 , , y m ] T with y i R , the kriging predictor at an untried point x is assumed as described in Reference [31]
y ^ ( x )   = C T Y ,
with C = C ( x ) R m . The corresponding true value can be written as
y ( x )   =   ( β , x ) + z ( x ) ,
where ( β , x ) and z ( x ) are the regression model and the approximation error, respectively. To keep the predictor unbiased E [ y ^ ( x ) y ( x ) ] = 0 and minimize the mean squared error of the predictor, Lagrange multiplier λ and C are
λ = 2 σ 2 ( F T R 1 F ) 1 ( F T R 1 r ( β , x ) ) ,
C = R 1 ( r + F λ 2 σ 2 ) ,
where F = [ ( β , s 1 ) , , ( β , s m ) ] T , R is defined as the matrix of stochastic process correlations between the approximation error z’s at design sites with R i j = ( θ , s i , s j ) , i , j = 1 , , m , r = [ ( θ , s 1 , x ) , , ( θ , s m , x ) ] T , and σ 2 the variance of the response y. is the correlation model with parameter θ , and is expressed by
( θ , ω , x ) = j = 1 n j ( θ , ω j x j ) ,
In this work, j ( θ , ω j x j ) = Exp [ θ ( ω j x j ) 2 ] . For the regression problem F β = Y , the generalized least squares solution with respect to R is
β *   =   ( F T R 1 F ) 1 F T R 1 Y .
Then, the kriging predictor at an untried point x is
y ^ ( x ) = ( β , x ) β * + r T R 1 ( Y F β * ) .
The means of the fatigue life are defined as responses Y . Each design site is composed of the tempering temperature and the stress amplitude.
Using the data in Table 4, Table 5 and Table 6, the predicted surface mean of fatigue life based on the kriging model is shown in Figure 8. If the tempering temperature and stress amplitude are given, the corresponding means of fatigue life should be estimated by the surface function. Therefore, if tempering temperature T is set to a value other than 500 °C, 600 °C, or 700 °C, the mean fatigue life N of quenched and tempered 0.44% carbon steel can be estimated by the surface function, and no additional fatigue test needs to be done when the average surface roughness Ra is still 0.4 μm.
Six other fatigue tests were carried out to validate the presented methods. They are composed of two tests with T = 500 °C and S = 690 MPa, two tests with T = 600 °C and S = 470 MPa, and two tests T = 700 °C and S = 420 MPa. The stress amplitudes were different from those of the previous fatigue tests. The test results are shown in Table 11. It can be seen that the maximum estimation error of the first method is 15.81% and that of the method based on the kriging model is 43.21%. It can be observed that the method based on the dislocation dipole accumulation model and Paris’ law is superior to the method based on the kriging model for estimating accuracy from the validation datum.

5. Conclusions

For 0.44% carbon steel with an average surface roughness of 0.4 μm, austenized at 900 °C and quenched in water, fatigue life observably decreased with increased tempering temperature from 500 °C to 700 °C when specimens were exposed to the same cycle stress amplitude. Fatigue life shows dispersion, and this dispersion is increasingly significant as the applied cycle stress amplitude is decreased, for tempering temperatures of 500 °C, 600 °C, and 700 °C. The P–S–N curves and their parameters at tempering temperatures of 500 °C, 600 °C, or 700 °C showed no significant difference between confidence levels of 95% and 99% when survival probability R was 50%, 90%, 99%, or 99.9%. The method based on the dislocation dipole accumulation model and Paris’ law was superior to the method based on the kriging model in terms of estimating accuracy from the validation datum. However, the latter could estimate the mean fatigue life of the quenched and tempered 0.44% carbon steel with average surface roughness of Ra = 0.4 μm when the tempering temperature was set to a value other than 500 °C, 600 °C, or 700 °C, without conducting additional fatigue tests.

Acknowledgments

The work is supported by National Natural Science Foundation of China (grant Nos. 51575095, 51675089), and Major State Basic Research Development Program of China (973 Program) (grant No. 2014CB046303).

Author Contributions

Changyou Li provided the main ideas for this research work, is the major contributor to the experimental design, presented two types of life estimation models, and is the chief author to write this paper; Shuangfeng Li is the major author to conduct the fatigue tests, is the major contributor to searching literature, and completed most jobs of plotting figures, drawing tables, collecting data, analyzing data, and writing paper; Fei Duan is the major contributor to the experimental design, data collection, data analysis, plotting figures, and drawing tables, is the chief author to present the first type of life estimation model, and completes a part of writing paper; Yuewu Wang is the major contributor to the experimental design, data analysis, plotting figures, and drawing tables; Yimin Zhang was contributed to ideas for this research work and two types of life estimation models; David He was contributed to experimental design, data analysis, and refined the language of this manuscript; Zhenyuan Li is contributed to plotting figures, and drawing tables; Wei Wang was contributed to data analysis.

Conflicts of Interest

The authors declare no conflict of interest.

References

  1. Thelning, K.E. Steel and Its Heat Treatment, 2nd ed.; Elsevier Ltd.: Amsterdam, The Netherlands, 1984; pp. 205–217. [Google Scholar]
  2. Liščić, B.; Tensi, H.; Luty, W. Theory and Technology of Quenching: A Handbook; Springer: Berlin, Germany, 1992; pp. 7–12. [Google Scholar]
  3. Smoljan, B. Prediction of mechanical properties and microstructure distribution of quenched and tempered steel shaft. J. Mater. Process. Technol. 2006, 175, 393–397. [Google Scholar] [CrossRef]
  4. Mei, Z.; Morris, J.W. Influence of deformation-induced martensite on fatigue crack propagation in 304-type steels. Metall. Mater. Trans. A 1990, 21, 3137–3152. [Google Scholar] [CrossRef]
  5. Anazadeh Sayed, A.; Kheirandish, S. Affect of the tempering temperature on the microstructure and mechanical properties of dual phase steels. Mater. Sci. Eng. A 2012, 532, 21–25. [Google Scholar] [CrossRef]
  6. Kuang, C.F.; Li, J.; Zhang, S.G.; Wang, J.; Liu, H.F.; Volinsky, A.A. Effects of quenching and tempering on the microstructure and bake hardening behavior of ferrite and dual phase steels. Mater. Sci. Eng. A 2014, 613, 178–183. [Google Scholar] [CrossRef]
  7. Suraratchai, M.; Limido, J.; Mabru, C.; Chieragatti, R. Modelling the influence of machined surface roughness on the fatigue life of aluminum alloy. Int. J. Fatigue 2008, 30, 2119–2126. [Google Scholar] [CrossRef] [Green Version]
  8. Murakami, Y.; Takada, M.; Toriyama, T. Super-long life tension–compression fatigue properties of quenched and tempered 0.46% carbon steel. Int. J. Fatigue 1998, 16, 661–667. [Google Scholar] [CrossRef]
  9. Murakami, Y. Metal Fatigue: Effects of Small Defects and Nonmetallic Inclusions; Elsevier Science Ltd.: Kidlington, UK, 2002; pp. 11–24. [Google Scholar]
  10. Starke, P.; Walther, F.; Eifler, D. Fatigue assessment and fatigue life calculation of quenched and tempered SAE 4140 steel based on stress-strain hysteresis, temperature and electrical resistance measurements. Fatigue Fract. Eng. Mater. Struct. 2007, 30, 1044–1051. [Google Scholar] [CrossRef]
  11. Starke, P.; Walther, F.; Eifler, D. New fatigue life calculation method for quenched and tempered steel SAE 4140. Mater. Sci. Eng. A 2009, 523, 246–252. [Google Scholar] [CrossRef]
  12. Gaul, D.J.; Duquette, D.J. The effect of fretting and environment on crack initiation and early propagation in a quenched and tempered 4130 steel fatigue. Metall. Mater. Trans. A 1980, 11, 1555–1561. [Google Scholar] [CrossRef]
  13. London, B.; Nelson, D.V.; Shyne, C. The influence of tempering temperature on small fatigue crack behavior monitored with surface acoustic waves in quenched and tempered 4140 steel. Metall. Mater. Trans. A 1989, 20, 1257–1265. [Google Scholar] [CrossRef]
  14. Amirat, A.; Chaoui, K. Effect of tempering temperature and frequency on fatigue crack propagation in 0.2% carbon alloy steel. J. Mater. Sci. 2003, 38, 575–580. [Google Scholar] [CrossRef]
  15. Tsay, L.W.; Chung, C.S.; Chen, C. Fatigue crack propagation of D6AC laser welds. Int. J. Fatigue 1997, 19, 25–31. [Google Scholar] [CrossRef]
  16. Sultan, D.J.N. Effect of austenizing and tempering heat treatment temperatures on the fatigue resistance of carburized 16MnCr5 (ASTM 5117) steel. Tikrit J. Eng. Sci. 2013, 20, 1–10. [Google Scholar]
  17. Yu, M.T.; DuQuesnay, D.L.; Topper, T.H. Notch fatigue behaviour of SAE1045 steel. Int. J. Fatigue 1988, 10, 109–116. [Google Scholar] [CrossRef]
  18. Oguma, H.; Nakamura, T. Effect of Tempering Temperature on Very High Cycle Fatigue Properties of High Strength Steel. In Proceedings of the 12th International Conference on Fracture (ICF-12), Ottawa, ON, Canada, 12–17 July 2009. [Google Scholar]
  19. Lee, K.A.; Nam, W.J.; Yoo, S.J.; Kim, N.J.; Lee, C.S. The Effect of Tempering Temperature on the High Cycle Fatigue Properties of High Strength Spring Steels. In Proceedings of the 9th International Conference on Fracture (ICF-9), Sydney, Australia, 1–5 April 1997. [Google Scholar]
  20. Kwon, H.; Barlat, F.; Lee, M.; Chung, Y.; Uhm, S. Influence of tempering temperature on low cycle fatigue of high strength steel. ISIJ Int. 2014, 54, 979–984. [Google Scholar] [CrossRef]
  21. Williams, J.J.; Deng, X.; Chawla, N.; Lindsley, B.; King, P.; Narasimhan, K.S. Effects of Residual Surface Stress and Tempering on the Fatigue Behavior of Ancorsteel 4300. In Proceedings of the 2006 International Conference on Powder Metallurgy and Particulate Materials, San Diego, CA, USA, 18–21 June 2006. [Google Scholar]
  22. Siddiqui, R.A.; Qamar, S.Z.; Pervez, T.; Abdul-Wahab, S.A. Effect of Heat Treatment and Surface Finish on Fatigue Fracture Characteristics in 0.45% Carbon Steel. In Proceedings of the 10th International Research/Expert Conference “Trends in the Development of machinery and Associated Technology”, Barcelona, Spain, 11–15 September 2006. [Google Scholar]
  23. Anctil, A.A.; Kula, E.B. Effect of Tempering Temperature on Fatigue-Crack Propagation in 4340 Steel. In Effects of Environment and Complex Load History on Fatigue Life; ASTM International: West Conshohocken, PA, USA, 1970; pp. 297–317. [Google Scholar] [CrossRef]
  24. Li, C.; Dai, W.; Duan, F.; Zhang, Y.; He, D. Fatigue life estimation of medium-carbon steel with different surface roughness. Appl. Sci. 2017, 7, 338. [Google Scholar] [CrossRef]
  25. Tanaka, K.; Mura, T. A dislocation model for fatigue crack initiation. Int. J. Appl. Mech. 1981, 48, 97–103. [Google Scholar] [CrossRef]
  26. Tanaka, K.; Mura, T. A theory of fatigue crack initiation at inclusions. Metall. Mater. Trans. A 1982, 13, 117–123. [Google Scholar] [CrossRef]
  27. Wang, J.L.; Zhang, Y.L.; Sun, Q.C.; Liu, S.J.; Shi, B.W.; Lu, H.T. Giga-fatigue life prediction of FV520B-I with surface roughness. Mater. Des. 2016, 89, 1028–1034. [Google Scholar] [CrossRef]
  28. Wang, Q.Y.; Bathias, C.; Kawagoishi, N.; Chen, Q. Effect of inclusion on subsurface crack initiation and gigacycle fatigue strength. Int. J. Fatigue 2002, 24, 1269–1274. [Google Scholar] [CrossRef]
  29. Wang, Q.Y.; Berard, J.Y.; Rathery, S.; Bathias, C. High-cycle fatigue crack initiation and propagation behaviour of high-strength spring steel wires. Fatigue Fract. Eng. Mater. Struct. 1999, 22, 673–677. [Google Scholar] [CrossRef]
  30. Martin, J.D.; Simpson, T.W. On the use of Kriging models to approximate deterministic computer models. AIAA J. 2005, 43, 853–863. [Google Scholar] [CrossRef]
  31. Lophaven, S.N.; Nielsen, H.B.; Søndergaard, J. DACE—A Matlab Kriging Toolbox, version 2.0; Informatics and Mathematical Modelling, Technical University of Denmark: Copenhagen, Denmark, 2002. [Google Scholar]
Figure 1. Geometry of fatigue test specimen (dimensions in mm).
Metals 07 00312 g001
Figure 2. The testing machine.
Metals 07 00312 g002
Figure 3. Scatter plot of fatigue life.
Metals 07 00312 g003
Figure 4. S–N curves at tempering temperatures of 500 °C, 600 °C, and 700 °C.
Metals 07 00312 g004
Figure 5. P–S–N curves at tempering temperature 500 °C and confidence levels: (a) γ = 95 % ; (b) γ = 99 % .
Metals 07 00312 g005
Figure 6. P–S–N curves at tempering temperature 600 °C and confidence levels: (a) γ = 95 % ; (b) γ = 99 % .
Metals 07 00312 g006
Figure 7. P–S–N curves at tempering temperature 700 °C and confidence levels: (a) γ = 95 % ; (b) γ = 99 % .
Metals 07 00312 g007
Figure 8. The predicted surface of mean fatigue life based on the kriging model.
Metals 07 00312 g008
Table 1. Chemical composition of the material.
ElementCCrMoSiMnSPNi
Weight (%)0.440.040.020.230.570.0160.0240.002
Table 2. Mechanical properties of the material with the different tempering temperature.
CaseTensile Strength (MPa)Yield Strength (MPa)Elongation at Break (%)
No heat treatment71049019.17
T = 500 °C87569316.26
T = 600 °C69853820.54
T = 700 °C62051025.69
Table 3. Mean and standard deviations (Std. D) of fatigue life of the first group (tempering temperature 500 °C).
Cycle Stress Amplitude750 MPa730 MPa700 MPa680 MPa650 MPa
Mean16,89935,51153,96183,271192,109
Std. D302443527254779124,829
Table 4. Mean and standard deviations of fatigue life of the first group (tempering temperature 600 °C).
Cycle Stress Amplitude550 MPa500 MPa450 MPa430 MPa400 MPa
Mean984624,81663,27190,126273,045
Std. D292130619838755671,309
Table 5. Mean and standard deviations of fatigue life of the first group (tempering temperature 700 °C).
Cycle Stress Amplitude550 MPa500 MPa450 MPa430 MPa400 MPa
Mean2490656916,56027,93260,327
Std. D4496001958688510,217
Table 6. Material constants at tempering temperatures 500 °C, 600 °C, and 700 °C.
Tempering Temperature (°C)nc
50015.9281.17 × 1050
60010.3511.68 × 1032
7009.8003.02 × 1030
Table 7. Parameters of P–S–N curves at tempering temperature 500 °C.
R (%)50909999.9Parameters
γ (%)
9555.410263.252470.704576.2902a1
−17.8844−20.7676−23.5074−25.5609a2
9956.494365.044073.511779.8967a1
−18.2830−21.4263−24.5394−26.8868a2
Table 8. Parameters of P–S–N at tempering temperature 600 °C.
R (%)50909999.9Parameters
γ (%)
9532.078433.143134.154934.9133a1
−10.3864−10.9761−11.5364−11.9564a2
9932.225533.386434.536135.4030a1
−10.4679−11.1108−11.7475−12.2276a2
Table 9. Parameters of P–S–N curves at tempering temperature 700 °C.
R (%)50909999.9Parameters
γ (%)
9529.070626.858424.756123.1804a1
−9.4609−8.7961−8.1645−7.6910a2
9928.764826.352923.964222.1630a1
−9.3690−8.6443−7.9265−7.3853a2
Table 10. Material constants C and n at tempering temperatures 500 °C, 600 °C, and 700 °C.
Tempering Temperature (°C)nC
50015.92802.7800 × 10−55
60010.31506.6324 × 10−36
7009.88404.9143 × 10−34
Table 11. Method validation and error.
Tempering TemperatureStress AmplitudeEstimated Fatigue LifeExperimental Fatigue LifeMean of Experimental Fatigue LifeError
Method in Section 4.1Method in Section 4.2Method in Section 4.1Method in Section 4.2
500 °C690 MPa78,02861,99074,55571,1599.65%−12.88%
67,762
600 °C470 MPa59,54973,63858,05551,41815.81%43.21%
44,780
700 °C420 MPa45,47738,40448,08641,6239.25%−7.73%
35,159

