Study on Hot Deformation Behavior and Microstructure Evolution of Ti55 High-Temperature Titanium Alloy

School of Materials Science and Engineering & National Key Laboratory for Precision Hot Processing of Metals, Harbin Institute of Technology, Harbin 150001, China
*
Authors to whom correspondence should be addressed.
Metals 2017, 7(8), 319; https://doi.org/10.3390/met7080319
Submission received: 29 June 2017
/
Revised: 2 August 2017
/
Accepted: 11 August 2017
/
Published: 20 August 2017
(This article belongs to the Special Issue Titanium Alloys 2017)
Abstract
:The isothermal compression experiment of as-rolled Ti-55 alloy was carried out on a Gleeble-3800 thermal simulation test machine at the deformation temperature range of 700–1050 °C and strain rate range of 0.001–1 s−1. The hot deformation behavior and the microstructure evolution were analyzed during thermal compression. The results show that the apparent activation energy Q in α + β dual-phase region and β single-phase region were calculated to be 453.00 KJ/mol and 279.88 KJ/mol, respectively. The deformation softening mechanism was mainly controlled by dynamic recrystallization of α phase and dynamic recovery of β phase. Discontinuous yielding behavior mainly occurred in β phase region, which weakened gradually with the increase of deformation temperature (>990 °C) and strain rate (0.01–1 s−1) in β phase region. The processing map derived from Murty’s criterion was more accurate in predicting the hot workability than that derived from Prasad’s criterion. The optimized hot working window was 850–975°C/0.001–1 s−1, in which sufficient dynamic recrystallization occurred and α + β-transus microstructure was obtained. When deformed at higher temperature (≥1000 °C), coarsened lath-shape β-transus microstructure was formed, while deformed at lower temperature (≤825 °C) and higher strain rate (≥0.1 s−1), the dynamic recrystallization was not sufficient, thus flow instability appeared because of shear cracking.
1. Introduction
Ti-55 alloy is a near α titanium alloy with the nominal chemical composition Ti-(5.0–6.0)Al-(3.0–4.0)Sn-(2.5–3.3)Zr-(0.3–1.5)Mo-(0.2–0.7)Ta-(0.2–0.7)Nb-(0.1–0.5)Si (wt %), which shows high strength and excellent corrosion resistance. Due to the addition of Si, Ta and Nb elements, the thermal stability and oxidation resistance are obviously improved, so the alloy can meet the requirement of long-term service with the temperature no less than 550 °C [1]. As a potential structural material for engine compressor, blade, sheet components in aviation and aerospace industries, Ti-55 alloy has gained increasing attention in China in recent years [2,3].
Similar to other high temperature titanium alloys, such as Ti-1100 and IMI834, this alloy is quite difficult to be formed into a complex shape because of its poor workability and high strength. Moreover, the accurate control of microstructure morphologies and properties of final components is very difficult for those high temperature titanium alloys with high alloying elements in forming process [4,5]. In order to develop plastic forming methods of high temperature titanium alloys, such as forging, extrusion and sheet hot forming, it is necessary to characterize the deformation behavior, including the flow stress behavior, deformation mechanism and microstructure evolution of the materials. Currently, quite a few investigations have been conducted to analyze the hot deformation behavior of high temperature titanium alloys. For instance, Liu and Bake [6] analyzed the deformation characteristics of IMI685 alloy and revealed its dynamic softening mechanism in β phase field, which was helpful for widening its forging temperature range. Wanjara et al. [4,5] explored the flow stress behavior and the microstructure evolution of near-α IMI834 alloy in β and α + β phase regions, respectively, through isothermal compression experiment. Niu et al. [7] investigated the high temperature behavior of a near-α Ti-600 alloy and determined its optimized superplastic forming window.
Although there is some research on the thermal stability and tensile formability of Ti-55 alloy [1,3,8], the hot compression behavior has been rarely reported, which limits the application of hot plastic forming processes, such as forging and extrusion, to this kind of titanium alloy. In this study, the isothermal compression of Ti-55 titanium alloy has been conducted at different strain rates and temperatures both in the α + β and β regions. The flow stress behavior has been analyzed and the microstructure evolution has been observed. Subsequently, the processing map has been established to understand the deformation mechanism during hot compression, and the optimum hot working window has been determined for hot processing of Ti-55 alloy.
2. Materials and Methods
The starting material used in the study was as-rolled sheet of Ti-55 alloy with the thickness of 12 mm, supplied by Baoji Titanium Industry Company Limited in China. The actual chemical composition (wt %) of the present Ti-Al-Sn alloy was determined by an inductively coupled plasma (ICP) test as follows: Al-5.2, Sn-3.3, Zr-2.9, Mo-1.0, Ta-0.4, Nb-0.4, Si-0.2 and the rest Ti. The β-transus temperature was calculated to be about 990 °C by a differential thermal analysis (DTA) test and metallographic method. The experimental specimens with dimension of Φ6 mm × 8 mm, whose axial direction was aligned with the sheet thickness direction (i.e., normal direction), were electro-discharge wire cut from the as-rolled sheet for hot compression, as shown in Figure 1. The isothermal compression test was carried out in the temperature range of 700–1050 °C with 50 °C intervals and strain rate range of 0.001–1 s−1 on a Gleeble-3800 simulator manufactured by DSI Company, which locate at Sao Paulo, Minnesota, America, with the low vacuum atmosphere of 1 × 10⁻³ Torr. All the specimens were heated to the deformation temperature at a heating rate of 10 °C/s and held for 2 min before hot compression, and the deformation temperature was recorded by Pt–Rh thermocouple wires spot-welded in the surface of the hot deformation specimens. In order to maintain the hot deformation microstructure, the specimens were quenched by water immediately after hot compression with 60% height reduction in low vacuum atmosphere. The tantalum chip of 0.1 mm was placed between crosshead and specimen to provide lubrication and prevent cementation during hot compression. The specimens were sectioned parallel to the compression axis after hot compression for microstructure observation. The specimens for optical microscopy (OM) observation were etched in a solution of 2 mL hydrofluoric acid, 4 mL nitric acid and 94 mL H2O. Electropolishing was carried out in a solution of 12.5% perchloric acid and 87.5% acetic acid with the voltage of 25 V and temperature of −20 °C to prepare the samples for scanning electron microscopy (SEM) and electron back scattering diffraction (EBSD) analysis. The specimens for transmission electron microscopy (TEM) analysis were mechanically ground to about 100 μm, followed by two-jet electro polished at an ion voltage of 20 V under the temperature of about −20 °C. The SEM, EBSD and TEM testing were conducted on a Quanta 200FEG scanning electron microscope and TecnaiG2F30 transmission electron microscope, respectively, manufactured by FEI Company located at Hillsborough, Oregon, America.
3. Results
3.1. Flow Stress Behavior
3.1.1. Flow Stress-Strain Curves
Figure 2 shows the stress-strain curves of as-rolled Ti-55 alloy during isothermal compression at different temperatures and strain rates. Clearly, the flow stress increased with the increase of true strain at the initial deformation stage to the peak stress because of work hardening, and then the flow stress decreased with further increase of true strain due to flow softening occurring during hot compression. Besides, the flow stress decreased with increasing deformation temperature and decreasing strain rate, indicating the flow stress was sensitive to deformation temperature and strain rate. When deformed at higher temperature and lower strain rate (≥900 °C and ≤0.01 s−1), the flow stress-strain curves reached to steady values with the increase of true strain, indicating the softening mechanism, including dynamic recrystallization (DRX) of α phase or dynamic recovery (DRV) of β phase, proceeded quickly to balance the rate of work hardening [9,10]. Besides this, the other secondary phase particles rich in Sn, Mo, Ta and Nb elements at the grain boundaries may have pinning effect on dislocation motion (see Figure 7a), which partly balanced dynamic softening during hot compression of Ti-55 alloy. However, when deformed in other conditions, such as lower temperature and higher strain rate, the curves exhibited continuous softening behavior after peak stress without the steady-state condition occurring due to insufficient softening behavior.
3.1.2. Discontinuous Yielding Behavior
Discontinuous yielding behavior, i.e., the sudden drop of flow stress beyond peak stress, was observed for the deformation conditions performed above 900 °C at strain rates of 0.01–1.0 s−1, while there was no obvious discontinuous yielding behavior appearing at lower strain rate of 0.001 s−1. Figure 3 shows the magnitude of the yield drop (i.e., σUY − σLY) at various deformation temperatures and strain rates. It can be seen that the yield drop reduced as the temperature increased over 950 °C, and the yield drop occurred only at the middle strain rate of 0.1 s−1 at 900 °C. The discontinuous yielding behavior has been found in many β titanium alloys, such as Ti-10V-4.5Fe-1.5Al, Ti-6.8Mo-4.5Fe-1.5Al and Ti40 [11,12,13]. Recently, this phenomenon has been reported in some α + β and near α titanium alloys. For instance, Li et al. and Wang et al. [14,15] discovered the discontinuous flow stress drop in α + β alloy Ti-3Al-5V-5 Mo and TC8, respectively. In addition, Jia et al. [10] demonstrated the behavior in near α alloy of Ti60. Generally, the discontinuous yield phenomenon could be explained mainly by two theories: static theory and dynamic theory. The first theory involved the dislocation locking and unlocking, and the second one associated discontinuous yielding with the abrupt formation of large quantities of new mobile dislocations originated from the grain boundary sources [14]. For titanium alloys, more researchers indicated that the discontinuous yielding should be attributed to dynamic theory, rather than static theory during hot compression at elevated temperatures [12,16,17].
However, the influence of processing parameters, such as deformation temperature and strain rate, on the discontinuous yielding was not clearly understood. For the present titanium alloy, the yield drop appeared most pronouncedly at 950 °C and reduced gradually with further increase of deformation temperature, as shown in Figure 3b. Usually, the increase of deformation temperature may induce two opposite results. On the one hand, the increase of deformation temperature could enhance the thermal activation to promote the generation of new mobile dislocations. On the other hand, the temperature rising may reduce the dislocation density and weaken the stress concentration to restrain the operation of new mobile dislocation. At lower temperature less than 900 °C, the increase of dislocation density and stress concentration could not operate new mobile dislocations significantly due to lower thermal activation and strong pinning effect of high content of alloy elements of Ti-55 alloy. With the increase of deformation temperature in β phase region (>990 °C), the reducing of dislocation density and stress concentration played a main role in restraining the generation of new mobile dislocations, leading to the decrease of the yielding drop.
Besides this, the discontinuous yield behavior weakened progressively with the increase of strain rate from 0.01 s−1 to 1 s−1 in this study. The magnitude of the yield drop changed slightly as the strain rate increased from 0.01 s−1 to 0.1 s−1, and pronouncedly reduced to the minimum when the strain rate increased from 0.1 s−1 to 1 s−1 for all the tests at higher temperatures (>900 °C). A similar evolution tendency was found in the hot compression of Ti60 alloy at the strain rate of 1 s−1 [10]. The possible reason was that high strain rate induced intense work hardening, which may conceal the discontinuous yielding behavior. When the strain rate was too low (less than 0.001 s−1), the dislocations were easily propagated and hard to be accumulated, which would lessen the stress concentration and lead to the disappearance of yield drop. Moreover, dynamic recovery rather than dynamic recrystallization was more prone to take place during hot compression in β phase region, which reduced dynamic softening of titanium alloy. Therefore, the yield drop at low strain rate of 0.001 s−1 vanished during hot deformation both in β and α + β phase regions.
3.2. Kinetic Analysis
During hot plastic deformation, the relationship among the flow stress, strain rate and deformation temperature can be described by a hyperbolic sine law [18]:
This also can be given by the Zener–Hollomon parameter as follows [19]:
where Z is the Zener–Hollomon parameter; A, α and n is materials constants, and , , ; R is the gas constant; is the strain rate; σp is the peak stress; T is the deformation temperature; Q is the activation energy.
From Equation (1), the activation energy Q can be calculated as:
By linear regression of the relations of and at different deformation conditions, the value of α was calculated as 0.00573 and 0.0269 in the temperature range of 700–950 °C and 1000–1050 °C, respectively, as shown in Figure 4a,b. Through linear fitting of vs. and vs. in the temperature ranges of 700–950 °C and 1000–1050 °C shown in Figure 4c–e, the average activation energy Q of as-rolled Ti-55 alloy were calculated to be 453.00 KJ/mol and 279.88 KJ/mol, respectively. Based on the linear relationship of vs. , the stress constant n of as-rolled Ti-55 alloy in the temperature range of 700–950 °C and 1000–1050 °C was calculated as 3.3851 and 2.6125, respectively, as shown in Figure 4f. Besides this, the correlation coefficient of as-rolled Ti-55 alloy in the temperature range of 700–950 °C and 1000–1050 °C for the linear relationship of vs. were 0.9150 and 0.9500, indicating it was reliable to describe the hot deformation behavior of as-rolled Ti-55 alloy by using hyperbolic sine law. Therefore, the dependence of peak stress on the strain rate and deformation temperature of as-rolled Ti-55 alloy in the temperature range of 700–900 °C and 950–1050 °C, respectively, could be expressed as:
The deformation activation energy of as-rolled Ti-55 alloy in α + β dual-phase region and β single-phase region was calculated to be 453.00 KJ/mol and 279.88 KJ/mol, respectively, both of which were greater than the lattice self-diffusion energy of α-Ti (150 KJ/mol) and β-Ti (153 KJ/mol) [4,9]. The results indicated that the main softening mechanism should be dynamic recrystallization in α + β dual-phase region and dynamic recovery in β single-phase region, respectively [20,21]. It should be noted that the activation energy in β phase region was mostly reported in the range of 180–220 kJ/mol during hot deformation of some titanium alloys [10,21,22,23], while the activation energy in β region of the Ti-55 alloy reached 279.88 kJ, which was higher than other titanium alloys. The possible reason is that the initial material used in this study was an as-rolled sheet, which possessed finer microstructure and intense deformation texture, so it was more difficult to deform plastically during hot compression. Besides, the activation energy in α + β dual-phase region was greater than the activation energy in β single-phase region, which should be caused by lower deformation temperature and less slip system of α phase (hexagonal close-packed structure, HCP) than β phase (body-centered cubic structure, BCC).
3.3. Microstructure Evolution and Softening Mechanism
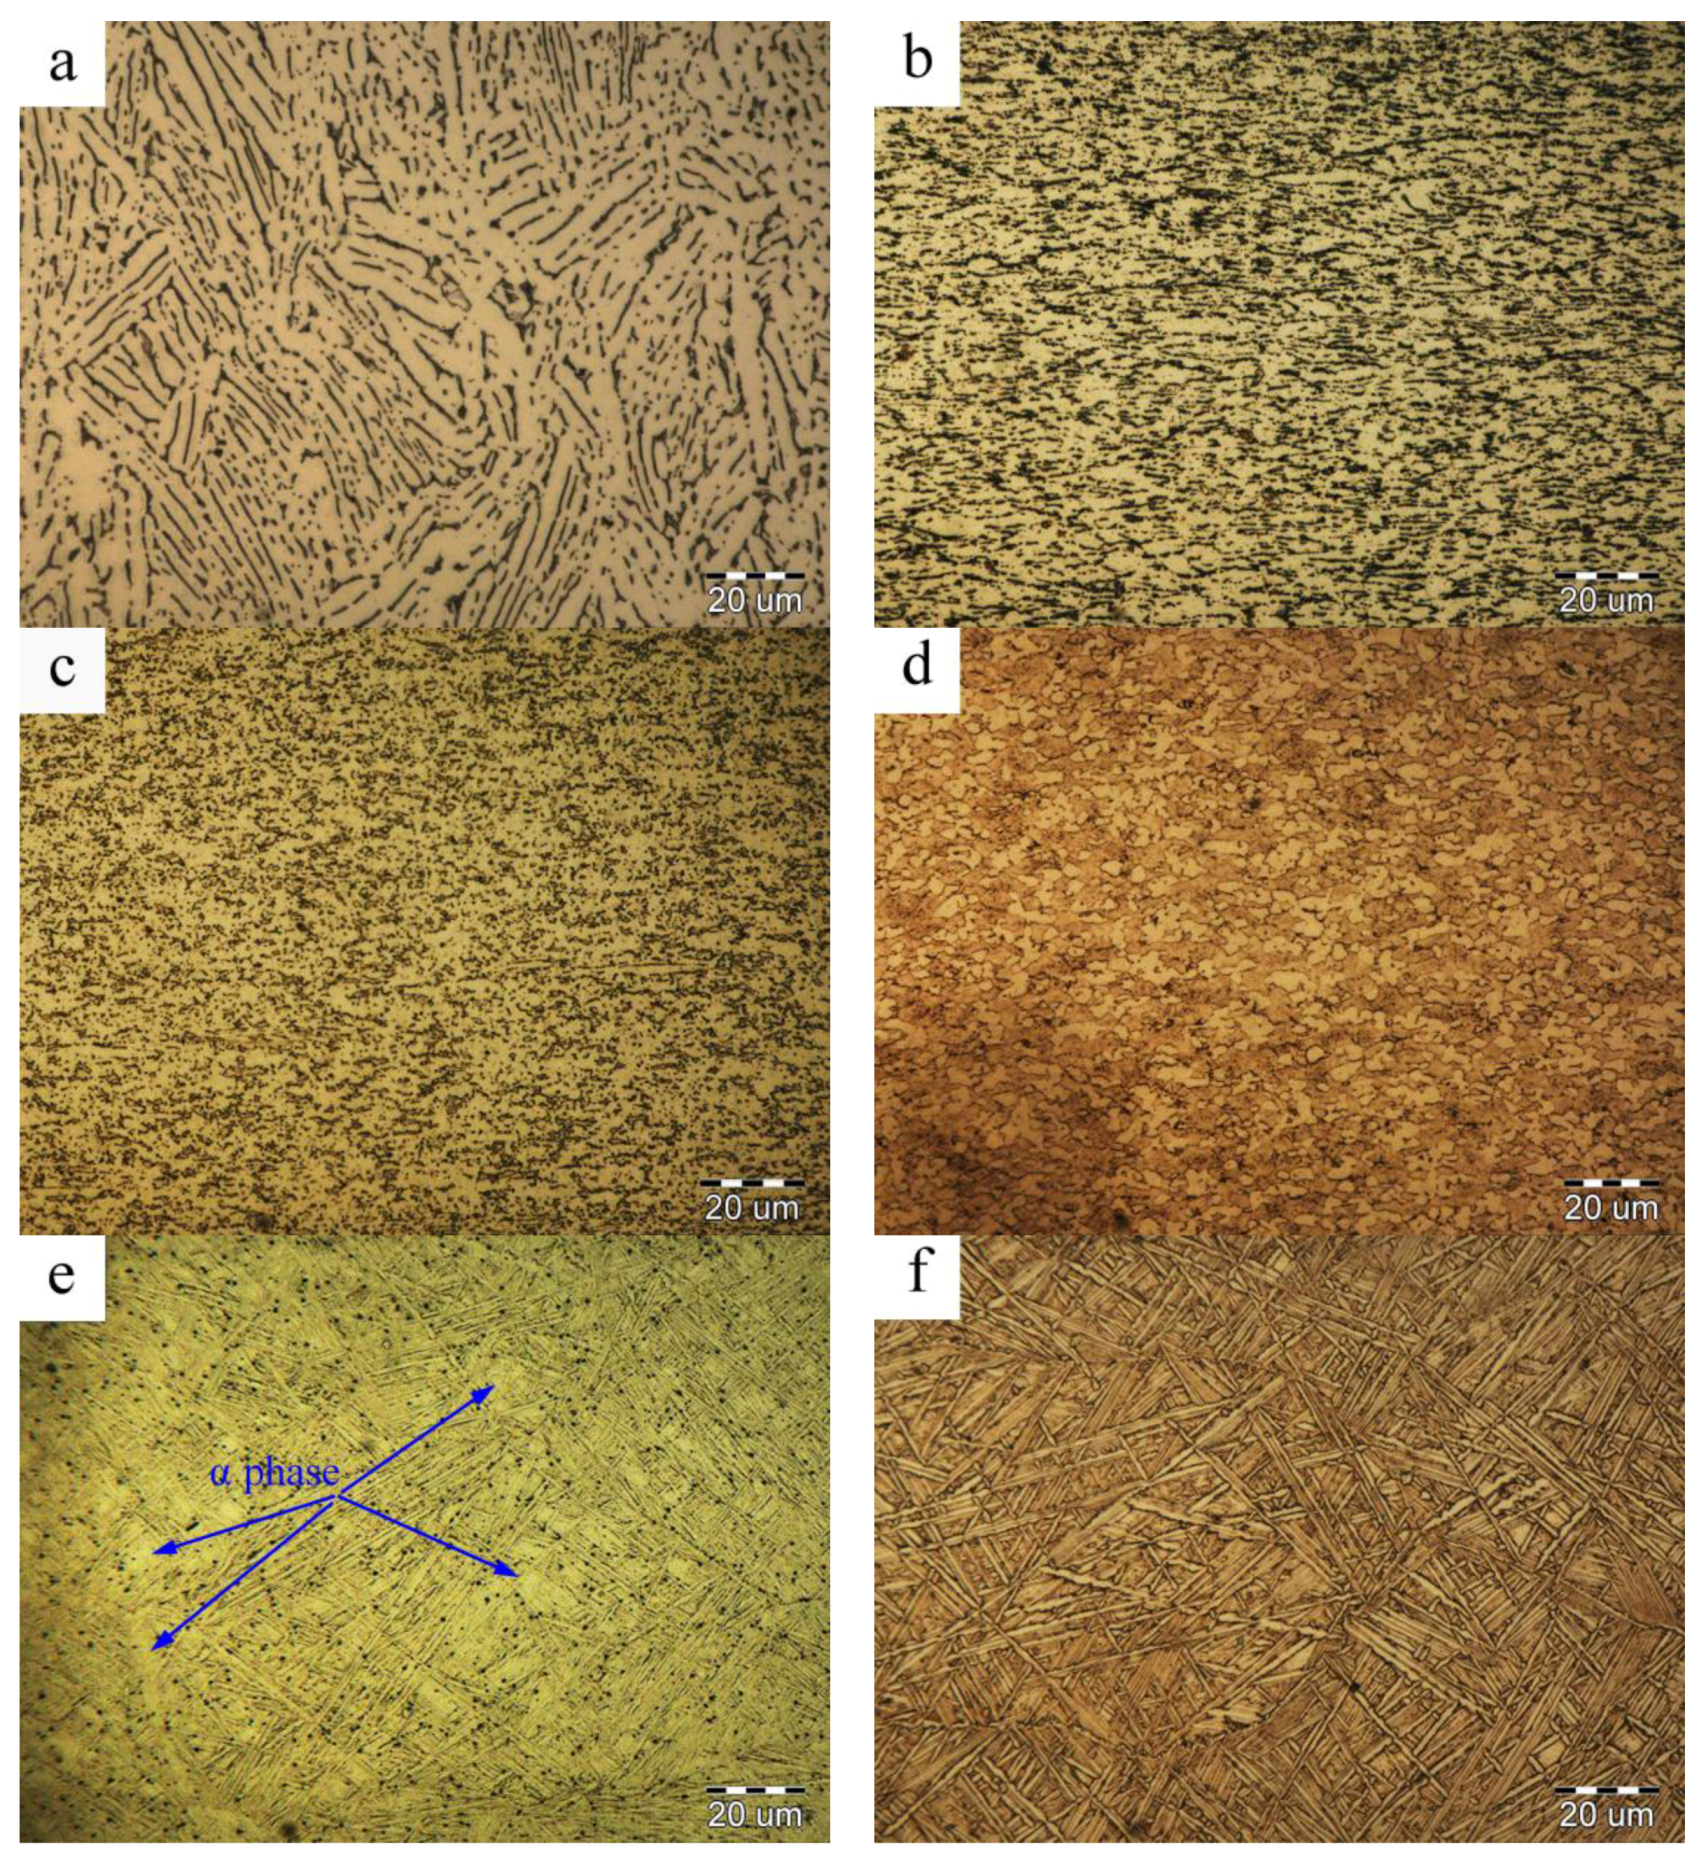
Figure 5 shows the microstructures of the as-rolled sheet and specimens deformed at different conditions. It is evident that the strip-like microstructure of as-rolled Ti-55 alloy was elongated in the rolled direction, as shown in Figure 5a. Due to the relatively lower deformation temperature, the initial large grains were elongated along the flow direction, exhibiting obvious deformation feature under the temperature of 700 °C and strain rate of 0.01 s−1 (Figure 5b). When the deformation temperature increased to 800 °C, the deformed microstructure was locally globalized, indicating the occurrence of dynamically recrystallization (Figure 5c). As the deformation temperature reached 900 °C, sufficient recrystallization took place, which contributed to the refinement of initial microstructure of the as-rolled Ti-55 alloy (Figure 5d). Besides this, the lath-shaped β-transus microstructure (see Figure 6d) appeared because of the phase transformation from α to β during hot deformation and then the re-precipitation of secondary α phase in β phase region during the cooling process. After deformation at 950 °C/0.01 s−1, the amount of initial α phase further decreased obviously and the amount of β-transus microstructure further increased dramatically due to the relatively higher deformation temperature close to β-transus temperature and relatively lower strain rate (see Figure 5e). When the deformation further increased to 1000 °C in β phase region, the initial α phase totally transformed to coarsened lath-shaped β-transus microstructure (Figure 5e).
Under the same deformation temperature (900 °C), as the strain rate increased to 0.1 s−1, the elongated α grains could be clearly observed (Figure 5g), indicating less sufficient dynamic recrystallization. When the strain rate decreased to 0.001 s−1, the dynamically recrystallized grains grew slightly and the volume fraction of β-transus microstructure increased since longer deformation time contributed to the coarsening of recrystallized grains as well as more sufficient phase transformation of α to β during hot deformation, as shown in Figure 5h. Hence, both strain rate and deformation temperature exhibited remarkable influence on the microstructure evolution, including dynamic recrystallization and phase transformation of the as-rolled Ti-55 alloy.
Figure 6 shows the EBSD images of as-rolled sheet and deformed microstructure in different processing conditions. It can be found that recrystallization occurred in the initial elongated microstructure along the grain boundaries, as shown in Figure 6a. But there were a lot of low angle boundaries and small amounts of β phase retained in α phase matrix because of hot rolling deformation at relatively low temperature in the final pass. After hot compression at 800 °C, compared to the initial rolled microstructure, the fraction of low angle boundary reduced obviously and the area fraction of β phase changed slightly because of the relatively low deformation temperature below the β-transus (see Figure 6b,c). As the deformation temperature increased to 900 °C at the strain rate 0.01 s−1, the fraction of low angle boundary continued to reduce, while the area fraction of β-transus microstructure increased significantly due to higher deformation temperature (see Figure 6d). Besides, with the increase of deformation temperature (Figure 6c,d) and the decrease of strain rate (Figure 6b,c), the fraction of low angle boundary decreased and the area fraction of β-transus microstructure increased, as shown in Figure 6e, which was basically consistent with the observation of OM microstructures.
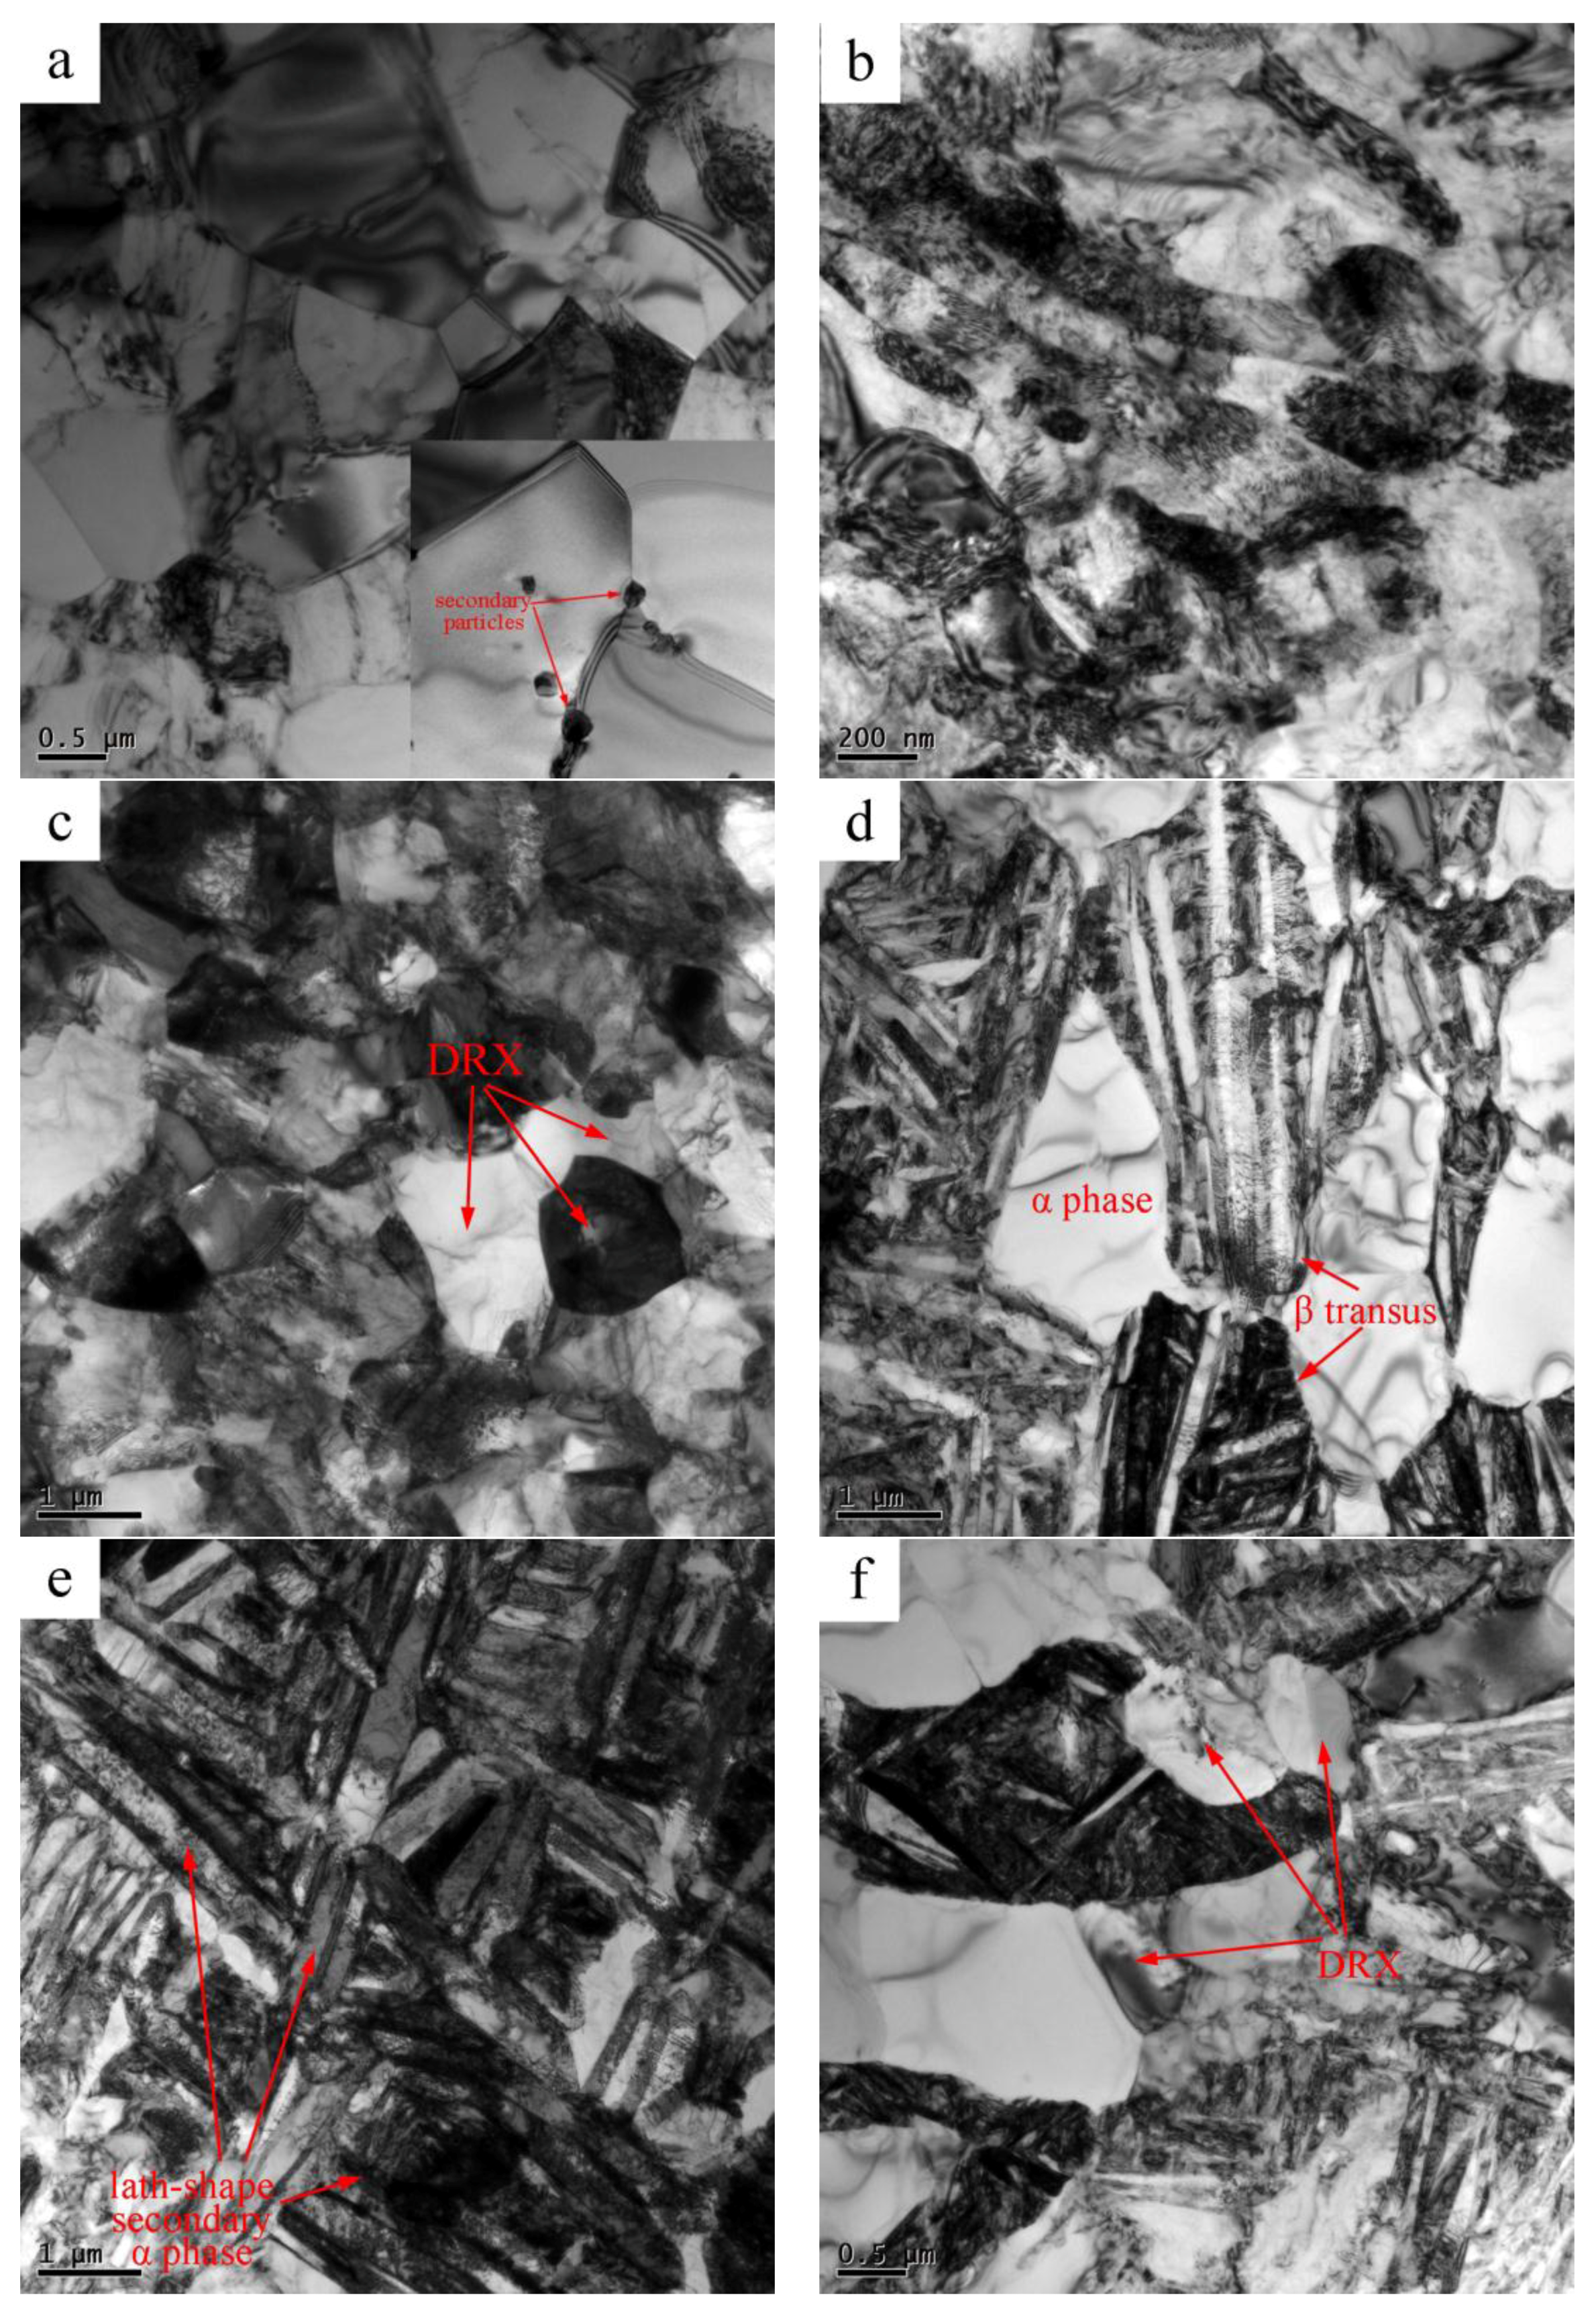
Figure 7 shows the TEM images of the as-rolled sheet and hot compressed microstructure at different deformation conditions. It can be seen that dynamic recrystallization occurred in the microstructure of as-rolled sheet and the dislocations density was relatively low (Figure 7a). Besides, some secondary phase particles rich in Mo, Sn, Nb and Ta elements existed at the grain boundaries, as shown in Figure 7a and Table 1. When deformed at the strain rate of 0.01 s−1 under the temperature lower than 900 °C, there was no β-transus microstructure occurring because of relatively low deformation temperature, as shown in Figure 7b,c. Especially at the temperature of 700 °C, the α phase was elongated perpendicular to the compression direction and amounts of dislocations existed in the titanium matrix (see Figure 7b). As the deformation temperature increased to 800 °C, some refined dislocation cells and dynamically recrystallized grains appeared, accompanied with the decrease of dislocations density, which indicated incomplete dynamic recrystallization appeared (see Figure 7c). Obviously, dynamic recrystallization proceeded more sufficiently and β-transus microstructure came into being at the temperature of 900 °C because of relatively high deformation temperature, as shown in Figure 7d. The phase transformation of α to β occurred during hot compression, and the secondary α phase re-precipitated as needle shape in the cooling process. Generally, α + β-transus microstructure was considered to be better for hot workability and mechanical property. But as the deformation temperature increased to β phase region, the needle-shaped β-transus microstructure would be coarsened to lath-typed shape and no initial α phase could be found, thus the hot workability was worsened, as shown in Figure 7e.
When the strain rate increased to 1 s−1 at the temperature of 900 °C, the volume fraction of β-transus microstructure obviously decreased, in which the re-precipitated needle-shaped α phase became finer (see Figure 7d,f). Albeit deformed at higher strain rate, dynamic recrystallization could be observed within the initial α phase due to relatively high deformation temperature, as shown in Figure 7f.
It should be noted that the maximum yield drop appeared at the deformation temperature of 950 °C, as shown in Figure 3, which should be ascribed to the transformation of α to β phase. Since the β-transus temperature was about 990 °C; there was a dramatic increase in β phase as the deformation temperature increased from 900 °C to 950 °C, which could be seen in Figure 5d,e. The β phase with body-centered cubic (BCC) structure possessed more operative slip systems than α phase with hexagonal close-packed (HCP) structure. Owing to high stress concentration at grain boundary of β and α phase, more mobile dislocations were easily generated to enhance the yield drop at the deformation temperature of 950 °C. When the deformation temperature increased over 1000 °C, the primary α phase totally transformed to β phase, so the vanishing of α/β interphase boundary would reduce the magnitude of yield drop.
3.4. Processing Map
3.4.1. Processing Map Theory
The processing map has been established recently by Prasad et al. [24,25,26,27,28] on the basis of the dynamic material model, aiming at studying the microstructure evolution and avoiding flow instability of many materials. In the dynamic materials model (DMM), the workpiece subjected to hot working is considered as a nonlinear dissipator of power. The instantaneous total power dissipation (P) at a given strain consists of two parts G and J, wherein the G represents the power dissipation for plastic deformation and J co-content is related to the power dissipation through metallurgical mechanisms, such as dynamic recovery, dynamic recrystallization and phase transformation, which can be described as a function of flow stress and strain rate:
The power dissipation characteristics of workpiece usually depend on the materials’ flow behavior, which follows the power law equation:
where K is the material constant; σ is the flow stress; is the strain rate; m is the strain rate sensitivity, by which the content G and J can be related in the phenomenological model, and can be described as follows:
The J co-content can be expressed as:
For the ideal linear dissipation body, m = 1 and J co-content reaches to the maximum: .
The power dissipation capacity of the material can be evaluated by the efficiency of power dissipation, η, which can be defined as:
For the flow instability, Prasad developed a criterion from the extremum principle, which can be expressed as follows:
The variation of the instability parameter with temperature and strain rate constitutes the instability map, from which the instability region can be obtained.
Predictably, for some materials, especially for metals with high content of alloying element and composites with high volume fraction of reinforcements, if the flow stress with respect to does not obey the power law in Equation (7), the computation of η and ξ in terms of m from Equations (10) and (11) becomes erroneous [29]. Hence, the DMM is further modified (MDMM) by Murty et al. [30], who suggests that the strain rate sensitivity parameter m is a variable and redefined the efficiency of power dissipation in terms of J co-content as:
The condition for the metallurgical instability is given as:
The variation of η and ξ with deformation temperature and strain rate constitutes the power dissipation map and instability map. Hence, the processing map can be obtained through superimposing the instability map on the power dissipation map. Figure 8 shows the processing maps at the true strain of 0.8 of as-rolled Ti-55 alloy derived from different instability criteria.
3.4.2. Instability Region
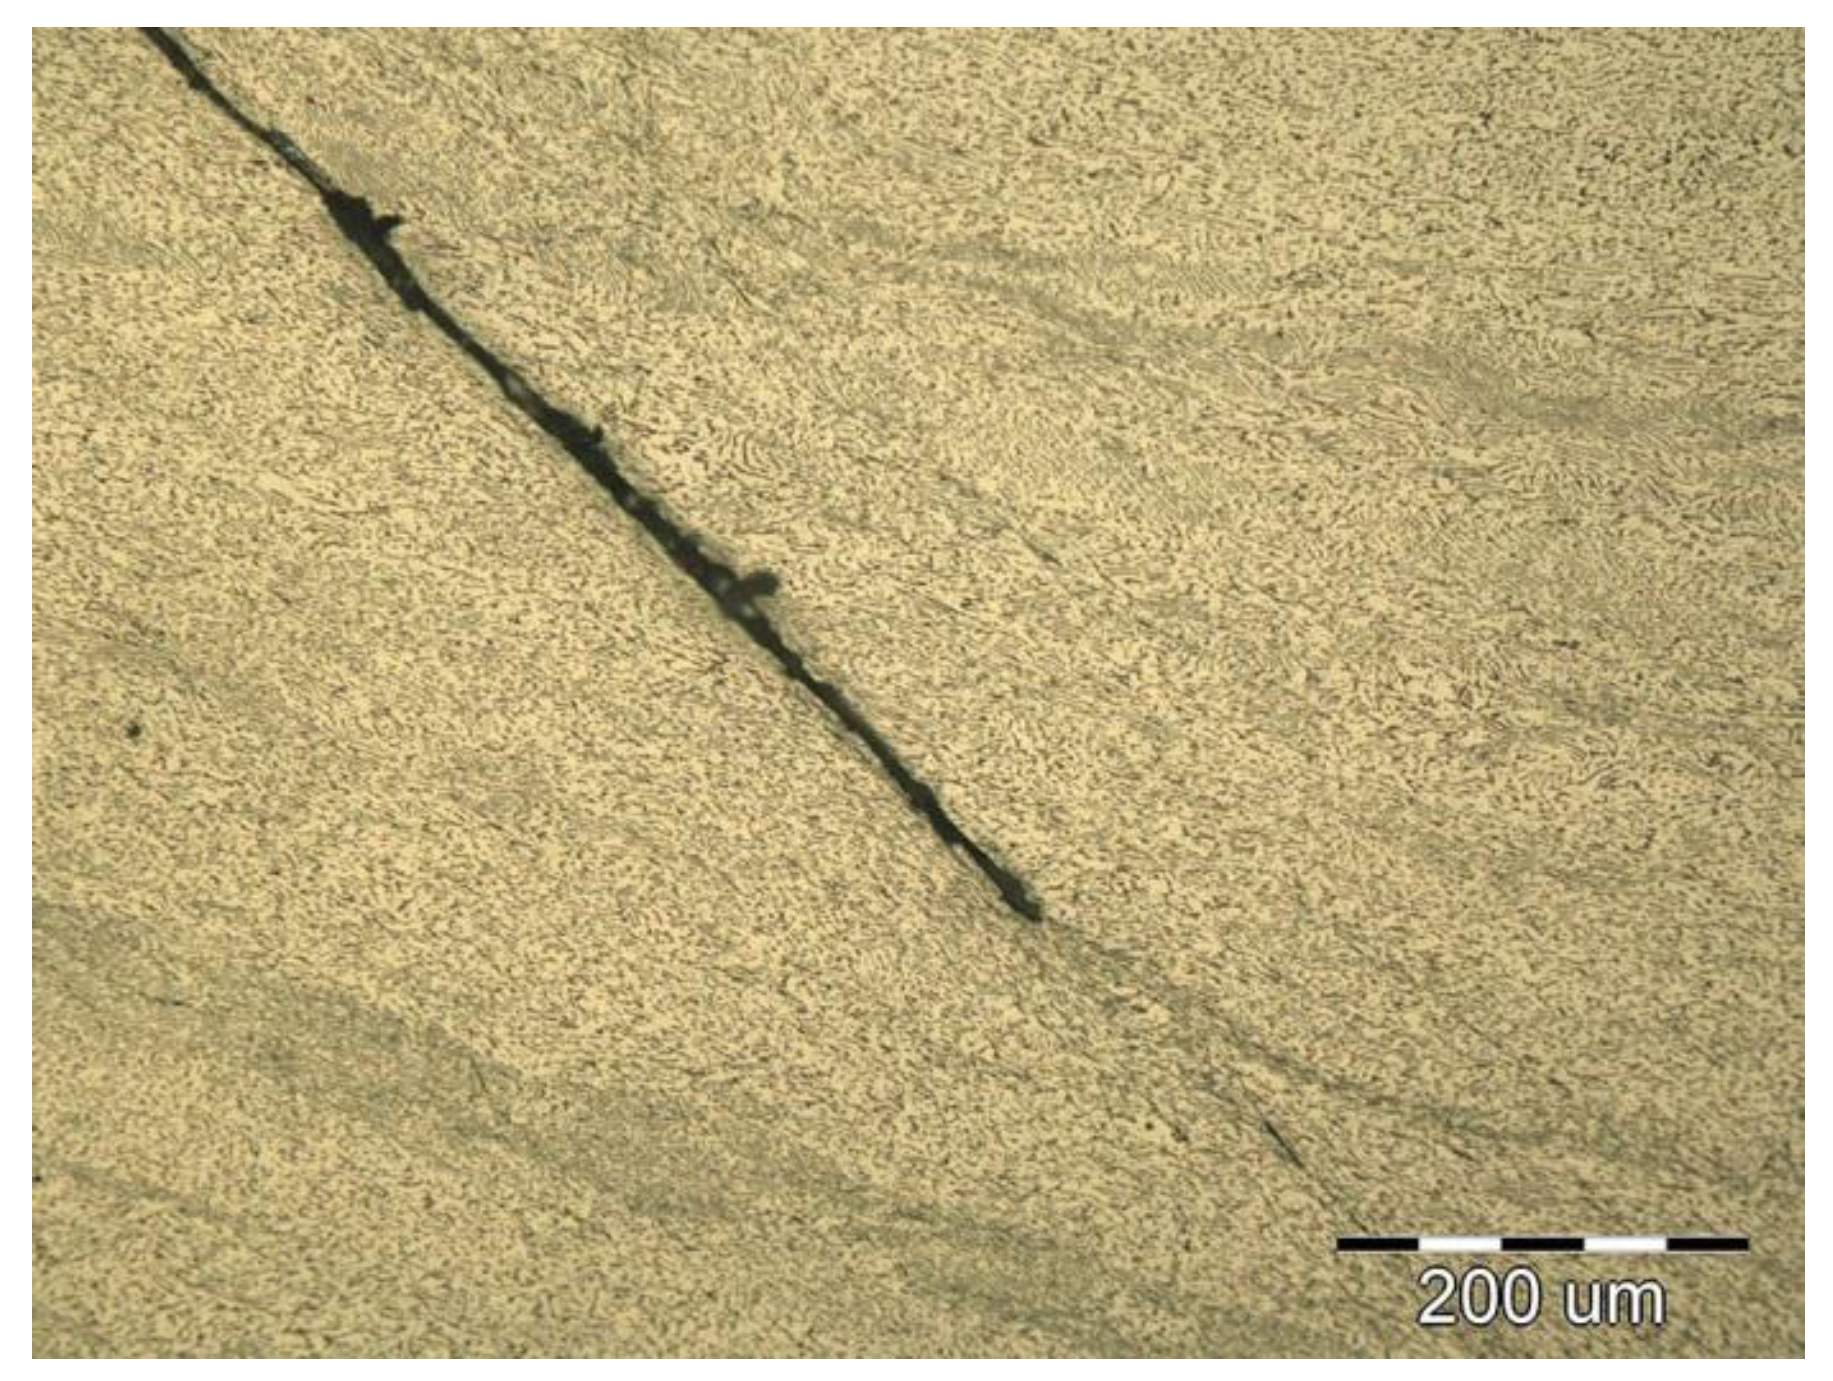
Clearly, the flow instability region predicted by Prasad’s instability criterion was located in the temperature region of 700–975 °C within the strain rate range of 0.1–1 s−1, while the instability region predicted by Murty’s instability criterion was significantly narrower within the temperature range of 700–825 °C and strain rate range of 0.1–1 s−1, as shown in Figure 8. Generally, the mechanism of flow instability should be related to cracking or localized plastic flow [31]. Obviously, shear cracking exhibiting the orientation of ~45° with the compression direction appeared when the specimen was deformed at 700 °C/1 s−1, as shown in Figure 9. In this case, dynamic softening was difficult to take place completely or even operate due to low temperature and short deformation time, which was prone to induce flow instability. However, the microstructure at 900 °C/1 s−1 and 900 °C/0.1 s−1 exhibited partial dynamic recrystallization, restraining flow instability effectively, as shown in Figure 5g and Figure 7f. It indicated that Murty’s criterion was more precise in predicting the flow instability of the as-rolled Ti-55 alloy compared to Parasad’s criterion. Hence, the flow instability region of the as-rolled Ti-55 alloy was located in the temperature range of 700–825 °C and strain rate range of 0.1–1 s−1, and thus the processing map of as-rolled Ti-55 alloy derived from Murty’s criterion was only discussed in the following section, which was thought to have a wider application range for the type of flow stress versus strain rate curves [29,31].
3.4.3. Stability Region
Figure 8b shows the processing maps at the true strain of 0.8 of the as-rolled Ti-55 alloy derived from Murty’s instability criterion. It can be seen that the processing map exhibited three higher power dissipation regions with peak dissipation efficiency of 48–64%: Region I: 750–850 °C/0.001–0.1 s−1, Region II: 850–975 °C/0.001–1 s−1 and Region III: 975–1050 °C/0.001–1 s−1. Although the stacking fault energy of the as-rolled Ti-55 alloy was relatively higher, the softening mechanism of the three steady deformation domains should be DRX because of the relatively higher dissipation efficiency of 48–64% [32]. Besides this, the occurrence of phase transformation also increased the efficiency of power dissipation [33]. Hence, the greater efficiency of power dissipation in Region II and III indicated the occurrence of phase transformation of α to β, which could be verified by the microstructure evolution during hot compression.
The microstructures of the as-rolled Ti-55 alloy at 800 °C/0.01 s−1 (Region I), 900 °C/0.01 s−1 and 950 °C/0.01 s−1 (Region II) and 1000 °C/0.01 s−1 (Region III) are shown in Figure 5c–f. Clearly, the dynamic recrystallization in Region I was the least insufficient due to relatively low deformation temperature. When deformed at 900 °C/0.01 s−1 (Region II), the microstructure of hot compressed specimens was consisted of α phase and β-transus microstructure, in which dynamic recrystallization took place sufficiently. Even when the strain rate increased to 1 s−1 at 900 °C, dynamic recrystallization still occurred relatively sufficiently (see Figure 7f). However, the coarse β grains formed and precipitated as coarsened lath-shaped secondary α microstructure after hot compression at 1000 °C/0.01 s−1 (Region III), which was harmful for the mechanical properties of Ti-55 alloy. Therefore, Region II (850–975 °C/0.001–1 s−1) was considered to be the optimum deformation region.
4. Conclusions
The hot compression experiment of as-rolled Ti-55 alloy was conducted in the temperature range of 700–1050 °C and strain rate range of 0.001–1 s−1. The hot deformation behavior and workability of the as-rolled Ti-55 alloy were studied and the optimized hot deformation parameters were obtained through analyzing microstructure evolution and establishing hot processing map, the following conclusions can be drawn:
(1) The flow stress decreased gradually with the increase of temperature and decrease of strain rate. The deformation softening mechanism was primarily controlled by DRX of α phase and DRV of β phase. The apparent activation energy Q was determined to be 453.00 KJ/mol and 279.88 KJ/mol in α + β dual-phase region and β single-phase region, respectively, which should be caused by lower deformation temperature and less slip system of α phase (HCP) than β phase (BCC). The constitutive equation for hot deformation in α + β dual-phase region and β single-phase region, respectively, was
and
(2) Discontinuous yielding behavior occurred mainly in the temperature range of 950–1050 °C and strain rate range of 0.01–1 s−1. With the increase of deformation temperature, the yield drop decreased gradually due to the decrease of dislocation density and stress concentration, which restrained the generation of new mobile dislocation. Much higher strain rate could cause the reduction of yield drop since intense work hardening at higher strain rate may conceal the discontinuous yielding behavior. The increasing of β phase content could enhance the yield drop in α + β phase region and the vanishing of α/β interphase boundary may reduce the yield drop in β phase region.
(3) The processing map derived from Murty’s instability criterion was more precise in predicting the hot workability of Ti-55 alloy compared to that based on Prasad’s instability criterion. The processing map exhibited the optimized hot working region with sufficient dynamic recrystallization and α + β-transus microstructure: 850–975 °C/0.001–1 s−1. A coarsened lath-shape β-transus microstructure was formed at higher temperature, while at lower temperature, dynamic recrystallization was not sufficient, which contributed to appearance of shear cracking at higher strain rate (≥0.1 s−1) and resulted in flow instability.
Acknowledgments
This work was supported by the National Natural Science Foundation of China (No.51275131).
Author Contributions
Wenchen Xu and Xueze Jin conceived and designed the experiments; Xunmao Zhong and Xingjie Wan performed the experiments; Fengyong Wu analyzed the data and wrote the paper; Bin Guo and Debin Shan provided guidance and all sorts of support during the work.
Conflicts of Interest
The authors declare no conflict of interest.
References
- Guan, S.X.; Kang, Q.; Wang, Q.J.; Liu, Y.Y.; Li, D. Influence of long-term thermal exposure on the tensile properties of a high-temperature titanium alloy Ti-55. Mater. Sci. Eng. A 1998, 243, 182–185. [Google Scholar] [CrossRef]
- Fang, B.; Chen, Z.Y.; Chen, Z.Q.; Liu, J.H.; Wang, Q.J.; Liu, Y.; Feng, Z.W.; Liu, J.R.; Song, X.Y.; Wei, M.X.; et al. Continuous cooling transformation diagram and microstructure evolution of Ti-55 alloy. Chin. J. Nonferrous Met. 2010, 20, s32–s35. [Google Scholar]
- Li, X.F.; Jiang, J.; Wang, S.; Chen, J.; Wang, Y.Q. Effect of hydrogen on the microstructure and superplasticity of Ti-55 alloy. Int. J. Hydrogen Energy 2017, 42, 6338–6349. [Google Scholar] [CrossRef]
- Wanjara, P.; Jahazi, M.; Monajati, H.; Yue, S.; Immarigeon, J.P. Hot working behavior of near-α alloy IMI834. Mater. Sci. Eng. A 2005, 396, 50–60. [Google Scholar] [CrossRef]
- Wanjara, P.; Jahazi, M.; Monajati, H.; Yue, S. Influence of thermomechanical processing on microstructural evolution in near-α alloy IMI834. Mater. Sci. Eng. A 2006, 416, 300–311. [Google Scholar] [CrossRef]
- Liu, Y.; Baker, T.N. Deformation characteristics of IMI685 titanium alloy under β isothermal forging conditions. Mater. Sci. Eng. A 1995, 197, 125–131. [Google Scholar] [CrossRef]
- Niua, Y.; Houb, H.L.; Li, M.Q.; Li, Z.Q. High temperature deformation behavior of a near alpha Ti600 titanium alloy. Mater. Sci. Eng. A 2008, 492, 24–28. [Google Scholar] [CrossRef]
- Liu, Z.G.; Li, P.J.; Xiong, L.T.; Liu, T.Y.; He, L.J. High-temperature tensile deformation behavior and microstructure evolution of Ti-55 titanium alloy. Mater. Sci. Eng. A 2017, 680, 259–269. [Google Scholar] [CrossRef]
- Seshacharyulu, T.; Medeiros, S.C.; Frazier, W.G.; Prasad, Y.V.R.K. Hot working of commercial Ti-6 Al-4 V with an equiaxed α-β microstructure: Materials modeling considerations. Mater. Sci. Eng. A 2000, 284, 184–194. [Google Scholar] [CrossRef]
- Jia, W.J.; Zeng, W.D.; Zhou, Y.G.; Liu, J.R.; Wang, Q.J. High-temperature deformation behavior of Ti60 titanium alloy. Mater. Sci. Eng. A 2011, 528, 4068–4074. [Google Scholar] [CrossRef]
- Balasubrahmanyam, V.V.; Prasad, Y.V.R.K. Deformation behaviour of beta titanium alloy Ti-10 V-4.5 Fe-1.5 Al in hot upset forging. Mater. Sci. Eng. A 2002, 336, 150–158. [Google Scholar] [CrossRef]
- Philippart, I.; Rack, H.J. High temperature dynamic yielding in metastable Ti-6.8 Mo-4.5 F-1.5 Al. Mater. Sci. Eng. A 1998, 243, 196–200. [Google Scholar] [CrossRef]
- Zhu, Y.C.; Zeng, W.D.; Zhao, Y.Q.; Shu, Y.; Zhang, X.M. Effect of processing parameters on hot deformation behavior and microstructural evolution during hot compression of Ti40 titanium alloy. Mater. Sci. Eng. A 2012, 552, 384–391. [Google Scholar] [CrossRef]
- Li, L.X.; Lou, Y.; Yang, L.B.; Peng, D.S.; Rao, K.P. Flow stress behavior and deformation characteristics of Ti-3 Al-5 V-5 Mo compressed at elevated temperatures. Mater. Des. 2002, 23, 451–457. [Google Scholar] [CrossRef]
- Wang, K.; Li, M.Q. Characterization of discontinuous yielding phenomenon in isothermal compression of TC8 titanium alloy. Trans. Nonferrous Met. Soc. China 2016, 26, 1583–1588. [Google Scholar] [CrossRef]
- Robertson, D.G.; McShane, H.B. Isothermal hot deformation behaviour of (α + β) titanium alloy Ti-4 Al-4 Mo-2 Sn-0.5 Si (IMI 550). Mater. Sci. Technol. 1997, 13, 459–468. [Google Scholar] [CrossRef]
- Fan, J.K.; Kou, H.C.; Lai, M.J.; Tang, B.; Chang, H.; Li, J.S. High Temperature Discontinuous Yielding in a New Near β Titanium Alloy Ti-7333. Rare Metal Mater. Eng. 2014, 43, 0808–0812. [Google Scholar] [CrossRef]
- He, G.A.; Liu, F.; Si, J.Y.; Yang, C.; Jiang, L. Characterization of hot compression behavior of a new HIPed nickel-based P/M superalloy using processing maps. Mater. Des. 2015, 87, 256–265. [Google Scholar] [CrossRef]
- Zener, C.; Hollomon, J.H. Effect of strain rate upon plastic flow of steel. J. Appl. Phys. 1944, 15, 22–32. [Google Scholar] [CrossRef]
- Wang, K.L.; Lu, S.Q.; Fu, M.W.; Li, X.; Dong, X.J. Identification of the optimal (α + β) forging process parameters of Ti-6.5 Al-3.5 Mo-1.5 Zr-0.3 Si based on processing-maps. Mater. Sci. Eng. A 2010, 527, 7279–7285. [Google Scholar] [CrossRef]
- Zhao, H.Z.; Xiao, L.; Ge, P.; Sun, J.; Xi, Z.P. Hot deformation behavior and processing maps of Ti-1300 alloy. Mater. Sci. Eng. A 2014, 604, 111–116. [Google Scholar] [CrossRef]
- Li, M.Q.; Pan, H.S.; Lin, Y.Y.; Luo, J. High temperature deformation behavior of near alpha Ti-5.6 Al-4.8 Sn-2.0 Zr alloy. J. Mater. Process. Tech. 2007, 183, 71–76. [Google Scholar] [CrossRef]
- Seshacharyulu, T.; Medeiros, S.C.; Morgan, J.T.; Mala, J.C.; Frazier, W.G.; Prasad, Y.V.R.K. Hot deformation mechanisms in ELI grade Ti-6 A1–4 V. Scripta Mater. 1999, 41, 283–288. [Google Scholar] [CrossRef]
- Dong, Y.Y.; Zhang, C.S.; Zhao, G.Q.; Guan, Y.J.; Gao, A.J.; Sun, W.C. Constitutive equation and processing maps of an Al-Mg-Si aluminum alloy: Determination and application in simulating extrusion process of complex profiles. Mater. Des. 2016, 92, 983–997. [Google Scholar] [CrossRef]
- He, D.G.; Lin, Y.C.; Chen, M.S.; Chen, J.; Wen, D.X.; Chen, X.M. Effect of pre-treatment on hot deformation behavior and processing map of an aged nickel-based superalloy. J. Alloy Compd. 2015, 649, 1075–1084. [Google Scholar] [CrossRef]
- Zhao, Z.L.; Li, H.; Fu, M.W.; Guo, H.Z.; Yao, Z.K. Effect of the initial microstructure on the deformation behavior of Ti60 titanium alloy at high temperature processing. J. Alloy Compd. 2014, 617, 525–533. [Google Scholar] [CrossRef]
- Xia, X.S.; Chen, Q.; Li, J.P.; Shu, D.Y.; Hu, C.K.; Huang, S.H.; Zhao, Z.D. Characterization of hot deformation behavior of as-extruded Mg-Gd-Y-Zn-Zr alloy. J. Alloy Compd. 2014, 610, 203–211. [Google Scholar] [CrossRef]
- Liu, J.; Cui, Z.S.; Li, C.X. Analysis of metal workability by integration of FEM and 3-D processing maps. J. Mater. Process. Technol. 2008, 205, 497–505. [Google Scholar] [CrossRef]
- Gupta, R.K.; Narayana Murtya, S.V.S.; Panta, B.; Agarwalab, V.; Sinha, P.P. Hot workability of γ+α2 titanium aluminide: Development of processing map and constitutive equations. Mater. Sci. Eng. A 2012, 551, 169–186. [Google Scholar] [CrossRef]
- Prasad, Y.V.R.K.; Gegel, H.L.; Doraivelu, S.M.; Malas, J.C.; Morgan, J.T.; Lark, K.A.; Barker, D.R. Modeling of Dynamic Material Behavior in Hot Deformation: Forging of Ti-6242. Metall. Trans. A 1984, 15, 1884–1891. [Google Scholar] [CrossRef]
- Narayana Murty, S.V.S.; Nageswara Rao, B. Instability map for hot working of 6061 Al-10 vol% Al2 O3 metal matrix composite. J. Phys. D 1998, 31, 3306–3311. [Google Scholar] [CrossRef]
- Xia, X.S.; Chen, Q.; Zhang, K.; Zhao, Z.D.; Ma, M.L.; Li, X.G.; Li, Y.J. Hot deformation behavior and processing map of coarse-grained Mg-Gd-Y-Nd-Zr alloy. Mater. Sci. Eng. A 2013, 587, 283–290. [Google Scholar] [CrossRef]
- Kong, F.T.; Cui, N.; Chen, Y.Y.; Wang, X.P.; Xiong, N.N. Characterization of hot deformation behavior of as-forged TiAl alloy. Intermetallics 2014, 55, 66–72. [Google Scholar] [CrossRef]
Figure 1.
Schematic diagram of specimens cutting from the as-rolled Ti-55 sheet (ND: Normal Direction; RD: Rolling Direction; TD: Transverse Direction).
Figure 1.
Schematic diagram of specimens cutting from the as-rolled Ti-55 sheet (ND: Normal Direction; RD: Rolling Direction; TD: Transverse Direction).
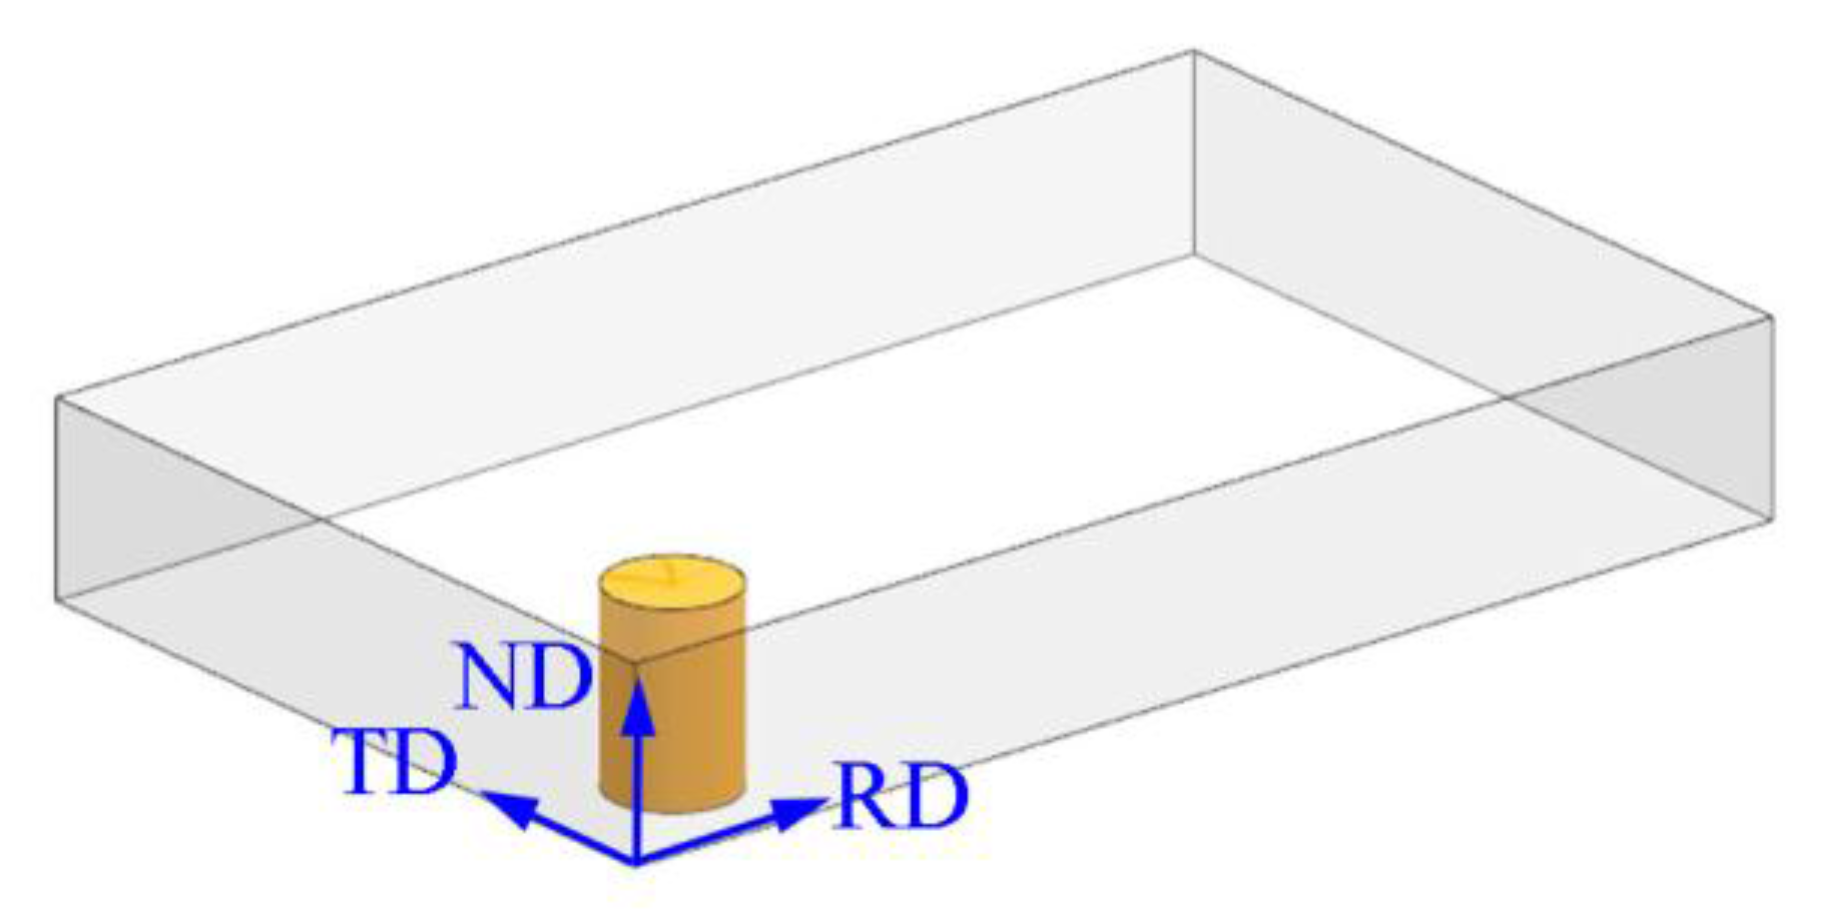
Figure 2.
Typical stress-strain curves at different temperatures and strain rates of as-rolled Ti-55 alloy: (a) 700 °C; (b) 750 °C; (c) 800 °C; (d) 850 °C; (e) 900 °C; (f) 950 °C; (g) 1000 °C; (h) 1050 °C.
Figure 2.
Typical stress-strain curves at different temperatures and strain rates of as-rolled Ti-55 alloy: (a) 700 °C; (b) 750 °C; (c) 800 °C; (d) 850 °C; (e) 900 °C; (f) 950 °C; (g) 1000 °C; (h) 1050 °C.
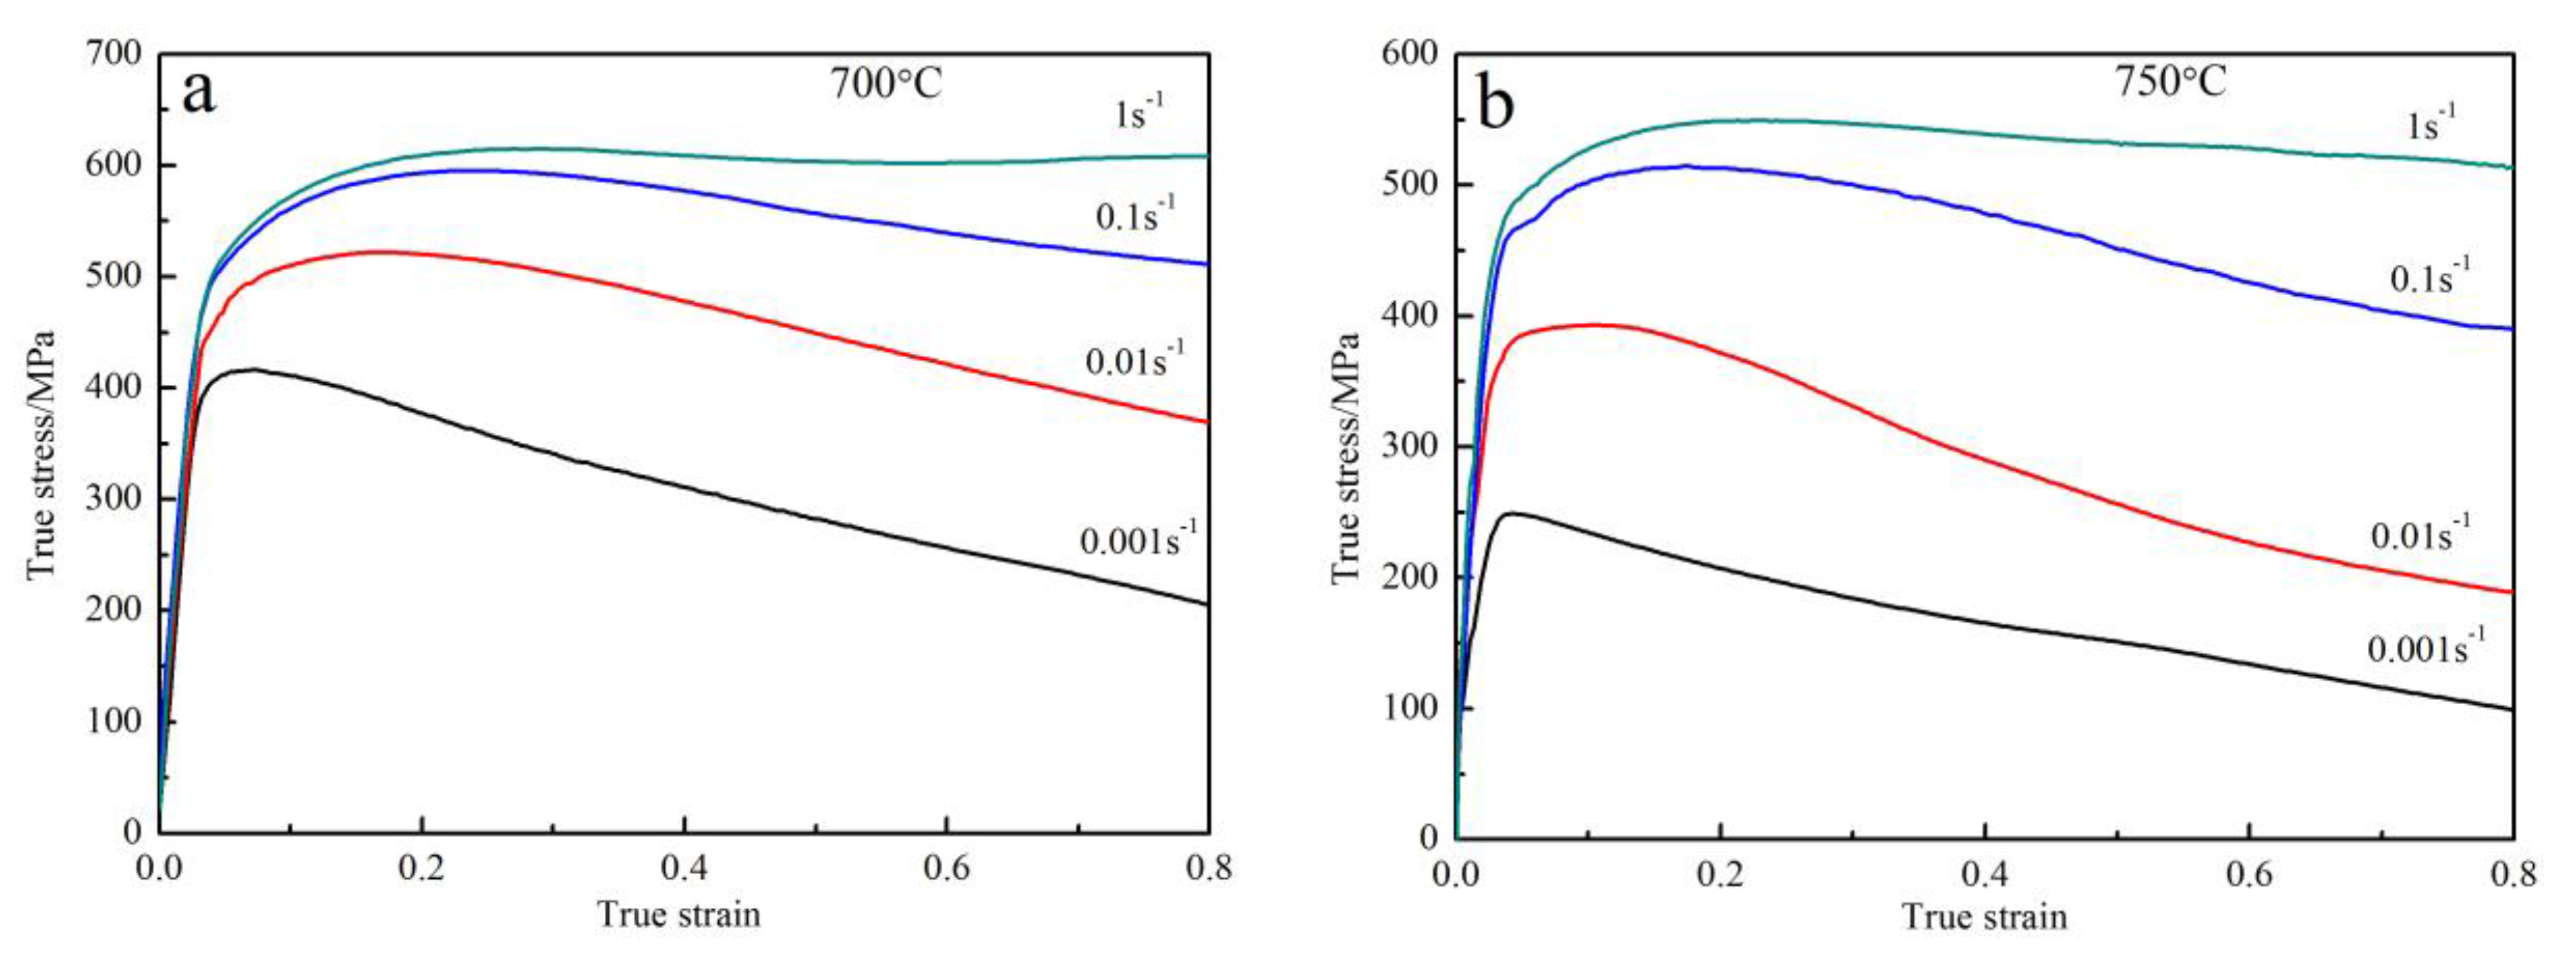
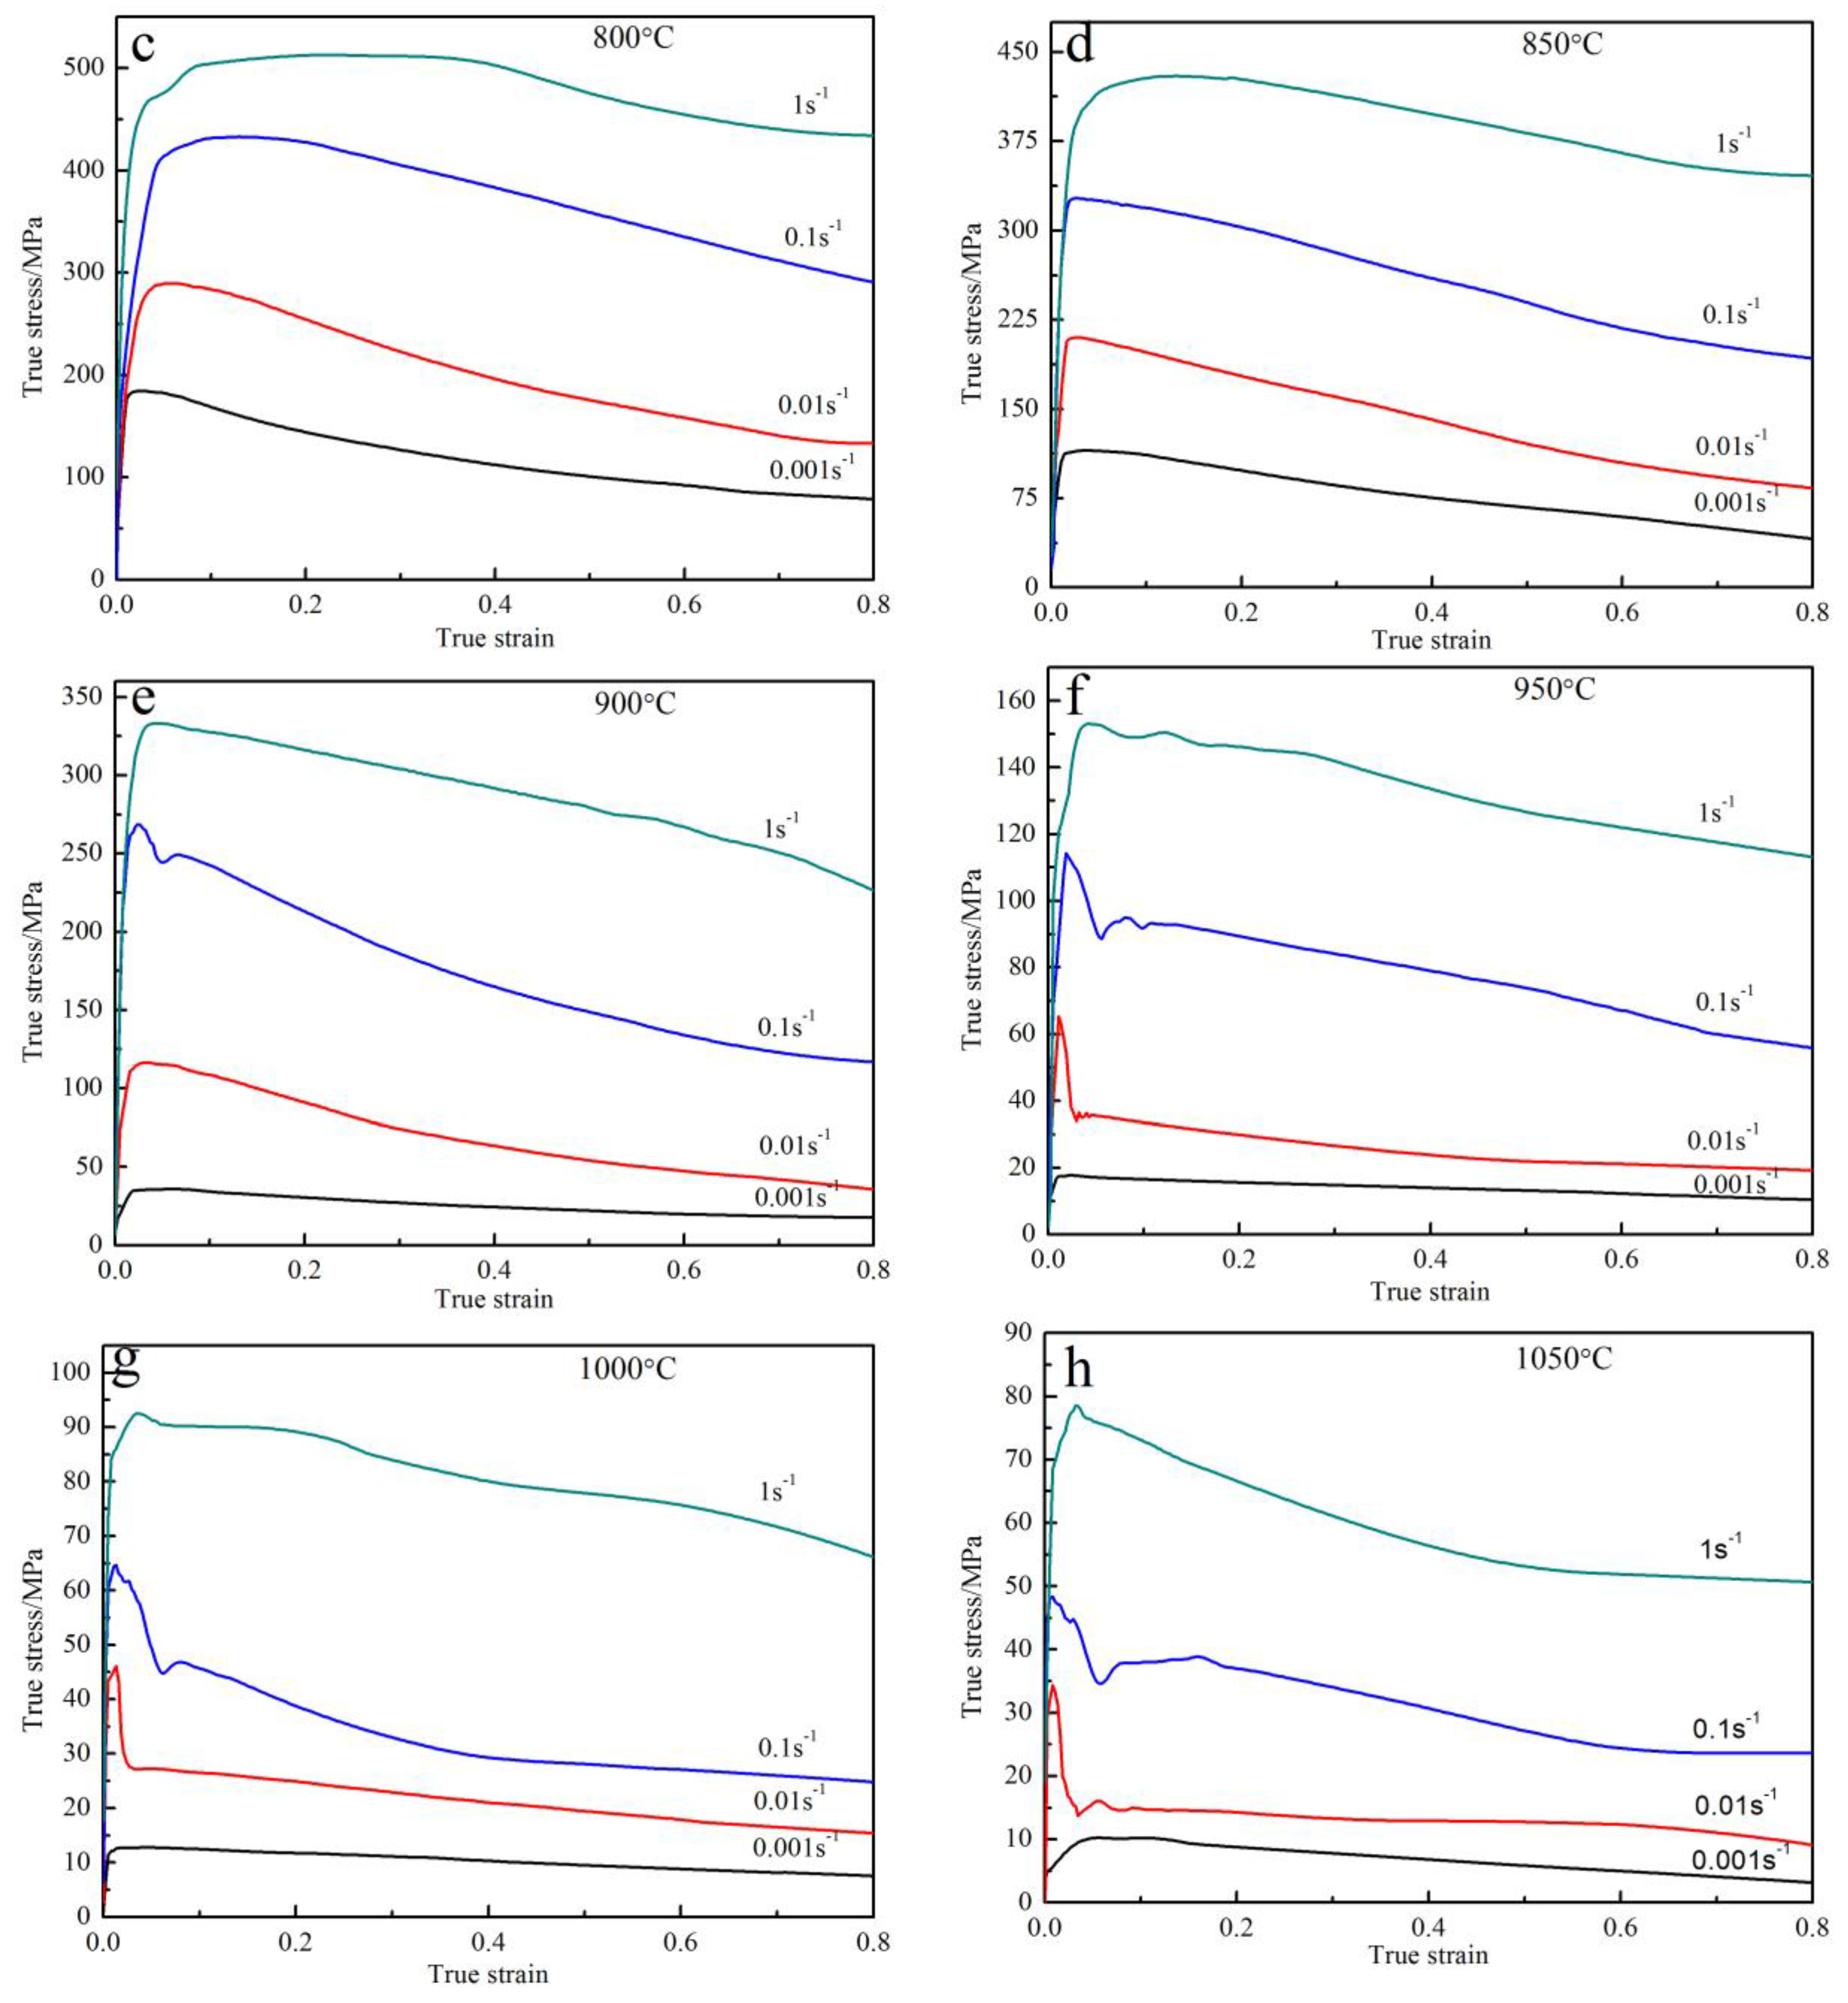
Figure 3.
Schematic diagram of yield stress drop (a) and magnitude of yield drop in Ti-55 alloy as a function of temperature and strain rate (b).
Figure 3.
Schematic diagram of yield stress drop (a) and magnitude of yield drop in Ti-55 alloy as a function of temperature and strain rate (b).
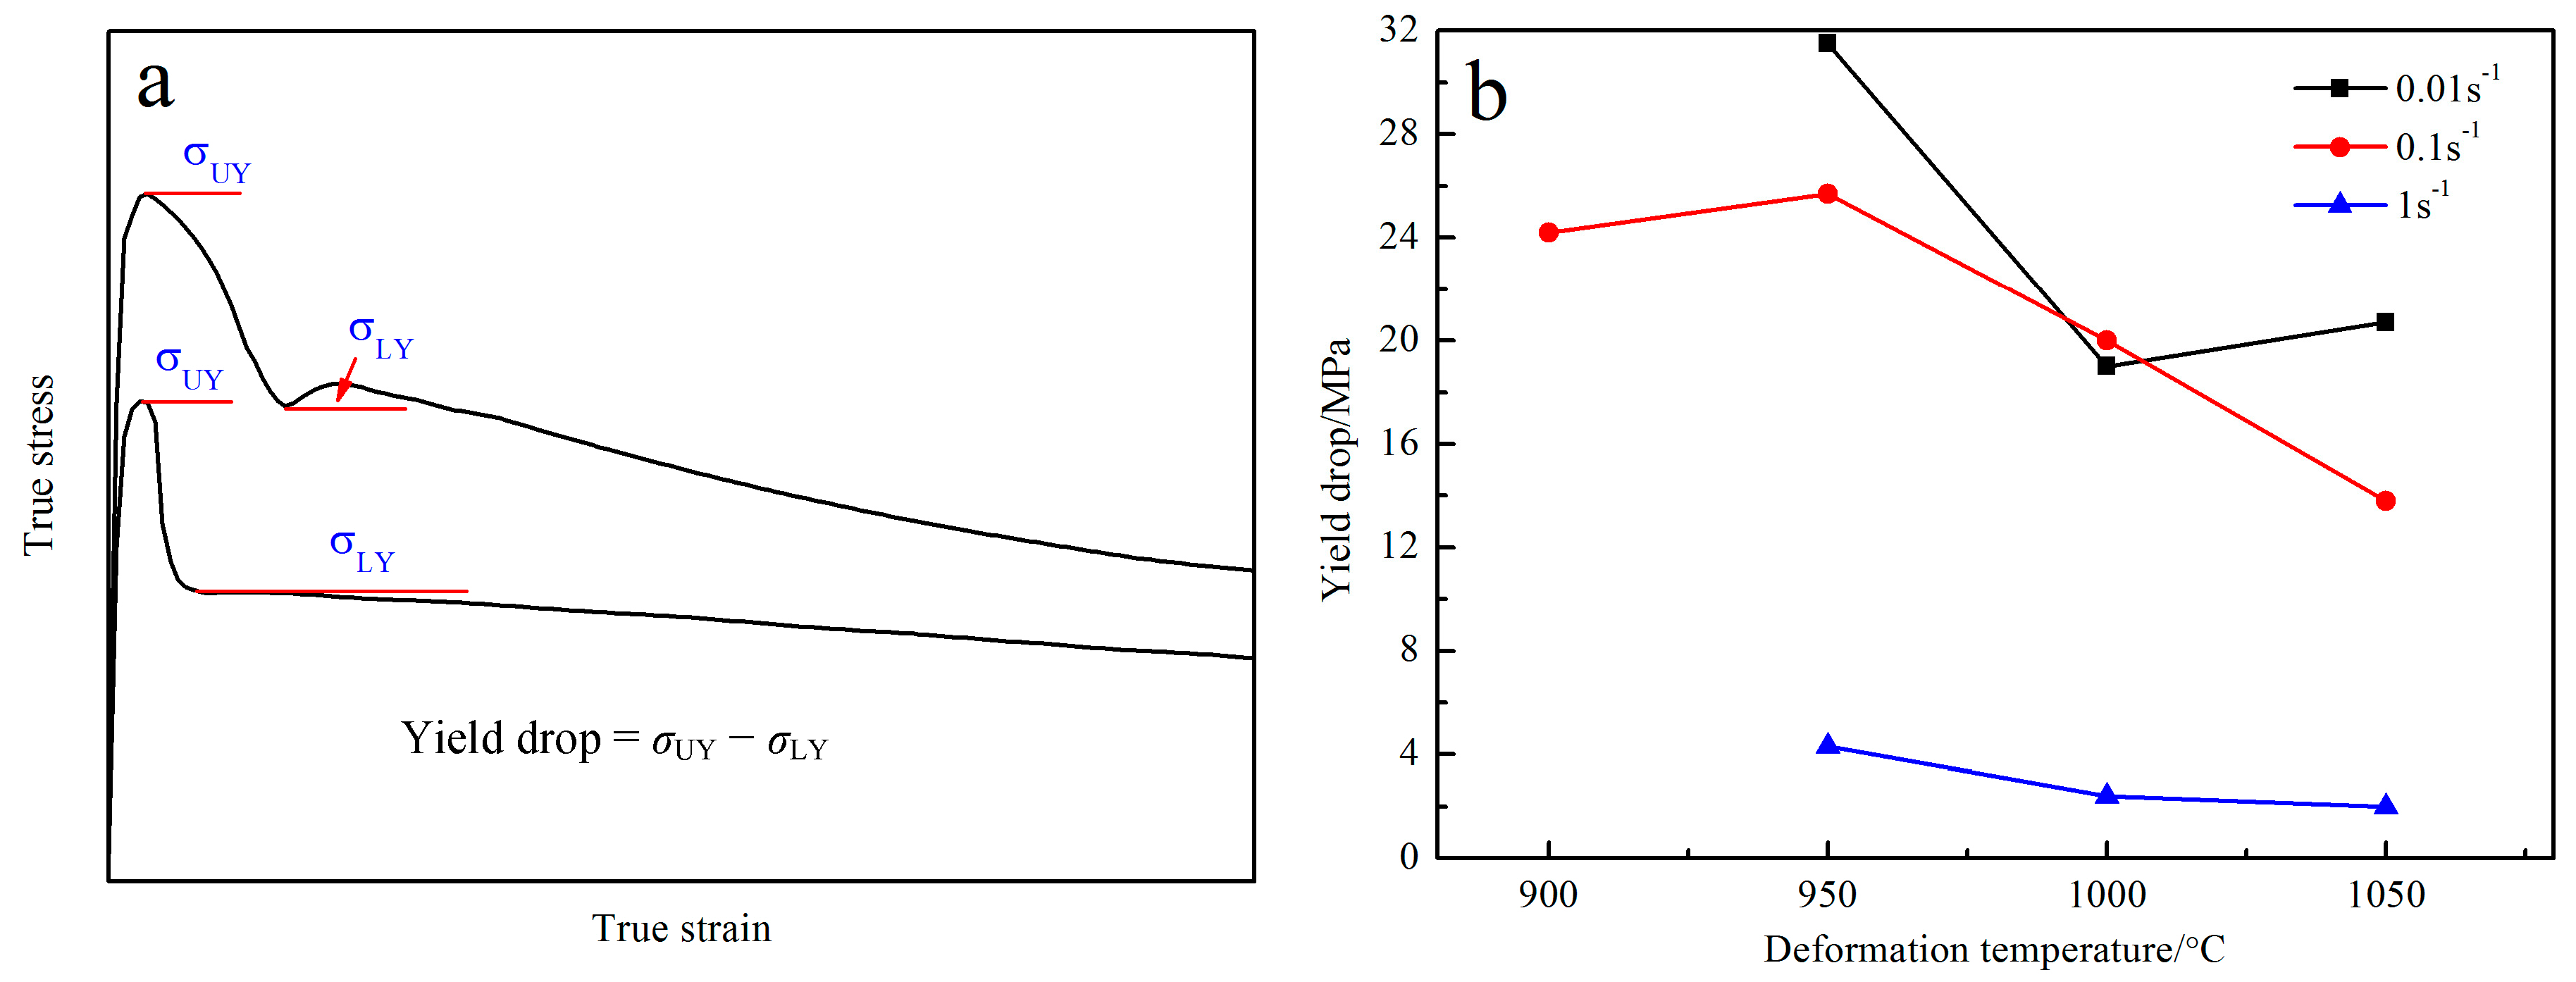
Figure 4.
Linear relationships fitting of peak stress with deformation temperature and strain rate for the as-rolled Ti-55 alloy: (a) ; (b) ; (c) and (d) ; (e) ln[sinh(ασp)]-; (f) ln[sinh(ασp)]-.
Figure 4.
Linear relationships fitting of peak stress with deformation temperature and strain rate for the as-rolled Ti-55 alloy: (a) ; (b) ; (c) and (d) ; (e) ln[sinh(ασp)]-; (f) ln[sinh(ασp)]-.
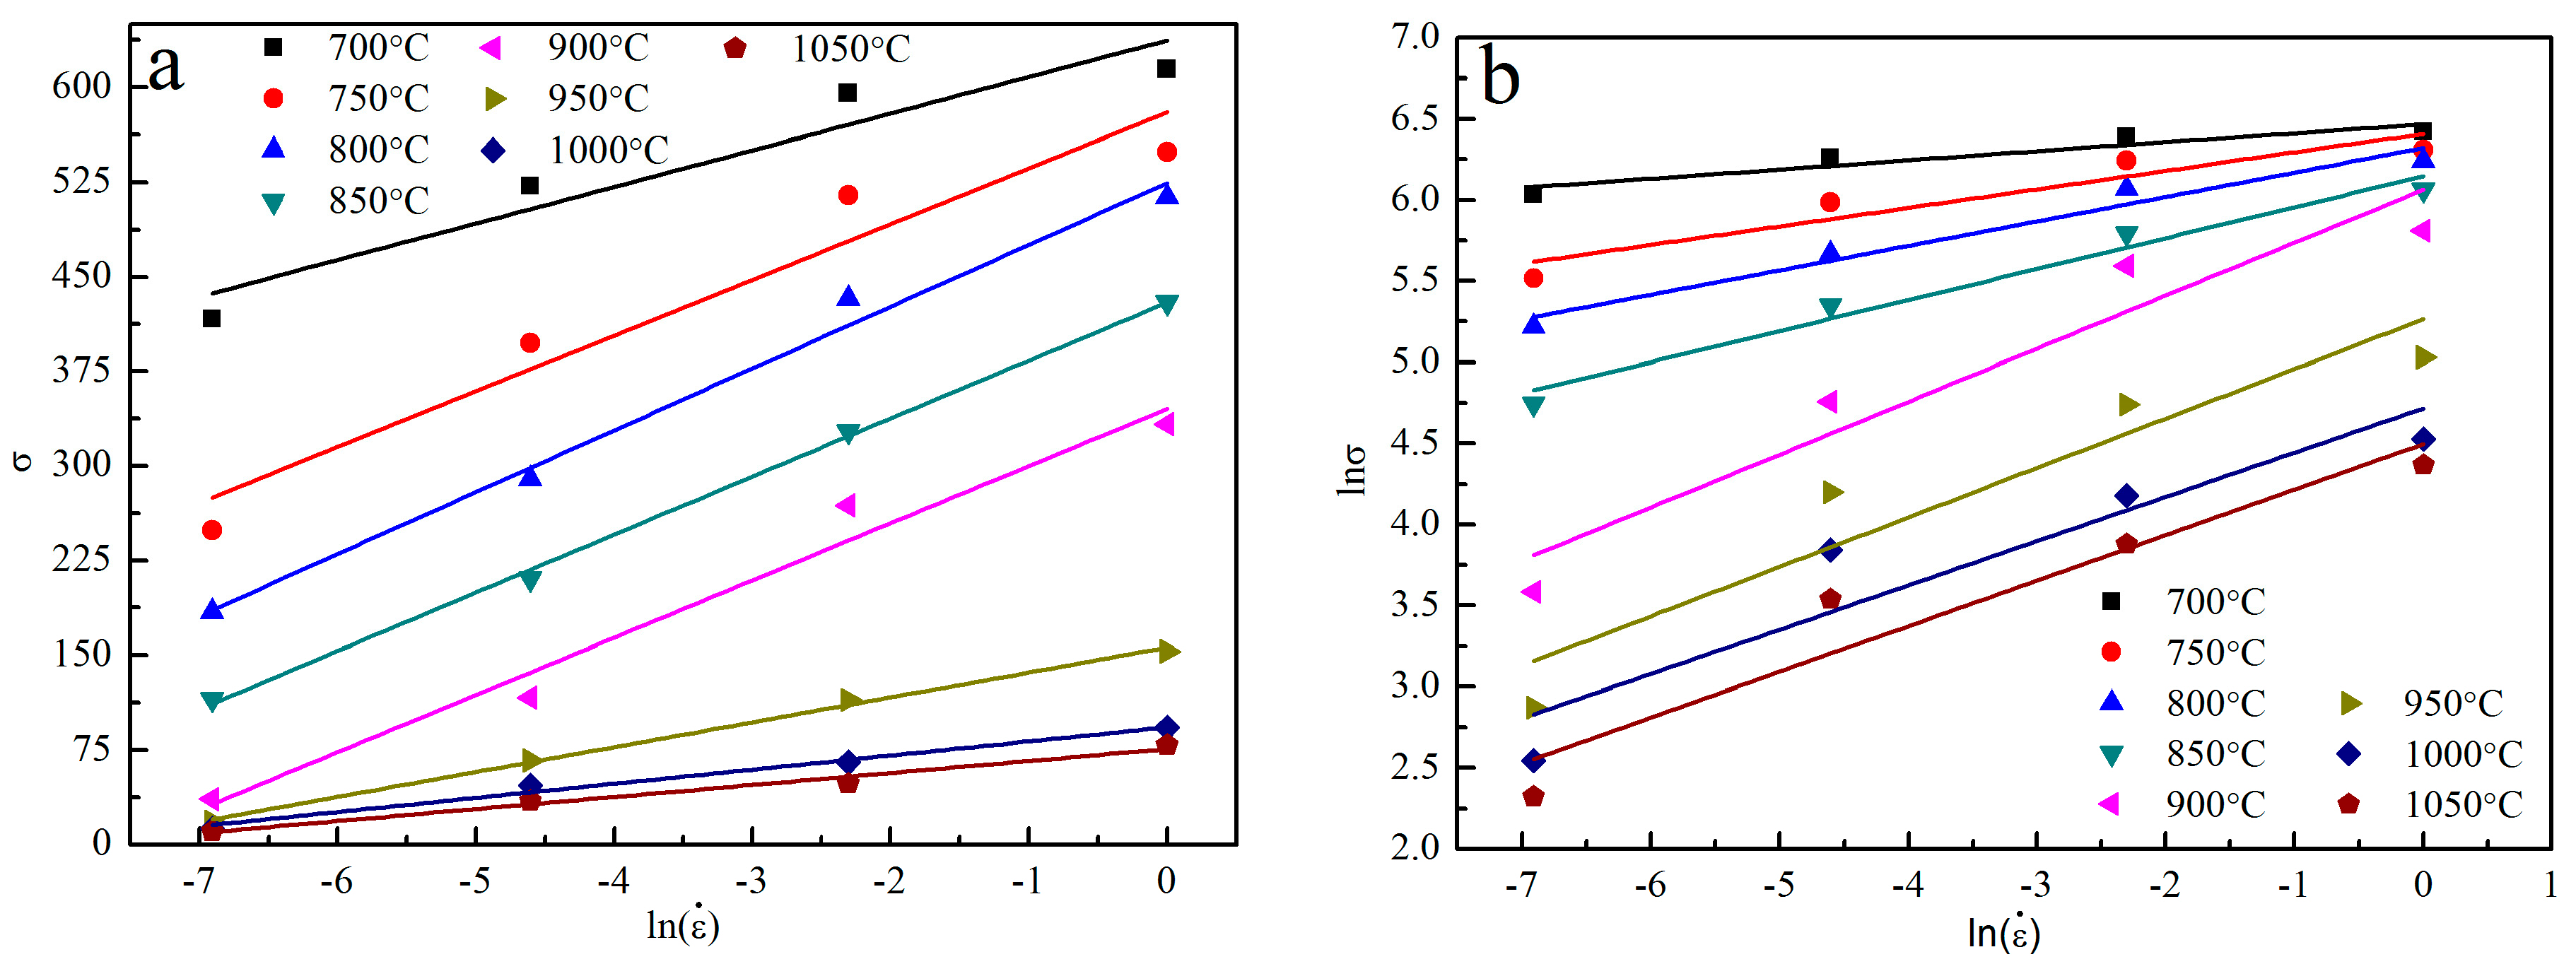
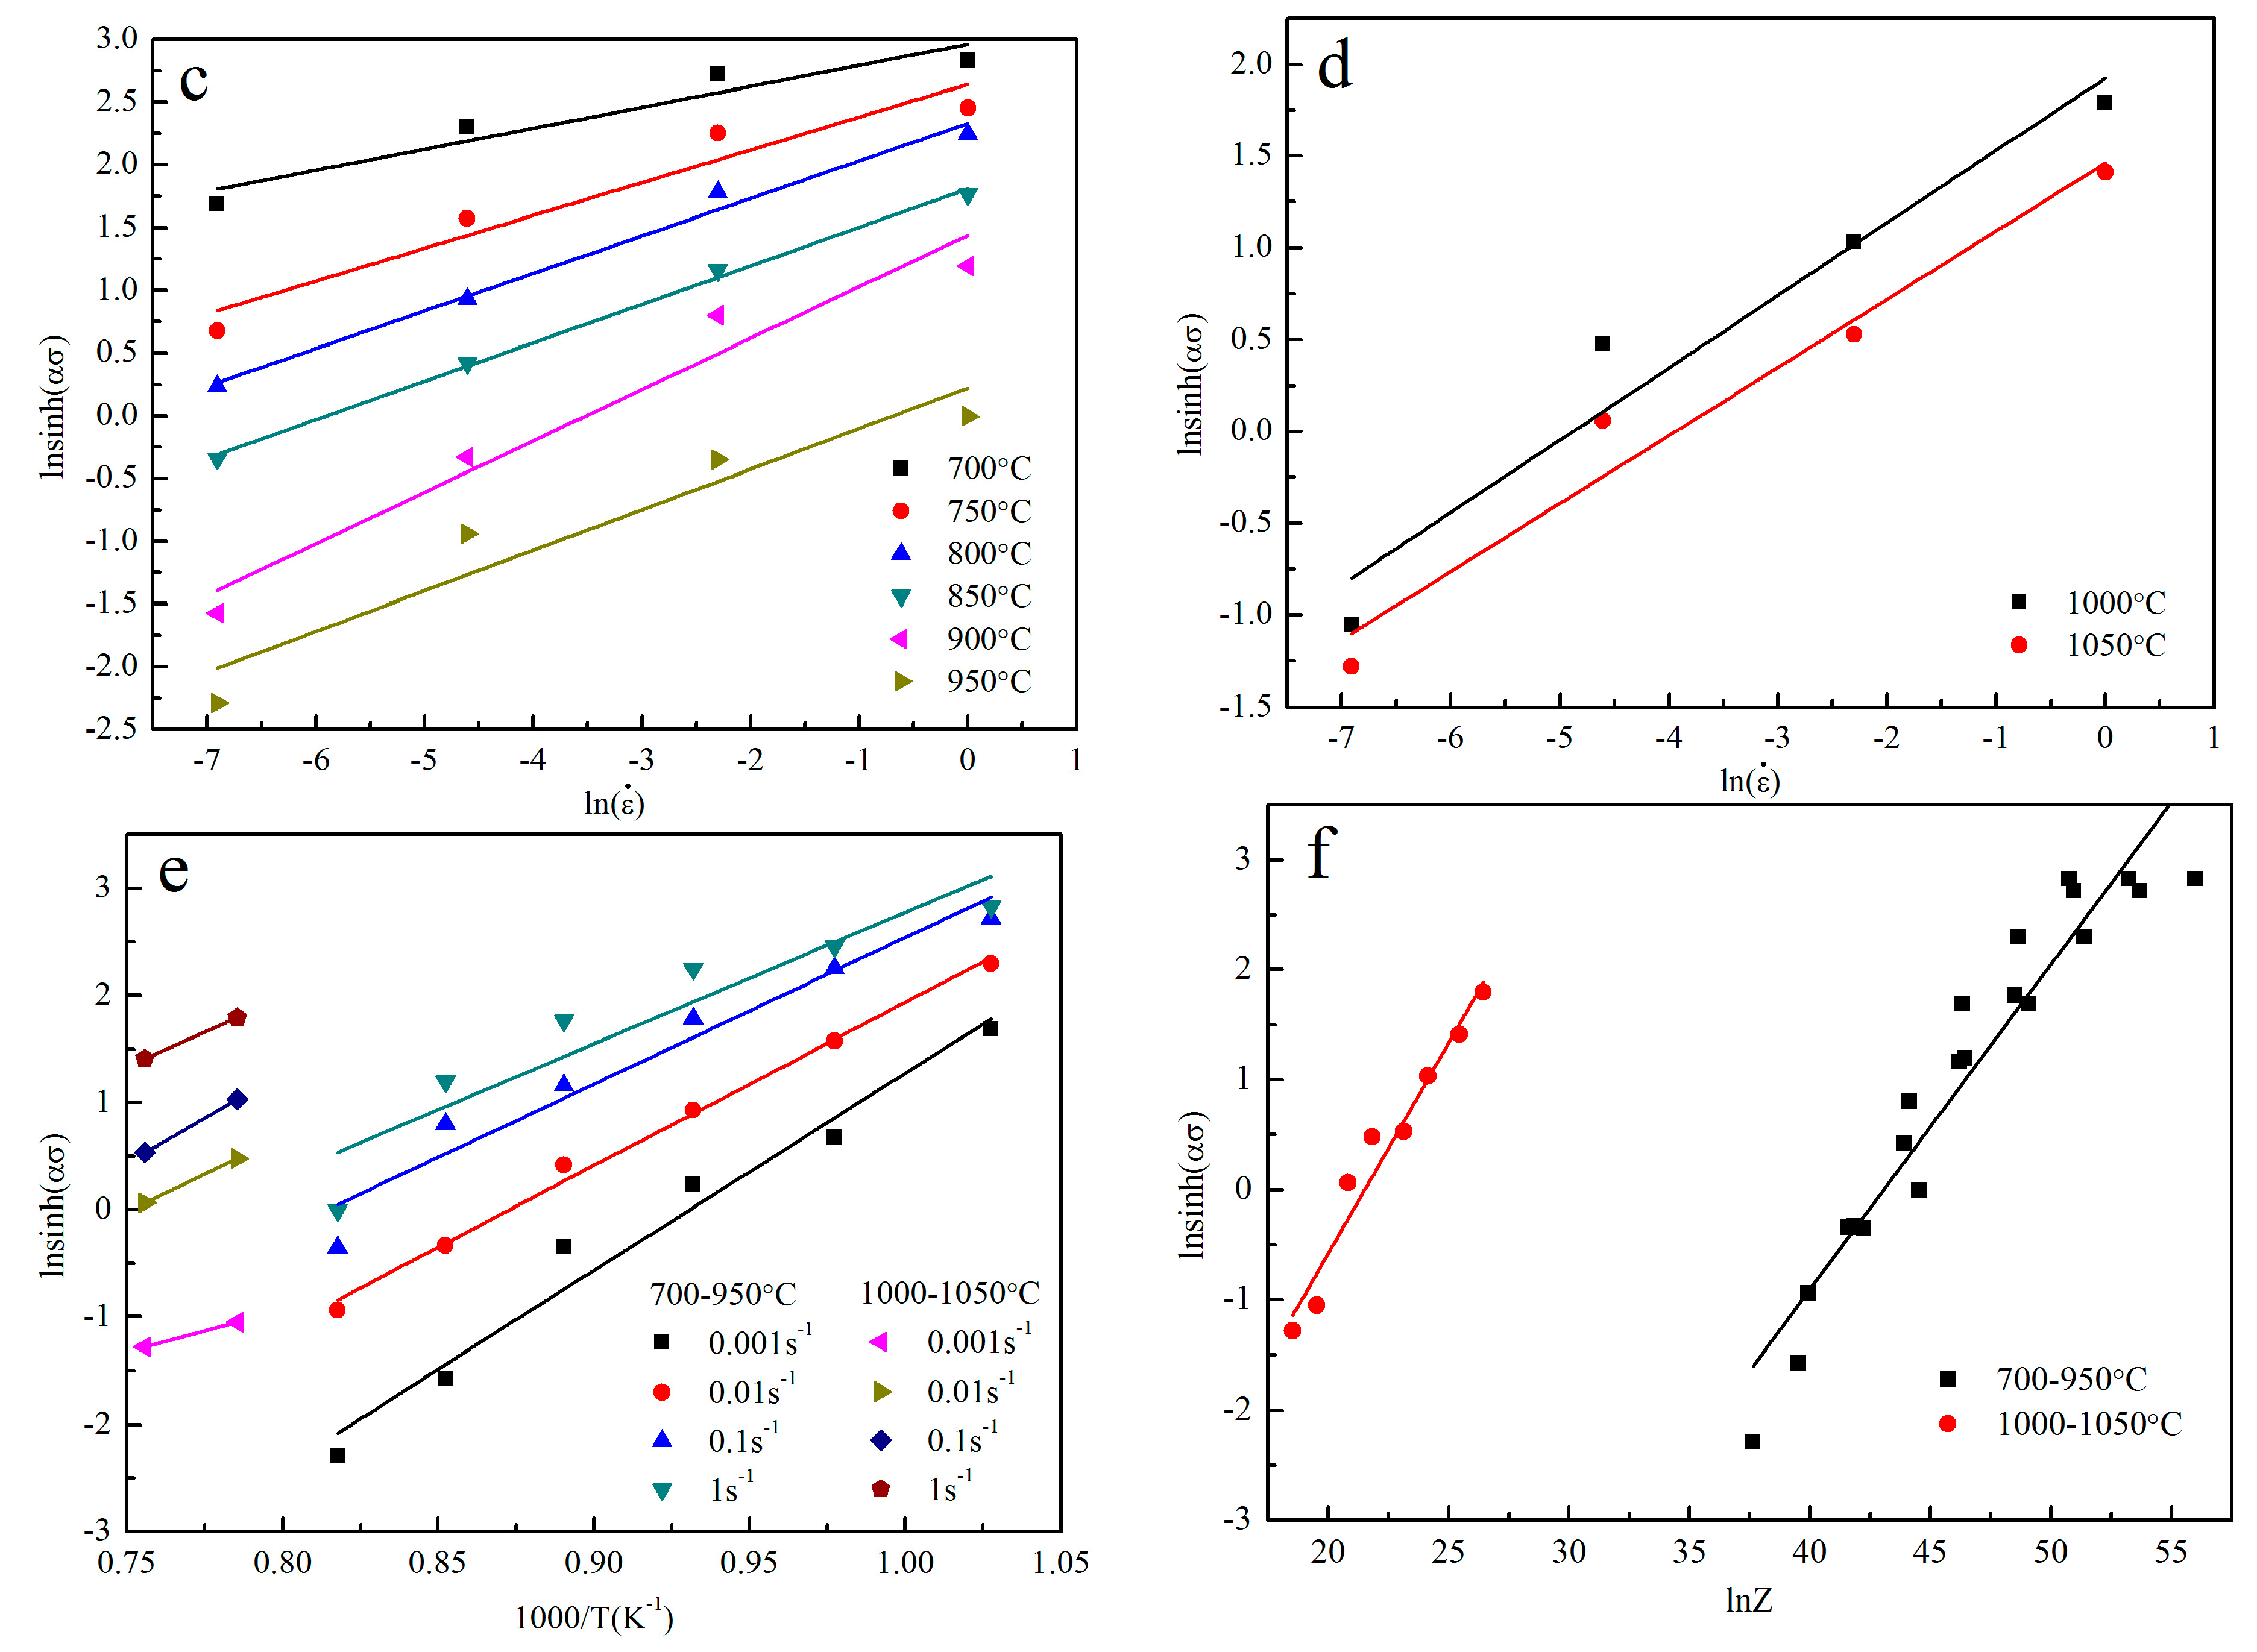
Figure 5.
Microstructures of as-rolled sheet and specimens deformed at different temperatures and strain rates of the as-rolled Ti-55 alloy: (a) As-rolled sheet; (b) 700 °C/0.01 s−1; (c) 800 °C/0.01 s−1; (d) 900 °C/0.01 s−1; (e) 950 °C/0.01 s−1; (f) 1000 °C/0.01 s−1; (g) 900 °C/0.1 s−1; (h) 900 °C/0.001 s−1.

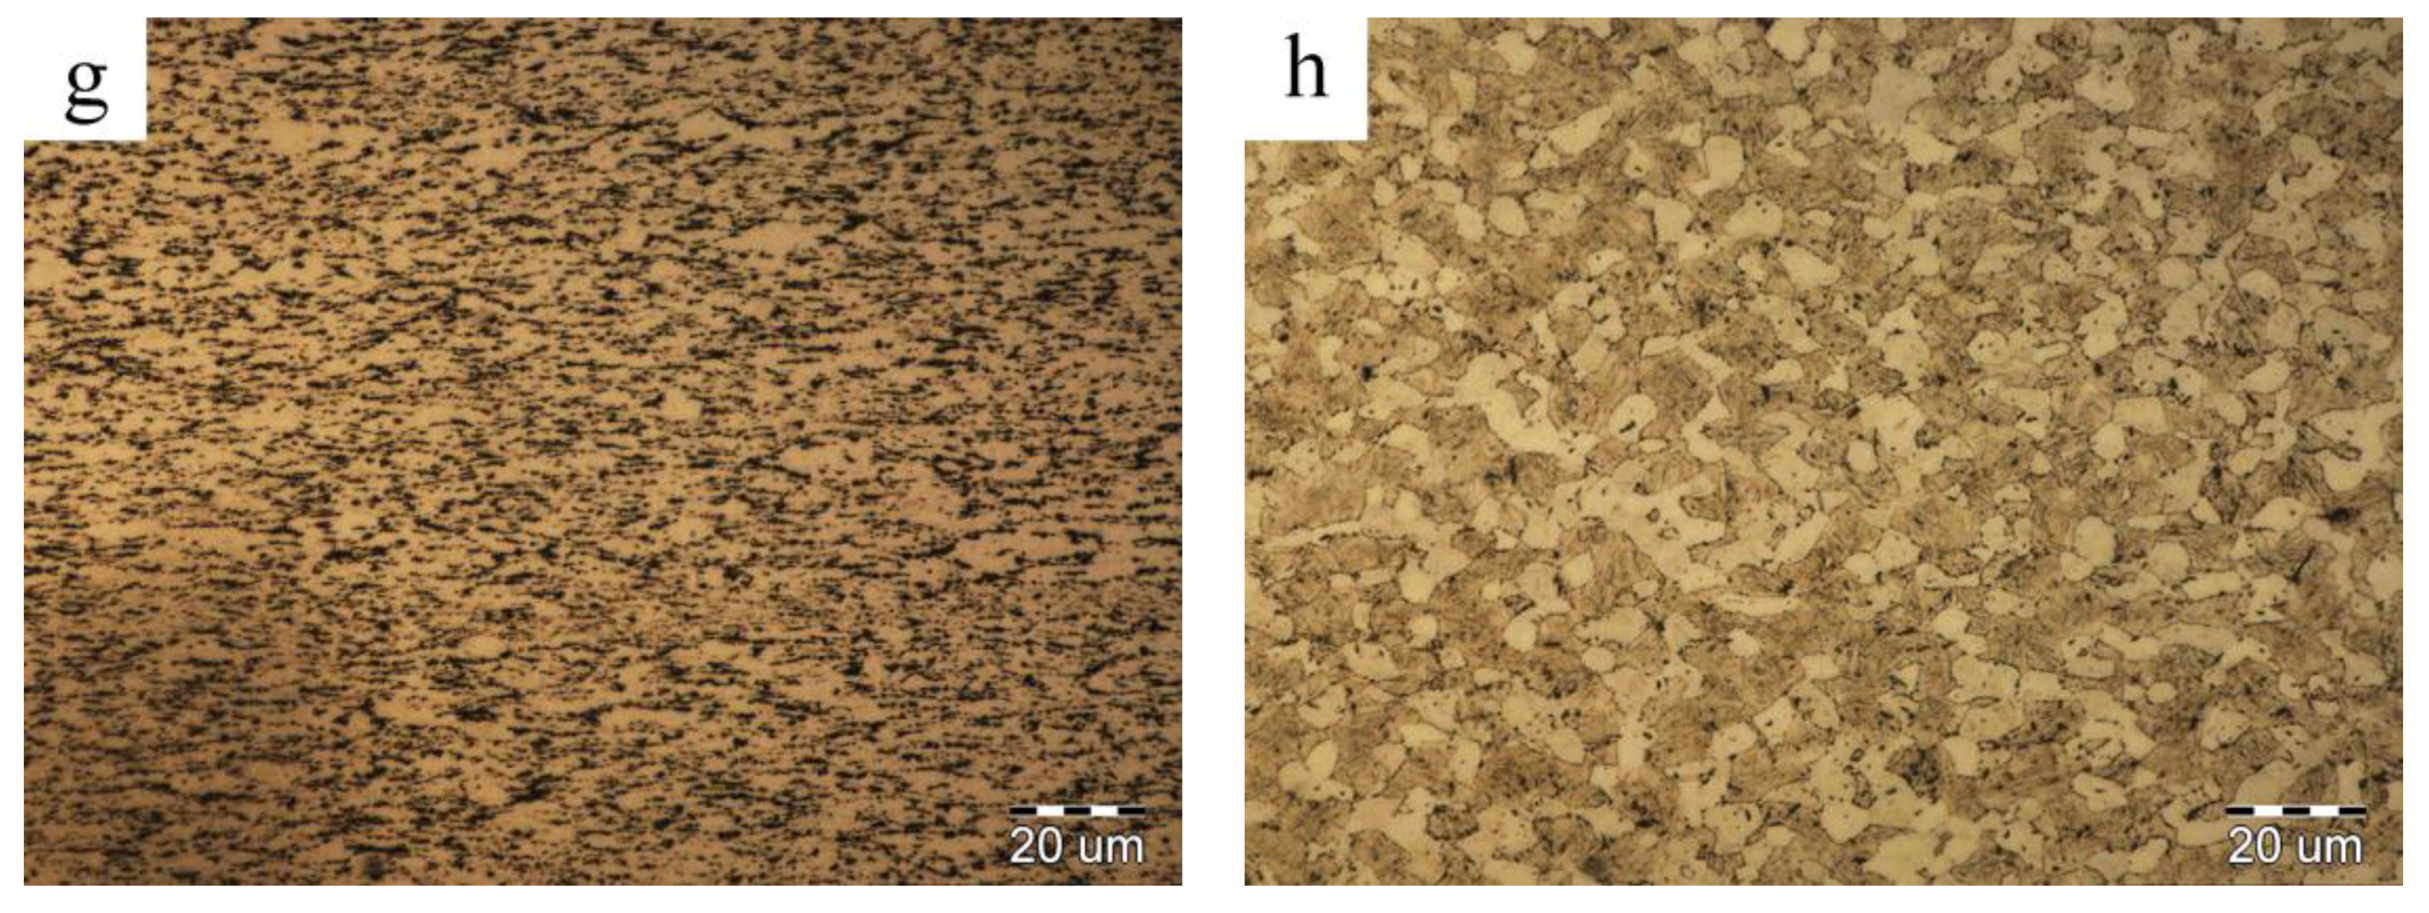
Figure 6.
Electron back scattering diffraction (EBSD) images of the specimens deformed at different deformation conditions of the as-rolled Ti-55 alloy: (a) As-rolled; (b) 800 °C, 0.001 s−1; (c) 800 °C, 0.01 s−1; (d) 900 °C, 0.01 s−1; (e) Percent of β phase/β transus and low angle boundary.
Figure 6.
Electron back scattering diffraction (EBSD) images of the specimens deformed at different deformation conditions of the as-rolled Ti-55 alloy: (a) As-rolled; (b) 800 °C, 0.001 s−1; (c) 800 °C, 0.01 s−1; (d) 900 °C, 0.01 s−1; (e) Percent of β phase/β transus and low angle boundary.
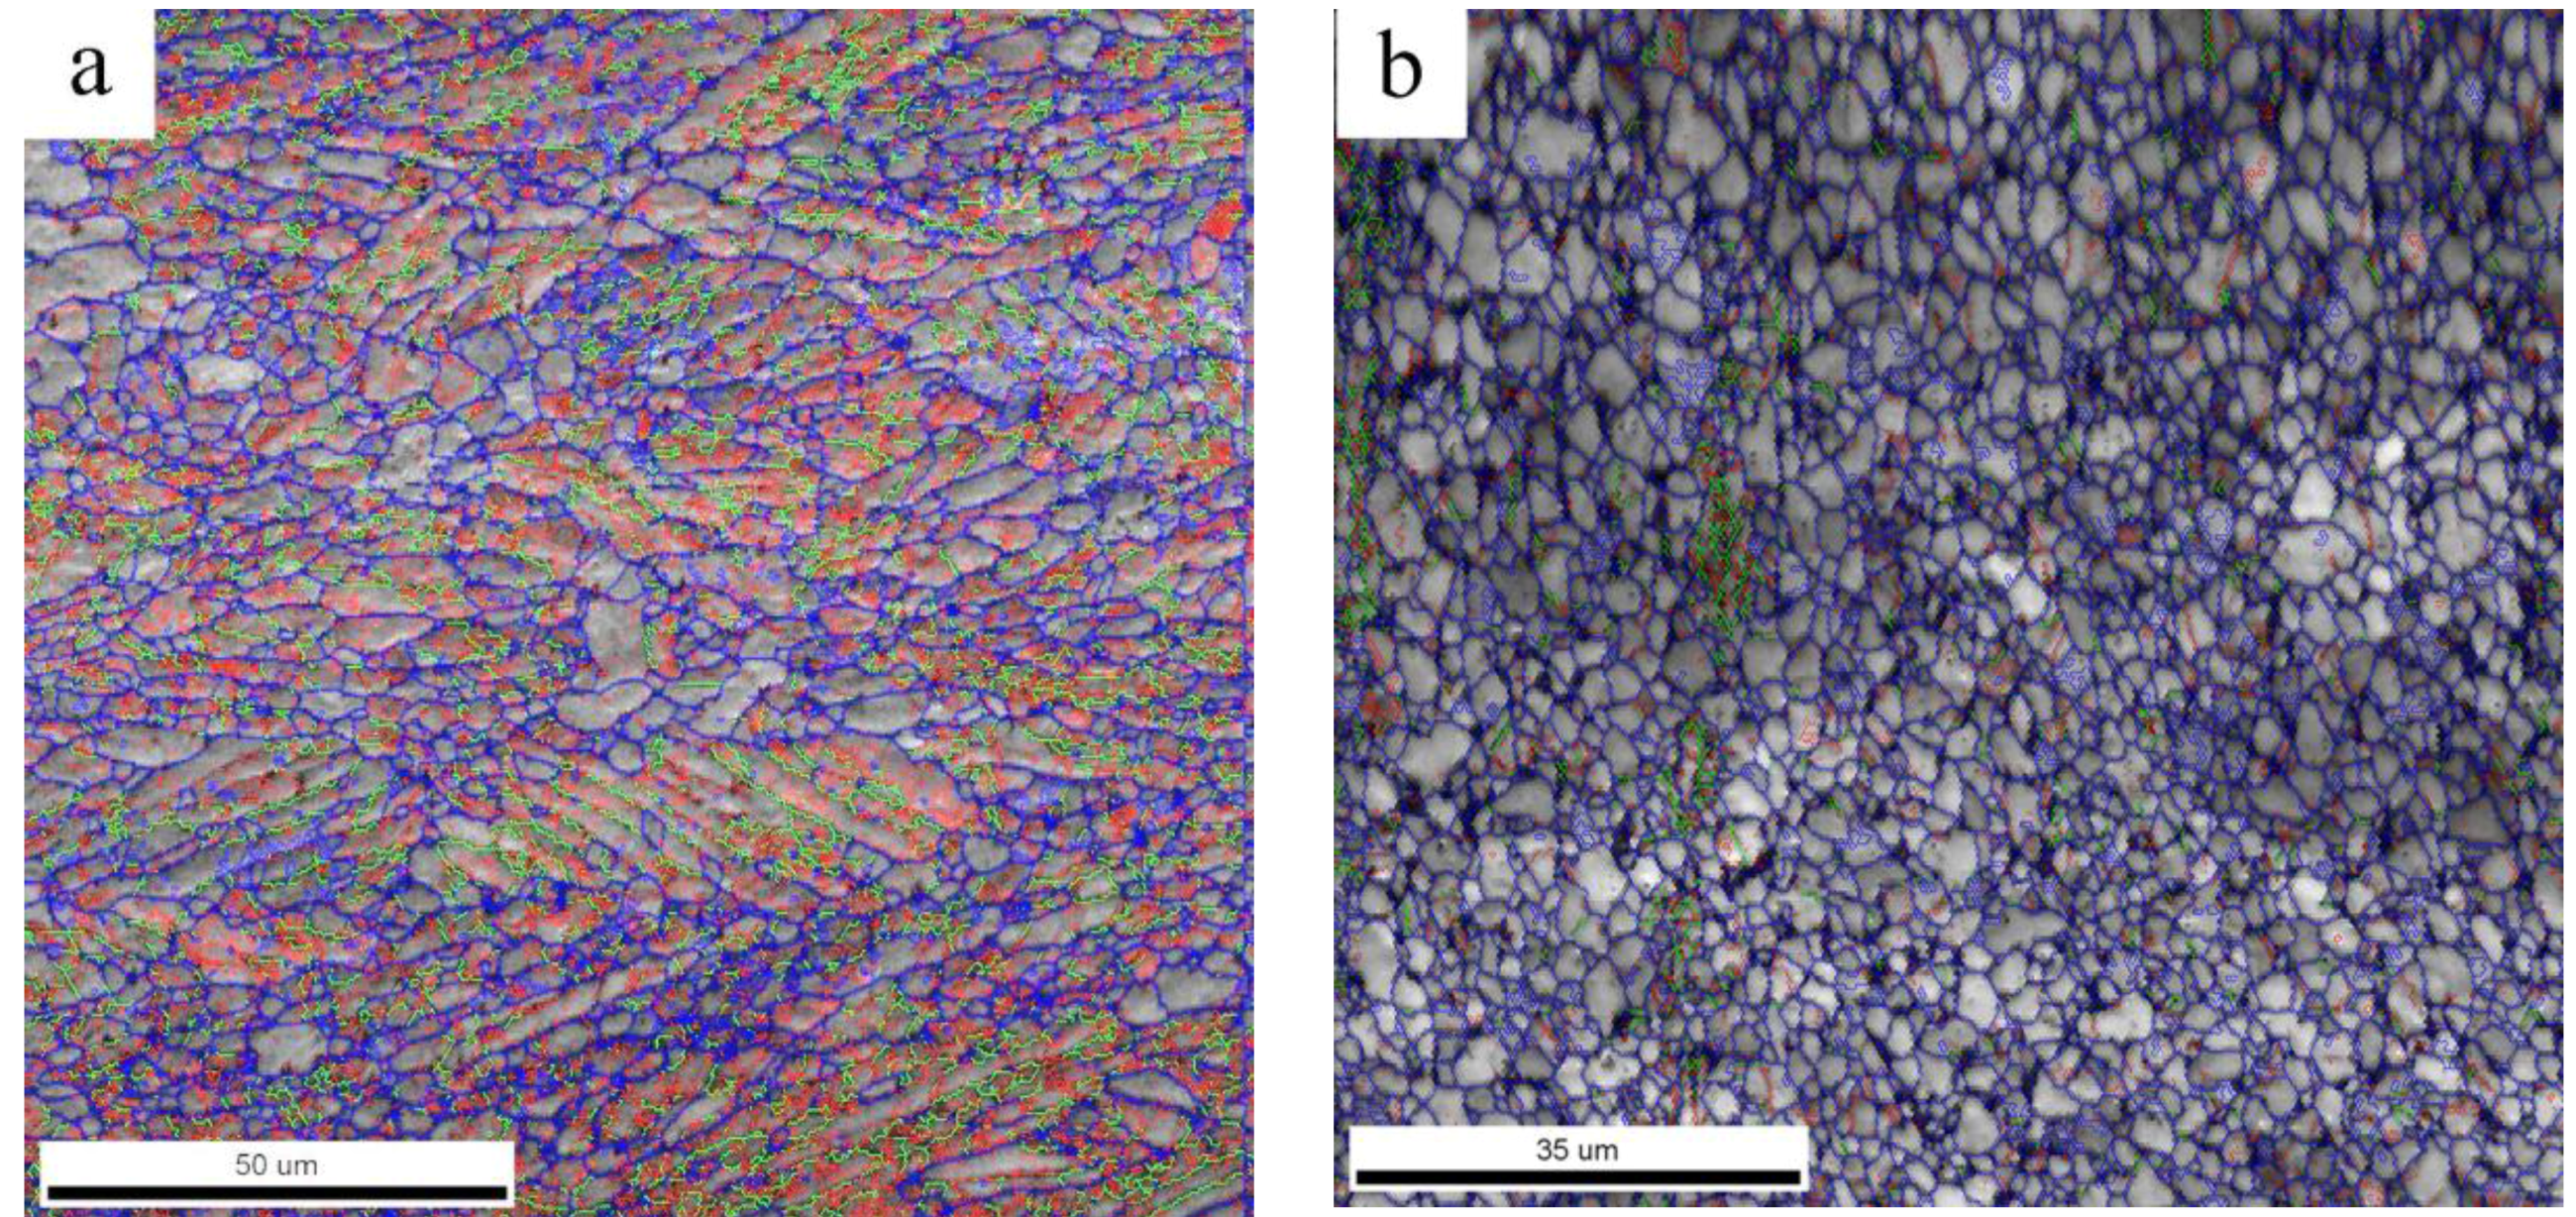
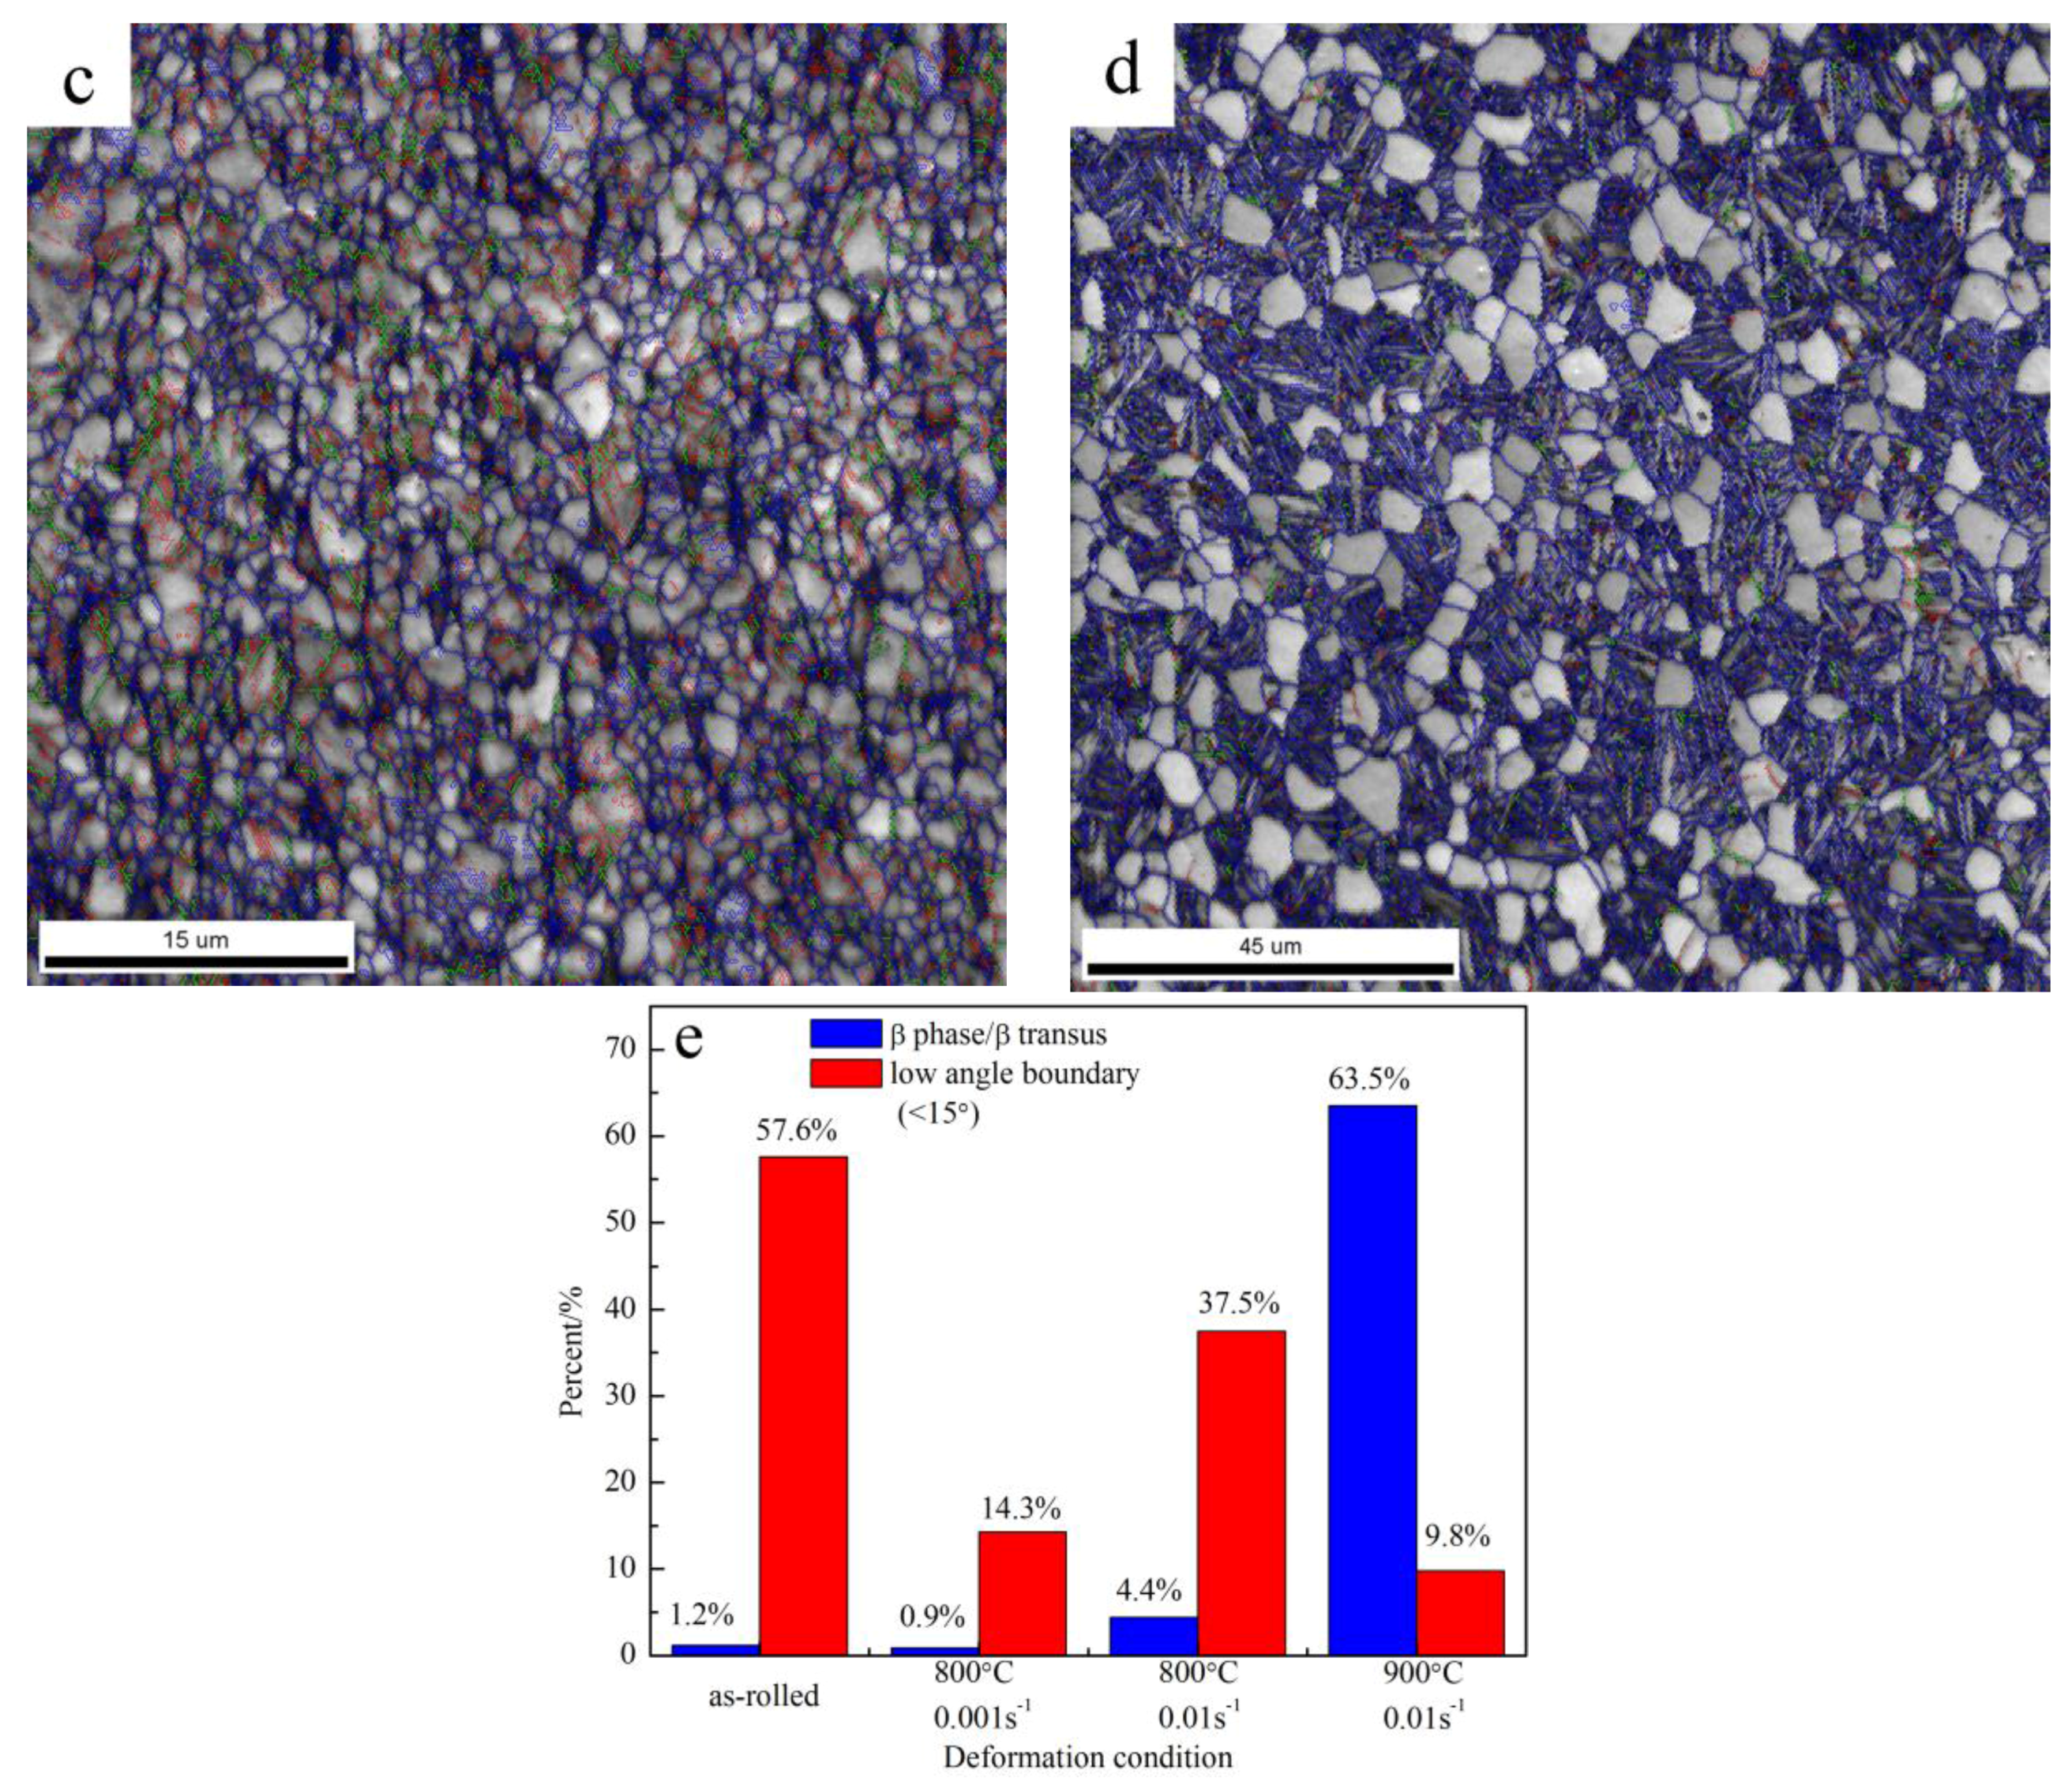
Figure 7.
Transmission electron microscopy (TEM) microstructure of the specimens deformed at different deformation conditions of the as-rolled Ti-55 alloy: (a) As-rolled; (b) 700 °C/0.01 s−1; (c) 800 °C/0.01 s−1; (d) 900 °C/0.01 s−1; (e) 1000 °C/0.01 s−1; (f) 900 °C/1 s−1. (DRX: Dynamic recrystallization.)

Figure 8.
Processing maps at true strain of 0.8 of the as-rolled Ti-55 alloy derived from different instability criteria: (a) Dynamic materials model (DMM) and Prasad’s instability criterion; (b) modified dynamic materials model (MDMM) and Murty’s instability criterion.
Figure 8.
Processing maps at true strain of 0.8 of the as-rolled Ti-55 alloy derived from different instability criteria: (a) Dynamic materials model (DMM) and Prasad’s instability criterion; (b) modified dynamic materials model (MDMM) and Murty’s instability criterion.
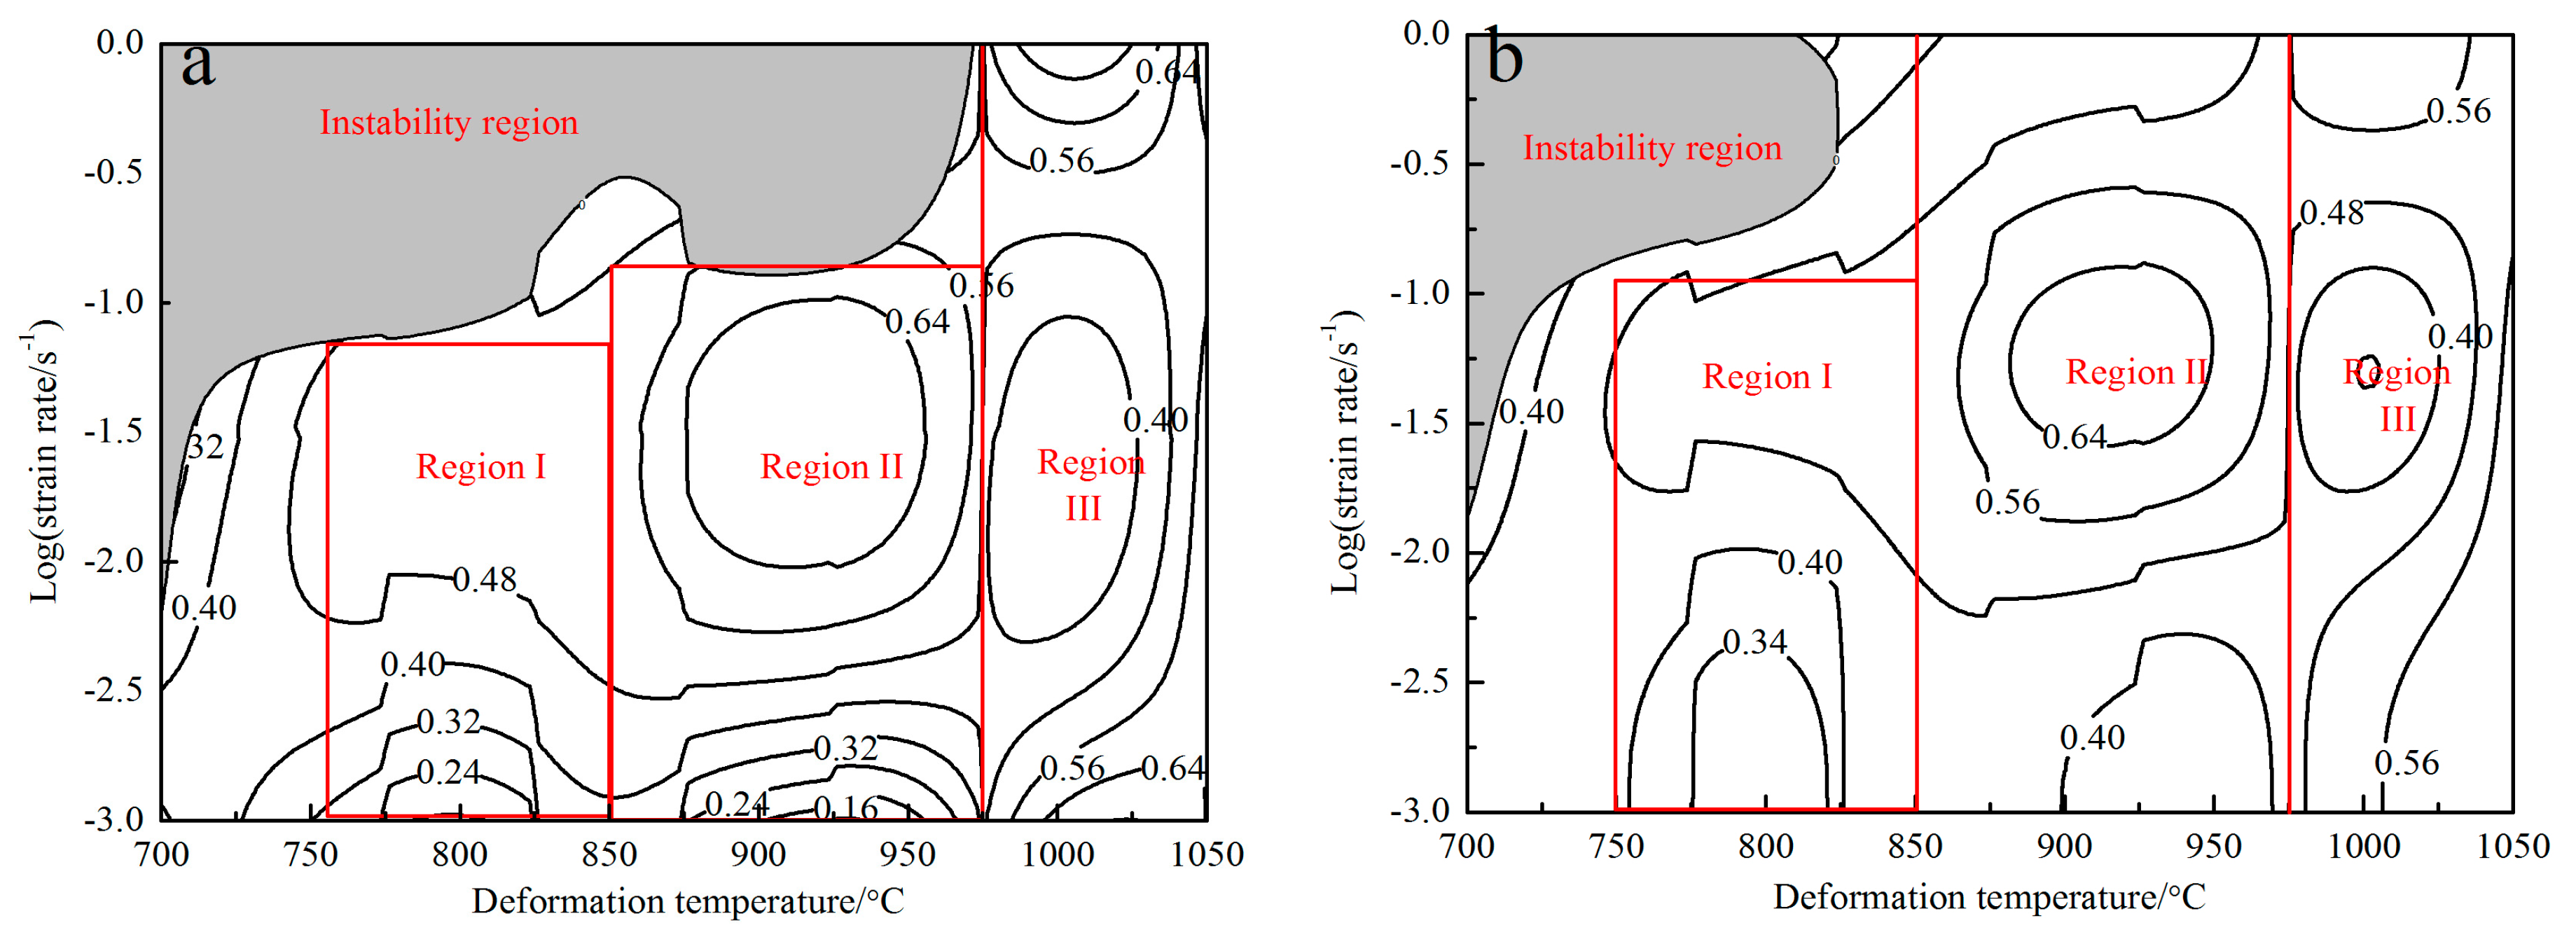
Figure 9.
Microstructure of specimen deformed at 700 °C/1 s−1 of the as-rolled Ti-55 alloy.


Table 1.
The composition of secondary phase particles at the grain boundary.
| Elements | Ti | Al | Sn | Zr | Mo | Ta | Nb | Si |
|---|---|---|---|---|---|---|---|---|
| Weight % | 67.86 | 1.26 | 4.83 | 2.32 | 16.98 | 2.55 | 3.41 | 0.75 |
| Atomic % | 79.39 | 2.61 | 2.28 | 1.42 | 9.91 | 0.79 | 2.05 | 1.50 |
© 2017 by the authors. Licensee MDPI, Basel, Switzerland. This article is an open access article distributed under the terms and conditions of the Creative Commons Attribution (CC BY) license (http://creativecommons.org/licenses/by/4.0/).
Share and Cite
MDPI and ACS Style
Wu, F.; Xu, W.; Jin, X.; Zhong, X.; Wan, X.; Shan, D.; Guo, B. Study on Hot Deformation Behavior and Microstructure Evolution of Ti55 High-Temperature Titanium Alloy. Metals 2017, 7, 319. https://doi.org/10.3390/met7080319
AMA Style
Wu F, Xu W, Jin X, Zhong X, Wan X, Shan D, Guo B. Study on Hot Deformation Behavior and Microstructure Evolution of Ti55 High-Temperature Titanium Alloy. Metals. 2017; 7(8):319. https://doi.org/10.3390/met7080319
Chicago/Turabian StyleWu, Fengyong, Wenchen Xu, Xueze Jin, Xunmao Zhong, Xingjie Wan, Debin Shan, and Bin Guo. 2017. "Study on Hot Deformation Behavior and Microstructure Evolution of Ti55 High-Temperature Titanium Alloy" Metals 7, no. 8: 319. https://doi.org/10.3390/met7080319
Note that from the first issue of 2016, this journal uses article numbers instead of page numbers. See further details here.