Development of Direct Quenched Hot Rolled Martensitic Strip Steels

ArcelorMittal Global R&D Ghent, J.F. Kennedylaan, 9060 Zelzate, Belgium
*
Author to whom correspondence should be addressed.
Metals 2017, 7(9), 326; https://doi.org/10.3390/met7090326
Submission received: 7 June 2017
/
Revised: 21 August 2017
/
Accepted: 22 August 2017
/
Published: 24 August 2017
(This article belongs to the Special Issue Bainite and Martensite: Developments and Challenges)
Abstract
:Metallurgical concepts for new ultra-high strength martensitic steels have been developed through direct quenching after hot rolling. In addition to the chemical composition, the hot rolling, quenching, and annealing parameters need to be optimized to fulfill the requirements for the demanding applications for which these steels are used. It is also shown that the welding behavior is influenced by the choice of alloying concept. Typical applications also require a high fatigue resistance, especially of formed components. For that reason, a dedicated set-up was developed that allows differentiation between materials, which is illustrated through the effect of inclusions on the fatigue performance of a bent test piece.
Keywords:
martensitic steel; direct quenched; industrialization; hot rolling; tempering; welding; fatigue1. Introduction
For many years, the production of martensitic flat steel products has been done through austenitizing and quenching, often followed by a tempering treatment. These steels were typically rolled on a plate mill. The development of accelerated cooling equipment allowed quenching directly after plate rolling, simplifying the production process and improving the properties. Extensive literature and reviews on the topic can be found in references [1,2]. In more recent years, direct quenching processes have been developed for hot strip mills to produce ultra-high strength martensitic grades. The main advantage of the strip process compared to the plate process is the higher productivity for low thicknesses.
There exist two main classes of low carbon martensitic strip steels. The first is steels for wear applications. These steels mainly need to achieve a minimum hardness level, combined with a sufficient bendability and impact toughness. Typical applications include tipper trucks and mining equipment. The second class is martensitic strip steels developed for structural applications, e.g., trailers, chassis parts, and lifting equipment. In addition to a high strength, these steels also typically need to fulfill more stringent requirements for tensile elongation, impact toughness, and bendability, both for the as-produced sheets and for weldments.
This paper discusses the main metallurgical principles that need to be understood to develop low carbon martensitic strip steels via direct quenching. The weldability of the steels is also discussed in detail to give an indication of how these steels can be used in practice. Finally, the fatigue behavior in the deformed condition is described, relevant for evaluation of the fatigue performance of an actual structural component. The test that was developed shows the importance of an optimized metallurgical concept, e.g., the need for a low amount of inclusions.
2. Experimental Procedures
The steels used in this study were either lab or industrially produced casts, reheated to 1250 °C, followed by hot rolling with finish rolling temperatures (ranging from 860 to 1000 °C), and direct quenching to below 100 °C to ensure a martensitic microstructure. The chemical composition ranges of the three steels are given in Table 1.
Tensile tests were performed on standard proportional tensile test specimens, in triplets, according to ISO 6892-1, using an Instron 4505 test rig (Norwood, MA, USA). Samples were taken along the rolling direction (RD). Triplets of Charpy impact tests were performed at 20 °C or −40 °C, using a Zwick pendulum impact tester PSW750 (Ulm, Germany). The tests were performed according to ISO 148-1. Samples were taken along the rolling direction (RD) with the V-notch along the normal direction (ND). Vickers hardness measurements (Future Tech, Kawasaki, Japan) were made using a 200 g weight, applied for 10 s. The load application was at a speed of 50 g/s. Optical microscopy (Olympus, Tokyo, Japan) after Béchet-Beaujard etching was used to reveal the prior austenite grain (PAG) structure. The prior austenite grain size (PAGS) was determined according to the linear intercept method (ASTM E112). Electron Back-Scatter Diffraction (EBSD) measurements were performed on a JEOL JSM-7001F FEG-SEM (Tokyo, Japan) at 20 kV equipped with a HKL Nordlys camera (Oxford, UK) for the detection of backscattered diffraction patterns. The angular resolution of the equipment is 2°. The step size used for the scan was 0.2 μm and the scanned area was 250 × 200 μm2. The measured martensite orientation maps were used to reconstruct the prior austenite grain structure following the procedure described in [3]. Dilatometric experiments were performed in a Bahr DIL805 dilatometer (Hüllhorst, Germany), using cylindrical specimens with a diameter of 5 mm and a length of 10 mm. For cooling rates of above 25 °C/s, hollow 10 mm long cylinders with a diameter of 4 mm and a wall thickness of 1 mm have been used.
To investigate the weldability of the concepts, both welding and thermal simulation experiments were performed. For the welding, full penetration butt welds were made on a semi-V bevel using a Fronius TransPuls Synergic 3200 CMT gas metal arc welding (GMAW) power source (Wels, Austria), operated in standard mode (i.e., no pulsing of the welding current or periodical retraction of the filler wire). Welding was performed in the downhand (PA) position using a Panasonic TA-1800 six-axes robot-arm (Kadoma, Osaka, Japan). ESAB OK AristoRod 89 solid wire of 1 mm diameter was used as filler wire in combination with Air Liquide Atal 6 (82% argon-18% CO2) M21 shielding gas. No pre- or post-heating was used, and the interpass temperature was kept below 100 °C. The critical welding parameters for calculation of the heat input (voltage, current, and travel speed) were measured using a TVC Arc Logger Ten (Great Yarmouth, UK). From the combination of the heat input, plate thickness, and the plate starting temperature, the cooling time from 800 to 500 °C—which is often seen as critical in welding—was calculated. Welding parameters were chosen to realize certain heat input levels and thus cooling times, rather than optimizing for weld shape.
In addition, samples of 11 × 11 × 70 mm3 were prepared and heat-treated using a Gleeble 1500 (Poestenkill, NY, USA), to simulate different parts of the heat-affected zone (HAZ), in particular the grain coarsened HAZ (GC HAZ), the inter-critical HAZ (IC HAZ), and the inter-critically reheated grain coarsened HAZ (IRGC HAZ). The difference between these regions is the peak temperature used (1350 and 775 °C for the grain coarsened and intercritical regimes, respectively); the last being a double-cycle treatment whereas the first two are single-cycle. The heating was performed at a rate of 100 °C/s up to 800 °C, then 300 °C/s to the peak temperature where a soaking time of 1 s was used. It was followed by cooling using different cooling times between 800 and 500 °C (t8/5). In the case of a dual cycle, the sample was cooled down to below 100 °C before the second cycle was started. The treated samples were then machined back to standard Charpy V notch (CVN) samples of 10 × 10 × 5 mm3 for CVN testing and per treatment condition, a sample was also used for hardness testing.
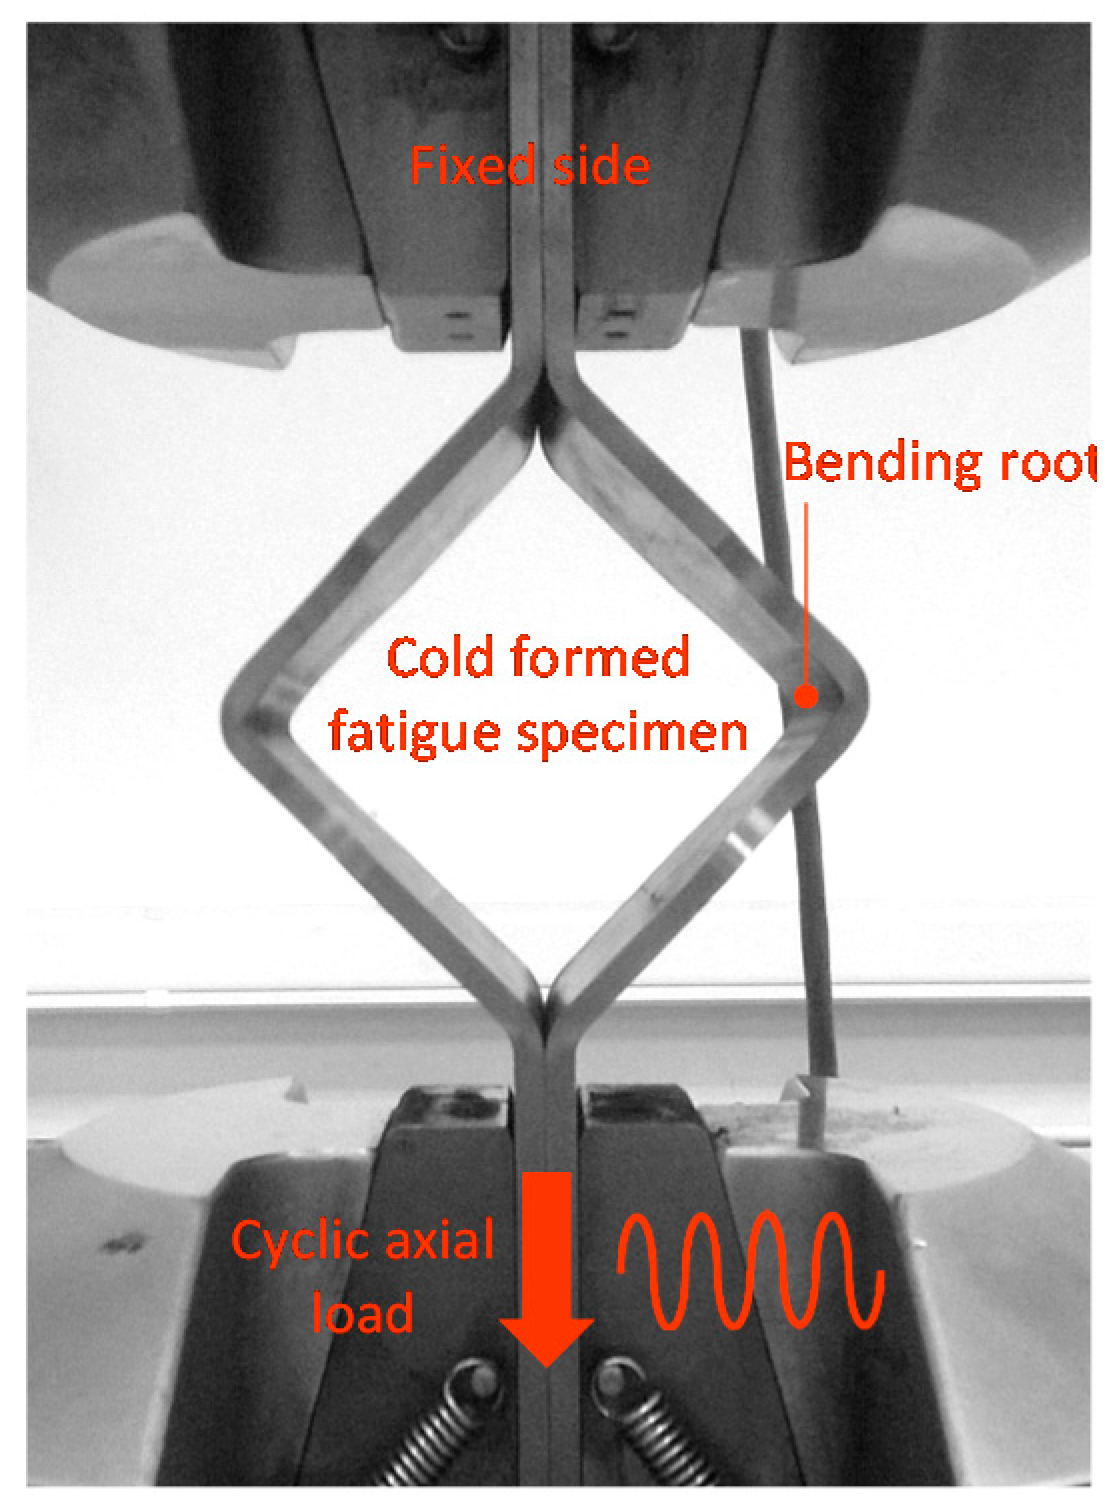
Force controlled fatigue tests were performed on specimens that were bent with a tool radius r of three-times the sheet thickness t. The set-up is shown in Figure 1. The fatigue experiments were carried out using six different axial load (stress) levels from 30 to 70 kN to produce the S–N curve. The fatigue loads were applied with a 0.1 loading ratio at a frequency of 2 Hz. At least two fatigue tests were performed at each load (stress) level to check the repeatability of results. For more information regarding the developed test method and the data analysis, readers are referred to [4].
3. Metallurgical Concepts
3.1. Hot Strip Mill Parameters
The hot strip mill rolling schedule is the main parameter to optimize the strength/toughness performance and the effect of the finish rolling temperature (FRT) on the properties and microstructure is therefore discussed. Figure 2a–c shows EBSD scans of three plates of the DQ1 steel that were rolled on a lab hot rolling mill with different FRTs. An in-house developed routine [3] was applied to reconstruct the prior austenite structure, as shown in Figure 2d–f. The prior austenite grain size (PAGS), as determined through these reconstructed EBSD maps, showed no significant differences for the different conditions.
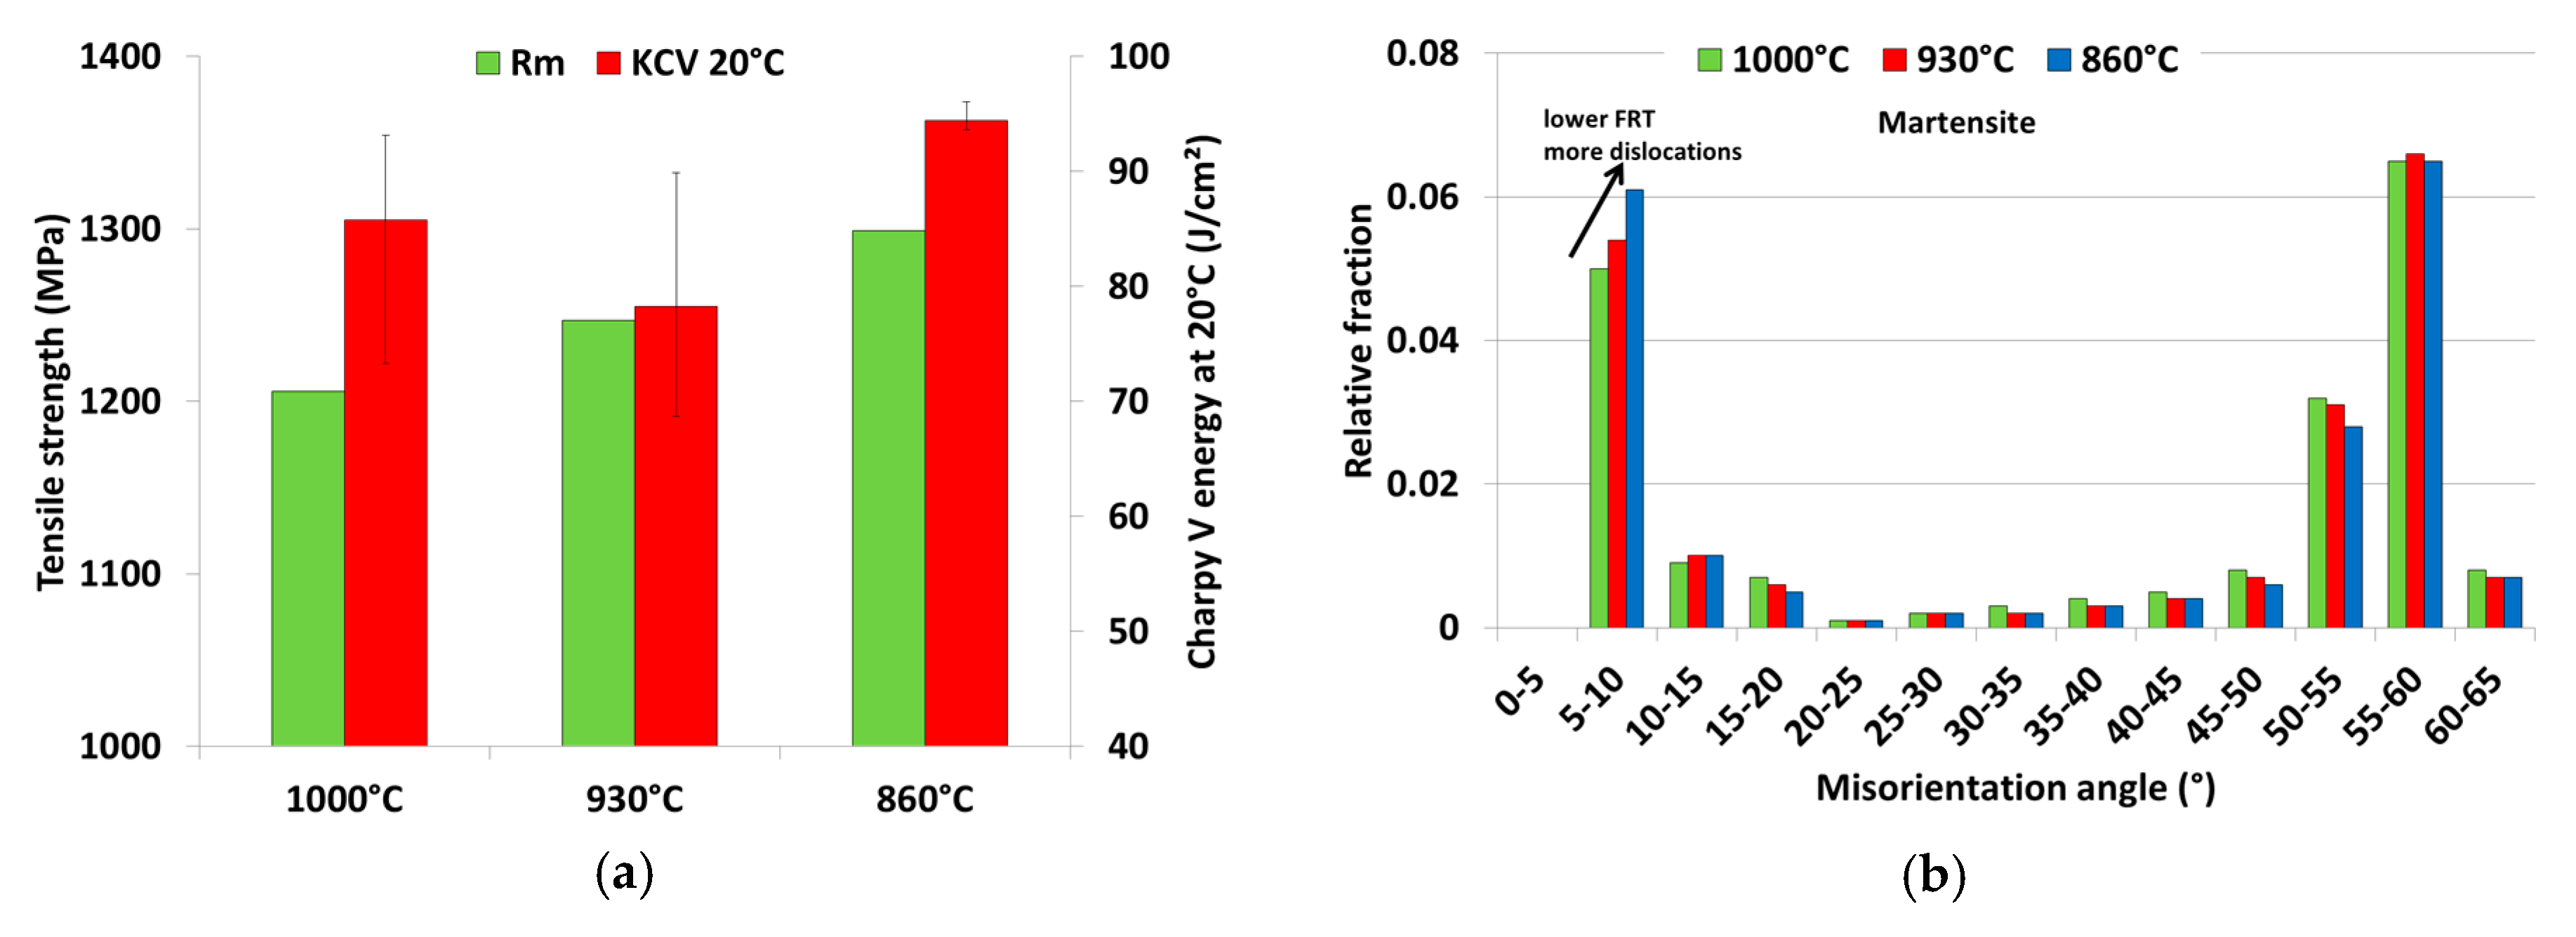
When reducing the FRT, the shape of the prior austenite grains becomes more and more pancaked. The temperature of non-recrystallization (Tnr) was estimated to be around 930 °C [5]. Figure 3 shows that the best combination of tensile strength and Charpy impact toughness was obtained for a FRT of 860 °C, resulting in a PAGS aspect ratio of around 4 for the specific rolling schedule used. This positive effect of a rather moderate rolling reduction below the Tnr is in line with earlier findings in Mo-V-B alloyed low C steels [6]. Stronger effects on the strength-toughness have been reported for higher rolling reductions [7], although excessive austenite pancaking impairs the bendability of the steel [8]. The Charpy impact toughness is quite similar for all three conditions, which is a consequence of their very similar PAGS [5]. The strength, however, increased with reducing FRT. This can be attributed to a higher dislocation density in the martensite, which is apparent from the misorientation distributions as a higher fraction of low angle misorientations was found [9], as illustrated in Figure 3b.
3.2. Laminar Cooling Strategy
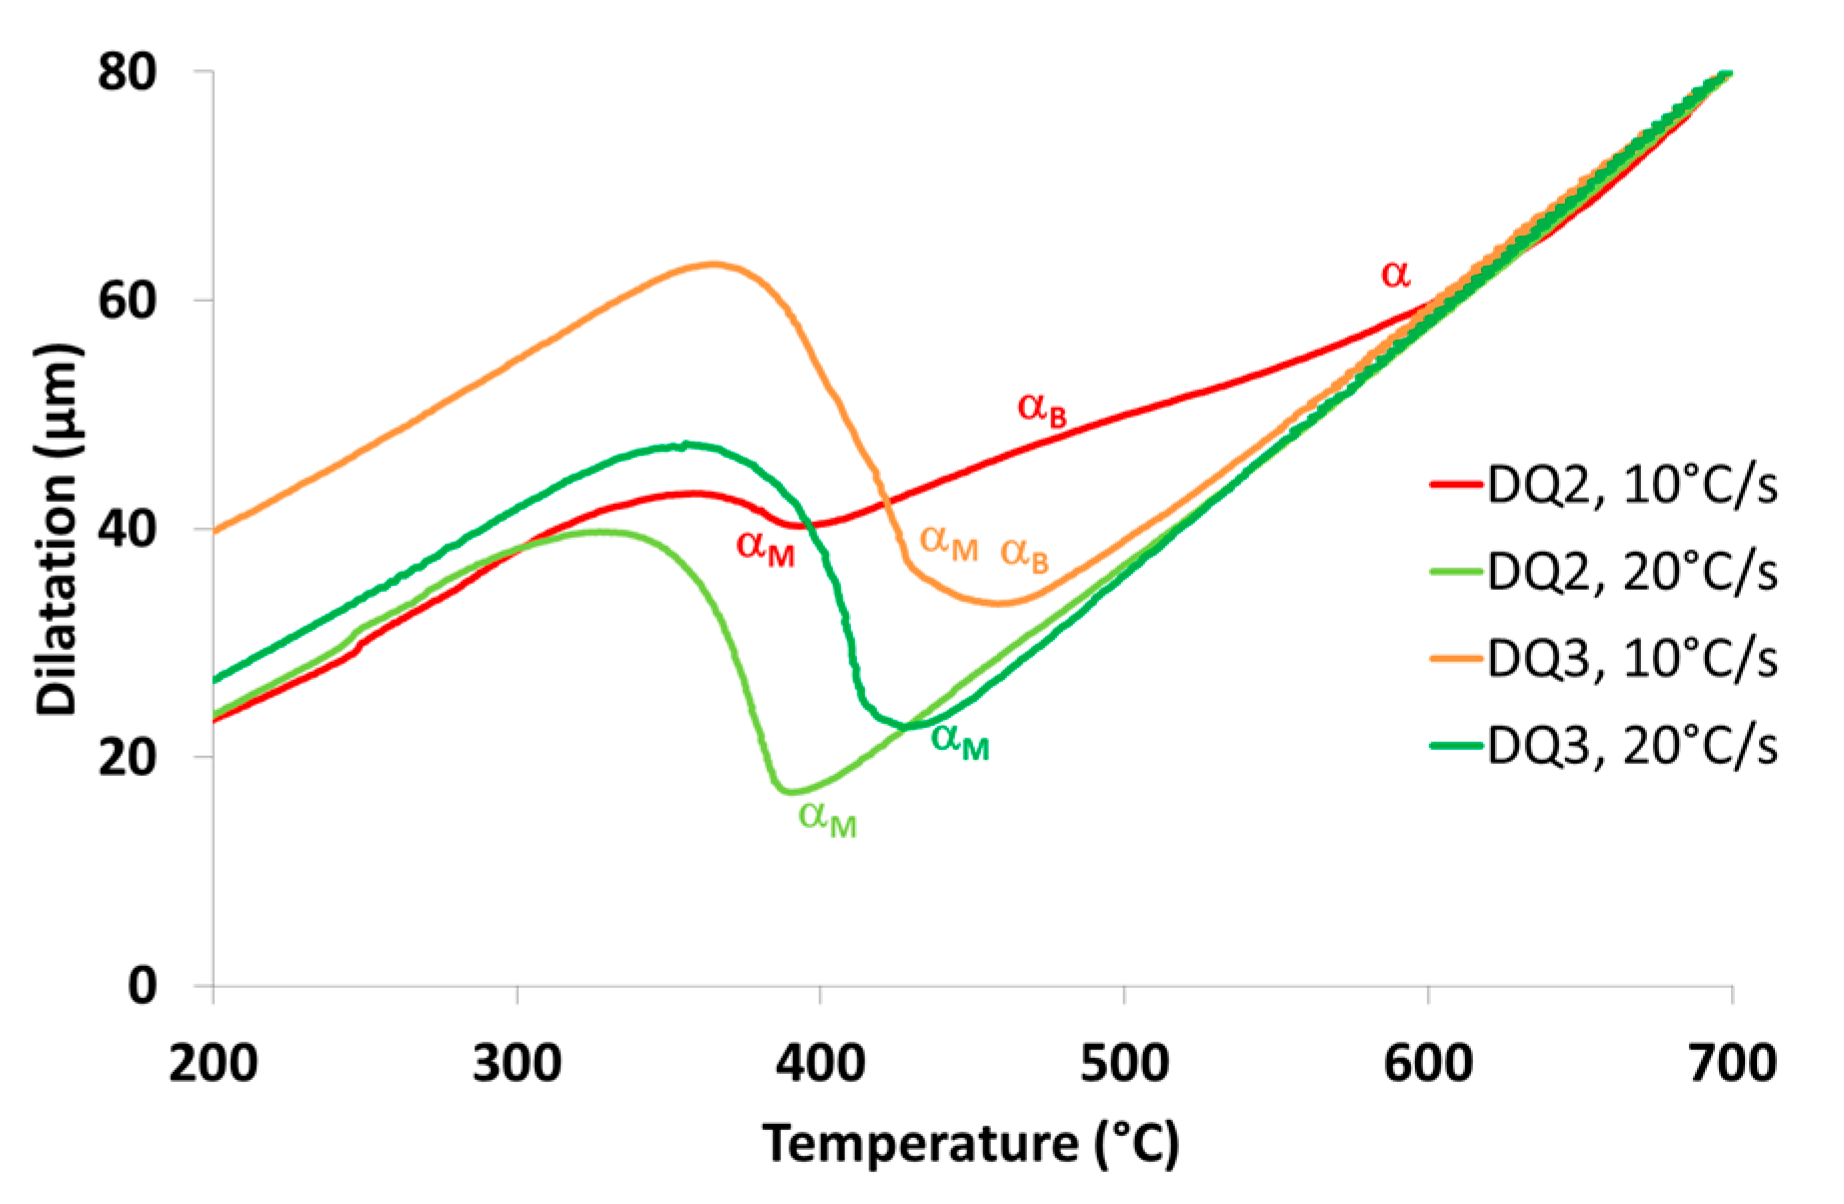
Since these steel grades are targeted to be martensitic directly after hot rolling, a high cooling rate is needed. The critical cooling rate needed varies with the chemical composition, as illustrated by the dilatometer curves in Figure 4. The lower alloyed DQ2 composition cooled at 10 °C/s showed significant amounts of ferrite and bainite. This is illustrated by the DQ2, 10 °C/s curve, which deviates from linearity above 600 °C, indicative of ferrite (α) formation. The transformation then gradually changes from ferrite to bainite (αB), with the final fraction of austenite transforming to martensite (αM) at 425 °C. The DQ3 composition shows a much higher hardenability, without ferrite formation and with only a minor fraction of bainite formed during cooling at 10 °C/s, as shown by the deviation of linear behavior at 475 °C. Both steels, however, are fully martensitic for cooling rates of 20 °C/s (and higher), with the martensite start temperature Ms estimated to be around 415 °C for the DQ2 and around 445 °C for the DQ3 composition. Such a cooling rate is readily feasible with modern laminar cooling equipment on the run-out-table for typical strip thicknesses.
3.3. Temper Annealing
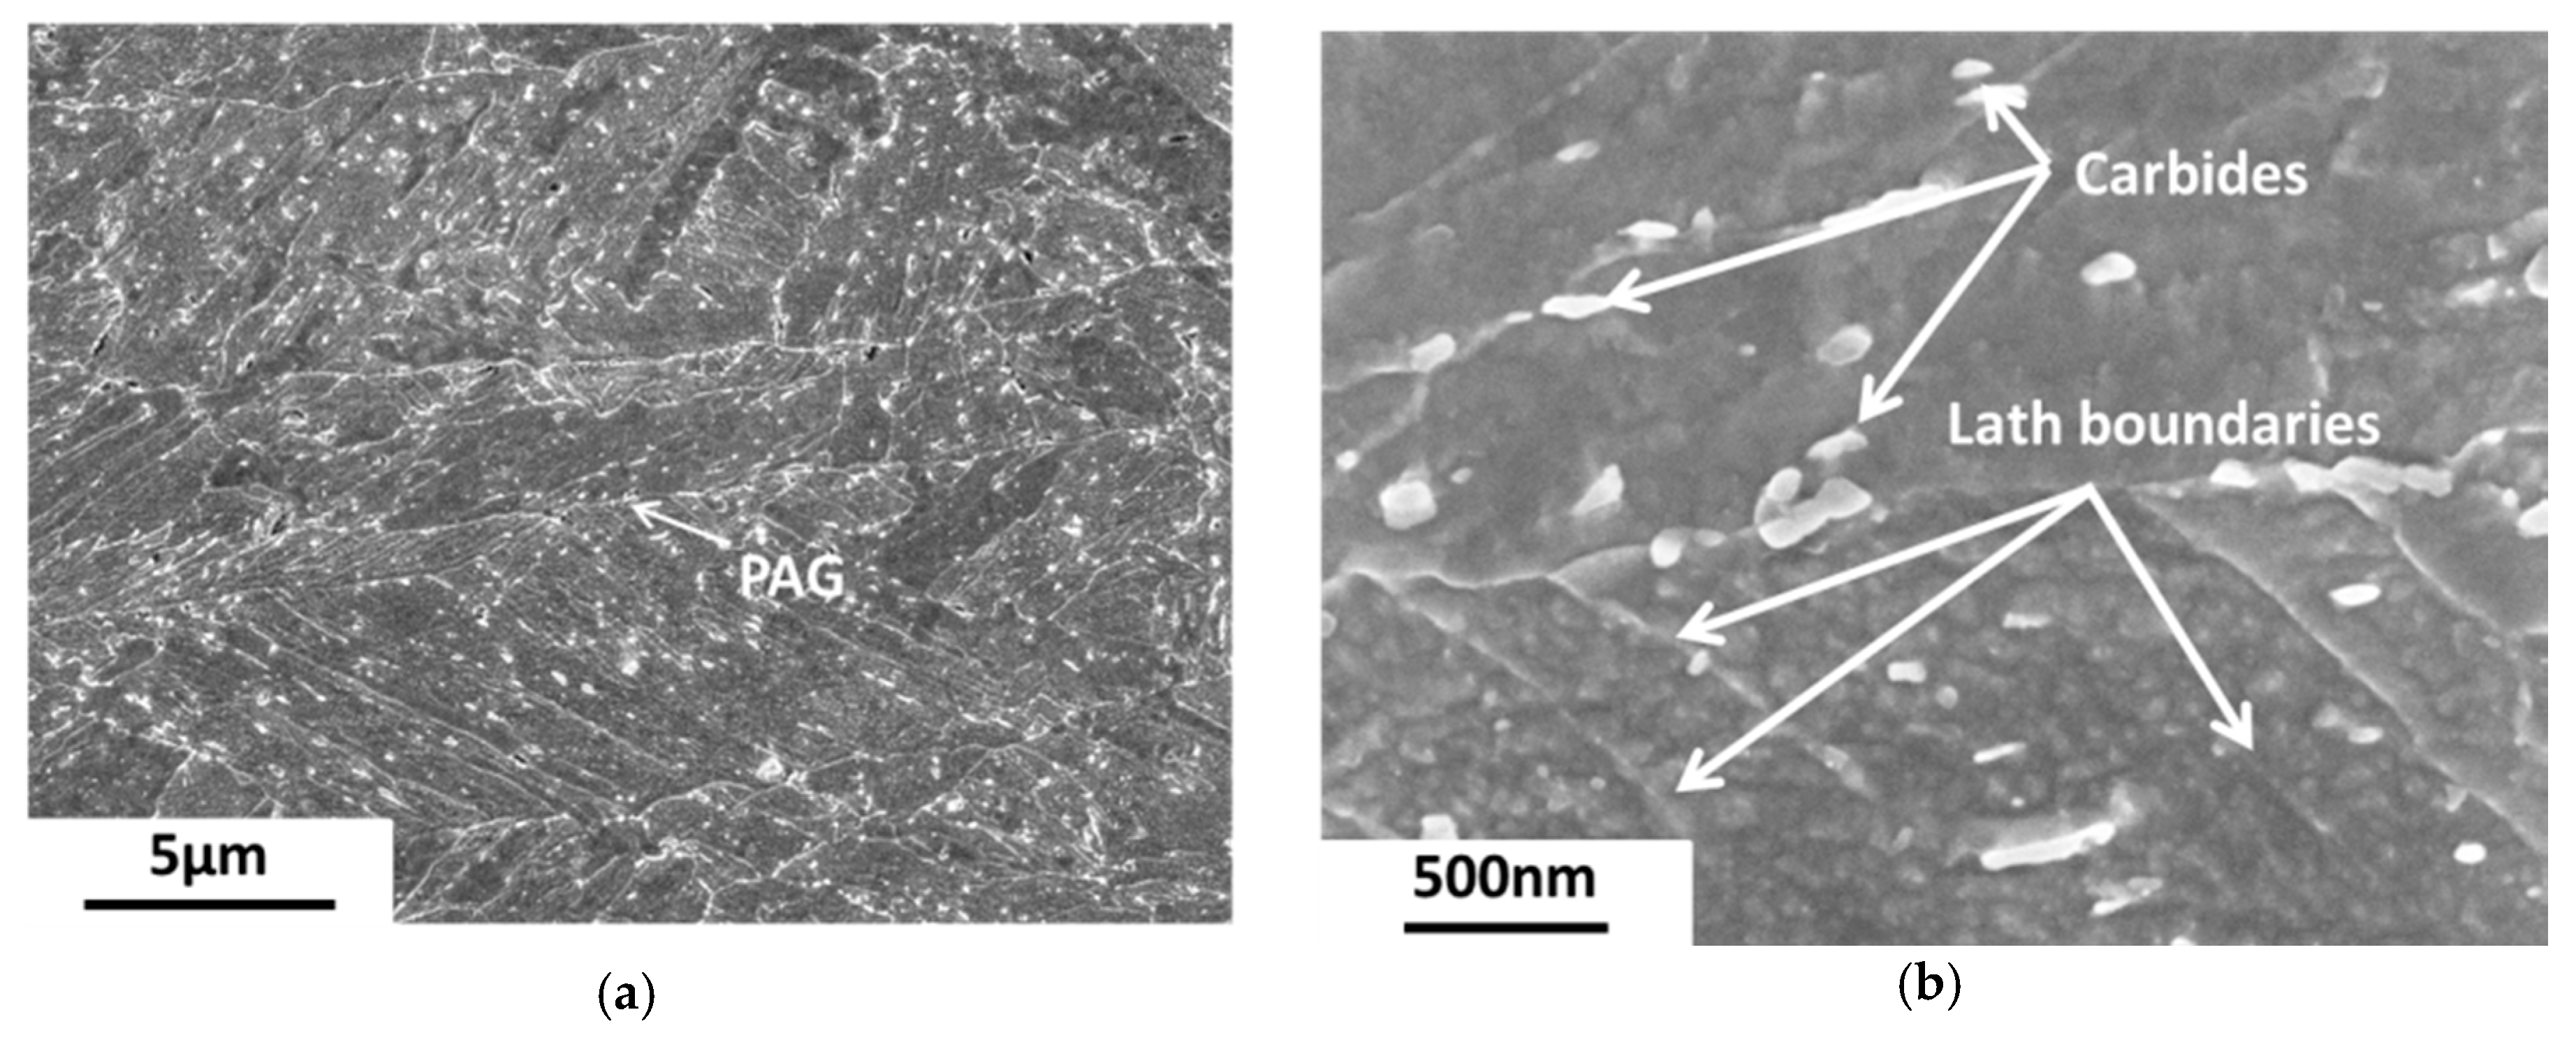
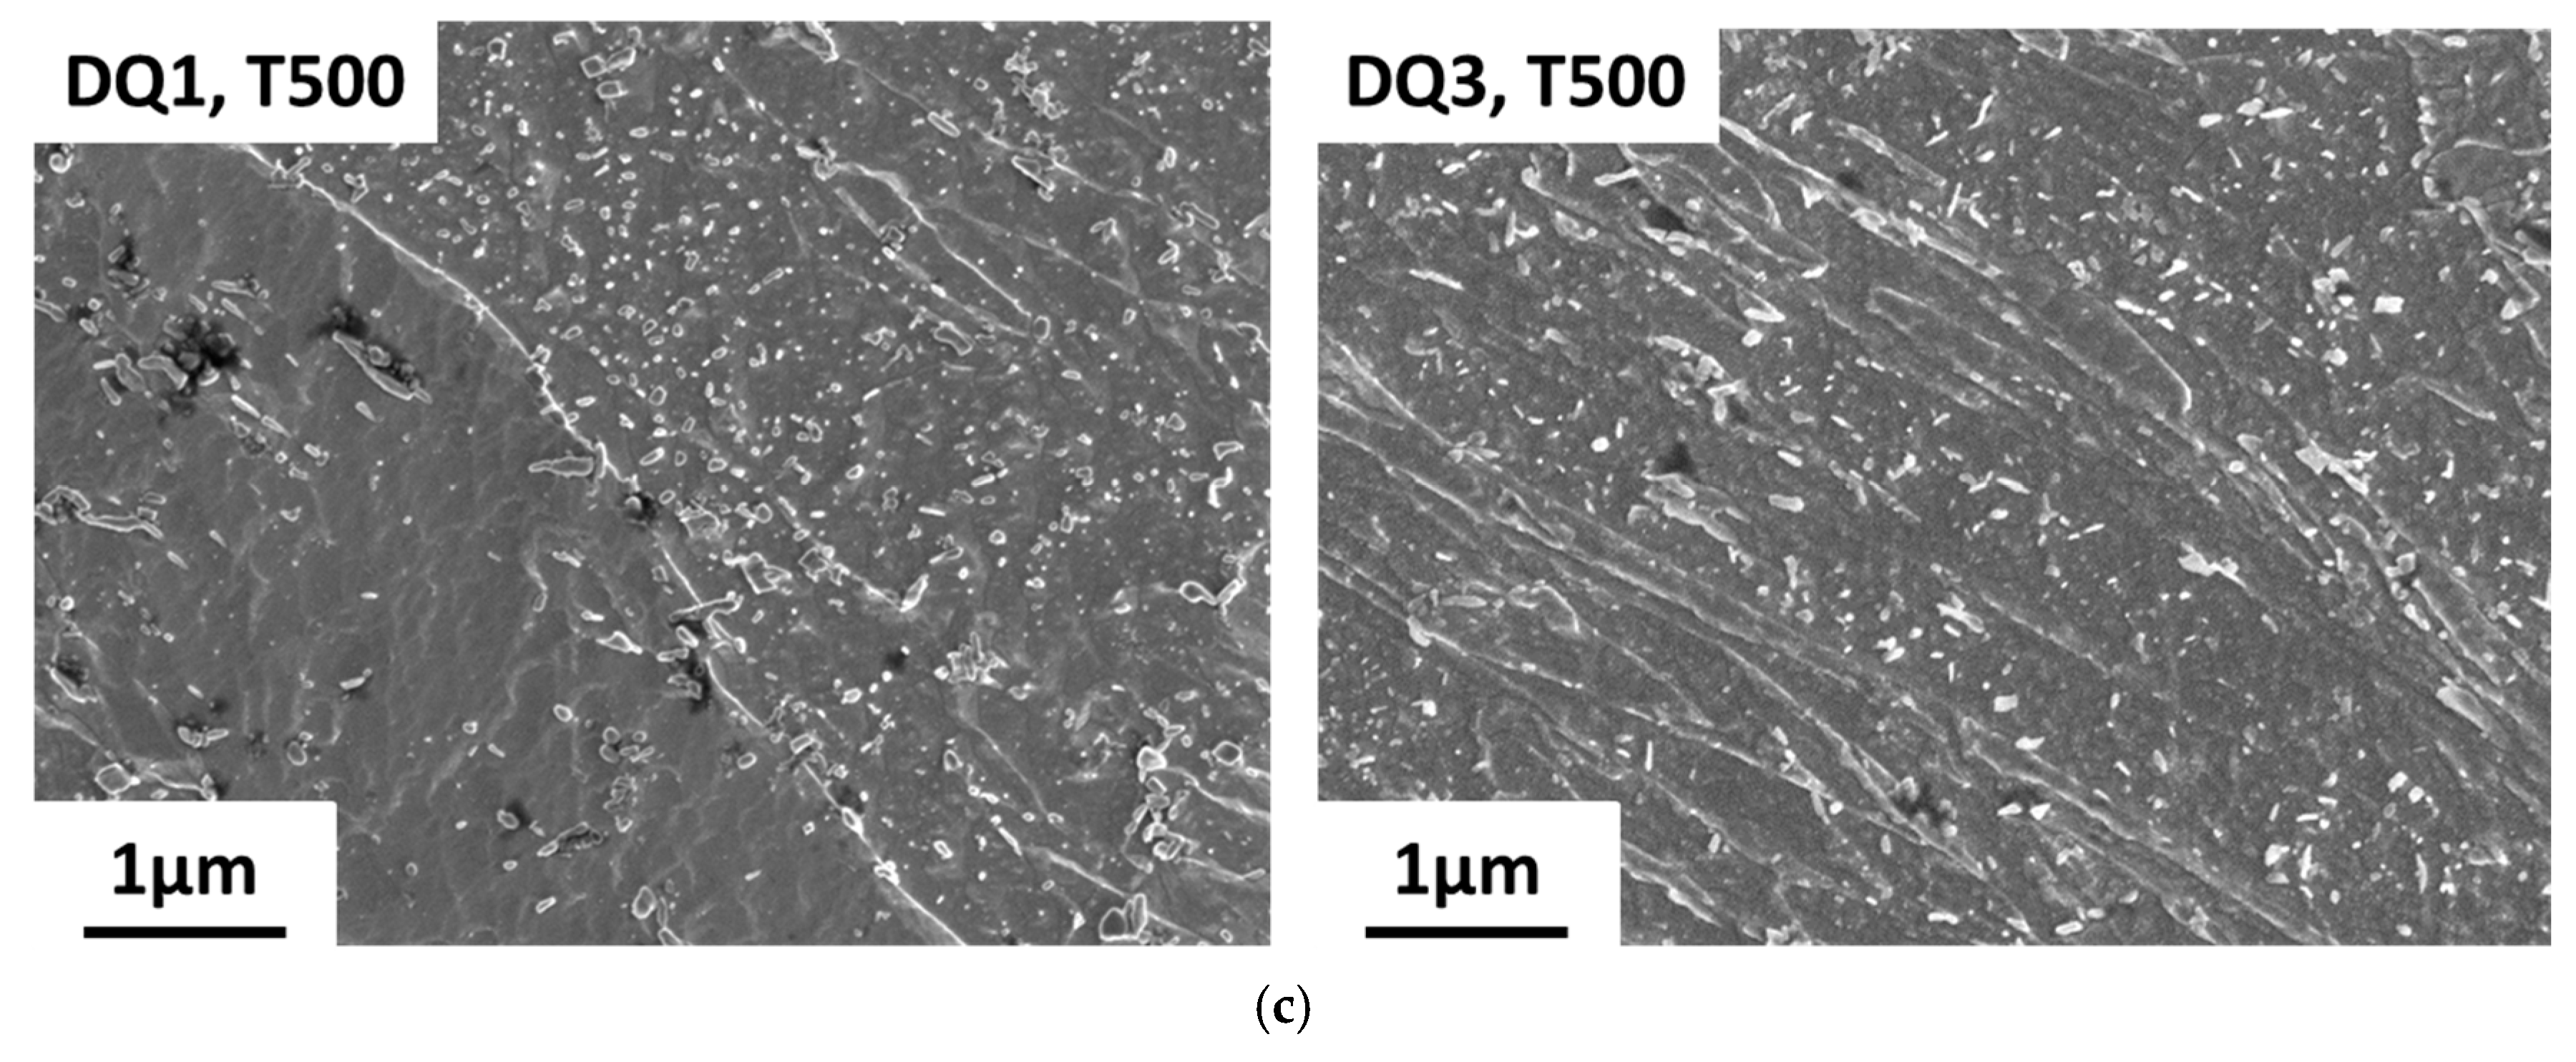
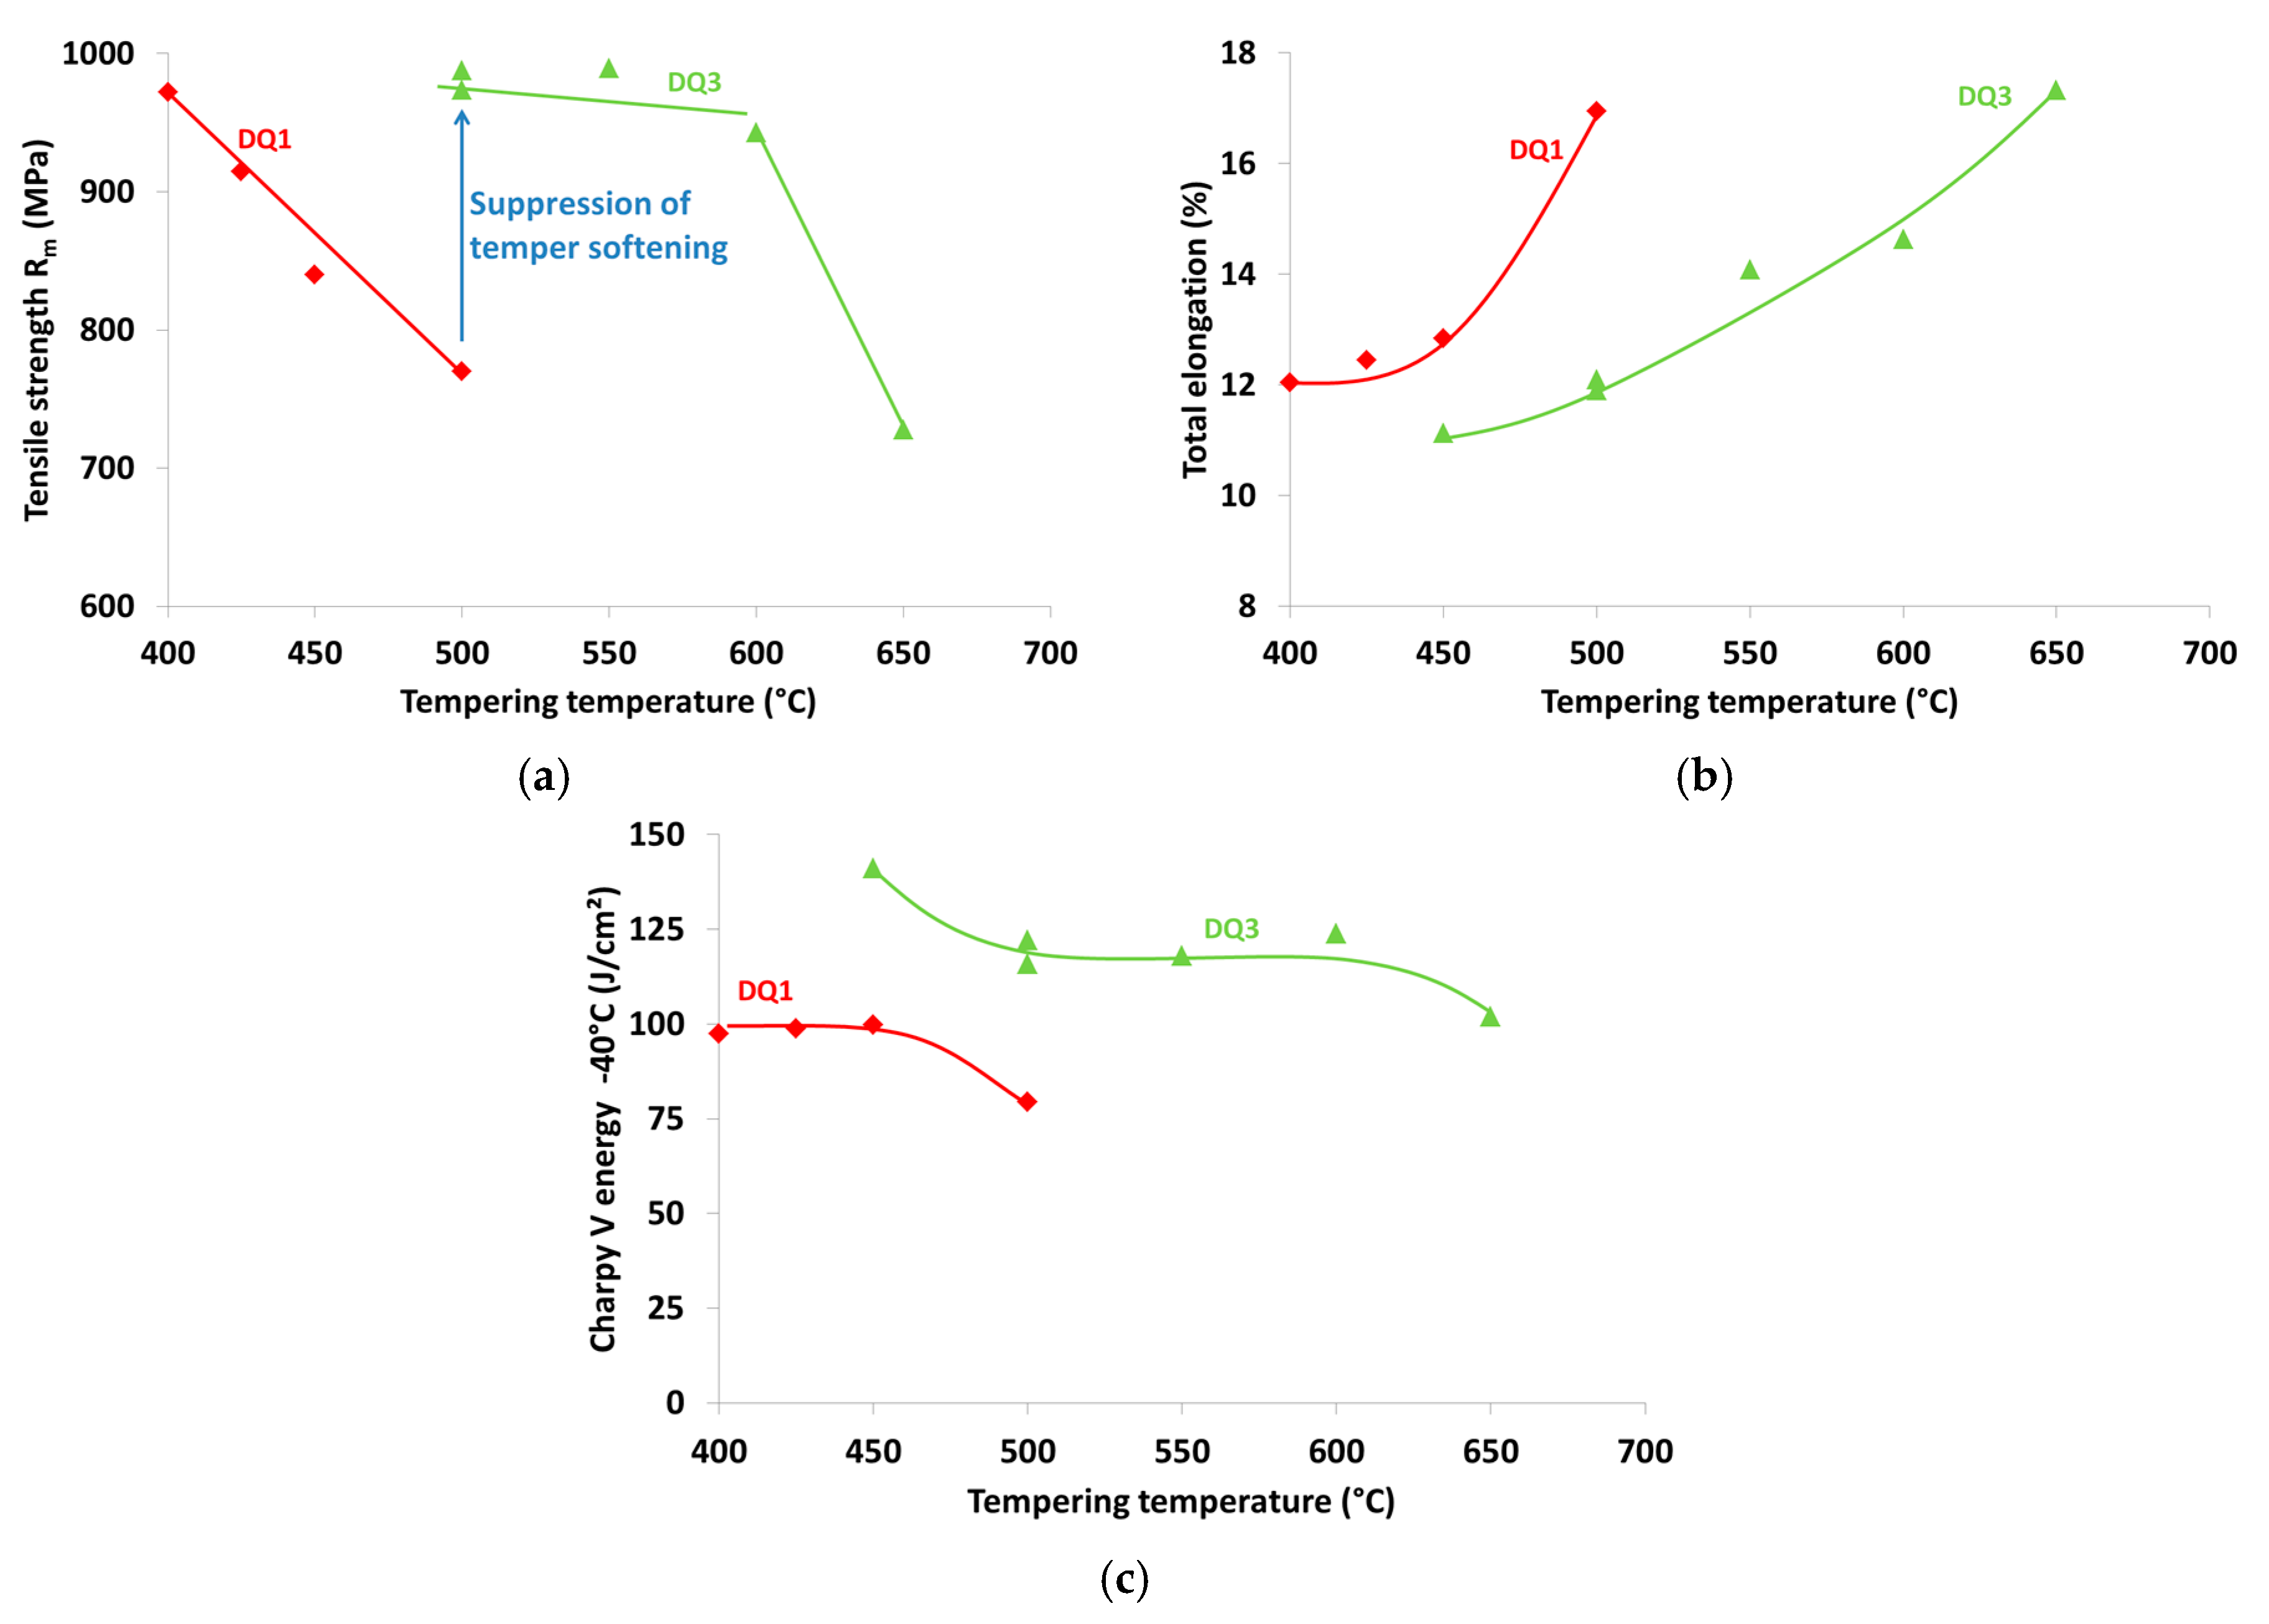
A typical microstructure after temper annealing at 550 °C is shown in Figure 5a,b, showing fine martensite laths and temper carbides. Figure 6a–c compares the tensile properties and the impact toughness for the DQ1 and DQ3 compositions after temper treatments at different temperatures. The hot rolled processing and quenching was similar and the tempering time was kept constant as well. The DQ1 composition showed very strong softening with increasing tempering temperature. The DQ3 composition, however, maintains its high strength up to tempering temperatures of 600 °C. This is direct consequence of the presence of (Cr + Mo + V), which are known to suppress temper softening [10,11]. In addition to suppression of temper softening, the Charpy impact toughness of the DQ3 composition is also maintained at a high level. This is likely a consequence of the fact that the fine lath martensite structure is maintained up to high temperatures in the DQ3 steel, whereas the lath structure disappears in the DQ1 due to absence of (Cr + Mo + V) [12]. This is illustrated in Figure 5c.
4. In-Use Properties
4.1. Welding
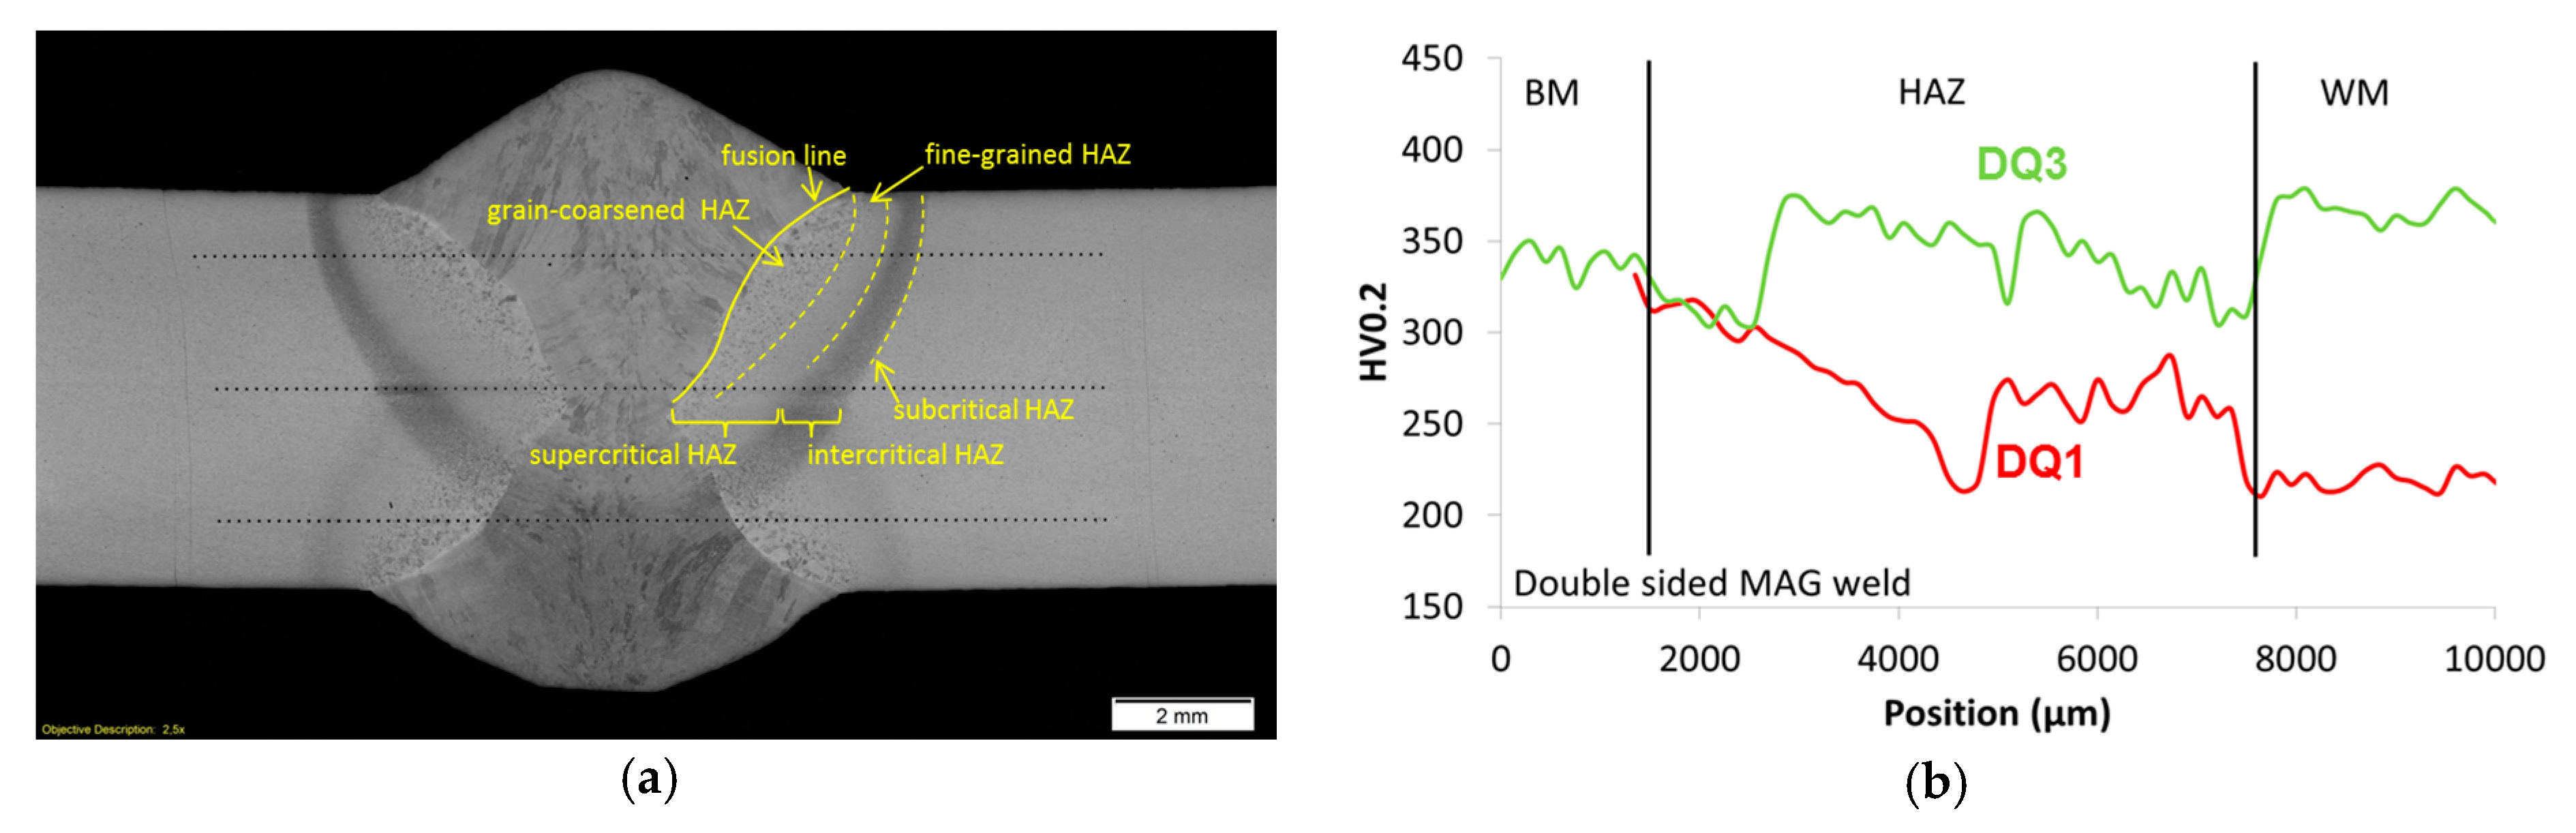
In terms of weldability of martensitic structural steels, the two main properties that need to be maintained are the hardness (and thus strength) and the impact toughness. For the hardness, the same alloying additions that suppress temper softening (Cr, Mo, V) also help maintain the hardness in the HAZ after welding [13]. This is illustrated by the hardness profiles in Figure 7 of similar weldments made with gas metal arc welding (GMAW) of the DQ1 and DQ3 alloys. Figure 7b clearly demonstrates the better softening resistance of the more highly alloyed DQ3. Nonetheless, even in the case of the DQ3, too high a heat input will still result in unacceptable softening in the grain coarsened heat affected zone (GCHAZ), as illustrated in Figure 8.
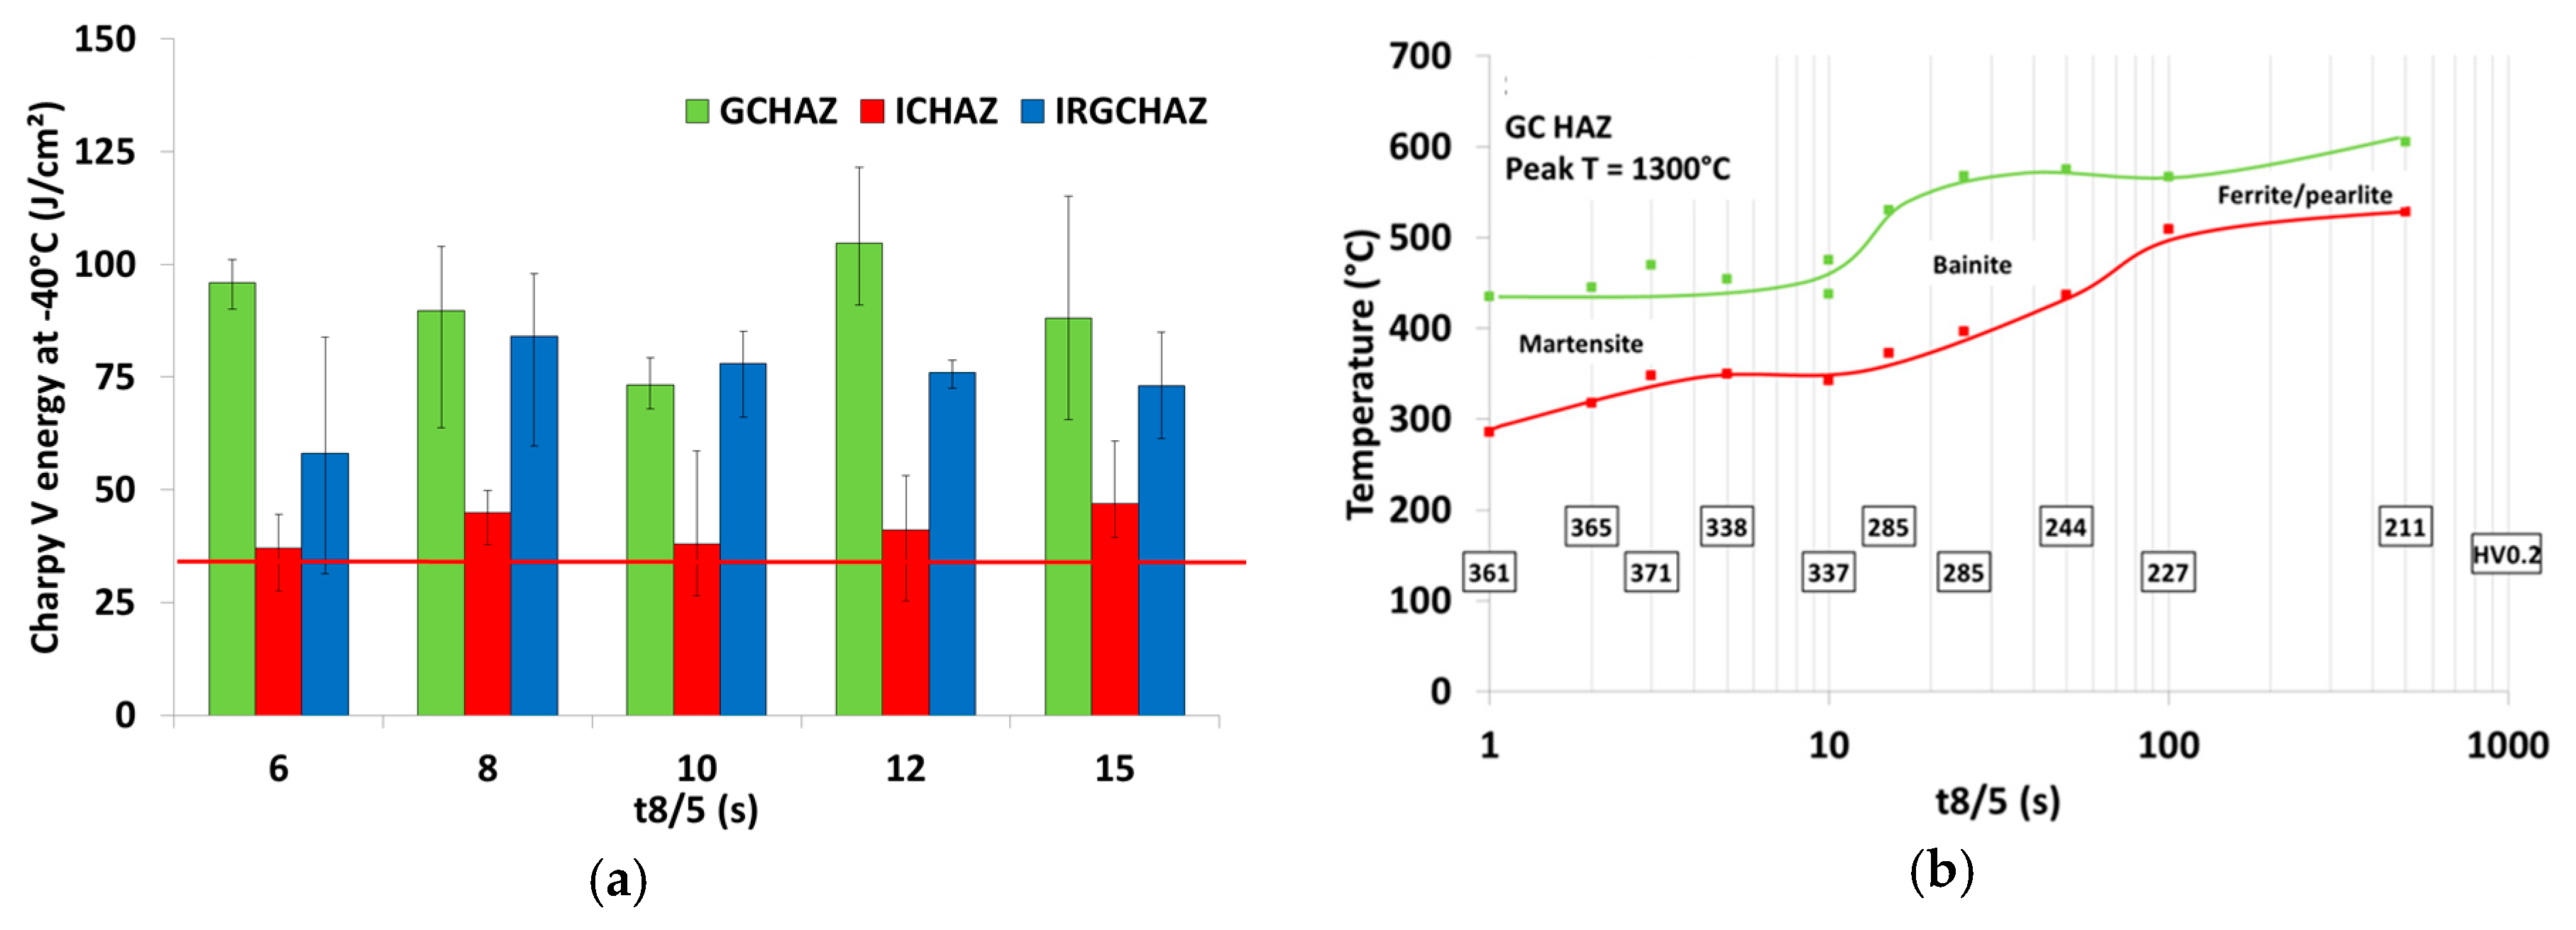
To identify the maximum allowable heat input and corresponding 800 to 500 °C (t8/5) cooling times for the DQ3, annealing simulations of the Grain Coarsened (GC HAZ), intercritical (IC HAZ), and intercritically reheated grain coarsened (IRGC HAZ) HAZ were made using a Gleeble thermo-mechanical simulator. Charpy testing results of the Gleeble samples in Figure 9a show that a minimum Charpy impact energy of 34 J/cm2 can be expected for all parts of the HAZ tested for a t8/5 range from at least 6 to 15 s. For the IC HAZ, some individual values are below the target, but the average values are still above the minimum required and the individual values above 70% of that. A welding continuous cooling diagram (CCT) of the GC HAZ was also constructed using dilatometry to establish the allowable cooling time range to maintain the hardness. The CCT diagram simulation (Figure 9b) of the Grain Coarsened HAZ (GC HAZ) shows that softening starts to take place for t8/5 cooling times above 10–15 s. The softening observed is a consequence of the formation of bainite instead of martensite. Excessive softening occurs only for cooling times above 25 s, which is in line with the results on the lab welds in Figure 8.
Based on the results obtained, the allowable t8/5 cooling times for welding of the DQ3 are set between 6 s and at least 15 s.
4.2. Fatigue Performance of Deformed Components
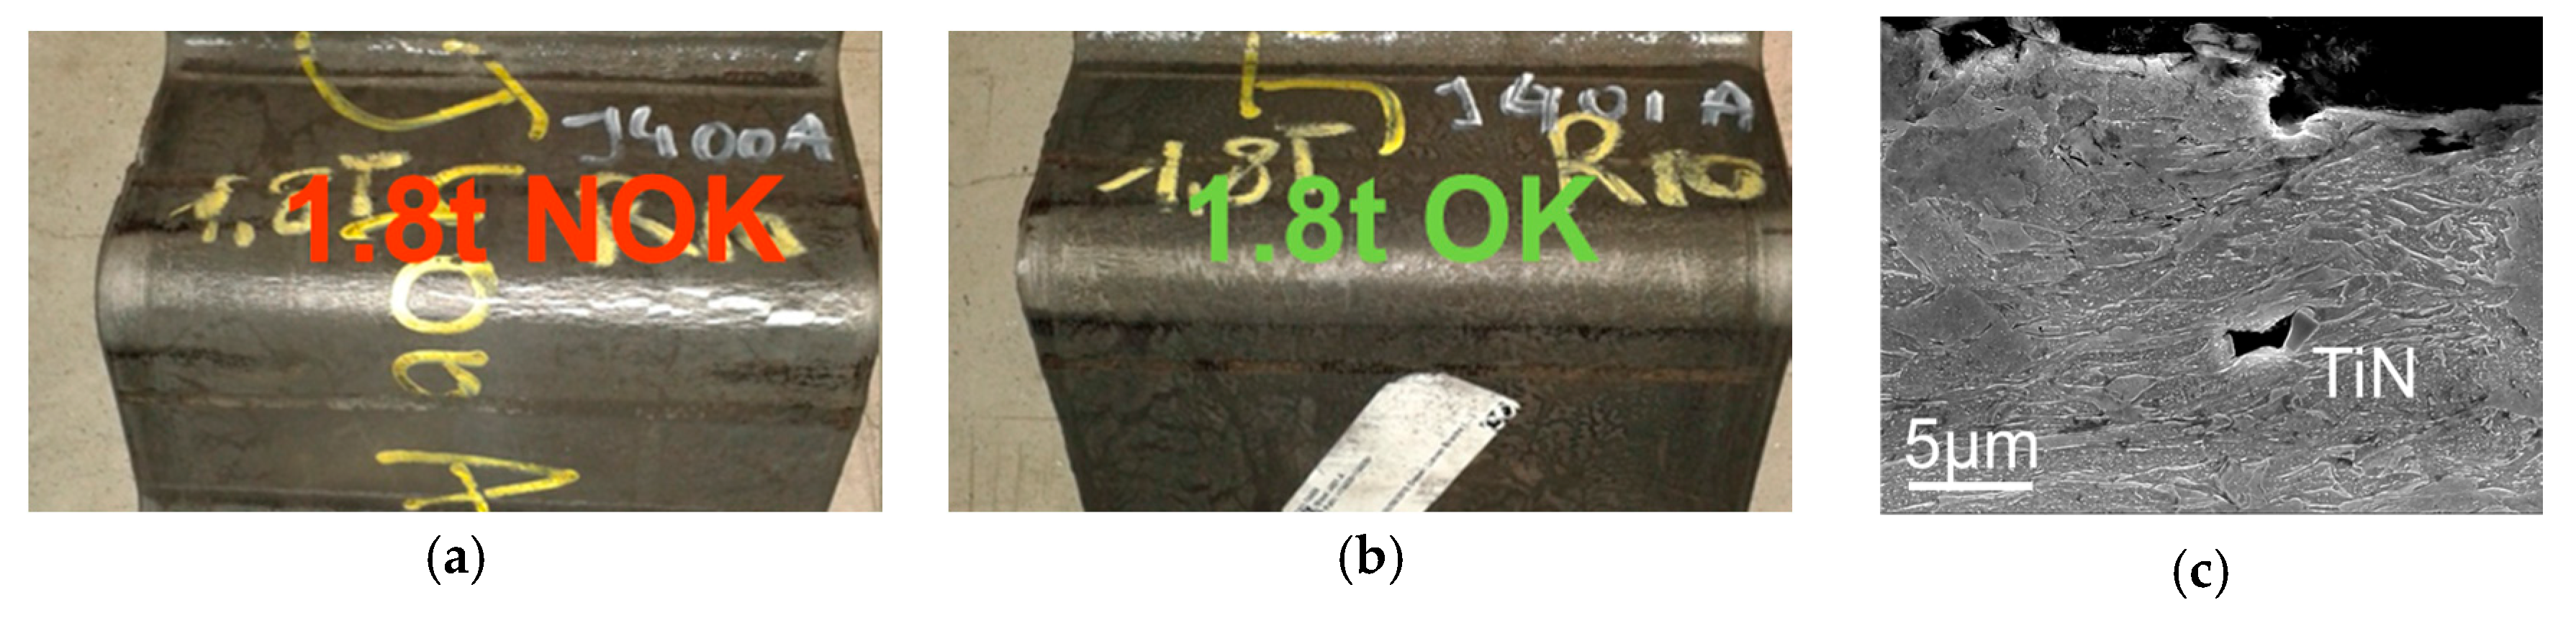
In order to obtain good behavior of a deformed component in fatigue, it is crucial that the damage to the microstructure after forming—typically bending—remains limited. In Figure 10a,b, the result after 90° bending using a radius of 1.8 times the thickness is shown for two DQ3 materials with different nitrogen (N) levels. The cracked sample in Figure 10a has a high N level, whereas the N level in the intact one in Figure 10b has a low N level. The micrograph in Figure 10c shows that significant microstructural damage occurs around the coarse TiN particles during deformation. Note that the chemical composition of this specific particle was not determined, but it has been assumed to be TiN based on its shape and size.
There are many steel components for different applications that are subjected to both bending and fatigue loading. Combining these two—i.e., cold forming followed by fatigue loading—causes micro-crack initiation at the bending root and fatigue propagation of the cracks up to final rupture of material. For this purpose, a new test sample was designed to take into consideration the effect of cold forming before the fatigue load is applied. For more information regarding the developed test method, readers are referred to [4].
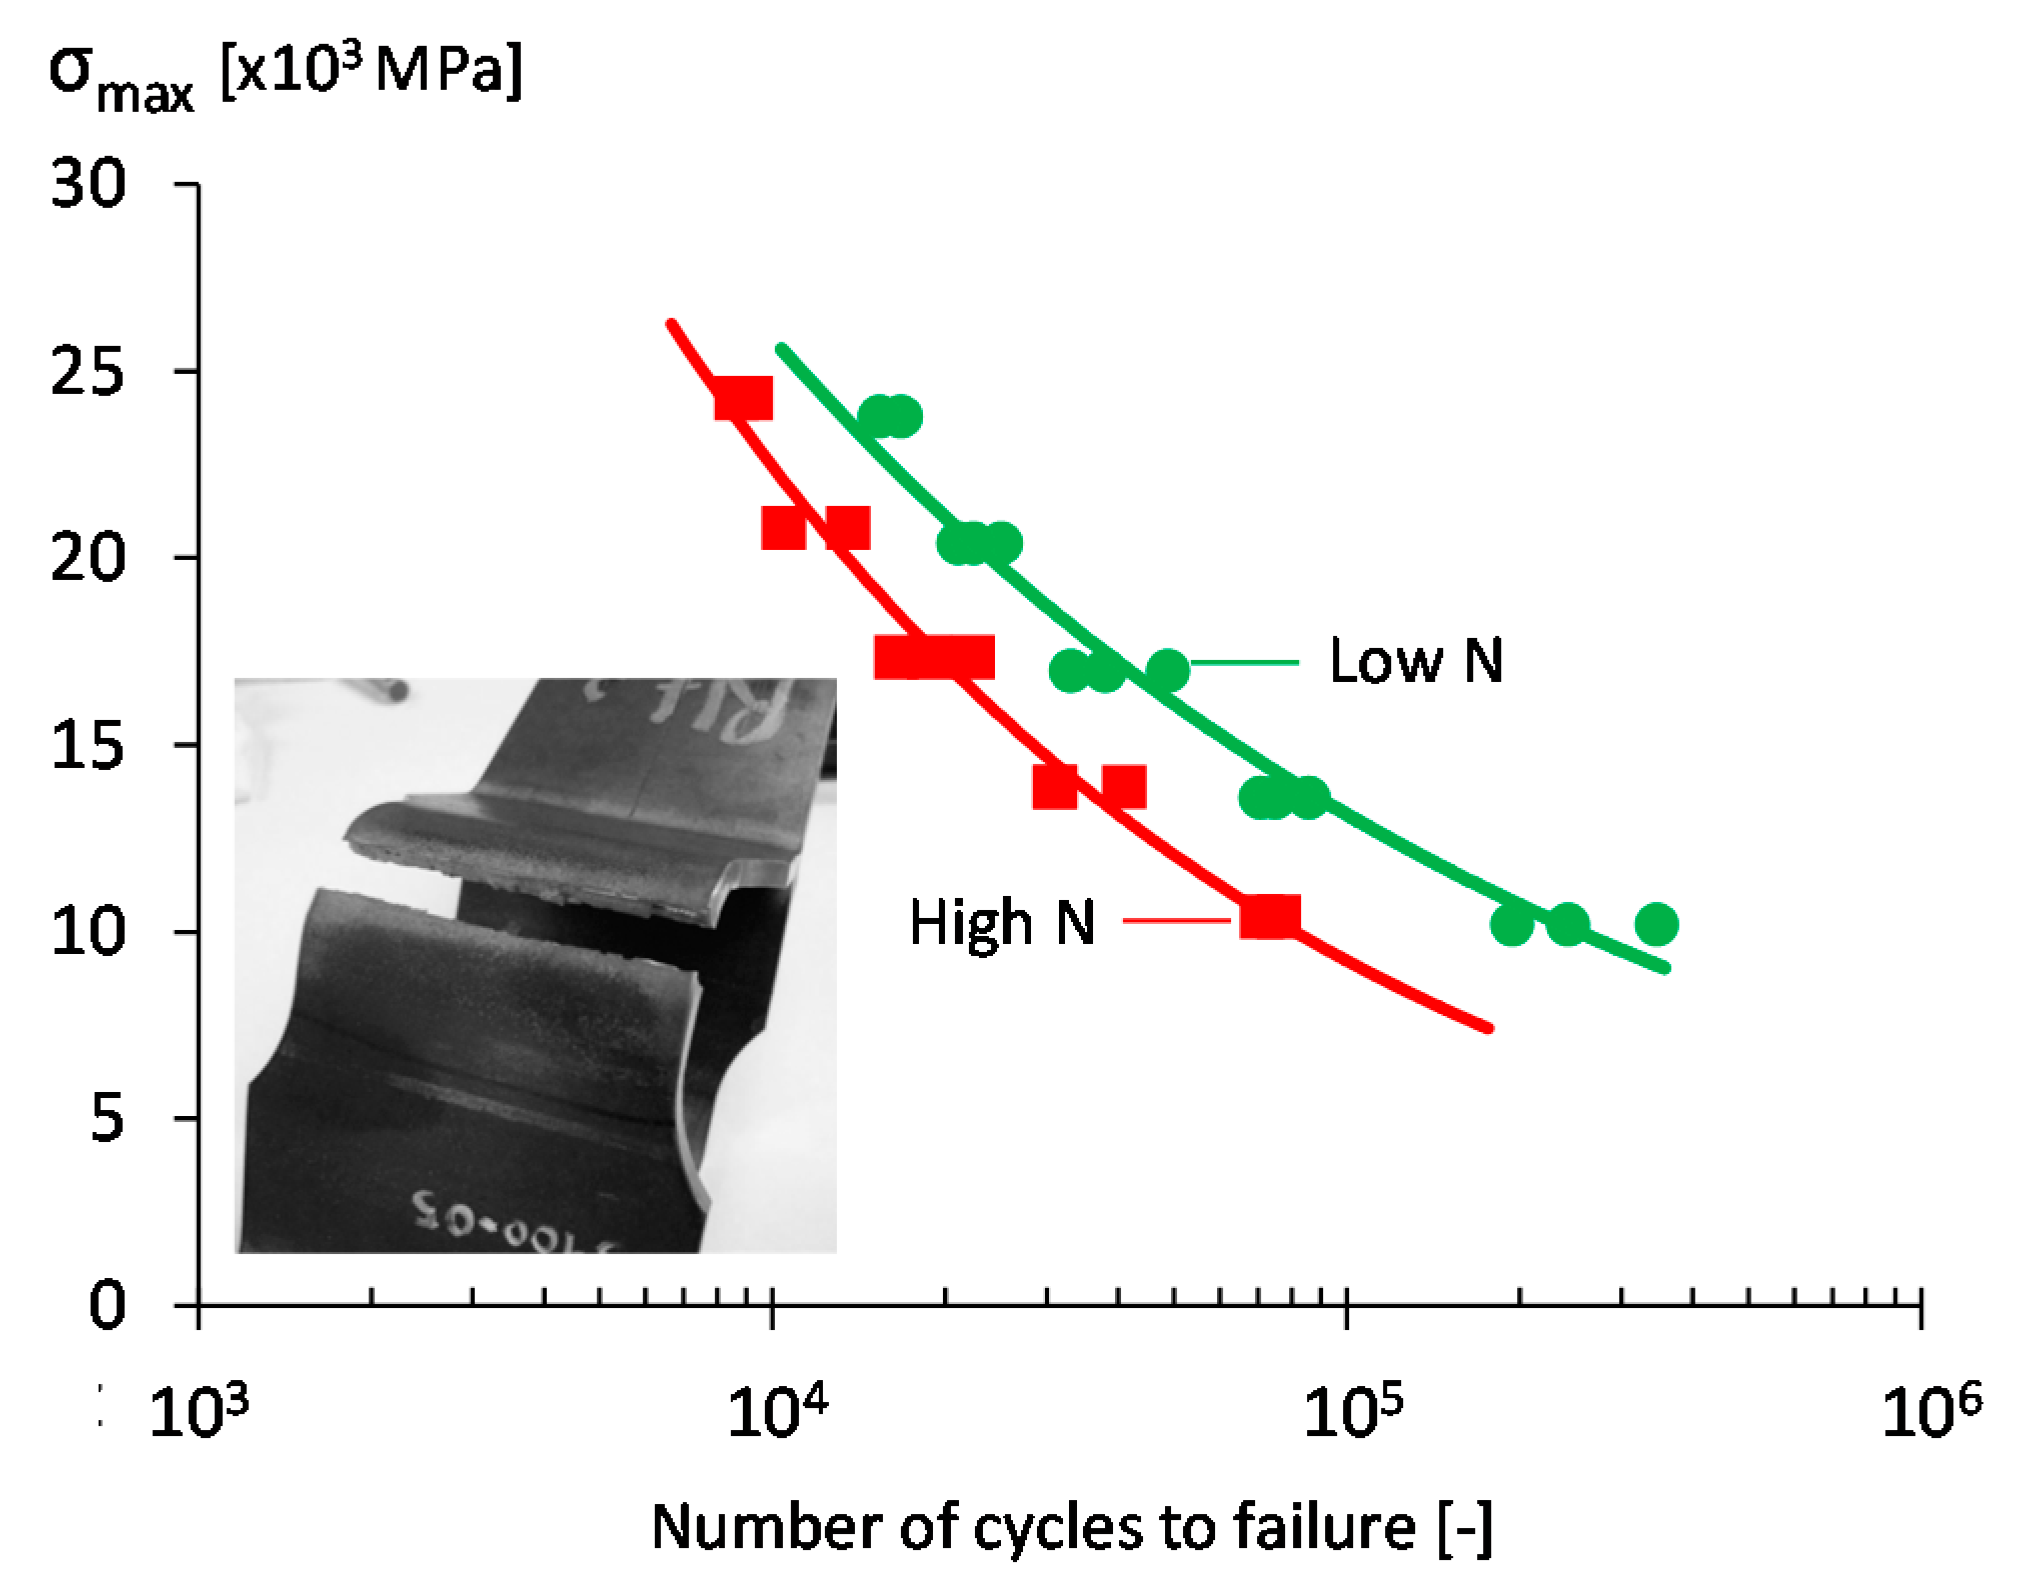
The fatigue tests of the cold formed fatigue specimens were performed on a hydraulic testing machine as shown in Figure 11a. Figure 11b shows the maximum stress value at the bending root versus the number of cycles to final failure of the cold formed fatigue specimen. The maximum stress at the bending root, as depicted in Figure 11a, was calculated using a finite element model (see [4]).
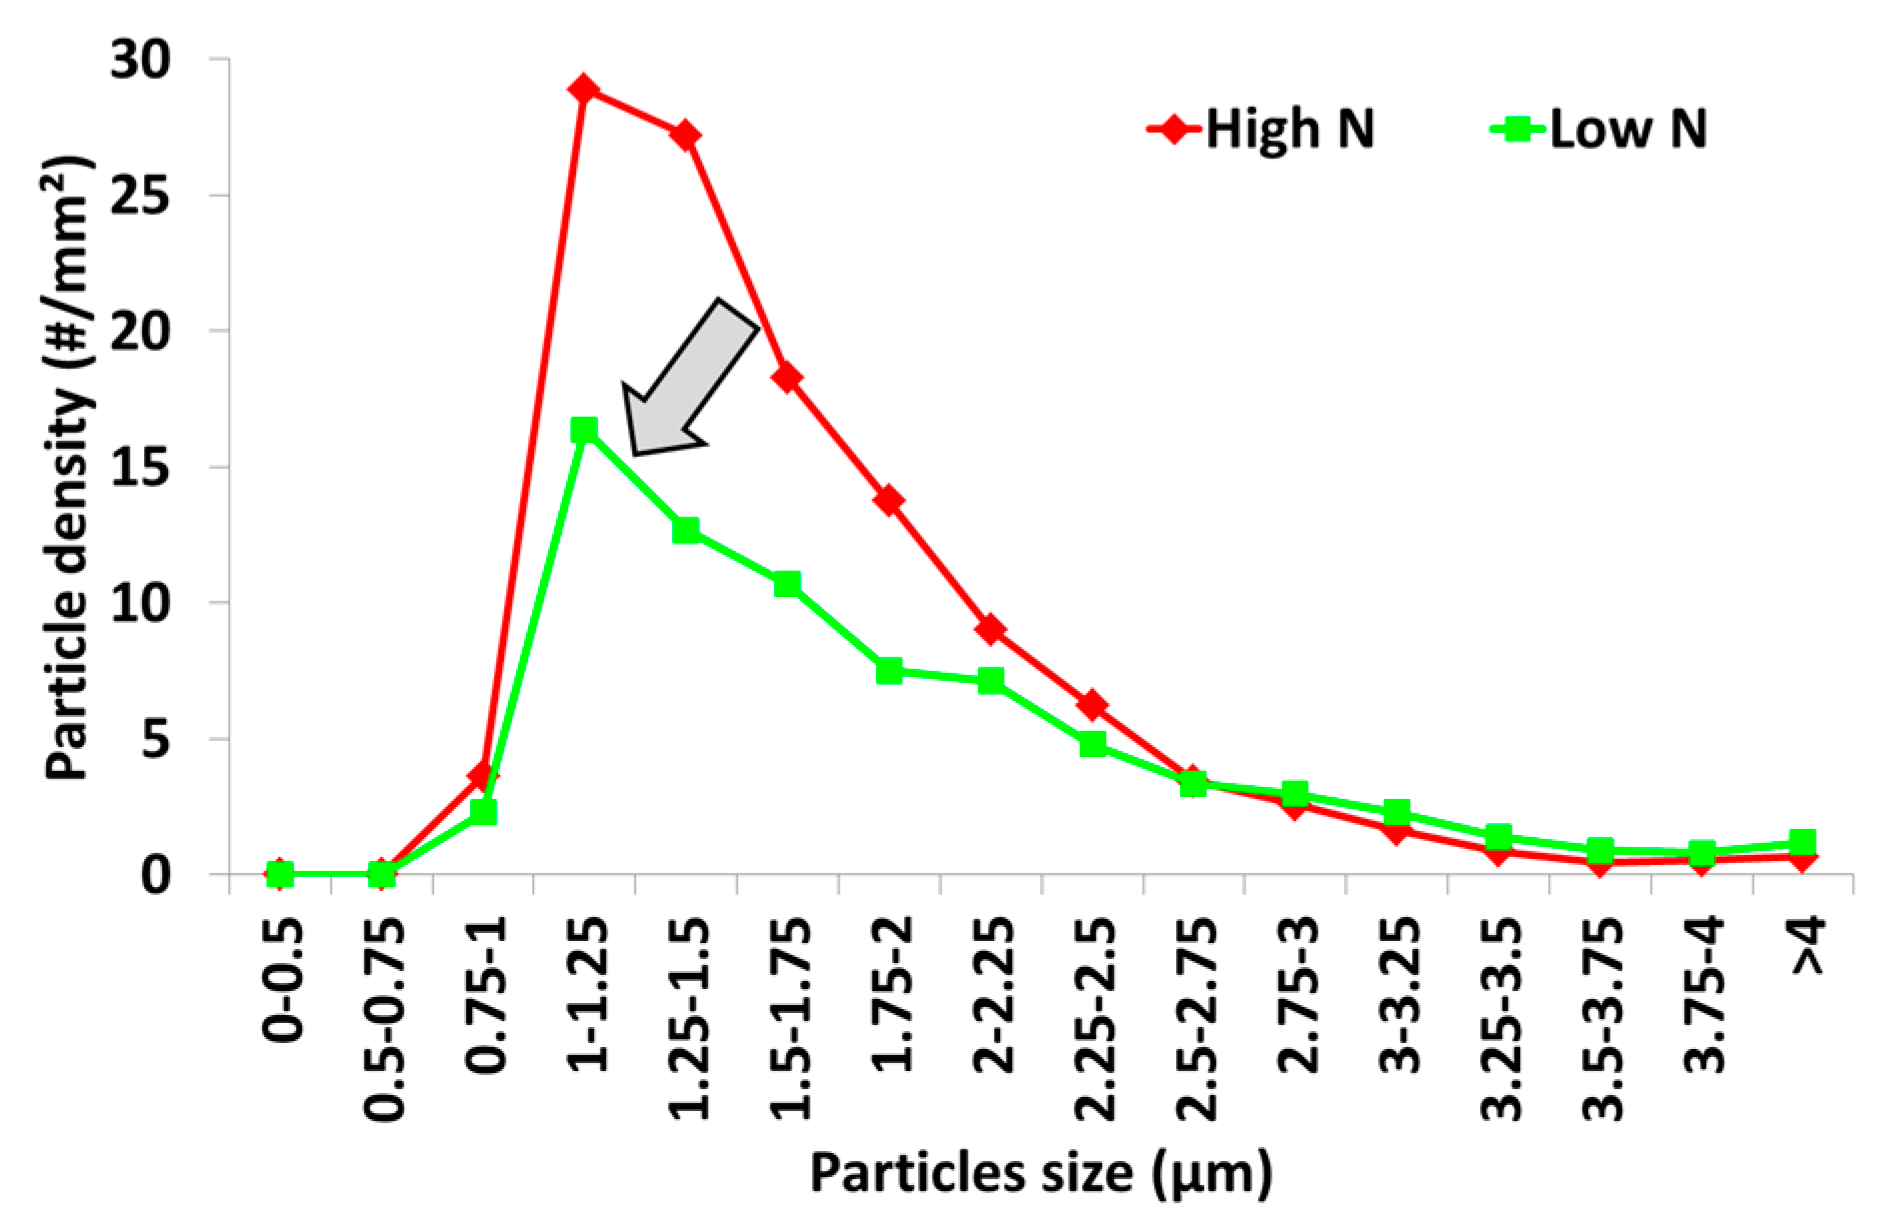
The observed results show the effect of the N level on the fatigue response of cold formed fatigue samples. By reducing the N level, the fatigue cycles to failure increase considerably, as shown in Figure 11. It is known that large, non-metallic particles reduce the fatigue performance of metals by microcrack formation at the matrix-particle interface [14]. This effect is likely further strengthened in the case of pre-existing damage as a consequence of deformation (cf. Figure 10c). A lower N content results in fewer and smaller TiN particles, as shown in Figure 12. This will result in less damage during the bending process for the low N steel, which in turn improves the fatigue performance of cold formed components. This effect is more pronounced at lower stress levels.
5. Summary and Conclusions
The main metallurgical parameters for the development of ultra-high strength martensitic strip steels have been discussed. Furthermore, the welding and fatigue behaviors of these steels have been illustrated.
The main parameter to optimize the strength/toughness balance is the finish rolling temperature after hot rolling. The FRT should be below the temperature of non-recrystallization, resulting in an optimum prior austenite grain size aspect ratio around 4. An additional tempering treatment in the range of 500 to 600 °C can be applied to further improve the toughness while maintaining the strength. The latter requires the addition of alloying additions that suppress temper softening, like Cr, Mo, and V. These same alloying additions also help to suppress softening during welding.
A specific test set-up was designed to investigate the fatigue behavior of a deformed component. It was shown that the fatigue behavior can be significantly improved if the N level is kept low. This is due to lower microstructural damage around TiN particles after forming, but likely also due to an intrinsic better fatigue response of the undeformed material.
Author Contributions
Lieven Bracke: contribution to all sections, related to metallurgical aspects; Dorien De Knijf, Eva Diaz Gonzalez: processing and metallurgy; Christoph Gerritsen: section on welding; Reza Hojjati Talemi: section on fatigue.
Conflicts of Interest
The authors declare no conflict of interest.
References
- Taylor, K.A.; Thompson, S.W.; Fletcher, F.B. (Eds.) Physical Metallurgy of Direct-Quenched Steels. In Proceedings of the Minerals, Metals, and Materials Society/American Society for Metals (TMS/ASM) Materials Week 92 Conference, Chicago, IL, USA, 2–4 November 1992. [Google Scholar]
- Ouchi, C. Development of Steel Plates by Intensive Use of TMCP and Direct Quenching Processes. ISIJ Int. 2001, 41, 542–553. [Google Scholar] [CrossRef]
- Bernier, N.; Bracke, L.; Malet, L.; Godet, S. An alternative to the crystallographic reconstruction of austenite in steels. Mater. Charact. 2014, 89, 23–32. [Google Scholar] [CrossRef]
- Talemi, R.H.; Chhith, S.; De Waele, W. Experimental and numerical study on effect of forming process on low cycle fatigue behavior of high strength steel. Fatigue Fract. Eng. Mater. Struct. 2017. [Google Scholar] [CrossRef]
- Bracke, L.; Xu, W.; Waterschoot, T. Effect of finish rolling temperature on direct quenched low alloy martensite properties. Mater. Today Proc. 2015, 2, S659–S662. [Google Scholar] [CrossRef]
- Taylor, K.A.; Hansen, S.S. Effects of Vanadium and Processing Parameters on the Structures and Properties of a Direct-Quenched Low-Carbon Mo-B Steel. Metall. Mater. Trans. A 1991, 22, 2359–2374. [Google Scholar] [CrossRef]
- Kaijalainen, A.J.; Suikkanen, P.P.; Limnell, T.J.; Karjalainen, L.P.; Kömi, J.I.; Porter, D.A. Effect of austenite grain structure on the strength and toughness of direct-quenched martensite. J. Alloys Compd. 2013, 577, S642–S648. [Google Scholar] [CrossRef]
- Kaijalainen, A.J.; Suikkanen, P.; Karjalainen, L.P.; Jonas, J.J. Effect of Austenite Pancaking on the Microtexture, Texture, and Bendability of an Ultrahigh-Strength Strip Steel. Metall. Mater. Trans. A 2014, 45, 1273–1283. [Google Scholar] [CrossRef]
- Zhao, Y.; Shi, J.; Cao, W.; Wang, M.; Xie, G. Effect of direct quenching on microstructure and mechanical properties of medium-carbon Nb-bearing steel. Univ.-Sci. A Appl. Phys. Eng. 2010, 11, 776–781. [Google Scholar] [CrossRef]
- Klein, M.; Rauch, R.; Spindler, H.; Stiaszny, P. Ultra high strength steels produced by thermomechanical hot rolling: Advanced properties and applications. In Proceedings of the 3rd International Conference on Steels in Cars and Trucks (SCT) 2011, Salzburg, Austria, 5–9 June 2011. [Google Scholar]
- Grange, R.A.; Hribal, C.R.; Porter, L.F. Hardness of Tempered Martensite in Carbon and Low-Alloy Steels. Metall. Mater. Trans. A 1977, 8, 1775–1785. [Google Scholar] [CrossRef]
- Caron, R.N.; Krauss, G. The Tempering of Fe-C Lath Martensite. Metall. Mater. Trans. B 1972, 3, 2381–2389. [Google Scholar] [CrossRef]
- Humber, G.; Klein, M.; Spindler, H.; Ernst, W. Properties and metallurgical aspects of thin wear resistant steel sheets of hardness 400/450HB produced in a hot strip mill. In Proceedings of the 4th International Conference on Steels in Cars and Trucks (SCT) 2014, Braunschweig, Germany, 15–19 June 2014. [Google Scholar]
- ASM International. Fatigue and Fracture. In ASM Handbook; ASM International: Geauga County, OH, USA, 1996; Volume 19, p. 155. [Google Scholar]
Figure 1.
Fatigue test set-up of cold formed specimen after 90° bending with a bending ratio r/t = 3.
Figure 1.
Fatigue test set-up of cold formed specimen after 90° bending with a bending ratio r/t = 3.

Figure 2.
EBSD maps for three different finish rolling temperatures (FRTs) (DQ1 steel): originally measured martensite structure (a) FRT 1000 °C, (b) FRT 930 °C, (c) FRT 860 °C, and reconstructed prior austenite EBSD maps of the same measurements (d) FRT 1000 °C, (e) FRT 930 °C, (f) FRT 860 °C. (Inverse Pole Figure colouring, black lines: 15° boundaries) (Bright green areas in (e,f): unreconstructed areas).
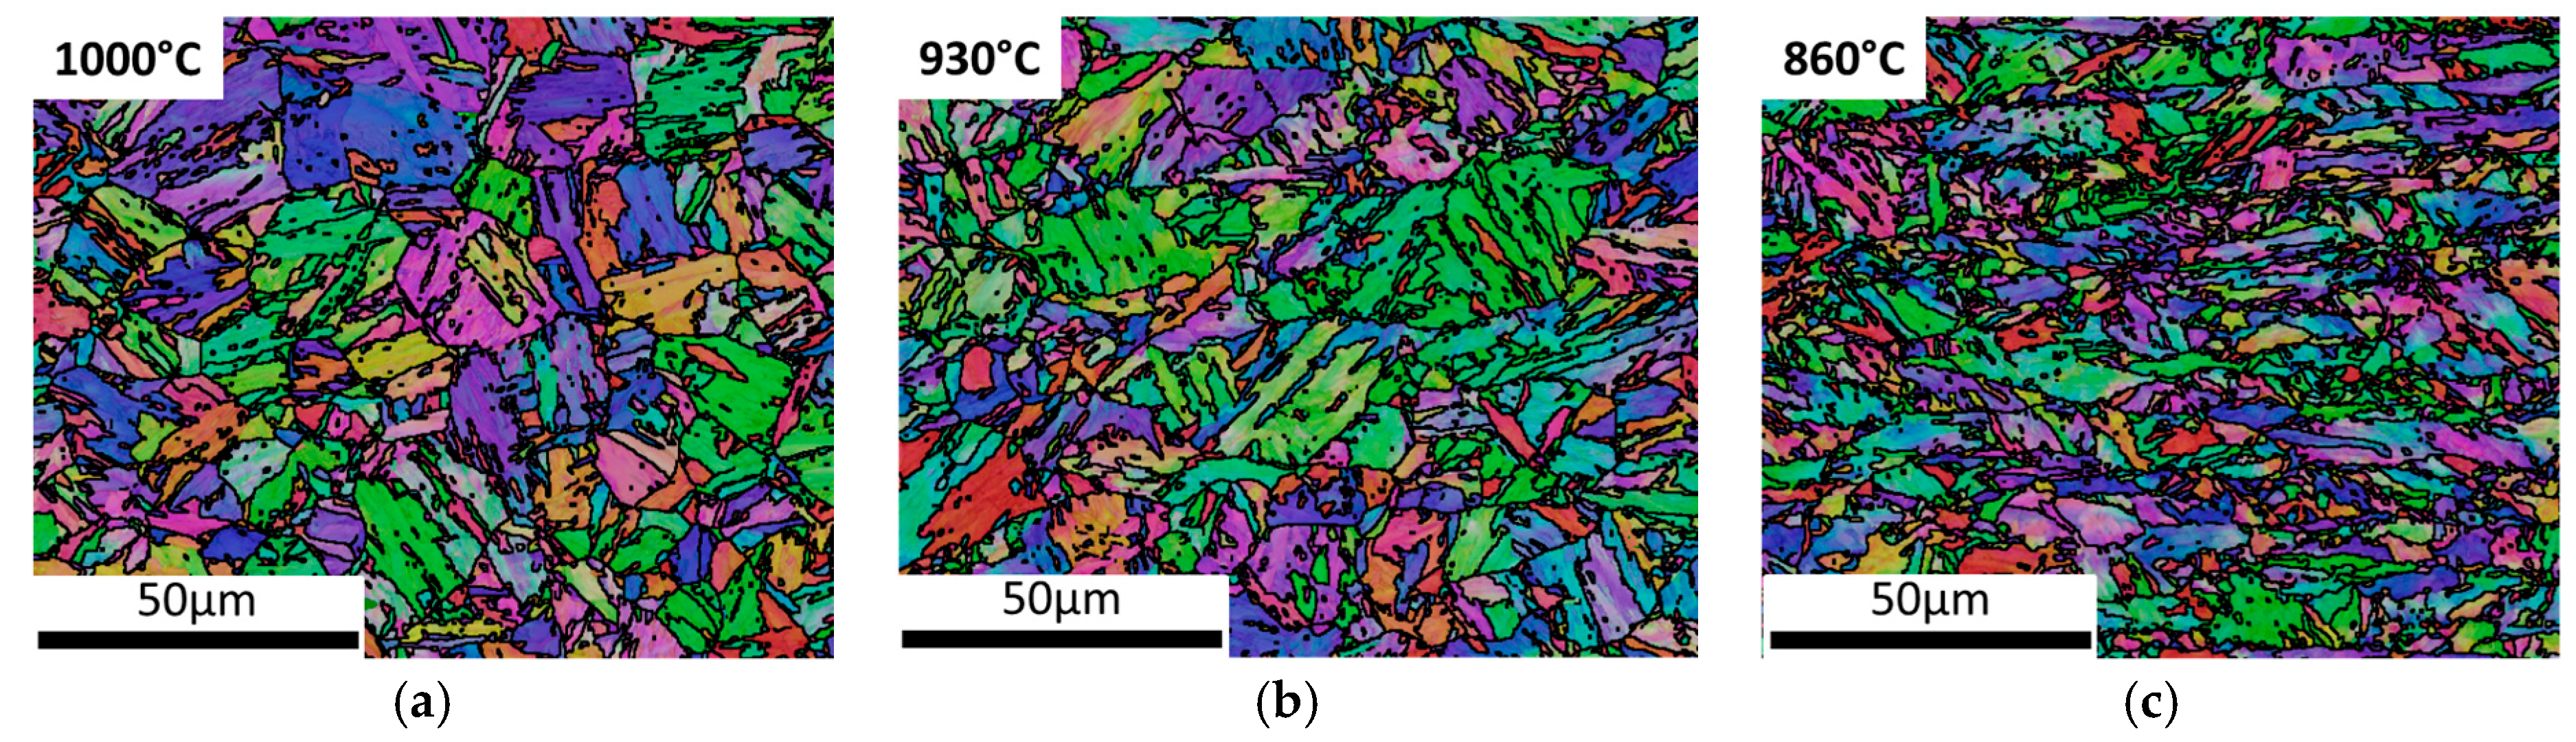
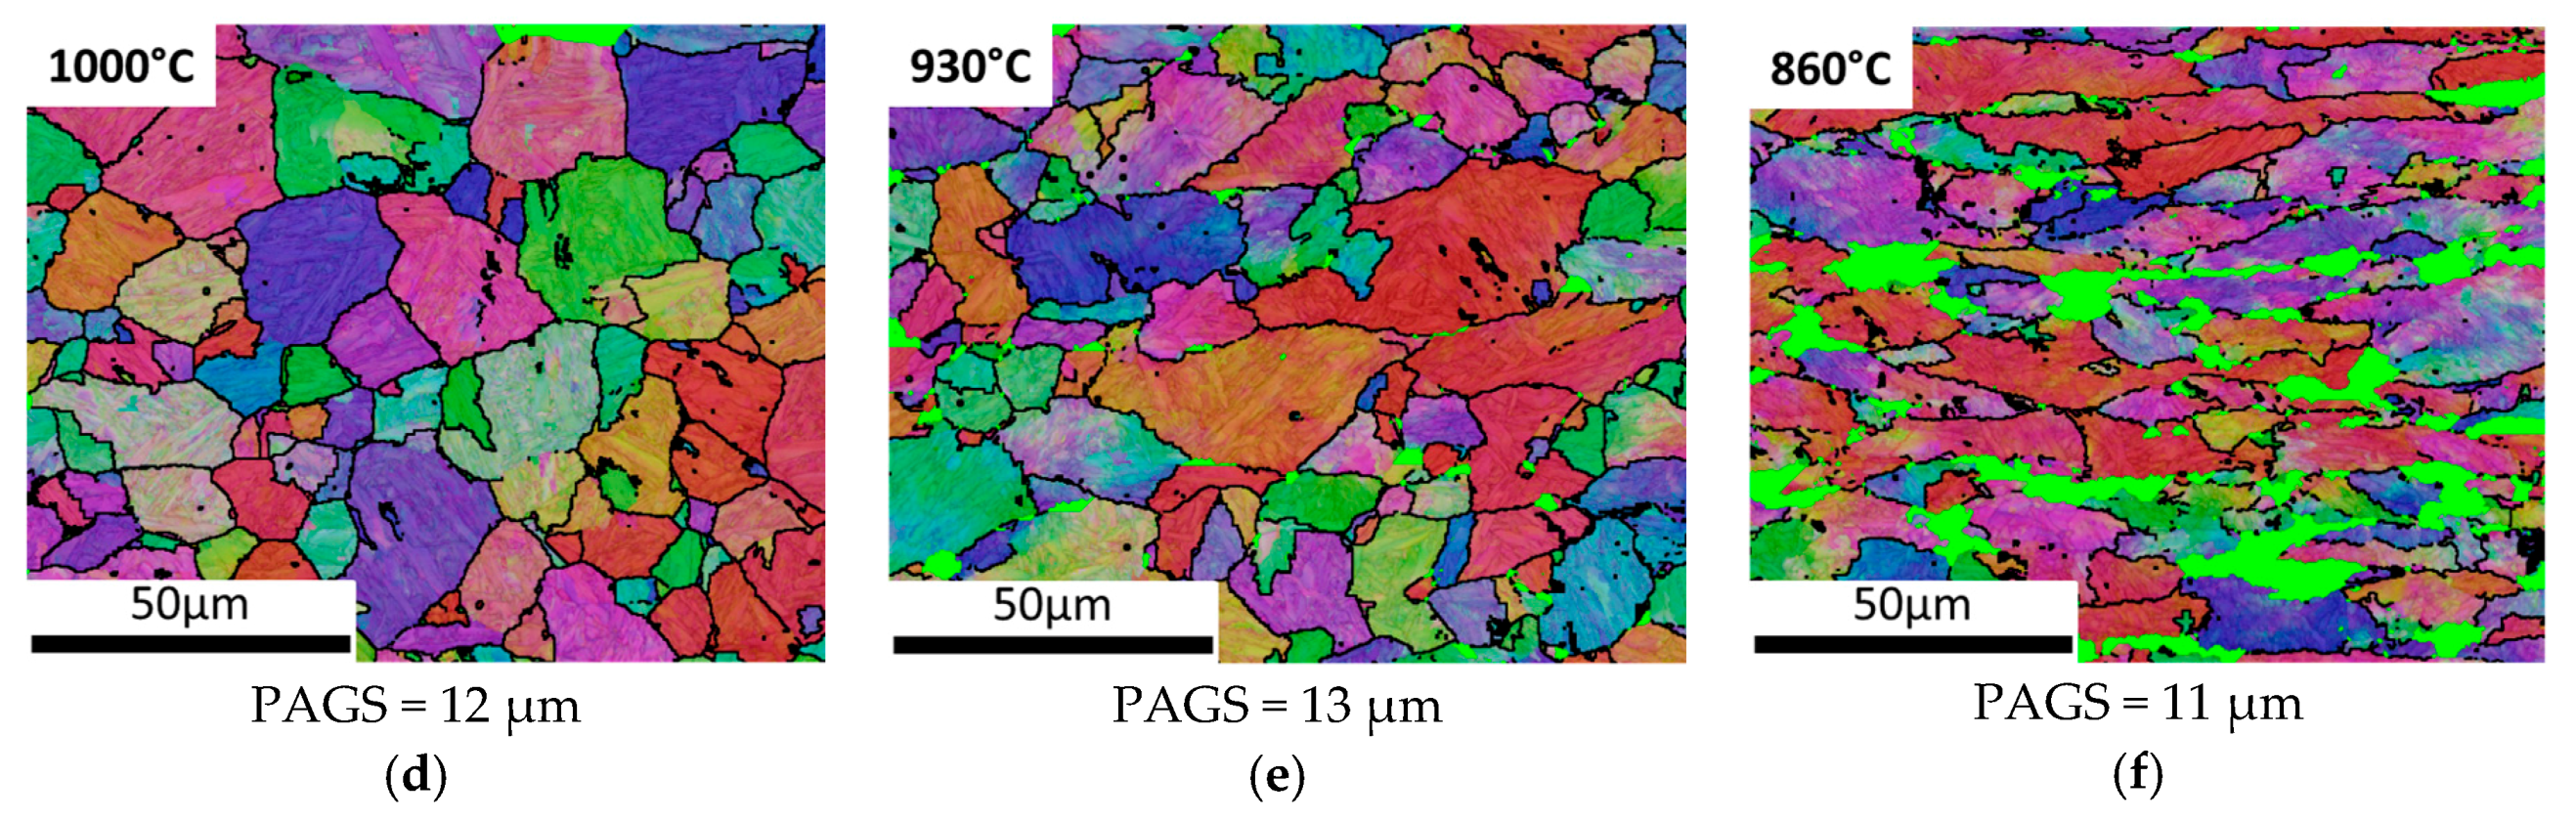
Figure 3.
(a) Tensile strength and Charpy V impact energy at 20 °C, tested in rolling direction, (b) Misorientation angles, based on martensite EBSD map. (DQ1 steel).
Figure 3.
(a) Tensile strength and Charpy V impact energy at 20 °C, tested in rolling direction, (b) Misorientation angles, based on martensite EBSD map. (DQ1 steel).

Figure 4.
Dilatometry curves for DQ2 and DQ3 steels, cooling rates of 10 and 20 °C/s. (Thermal cycles: heating to 850 °C with 10 °C/s, holding time 300 s before final cooling).
Figure 4.
Dilatometry curves for DQ2 and DQ3 steels, cooling rates of 10 and 20 °C/s. (Thermal cycles: heating to 850 °C with 10 °C/s, holding time 300 s before final cooling).

Figure 5.
(a) Typical SEM micrograph of DQ3 steel (PAG = prior austenite grain), tempered at 550 °C (RD-ND section), (b) High magnification SEM micrograph showing temper carbides and residual martensitic lath structure of DQ3 steel, tempered at 550 °C, (c) Difference in remaining martensitic lath structure between DQ1 and DQ3 steel after tempering at 500 °C.


Figure 6.
Comparison of mechanical properties of DQ1 and DQ3 steels for different temperatures (a) Tensile strength, (b) Total elongation (proportional test specimen), (c) Charpy V impact energy at −40 °C.
Figure 6.
Comparison of mechanical properties of DQ1 and DQ3 steels for different temperatures (a) Tensile strength, (b) Total elongation (proportional test specimen), (c) Charpy V impact energy at −40 °C.

Figure 7.
(a) Lab produced double-sided GMAW weld (Note: weld made with a specified heat input; not optimized for weld shape), (b) Hardness profile across the heat-affected zone (HAZ) of similar double-sided GMAW welds for the DQ1 and DQ3 steels. (Thickness: 6 mm, t8/5 = 7 s).
Figure 7.
(a) Lab produced double-sided GMAW weld (Note: weld made with a specified heat input; not optimized for weld shape), (b) Hardness profile across the heat-affected zone (HAZ) of similar double-sided GMAW welds for the DQ1 and DQ3 steels. (Thickness: 6 mm, t8/5 = 7 s).

Figure 8.
Minimum hardness measured in the GC HAZ for lab welds of DQ3 with different heat inputs (t8/5 = cooling time from 800 to 500 °C).
Figure 8.
Minimum hardness measured in the GC HAZ for lab welds of DQ3 with different heat inputs (t8/5 = cooling time from 800 to 500 °C).
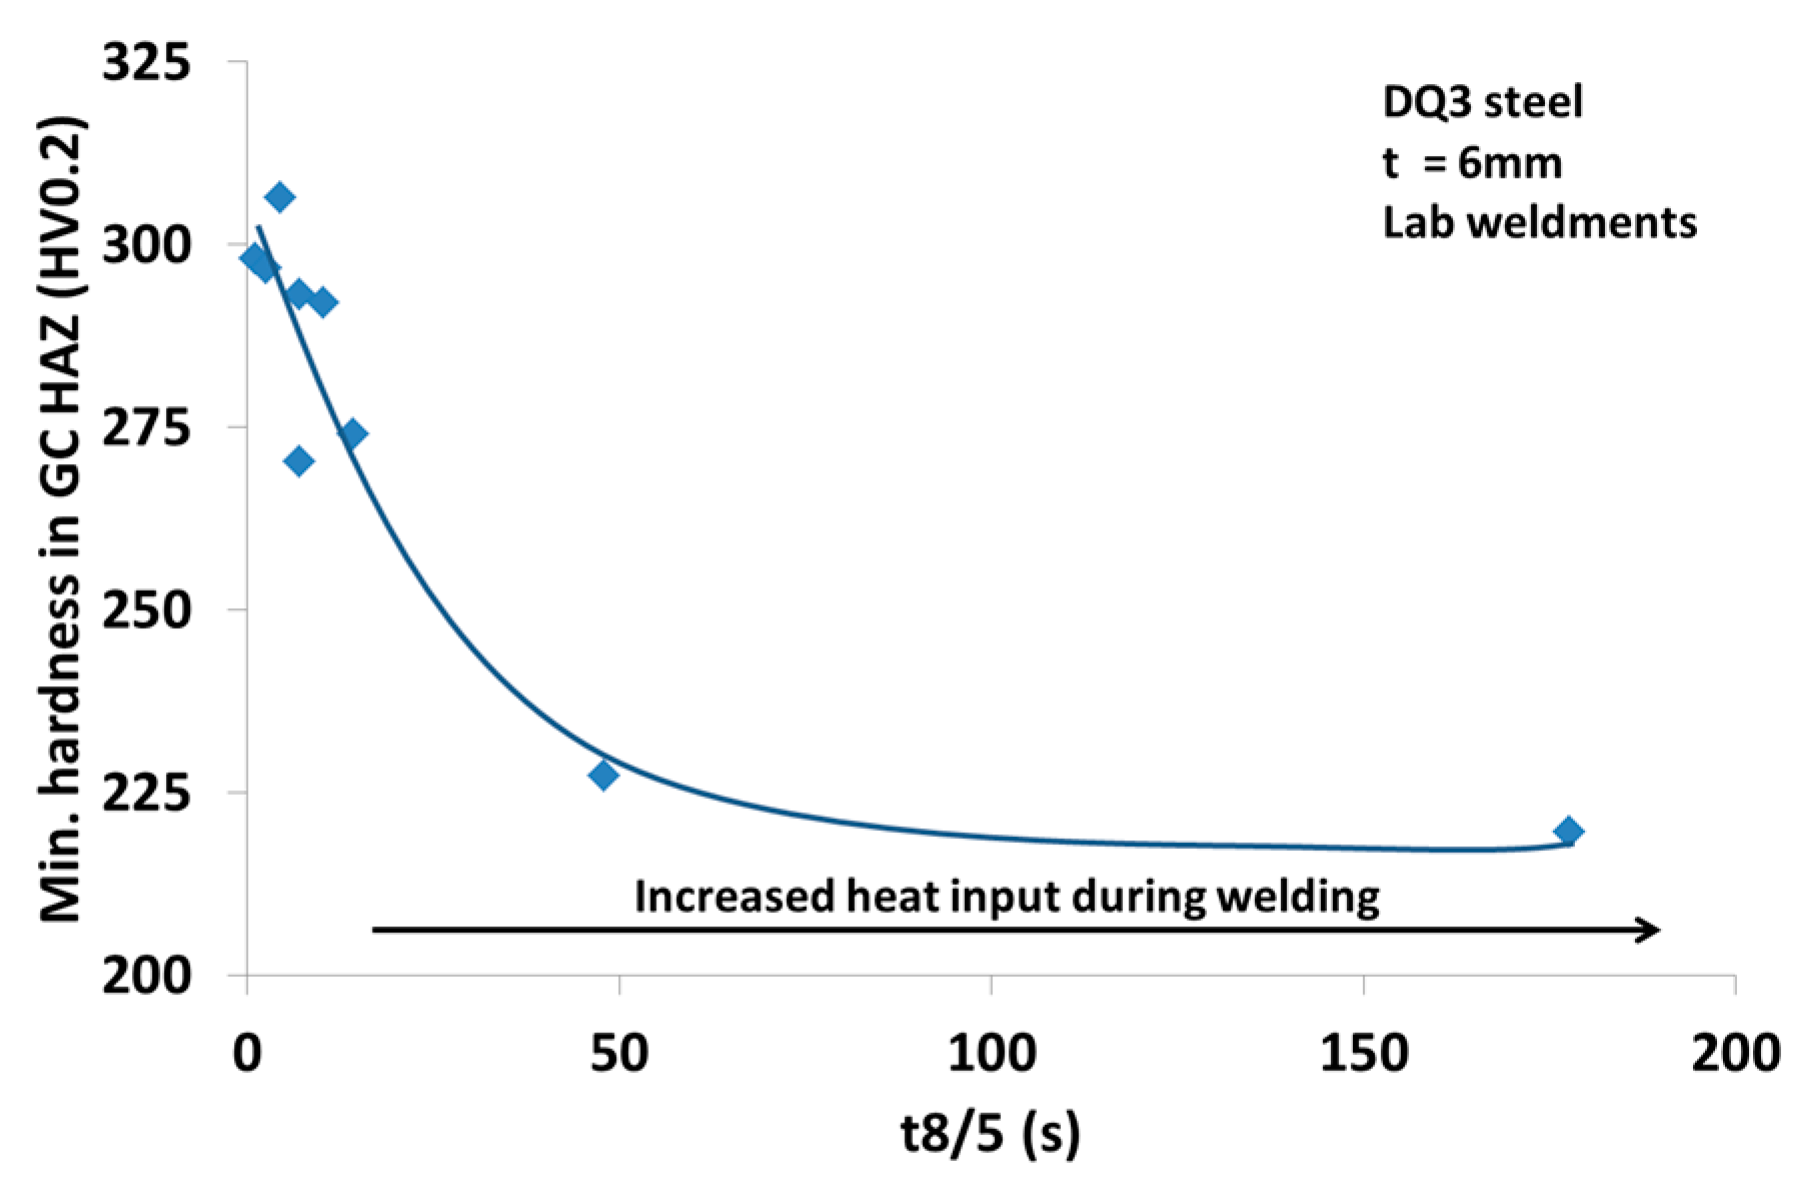
Figure 9.
Welding simulation data for DQ3 steel: (a) Charpy V impact energy at −40 °C on Gleeble annealed samples with different t8/5 (GC HAZ: peak temperature 1350 °C, ICHAZ: peak temperature 775 °C, IRGZ HAZ: dual cycle: Tp1 = 1350 °C; Tp2 = 775 °C), (b) Welding CCT diagram for the CG HAZ (Thermal cycle: Heating at 100 °C/s up to 800 °C, then 300 °C/s to peak temperature 1300 °C, followed by cooling using different cooling times between 800 and 500 °C (t8/5)).

Figure 10.
Effect of N on the bending behavior, 90° V-bending, r/t = 1.8 (a) DQ3 steel, high N; (b) DQ3 steel, low N; (c) Damage around a coarse TiN particle in DQ1 steel.
Figure 10.
Effect of N on the bending behavior, 90° V-bending, r/t = 1.8 (a) DQ3 steel, high N; (b) DQ3 steel, low N; (c) Damage around a coarse TiN particle in DQ1 steel.

Figure 11.
S–N curve obtained from cold formed specimen. The maximum stress at the bending root was calculated using a finite element model.
Figure 11.
S–N curve obtained from cold formed specimen. The maximum stress at the bending root was calculated using a finite element model.

Figure 12.
TiN particle size distribution for the high N and low N steel (SEM analysis: chemical composition measured by EDX, size measured by automated procedure based on image contrast).
Figure 12.
TiN particle size distribution for the high N and low N steel (SEM analysis: chemical composition measured by EDX, size measured by automated procedure based on image contrast).


Table 1.
Chemical composition ranges of three direct quenched, ultra-high strength hot rolled steels. (All in wt %, balance: Fe + impurities). Measured via Optical Emission Spectroscopy, except C, N, and S via combustion.
Table 1.
Chemical composition ranges of three direct quenched, ultra-high strength hot rolled steels. (All in wt %, balance: Fe + impurities). Measured via Optical Emission Spectroscopy, except C, N, and S via combustion.
| Composition | C | Mn | Si | Cr + Mo + V | Cu + Ni | B | Ti + Nb + V |
|---|---|---|---|---|---|---|---|
| DQ1 | <0.15 | <2.0 | <0.3 | <0.50 | <0.5 | 0.002 | <0.100 |
| DQ2 | 0.15–0.20 | <2.0 | <0.3 | <0.50 | <0.5 | 0.002 | <0.100 |
| DQ3 | <0.15 | <1.5 | <0.3 | <1.00 | <0.5 | 0.002 | <0.150 |
© 2017 by the authors. Licensee MDPI, Basel, Switzerland. This article is an open access article distributed under the terms and conditions of the Creative Commons Attribution (CC BY) license (http://creativecommons.org/licenses/by/4.0/).
Share and Cite
MDPI and ACS Style
Bracke, L.; De Knijf, D.; Gerritsen, C.; Hojjati Talemi, R.; Diaz Gonzalez, E. Development of Direct Quenched Hot Rolled Martensitic Strip Steels. Metals 2017, 7, 326. https://doi.org/10.3390/met7090326
AMA Style
Bracke L, De Knijf D, Gerritsen C, Hojjati Talemi R, Diaz Gonzalez E. Development of Direct Quenched Hot Rolled Martensitic Strip Steels. Metals. 2017; 7(9):326. https://doi.org/10.3390/met7090326
Chicago/Turabian StyleBracke, Lieven, Dorien De Knijf, Christoph Gerritsen, Reza Hojjati Talemi, and Eva Diaz Gonzalez. 2017. "Development of Direct Quenched Hot Rolled Martensitic Strip Steels" Metals 7, no. 9: 326. https://doi.org/10.3390/met7090326
Note that from the first issue of 2016, this journal uses article numbers instead of page numbers. See further details here.