The Effect of the Sintering Temperature and Addition of Niobium and Vanadium on the Microstructure and Mechanical Properties of Microalloyed PM Steels


Turkish Chambers and Stock Exchange Technical Science Vocational School, Karabük University, Karabük 78050, Turkey
Metals 2017, 7(9), 329; https://doi.org/10.3390/met7090329
Submission received: 9 July 2017
/
Revised: 23 August 2017
/
Accepted: 24 August 2017
/
Published: 26 August 2017
(This article belongs to the Special Issue Selected Papers from the 3rd International Iron and Steel Symposium)
Abstract
:In this work, the effect of the sintering temperature on the microstructure and mechanical properties of Nb-V added powder metallurgy (PM) steels was investigated. The microstructure and mechanical properties of the Nb-V added PM microalloyed steel were examined by optical microscopy, scanning electron microscope (SEM), energy dispersive spectroscopy (EDS), optical emission spectrometer (OES), tensile and hardness tests. Results indicated that the optimal sintering temperature was 1350 °C and the addition of 0.1%, 0.15% or 0.2% of Nb-V increases the yield strength (YS), ultimate tensile strength (UTS) and hardness of the PM sintered steels. 0.2 wt % Nb-V added PM steel showed the highest values in yield strength (YS), ultimate tensile strength (UTS) and the highest hardness. Elongation also tends to improve with adding Nb-V content. In addition, Nb-V limited grain growth during austenitization.
1. Introduction
Microalloyed steels are defined as steels containing niobium, vanadium and titanium in amounts between 0.05% and 0.20% by wt. Microalloyed steel is the material group of steels that have superior properties such as high strength and toughness, low ductile-to-brittle transition temperature, excellent weldability and corrosion resistance. These properties are obtained by applying various hardening mechanisms and proper thermomechanical procedures. The main advantages of microalloying elements are their ability to refine the grain size, prevent recrystallization and facilitate precipitation hardening. The effect of microalloying elements on the grain boundary movement and recrystallization is a result of carbonitride precipitates [1,2].
Precipitation hardening is the most desired strengthening mechanism. It is made especially in forged products by forming vanadium carbide (VC) like precipitates. The type, size and distribution of the compounds of microalloying elements with carbon and nitrogen are important for precipitation hardening. Vanadium is the most important element due to its high solubility in austenite [3]. The major function of vanadium, as a microalloying element, is precipitation hardening. Carbon rich VCN forms at temperatures below 700 °C. Vanadium precipitates have a diameter of less than 0.03µm during or after the transformation. VN can form in austenitic structures of high carbon steels (0.4%), especially when the amount of nitrogen is high, and refine the grain size similar to NbC. Since vanadium forms precipitates, it increases the strength of the steel [2,3,4,5]. Although vanadium is highly soluble in austenite, it is less soluble in ferrite. Contrary to the other microalloys, vanadium is known to increase the ferrite formation rather than prevent it [3]. VN precipitates prevent grain coarsening and consequently ferrite grain structures are formed which increases the toughness and strength.
Niobium is known to be the most effective microalloying element. It forms nitride and carbide. NbC is formed at 1000 °C and causes ferrite grains to form by preventing the recrystallization of austenite. NbC needs to be completely inside the solution to be effective. Thus it increases the yield strength by the precipitation of fine particles. For NbC to enter into the solution, the reheating temperature needs to be high (1300 °C) and long enough in duration [6]. NbC precipitates with a mean size of 200 nm, preventing grain coarsening. On the other hand, 20 nm precipitates formed in austenite can delay recrystallization. An NbC precipitate of 2 μm size prevents the grain coarsening of austenite during normalization. The addition of niobium to steels under normalization conditions improves strength and toughness. Niobium, which doesn’t precipitate in austenite, precipitates during the transition to ferrite and improves strength.
Microalloyed steel or steels are produced by powder metallurgy, though production rates are not very high yet [6,7,8]. Recent production methods in the automotive industry depend strongly on powder metallurgy. This production method is unique due to its homogeneous distribution of the quality, controllable content and cost efficiency. Proper determination of the sintering temperature would facilitate the formation of carbo-nitrides that are required in steel. Microalloyed steels today are mostly produced in the form of sheet and pipe.
Previous studies have demonstrated the efficacy of a PM method. For example, Erden et al. [1] produced Ti microalloyed steel in their study by a PM method. Sintering was performed at 1150 °C for 60 min. Increasingthe Ti content (0-0.1-0.15% and 0.2% by weight) contributed to yield and tensile strength. They attribute these results to the formation of TiC(N) precipitates during the cooling period after sintering. Their results showed that precipitates like TiC(N) prevent grain coarsening and lead to the formation of small austenite grains. These grains, in turn, improve the strength of the material. In another study, Schade et al. used the PM method to produce V-Si PM microalloyed steel. They suggested that silicon and vanadium significantly increased the strength of PM steels with a pearlitic structure [9].
In this study, the effect of sintering temperatures and chemical composition on the microstructural and mechanical properties of Nb-V added microallyed PM steel was examined. The study especially focuses on the effects of microalloying elements as well as sintering temperatures on the microstructure and mechanical properties.
2. Materials and Methods
In this study, one unalloyed and three microalloyed steel specimens were produced by powder metallurgy methods (see PM composition in Table 1).
Iron, graphite, niobium and vanadium powders were used to produce the steel specimens. The size of graphite, iron, niobium and vanadium powders were <20, ≤180, <45, and <44 µm, respectively. These powders were supplied by Sigma-Aldrich (Istanbul, Turkey). The purities of graphite, Fe, Nb and V are 96.5%, 99.9%, 99.8% and 99.5%, respectively. The SEM micrographs of the powders are presented in Figure 1.
In order to produce the microalloyed steel specimens with the compositions given in Table 1, the powders were mixed using the TURBULA T2F device (Willy A. Bachofen AG, Muttenz, Switzerland). Zn-stearate was also used as the lubricant. After the powders were weighed to the chemical composition ratios given in Table 1 by a 0.0001 g precision digital scale, they were mixed in a three axis Turbula mixer without ball for 1 hour. The mixed powders were then pressed in a die in the form of the standard tensile test specimen according to ASTM E8/E8M [10] under 700 MPa for 10 s uniaxial pressure in a 100 ton capacity hydraulic press.
The pressed specimens were sintered in a 90% nitrogen-10% hydrogen atmosphere at four different temperatures: 1150 °C, 1250 °C, 1350 °C and 1400 °C. The temperature was increased at a 5 °C/min heating rate. The specimens were held at 350 °C for 30 min to allow the zinc-stearate to evaporate. Then the specimens were heated up to sintering temperatures and isothermally annealed for 1 h. They were then cooled to ambient temperature at a cooling rate of 5 °C/min again. Five specimens were produced for each composition, resulting in a total of 80 specimens. Graphite (0.45%) was added to reach a carbon content of 0.25% in the sintered test pieces. Figure 2 shows the produced specimens.
A SHIMADZU hardness machine (MCT-W, Shimadzu, Tokyo, Japan) was used to measure the microhardness of all the specimens under HV0.5 (500 g) load. The hardness values of specimens were determined by the mean value of ten measurements taken for each sample. The specimens were subjected to tensile tests at 1 mm/min crosshead speed using a SHIMADZU tensile testing machine (Shimadzu, Tokyo, Japan) (with 50 kN capacity). Stress-strain (%) diagrams were obtained after each test. Yield strength (0.2%), tensile strength and percent strain values of the specimens were calculated from these diagrams. For each series of five specimens, the arithmetic mean and standard deviation of each property for the specimens with the five yield strengths, ultimate tensile strength elongations % and hardness strengths were calculated to the proper number of significant figures. This wasdone on the basis that the expected errors (nicks or flaws in the specimen, breaks within the grips, specimen slippage, etc.) would all tend to produce lower results. The standard deviation [11] is given by Equation (1):
where is the arithmetic mean of the data set, xi is the value of a single observation (i = 1 through n), n is the number of observations and s is the estimated standard deviation.
The average composition of alloys, on the other hand, was determined using the Optical Emission Spectrometer (OES, Bruker Alpha, Bursa, Turkey) following the ASTM A751-11 standard. Densities of the specimens were determined by the Radwag density kit (Bruker Alpha, Bursa, Turkey) using the Archimedes principle based on ASTM B 328-96 [12]. An optical emission spectrometer (OES, Bruker Alpha, Bursa, Turkey) was also used to determine the chemical compositions of the produced samples before sintering and after sintering. Microstructural studies were then carried out using optical and field emission scanning electron microscopy (FESEM) by a Zeiss Ultra Plus machine (Carl Zeiss SMT GmbH, Oberkochen, Germany) equipped with a secondary electron (SE2) and energy dispersive X-ray spectroscopy (EDS) analysis system. To investigate the microstructure of steels, a Nikon ECLIPSE L150 type microscope (Melville, NY, USA) with magnification of 50× to 1000× was used. Grain sizes of non-alloyed and microalloyed PM steel specimens were calculated using the mean linear intercept method on optical micrographs. A line (45° incline) was drawn on the micrographs and at least 500 grains, cut by the intersecting line, were counted for each specimen [13,14]. Finally, percentages of ferrite and pearlite ratios were determined by using the point counting method. The standard deviation of the mean linear intercept method was calculated by the formula developed by Blank and Gladman [14]. In this equation, the standard deviation of a single intercept value is accepted as a constant of (σi/i) = 0.7. The relative error, φ, of the mean linear intercept based on the measurement of n grains (SEi/i) is given by Equation(2):
where σi is the standard deviation of the assessment of intercept lengths. The volume fractions of ferrite and pearlite phases of the specimens were calculated by the metallographic point counting method defined by Gladman and Woodhead, see Equation (3) [13]. According to this method, when the grid points intersect the ferrite boundary, they are counted as half. Errors in point counting were also calculated by the Gladman and Woodhead method, see Equation (4).
where f is the measured volume fraction of ferrite or pearlite, n = the number of points corresponding to the ferrite and pearlite phases of the specimens, N is the total number of points counted and σ is the standard deviation. All volume fractions were expressed ± σ (standard deviation).
3. Results and Discussion
In the present work, an optical emission spectrometer (OES) was used to compare the differences in chemical compositions of the produced samples before sintering and after sintering.
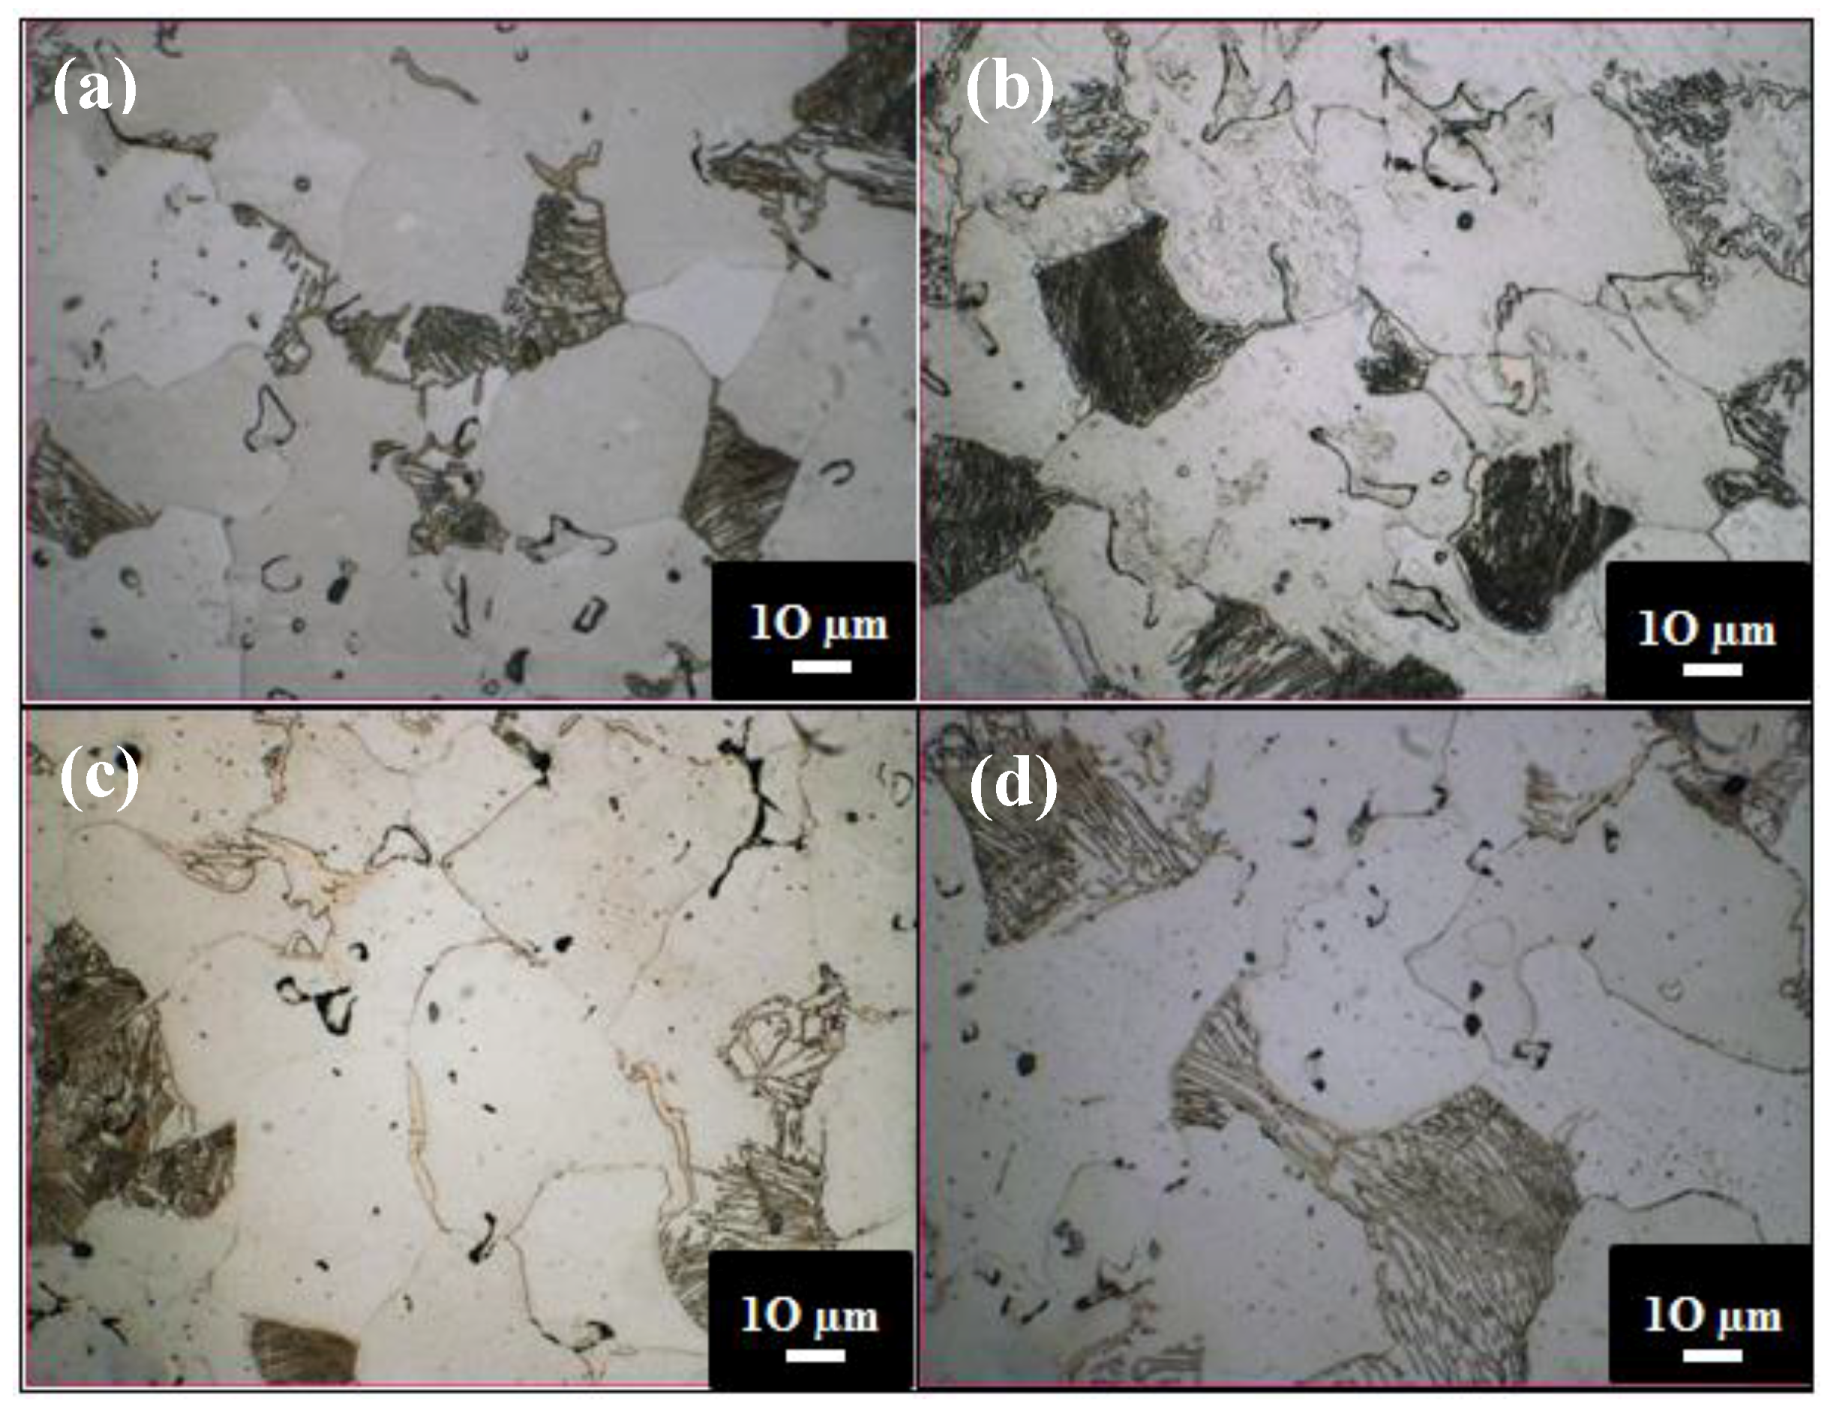
The chemical compositions of the produced PM steels after sintering can be seen in Table 2. The results of the optical emission spectrometer (OES) analysis showed that the pre-production plan of the chemical composition agreed with the chemical composition after the production. Figure 3 shows the micrographs of Fe-0.25C (Alloy 1). The microstructure of the Alloy 1 specimen consists of ferrite and pearlite grains of various sizes. These micrographs show that the grain sizes increased with the increasing sintering temperature. For example, the grain size of Fe-0.25C (Alloy 1) sintered at 1150 °C is 29.3 µm while it became 35.6 µm after sintering at 1400 °C. Since the diffusion of atoms increases at high temperatures, fine grains consequently grow by combining with each other. Therefore, it was expected that the grains would become larger when the temperature was increased [14]. See Figure 4 for the optical micrographs of the Fe-0.25C-0.05Nb-0.05V (Alloy 2), Fe-0.25C-0.075Nb-0.075V (Alloy 3) and Fe-0.25C-0.1Nb-0.1V (Alloy 4) specimens.
Table 3 gives the relative density, phase volume fractions and mean linear intercept grain sizes of the specimens. As can be seen, the microstructure of Nb-V microalloyed PM steels sintered at different temperatures consist of different ferrite and perlite phases with different grain sizes. Table 3 shows the sintered densities which are in the range of 92% to 94%. These density values are relatively low which may be caused by uniaxial pressing. Density values can be increased by using axial pressing, hot isostatic pressing or metal injection moulding instead of uniaxial cold pressing. The density of the specimens increased after sintering as expected. Sintering is used to combine particles to each other in a certain temperature and time. Similar studies agree with this result [5,6,7,15].
Figure 4 and Table 3 indicate that grain sizes decreased with increasing the Nb-V content. A major benefit of microalloying is the decrease of grain growth rate during austenitization. If fine precipitates exist in austenite, the growth of grains is restricted, leading to a finer grain size [4,7,8]. The kinetics of formation of these precipitates such as carbides and nitrides are different from each other. This situation affects the mechanical properties of the steel differently. The solubility of NbC precipitates is similar to TiC precipitates, contributing to the formation of ferrite grains by preventing the growth of austenite grains [4]. Precipitates that don’t dissolve at sintering temperature prevent austenite grain growth and cause small ferrite grains to form. It is known that NbC precipitates prevent recrystallization in the austenite region (900 °C–1300 °C) and form small ferrite grains [9,16].
Niobium has low solubility which allows for substantial dissolution of niobium carbonitrides at elevated temperatures. However, at low temperatures in the austenite range, the carbonitride shows low solubility and the dispersion strengthening is not generally observed. The undissolved carbonitride at these temperatures acts mostly as an effective grain refiner. The marked change in carbonitride dissolution between high and low temperatures (1300 °C and 900 °C) in the austenite temperature range allows for substantial strain and accelerated precipitation at temperatures below 1000 °C, and produces what is arguably the most obvious distinctive effect of niobium, i.e., the marked retardation of recrystallization at these temperatures [16].
VC, VN and VCN precipitates prevent grain growth in the austenite region and during the austenite-ferrite transformation leading to the formation of small ferrite grains [17]. There are studies in literature arguing that small amounts of vanadium addition to steel increases the nucleation of ferrite grains in grain boundaries and allows for the formation of small ferrite grains [18].
In this study, 0.1%, 0.15% and 0.2% (by weight) additions of Nb-V into PM steels caused the grains to refine. This situation is a result of the formation of small precipitates like NbC(N) and VC(N) during the sintering process at temperatures: 1150 °C, 1250°C, 1350 °C and 1400 °C, or during the cooling process. Precipitates that don’t dissolve at sintering temperature prevent the austenite grain growth causing small ferrite grains to form. Especially in the austenite region (900 °C–1300 °C) NbC precipitates formed prevent recrystallization and form small ferrite grains. Niobium and vanadium microalloying elements precipitate as carbide, nitride and carbonitride and contribute to the mechanical properties of microalloyed steels by grain refinement, solid solution precipitation and precipitation hardening mechanisms [17,18,19,20].
Figure 5 shows yield strength (YS), ultimate tensile strength (UTS), elongation and hardness of the examined PM steels. Figure 6 also shows a typical example of the stress-strain curves obtained by the tensile test and a general increase of the YS and UTS of steel with the addition of Nb-V. Generally, elongation tends to improve with adding Nb-V content. These changes are considered to be the consequences of differences in precipitation distribution. High strength and good toughness in microalloyed steels are achieved by a combination of microalloying and controlled rolling [21]. During sintering and slow cooling from sintering temperature, NbC(N) or VC(N) precipitates form in austenite and in ferrite during the austenite-ferrite transformation, or after transformation as suggested by Erden et al. [3]. This leads to an increase in strength compared to the niobium and vanadium-free alloy. The hardness of PM steels can increase with VC(N) and NbC(N) precipitates. Table 3 gives the hardness values of unalloyed and microalloyed steel specimens sintered at 1350 °C. The hardness increased in up to 0.2% of the alloying element. Due et al. [22] have observed an increase in the wear resistance and hardness of low carbon steel by TiC-VC precipitates. Some other studies [1,2,3,23] indicated that carbides and nitrides formed in microalloyed steels improve the hardness and strength. These studies argued that it was the solid solution hardening that contributed to strength less than carbide and nitride precipitation.
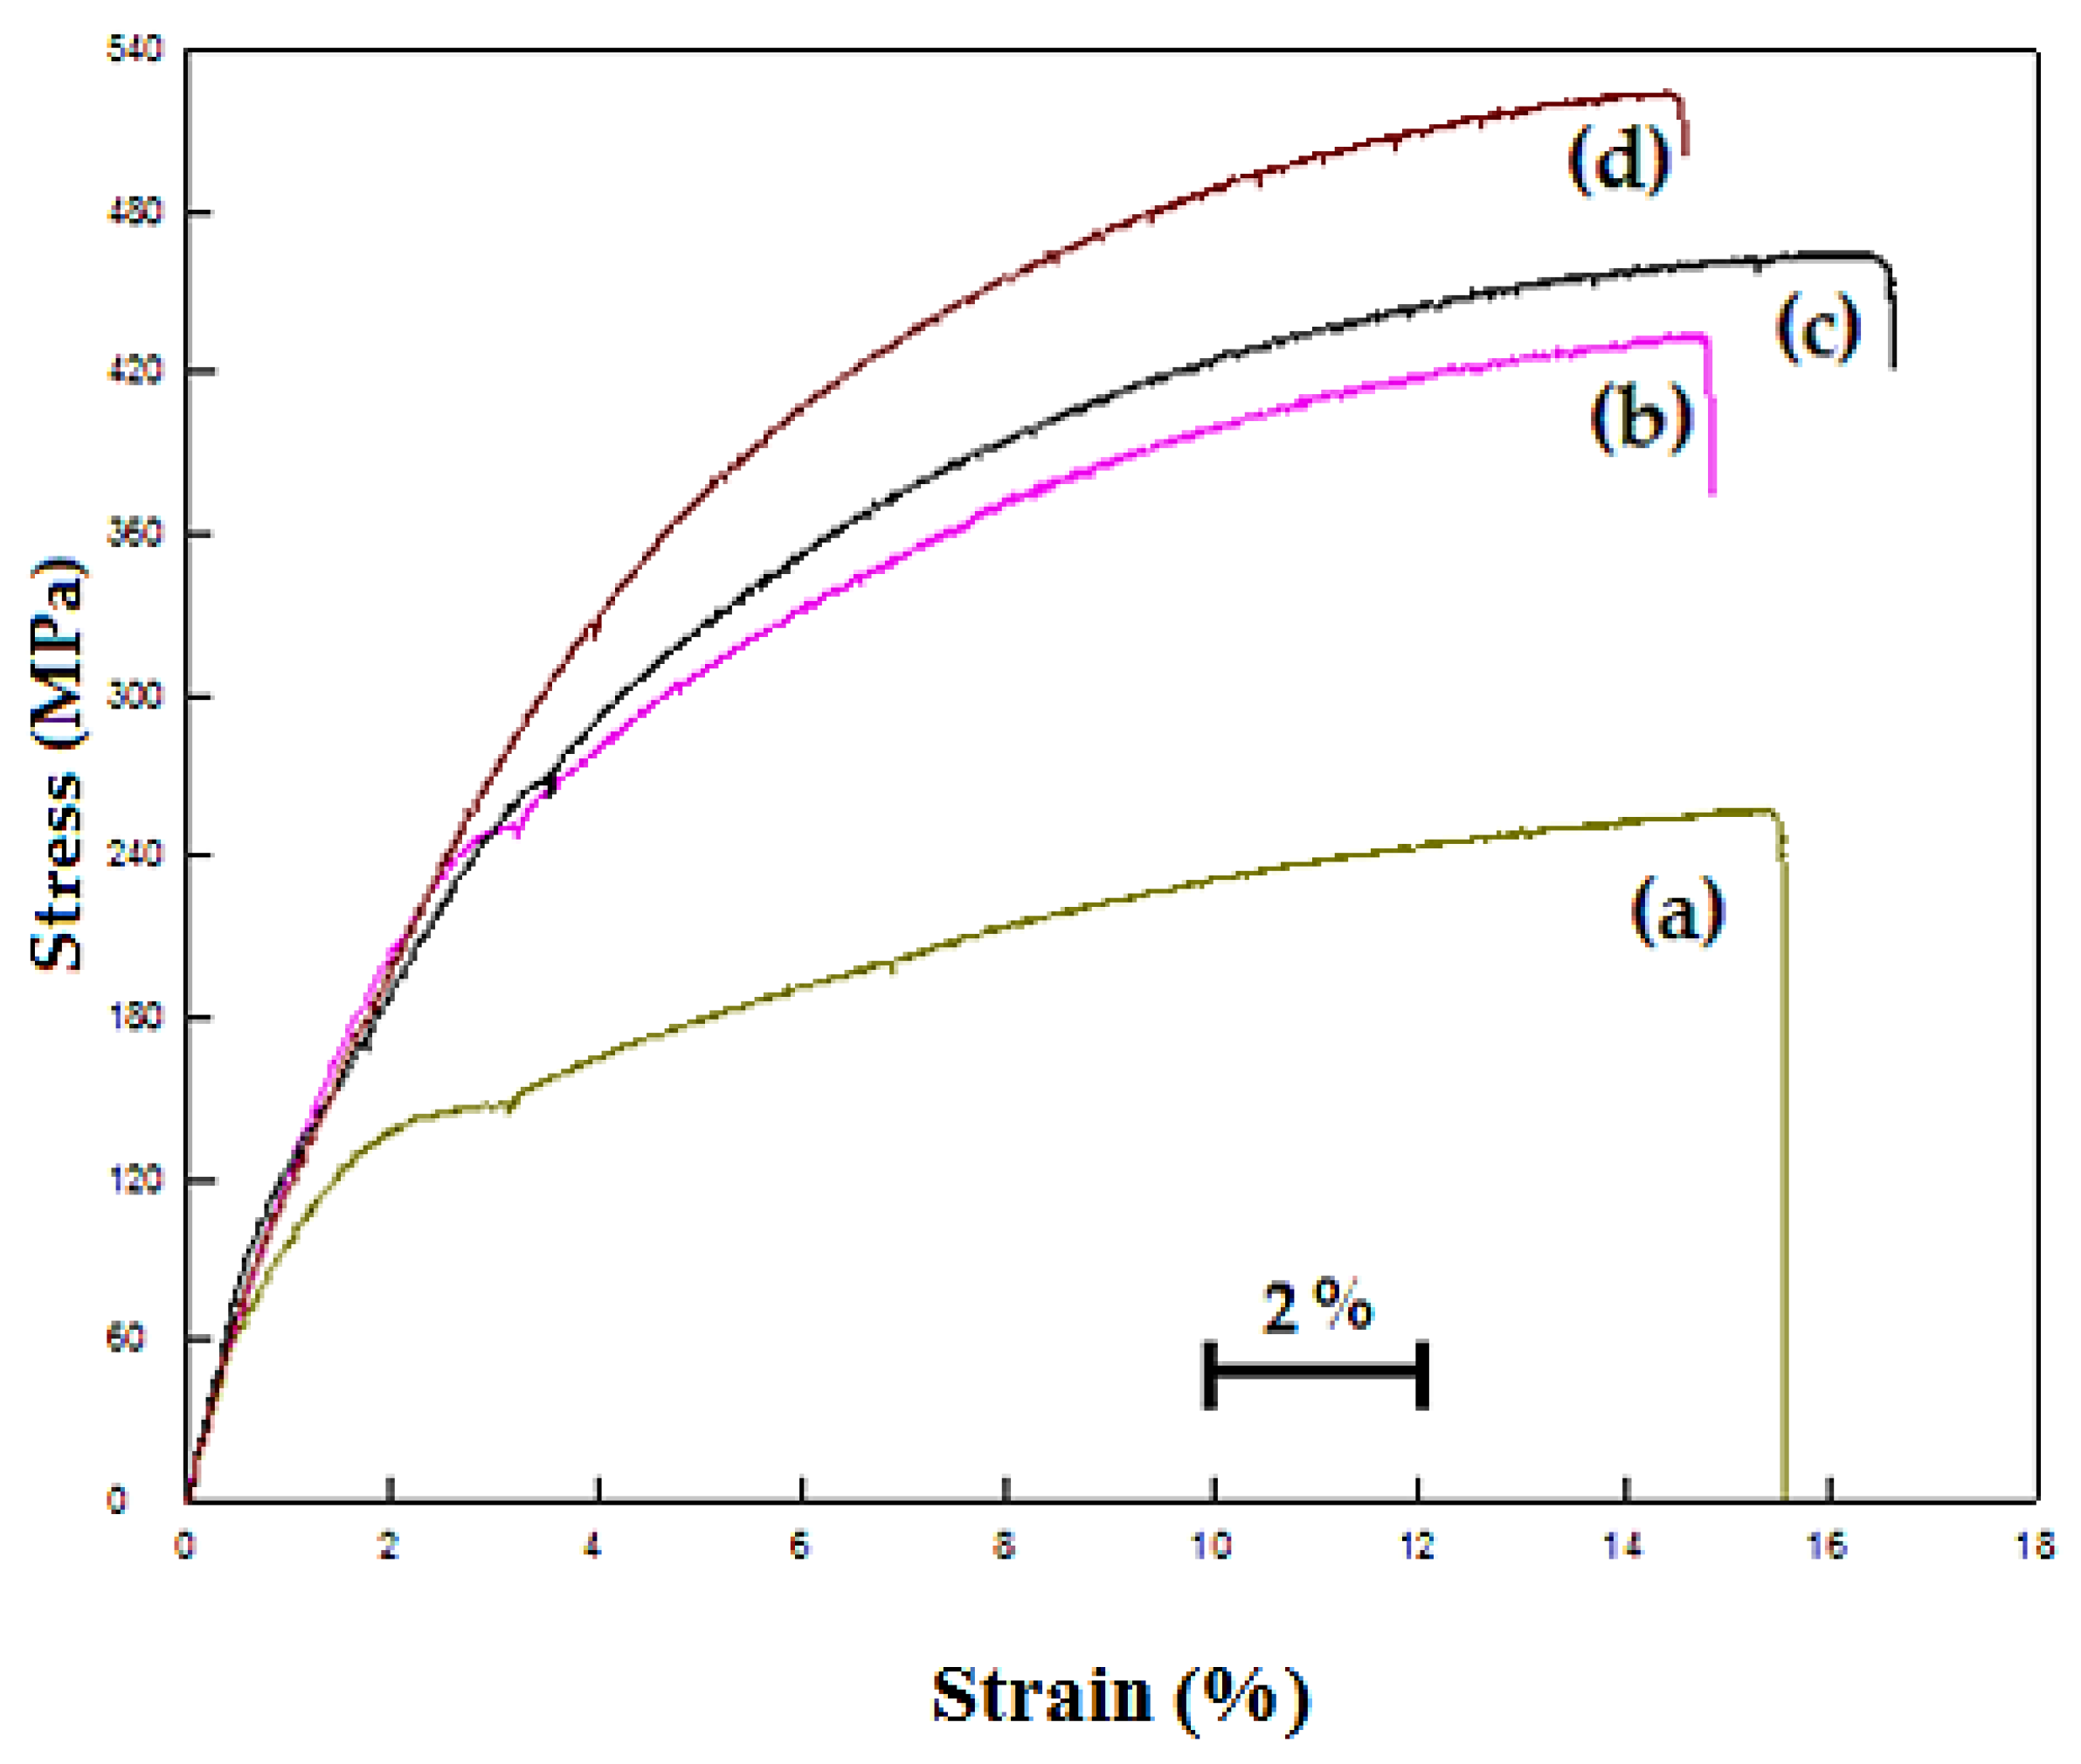
Figure 6 shows the stress-strain diagrams of the specimens. The figures demonstrate that the yield point elongation decreased as the amount of Nb-V increased. Moreover, the yield point elongation of non-alloyed steels was longer than that of Nb-V microalloyed steels. This is a result of the Cottrell atmosphere around the carbon atoms of the dislocations. Davies [24] showed that free carbon atoms in solid solution diffuse into the dislocations of ferrite resulting in less movement and an elongated yield point. When the weight percentage of Nb-V increased to 0.1%, 0.15% or 0.2%, yield point elongation decreased to 1.5%, 0.6% and 0.4%, respectively. This situation showed that VC and NbC precipitates were formed in the Nb-V microalloyed PM steel and that the amount of free carbon atoms in solid solution resulted in a decrease in yield point elongation. In their study, Lou and Northwood [25] explain the reason why the yield point elongation decreased: decreasing carbon and nitrogen atom diffusivity, decreasing solubility of interstitial atoms and decreasing density of interstitial atoms in the Cottrell atmosphere. Yield point elongation is related to the density of atoms that prevent the dislocations. Precipitation of carbon and nitrides decreases the atom density around the dislocations leading to a decrease in yield point elongation. The addition of elements to the steel, forming stable carbide and nitride, can eliminate the continuous yield behavior by taking carbon and nitrogen atoms from the solid solution [26]. However, free interstitial atoms may still exist in the solid solution although the alloying elements are added to the steel. In the present experimental work, the concentration of solute atoms decreases with the increase in the weight percentage of Nb-V due to the precipitation of NbC(N) and VC(N). As a result of this, the yield point elongation of microalloyed PM steel decreased with the increase in the weight percentage of Nb-V.
In this study, the solubility product of VC precipitates at 1150 °C was calculated by using Equation (4) given by Narita [27].
The solubility of VC precipitates was calculated as 1.1. This was surprising, as it is higher than the solubility values of carbides and nitrides reported in the literature for the same temperature. This result shows that VC can dissolve completely at a sintering temperature of 1150 °C and that free vanadium and carbon atoms exist in the solid solution. Vanadium dissolved during the sintering process precipitates as VC, VCN, VN and VCN during austenite-ferrite transformation or in the ferrite phase, improving the mechanical properties of microalloyed steel compared to non-alloyed steels [26]. It is known that the formation of carbonitride precipitates in niobium and vanadium microalloyed steels plays an important role in controlling the microstructure and mechanical properties. Ferrite grain size is affected from the fine precipitates formed during and after austenite-ferrite transformation, and these precipitates contribute to the formation of fine ferrite grains [28].
Dissolved vanadium and carbon atoms, on the other hand, precipitate in the ferrite during the austenite-ferrite transformation after sintering, resulting in an increase in hardness. The most important reason for using vanadium is that it causes precipitation hardening in steel. Vanadium dissolves well in austenite, though it dissolves significantly less in the ferrite phase [3]. Therefore, vanadium is used widely to promote precipitation hardening, not only in vanadium steels but also in niobium steels [4].
According to stochiometry, niobium (atomic weight 92.9) and vanadium (atomic weight 50.9) should combine with carbon (atomic weight 12) at one-fourth of their weight. Alloying element amounts in microalloyed PM steels containing 0.1%, 0.15% and 0.2% Nb-V by wt. are not enough to combine with all carbon atoms in the alloy. This implies that some amount of free carbon exists in the solid solution along with formations of precipitates (e.g., NbC, VC and NbVC(N)) during the sintering process. In some studies [20,29], it was shown that the existence of several microalloying elements in alloy can result in differing combinations of carbides and nitrides. These precipitates then play a more effective role in improving strength. Since the amount of free carbon and nitrogen decreases in solid solutions by precipitation, the effect of solid solution hardening on strength decreases [30,31]. Therefore, it can be said that increasing the strength of microalloyed PM steel can be explained by the presence of NbC, VC and NbVC(N) precipitates formed in the steel.
Figure 5 show that, in general, increasing the Nb-V ratio increases the yield strength, tensile strength and hardness value. This variation in strength values is caused by the formation of precipitates such as NbC(N) and VC(N), and their distribution in the matrix at different sizes [6,8]. Carbides and nitrides formed by alloying elements have different solubility values, as well as differing formation kinetics. As such, this situation affects the mechanical properties of the steel differently. For example, some precipitates (e.g., NbC, AlN and TiN) prevent austenite grain growth and recrystallization, while others (e.g., VC, VC(N)) cause precipitation hardening in the ferrite phase [32]. Microalloyed steels today require the use of several microalloying elements together in order to obtain different mechanical properties. For example, Nb is added to steel to prevent recrystallization and provide dispersion hardening. Vanadium, on the other hand, decreases the pearlite lamellar spacing by decreasing the austenite-ferrite conversion temperature. This produces tiny VC precipitates in the ferrite phase of pearlite [3]. These precipitates form during the sintering process conducted at 1350 °C, as well as in the cooling stage after sintering.
In this study, the solubility of NbC precipitates at 1350 °C was also calculated using Equations(4) and (5) given by Narita [27].
Using these calculations, the solubility of NbC precipitates at 1350 °C is found at 3.6 × 10⁻² respectively. This indicated that some free niobium and carbon atoms should exist in the solution during the sintering process at 1350 °C. Free niobium and carbon atoms in the structure precipitate as NbC, depending on the cooling rate. This improves the strength of steel with VC(N).
The relationship between yield strength and grain size of metals was first defined by Hall [33] and Petch [34], both theoretically and experimentally. The equation that gives the relationship is called the Hall-Petch equation. However, precipitation hardening and cluster hardening also affect the mechanical properties (i.e., yield strength of steel). Therefore, Equation (6) developed by Pickering and Gladman [35] was used to calculate the σp value, including precipitation hardening and cluster hardening.
σy = 54 + 17.4d−1/2 + σp
In this equation, σy is yield stress, 54 MPa is friction stress required for dislocation movement in grain boundary, 17.4 MPa is the Hall-Petch Factor, d is the grain size and σp is the contribution of precipitation and cluster hardening as MPa. The Hall-Petch Factor is a coefficient representing the block effect of grain boundaries on the dislocation movement at the initial stage of plastic deformation.
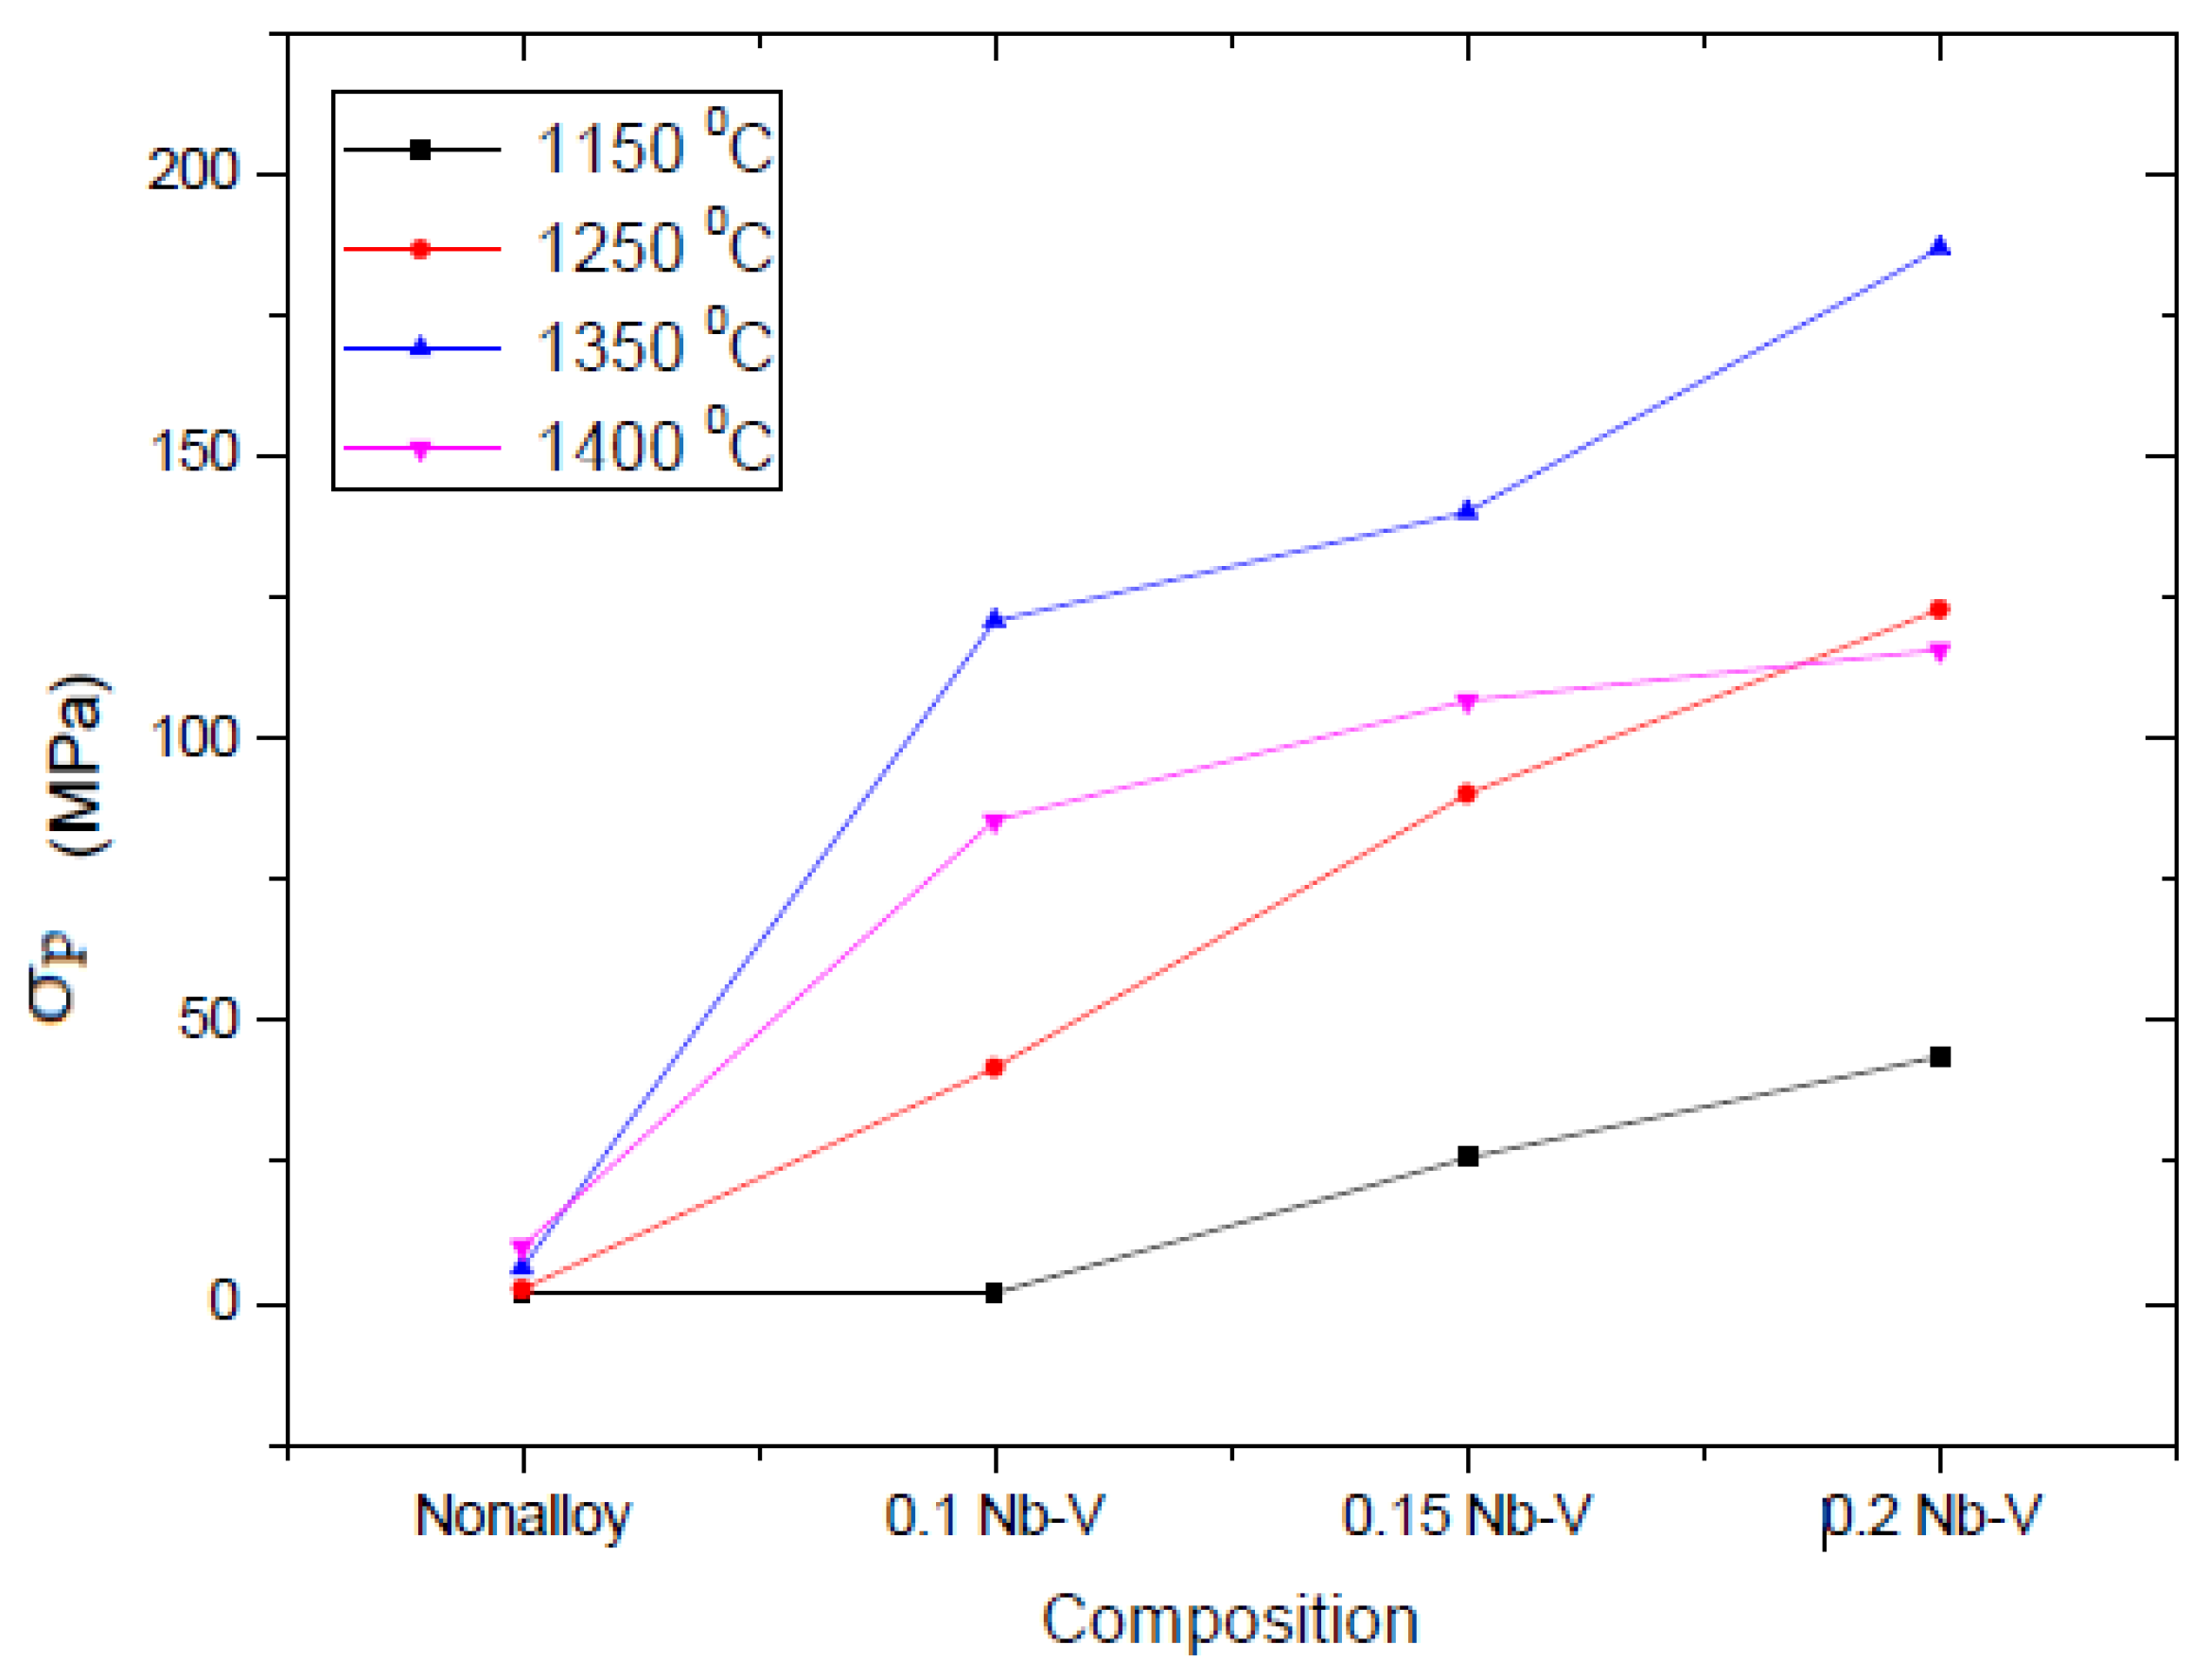
The σp value of non-alloyed and microalloyed PM specimens is found by subtracting the actual yield strength from the calculated yield strength. The σp values of these specimens ranged from 1.81 MPa to 186.77 MPa, according to the type and amount of alloying element and sintering temperature (see Figure 7 and Table 4). The highest σp value was observed in Alloy 4, which was sintered at 1350 °C. This value was found because Alloy 4 had more precipitation and cluster hardening compared to other microalloyed steels. Under normal conditions, NbC may precipitate at elevated temperatures [36]. Moreover, niobium provides a significant increase in strength by producing hard and stable carbides, nitride and carbo-nitride precipitates. The maximum strength and hardness in the Fe-C system is found at niobium levels of 0.15%–0.2%. The results indicated that the effect of niobium in dispersion strengthening is higher than that of vanadium. Niobium also increases the strength more than vanadium by increasing the pearlite ratio and forming small grains [6,7].
As an important aspect in powder metallurgy, density also affects the mechanical properties of steel. This is because the residual voids formed after sintering decrease the strength, heat transfer and cooling rate of the material. These voids are critical for the initiation and propagation of cracks. Formability and toughness is largely dependent on density, such that they are high when density is high [37,38]. In this study, density increased with the sintering temperature. The specimens with the highest density were those sintered at 1400 °C. The density values of the non-alloyed and microalloyed PM steels, however, are generally similar (between 92% and 94%), depending on the sintering temperatures. Past studies to characterize precipitation in microalloyed steels have been mainly carried out using the transmission electron microscopy (TEM) of extraction replicas and thin foils [14,15,16,38]. However, in the present work SEM and EDS analyses have been used to describe the precipitates occurring under different conditions, because the porosities of the samples in this study were so high (≥6%) that the preparation of the samples for transmission electron microscope examinations was not possible [5,39,40]. Gündüz et al. showed the XRD precipitate peaks of the filter residue of Nb-Al microalloyed PM steel by using chemical or electrochemical procedures. They also indicated that the porosity of the samples in their study was so high (≥7%) that transmission electron microscope samples of the steel could not be prepared [8].
The EDS analysis results showed that vanadium and niobium elements existed in the solution as precipitates (Figure 8 and Figure 9). SEM micrographs of various Nb-V compounds in Figure 7 reveal precipitates with different sizes. Zajac et al. [41] investigated the precipitation behavior of low carbon microalloyed steel containing titanium and vanadium. They showed that both TiN and VN precipitate in the austenite, forming Ti,V(N) precipitates when titanium is added to the steel. By chemical analysis, they were able to determine that the inner part of precipitates is rich in titanium, while the outer part is rich in vanadium. This means that vanadium precipitates into TiN, ultimately forming Ti,V(N). The EDS point analysis taken from the precipitate contained both vanadium and niobium, and the amount of carbon is clearly higher when compared with the EDS point analysis taken from the matrix (see Figure 8). It is thought that this precipitate was formed as Nb,V(C). Comparing the EDS point analysis results in this study to that of previous literature, it is evident that precipitates like VC and NbC exist in microalloyed PM steels.
The EDS line analysis also revealed that the type and number of elements in Alloy 3 sintered at 1350 °C varied along the line intersecting with the matrix and precipitates (see Figure 9). Though the matrix phase is rich in iron, the spherical precipitate is rich in niobium. There is a sharp increase in the amount of niobium at the intersection of the analysis line with precipitates. The precipitates observed in PM steel samples by using SEM and EDS analyses are known to have significant effects upon recrystallization and austenite grain growth [6].
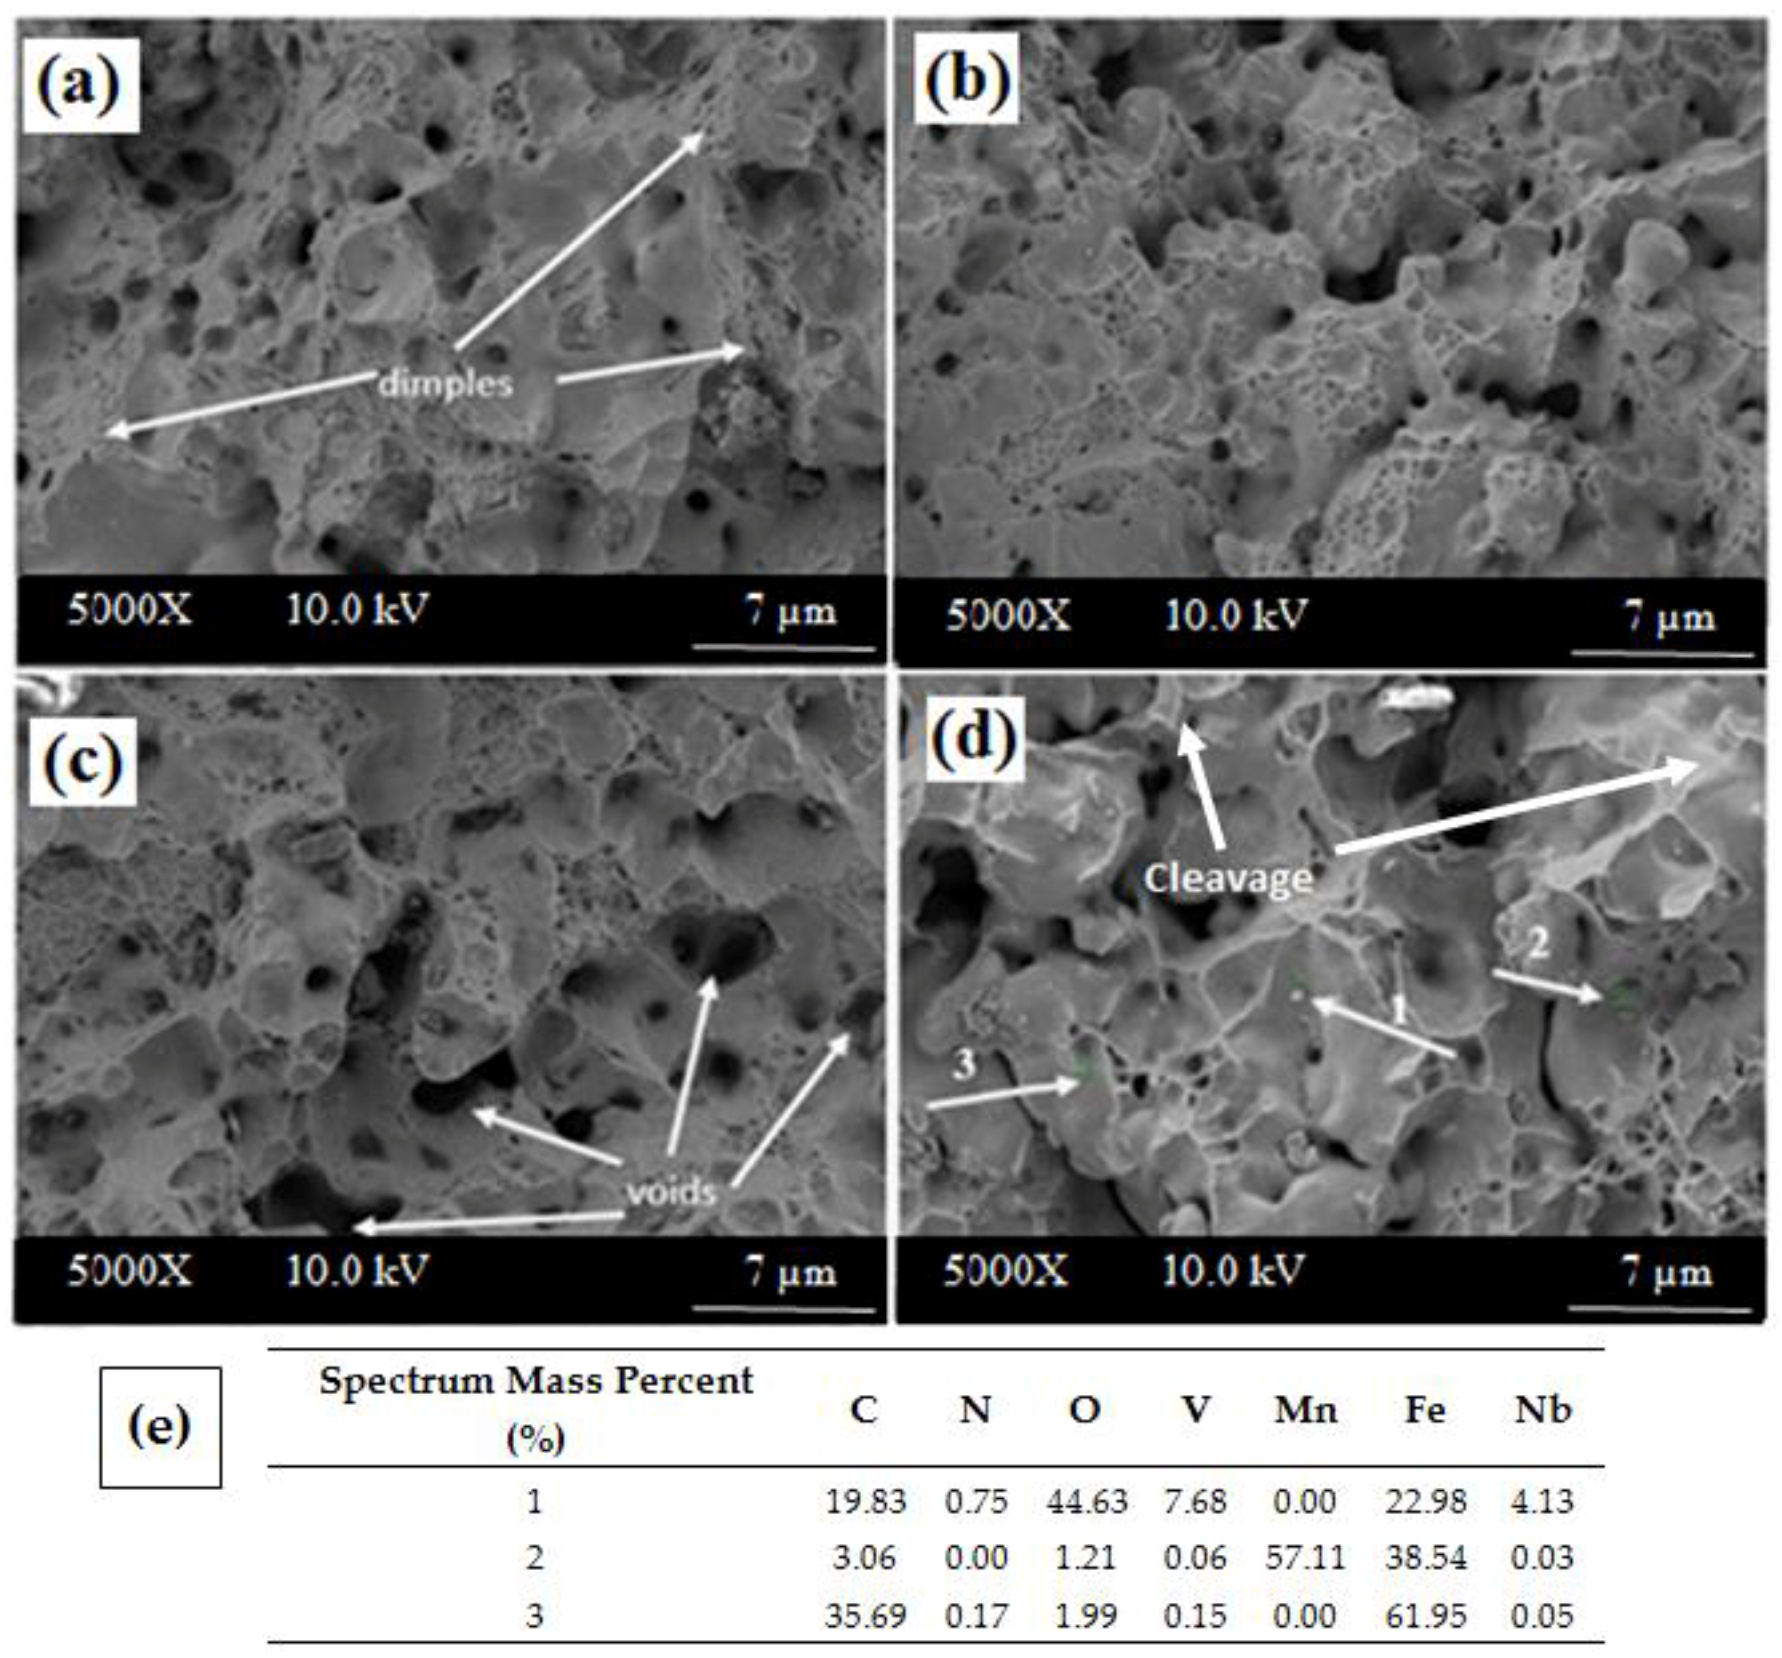
Figure 10 shows the fracture surfaces of Alloys 1–4 sintered at 1350 °C after tensile testing. Changes were observed on the fracture surfaces of all alloys with respect to the size, shape and depth of the microvoids. SEM pictures (Figure 10) of different amounts of Nb-V containing specimens indicate that the fracture surfaces are partially ductile (honeycomb structure) and partially brittle (cleavage plane). Voids were evident throughout the fracture surface in its entirety. This situation indicates that fractures propagate by the coalescence of microvoids. Cleavage planes, however, were most prominent in the alloy containing 0.2% Nb-V (Alloy 4), somewhat prominent in the alloy containing 0.15% Nb-V (Alloy 3) and least prominent in the alloy containing 0.1% Nb-V (Alloy 2). These planes are an indication of brittle fracture. Large voids were seen in the alloy containing 0.15% Nb-V (Alloy 3) sintered at 1350 °C (Figure 10c). These voids indicate that precipitates like VC and NbC detach from the surface during tensile tests. Shanmugasundaram and Chandramouli [41] observed these kinds of voids in PM steel containing Cr, Ni and Mo. They attributed them to the separation of carbides from the surface during the tensile test. The Nb-C based particle inside the large microvoids of microalloyed PM steel are clearly shown in the SEM fracture surfaces and corresponding EDS results (see Figure 10e). Erden et al. [1] investigated the tensile behavior of sintered Ti microalloyed PM steel as well. They observed mixed (ductile-brittle) type fractures in the microalloyed steel due to the presence of carbides and the carbides pull-off during heavy deformation.
4. Conclusions
- Among the sintering temperatures, 1350 °C was found to be the most suitable temperature in terms of yield and tensile strengths and hardness.
- Increasing the amount of microalloying elements of Nb-V led to the highest yield and tensile strengths and highest hardness. The addition of these elements resulted in precipitates.
- EDS analysis results reveal the presence of NbC and VC in the microstructure of the microalloyed PM steels which affected the mechanical properties of the PM steels.
- The SEM images of the fracture surfaces of non-alloyed PM steel showed a ductile type fracture, while the microalloyed PM steel showed both ductile and brittle fractures.
Acknowledgments
This work was supported by Scientific Research Projects Coordination Unit of Karabük University (Karabük, Turkey). Project Number: KBÜ-BAP-15/2-KP-058 and KBÜ-BAP-17-DS-029.
Conflicts of Interest
The author declares no conflict of interest.
References
- Erden, M.A.; Gündüz, S.; Türkmen, M.; Karabulut, H. Microstructural characterization and mechanical properties of microalloyed powder metallurgy steels. Mater. Sci. Eng. A 2014, 616, 201–206. [Google Scholar] [CrossRef]
- Karabulut, H.; Türkmen, M.; Erden, M.A.; Gündüz, S. Effect of different current values on microstructure and mechanical properties of microalloyedsteels joined by the submerged arc welding method. Metals 2016, 6, 281. [Google Scholar] [CrossRef]
- Erden, M.A.; Gündüz, S.; Karabulut, H.; Türkmen, M. Effect of V addition on the microstructure and mechanical properties of low carbon microalloyedpowder metallurgy steels. Mater. Test. 2016, 58, 433–437. [Google Scholar] [CrossRef]
- Gladman, T. The Physical Metallurgy of Microalloyed Steels, 1st ed.; The Institute of Materials: London, UK, 1997. [Google Scholar]
- Erden, M.A. An Investigation on the Relation Sheep Between Microstructure and Mechanical Properties of Microalloyed Steels Produced by Powder Metallurgy. Ph.D. Thesis, Karabük University Natural and Applied Science Department of Manufacturing Engineering, Karabük, Turkey, 2015. [Google Scholar]
- Gündüz, S.; Erden, M.A.; Karabulut, H.; Türkmen, M. Effect of the addition niobium and aluminium on the microstructure and mechanical properties of the micro-alloyed PM steels. Mater. Technol. 2016, 50, 641–648. [Google Scholar] [CrossRef]
- Özdemirler, D.; Gündüz, S.; Erden, M.A. Influence of NbC addition on the sintering behaviour of medium carbon PM steels. Metals 2017, 7, 121. [Google Scholar] [CrossRef]
- Gündüz, S.; Erden, M.A.; Karabulut, H.; Türkmen, M. The effect of vanadium and titanium on mechanical properties of microalloyed PM steel. Powder Metall. Met. Ceram. 2016, 55, 277–287. [Google Scholar] [CrossRef]
- Schade, C.; Murphy, T.; Lawley, A.; Doherty, R. Microstructure and mechanical properties of PM steels alloyed with silicon and vanadium. Int. J. Powder Metall. 2012, 48, 41–48. [Google Scholar]
- ASTM E8/E8M. Standard Test Methods for Tension Testing of Metallic Materials; ASTM International: West Conshohocken, PA, USA, 2013. [Google Scholar]
- Brand, W.A. 1001 Statistics Practice Problems for Dummies; John Wiley and Sons. Inc.: Hoboken, NJ, USA, 2014. [Google Scholar]
- ASTM B328-96. Standard Test Method for Density, Oil Content, and Interconnected Porosity of Sintered Metal Structural Parts and Oil-Impregnated Bearings; ASTM International: West Conshohocken, PA, USA, 2004. [Google Scholar]
- Fischmeister, H.F. Applications of quantitative microscopy in materials engineering. J. Microsc. 1972, 95, 119–143. [Google Scholar] [CrossRef]
- Gladman, T.; Woodhead, J. The accuracy of point counting in metallographic investigation. J. Iron Steel Inst. 1960, 194, 189–193. [Google Scholar]
- Askeland, D.R. The Science and Engineering of Materials, 1st ed.; Chapman and Hall: London, UK, 1996. [Google Scholar]
- Jung, J.G.; Park, J.S.; Kim, J.; Lee, Y.K. Carbide precipitation kinetics in austenite of a Nb-Ti-V microalloyed steel. Mater. Sci. Eng. A 2011, 528, 5529–5535. [Google Scholar] [CrossRef]
- Baker, T.N. Processes, microstructure and properties of vanadium microalloyed steels. Mater. Sci. Technol. 2009, 25, 1083–1107. [Google Scholar] [CrossRef] [Green Version]
- Hernandez, D.; López, B.; Rodriguez-Ibabe, J.M. Ferrite grain size refinement in vanadium microalloyed structural steels. Mater. Sci. Forum 2005, 500, 411–418. [Google Scholar] [CrossRef]
- Misra, R.D.K.; Tenneti, K.K.; Weatherly, G.C.; Tither, G. Microstructure and texture of hot-rolled Cb-Ti and V-Cb microalloyed steels with differences in formability and toughness. Metall. Trans. A 2003, 34, 2341–2351. [Google Scholar] [CrossRef]
- Rodrigues, P.C.M.; Pereloma, E.V.; Santos, D.B. Mechanical properties of an HSLA bainitic steel subjected to controlled rolling with accelerated cooling. Mater. Sci. Eng. A 2014, A283, 136–143. [Google Scholar]
- Dutta, B.; Sellars, C.M. Strengthening of austenite by niobium during hot rolling of Microalloyed steel. Mater. Sci. Technol. 1986, 2, 146–153. [Google Scholar] [CrossRef]
- Du, B.; Zou, Z.; Wang, X.; Li, Q. In situ synthesis of TiC-TiB2 reinforced FeCrSiB composite coating by laser cladding. Surf. Rev. Lett. 2007, 14, 315–319. [Google Scholar] [CrossRef]
- Chokkalingam, B.; Nazirudeen, S.S.M.; Ramakrishnan, S.S. Investigation into the mechanical properties of micro-alloyed as-cast steel. Mater. Technol. 2011, 45, 159–162. [Google Scholar]
- Davies, R.G.; Kot, R.A.; Bramfitt, B.L. Fundamentals of Dual Phase Steels, 1st ed.; AIME: New York, NY, USA, 1981; pp. 265–277. [Google Scholar]
- Lou, S.; Northwood, D.O. Effect of temperature on the lower yield strength and static strain ageing in low-carbon steels. J. Mater. Sci. 1995, 30, 1434–1438. [Google Scholar] [CrossRef]
- Gladman, T. The physical metallurgy of microalloyed steels. Mater. Sci. Technol. 1999, 15, 30–36. [Google Scholar] [CrossRef]
- Narita, K. Physical chemistry of the groups IVa(Ti,Zt), Va(V,Nb,Ta). Trans. ISIJ 1975, 15, 145–152. [Google Scholar]
- Jahazi, M.; Eghbali, B. The influence of hot forging conditions on the microstructure and mechanical properties of two microalloyed steels. J. Mater. Process. Technol. 2001, 113, 594–598. [Google Scholar] [CrossRef]
- Jia, Z.; Misra, R.D.K.; Malley, R.O.; Jansto, S.J. Fine-scale precipitation and mechanical properties of thin slab processed titanium-niobium bearing high strength steels. Mater. Sci. Eng. A 2011, A528, 7077–7083. [Google Scholar] [CrossRef]
- Najafi, H.; Rassizadehghani, J.; Halvaaee, A. Mechanical properties of as cast microalloyed steels containing V, Nb and Ti. Mater. Sci. Technol. 2007, 23, 699–705. [Google Scholar] [CrossRef]
- Guang, X.; Xiaolong, G.; Guojun, M.; Feng, L.; Hang, Z. The development of Ti alloyed high strength microalloy steel. Mater. Des. 2010, 31, 2891–2896. [Google Scholar]
- Llewellyn, D.T.; Hudd, R.C. Steels: Metallurgy and Applications, 3rd ed.; Reed Educational and Professional Publishing Ltd.: Oxford, UK, 1998; pp. 15–40. [Google Scholar]
- Hall, E.O. The deformation and ageing of mild steel: III discussion of results. Proc. Phys. Soc. 1951, B64B, 747–753. [Google Scholar] [CrossRef]
- Petch, N.J. The cleavage strength of polycrystals. J. Iron Steel Inst. 1953, 174, 25–28. [Google Scholar]
- Pickering, F.B.; Gladman, T. An Investigation into Some Factors Which Control the Strength of Carbon Steels. In Metallurgical Developments in Carbon Steels; Iron & Steel Inst.: London, UK, 1963; pp. 11–20. [Google Scholar]
- Firoz, L. Comparison of Aluminium Grain Refined and Vanadium Grain Refined Spring Steels for the Manufacture of Highly Stressed Automotive Coilsprings. Master’s Thesis, University of the Witwatersrand, Johannesburg, South Africa, 2005. [Google Scholar]
- Kostryzhev, A.G.; Al Shahrani, A.; Zhu, C.; Cairney, J.M.; Ringer, S.P.; Killmore, C.R.; Pereloma, E.V. Effect of niobium clustering and precipitation on strength of an NbTi-microalloyed ferritic steel. Mater. Sci. Eng. A 2014, 607, 226–235. [Google Scholar] [CrossRef]
- Siwecki, T.; Eliasson, J.; Lagneborg, R.; Hutchinson, B. Vanadium microalloyedbainitic hot strip steels. ISIJ Int. 2010, 50, 760–767. [Google Scholar]
- Radis, R.; Kozeschnik, E. Kinetics of AlN precipitation in microalloyed steel. Modelling Simul. Mater. Sci. Eng. 2010, 18, 605–611. [Google Scholar] [CrossRef]
- Zajac, S.; Siwecki, T.; Hutchinson, B.; Attlegard, M. Recrystallization controlled rolling and accelerated cooling for high strength and toughness in V-Ti-N steels. In Proceedings of the International Symposium on Microalloyed Vanadium Steels 1990, Cracow, Poland, 24–26 April 1990; pp. 149–170. [Google Scholar]
- Shanmugasundaram, D.; Chandramouli, R. Tensile and impact behaviour of sinter-forged Cr, Ni and Mo alloyed PM steels. Mater. Des. 2009, 30, 3444–3449. [Google Scholar] [CrossRef]
Figure 1.
Scanning electron microscope (SEM) micrographs of powders; (a) graphite (<20 μm, 2000× magnification), (b) Fe (≤180 μm, 250× magnification), (c) Nb (<45 μm, 2000× magnification) and (d) V (<44 µm, 2000× magnification).
Figure 1.
Scanning electron microscope (SEM) micrographs of powders; (a) graphite (<20 μm, 2000× magnification), (b) Fe (≤180 μm, 250× magnification), (c) Nb (<45 μm, 2000× magnification) and (d) V (<44 µm, 2000× magnification).
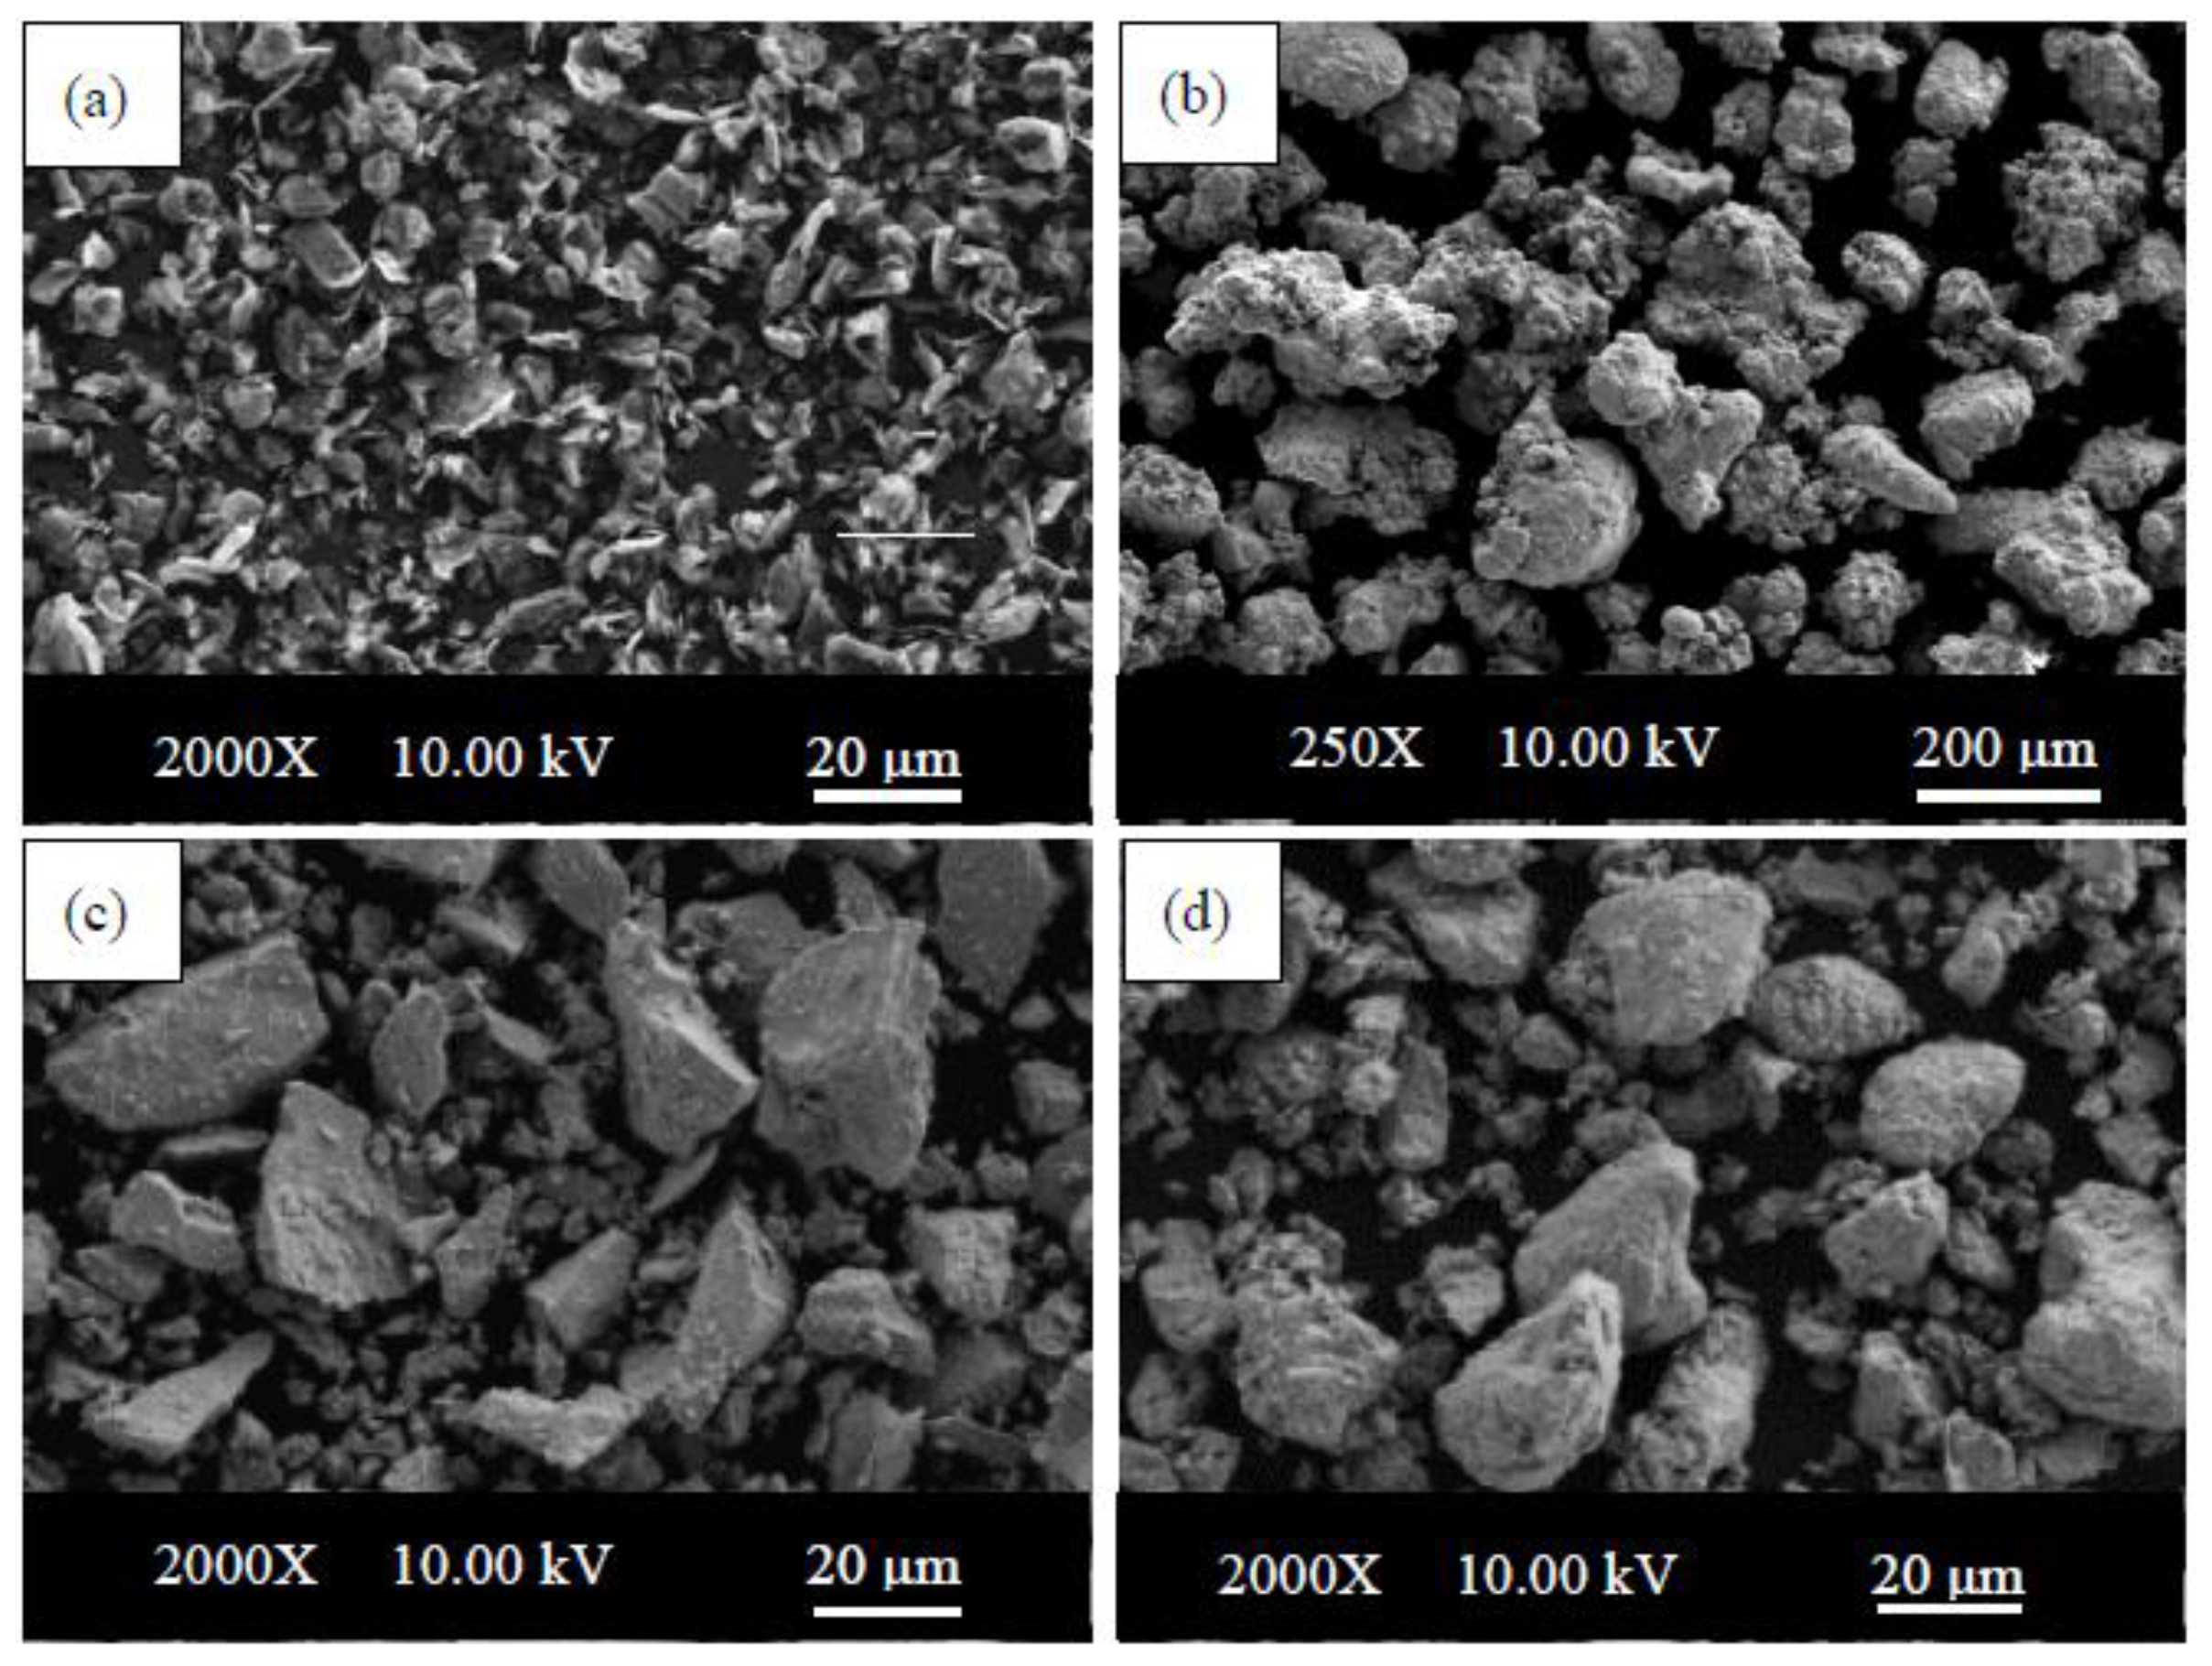
Figure 2.
General view of Alloy 2 test specimen sintered at 1350 °C for 1 h. (a) before tensile test and (b) after tensile test.
Figure 2.
General view of Alloy 2 test specimen sintered at 1350 °C for 1 h. (a) before tensile test and (b) after tensile test.
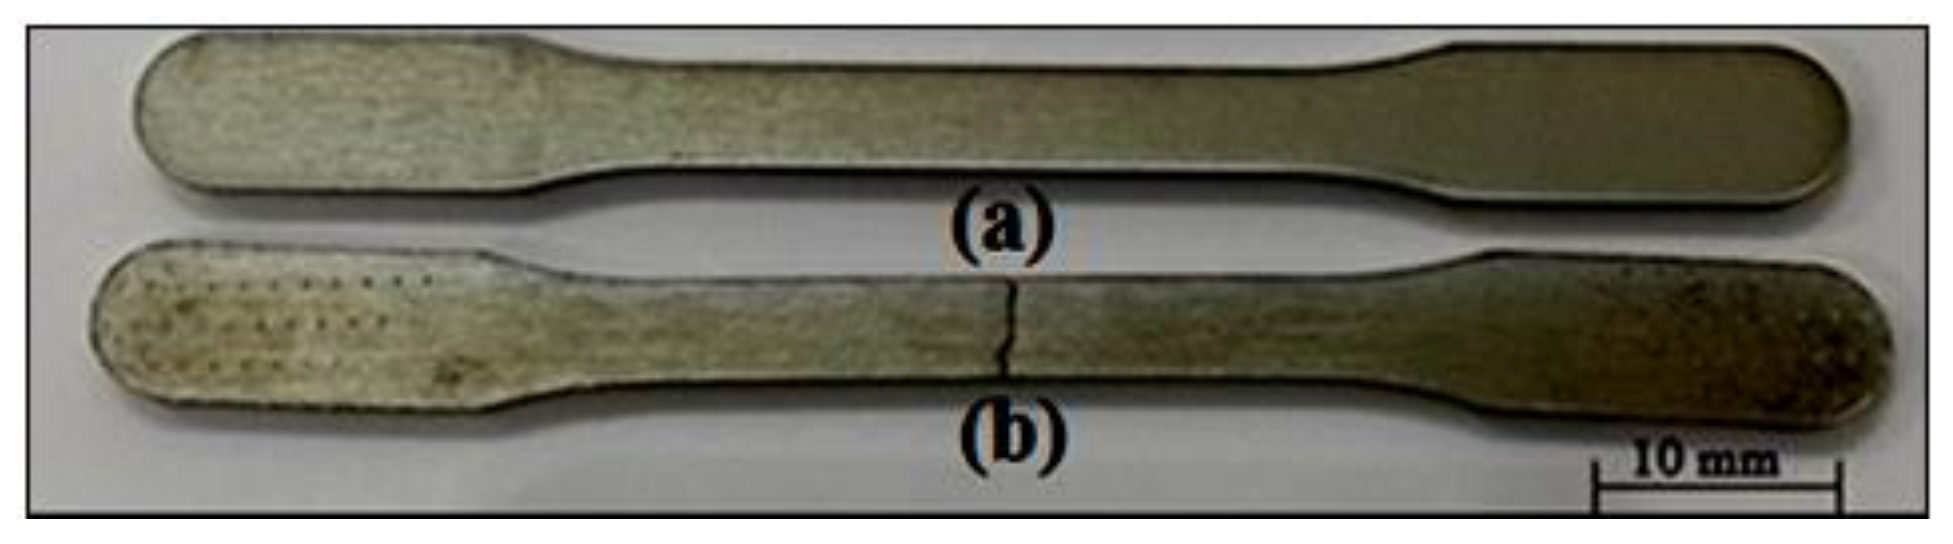
Figure 3.
Micrographs of non-alloyed PM steel specimens of Fe+0.25C sintered at various temperatures (1000×). (a) 1150 °C, (b) 1250 °C, (c) 1350 °C and (d) 1400 °C.
Figure 3.
Micrographs of non-alloyed PM steel specimens of Fe+0.25C sintered at various temperatures (1000×). (a) 1150 °C, (b) 1250 °C, (c) 1350 °C and (d) 1400 °C.

Figure 4.
Micrographs of Nb-V PM steel specimens sintered at different temperatures (500×).
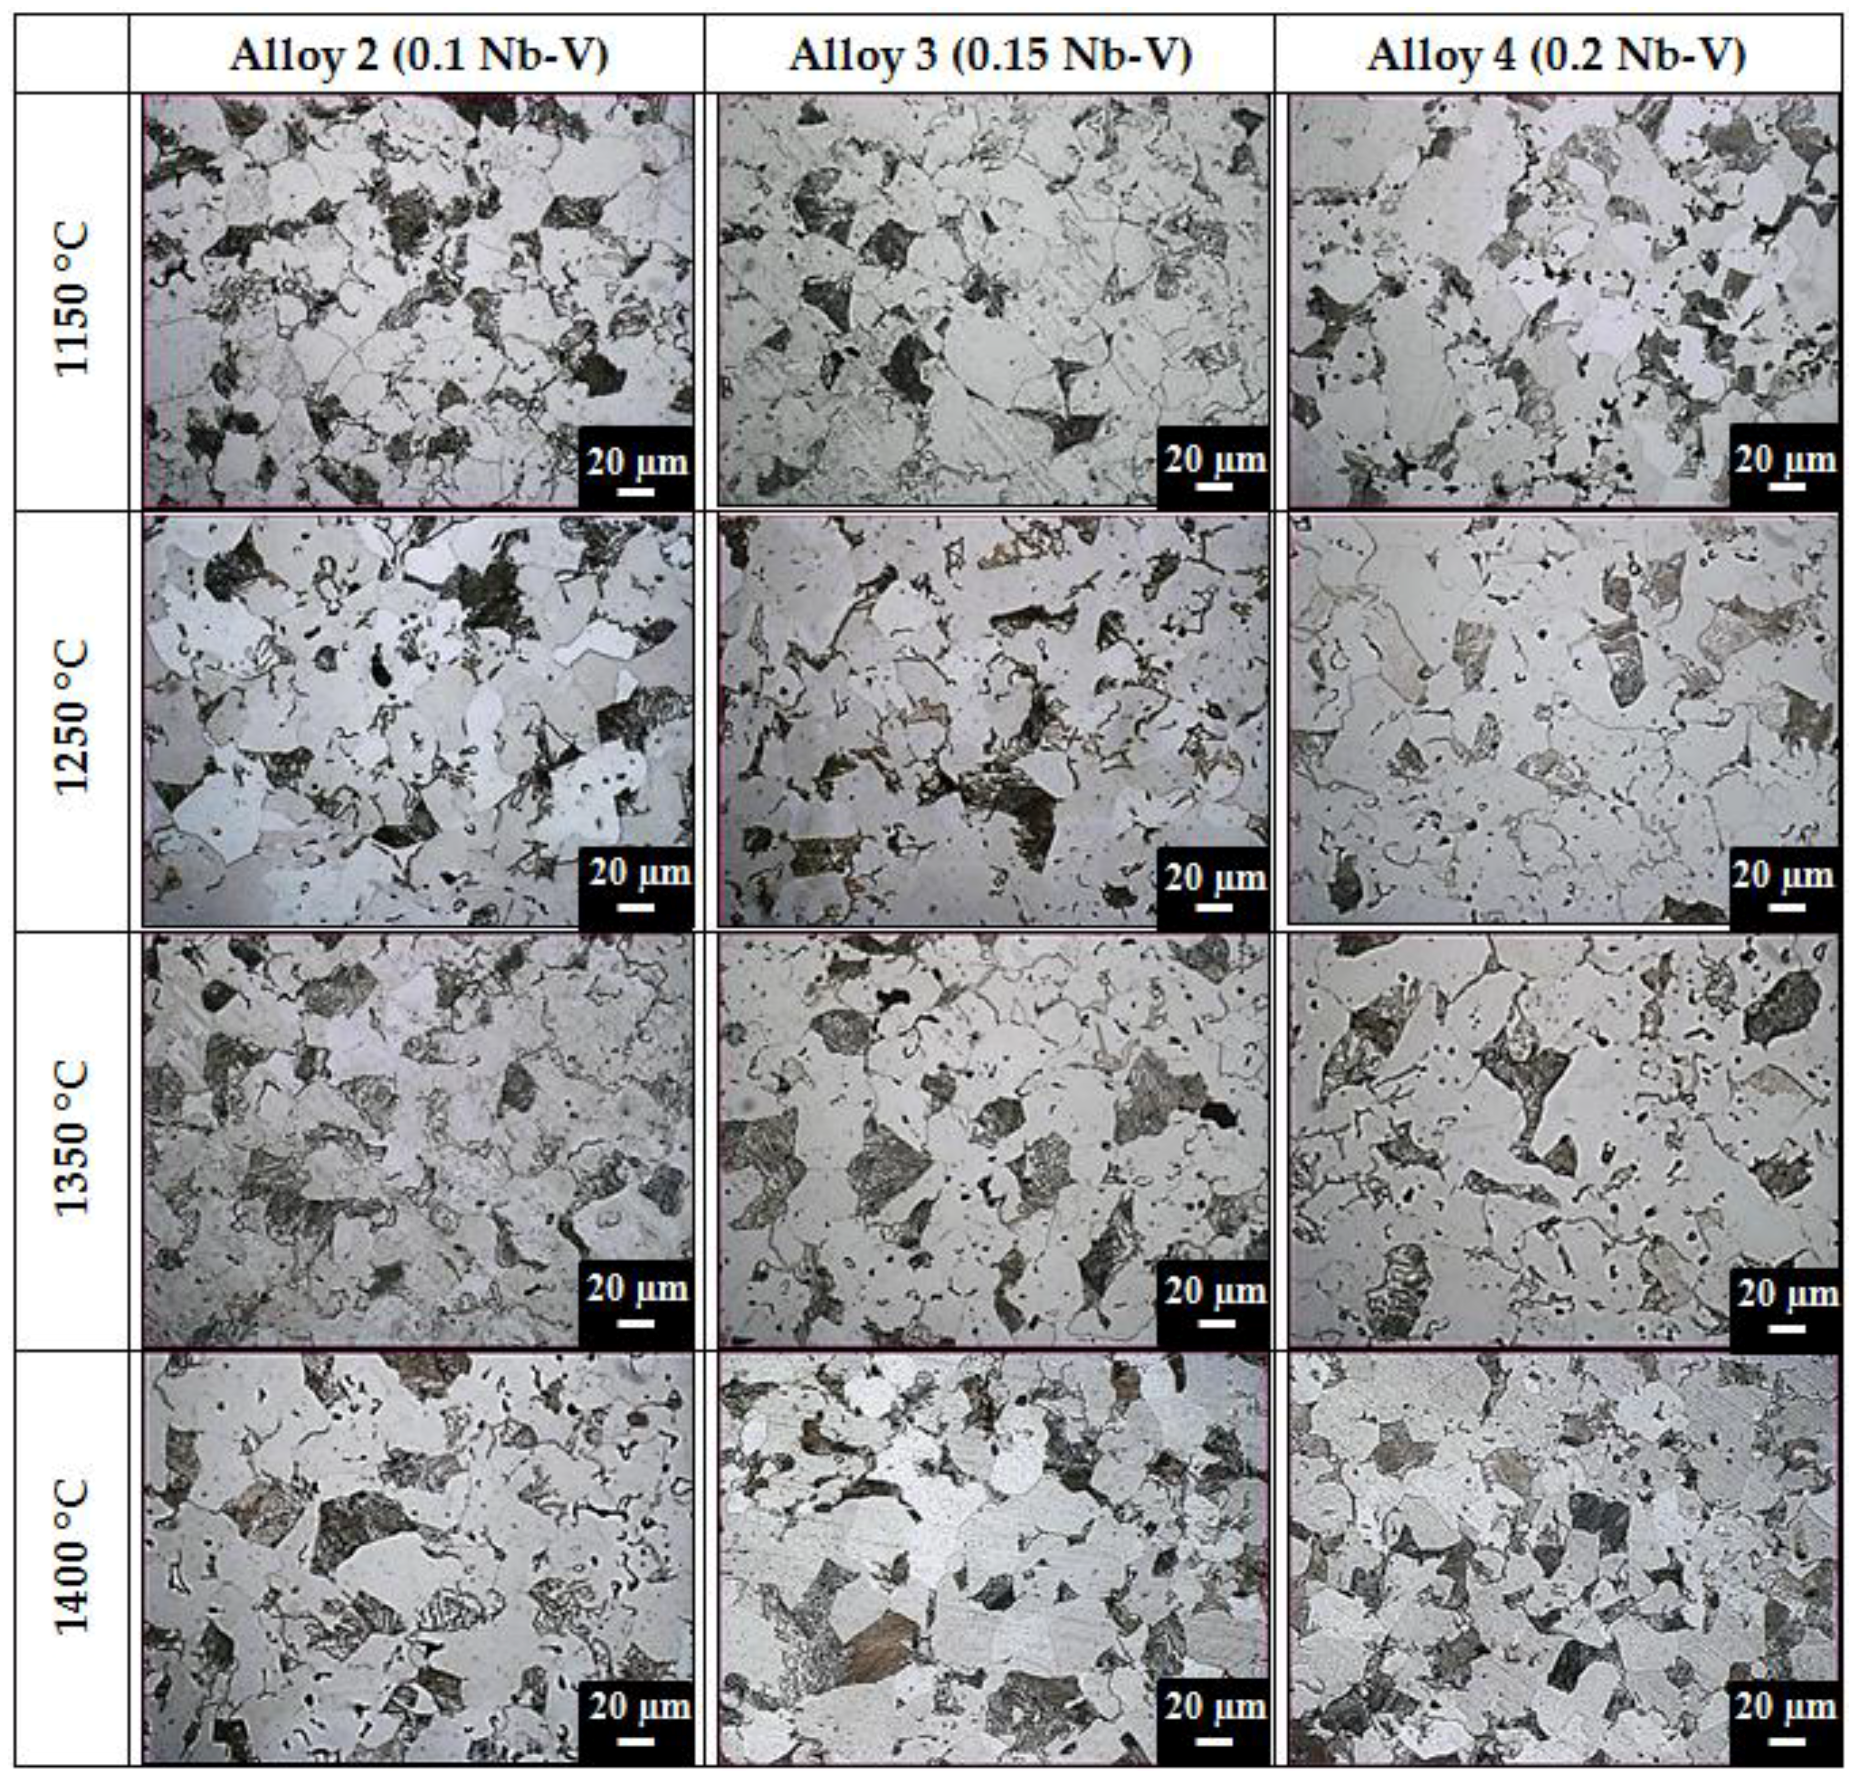
Figure 5.
Mechanical properties of the PM steel and microalloyed PM steels at different percentages of Nb-V content and different temperatures: (a) yield strength (MPa), (b) ultimate tensile strength (MPa), (c) hardness (HV0.5) and elongation % ((d) 1150 °C, (e) 1250 °C, (f) 1350 °C and (g) 1450 °C).
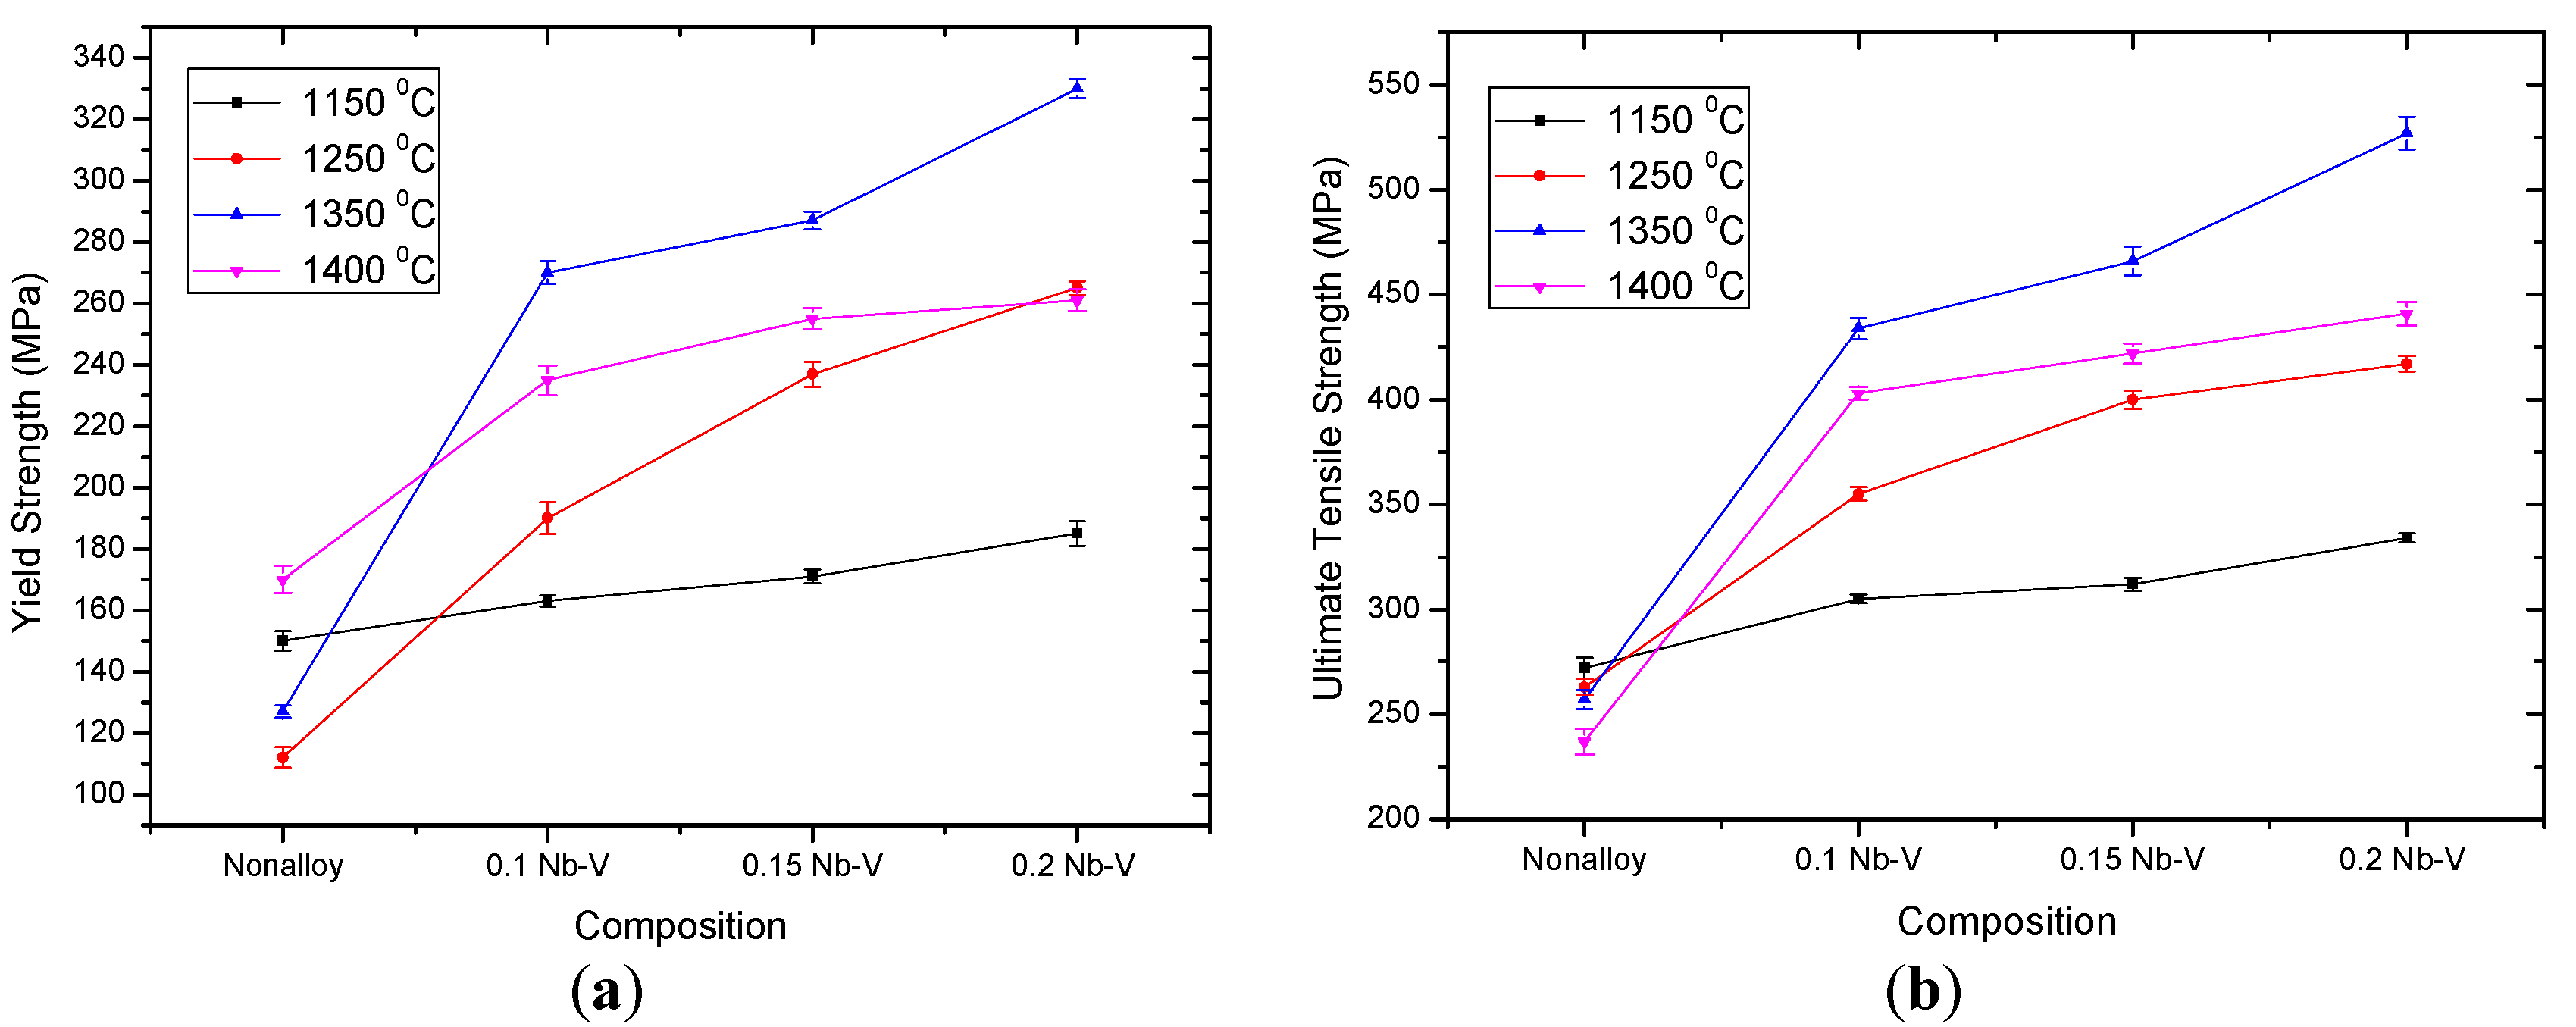
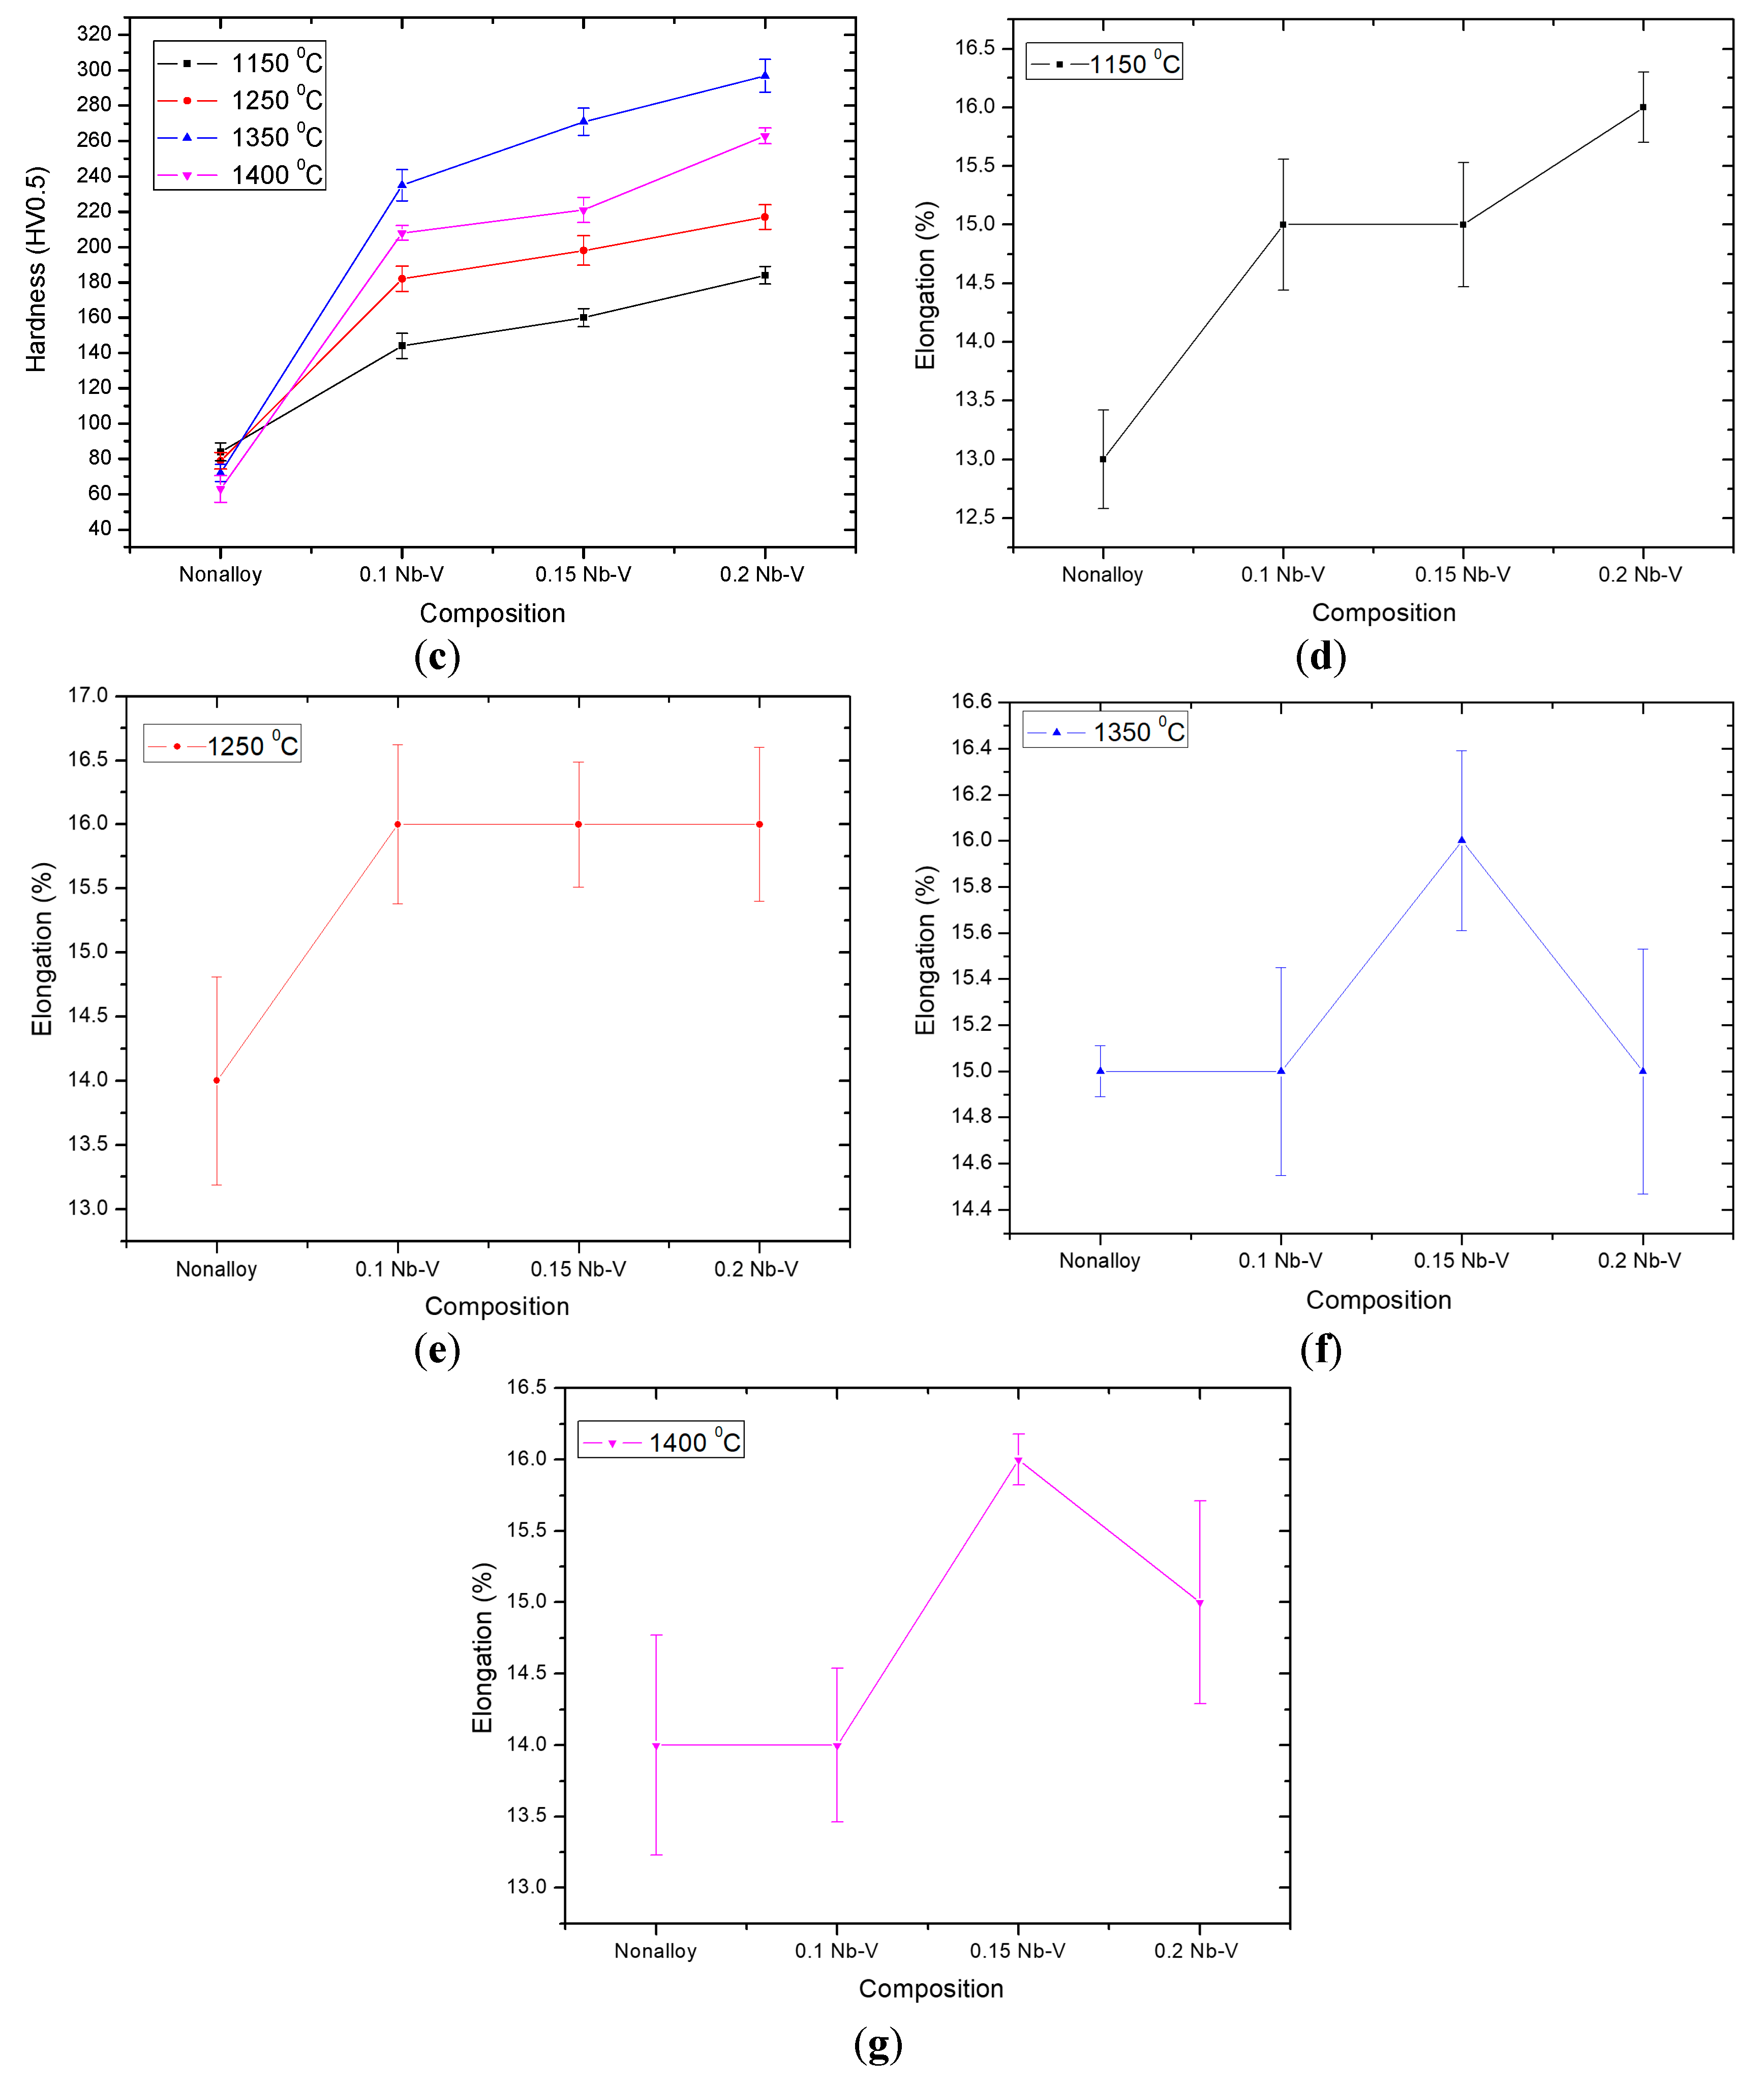
Figure 6.
The stress-strain curves for the PM steel and microalloyed PM steels at different percentages ofNb-V content and 1350 °C temperature: (a) Alloy 1, (b) Alloy 2, (c) Alloy 3, and (d) Alloy 4.
Figure 6.
The stress-strain curves for the PM steel and microalloyed PM steels at different percentages ofNb-V content and 1350 °C temperature: (a) Alloy 1, (b) Alloy 2, (c) Alloy 3, and (d) Alloy 4.

Figure 7.
Variation of σp (the contribution of precipitation and cluster hardening as MPa) values of the PM steel and microalloyed PM steels at different percentage Nb-V content and different temperatures.
Figure 7.
Variation of σp (the contribution of precipitation and cluster hardening as MPa) values of the PM steel and microalloyed PM steels at different percentage Nb-V content and different temperatures.

Figure 8.
SEM micrographfor Alloy 4 and the corresponding EDS of the indicated points.
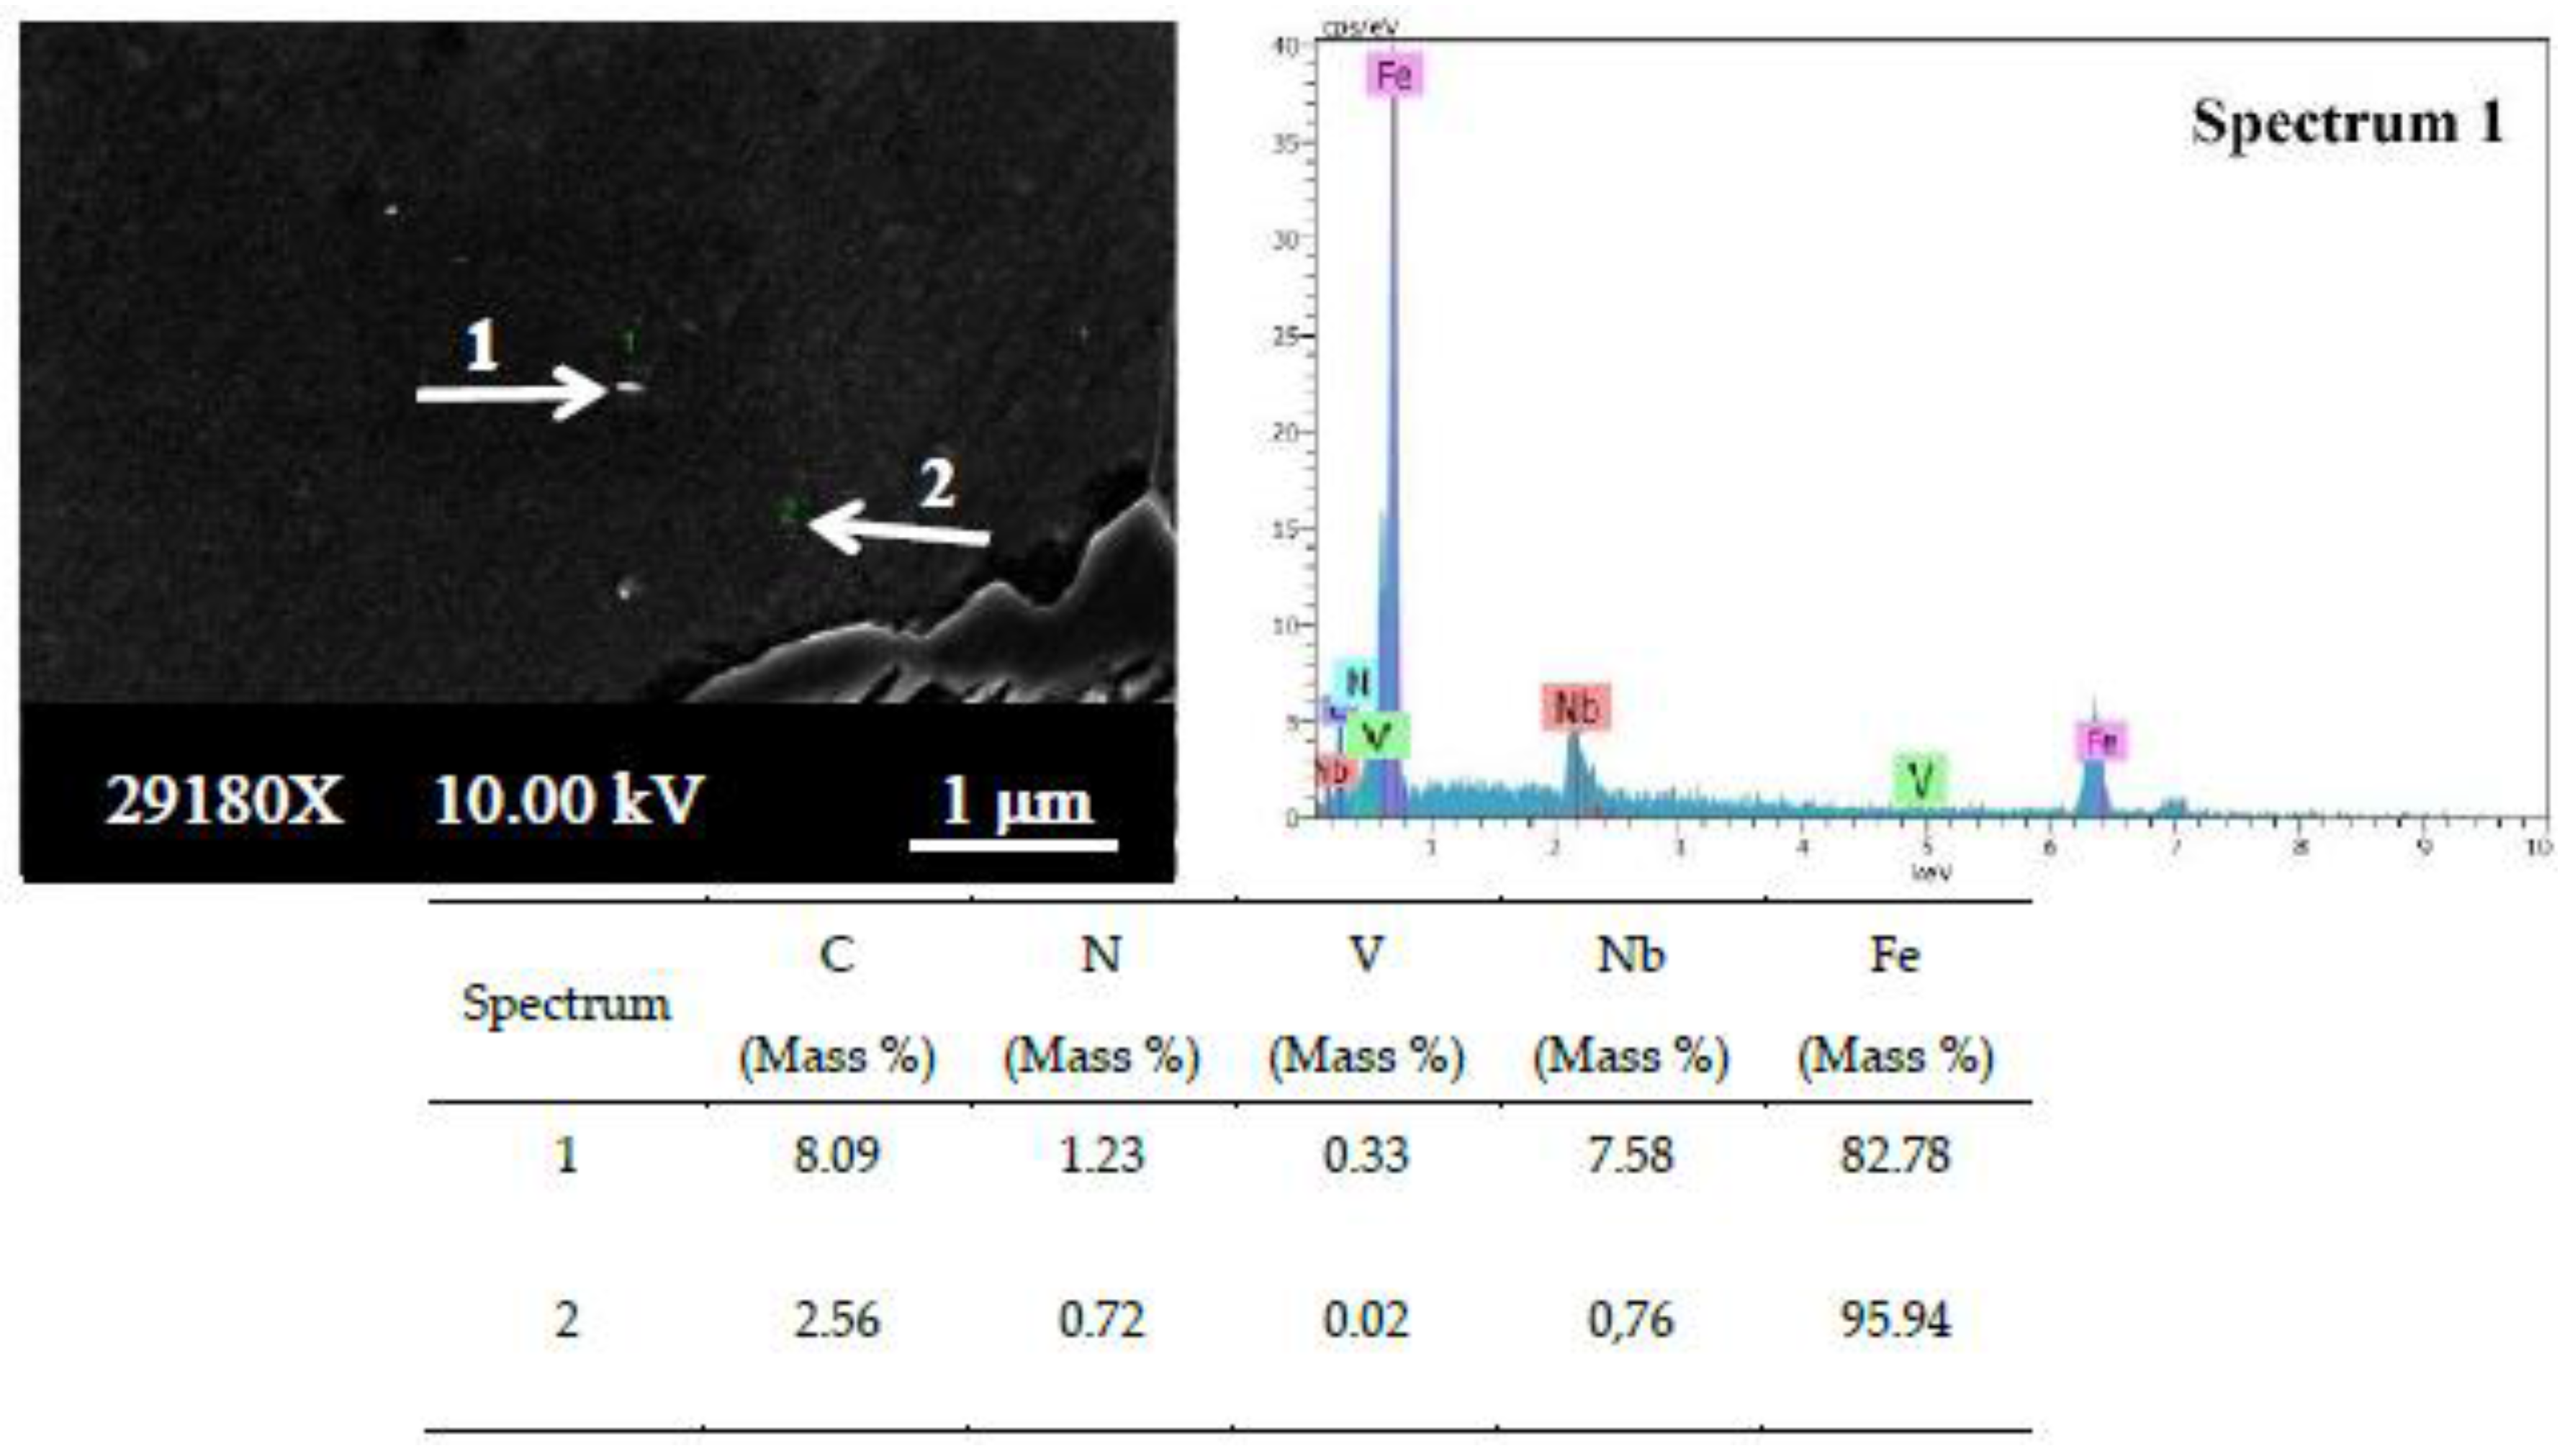
Figure 9.
SEM micrograph for Alloy 3 sintered at 1350 °C and the EDS lines scan of the indicated particle.
Figure 9.
SEM micrograph for Alloy 3 sintered at 1350 °C and the EDS lines scan of the indicated particle.
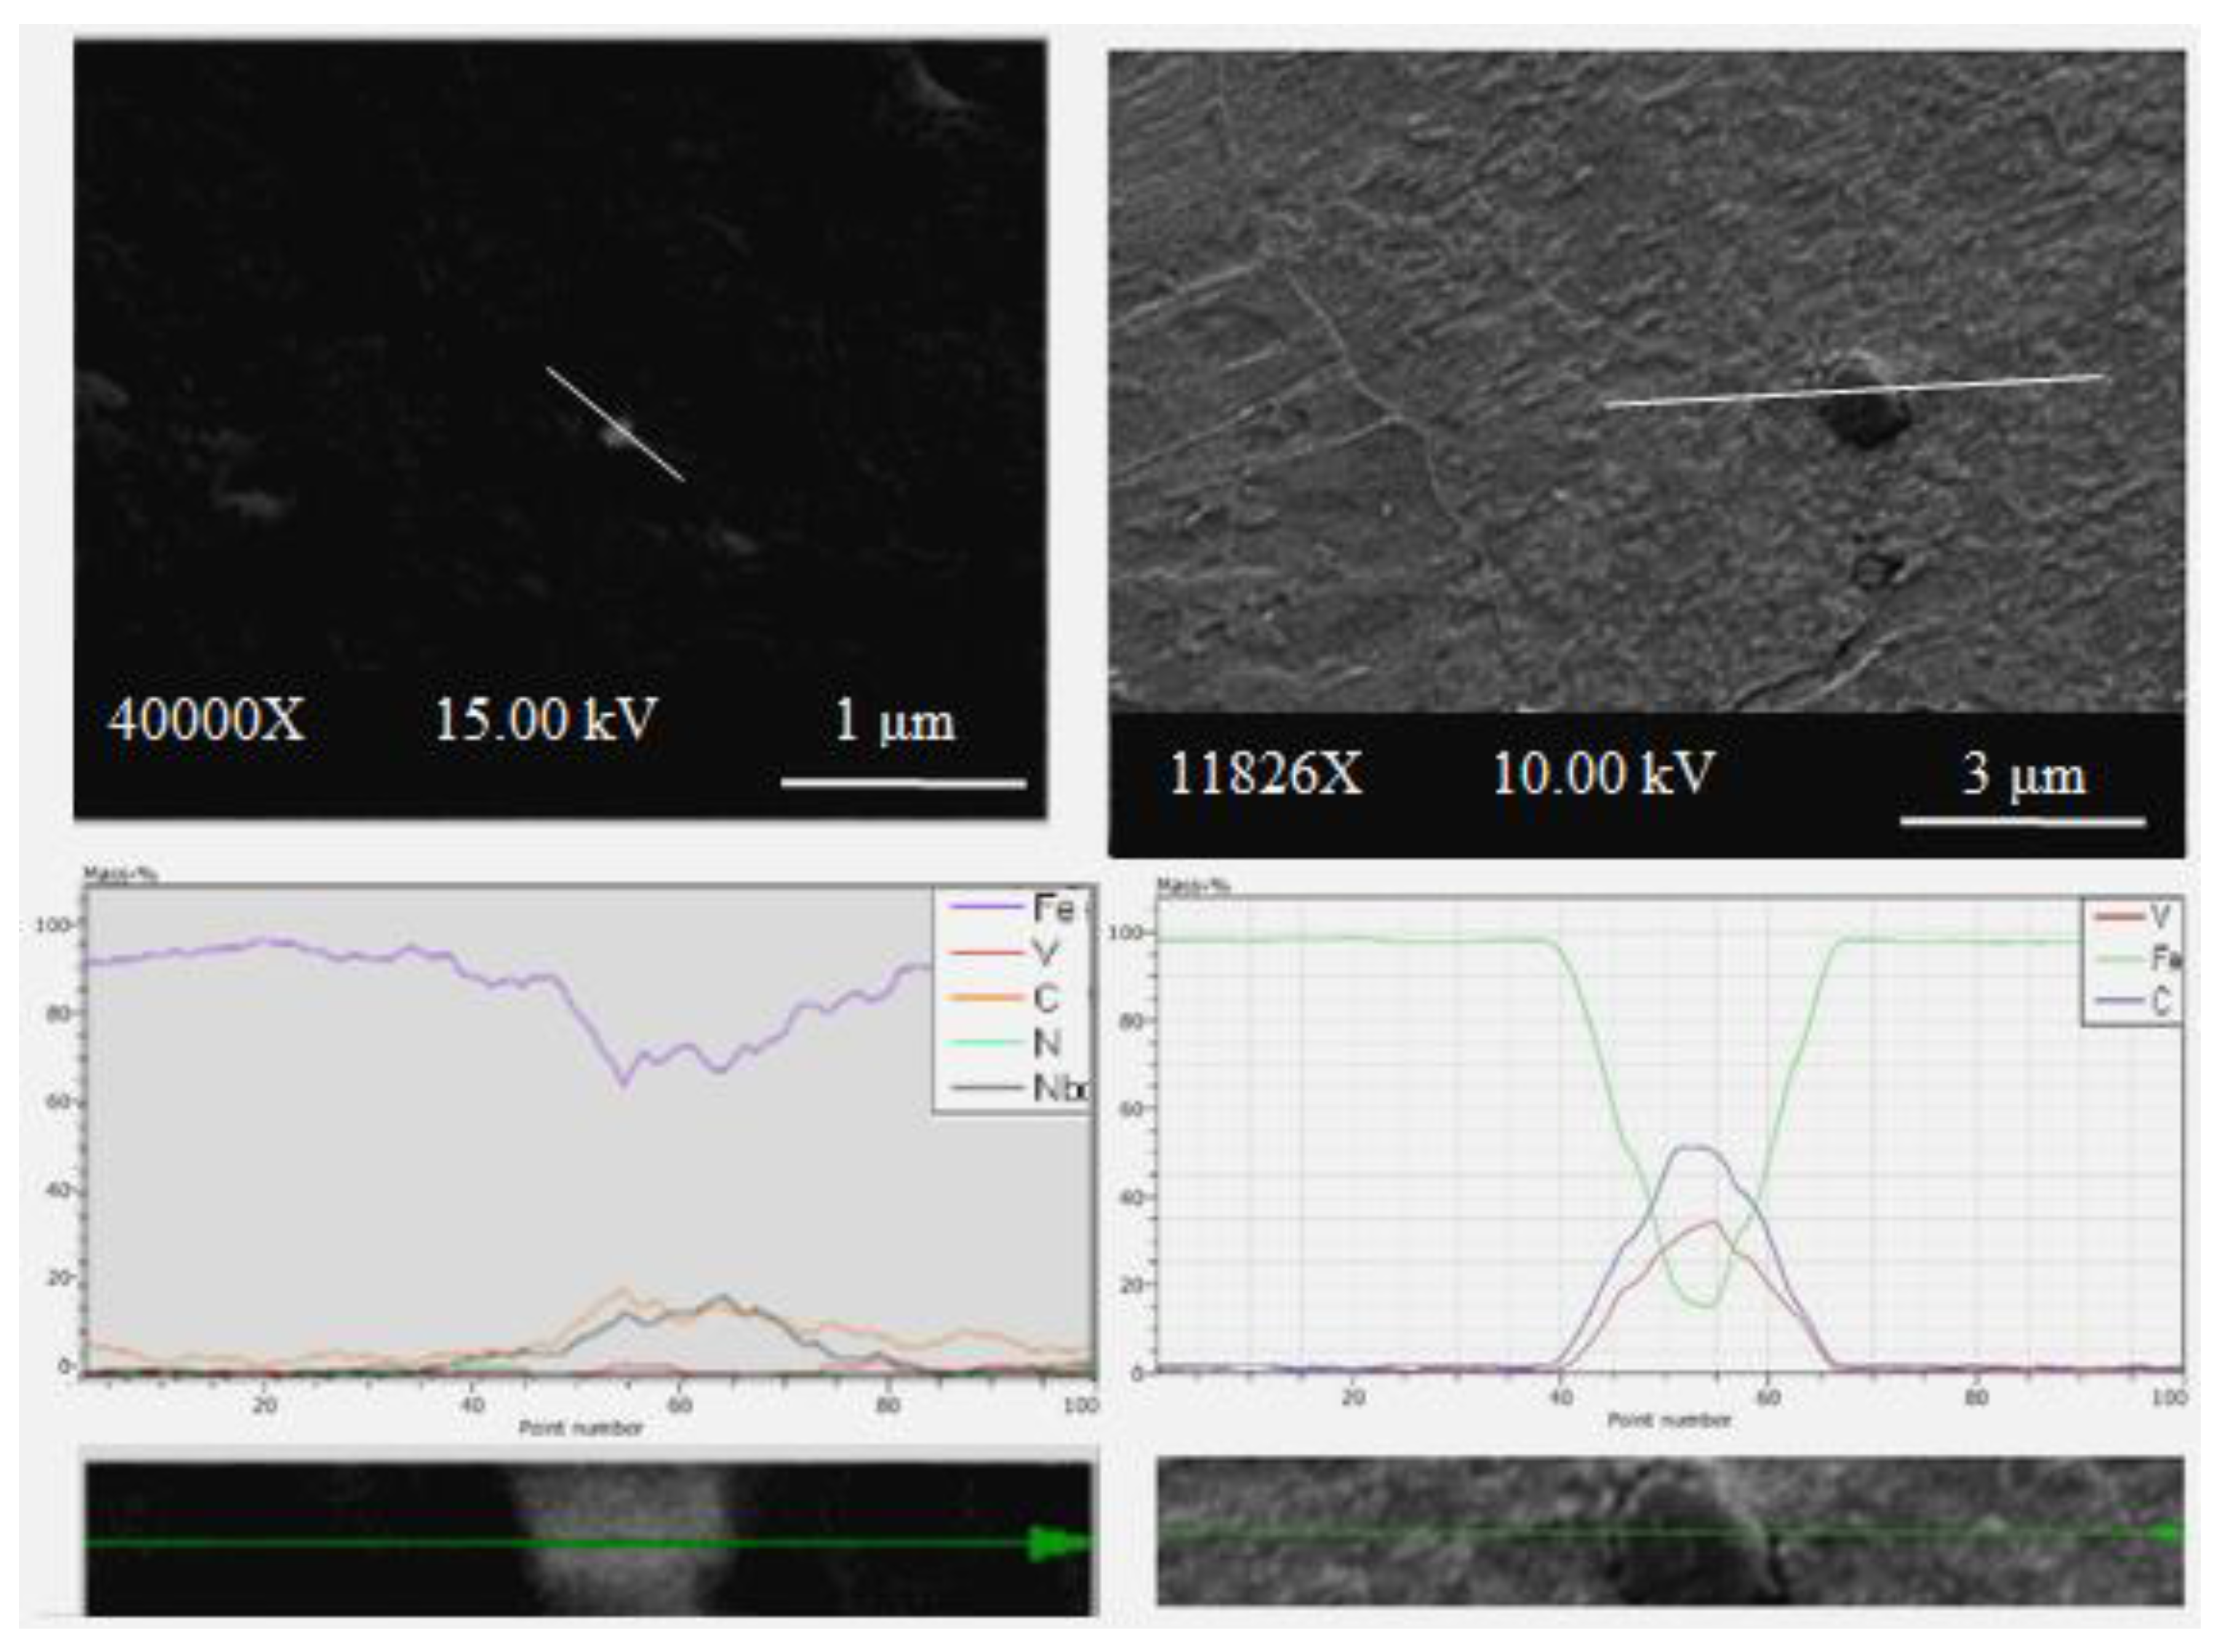
Figure 10.
Fracture surfaces of microalloyed PM steels sintered at 1350 °C: (a) Alloy 1, (b) Alloy 2, (c) Alloy 3 and (d) Alloy 4. (e) EDS results from the indicated particle of Alloy 3.
Figure 10.
Fracture surfaces of microalloyed PM steels sintered at 1350 °C: (a) Alloy 1, (b) Alloy 2, (c) Alloy 3 and (d) Alloy 4. (e) EDS results from the indicated particle of Alloy 3.

Table 1.
Nominal chemical compositions of powder metal steels.
| Compound | C (wt%) | Nb (wt%) | V (wt%) | Fe (wt%) |
|---|---|---|---|---|
| Fe+0.25%C (Alloy 1) | 0.25 | - | - | rest |
| Fe+0.25%C+ 0.1%(Nb+V) (Alloy 2) | 0.25 | 0.05 | 0.05 | rest |
| Fe+0.25%C+ 0.15%(Nb+V) (Alloy 3) | 0.25 | 0.075 | 0.075 | rest |
| Fe+0.25%C+ 0.2%(Nb+V) (Alloy 4) | 0.25 | 0.1 | 0.1 | rest |
Table 2.
Chemical composition of Alloys 1–3 and Alloy 4 obtained by the OES method.
| Alloys | Fe | C | Mn | Nb | V |
|---|---|---|---|---|---|
| Alloy 1 | 99.232 | 0.249 | 0.211 | 0.000 | 0.000 |
| Alloy 2 | 98.569 | 0.234 | 0.171 | 0.049 | 0.046 |
| Alloy 3 | 98.821 | 0.210 | 0.198 | 0.063 | 0.065 |
| Alloy 4 | 98.355 | 0.241 | 0.180 | 0.098 | 0.091 |
Table 3.
Relative density, mean linear intercept grain sizes and volume fractions of ferrite and pearlite phases in non-alloyed and microalloyed PM specimens.
Table 3.
Relative density, mean linear intercept grain sizes and volume fractions of ferrite and pearlite phases in non-alloyed and microalloyed PM specimens.
| Alloy | Relative Density (%) | Grain Size (µm) | Ferrite (%) | Pearlite (%) |
|---|---|---|---|---|
| Alloy 1 (1150 °C) | 92.3 | 29.3 ± 0.13 | 78.4 ± 0.18 | 21.6 ± 0.18 |
| Alloy 2 (1150 °C) | 92.1 | 28.7 ± 0.13 | 75 ± 0.19 | 22.9 ± 0.19 |
| Alloy 3 (1150 °C) | 92 | 27.5 ± 0.14 | 76.3 ± 0.19 | 23.7 ± 0.19 |
| Alloy 4 (1150 °C) | 91.8 | 25.1 ± 0.12 | 74.4 ± 0.20 | 25.6 ± 0.20 |
| Alloy 1 (1250 °C) | 92.7 | 32.7 ± 0.13 | 77.8 ± 0.19 | 22.2 ± 0.19 |
| Alloy 2 (1250 °C) | 92.4 | 29.3 ± 0.13 | 77.6 ± 0.19 | 23.4 ± 0.19 |
| Alloy 3 (1250 °C) | 92.2 | 28.4 ± 0.14 | 75.8 ± 0.19 | 24.2 ± 0.19 |
| Alloy 4 (1250 °C) | 92 | 25.7 ± 0.12 | 73.5 ± 0.20 | 26.5 ± 0.20 |
| Alloy 1 (1350 °C) | 93.4 | 34.1 ± 0.13 | 77.5 ± 0.19 | 22.5 ± 0.19 |
| Alloy 2 (1350 °C) | 93.2 | 29.9 ± 0.13 | 76.1 ± 0.19 | 24.9 ± 0.19 |
| Alloy 3 (1350 °C) | 92.9 | 28.5 ± 0.14 | 74.1 ± 0.20 | 25.9 ± 0.20 |
| Alloy 4 (1350 °C) | 92.5 | 26.3 ± 0.12 | 73.2 ± 0.20 | 26.8 ± 0.20 |
| Alloy 1 (1400 °C) | 94.4 | 37 ± 0.13 | 77.3 ± 0.019 | 22.7 ± 0.19 |
| Alloy 2 (1400 °C) | 94.1 | 30.1 ± 0.13 | 75.4 ± 0.19 | 24.6 ± 0.19 |
| Alloy 3 (1400 °C) | 93.5 | 29.3 ± 0.13 | 73.1 ± 0.20 | 26.9 ± 0.20 |
| Alloy 4 (1400 °C) | 93 | 27.5 ± 0.13 | 71.9 ± 0.20 | 28.1 ± 0.20 |
Table 4.
Structure properties analyses of PM steel and microalloyed PM steels tensile tested at room temperature.
Table 4.
Structure properties analyses of PM steel and microalloyed PM steels tensile tested at room temperature.
| Alloy | σo (MPa) | Grain Size (µm) | kyd-1/2 (MPa) | σTotal (MPa) | σyTest (MPa) | σp (MPa) |
|---|---|---|---|---|---|---|
| Alloy 1 (1150 °C) | 54 | 29.3 | 94.19 | 148.19 | 150 | 1.81 |
| Alloy 2 (1150 °C) | 54 | 28.7 | 93.22 | 147.22 | 163 | 15.78 |
| Alloy 3 (1150 °C) | 54 | 27.5 | 91.25 | 145.25 | 171 | 25.75 |
| Alloy 4 (1150 °C) | 54 | 25.1 | 87.17 | 141.17 | 185 | 43.83 |
| Alloy 1 (1250 °C) | 54 | 32.7 | 99.50 | 153.50 | 156 | 2.5 |
| Alloy 2 (1250 °C) | 54 | 29.3 | 94.19 | 148.19 | 190 | 41.81 |
| Alloy 3 (1250 °C) | 54 | 28.4 | 92.73 | 146.73 | 237 | 90.27 |
| Alloy 4 (1250 °C) | 54 | 25.7 | 88.21 | 142.21 | 265 | 122.79 |
| Alloy 1 (1350 °C) | 54 | 34.1 | 101.61 | 155.61 | 162 | 6.39 |
| Alloy 2 (1350 °C) | 54 | 29.9 | 95.15 | 149.15 | 270 | 120.85 |
| Alloy 3 (1350 °C) | 54 | 28.5 | 92.89 | 146.89 | 287 | 140.11 |
| Alloy 4 (1350 °C) | 54 | 26.3 | 89.23 | 143.23 | 330 | 186.77 |
| Alloy 1 (1400 °C) | 54 | 37 | 105.84 | 159.84 | 170 | 10.16 |
| Alloy 2 (1400 °C) | 54 | 30.1 | 95.46 | 149.46 | 235 | 85.54 |
| Alloy 3 (1400 °C) | 54 | 29.3 | 94.19 | 148.19 | 255 | 106.81 |
| Alloy 4 (1400 °C) | 54 | 27.5 | 91.25 | 145.25 | 261 | 115.75 |
© 2017 by the author. Licensee MDPI, Basel, Switzerland. This article is an open access article distributed under the terms and conditions of the Creative Commons Attribution (CC BY) license (http://creativecommons.org/licenses/by/4.0/).
Share and Cite
MDPI and ACS Style
Erden, M.A. The Effect of the Sintering Temperature and Addition of Niobium and Vanadium on the Microstructure and Mechanical Properties of Microalloyed PM Steels. Metals 2017, 7, 329. https://doi.org/10.3390/met7090329
AMA Style
Erden MA. The Effect of the Sintering Temperature and Addition of Niobium and Vanadium on the Microstructure and Mechanical Properties of Microalloyed PM Steels. Metals. 2017; 7(9):329. https://doi.org/10.3390/met7090329
Chicago/Turabian StyleErden, Mehmet Akif. 2017. "The Effect of the Sintering Temperature and Addition of Niobium and Vanadium on the Microstructure and Mechanical Properties of Microalloyed PM Steels" Metals 7, no. 9: 329. https://doi.org/10.3390/met7090329
Note that from the first issue of 2016, this journal uses article numbers instead of page numbers. See further details here.