Definition of a First Process Window for Purification of Aluminum via “Cooled Finger” Crystallization Technique


IME Institute of Process Metallurgy and Metal Recycling, RWTH Aachen University, 52056 Aachen, Germany
*
Author to whom correspondence should be addressed.
Metals 2017, 7(9), 341; https://doi.org/10.3390/met7090341
Submission received: 25 July 2017
/
Revised: 25 August 2017
/
Accepted: 29 August 2017
/
Published: 1 September 2017
Abstract
:Aluminum ultra-purification is commonly realized through a combination of three-layer electrolytic refining and fractional crystallization, mostly using zone melting. In order to achieve a purity over 6N with the aid of zone melting, many passes have to be performed, taking several days to be accomplished. This paper focuses on a fractional crystallization methodology using a rotating and internally gas cooled crystallizer (“cooled finger”), based on a Japanese patent from the 1980s, about which no scientific investigation or publication has yet been found. This paper focuses on the impact of process conditions (mainly cooling gas flow and rotation velocity) on the growth rate of the crystallized material as well as on the reduction factor of the impurities Fe, Si, Pb, and Zn in aluminum in relationship to their initial concentration and their interaction in a multi-component system. This technique can be considered as a promising alternative for purification of aluminum as well as other metallic systems.

1. Introduction
Pyro-metallurgical purification of ultra-pure aluminum relies almost entirely on methods that uses the principle of fractional crystallization. This principle is based on the ratio between the solubility of the impurities in the solid and molten phase of a metal, described by the distribution coefficient (k), as shown in Equation (1) below.
where CS is the concentration of impurity in the solid and CL is the concentration of impurity in the liquid.
The distribution coefficient (k) is one of the most important indicators in fractional crystallization methods and defines the purification degree that can be theoretically achieved in a system. For example, at equilibrium and not considering the influence of additional impurity elements, the distribution coefficient can be calculated from a binary phase diagram at a constant temperature [1,2,3]. This coefficient is only valid by assumption of a complete diffusion of the expelled solid in the liquid. Therefore, a more realistic approach can be evaluated by taking the growth rate of the solid, the diffusion of the impurity into the melt and the thickness of the diffusion boundary layer into account. This optimized approach leads to the so called effective distribution coefficient (keff), shown in Equation (2) and described in detail by Burton, Prim and Slichter (known as BPS model) [3,4,5]. As it is seen in Equation (2), the diffusion layer thickness and the growth velocity of the crystallized material are the most important factors in this model, both able to be controlled in the best form through a mixing of the melt as well as cooling effect of the crystallizer. These two aspects are exactly the process parameters in a cooled finger technique and allow the consideration of this model into the interpretation of the experimental results of this study.
where δ is the thickness of the diffusion boundary layer, k0 is the ratio Cs/C0, D is the impurity diffusivity in the melt and V is the solid growth rate.
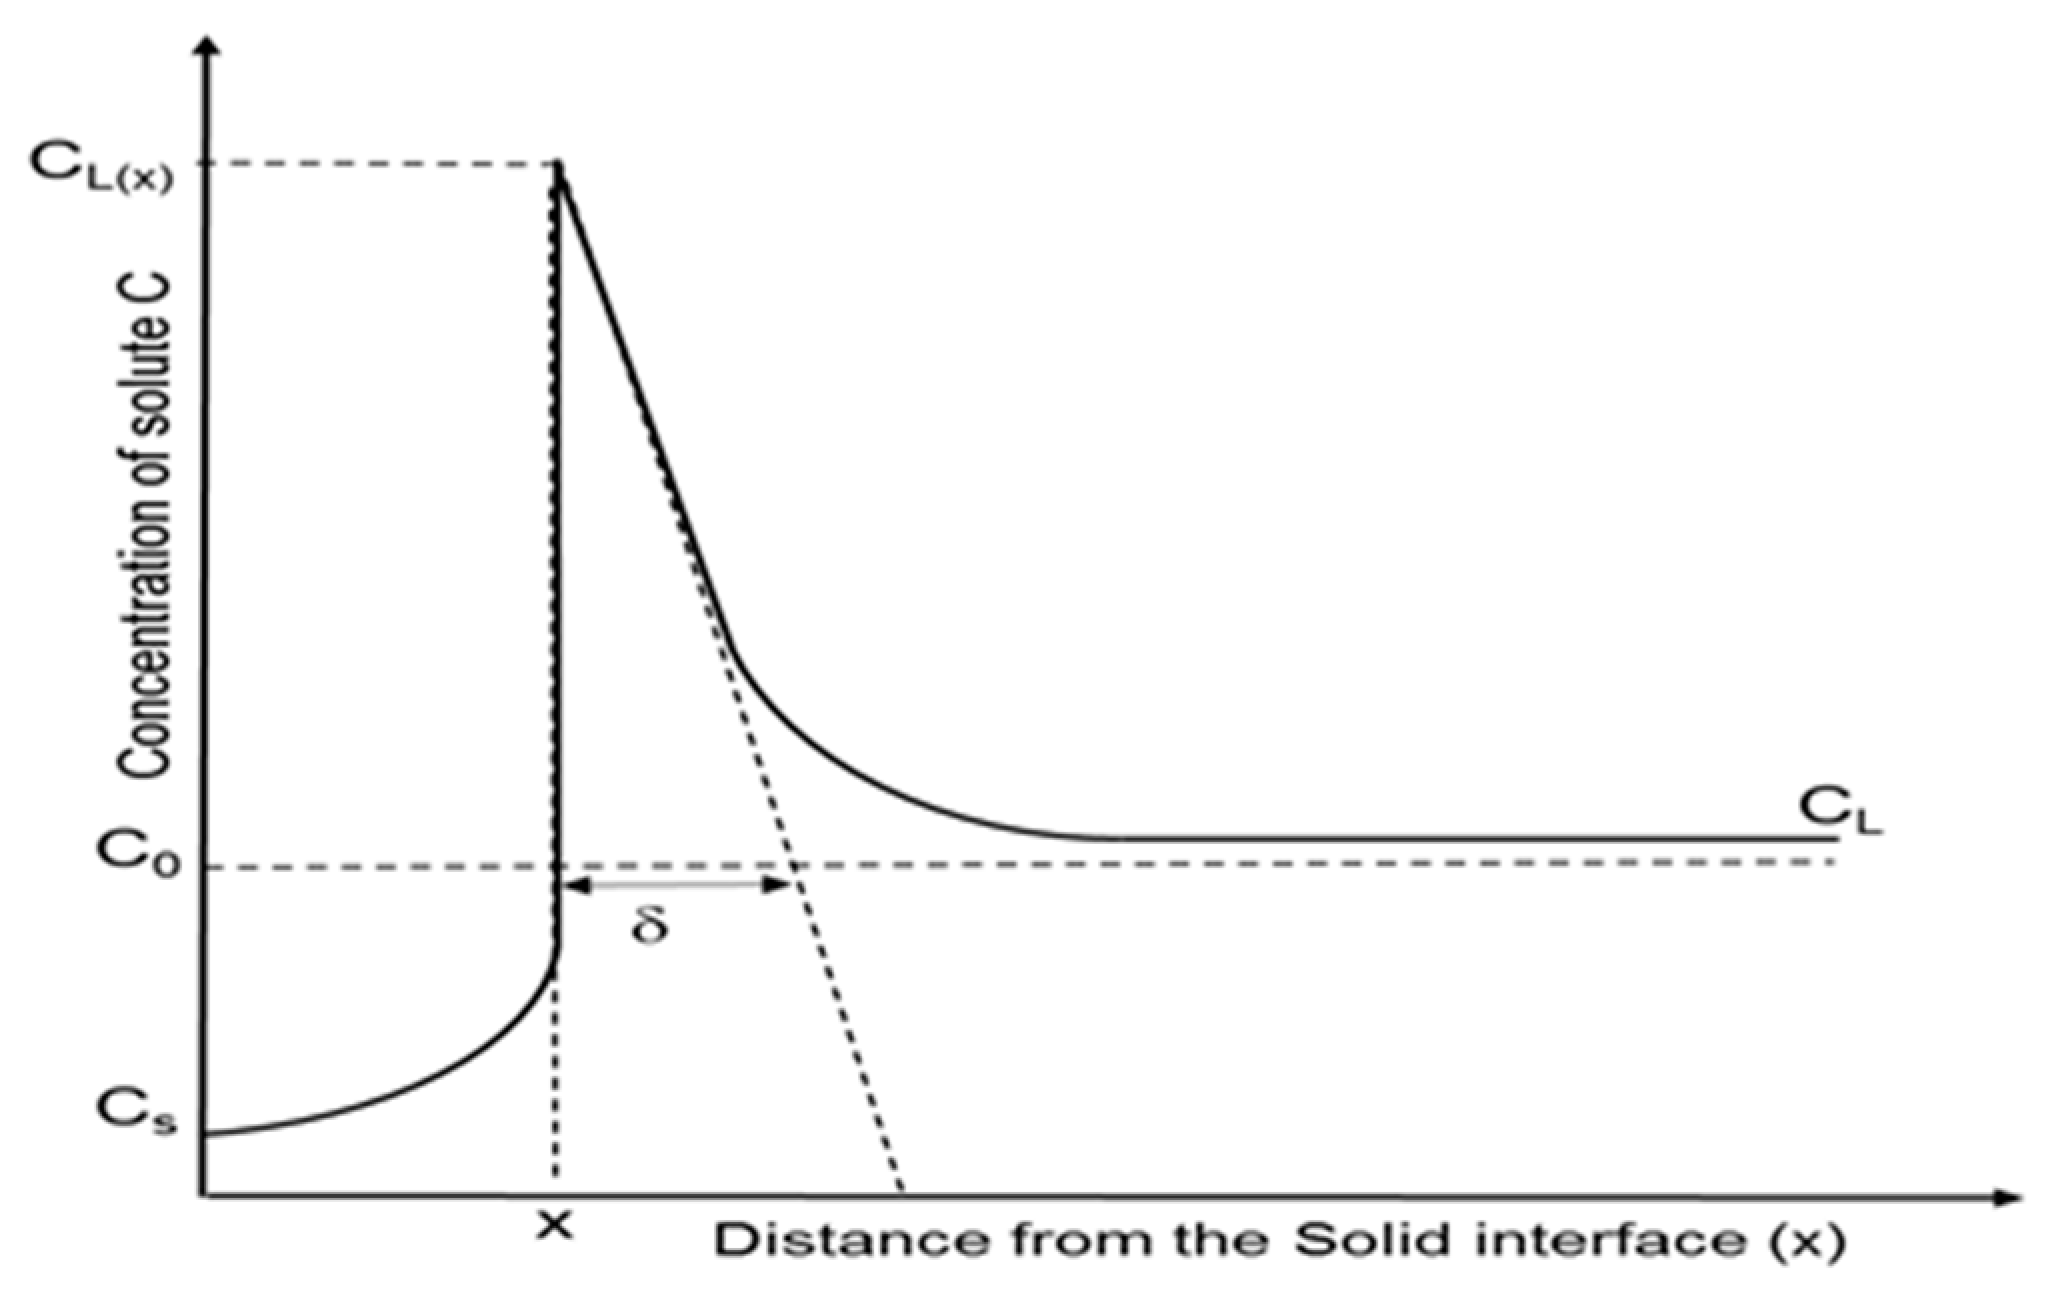
When a maximum mixing of the segregated solute into the melt occurs, the value of keff becomes very close to that of k, showing the optimum purification. In reality and while crystallizing, the rejected impurities enrich the melt ahead of the crystallization front, so that this region contains a higher amount of solute. A representation of this effect can be seen in Figure 1.
The region, whose thickness is represented as δ, is the so called diffusion boundary layer. In this area, the impurities are concentrated from the solid/liquid interface up to the distance where the solute concentration is approximately the same as that of the bulk. Within this film layer, impurity transport is assumed to occur only by diffusion, while ahead of this layer the transport is done mainly by convection, which can be increased by mixing mechanisms such as rotation or applying a magnetic field in the melt [8,9,10].
Applying a mechanical agitation e.g., using an immersed rotor, leads to the reduction of the temperature gradient between the crystallization front and the melt besides the crucible wall, keeping the heat flow from the melt to the interface as small as possible. This rotation will also promote a mass flow in the melt, resulting not only in a lower thermal gradient but also in a stable boundary layer in front of the solid-liquid interface, allowing a uniform segregation of impurities [11].
According to the BPS model (Equation (2)), for small values of growth rate, the thickness of the diffusion boundary layer (δ) has a dependence on the rotation rate as well as viscosity of the liquid phase. Equation (3) describes this dependence as an upgrading of the BPS model. In this equation the increase of the angular velocity by increasing the rotation rate of the “cooled finger” will negatively influence the thickness of the diffusion boundary layer, which in turn will contribute to a lower effective distribution coefficient [5].
where ω is the angular velocity of the crystallized material, v is the kinematic viscosity of the liquid, and D is the diffusion coefficient of the solute.
With some exceptions, most impurities in aluminum have their k values lower than unity, facilitating their removal by fractional crystallization. Some impurities however, have k-values much bigger than one, such as Ti, V, Cr, and Zr, which are known as peritetic impurities. Table 1 contains the distribution coefficients of most relevant impurities in aluminum according to different authors as well as some values obtained by own calculations using the FactSageTM thermodynamic software (version 6.4, GTT-Technologies, Aachen, Germany) using the light metals database (FT Lite-FACT light metal alloy solutions (2013)). These calculations were conducted by extracting the solidus and liquidus curves from FactSageTM for every binary system (up to 1 wt % concentration of element X in a Al-X system) and exporting them to excel, where each curve was fitted into a 6th-degree-polynomial equation as a function of temperature. This prevented inconsistencies, when extreme lower amounts of impurities are present or when the liquidus and solidus lines are too close to each other. The values of CS and CL at every specific temperature were then extracted from each liquidus-as well as solidus equation and then the thermodynamical distribution coefficient value (k) was obtained (Equation (1)). Such calculations were made for the whole interval of concentrations. The values correlated well with the ones found in literature and the source of errors are mostly limited to the possibility of errors from the FactSageTM database.
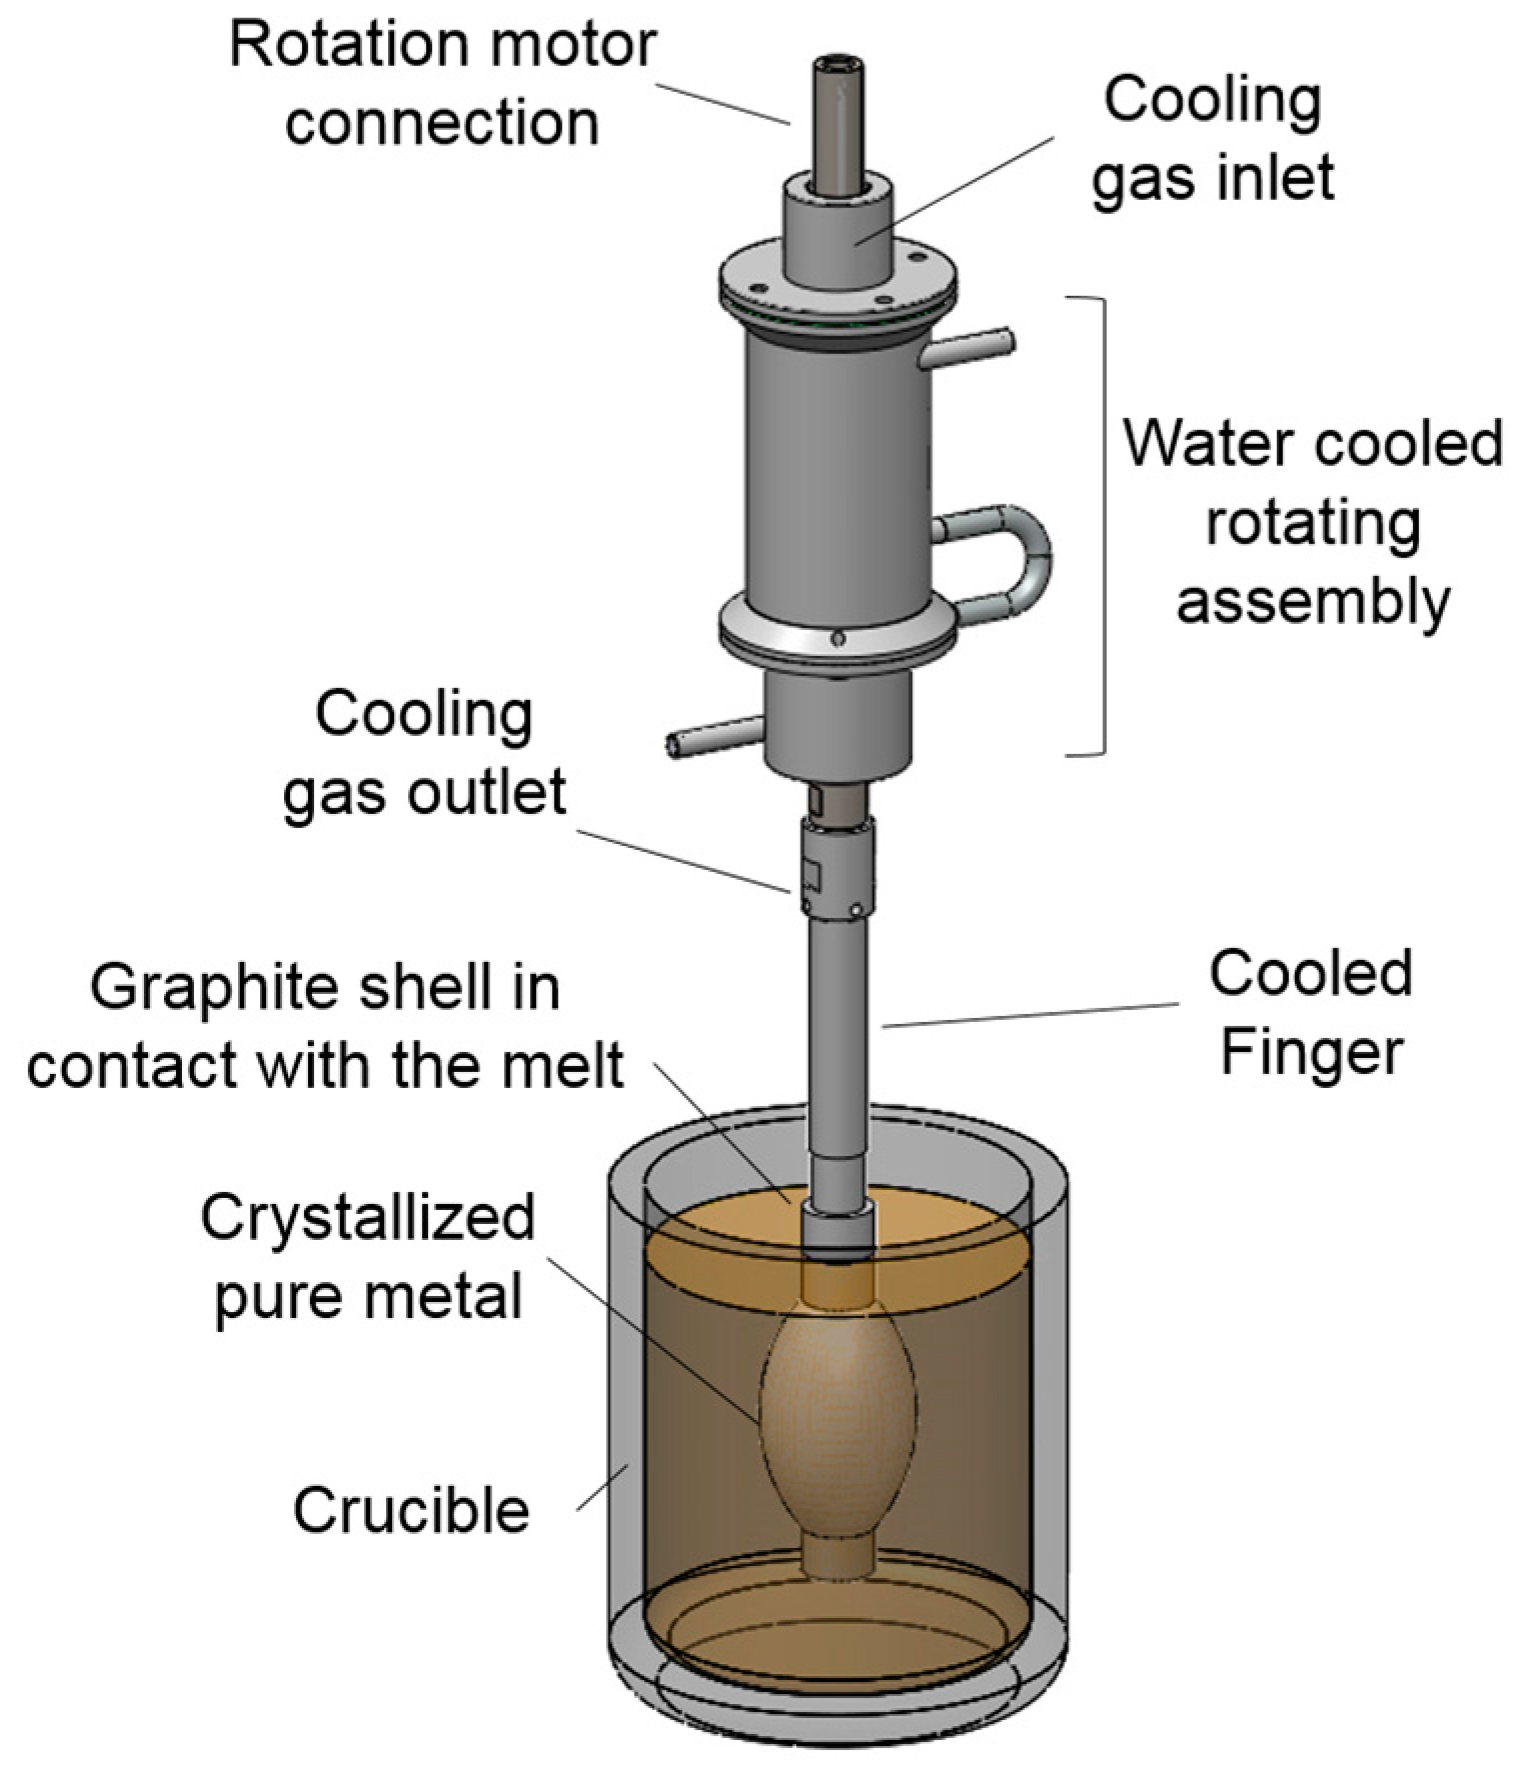
The innovative methodology of a rotational immersing cooled finger consists of an internally cooled tube that rotates inside a molten bath, as seen in Figure 2. Since this patent filing in 1982, there were neither any scientific investigations found on this method, nor was there any fundamental research published.
Based on the same physical principle of well stablished methods like zone melting, vertical gradient freeze, pechiney crystallizer, etc. this method relies on the fractional crystallization principle, where a growth front is formed and moves radially towards the crucible wall. The rotational mechanism promotes a homogeneous mixing of the melt and a stable boundary layer, which assures an optimal segregation of impurities. The growth rate can be adjusted by combination of the cooling degree and the rotation rate to the targeted purification/productivity rate according to the requirements for subsequent processes.
This process was initially designed as a batch process, though it has big potential to be developed as a semi-continuous methodology. Around 60–70% of molten metal always remains in the crucible after removing the rotor with crystallized metal, it is then possible to be recharged, with further crude aluminum, while it is still molten to repeat the crystallization process.
2. Experimental and Assessment Methodology
Based on the sketch of Figure 2, a cooled finger equipment was designed and built. After the aluminum is molten, the bath temperature is equalized to 700 °C (as the fix melt temperature in this series of experiments). The crystallization unit is pre-heated for a certain period of time inside the furnace above the melt by radiation to avoid thermal shock for the graphite shell (see Figure 3) as well as rapid solidification after contacting molten aluminum. Once the unit has achieved a temperature of approximately 400 °C, it was immersed into the melt and the cooling gas and rotation movement started. These two parameters are the process influencing factors, investigated in this paper. After around 25 min, the temperature of the melt drops shortly above the liquidus temperature and remains in a constant level. In this stage, a crystal layer starts to grow on the cooled surface of the graphite shell. When this crystallized material reaches a specific thickness (around 20 mm), the crystallization unit is lifted and the process interrupted. While removing the crystallized aluminum, another graphite shell can be installed on the unit and the crystallization goes on in a semi-continuous process. Addition of “fresh aluminum” to the melt as well as taking samples before immersing the cooled finger, guarantee the reproducibility of the initial chemical composition. The samples are analyzed via OES spark spectrometry (Optical Emission Spectroscopy, Firma Spectro Analytical Instruments GmbH, Kleve, Germany), which has a certified precision up to 4N5 (99.995 wt %) for aluminum. The analytics follows the industrial standard procedures for this level of impurities and guarantees a reliable result for this concentration range.
The variation of the melt temperature—measured inside the melt and close to the crucible wall—is later analyzed to obtain the exact time of the crystallization plateau, when temperature is stable and only latent heat is extracted. These data in conjunction with the thickness of crystallized material will later allow the calculation of an approximate growth rate, being evaluated as a function of the cooling gas flow- and rotation rates.
The experimental investigation is divided into three phases. The first is focused on understanding the influence of rotation- and cooling gas flow rate on the growth of the crystallized aluminum. These trials were conducted with pure aluminum (4N7) without any impurities added. The aim is to exclude the effect of impurities on the process behavior. The second part focused on the effect of rotation on the removal potential of some chosen impurities, including Fe, Si, Pb, and Zn. The selection of these elements is due to the fact that they are among the most common impurities in aluminum with quite a wide range of distribution coefficients. In the third part of these trials, the potential of Pb- and Zn-removal based on the initial chemical composition and the effect of accompanying elements was investigated.
The master alloys used to induce the artificial impurities in the trials (Al–Pb; Al–Zn; Al–Si and Al–Fe) were produced internally using high purity aluminum (99.997 wt %) and the additional impurities elements were at least 99.9 wt % purity. When these elements are diluted as maximal 0.1 wt % concentration in aluminum, the presence of unwanted contamination are drastically reduced below the detection limits of OES spectrometry and do not have any meaningful influence on the results.
3. Results and Discussions
3.1. Effect of Combination of Rotation and Cooling Gas Flow Rate on Crystallization Growth
The trials were performed using the variable combinations shown in Table 2. The results revealed, as predicted, an increase in the average growth rate when subjected to higher cooling gas flow. On the other hand, the increase of rotation rate promotes a decrease in the average crystal growth at least for the cases of 45 and 50 L/min. When applying the maximum cooling gas flow rate (55 L/min), this effect is not detectable, as this flow rate is high enough to cause a rather “rapid solidification” instead of the needed “slow crystallization”; therefore, the growth velocity at this cooling gas flow rate seems to be independent from the rotation rate.
Through summarizing the whole data collected, Figure 4 was sketched. By selecting the most accurate coefficient of determination (R2), Equation (4) is obtained, representing a linear relationship between the crystal growth rate, cooling gas flow rate as well as the number of rotations per minute while having a R2 = 0.934.
As stated before, the cooling gas flow rate has a strong impact on the average growth rate, while the rotation rate has a smaller effect, resulted from the amounts of the factors A and B in Equation (4). The reason is most likely that the cooling gas flow rate has a significant influence on the thermal gradient in the growth front, resulting in a rapid solidification and therefore leads to a much higher growth rate. On the other hand and despite the fact that the most important effect of rotation occurs on the diffusion layer thickness δ (see Equations (2) and (3)), this effect can—to a smaller extent—compensate the increase in the thermal gradient by promoting a homogenization of the melt temperature during the process and, as a result, decrease the average growth rate.
where A = 1.32; B = −0.17; C = −73.51.
3.2. Effect of Rotation on Removal Efficiency (Reduction Factor)
Selecting the most suitable cooling gas flow rate—according to the results above (50 L/min)—the effect of rotation velocity on purification efficiency and impurity segregation in aluminum was investigated. These impurities includes iron, silicon, lead, and zinc. The amount of impurities was set each as around 0.1 wt %, resulting in a total initial purity of aluminum of about 99.6 wt %. This level of impurities is within the confidence interval (up to 99.995 wt %) of the analytical method used (OES—spark spectrometry) for aluminum. The impurities removal efficiency, represented here by a “reduction factor η”, is calculated as the relation between the impurity concentration in the crystallized product to that in the initial material as stated by the Equation (5) below.
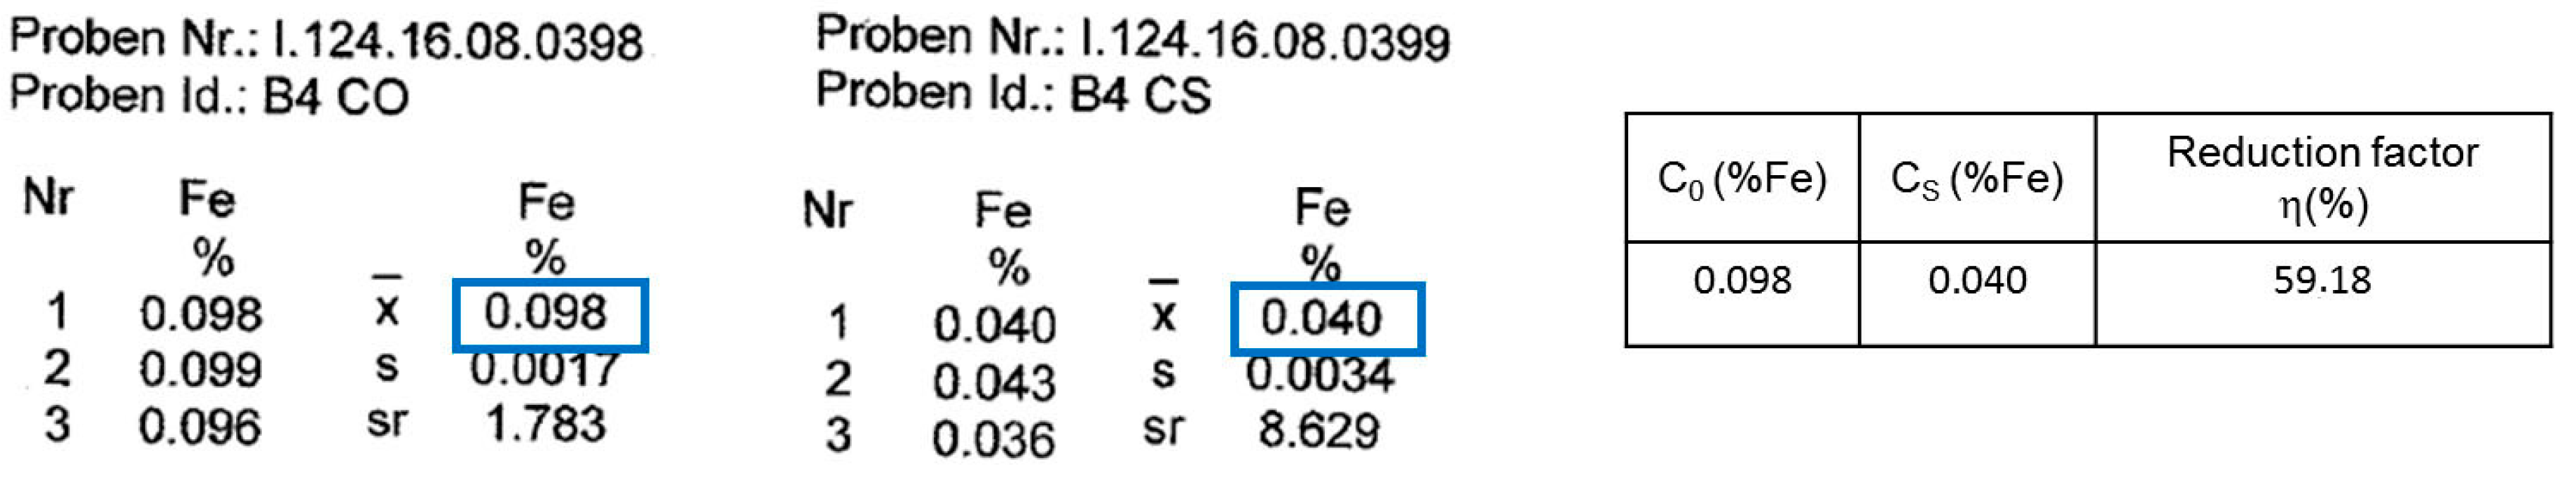
For all performed trials, the sampling of the initial composition (C0), as well as from the residual melt (CL), were taken from the molten bath before and after the crystallization period, respectively. Additionally, a third sample from the crystallized material (CS) was obtained. All the samples were prepared, polished, and analyzed via OES spark spectrometry. Each analysis was repeated three times and an average of the measurements was obtained. With the results of CS and C0, the reduction factor can be calculated according to Equation (5). An example of this calculation is given below on Figure 5 for the trials of an Al–Fe system using 50 L/min of cooling gas flow rate and 25 rpm of rotation velocity. Figure 5 left shows the results for the initial concentration (C0), the middle shows the concentration in the crystallized material (CS) and at the right side, a table with the results of the reduction factor is demonstrated.
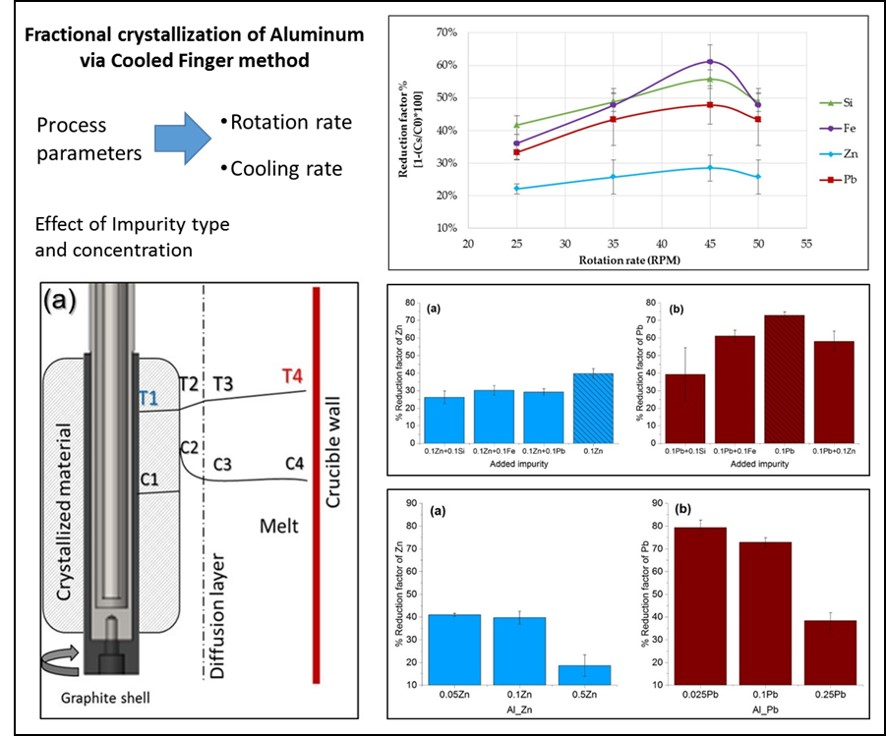
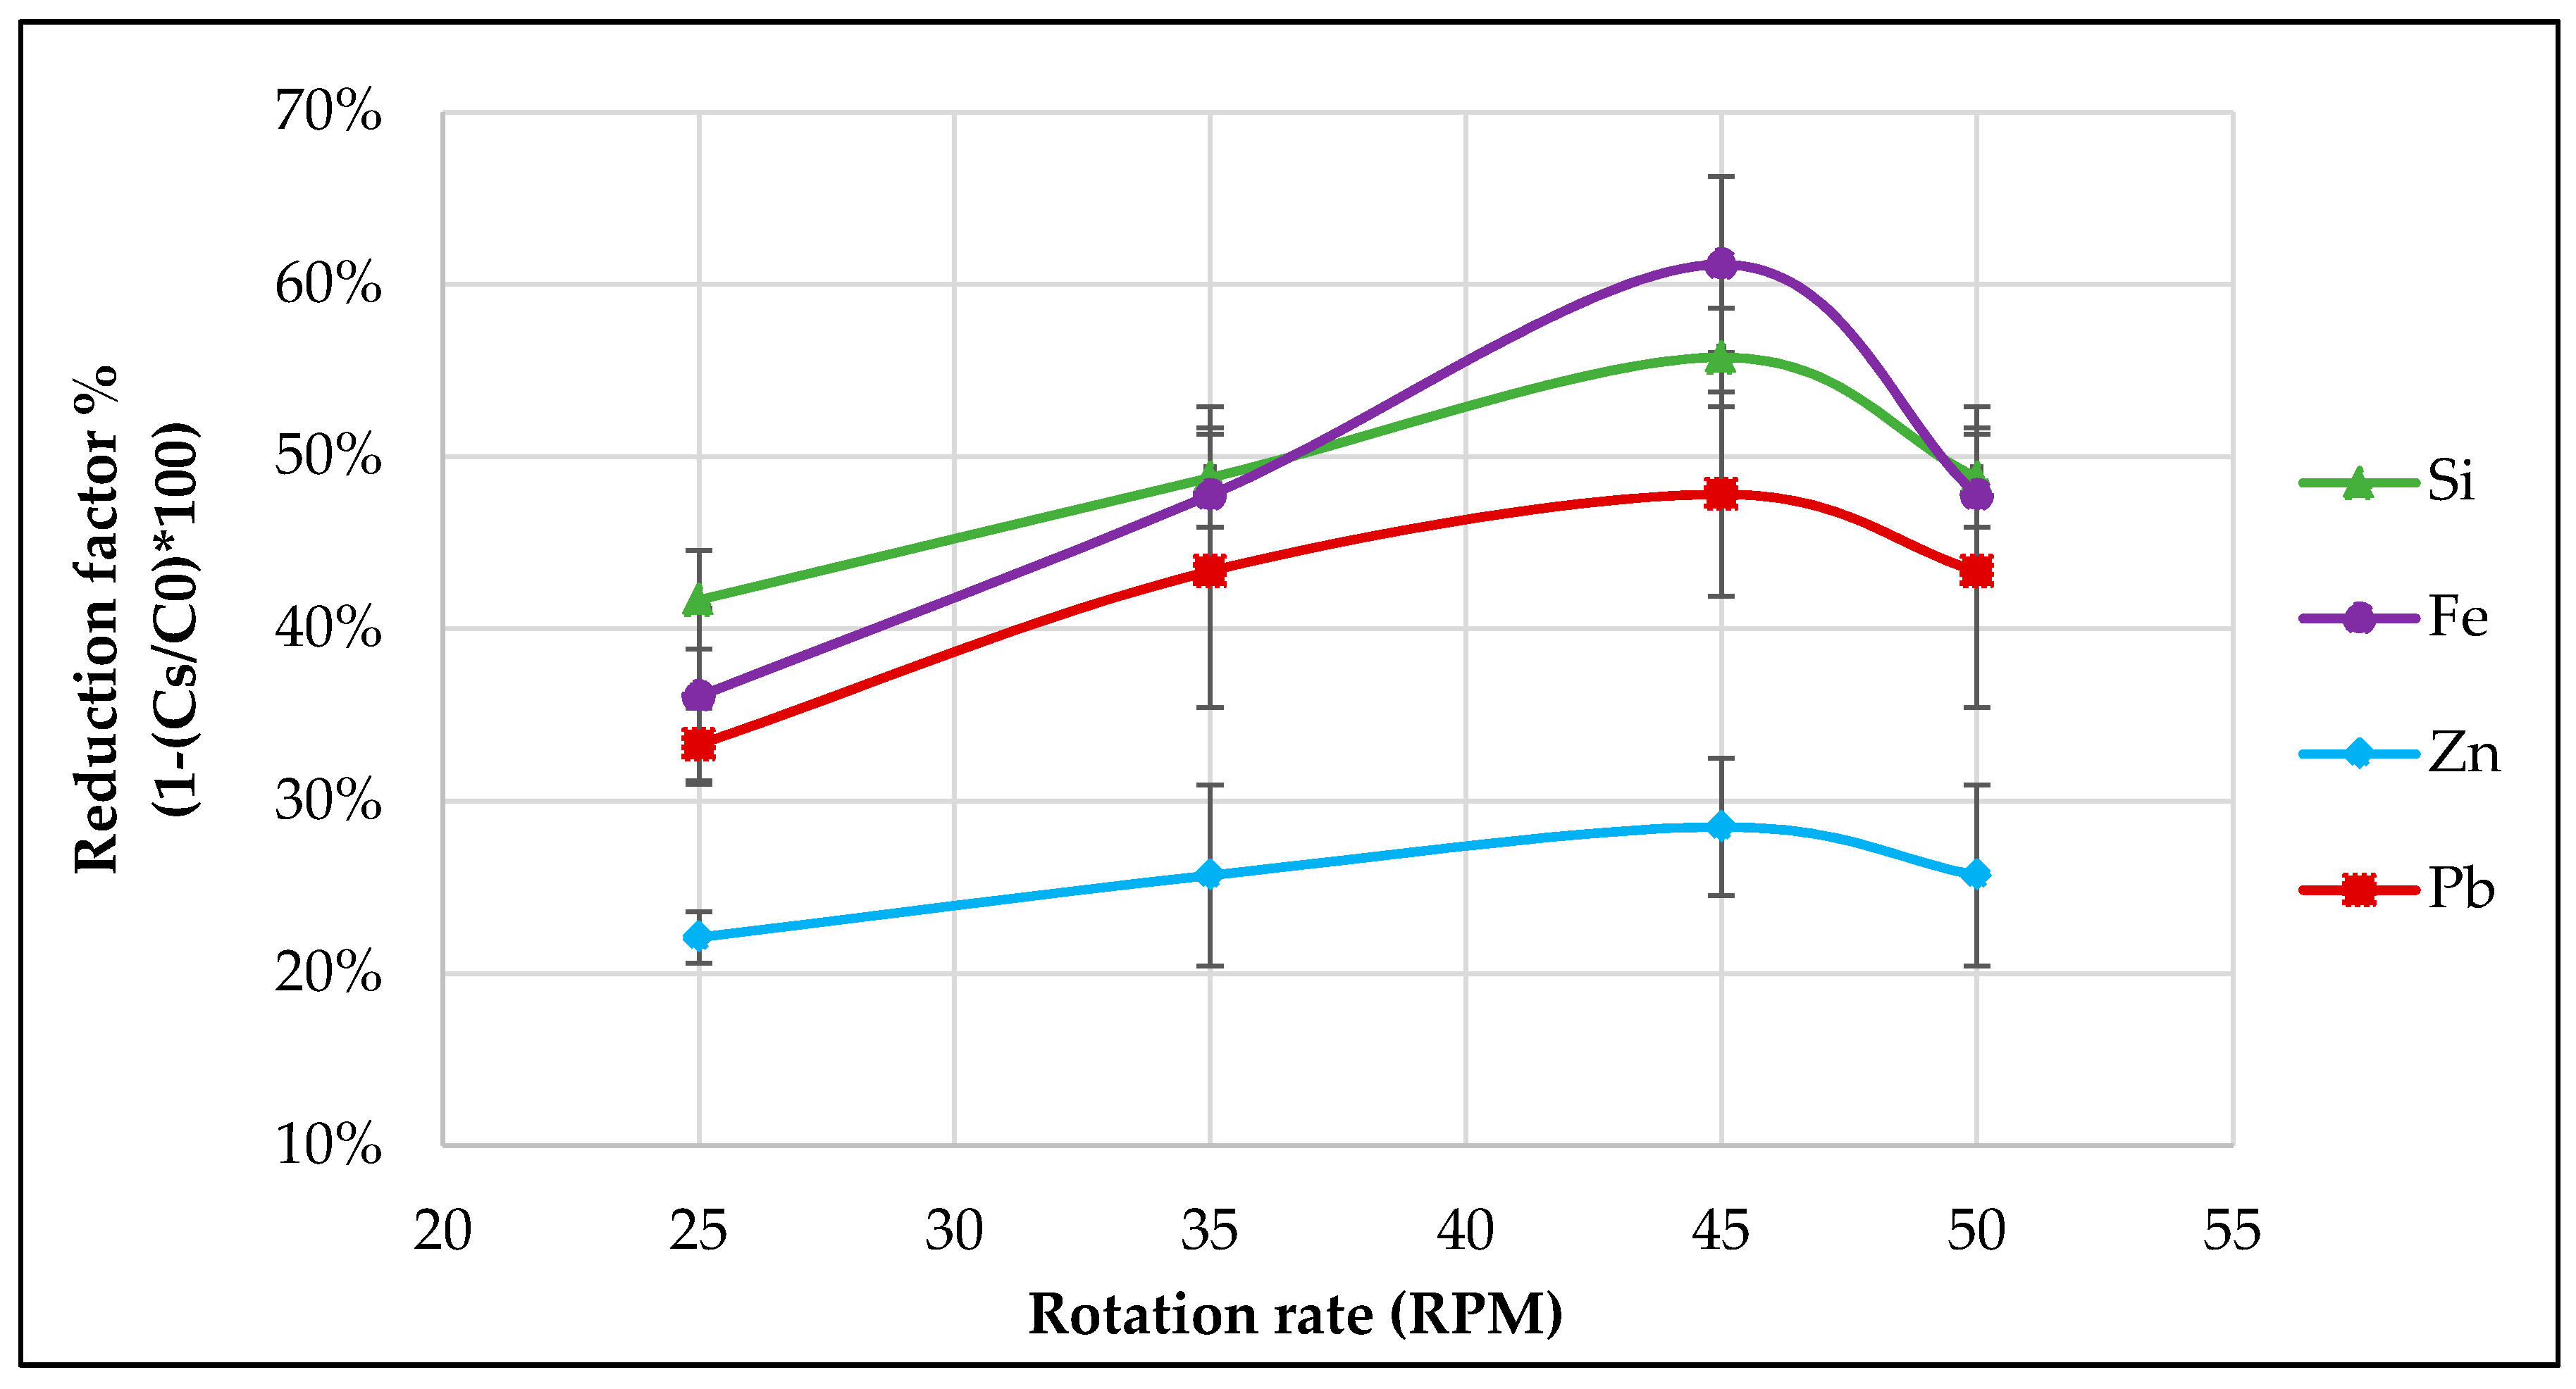
Now, the reduction factor and removal efficiency of different impurities in aluminum via cooled finger at different rotation rates has been illustrated in Figure 6. In these graphs, a significant rise in the reduction factor (%) was observed with increasing rotation rate. This tendency though ends after achieving the maximum peak at 45 rpm. Up to this peak, the behavior of the impurity removal follows Equations (2) and (3), where increasing the rotation rate caused the thickness of the diffusion layer and at the same time the effective distribution coefficient to decrease. After the maximum peak, the efficiency of all impurities dropped, while applying a higher rotation rate (50 rpm) had a contrary influence on the reduction factor tendency. That can be explained by the effect of rotation on the average growth rate of the crystallized material (see Table 3) as well as by using the theory that the rotation of the Cooled Finger increases the mass transport of the molten aluminum coming from the warmer crucible wall in direction to the solid-liquid interface. This phenomenon contributes to the breakdown of the growth front and generates a back melting effect [12]. It leads to an equilibrium between the melt and the crystallization front, as the latter does not grow any more. In such a case, the probability of the previously rejected solute being crystallized becomes greater. It can be hence concluded that beside 50 L/min as the most optimum cooling gas flow rate, 45 rpm can be considered to be the most optimum rotation rate among the investigated experimental parameters.
3.3. Effect of Type and the Concentration of the Impuriies on the Removal Efficiency
In the third part of the experimental trials, the initial concentration as well as the influence of additional impurities on the removal efficiency of Pb and Zn was investigated. Although, according to the previous chapter the most optimum rotation velocity was identified as 45 rpm, in this series of experiments the lowest rotation (25 rpm) was selected in order to suppress the positive effect of rotation and just focus on the effect of impurities on their reduction factor. The idea behind the selection of the impurities was that first, lead—a future undesired element in aluminum based on the international environmental rules—has one of the lowest distribution coefficients (0.0007), and second, zinc—one of the most common impurities in secondary aluminum—has one the highest coefficients (~0.4).
Figure 7a illustrates the removal degree of zinc at different initial concentrations, whereas Figure 7b shows that of lead. It can be observed that the initial concentration of the main impurity negatively affects the amount of segregation in the system; i.e., the higher the initial concentration of these impurities, the more difficult it is to remove them and to achieve a desired final purity. Also, there seems to be a technical limit in the amount of impurities segregated, where above a specific concentration (0.1wt % for both Pb and Zn) the reduction factor drops considerably from approximately 80 to 40% for Pb and 40 to 20% for Zn, while taking the more contaminated sample. The impurities are generally concentrated on the boundary layer and transferred—while moving this layer together with the growth front—to the liquid phase. However, this is a velocity-depending phenomena and cannot be accomplished in the case of bigger velocities of the layer movement, known as growth rate. That is why using the same growth rates showed a decrease in the reduction factor while using higher initial concentrations. Whether by decreasing the growth rates, the same removal factor as lower concentrations can be achieved, is still under investigation.
The difference seen in the reduction factor in the case of the same initial concentrations for Zn and Pb can be argued due to the huge differences in their distribution coefficient (see Table 1). Not only the amount of impurities will affect the reduction factor, but also their interaction plays a role on the effectiveness of the segregation of each impurity. Based on this assumption, a series of trials were performed with the same process conditions as above (25 rpm and 50 L/min of cooling gas flow rate). The influence of four impurities (all in 0.1 wt % concentrations) were evaluated in ternary systems and presented in Figure 8. This figure shows that the reduction factor for 4N7-Al with 0.1 wt % Zn reaches approx. 40% (see the patterned column in Figure 8a), which is even decreased if any 0.1 wt % of a second impurity (such as Si, Fe, or Pb) is added to this system. The same effect is valid for the removal of lead (Figure 8b), being significantly degraded if 0.1 wt % iron, zinc, or silicon is present. It is known that the growth front is generally less stable for multi-component systems in comparison with binary systems, as described in the work from Altieri et al. [18]. This instability can cause poor solute segregation and therefore decreasing of the achievable reduction factor. Such interactions could also be due to the formation of intermetallics on the grain boundaries (shown as dark spots in Figure 9). They act as a barrier, preventing further growth of the grains. Small yellow arrows show the boundary of two grains as well as the saturation of impurities on the grain boundary. It can be concluded that through doubling the impurities concentration from 0.1 to 0.2 wt %, every single grain is forced to grow in different orientations. However, dark spots are not only detected on the grain boundary but maybe also inside the grains. That can be because of the general ascending in the impurities concentration, which decreases the removal efficiency. Furthermore, the selected metallography methodology (electrolytic polishing, Baker’s reagent, circular polarized light) is assumed not to be adequate enough to detect and illustrate the whole occurred grain boundaries.
4. Conclusions and Outlook
The cooled finger method is proved to be a potential fractional crystallization to achieve purification on aluminum and therefore suggested to be used as an alternative to the common Zone melting or vertical gradient freeze for other metallic systems like Ge, Si, etc. [19]. Up to this date, this publication was the first oriented research that correlates the general theory of fractional crystallization to the cooled finger method in order to investigate and to stablish a first process window to purify aluminum via cooled finger. The results from the conducted experimental investigations proved the expectation from the theory on fractional crystallization and showed a dependency of the growth rate on the cooling gas flow—as well as rotation rates. The latter has a clear influence on the of purification efficiency.
The cooling at the solid/liquid growth interface together with the heat transfer from this interface to the solid phase enables an ever growing of the crystallized aluminum. Therefore it can be concluded that the growth rate is not only driven by the kinetics but also significantly by the heat transfer. The influences of other parameters like rotation and temperature gradient should be taken into account, since they have a significant impact on the achieved growth rate.
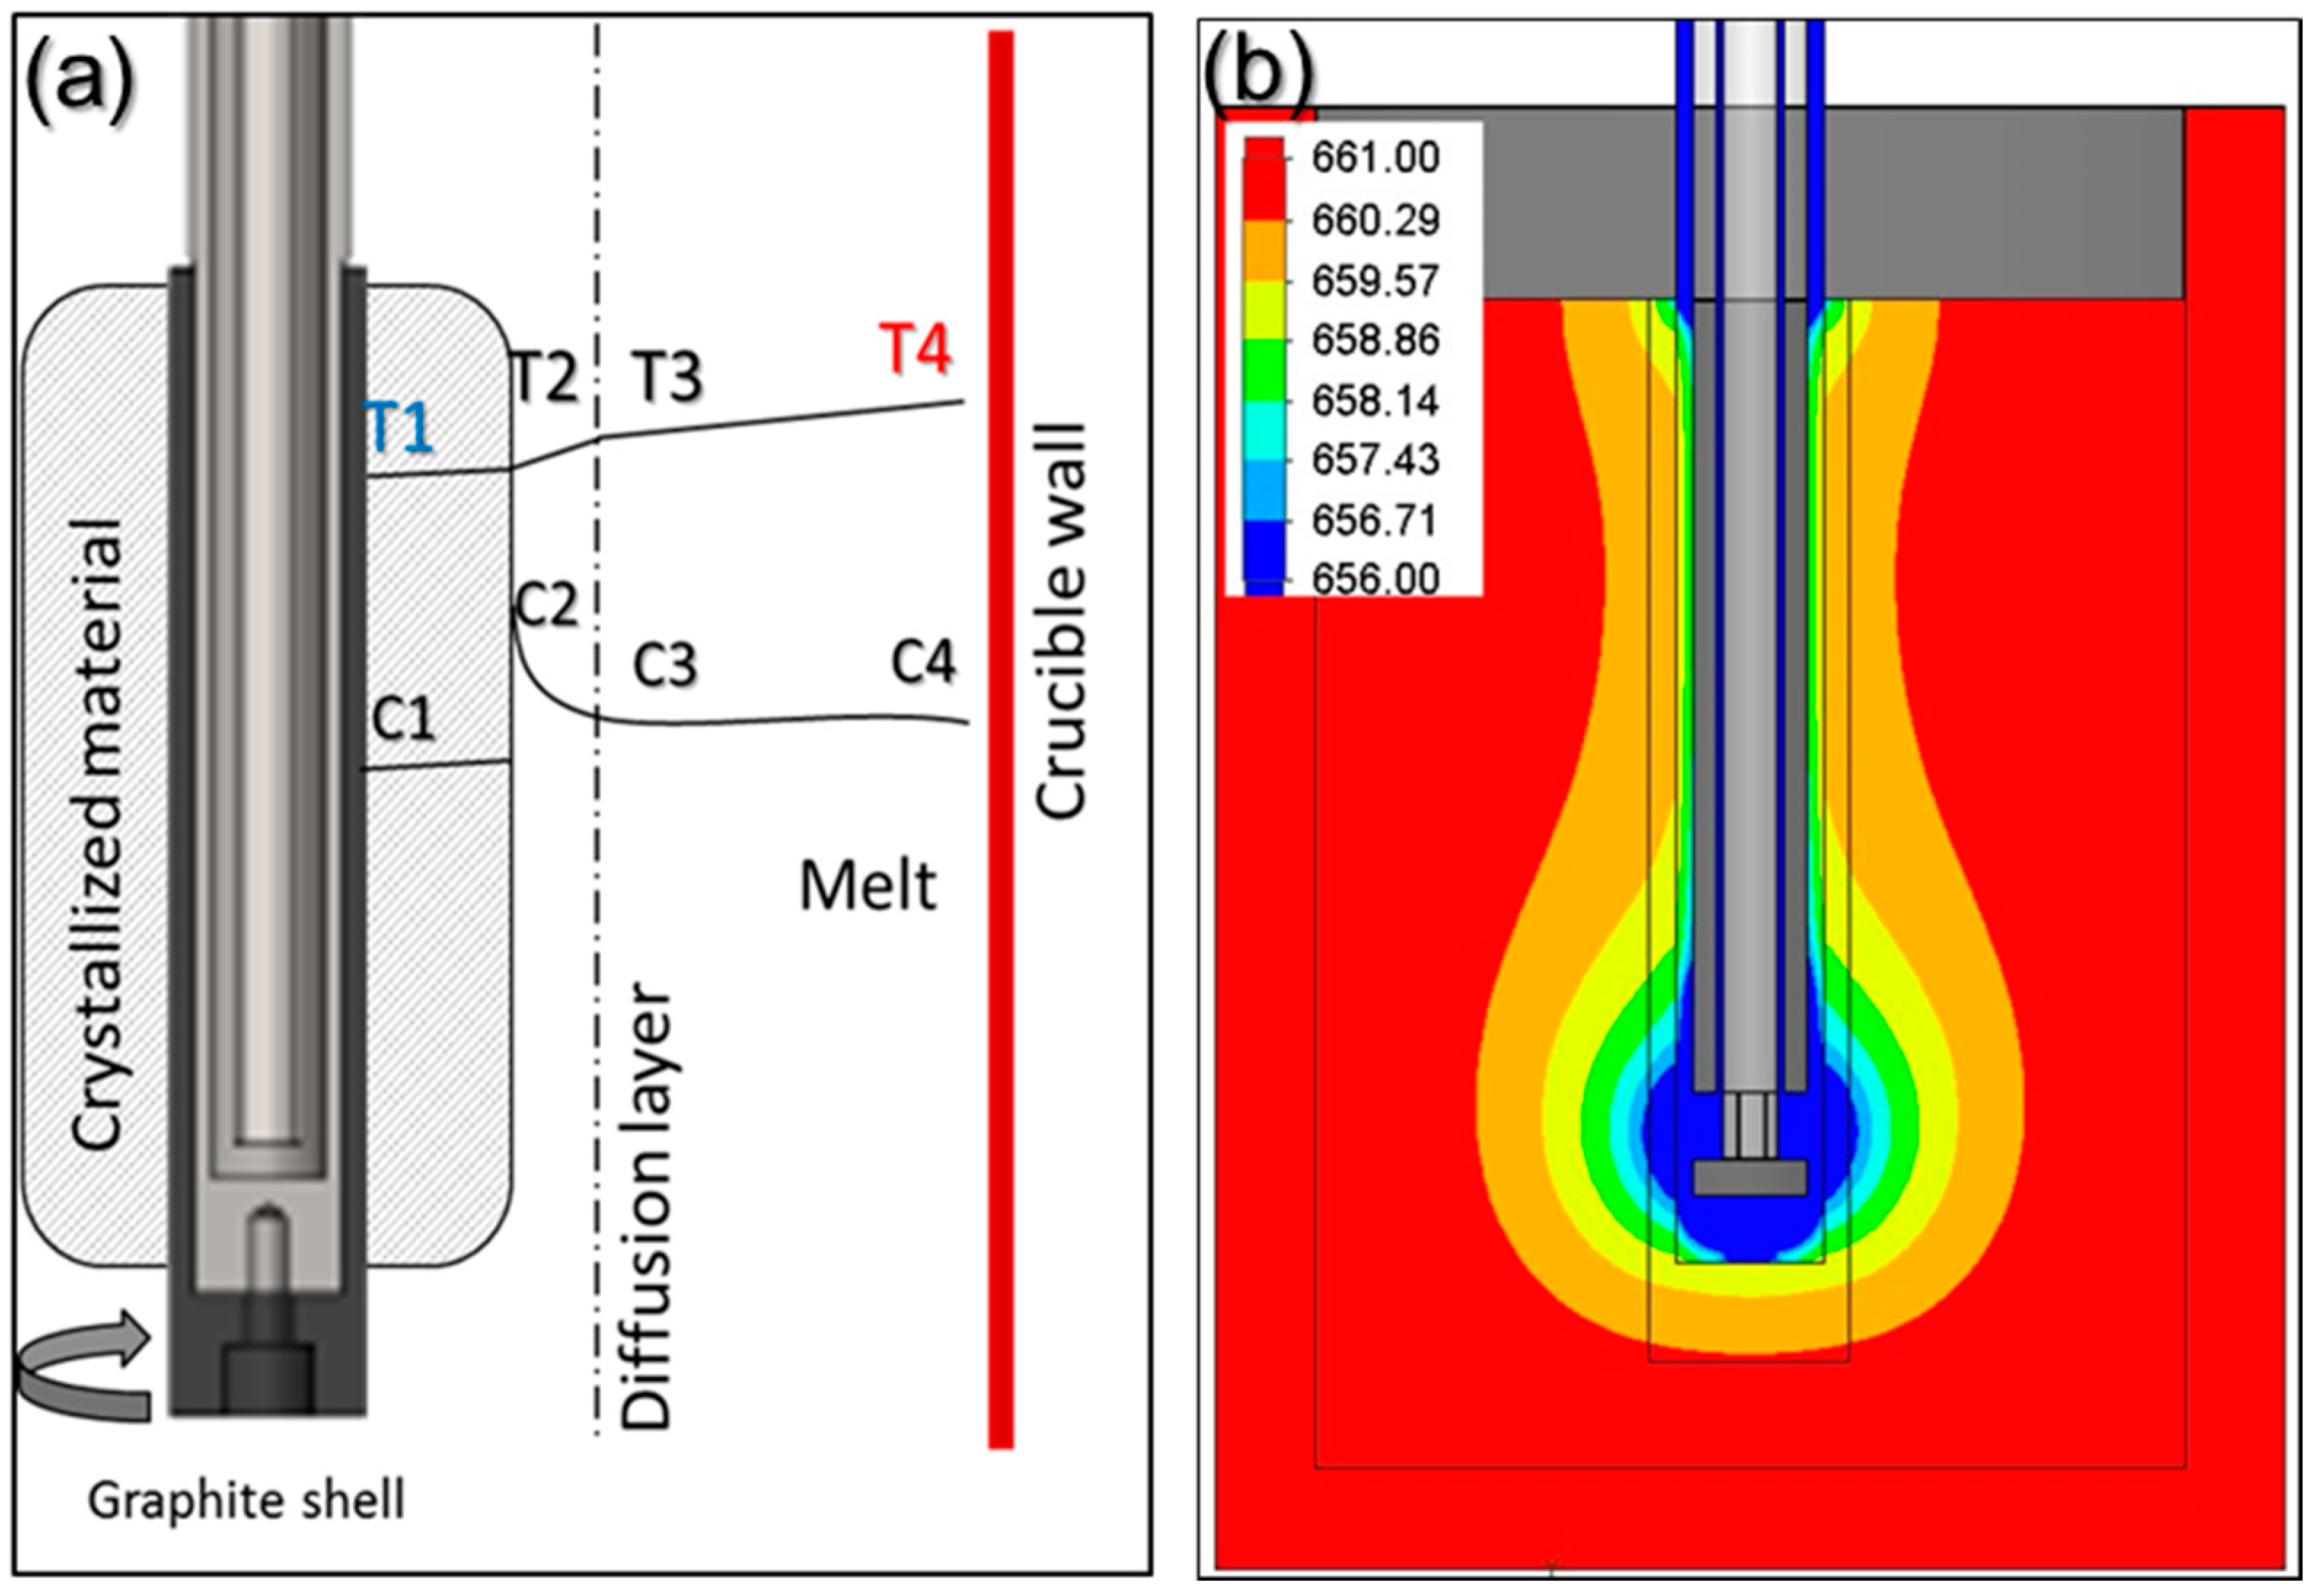
With the help of the software Solidworks® (version 2017, Dassault Systèmes, Waltham, MA, USA), a basic simulation was performed (see Figure 10b) representing the temperature profile in the melt and in the crystallized material. The results showed that the variation in the temperature gradient between the melt adjacent to crucible wall (T4) and the solidification front (T2) is in the order of 0.9 °C (comparing Figure 10a,b). When rotation is applied during the experiments, it promotes a forced convection that assists on the reduction of this thermal gradient. This reduction will also decrease the average growth rate, as seen on Table 3. Additionally, based on the theory of fractional crystallization (Equation (2)) and the experimental results shown in Figure 6, it is assumed that the applied rotation contributed in the decrease of the diffusion layer thickness, favoring a more efficient rejection of the solute into the melt.
With increasing the crystallized material diameter, the growth rate decreases due to the less efficient cooling of the solid formed, the proximity of the solid/liquid interface to the crucible wall and therefore smaller temperature gradient. Though, this fact wasn’t investigated in this paper due to the impossibility of an accurate measurement of the growth rate during the process. One alternative is to perform a “striation” trial, where for certain periods of time a disturbance on the growth front is generated by e.g., drop of temperature or addition of extra impurities [20,21]. A microscopy analysis later will reveal the intervals in distance of these disturbances and the growth rate across the whole crystallized material can be calculated. Despite the fact that smaller growth rates lead to a better purification efficiency, drastic reduction in growth rate can lead to higher process time and therefore an optimum thermal gradient and declining the solute build-up in the boundary layer by promoting an efficient mixing in the melt should be maintained. Also, the application of the most optimum combination of rotation- and cooling rate in the cooled finger method will allow a more efficient end-purification. This promotes a stable boundary layer, which together with a proper temperature gradient, allows a uniform growth as well as a controlled segregation of impurities. Higher rotation rates proved beneficial for the purification but at very high levels it rather causes a drop in purification, most likely due to back melting effect caused by high turbulence flow on the growth front.
The purification factor obtained from the experiments showed a strong dependence on the process parameters, the initial chemical composition and the concentration of the impurities as well as the interaction between the impurity elements. The reduction factors of Pb and Zn revealed to be negatively affected by the other accompanying elements such as Fe and Si. Disturbances in the growth front are more likely to occur in multicomponent systems than in binary ones. A reduction in the growth rate of the process in order to keep the growth front stable will result in a higher reduction factor of impurities. This effect can be induced by an optimization in the rotation rate, therefore reducing the diffusion layer thickness. In addition, lower amounts of impurity (e.g., 0.025–0.05 wt %), results a much higher reduction factor, however, extreme lower initial concentration of the impurities were not yet studied in this proof of principle investigation.
The advantages of the cooled finger method in comparison with zone melting are the higher production rate and more efficient segregation of impurities. The crystallized material in the cooled finger process grows radially and generates a much bigger volume, while the growth in zone melting is in one direction along the length of a metallic bar and produces smaller masses. This fact in combination with the potential of cooled finger process to be scaled up to at least hundreds of Kilograms leads to significantly higher production rate in comparison to zone refining. Another advantage of cooled finger is its controllable mixing next to the growth front, leading to a decrease the diffusion layer thickness as described in page 2 (Equation (2)). The mixing behavior in cooled finger methodology is a mechanical aspect and independent from the heating behavior of the system. In contrast and in spite of applying induction heating in zone refining and hence inducing a turbulence at the growth front as well, the same fine controlling cannot be managed, because by changing the induction power not only the diffusion layer but also the zone length would be changed. All these aspects make the cooled finger technique a promising alternative to the currently common methods.
Acknowledgments
The Authors would like to appreciate the analytical contributions of Talal Al Samman and David Beckers from IMM—Institute of Physical Metallurgy and Metal Physics/RWTH Aachen University for the kind supply of the micrographic analyses. Also, many thanks to the CNPQ-Brazilian National Council for Scientific and Technological Development for the financial support of the Brazilian scholarship holder and guest researcher Danilo Coladetti Curtolo.
Author Contributions
Bernd Friedrich was the principal investigator. Semiramis Friedrich and Danilo C. Curtolo conceived and designed the experiments. Dominic Bellin and Gargi S. Nayak performed the experiments. Semiramis Friedrich, Danilo C. Curtolo, Dominic Bellin and Gargi S. Nayak analyzed the data. Danilo C. Curtolo and Semiramis Friedrich wrote and edited the manuscript.
Conflicts of Interest
The authors declare no conflicts of interest.
References
- Weiser, K. Theoretical calculation of distribution coefficients of impurities in germanium and silicon, heats of solid solution. J. Phys. Chem. Solids 1958, 7, 118–126. [Google Scholar] [CrossRef]
- Pfann, W.G. Zone melting: This technique offers unique advantages in purification and in control of composition in various substances. Science 1962, 135, 1101–1109. [Google Scholar] [CrossRef] [PubMed]
- Cheung, N.; Bertazzoli, R.; Garcia, A. Experimental impurity segregation and numerical analysis based on variable solute distribution coefficients during multi-pass zone refining of aluminum. J. Cryst. Growth 2008, 310, 1274–1280. [Google Scholar] [CrossRef]
- Burton, J.A.; Prim, R.C.; Slichter, W.P. The Distribution of Solute in Crystals Grown from the Melt. Part II. Experimental. J. Chem. Phys. 1953, 21, 1991–1996. [Google Scholar] [CrossRef]
- Burton, J.A.; Prim, R.C.; Slichter, W.P. The Distribution of Solute in Crystals Grown from the Melt. Part I. Theoretical. J. Chem. Phys. 1953, 21, 1987–1991. [Google Scholar] [CrossRef]
- Tiller, W.; Jackson, K.; Rutter, J.; Chalmers, B. The redistribution of solute atoms during the solidification of metals. Acta Metall. 1953, 1, 428–437. [Google Scholar] [CrossRef]
- Ostrogorsky, A.G.; Glicksman, M.E. Segregation and Component Distribution. In Handbook of Crystal Growth: Bulk Crystal Growth, 2nd ed.; Elsevier: Amsterdam, The Netherlands, 2014; Volume II-A, pp. 1008–1009. [Google Scholar]
- Porter, D.A.; Easterling, K.E. Solidification. In Phase Transformations in Metals and Alloys, 2nd ed.; Chapman & Hall: London, UK, 1992; pp. 209–215. [Google Scholar]
- Chatelain, M.; Albaric, M.; Pelletier, D.; Botton, V. Solute segregation in directional solidification: Scaling analysis of the solute boundary layer coupled with transient hydrodynamic simulations. J. Cryst. Growth 2015, 430, 138–147. [Google Scholar] [CrossRef]
- Wilson, L.O. On interpreting a quantity in the burton, prim and slichter equation as a diffusion boundary layer thickness. J. Cryst. Growth 1978, 44, 247–250. [Google Scholar] [CrossRef]
- Rudolph, P.; Nishinga, T. Handbook of Crystal Growth: Bulk Crystal Growth; Elsevier: Amsterdam, The Netherlands, 2014; Volume II-B, pp. 389–397. [Google Scholar]
- Hannibal, W.D.; Ibe, G.; Kurre, K.; Peychal-Heiling, H. Entwicklung Eines Technischen Verfahrens zur Herstellung von Reinstaluminium für die Kyroelektrotechnik, Speziell für Kyromagnete; Zentralstelle für Luft-u. Raumfahrtdokumentation u.-information: Munich, Germany, 1974. [Google Scholar]
- Barthel, J.; Buhirg, E.; Al, E. Kristallisation Aus Schmelzen; Verlag für Grundstoffindustrie Leipzig: Leipzig, Germany, 1982. [Google Scholar]
- Widiatmo, J.V.; Harada, K.; Yamazawa, K.; Arai, M. Estimation of impurity effect in aluminium fixed-point cells based on thermal analysis. Metrologia 2006, 43, 561–572. [Google Scholar] [CrossRef]
- Hashimoto, E.; Ueda, Y.; Kino, T. Purification of Ultra-High Purity Aluminum. J. Phys. IV 1995, 5, C7-153–C7-157. [Google Scholar] [CrossRef]
- Shingu, H.; Arai, K.; Sakaguchi, M.; Nishide, T.; Watanabe, O.; Tashiro, Y.; Otsuka, R.; Tsukamoto, K. Process for Producing High-Purity Aluminum. U.S. Patent 4,469,512, 4 September 1984. [Google Scholar]
- Friedrich, S.; Curtolo, D.C.; Friedrich, B. Effect of process parameter variation on purity during rotary fractional crystallization of Aluminum. Open J. Met. 2017, 7, 25. [Google Scholar] [CrossRef]
- Altieri, A.L.; Davis, S.H. Instabilities in solidification of multi-component alloys. J. Cryst. Growth 2017, 467, 162–171. [Google Scholar] [CrossRef]
- Curtolo, D.C.; Friedrich, S.; Friedrich, B. High purity Germanium, a review on principle theories and technical production methodologies. J. Cryst. Process Technol. 2017, 7, 79–80. [Google Scholar] [CrossRef]
- Müller, A.; Wilhelm, M. Periodische Temperaturschwankungen in flüssigem InSb als Ursache schichtweisen Einbaus von Te in kristallisierendes InSb. Zeitschrift für Naturforschung A 1964, 19, 254–263. [Google Scholar] [CrossRef]
- Ueda, H. Resistivity Striations in Germanium Single Crystal. J. Phys. Soc. Jpn. 1960, 16, 61–66. [Google Scholar] [CrossRef]

Figure 2.
Principle of cooled finger crystallization concept [16].
Figure 2.
Principle of cooled finger crystallization concept [16].
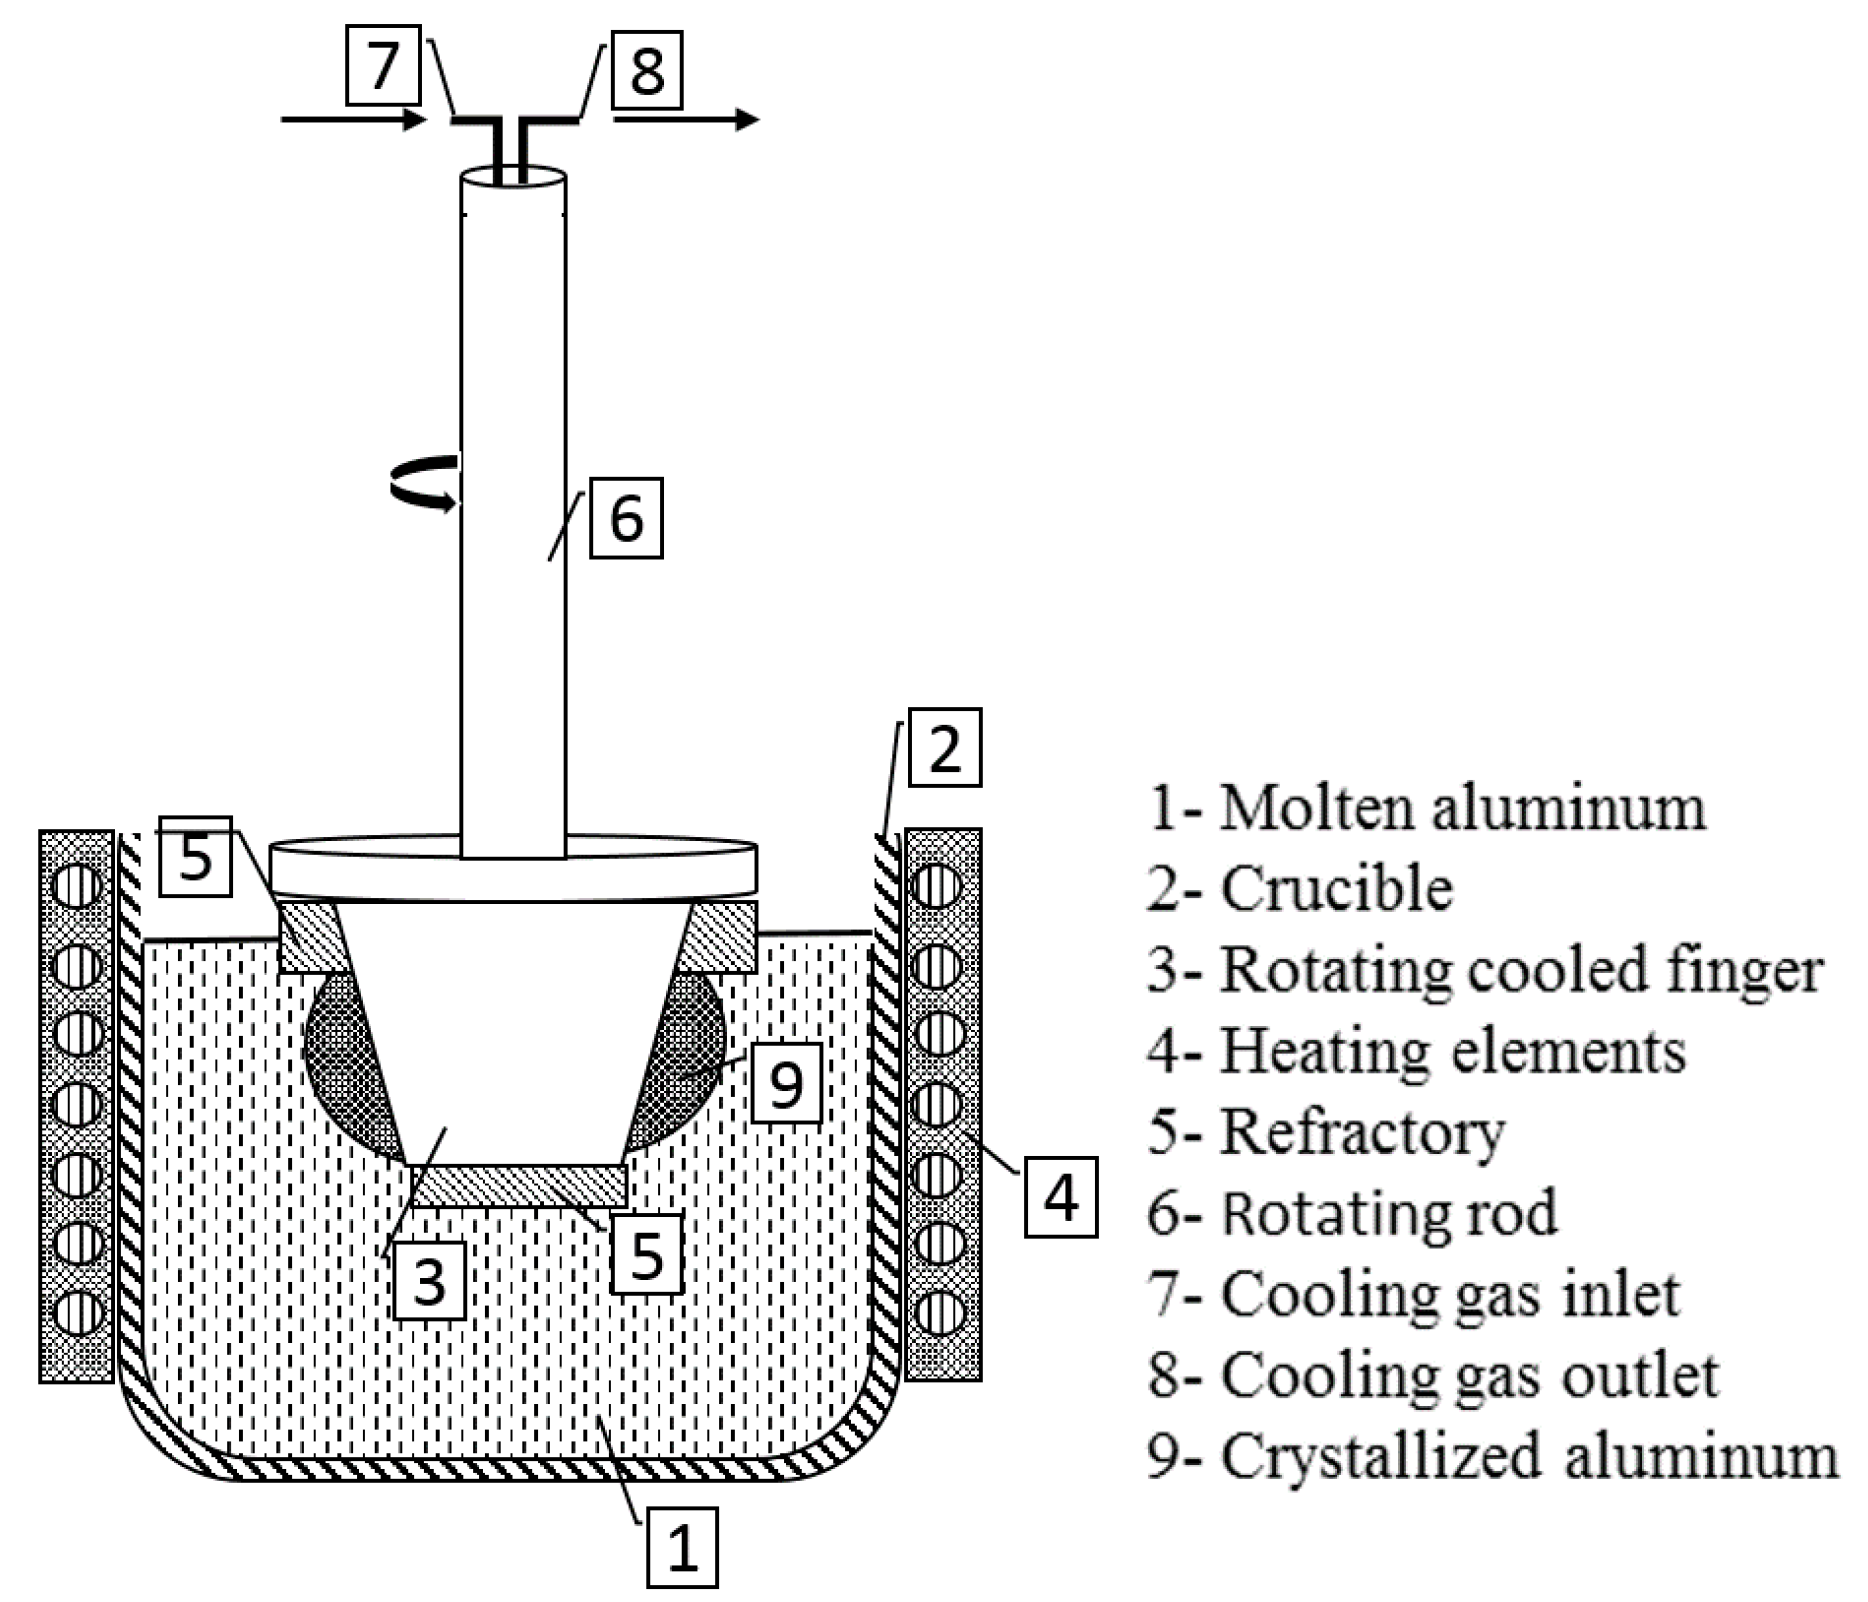
Figure 3.
Experimental apparatus of crystallization including “cooled finger” and rotational system [17].
Figure 3.
Experimental apparatus of crystallization including “cooled finger” and rotational system [17].

Figure 4.
Experimentally obtained average growth rate (μm/s) depending on the cooling gas flow rate (L/min) and rotation speed (rpm) for the crystallization of 4N7 aluminum via cooled finger.
Figure 4.
Experimentally obtained average growth rate (μm/s) depending on the cooling gas flow rate (L/min) and rotation speed (rpm) for the crystallization of 4N7 aluminum via cooled finger.
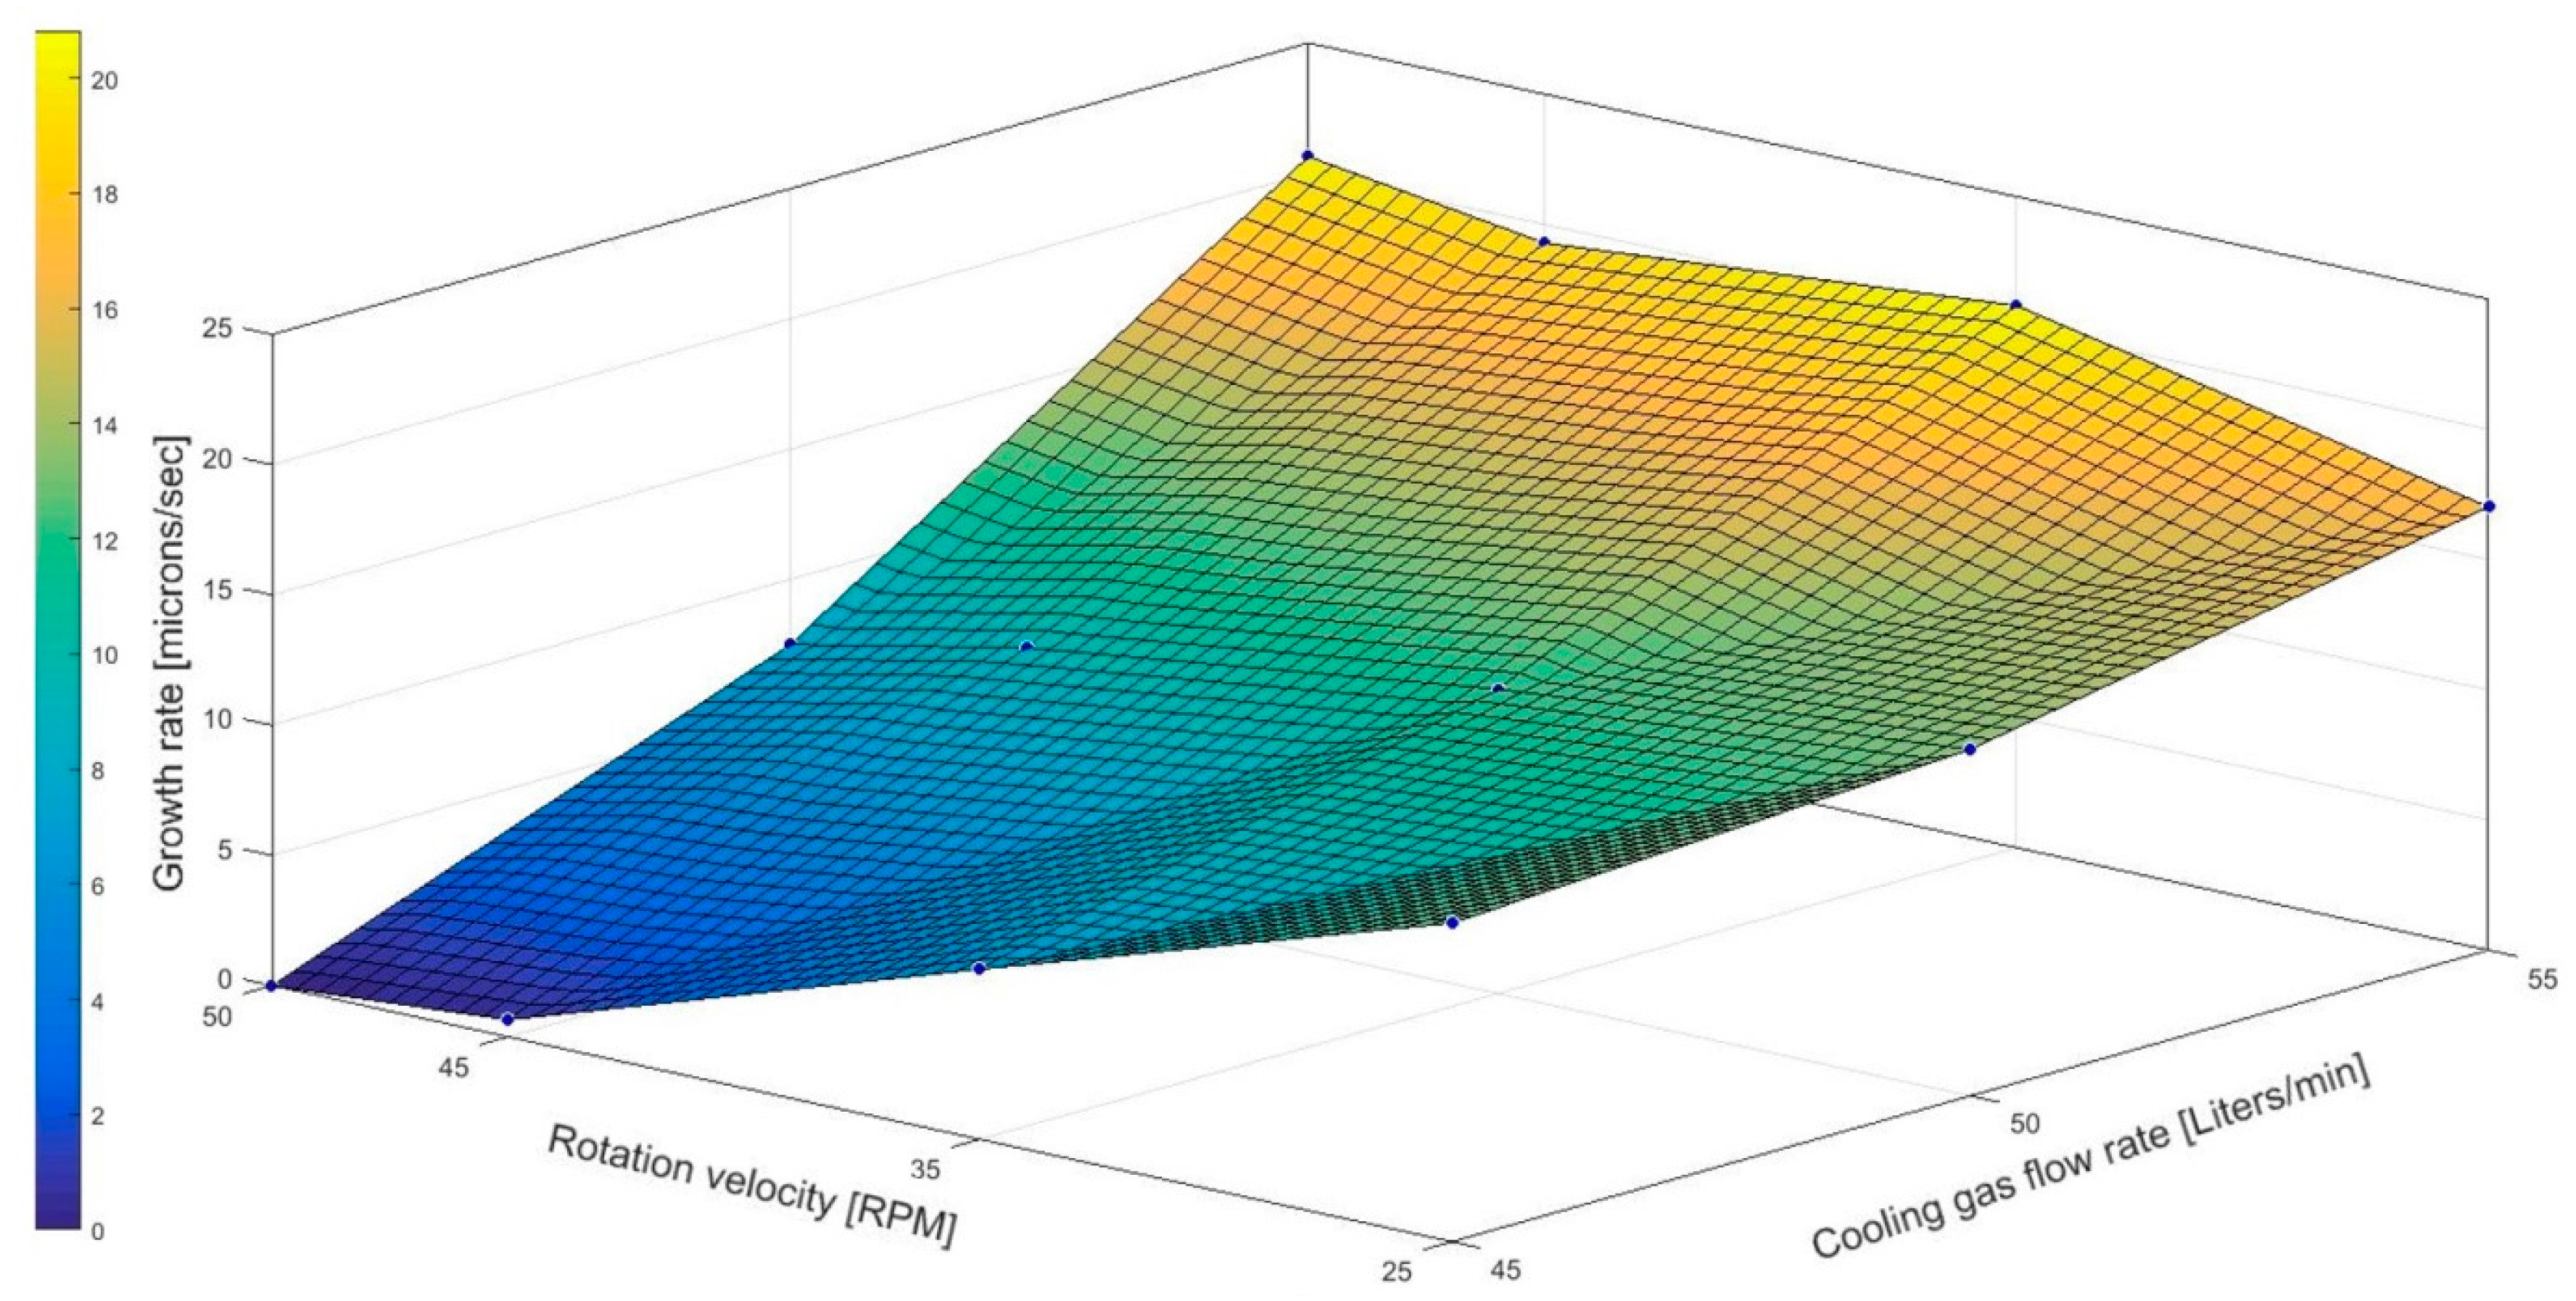
Figure 5.
Example of the OES spark spectrometry analyze for the Fe concentration in an Al–Fe system.
Figure 5.
Example of the OES spark spectrometry analyze for the Fe concentration in an Al–Fe system.

Figure 6.
Plot of reduction factor (%) of impurities in aluminum via cooled finger process and in relation with rotation rate (rpm).
Figure 6.
Plot of reduction factor (%) of impurities in aluminum via cooled finger process and in relation with rotation rate (rpm).

Figure 7.
Influence of impurity concentration on the removal factor of Zn (a) and Pb (b) on an Al–Pb and Al–Zn system (each based on three repetitions).
Figure 7.
Influence of impurity concentration on the removal factor of Zn (a) and Pb (b) on an Al–Pb and Al–Zn system (each based on three repetitions).
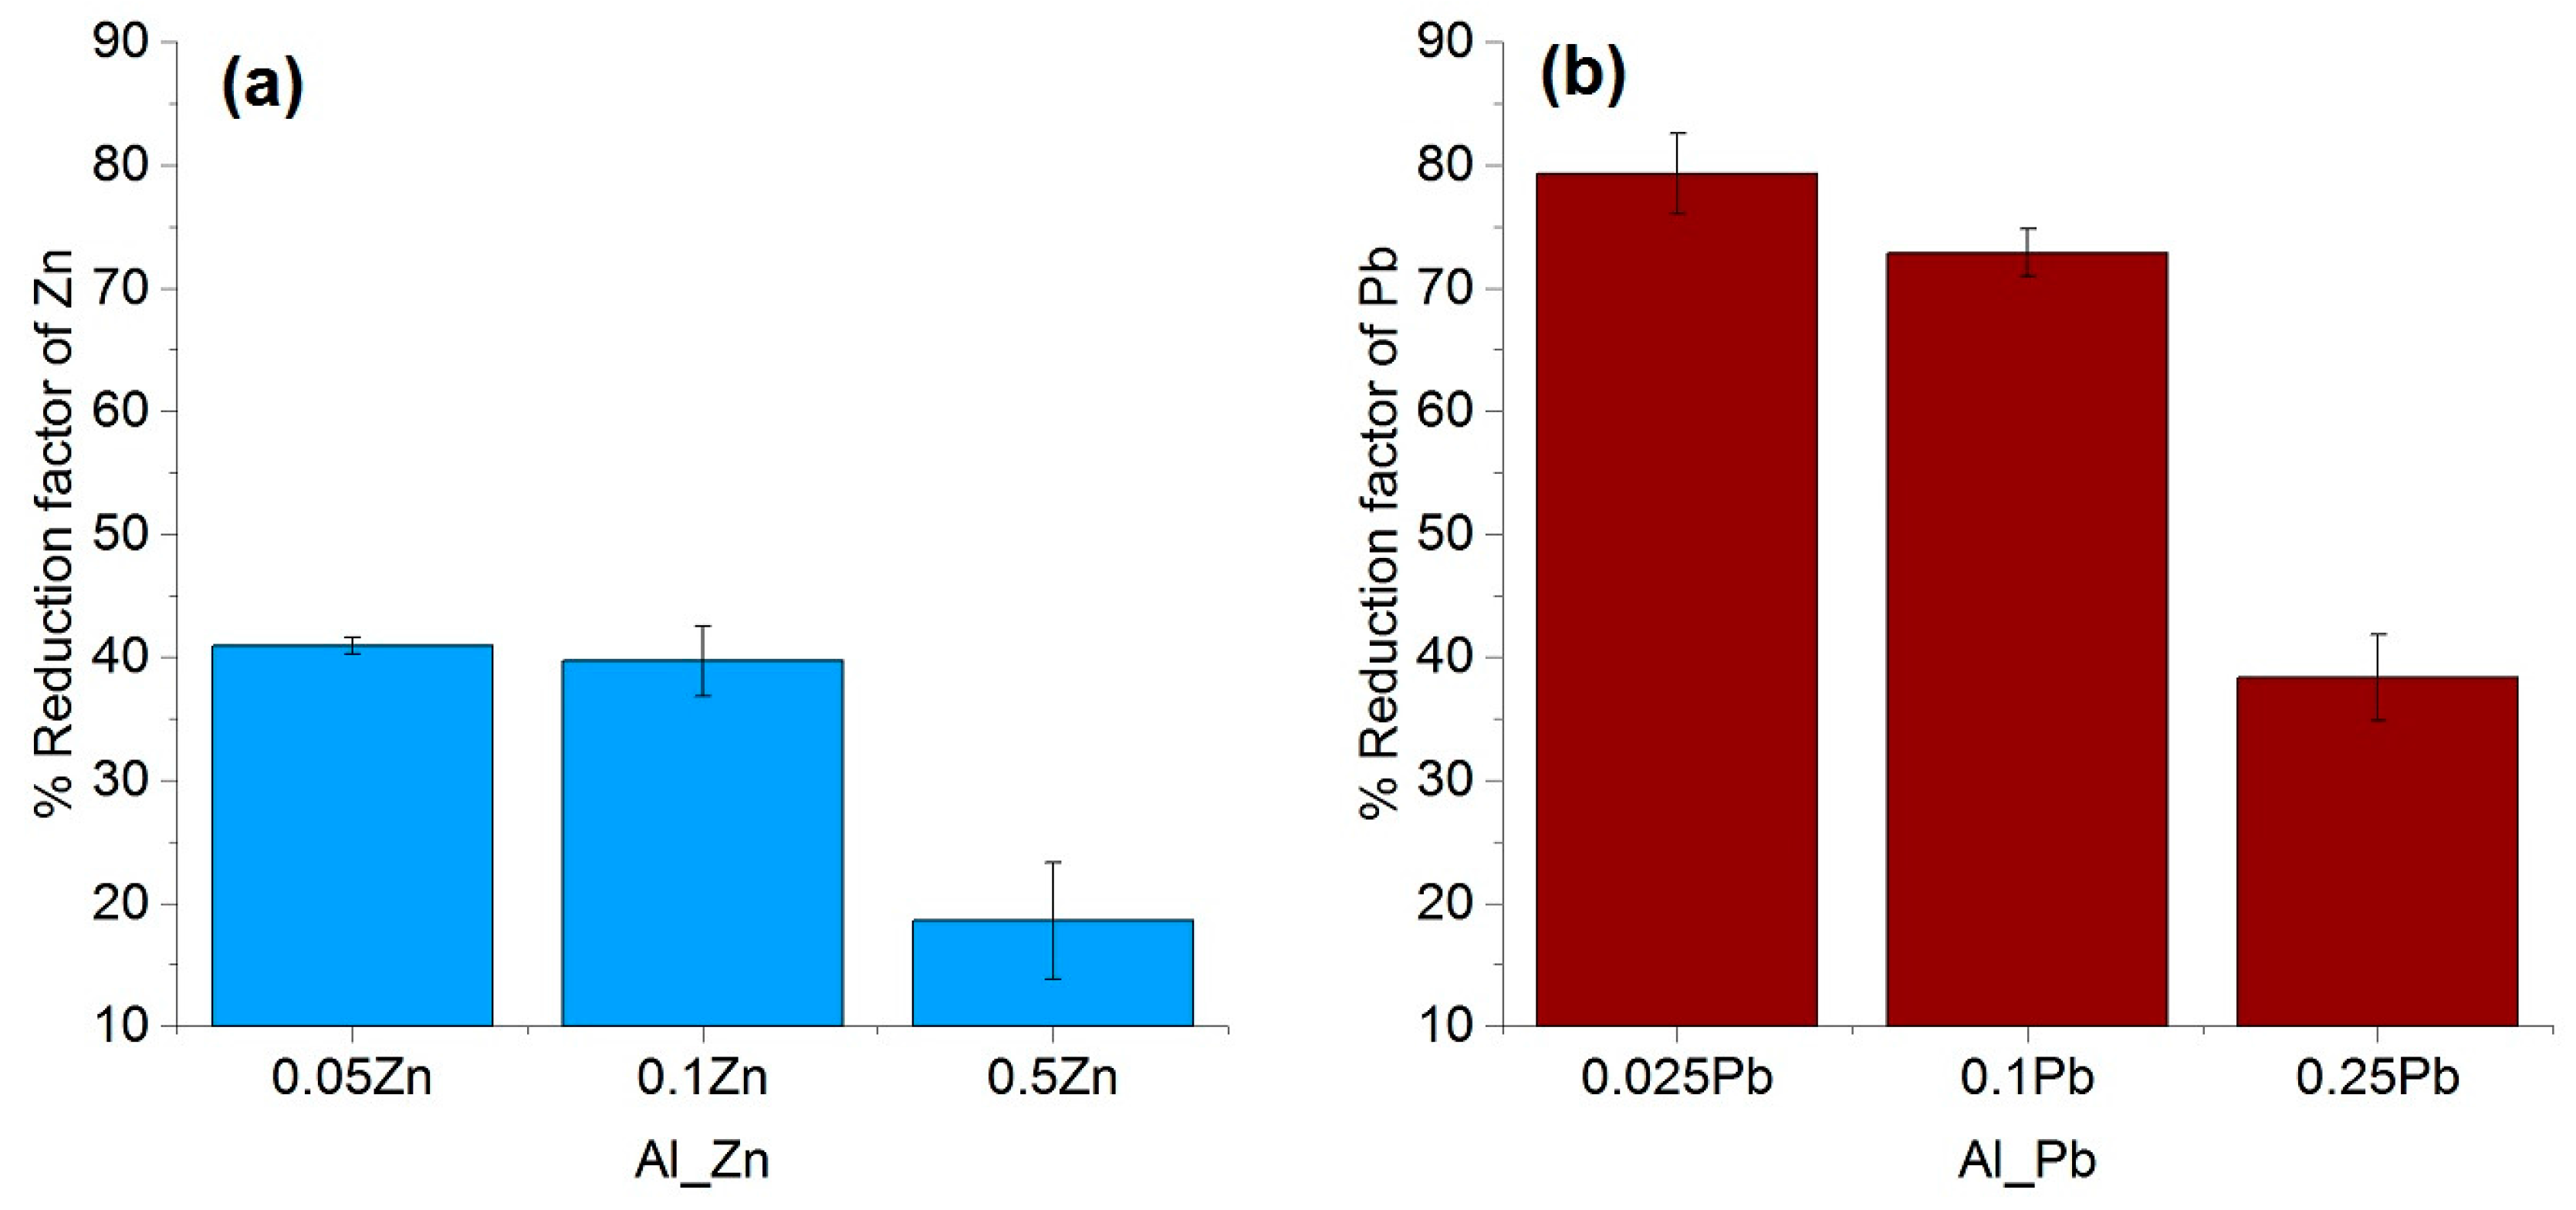
Figure 8.
Influence of additional impurities (each with 0.1 wt % concentration) on the reduction factor of the impurity Zinc (a) or Lead (b) in a system Al–0.1X system (each based on three repetitions).
Figure 8.
Influence of additional impurities (each with 0.1 wt % concentration) on the reduction factor of the impurity Zinc (a) or Lead (b) in a system Al–0.1X system (each based on three repetitions).
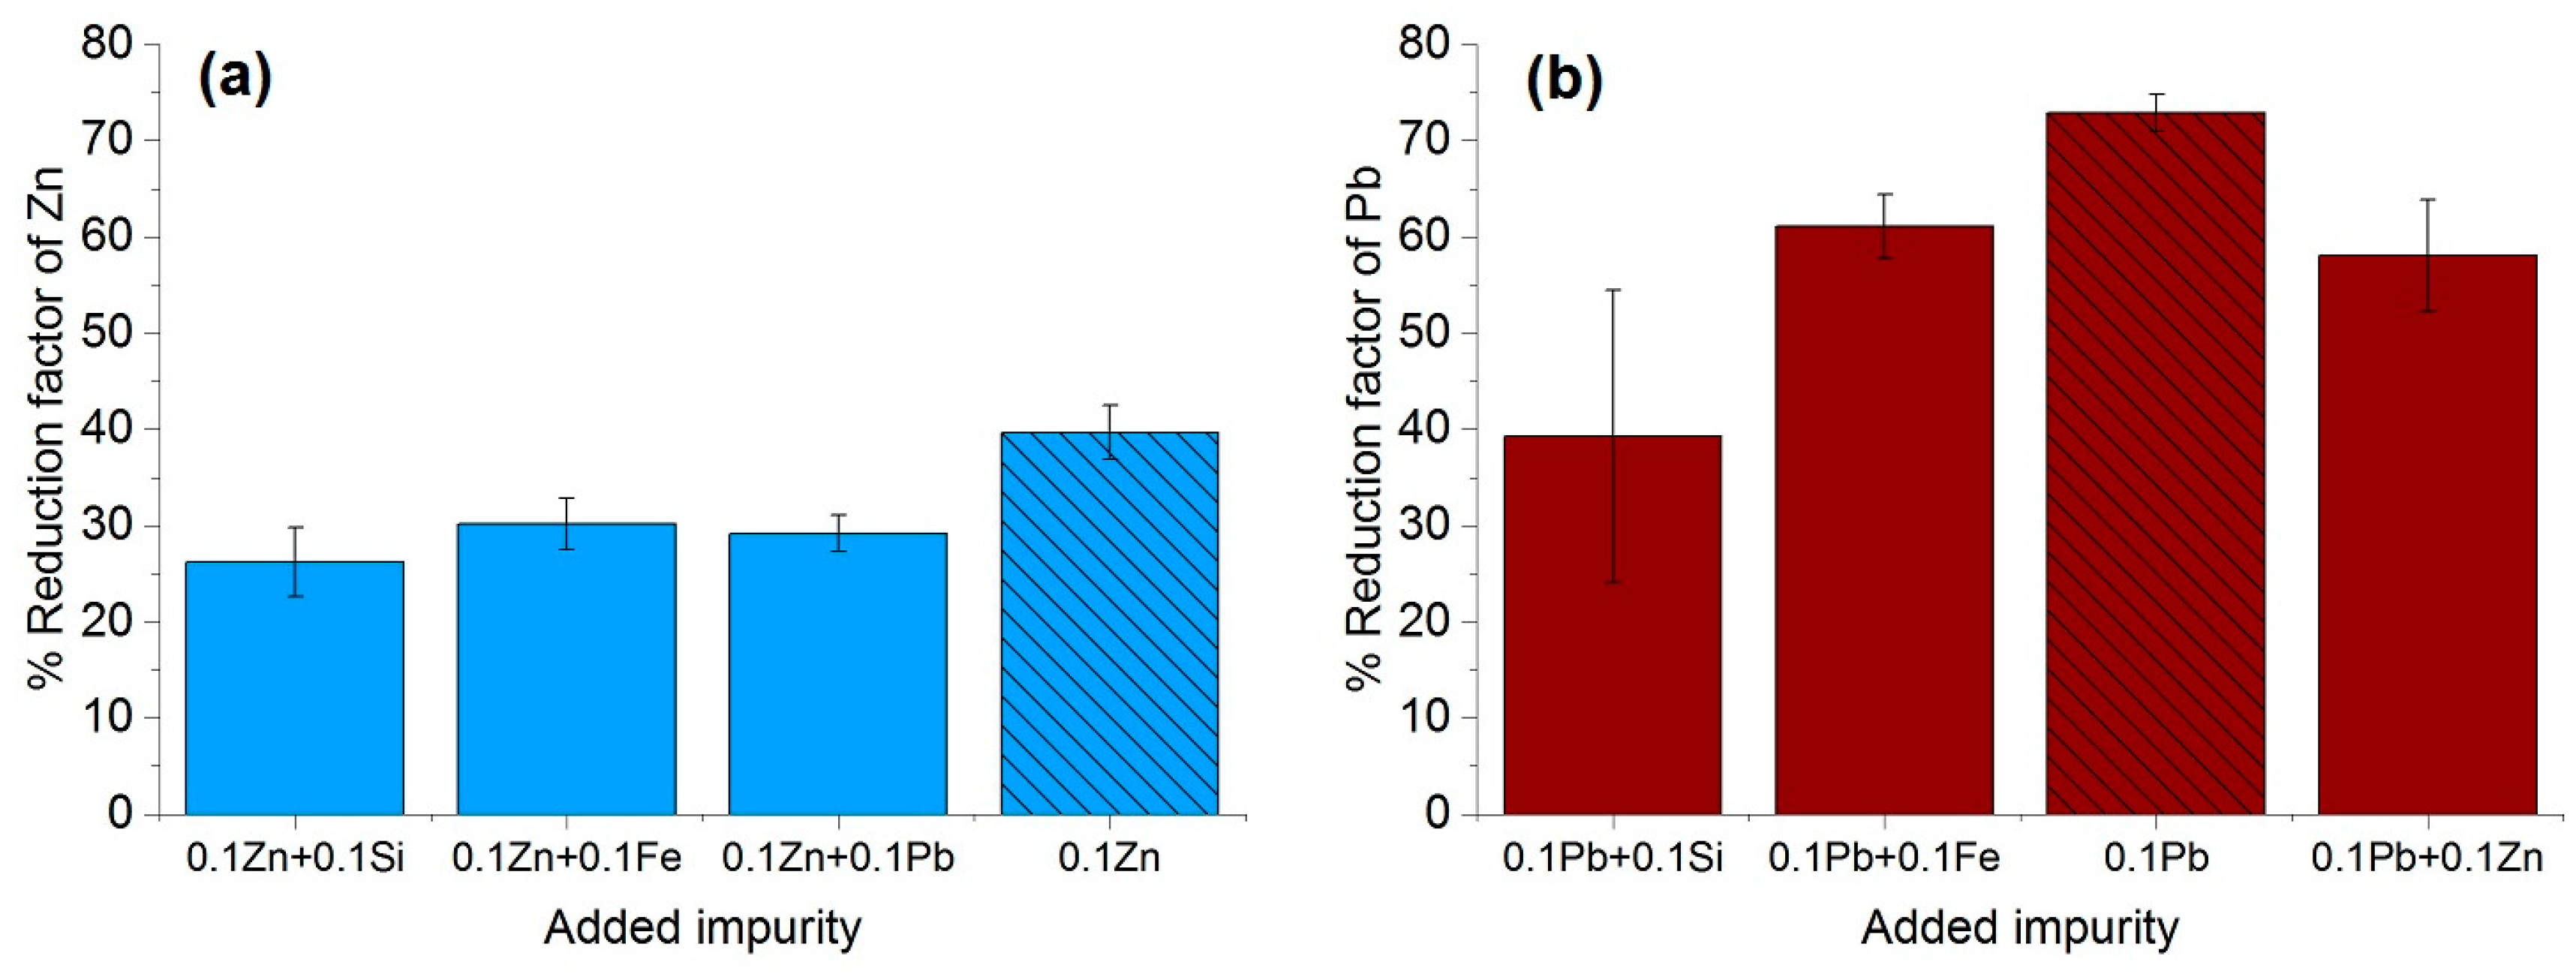
Figure 9.
Micrographic pattern of Al–Zn–Pb with ×50-magnification (FCC-face-centered cubic phases), color pattern relates to different grain orientations showing pure Al.
Figure 9.
Micrographic pattern of Al–Zn–Pb with ×50-magnification (FCC-face-centered cubic phases), color pattern relates to different grain orientations showing pure Al.
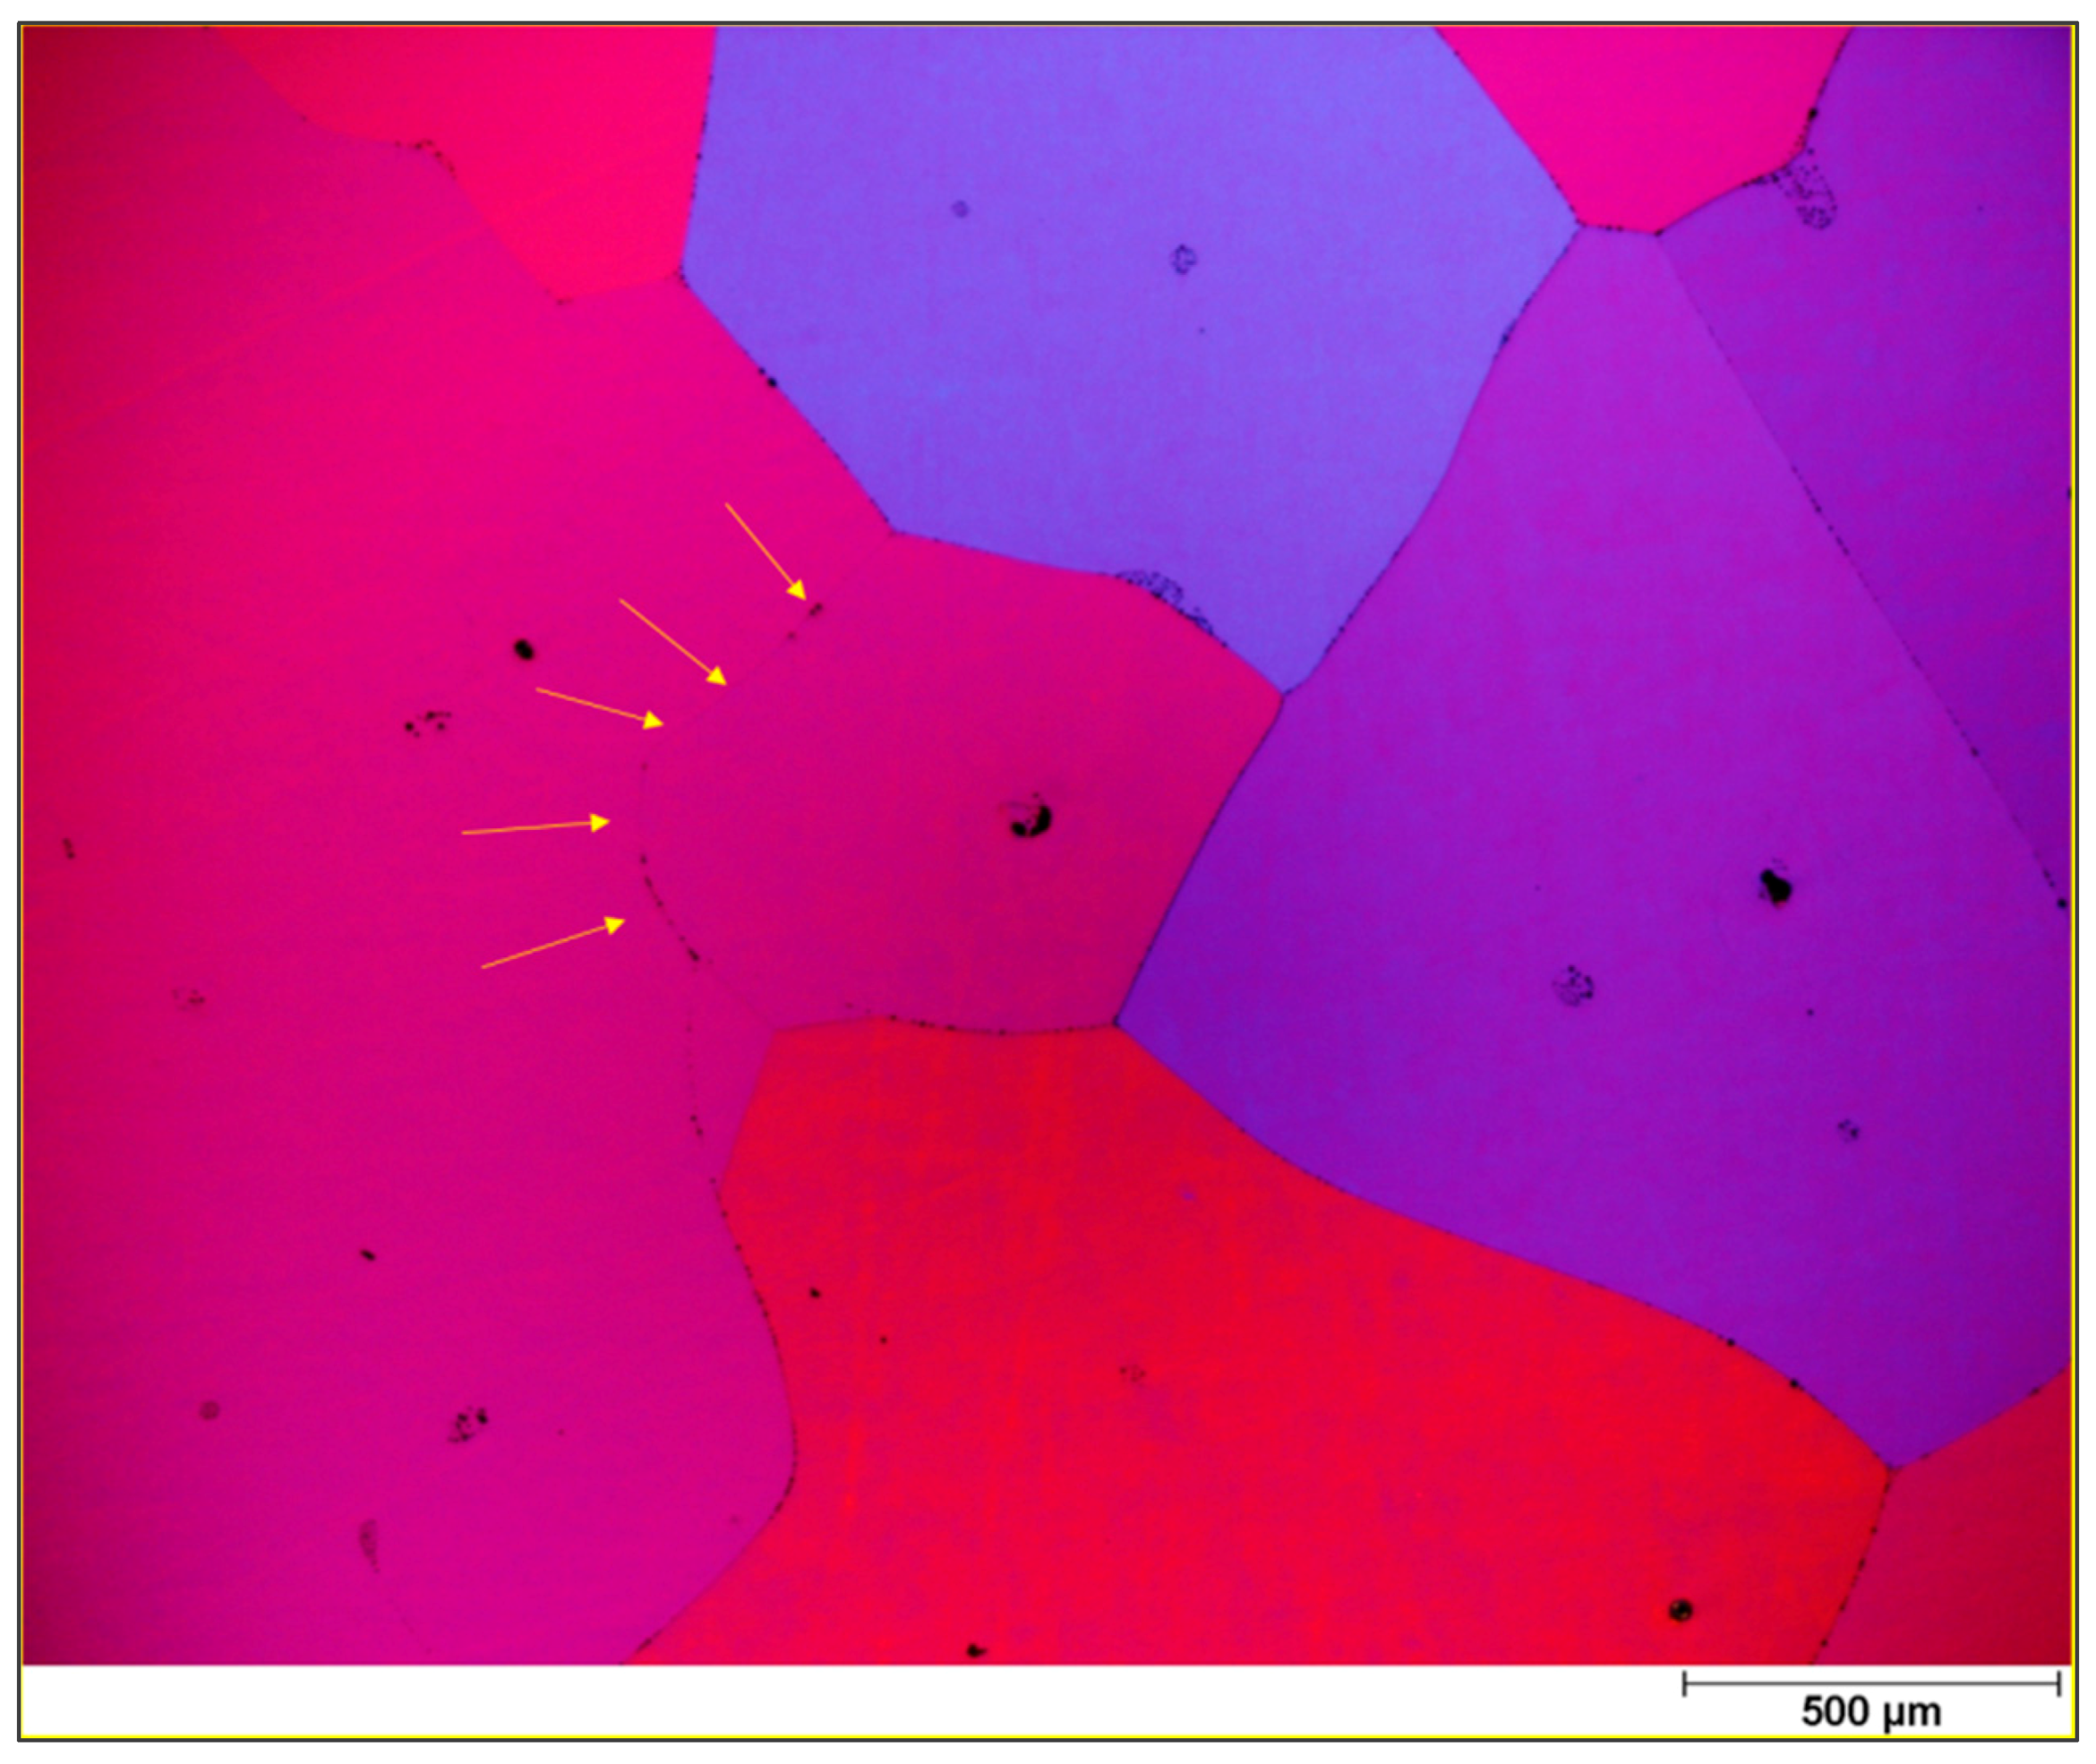
Figure 10.
(a) Schematic of temperature and impurity concentration profile ahead of the solidification front; (b) Simulation of cooled finger and the form of the product based on the temperature profile via Solidworks® 2017.
Figure 10.
(a) Schematic of temperature and impurity concentration profile ahead of the solidification front; (b) Simulation of cooled finger and the form of the product based on the temperature profile via Solidworks® 2017.


Table 1.
Distribution coefficients of impurities in aluminum.
| Element | Range of k | Element | Range of k |
|---|---|---|---|
| Fe [12,13,14] | 0.018–0.053 | Ti [12,14] * | 7–11 |
| Cu [12,13,14] | 0.15–0.153 | Si [12,13,14] * | 0.082–0.12 |
| Ag [12,13] | 0.2–0.3 | K [14] | 0.56 |
| Au [12,13] | 0.18 | Zr [14] * | 2.3–3 |
| Zn [12,14] * | 0.35–0.47 | Pb * | 0.0007 |
| Ni [12,13,14] * | 0.004–0.09 | P [12,13] | <0.01 |
| Mn [12,14] * | 0.55–0.9 | Sc [15] | 0.9 |
| Mg [12,14] * | 0.29–0.5 | Sb [12] | 0.09 |
| Ca [12,13,14] | 0.006–0.08 | V [12,14] * | 3.3–4.3 |
| Cr [14] | 1.8 | Na [14] | 0.013 |
* Calculated based on FactSageTM FT Lite Database.
Table 2.
Average growth rate according to experimental parameters of cooling gas flow rate and rotation rate for 4N7 Aluminum melt crystallized by the cooled finger method.
Table 2.
Average growth rate according to experimental parameters of cooling gas flow rate and rotation rate for 4N7 Aluminum melt crystallized by the cooled finger method.
| Rotation Rate (rpm) | 25 | 35 | 45 | 50 | ||||||||
|---|---|---|---|---|---|---|---|---|---|---|---|---|
| Cooling gas flow rate (L/min) | 45 | 50 | 55 | 45 | 50 | 55 | 45 | 50 | 55 | 45 | 50 | 55 |
| Average growth rate (μm/s) | 12.2 | 13.3 | 17 | 6.5 | 11.3 | 21.5 | 0.7 | 9.3 | 19.3 | - | 7.5 | 20.6 |
Table 3.
Results of average growth rate and reduction factor for Fe, Si, Pb, and Zn in relation with the rotation rate (each average of three repetitions).
Table 3.
Results of average growth rate and reduction factor for Fe, Si, Pb, and Zn in relation with the rotation rate (each average of three repetitions).
| Rotation (rpm) | Average Growth Rate (μm/s) |
|---|---|
| 25 | 22.09 |
| 35 | 17.48 |
| 45 | 10.83 |
| 50 | 10.86 |
© 2017 by the authors. Licensee MDPI, Basel, Switzerland. This article is an open access article distributed under the terms and conditions of the Creative Commons Attribution (CC BY) license (http://creativecommons.org/licenses/by/4.0/).
Share and Cite
MDPI and ACS Style
Curtolo, D.C.; Friedrich, S.; Bellin, D.; Nayak, G.S.; Friedrich, B. Definition of a First Process Window for Purification of Aluminum via “Cooled Finger” Crystallization Technique. Metals 2017, 7, 341. https://doi.org/10.3390/met7090341
AMA Style
Curtolo DC, Friedrich S, Bellin D, Nayak GS, Friedrich B. Definition of a First Process Window for Purification of Aluminum via “Cooled Finger” Crystallization Technique. Metals. 2017; 7(9):341. https://doi.org/10.3390/met7090341
Chicago/Turabian StyleCurtolo, Danilo C., Semiramis Friedrich, Dominic Bellin, Gargi S. Nayak, and Bernd Friedrich. 2017. "Definition of a First Process Window for Purification of Aluminum via “Cooled Finger” Crystallization Technique" Metals 7, no. 9: 341. https://doi.org/10.3390/met7090341
Note that from the first issue of 2016, this journal uses article numbers instead of page numbers. See further details here.