In Vitro Corrosion Properties of Mg Matrix In Situ Composites Fabricated by Spark Plasma Sintering
by
Nguyen Q. Cao
1, 
Dinh N. Pham
1,
Narita Kai
2,
Hai V. Dinh
3,
Sachiko Hiromoto
4 and
Equo Kobayashi
1,* 1
Department of Metallurgy and Ceramics Science, Tokyo Institute of Technology, Tokyo 152-8550, Japan
2
Division of Engineering and Applied Sciences, California Institute of Technology, Pasadena, CA 91125, USA
3
School of Materials Science and Engineering, Hanoi University of Science and Technology, Hanoi 100000, Vietnam
4
Corrosion Property Group, Research Center for Structural Materials, National Institute for Materials Science, Tsukuba 305-0047, Japan
*
Author to whom correspondence should be addressed.
Metals 2017, 7(9), 358; https://doi.org/10.3390/met7090358
Submission received: 8 August 2017
/
Revised: 4 September 2017
/
Accepted: 7 September 2017
/
Published: 9 September 2017
(This article belongs to the Special Issue Spark Plasma Sintering-A Key Technology towards the Development of New Materials)
Abstract
:Mg matrix in situ composites were fabricated from Mg and ZnO powder by a spark plasma sintering method. The composition and microstructure of the sintered samples were characterized. Corrosion properties of fabricated composites were evaluated by immersion and by electrochemical tests using Hanks’ solution. The results showed that the formation of in situ products improved significantly the corrosion resistance of the fabricated composites compared with pure Mg; Mg-10 wt % ZnO composites especially exhibited the lowest corrosion rate. In addition, an energy-dispersive X-ray (EDX) analysis showed that calcium phosphate formed as a corrosion product on the surface of Mg-10 wt % ZnO composites, while Mg(OH)2 appeared as a corrosion product on the surface of Mg-20 wt % ZnO composite. The findings suggested Mg-10 wt % ZnO composite as a potential candidate for temporary implant application.
1. Introduction
In recent decades, traditional metallic biomaterials including pure Ti and its alloys, CoCr alloys, and stainless steel have been widely applied into bone replacement and bone fixation devices in order to repair bone fractures or support in the healing process. However, these types of traditional metallic biomaterials required secondary surgery in order to remove the implants after healing [1,2,3]. Recently, Magnesium and its alloys emerged as promising candidates for biodegradable implant applications that do not require additional surgery for removal of implant after healing. Mg and its alloys are not only biocompatible but also contribute to the stimulation of bone growth and the healing process [4,5]. In addition, Mg-based materials have similar mechanical properties and Young’s modulus compared with those of natural bone, avoiding a stress-shielding effect [6,7]. However, the drawback of Mg and its alloys is a fast degradation rate in vivo, affecting the mechanical integrity of the healing process [8]. Thus, it is essential to improve both initial mechanical properties and corrosion resistance of Mg-based materials. So far, there have been many research works on the development of mechanical properties and corrosion resistance of conventional Mg-matrix composites for biodegradable implant applications. However, as-developed composites either exhibited poor mechanical properties [9,10,11] or were not fully biodegradable due to very low solubility of reinforcements in vivo [12,13,14,15]. In such a situation, the Mg-matrix in situ composites became potential candidates.
Deng et al. [16] and Lei et al. [17] successfully fabricated Mg-matrix in situ composites from mixed Mg-ZnO powder by a conventional sintering method. However, the fabricated composites exhibited limitation in the improvement of mechanical properties and corrosion resistance due to the insufficient sintering degree. Recently, Cao et al. [18] employed a spark plasma sintering (SPS) technique and fabricated Mg matrix in situ composites with excellent mechanical properties from mixed Mg-ZnO powder. The work indicated that in situ reaction products including MgO, Zn, and intermetallic compounds significantly reinforced mechanical performance of the fabricated composites. Previous research has shown that Zn is an effective additive that improves the mechanical properties as well as the corrosion resistance of Mg-based biomaterials [19,20,21,22]. In addition, Zn is also biocompatible and biodegradable with a daily moderate amount of allowance [23,24]. Many previous works demonstrated that Zn-based biomaterials exhibited mechanical properties, corrosion rate, and biocompatibility that are promising for a bio-absorbable endovascular stent [25]. In this study, with the purpose of using Zn and its compounds as reinforcements in order to improve corrosion resistance, Mg-matrix in situ composites were fabricated from homogeneously mixed Mg-ZnO powder via the spark plasma sintering (SPS) technique.
The SPS is a well-known new sintering method with high-speed powder consolidation technology. During the SPS sintering process, spark plasma generated by direct pulse current associated with uniaxial pressure on powder resulted in lower temperatures and shorter sintering times than conventional sintering methods. These advantages make SPS an effective sintering method to fabricate Mg matrix composites, which are normally difficult to be fully sintered by conventional sintering techniques [26,27].
In this study, SPS was employed for fabricating Mg matrix in situ composites from mixed Mg-ZnO powders. The corrosion property of fabricated composites was investigated by various corrosion tests.
2. Experimental Procedure
2.1. Sample Preparation
Mg powders with a purity of 99.5% and particle size of 180 μm and ZnO powders with a purity of 99.9% and particle size of 1 μm supplied by Kujundo Chemical Laboratory (Sakado, Japan) were used for sample preparation. Mg/ZnO powders with three different weight fractions (0, 10, 20 wt %) were mixed homogeneously with zirconia balls (2.5 of ball to powder weight ratio) in an argon atmosphere using a planetary micro ball mill (Pulverisette 7, Fritsch, Oberstein, Germany) with rotation speed of 500 rpm for 12 h. No process control agent was used. The mixed powders were set inside the Tungsten-Carbide die (NJS, Yokohama, Japan) of 120 mm in height and 15 mm in an inner diameter for the spark plasma sintering using a 511S, Syntex SPS system.
Five kinds of samples named A, B-1, B-2, C-1, and C-2 were fabricated with different ZnO weight fractions and sintering conditions. Sample A, B-1, and C-1 were directly sintered by SPS while sample B-2 and C-2 were sintered in a vacuum furnace before sintering by SPS. The details of fabrication process are shown in Table 1.
All the sintering processes were performed in a high vacuum chamber. After the sintering processes, the samples were cooled down to room temperature inside the vacuum chamber.
2.2. Composition and Microstructure Analysis
The sintered composites were machined into a disk shape with the size of Φ15 mm × 2 mm. The machined samples were ground using SiC papers up to 4000 grit, successively polished with 1/4-μm diamond paste, ultrasonically cleaned with ethanol and then dried for sample characterization. X-ray diffractometry (XRD) was conducted using a RINT2100 RIGAKU diffractometer (Rigaku, Tokyo, Japan). Microstructural observation was performed using a backscattering electron microscope (BSEM) (Miniscope 1000, Hitachi, Tokyo, Japan).
2.3. Immersion Tests
Disk shape specimens with dimensions of Φ14 mm × 2 mm were immersed in Hanks’ solution at 37 °C for 14 days in air. The specimens were placed on a clip to expose the bottom surface to the solution. The composition of Hanks’ solution is described in Table 2. The ratio of surface area to solution volume was 1 cm2:50 mL. The immersion test was conducted in triplicate for each sample condition.
The amount of Mg2+ ions dissolved in the sampled medium was quantified by a colorimetric method using Xylidyl blue-I [28,29]. In addition, hydrogen gas generated was collected by a burette with a funnel that was placed over the immersed sample. XRD, SEM, EDX, and Fourier-transform infrared spectroscopy (FTIR) were conducted for the samples after the immersion test for 14 days.
2.4. Polarization and Impedance Tests
Polarization tests were carried out in Hanks’ solution. The surface was coated with epoxy resin to expose the measurement area of 1 cm2 to Hanks’ solution at 37 °C. The open circuit potential was measured for 1500 s. Subsequently, potentiodynamic polarization curves were measured in the potential range from −0.1 V vs. open circuit potential (Eocp) at a scan rate of 1 mV/s. Electrochemical impedance spectroscopy (EIS) measurements were performed at Eocp with the scan frequency ranged from 100 kHz to 0.01 Hz, and with the perturbation amplitude of 5 mV. The reference and counter electrodes were saturated Ag/AgCl and Pt electrodes, respectively.
3. Results and Discussion
3.1. Composition and Microstructure of Composites
XRD patterns of the samples A, B-1, B-2, C-1, and C-2 in Figure 1a–c show that there are peaks of MgO, Zn, and Mg-Zn intermetallic compounds for all composite samples. In addition, there are peaks of ZnO detected for samples C-1 and C-2.
In previous work, Cao et al. [18] demonstrated that the following in situ reactions occurred during sintering mixed Mg-ZnO powders from room temperature to 550 °C.
where the subscripts (s) and (l) refer to solid state and liquid state, respectively, and MgxZny includes MgZn, Mg2Zn3 and Mg7Zn3 intermetallic compounds.
The peak of ZnO of sample C-1 is higher than that of sample C-2, indicating that the amount of remaining ZnO in sample C-1 is larger than that in sample C-2. This is reasonable because sintering time of sample C-1 was much shorter than that of sample C-2. Consequently, the amount of ZnO in sample C-2 involved in reaction (1) was much higher than that in sample C-1 resulting in lower amount of remaining ZnO in sample C-2 compared with that in sample C-1. Similarly, the intensity of MgO peak of samples C-1 and C-2 is higher than that of samples B-1 and B-2. Therefore, the amount of newly produced MgO in samples C-1 and C-2 is much higher than that in samples B-1 and B-2 because the amount of initial ZnO in sample C-1 and C-2 is the double of that in samples B-1 and B-2, respectively.
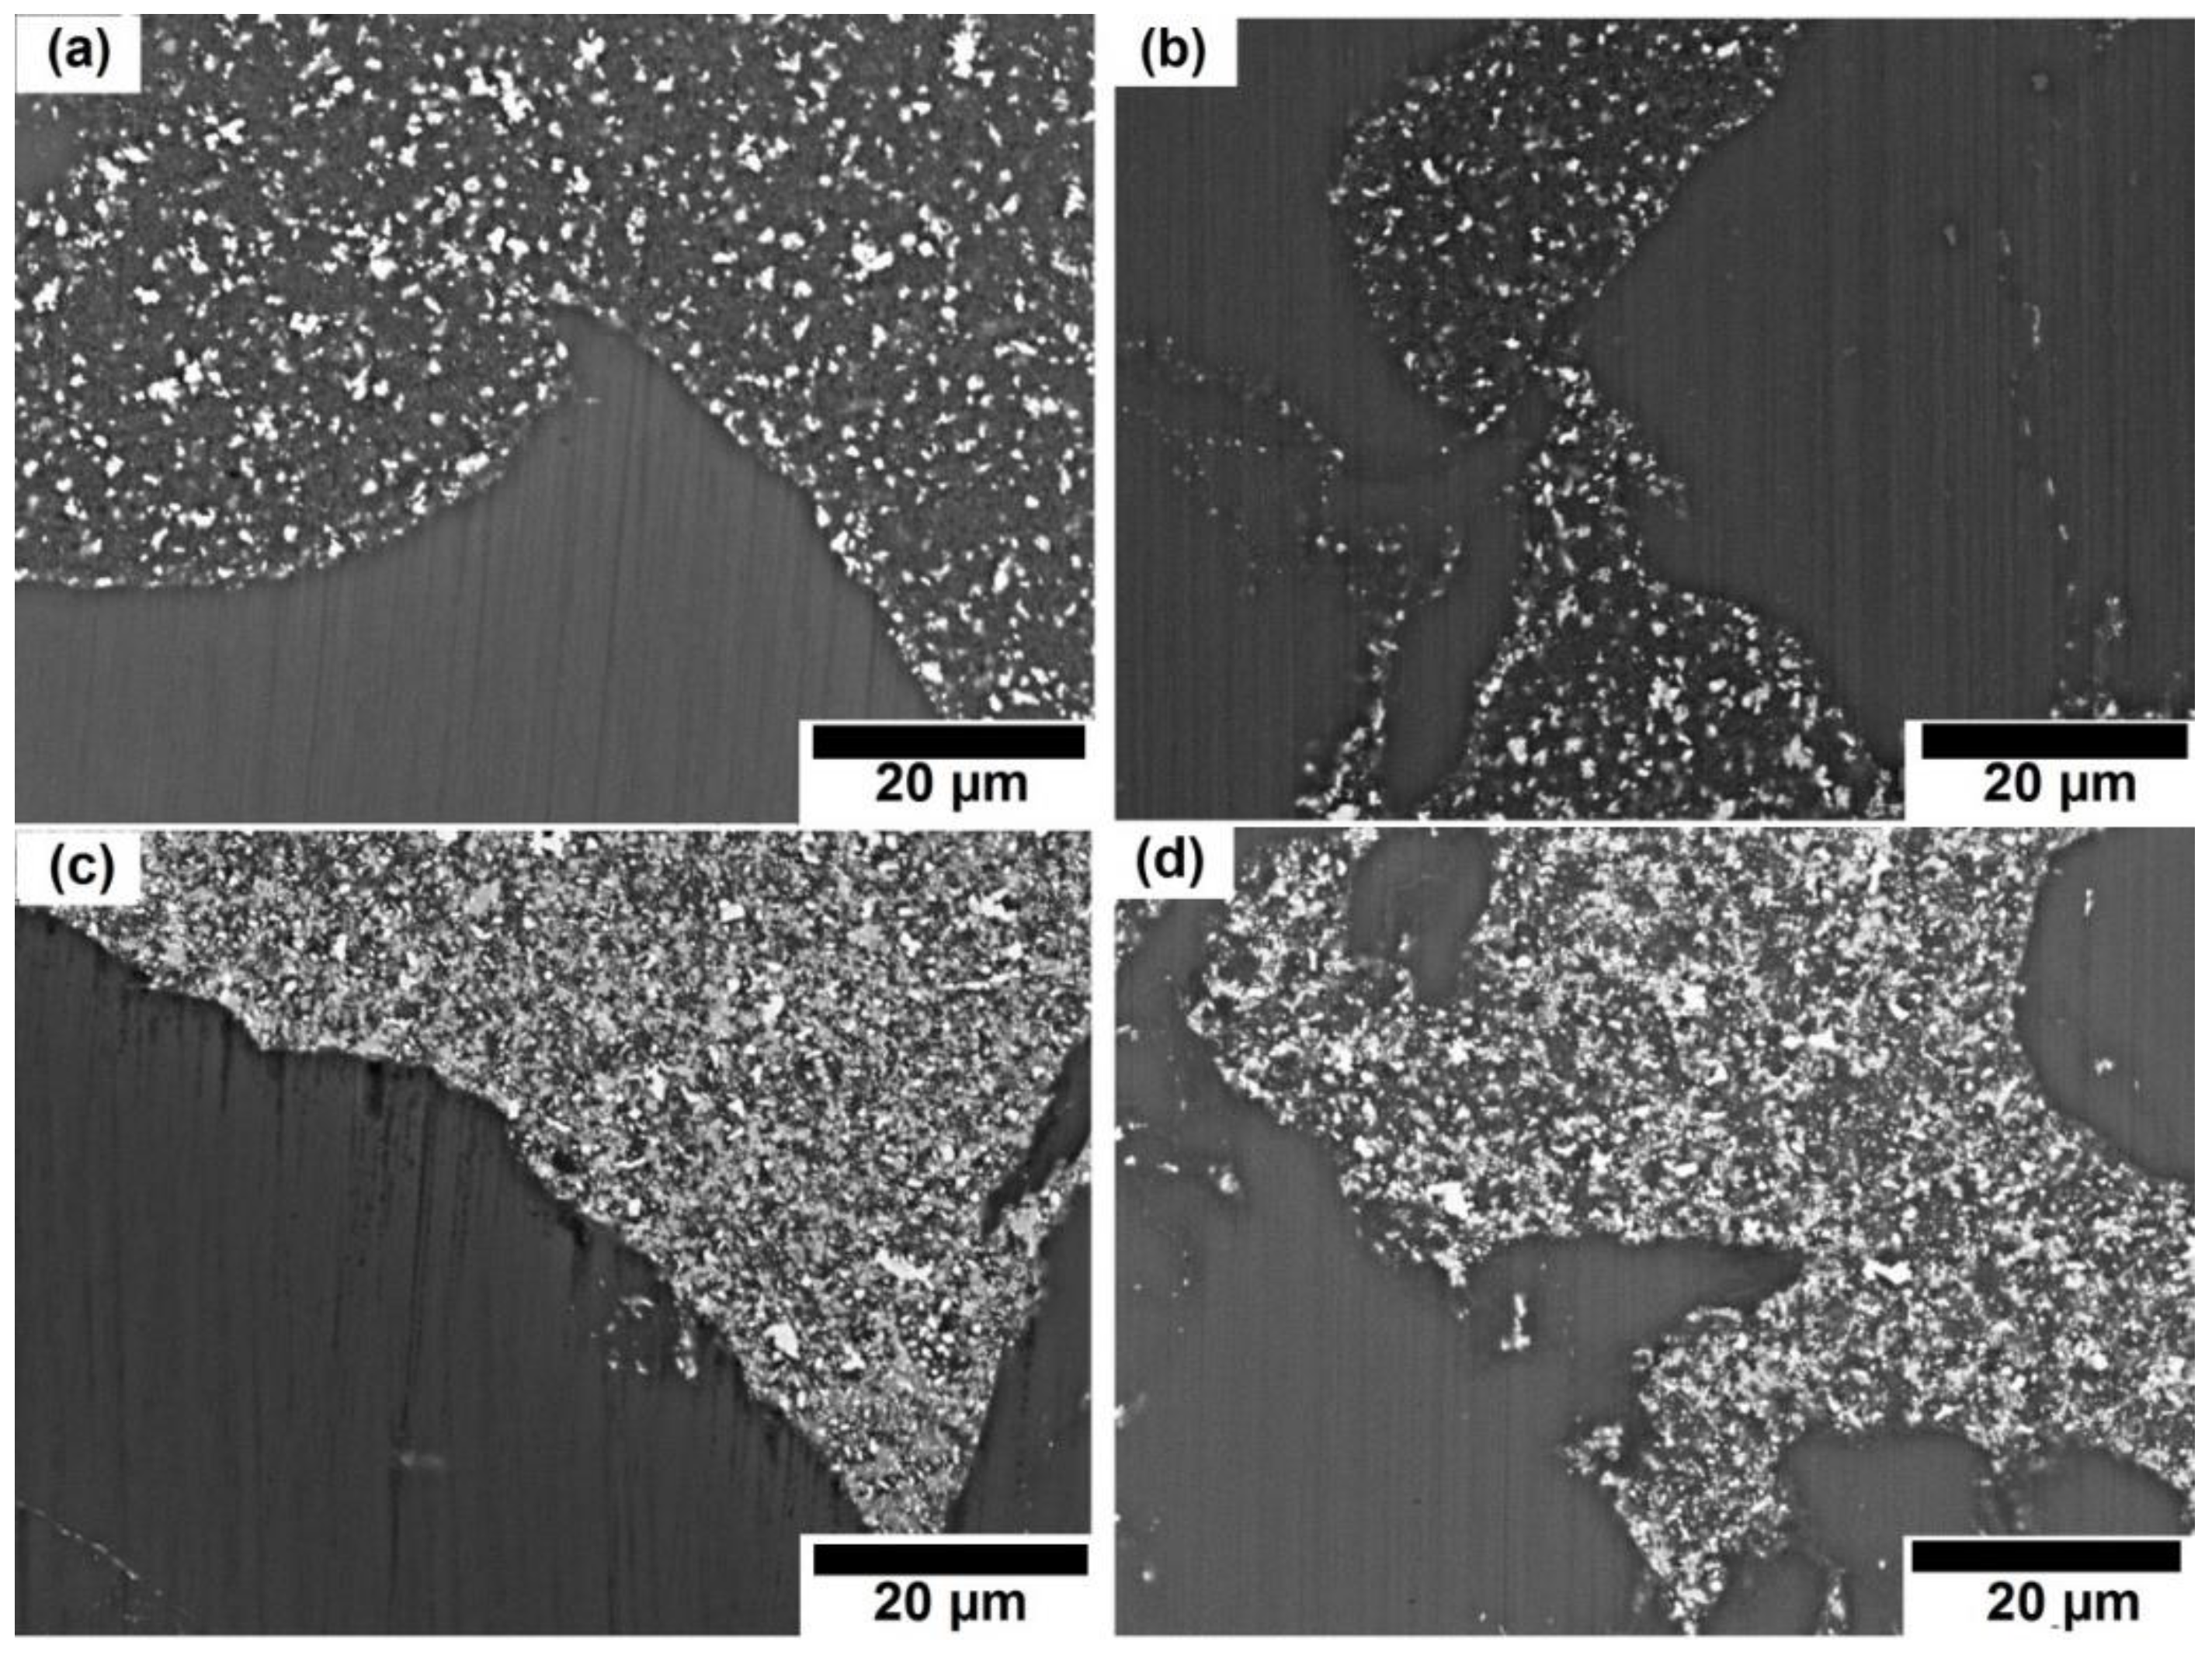
Figure 2 shows SEM images of four samples B-1, B-2, C-1, and C-2. Focus on second phase region, it can be seen that there are remaining ZnO white particles randomly distributed in the reaction products. The amount of remaining ZnO increased in the following order: B-2 < B-1 < C-2 < C-1. This is reasonable because of following reasons: firstly, the initial amount of ZnO in samples B-1 and B-2 is 10%, and the initial amount of ZnO in samples C-1 and C-2 is 20%. Sintering time of samples B-1 and C-1 is 10 min, while sintering time of samples B-2 and C-2 is 2.5 h. Consequently, ZnO involved in reaction (1) of sample B-2 is higher than that of sample B-1. Similarly, ZnO involved in reaction (1) of sample C-2 is higher than that of sample C-1. In addition, from SEM images, it can be seen that ZnO displayed as while particles distributed in the second phase region. The density of white particles in second phase increased in the following order: B-2 < B-1 < C-2 < C-1. Combining all above reasons and XRD result, it is possible to conclude that the amount of remaining ZnO increased in the following order: B-2 < B-1 < C-2 < C-1. This reveals that sintering in a vacuum furnace significantly decreased the remaining ZnO in samples C-2 and B-2 compared to C-1 and B-1, respectively.
3.2. Corrosion Behavior under Static Immersion
3.2.1. Mg2+ Ion Release Behavior
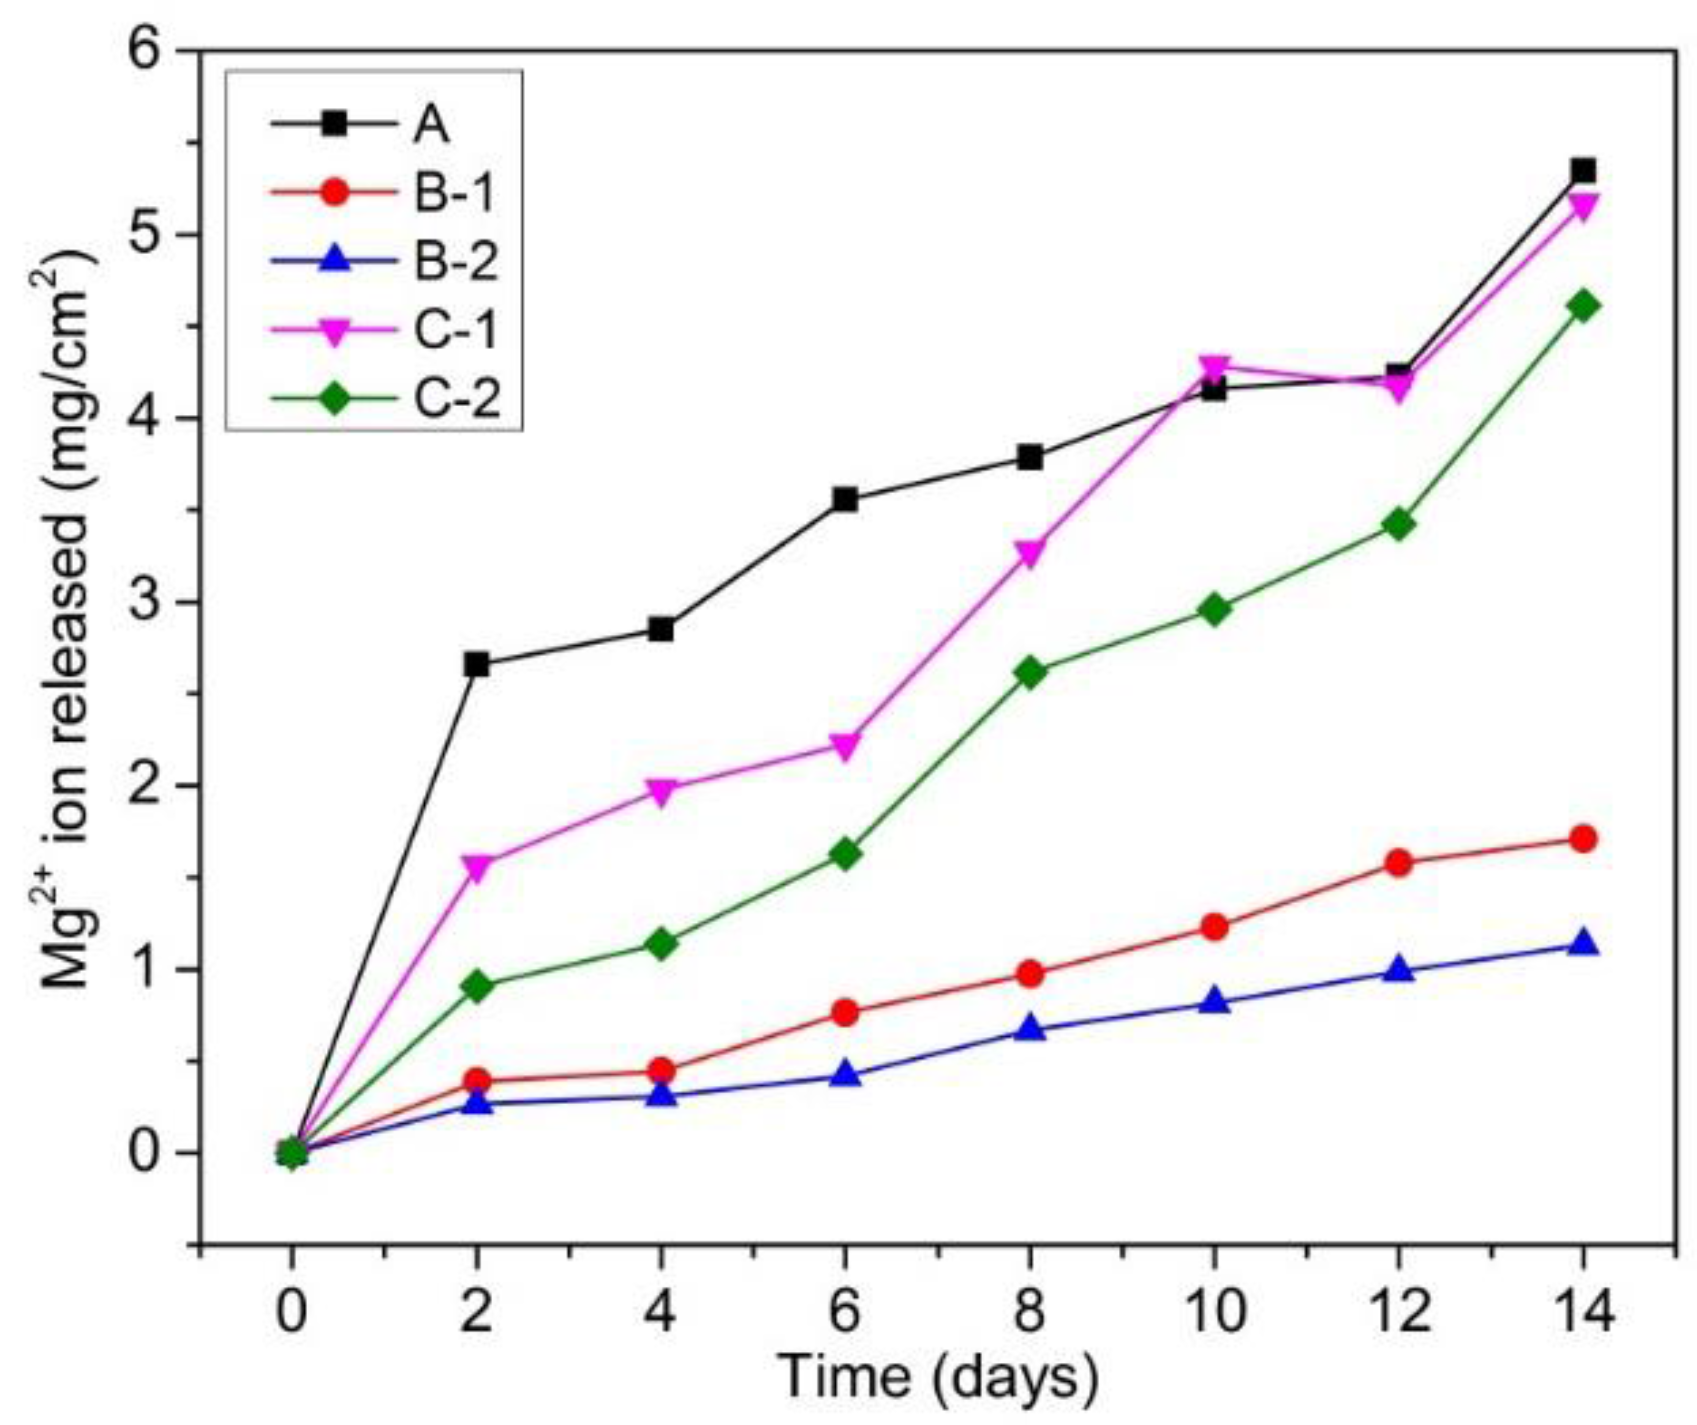
Figure 3 shows the amount of Mg2+ ion released per cm2 in Hanks’ solution as a function of immersion period of fabricated samples. It could be seen that all samples show the highest Mg2+ ion release rate in the first 2 days. After 2 days, the Mg2+ ion release rate decreased. This suggests that corrosion occurred most severely during the first 2 days. After 2 days, corrosion products formed and deposited on the surface of samples. This corrosion product layer acted as a protective layer, which inhibited severe corrosion, leading to lower Mg2+ ion release rates in the subsequent days. In another aspect, Mg-10 wt % ZnO composites (samples B-1 and B-2) exhibited the lowest corrosion rates, while pure Mg sample (sample A) showed the highest corrosion rate. Although Mg-20 wt % ZnO composites (samples C-1 and C-2) showed a slight improvement in corrosion resistance compared with pure Mg sample, they exhibited much higher corrosion rate than that of Mg-10 wt % ZnO composites.
As for the effect of sintering time, with the same initial composition, the composites sintered in vacuum furnace for 2.5 h and by SPS for 10 min showed lower corrosion rates than the composites sintered only by SPS for 10 min. The improvement of corrosion resistance of the composites can be understood by the positive effect of produced Zn and Mg-Zn intermetallic compounds. As demonstrated in previous works [19,20,21,22], Zn is able to significantly improve the corrosion resistance of Mg matrix. On the other hand, the above results suggested that the remaining ZnO and newly produced MgO had negative effects on the corrosion resistance of these composites. The higher the composite with the amount of remaining ZnO and newly produced MgO, the higher corrosion rate it exhibited.
3.2.2. H2 Gas Evolution Behavior
Figure 4 reveals hydrogen-evolution behavior of fabricated samples during immersion in Hanks’ solution. The hydrogen-evolution behavior exhibited similar trend to Mg2+ ion release behavior. Specifically, sample A showed strongest gas evolution over the limitation of the gas container after 1 day. Samples C-1 and C-2 exhibited second and third gas evolution rates and over the limitation of gas container after 6 and 8 days, respectively. Whereas samples B-1 and B-2 featured the lowest gas evolution rates. This result is in agreement with the result of Mg2+ ion release measurement shown in Figure 3 that samples B-1 and B-2 showed lowest corrosion rates, while sample A showed highest corrosion rate.
3.2.3. Surface Morphology and Composition of Immersed Sample Surface
Figure 5 shows surface morphology of the samples before and after immersion tests. The images of samples A and C-1 were taken in Hanks’ solution. It could be seen that samples A (Figure 5f) and C-1 (Figure 5i) were fractured during the immersion period, indicating the lowest corrosion resistance. While sample B-2 (Figure 5h) showed the least corrosion with partially corroded area on the surface. Surface appearance of sample C-2 (Figure 5k) showed filiform corrosion on the most surface area with corrosion products deposited. On the surface of sample B-1 (Figure 5g), there were a lot of pits on the surface area instead of filiform corrosion. On the sample B-2 (Figure 5h), there was a part of surface area covered by filiform corrosion and randomly pits appeared. It could be seen that the corrosion area ratios are consistent to the amounts of released Mg2+ ion showed in Figure 3.
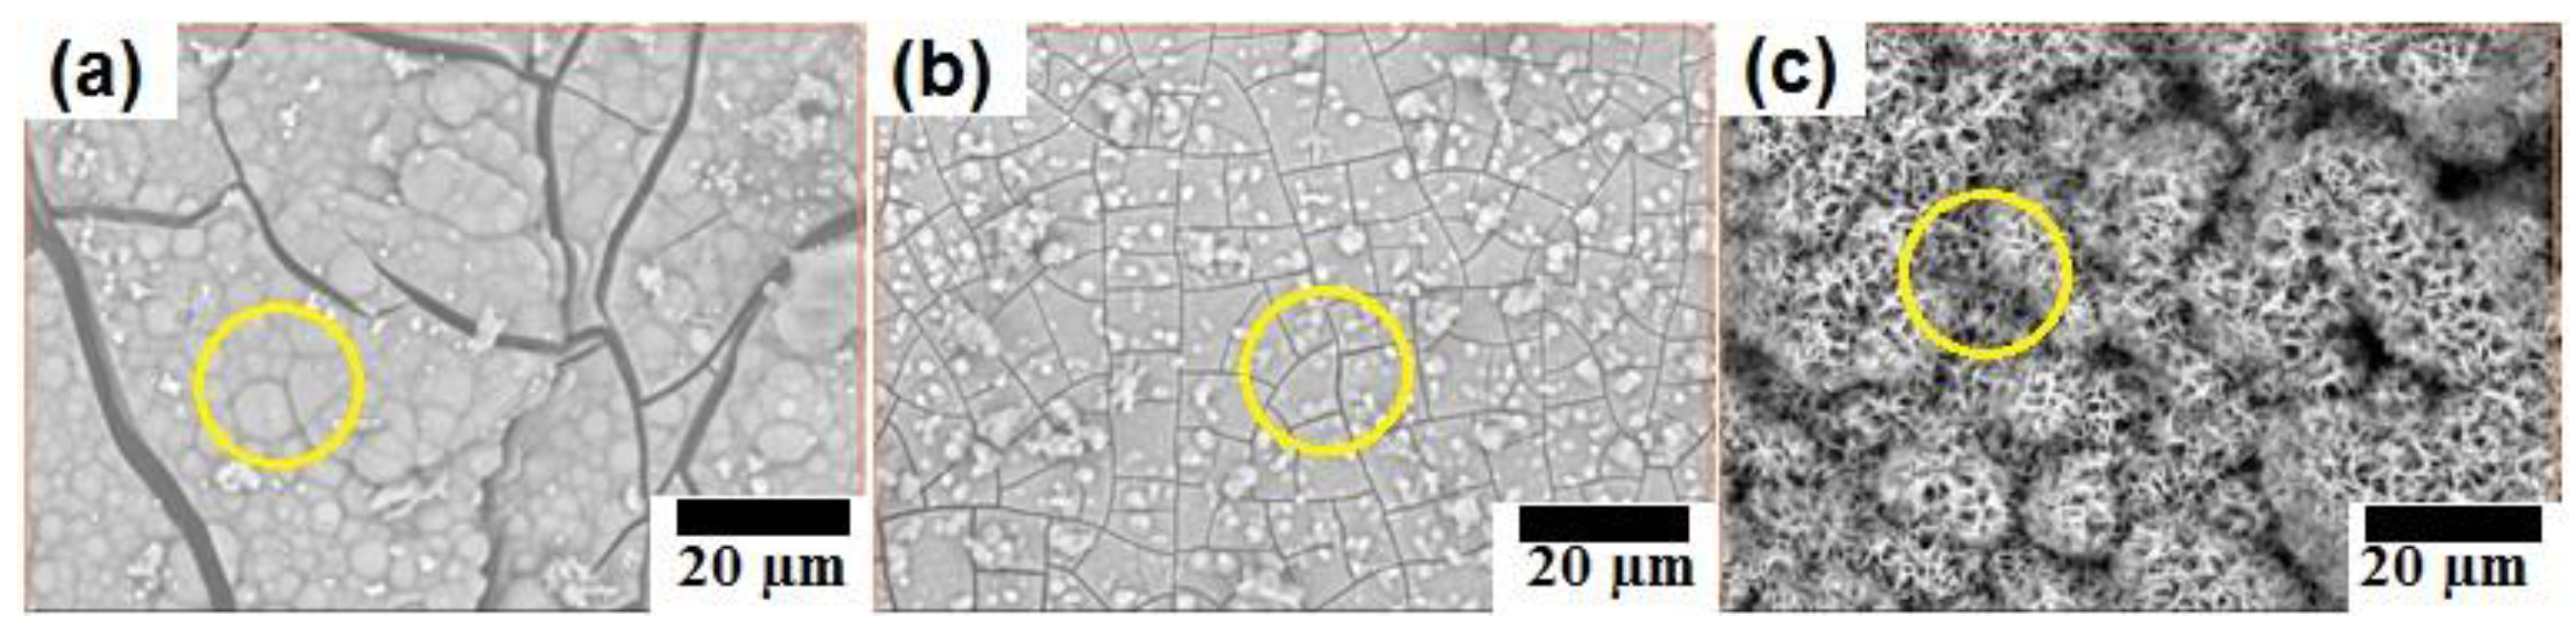
Figure 6 shows SEM images of surface of immersed samples B-1, B-2, and C-2. All three surfaces showed deposited corrosion products. Samples B-1 and B-2 showed similar corrosion product with a solid structure, while corrosion products deposited on surface of sample C-2 showed porous structure. The structure of corrosion product layers on surface of samples B-1 and B-2 indicated that they played an important role as protective layers avoiding severe corrosion. On the other hand, the porous structure of the corrosion product on the surface of sample C-2 indicated a weak protective layer compared with the stronger protective layer of corrosion products on samples B-1 and B-2. This kind of porous structure layer can be diffused by solution more easily than the solid structure layer of corrosion products on samples B-1 and B-2. Consequently, the corrosion process of sample C-2 occurred more severe compare to that of samples B-1 and B-2.
Table 3 shows the result of EDX analysis of corrosion products on the surface of samples B-1, B-2, and C-2. The analyzed areas were marked by yellow circles on Figure 6. As for samples B-1 and B-2, the ratio of atomic percentages of Ca:P:O suggest the formation of calcium phosphate on the surfaces of these samples.
The atomic percentages of Mg and Zn on the surface of sample B-1 were lower than those on surface of sample B-2 confirming that corrosion product layer on sample B-1 was thicker than that on sample B-2. As discussed in previous works [30,31], the formation of calcium phosphate on surface of samples B-1 and B-2 not only increases the corrosion resistance of Mg-based materials but also enhances the osseointegration.
On the other hand, the EDX analysis result on sample C-2 suggested the formation of Mg(OH)2 on the surface of this sample because the ratio of atomic percent of Mg:O ≈ 1:2.
Figure 7 shows XRD patterns of sample B-1, B-2, and C-2 samples. The results confirmed that Mg(OH)2 formed only on the surface of sample C-2 since the peak of Mg(OH)2 was detected only on the pattern of this sample. The formation of Mg(OH)2 on C-2 sample might be due to the high amount of MgO existing in this sample before immersion. It should be noted that this sample contained highest amount of MgO compared with that in B-1 and B-2 sample.
It was confirmed in previous work [12] that the corrosion products of the Mg-based materials in the simulated body fluid were composed of magnesium hydroxide and calcium phosphate. Therefore, the formation of Mg(OH)2 on the surface of sample C-2 and calcium phosphate compounds on the surface of sample B-1 and B-2 as the protective layers are reasonable in this research. However, calcium phosphate is known to strongly increase the corrosion resistance of B-1 and B-2 sample, while Mg(OH)2 contributed to slight improvement in corrosion resistance of C-2 sample.
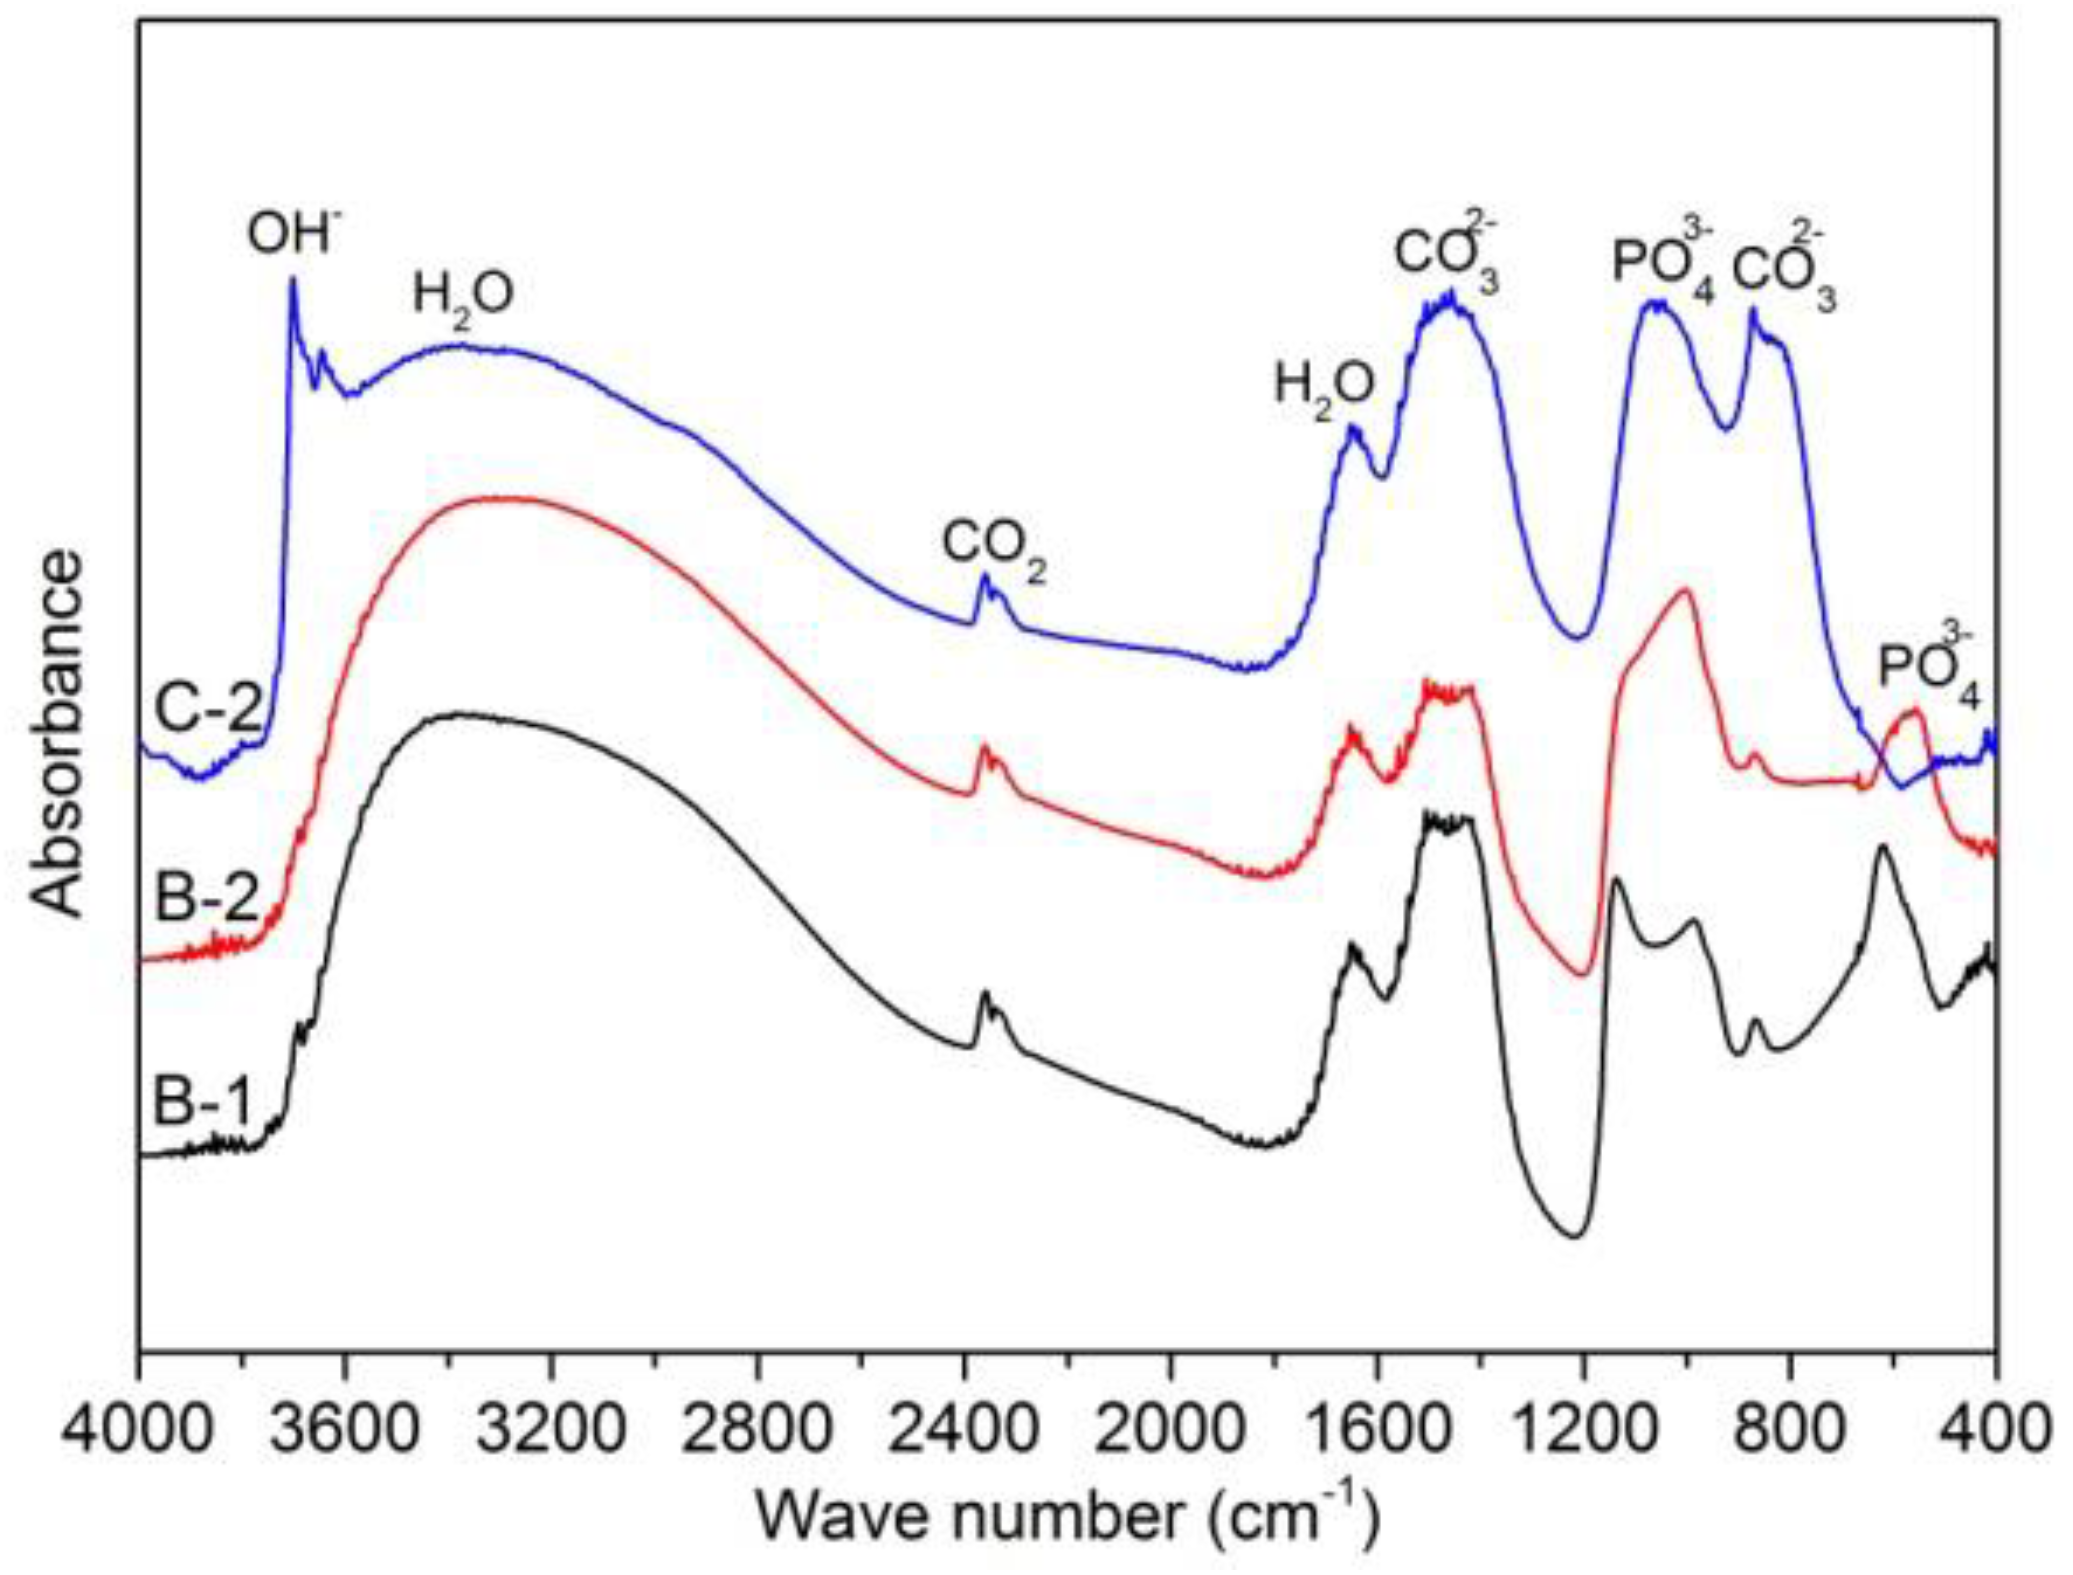
Figure 8 shows FTIR spectra of immersed samples B-1, B-2, and C-2. It could be seen that the presence of OH− peak only for sample C-2 confirms that Mg(OH)2 formed only on surface of sample C-2. The presence of and peaks for all three samples, suggesting that calcium phosphate and carbonates formed on the surface of three samples. However, the amount of calcium phosphate formed on surface of sample C-2 and amount of carbonates formed on the surface of three samples are too low to be detected by EDX analysis.
From EDX analysis, XRD patterns, and FTIR spectra of immersed samples B-1, B-2, and C-2, it can be concluded that Mg(OH)2 is the main corrosion product deposited on the surface of sample C-2, while calcium phosphate formed as main corrosion product on the surface of samples B-1 and B-2.
3.3. Polarization and Impedance Behavior
Figure 9 and Figure 10 show the polarization curves and Bode plots of all samples in Hanks’ solution, respectively. Generally, the dissolution rate of Mg2+ ions corresponds the anodic current density, while the reduction rate of water is hydrogen evolution reaction corresponds to the cathodic current density [32].
Anodic reaction: Mg → Mg2+ + 2e−
Cathodic reaction: 2H2O +2e− → H2 + 2OH−
In this work, corrosion current density (Icorr) was obtained by Tafel extrapolation method since cathodic polarization curves showed a linear region. The corrosion potential (Ecorr) and corrosion current density (Icorr) of the all samples are listed in Table 4. As shown, the Tafel curve for sample A exhibits the most negative corrosion potential at −1.63 V (vs. SCE) and highest corrosion current density at 2.7 × 10⁻⁵ A cm−2 indicating highest corrosion rate, whereas Tafel curves for sample B-2 and B-1 exhibit the most positive corrosion potentials at −1.47 V (vs. SCE) and −1.50 V (vs. SCE), and lowest corrosion current densities at 2.2 × 10⁻⁶ A cm−2 and 3.0 × 10⁻⁶ A cm−2, respectively, indicating the lowest corrosion rates. This result is consistent with immersion test result.
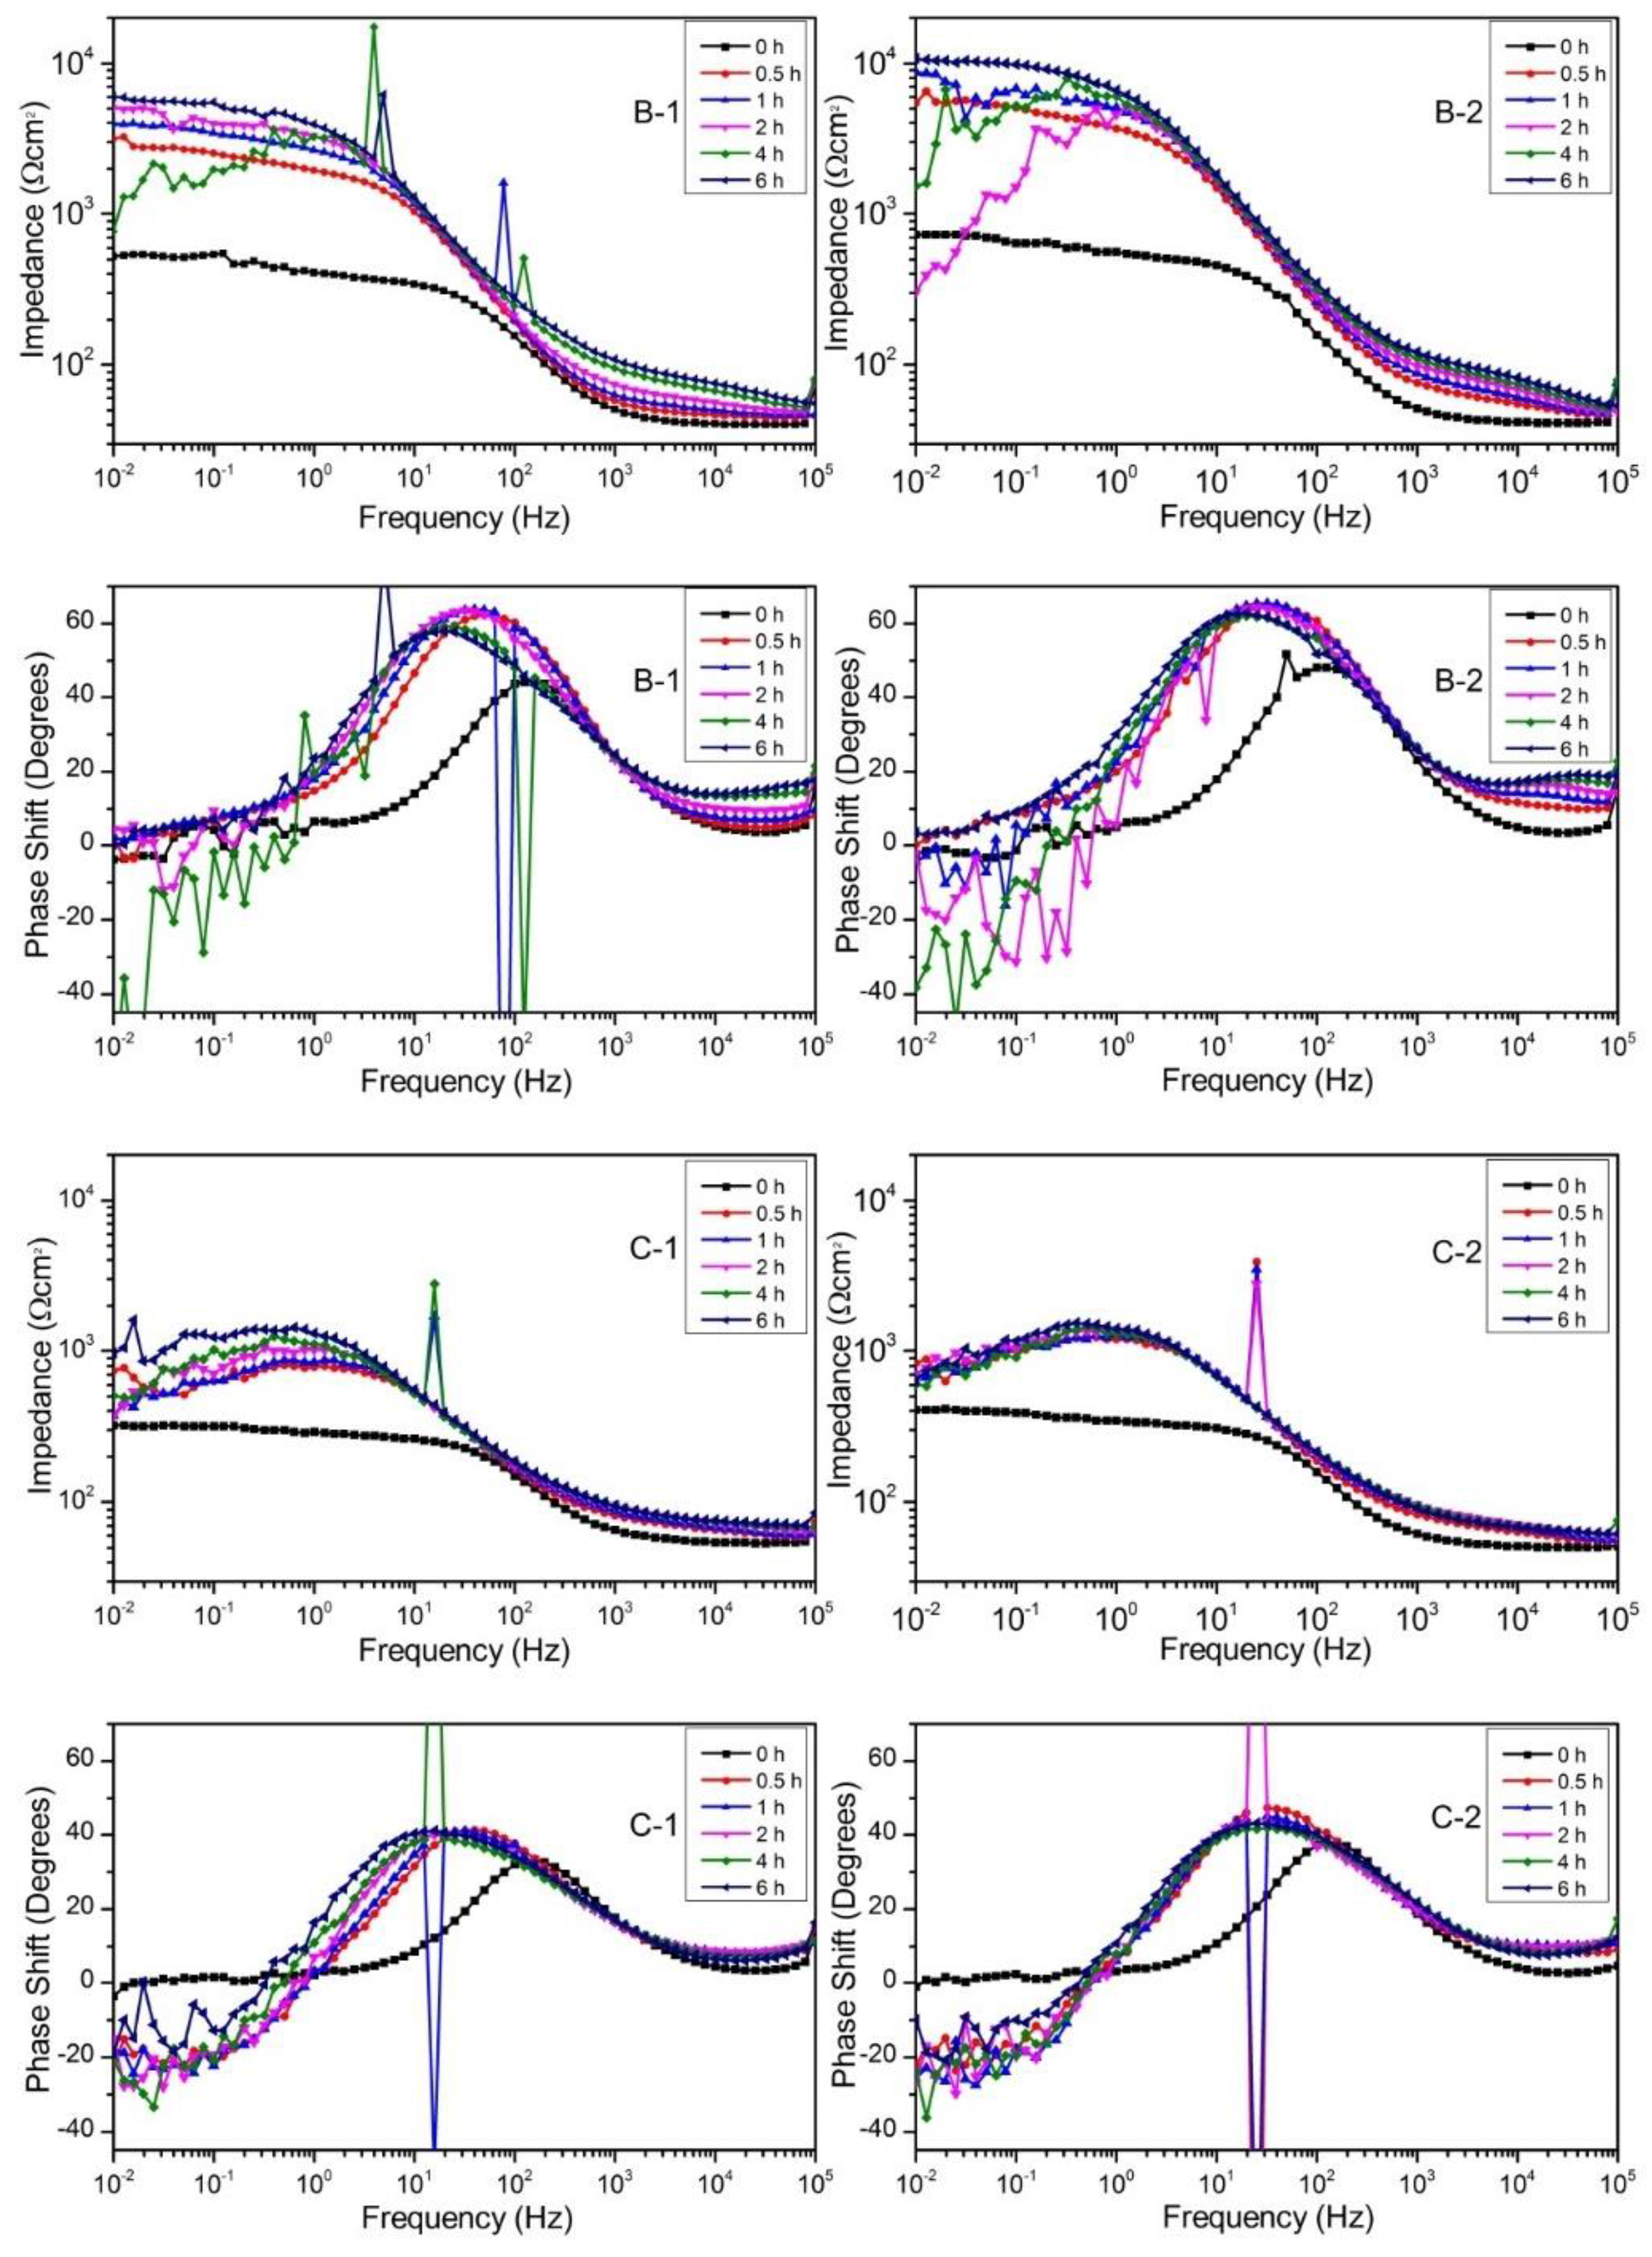
The difference in impedance between 105 Hz and 10−2 Hz corresponds to the polarization resistance (Rp). The initial increase of Rp from 0 h to 0.5 h indicates the formation of a deposited corrosion product layer which showed corrosion protection property. The impedance result indicates that the corrosion product layer was formed in the pre-immersion of polarization test. The magnitude of cathodic current density of all samples except C-1 was similar, which is attributed to the formation of the corrosion product layer.
The impedance spectra showed that the polarization resistance of B-1 increased from 0 h to 2 h, decreased at 4 h and recovered at 6 h. The impedance spectrum at 4 h showed a lot of fluctuations and the phase shift became below zero. These results indicate that the local corrosion occurred around 4 h and the corrosion pit was recovered afterwards. B-2 showed the larger increase of Rp than B-1, and Rp at 6 h of B-2 was higher than that of B-1 although the Rp showed a decrease at 2 h and 4 h. The higher Rp of B-2 than that of B-1 is consistent with the smaller Mg2+ ion release from B-2 than that from B-1 in the static immersion test.
The Rp of C-1 and C-2 increased from 0 h to 0.5 h, but the impedance decreased and the phase shift showed negative value in the low-frequency region. This result indicates that the corrosion product layer formed on C-1 and C-2 had defects from the beginning. The low Rp value is consistent with the large Mg2+ ion release from C-1 and C-2. The defects may be due to the large area ratio of the reaction product region on the surface. The corrosion product layer might not be able to cover the reaction product region.
The significant noise at some frequencies of the impedance test results should be noted. The source of this noise might be from the effect of electricity to the measurement devices at some frequencies. This is because during the measurement, a filter to eliminate the noise caused by electricity was not used. However, the result of impedance tests still reveals precisely the measured property and is consistent with immersion tests and polarization tests.
4. Conclusions
Mg-ZnO matrix in situ composites were synthesized and their corrosion property was investigated. Findings of the research are summarized as following:
- (1)
- Several in situ reactions occurred during sintering process from room temperature to 550 °C to form Zn, MgO and Mg-Zn intermetallic compounds.
- (2)
- Newly formed Zn and Mg-Zn intermetallic compounds have positive effects while the remained ZnO has negative effects on the corrosion resistance of as fabricated composites.
- (3)
- Mg-20 wt % ZnO composites promoted the formation of Mg(OH)2 on the surface of the sample during immersion. This Mg(OH)2 film plays as a weak protective layer resulting in slight improvement of corrosion resistance.
- (4)
- Mg-10 wt % ZnO composites promoted the formation of calcium phosphate on the surface of samples. The calcium phosphate layer is possible to not only significantly increase the corrosion resistance of the composites but also is beneficial for osseointegration. These results suggested Mg-10 wt % ZnO composites become very promising candidates for temporary implant applications.
Acknowledgments
This work was financially supported by Light Metal Educational Foundation, Inc.
Author Contributions
Nguyen Q. Cao (Nguyen Quang Cao) contributed to this work in experiment planning, experiment measurements, data analysis and manuscript preparation. Dinh N. Pham (Dinh Ngoc Pham) and Kai Narita contributed in sample preparation and manuscript preparation. Hai V. Dinh (Hai Van Dinh) contributed in experiment planning, result analysis and evaluation. Sachiko Hiromoto contributed in experiment measurements, data analysis and manuscript preparation. Equo Kobayashi contributed in experiment planning, experiment measurements, data analysis and manuscript preparation.
Conflicts of Interest
The authors declare no conflict of interest. The founding sponsors had no role in the design of the study; in the collection, analyses, or interpretation of data; in the writing of the manuscript, and in the decision to publish the results.
References
- Basu, B.; Katti, D.S.; Kumar, A. Advanced Biomaterials: Fundamentals, Processing, and Applications; John Wiley & Sons: Hoboken, NJ, USA, 2010. [Google Scholar]
- Niinomi, M. Recent metallic materials for biomedical applications. Metall. Mater. Trans. A 2002, 33, 477–486. [Google Scholar] [CrossRef]
- Yu, K.; Chen, L.; Zhao, J.; Li, S.; Dai, Y.; Huang, Q.; Yu, Z. In vitro corrosion behavior and in vivo biodegradation of biomedical β-Ca3(PO4)2/Mg–Zn composites. Acta Biomater. 2012, 8, 2845–2855. [Google Scholar] [CrossRef] [PubMed]
- Zreiqat, H.; Howlett, C.R.; Zannettino, A.; Evans, P.; Schulze-Tanzil, G.; Knabe, C.; Shakibaei, M. Mechanisms of magnesium-stimulated adhesion of osteoblastic cells to commonly used orthopaedic implants. J. Biomed. Mater. Res. 2002, 62, 175–184. [Google Scholar] [CrossRef] [PubMed]
- Li, L.; Gao, J.; Wang, Y. Evaluation of cyto-toxicity and corrosion behavior of alkali-heat-treated magnesium in simulated body fluid. Surf. Coat. Technol. 2004, 185, 92–98. [Google Scholar] [CrossRef]
- Staiger, M.P.; Pietak, A.M.; Huadmai, J.; Dias, G. Magnesium and its alloys as orthopedic biomaterials: A review. Biomaterials 2006, 27, 1728–1734. [Google Scholar] [CrossRef] [PubMed]
- Salahshoor, M.; Guo, Y. Biodegradable Orthopedic Magnesium-Calcium (MgCa) Alloys, Processing, and Corrosion Performance. Materials 2012, 5, 135–155. [Google Scholar] [CrossRef] [PubMed]
- Witte, F.; Hort, N.; Vogt, C.; Cohen, S.; Kainer, K.U.; Willumeit, R.; Feyerabend, F. Degradable biomaterials based on magnesium corrosion. Curr. Opin. Solid State Mater. Sci. 2008, 12, 63–72. [Google Scholar] [CrossRef]
- Seong, J.W.; Kim, W.J. Development of biodegradable Mg-Ca alloy sheets with enhanced strength and corrosion properties through the refinement and uniform dispersion of the Mg2Ca phase by high-ratio differential speed rolling. Acta Biomater. 2015, 11, 531–542. [Google Scholar] [CrossRef] [PubMed]
- Gu, X.; Zhou, W.; Zheng, Y.; Dong, L.; Xi, Y.; Chai, D. Microstructure, mechanical property, bio-corrosion and cytotoxicity evaluations of Mg/HA composites. Mater. Sci. Eng. C 2010, 30, 827–832. [Google Scholar] [CrossRef]
- Zheng, Y.F.; Gu, X.N.; Xi, Y.L.; Chai, D.L. In vitro degradation and cytotoxicity of Mg/Ca composites produced by powder metallurgy. Acta Biomater. 2010, 6, 1783–1791. [Google Scholar] [CrossRef] [PubMed]
- Witte, F.; Feyerabend, F.; Maier, P.; Fischer, J.; Störmer, M.; Blawert, C.; Dietzel, W.; Hort, N. Biodegradable magnesium-hydroxyapatite metal matrix composites. Biomaterials 2007, 28, 2163–2174. [Google Scholar] [CrossRef] [PubMed]
- Huang, Y.; Liu, D.; Anguilano, L.; You, C.; Chen, M. Fabrication and Characterization of a Biodegradable Mg-2Zn-0.5Ca/1β-Tcp Composite. Mater. Sci. Eng. C 2015, 54, 120–132. [Google Scholar] [CrossRef] [PubMed]
- Khanra, A.K.; Jung, H.C.; Hong, K.S.; Shin, K.S. Comparative property study on extruded Mg-HAP and ZM61-HAP composites. Mater. Sci. Eng. A 2010, 527, 6283–6288. [Google Scholar] [CrossRef]
- Kwon, S.H.; Jun, Y.K.; Hong, S.H.; Kim, H.E. Synthesis and dissolution behavior of β-TCP and HA/β-TCP composite powders. J. Eur. Ceram. Soc. 2003, 23, 1039–1045. [Google Scholar] [CrossRef]
- Deng, C.J.; Wong, M.L.; Ho, M.W.; Yu, P.; Dickon, H.L.N. Formation of MgO and Mg-Zn intermetallics in an Mg-based composite by in situ reactions. Compos. Part A Appl. Sci. Manuf. 2005, 36, 551–557. [Google Scholar] [CrossRef]
- Lei, T.; Tang, W.; Cai, S.H.; Feng, F.F.; Li, N.F. On the corrosion behaviour of newly developed biodegradable Mg-based metal matrix composites produced by in situ reaction. Corros. Sci. 2012, 54, 270–277. [Google Scholar] [CrossRef]
- Cao, N.Q.; Narita, K.; Kobayashi, E.; Sato, T. Evolution of the microstructure and mechanical properties of Mg-matrix in situ composites during spark plasma sintering. Powder Metall. 2016, 59, 302–307. [Google Scholar] [CrossRef]
- Cai, S.; Lei, T.; Li, N.; Feng, F. Effects of Zn on microstructure, mechanical properties and corrosion behavior of Mg-Zn alloys. Mater. Sci. Eng. C 2013, 32, 2570–2577. [Google Scholar] [CrossRef]
- Gu, X.; Zheng, Y.; Cheng, Y.; Zhong, S.; Xi, T. In vitro corrosion and biocompatibility of binary magnesium alloys. Biomaterials 2009, 30, 484–498. [Google Scholar] [CrossRef] [PubMed]
- Zhang, S.; Zhang, X.; Zhao, C.; Li, J.; Song, Y.; Xie, C.; Tao, H.; Zhang, Y.; He, Y.; Jiang, Y.; et al. Research on an Mg-Zn alloy as a degradable biomaterial. Acta Biomater. 2010, 6, 626–640. [Google Scholar] [CrossRef] [PubMed]
- Zhang, S.; Li, J.; Song, Y.; Zhao, C.; Zhang, X.; Xie, C.; Zhang, Y.; Tao, H.; He, Y.; Jiang, Y.; et al. In vitro degradation, hemolysis and MC3T3-E1 cell adhesion of biodegradable Mg-Zn alloy. Mater. Sci. Eng. C 2009, 29, 1907–1912. [Google Scholar] [CrossRef]
- Trumbo, P.; Yates, A.A.; Schlicker, S.; Poos, M. Dietary reference intakes: Vitamin A, vitamin K, arsenic, boron, chromium, copper, iodine, iron, manganese, molybdenum, nickel, silicon, vanadium, and zinc. J. Am. Diet. Assoc. 2001, 101, 294–301. [Google Scholar] [CrossRef]
- Tapiero, H.; Tew, K.D. Trace elements in human physiology and pathology: Zinc and metallothioneins. Biomed. Pharmacother. 2003, 57, 399–411. [Google Scholar] [CrossRef]
- Patrick, K.B.; Emily, R.S.; Shan, Z.; Roger, J.G.; Feng, Z.; Jeremy, G.; Jaroslaw, W.D. Biodegradable Metals for Cardiovascular Stents: From Clinical Concerns to Recent Zn-Alloys. Adv. Healthc. Mater. 2016, 5, 1121–1140. [Google Scholar]
- Omori, M. Sintering, consolidation, reaction and crystal growth by the spark plasma system (SPS). Mater. Sci. Eng. A 2000, 287, 183–188. [Google Scholar] [CrossRef]
- Chartier, T.; Badev, A. Handbook of Advanced Ceramics; Elsevier Inc.: Amsterdam, The Netherlands, 2013. [Google Scholar]
- Mann, C.K.; Yoe, J.H. Spectrophotometric determination of magnesium with sodium 1-azo-2-hydroxy-3-(2,4-dimethylcarboxanilido)-naphthalene-1-(2-hydroxybenzene-5-sulfonate). Anal. Chem. 1956, 28, 202–205. [Google Scholar] [CrossRef]
- Watanabe, H.; Tanaka, H. Dual-wavelength spectrophotometric determination of magnesium with xylidyl blue I and nonionic surfactant. Bunseki Kagaku 1977, 26, 635–639. [Google Scholar] [CrossRef]
- Kumar, M.; Dasarathy, H.; Riley, C. Electrodeposition of brushite coatings and their transformation to hydroxyapatite in aqueous solutions. J. Biomed. Mater. Res. Part A 1999, 45, 302. [Google Scholar] [CrossRef]
- Shadanbaz, S.; Dias, G.J. Calcium phosphate coatings on magnesium alloys for biomedical applications: A review. Acta Biomater. 2012, 8, 20–30. [Google Scholar] [CrossRef] [PubMed]
- Ren, M.; Cai, S.; Liu, T.; Huang, K.; Wang, X.; Zhao, H.; Niu, S.; Zhang, R.; Wu, X. Calcium phosphate glass/MgF2 double layered composite coating for improving the corrosion resistance of magnesium alloy. J. Alloys Compd. 2014, 591, 34–40. [Google Scholar] [CrossRef]
Figure 1.
XRD (X-ray diffractometry) patterns of as fabricated samples, (a) full scan range of 2θ from 30 to 60 degrees; (b) magnification of 2θ from 36 to 37.5 degrees; and (c) magnification of 2θ from 38 to 45 degrees.
Figure 1.
XRD (X-ray diffractometry) patterns of as fabricated samples, (a) full scan range of 2θ from 30 to 60 degrees; (b) magnification of 2θ from 36 to 37.5 degrees; and (c) magnification of 2θ from 38 to 45 degrees.
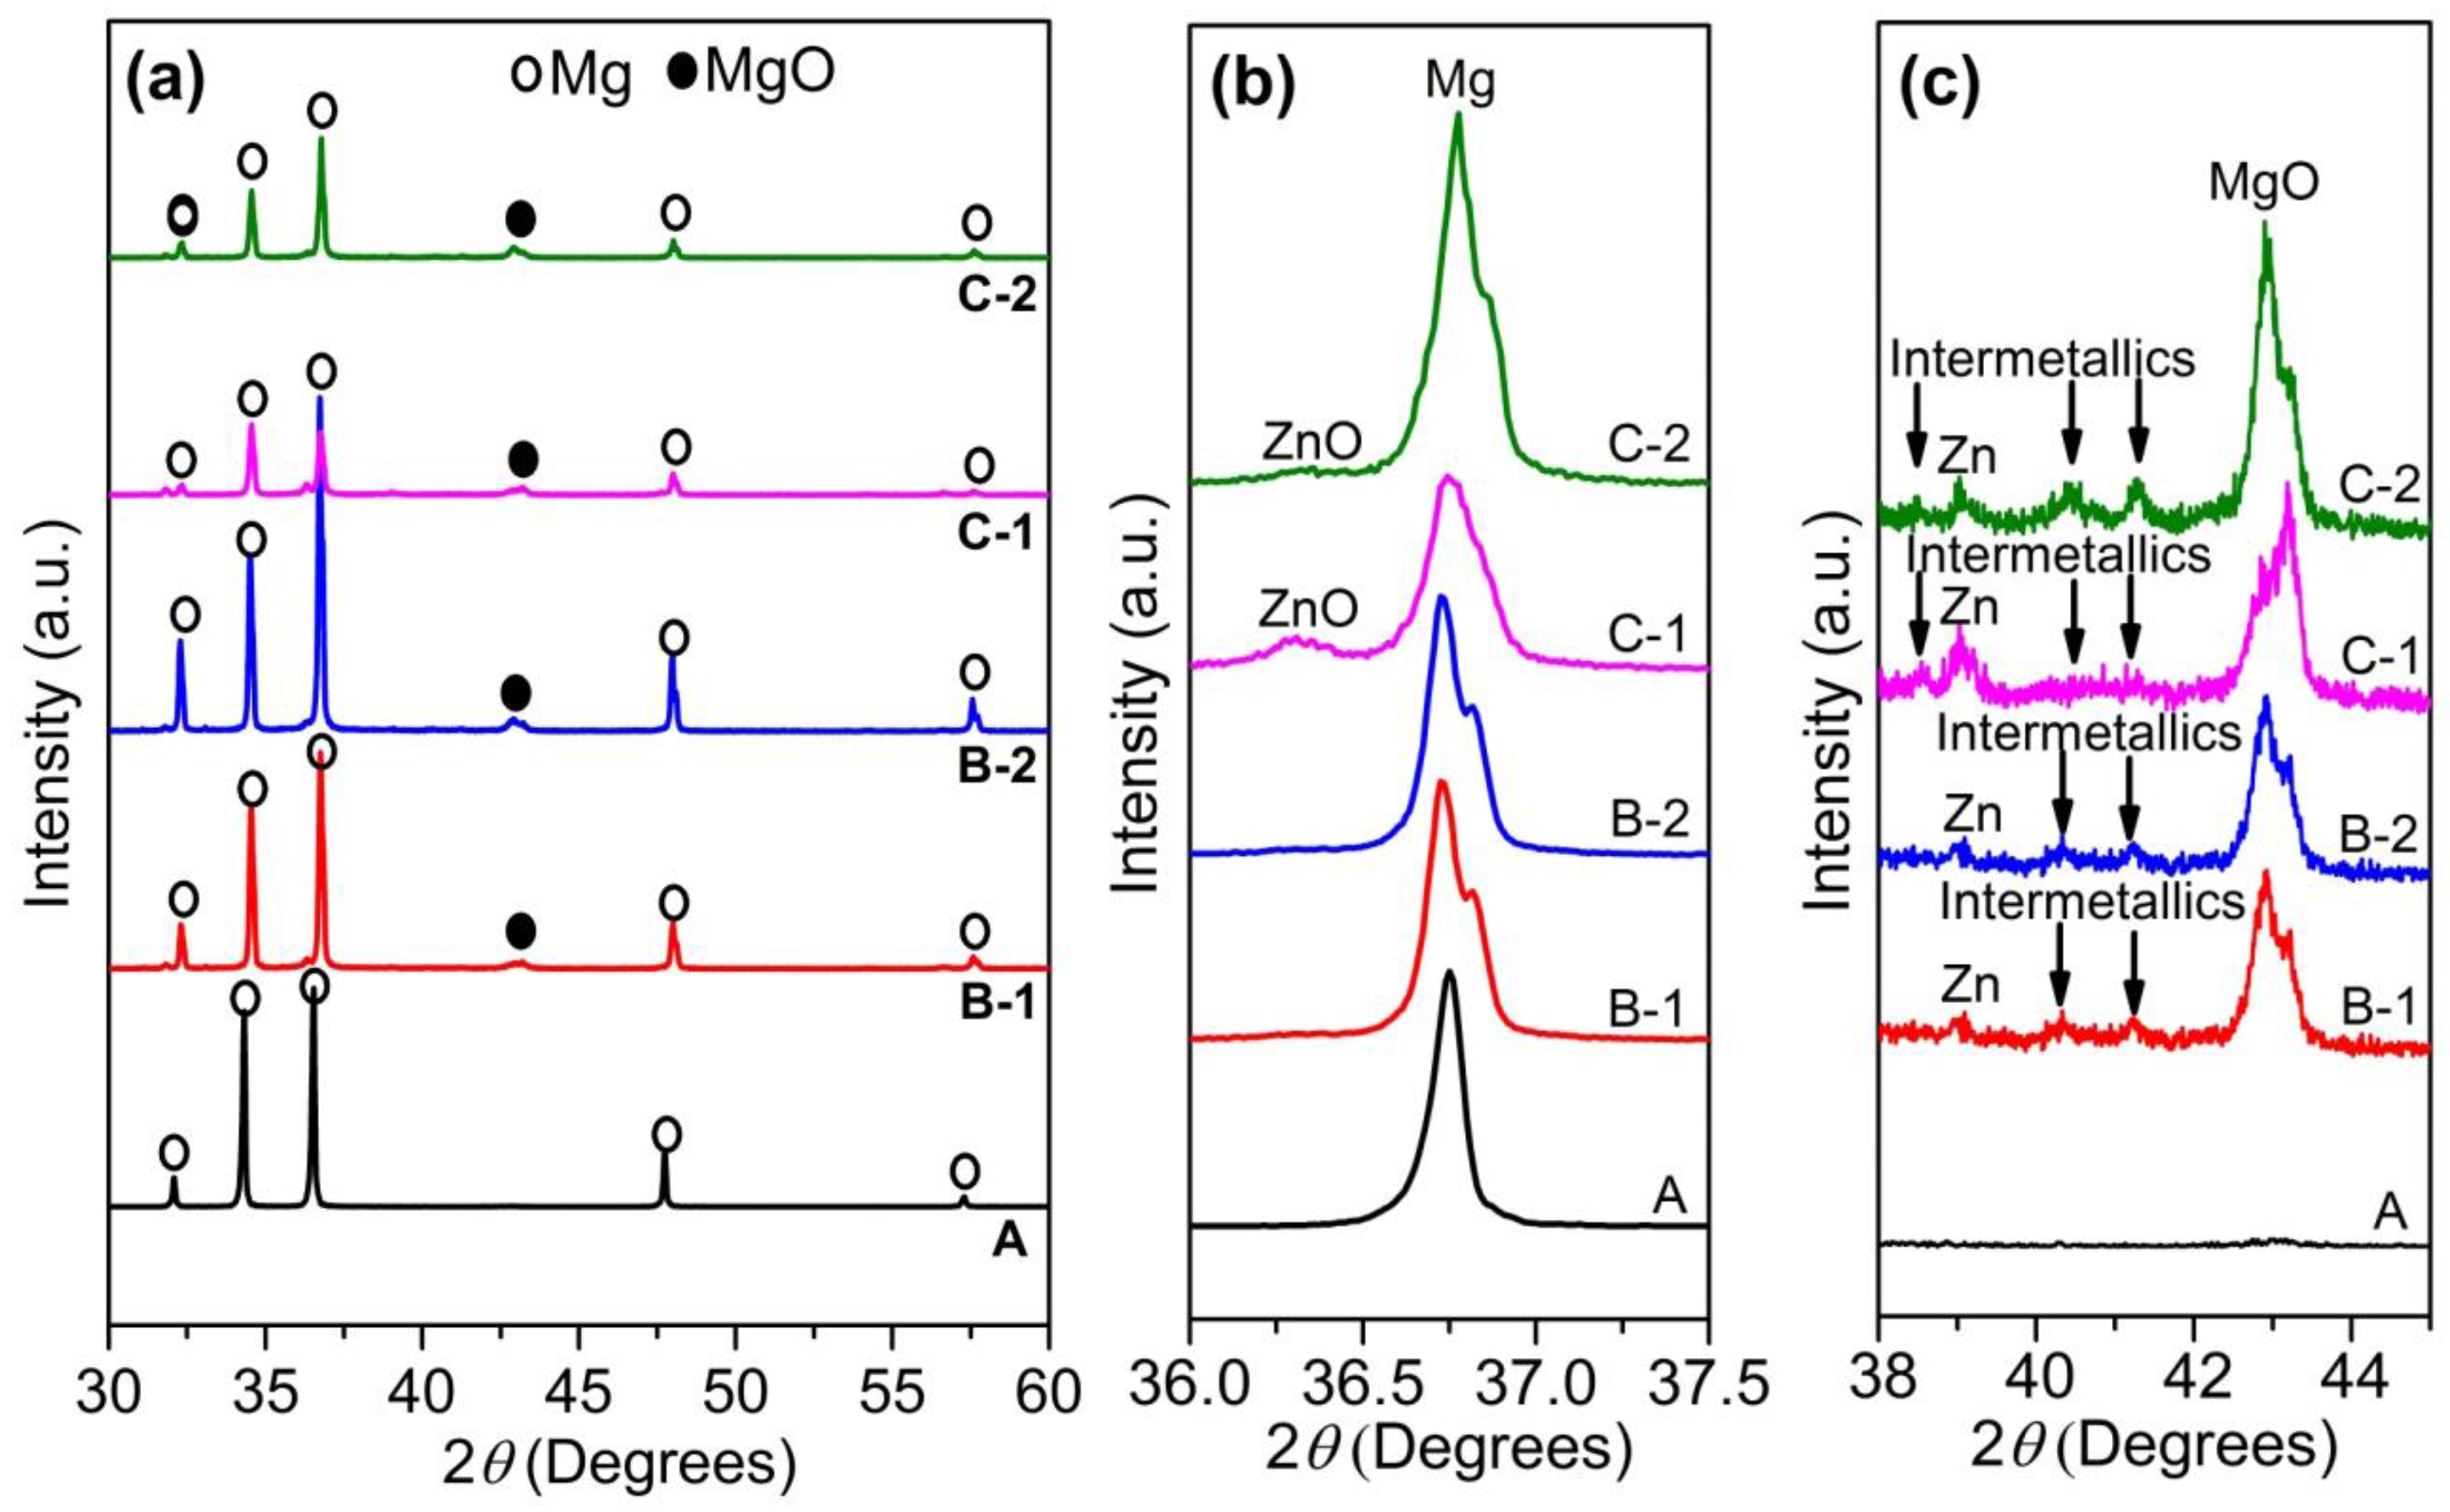
Figure 2.
SEM (scattering electron microscope) images of (a) sample B-1; (b) sample B-2; (c) sample C-1; and (d) sample C-2.
Figure 2.
SEM (scattering electron microscope) images of (a) sample B-1; (b) sample B-2; (c) sample C-1; and (d) sample C-2.

Figure 3.
Mg2+ ion release in the Hanks’ solution during immersion test.

Figure 4.
Hydrogen gas evolution during immersion test.
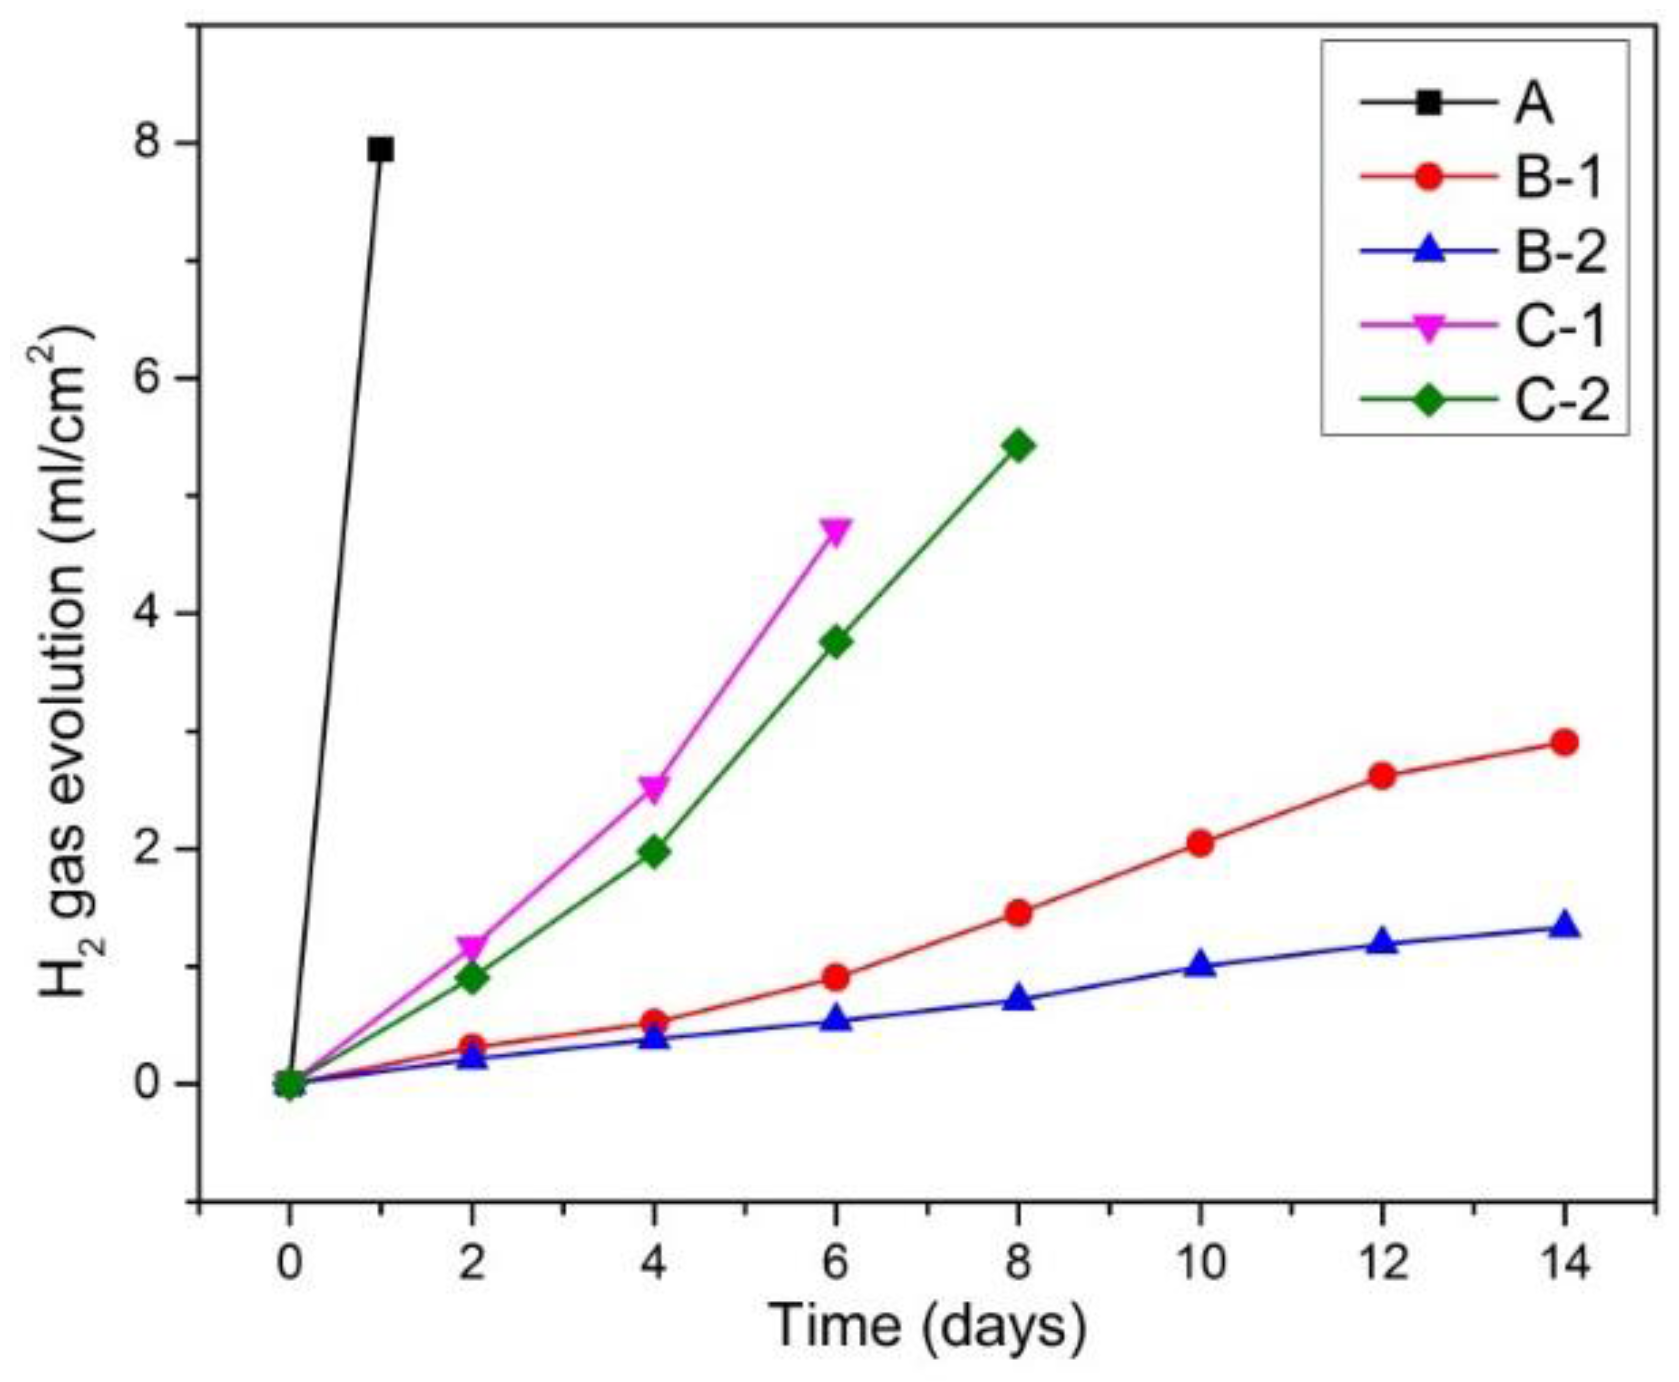
Figure 5.
(a–k) Surface morphology of samples before and after immersion test.

Figure 6.
SEM images of immersed samples: (a) B-1; (b) B-2; and (c) C-2.

Figure 7.
XRD patterns of immersed samples B-1, B-2, and C-2.
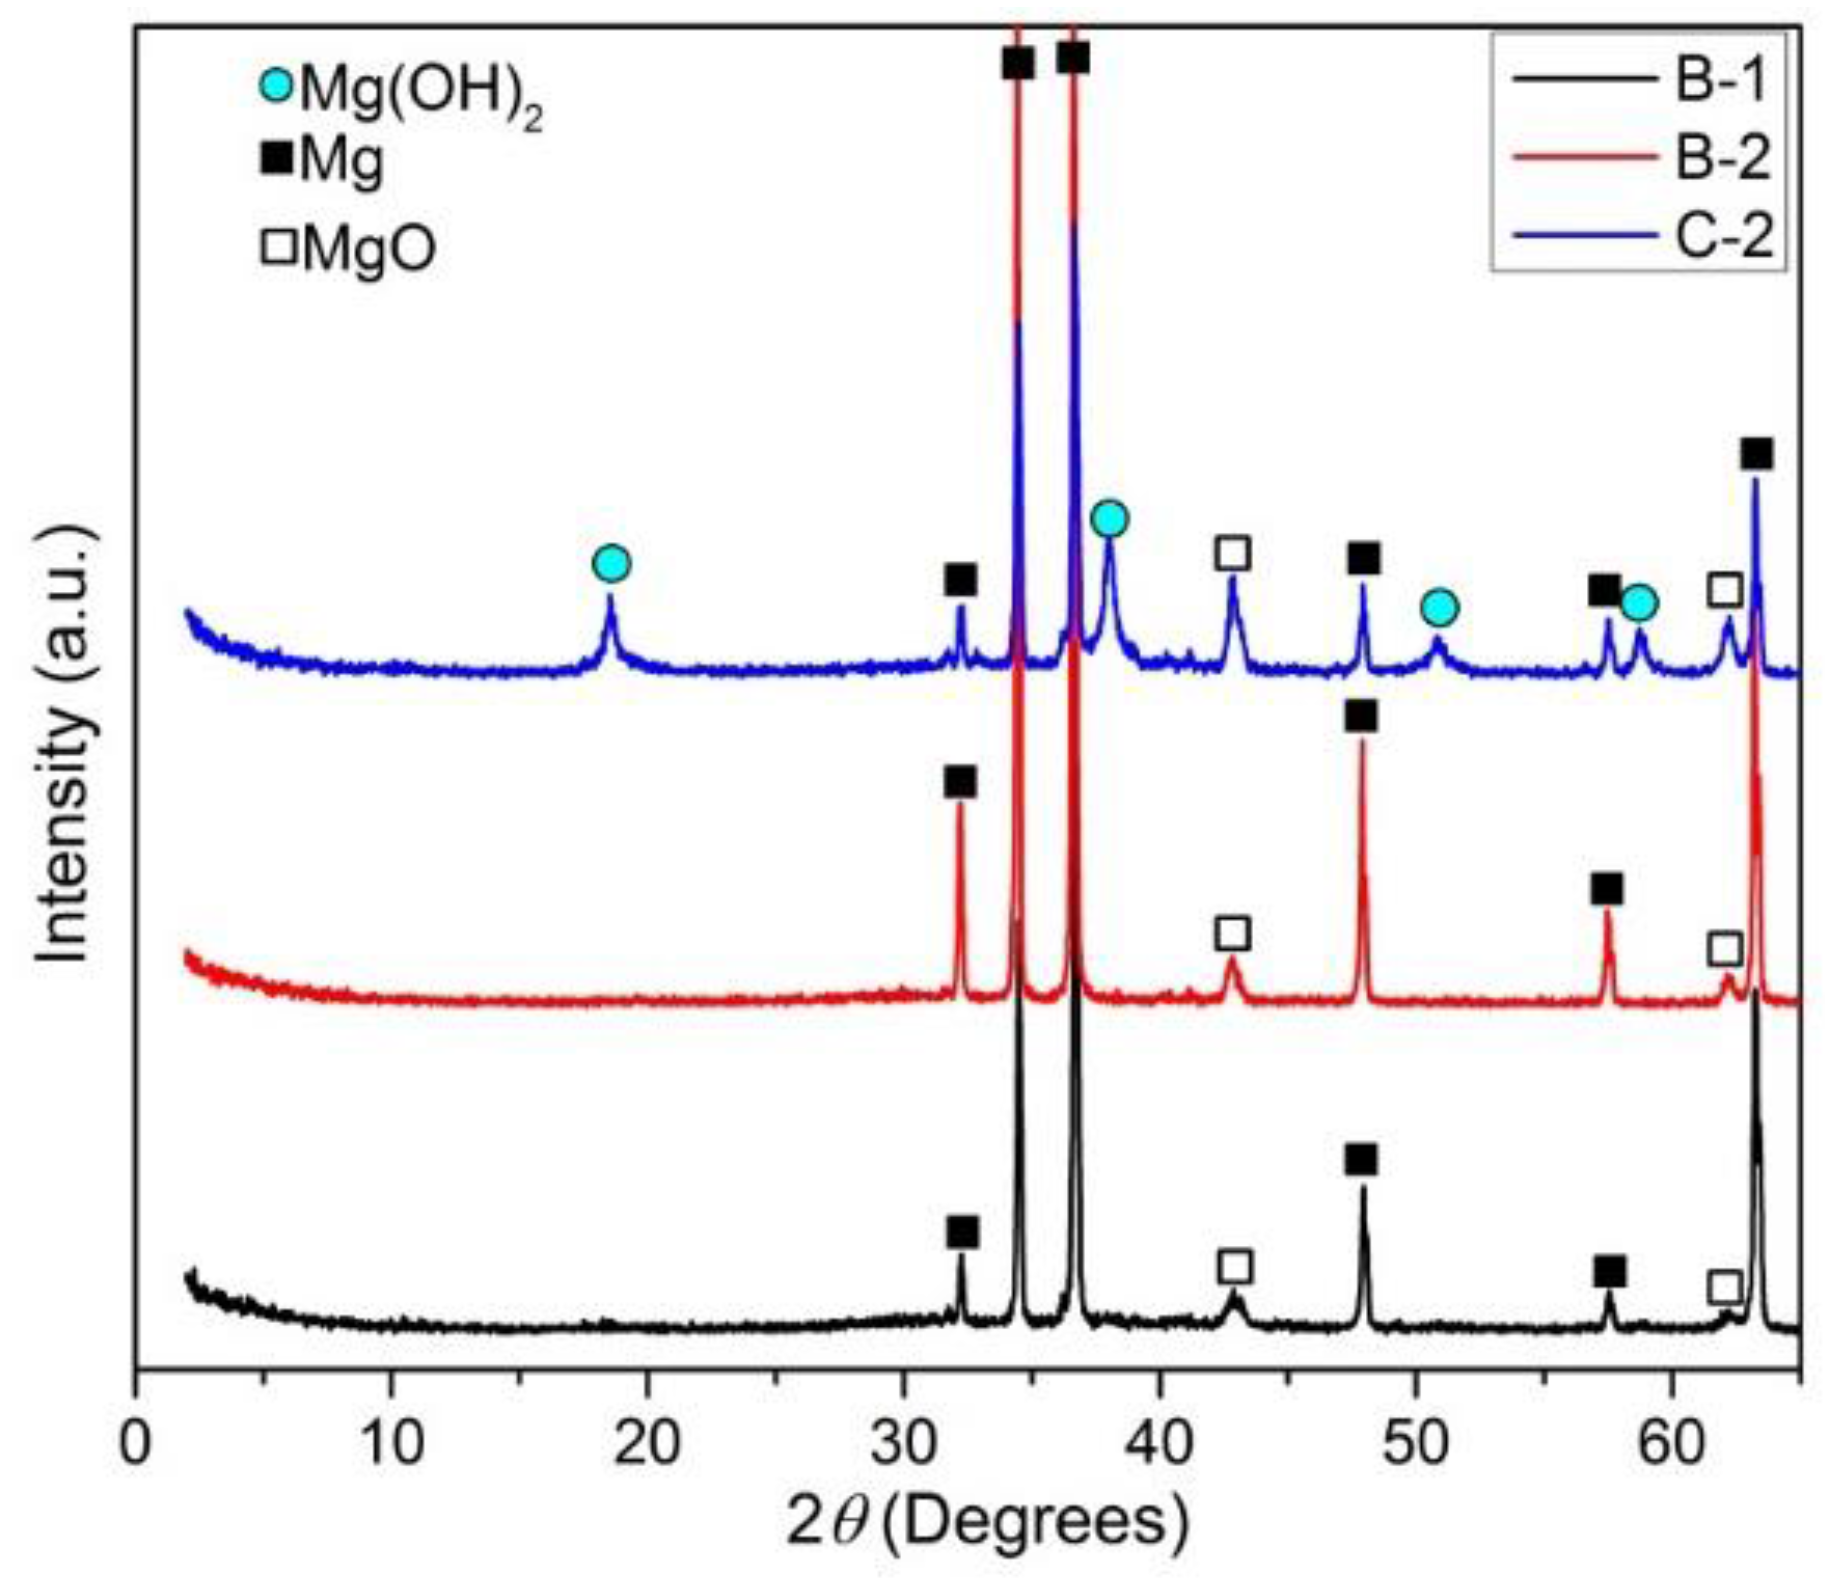
Figure 8.
FTIR (Fourier-transform infrared spectroscopy) spectra of immersed samples B-1, B-2, and C-2.
Figure 8.
FTIR (Fourier-transform infrared spectroscopy) spectra of immersed samples B-1, B-2, and C-2.

Figure 9.
Potentiodynamic polarization curves of as fabricated samples in Hanks’ solution.
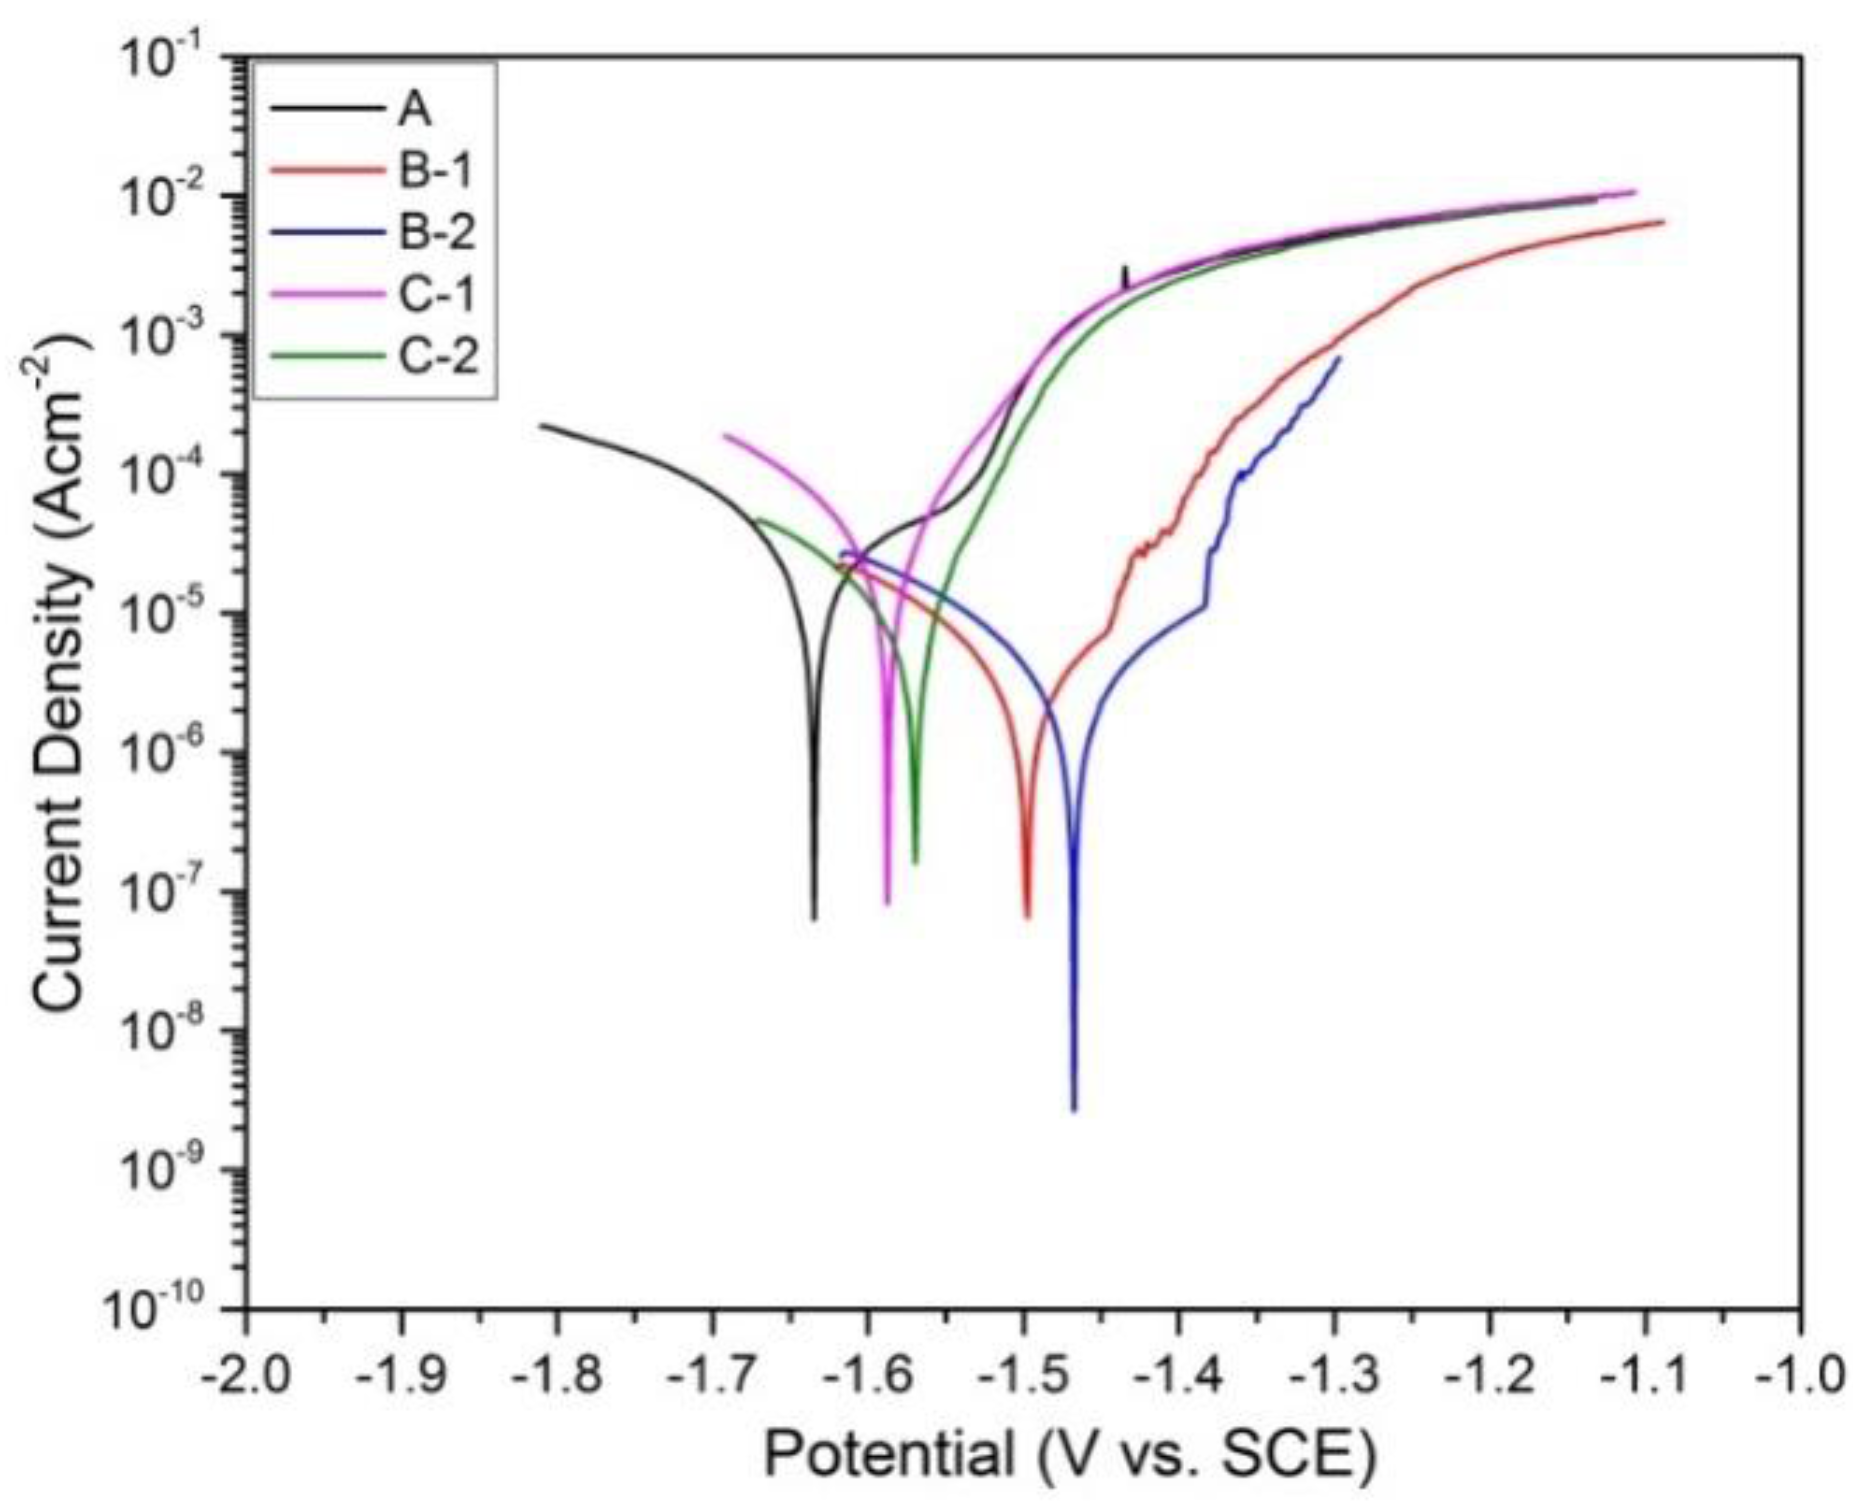
Figure 10.
Bode plots of samples B-1, B-2, C-1, and C-2 immersed in Hank’s solution.

Table 1.
Composition and sintering conditions of five kinds of samples.
| Sample Name | Composition | Sintering in Vacuum Furnace Time/Temperature/Pressure | Sintering by SPS Time/Temperature/Pressure |
|---|---|---|---|
| A | Mg-0 wt % ZnO | - | 10 min/550 °C/50 MPa |
| B-1 | Mg-10 wt % ZnO | - | 10 min/550 °C/50 MPa |
| B-2 | Mg-10 wt % ZnO | 2.5 h/550 °C/0 MPa | 10 min/550 °C/50 MPa |
| C-1 | Mg-20 wt % ZnO | - | 10 min/550 °C/50 MPa |
| C-2 | Mg-20 wt % ZnO | 2.5 h/550 °C/0 MPa | 10 min/550 °C/50 MPa |
Table 2.
Composition of Hanks’ solution using for immersion tests.
| Reagent | NaCl | KCl | Na2HPO4·H2O | KH2PO4 | MgSO4·7H2O | NaHCO3 | CaCl2 |
|---|---|---|---|---|---|---|---|
| Concentration (g/L) | 8.00 | 0.40 | 0.06 | 0.06 | 0.20 | 0.35 | 0.14 |
Table 3.
EDX (energy-dispersive X-ray) analysis result on the surfaces of immersed samples.
| Element | Sample B-1 | Sample B-2 | Sample C-2 |
|---|---|---|---|
| Oxygen (at %) | 70 | 62 | 68 |
| Calcium (at %) | 14 | 15 | 0 |
| Phosphorus (at %) | 10 | 12 | 1 |
| Magnesium (at %) | 6 | 11 | 31 |
Table 4.
Corrosion potential (Ecorr) and corrosion current density (Icorr) of the as fabricated samples.
Table 4.
Corrosion potential (Ecorr) and corrosion current density (Icorr) of the as fabricated samples.
| Sample | Ecorr (V vs. SCE) | Icorr (A cm−2) |
|---|---|---|
| A | −1.63 | 2.7 × 10⁻⁵ |
| B-1 | −1.50 | 3.0 × 10⁻⁶ |
| B-2 | −1.47 | 2.2 × 10⁻⁶ |
| C-1 | −1.59 | 3.0 × 10⁻⁵ |
| C-2 | −1.57 | 8.0 × 10⁻⁶ |
© 2017 by the authors. Licensee MDPI, Basel, Switzerland. This article is an open access article distributed under the terms and conditions of the Creative Commons Attribution (CC BY) license (http://creativecommons.org/licenses/by/4.0/).
Share and Cite
MDPI and ACS Style
Cao, N.Q.; Pham, D.N.; Kai, N.; Dinh, H.V.; Hiromoto, S.; Kobayashi, E. In Vitro Corrosion Properties of Mg Matrix In Situ Composites Fabricated by Spark Plasma Sintering. Metals 2017, 7, 358. https://doi.org/10.3390/met7090358
AMA Style
Cao NQ, Pham DN, Kai N, Dinh HV, Hiromoto S, Kobayashi E. In Vitro Corrosion Properties of Mg Matrix In Situ Composites Fabricated by Spark Plasma Sintering. Metals. 2017; 7(9):358. https://doi.org/10.3390/met7090358
Chicago/Turabian StyleCao, Nguyen Q., Dinh N. Pham, Narita Kai, Hai V. Dinh, Sachiko Hiromoto, and Equo Kobayashi. 2017. "In Vitro Corrosion Properties of Mg Matrix In Situ Composites Fabricated by Spark Plasma Sintering" Metals 7, no. 9: 358. https://doi.org/10.3390/met7090358
Note that from the first issue of 2016, this journal uses article numbers instead of page numbers. See further details here.