The Influence of La and Ce Addition on Inclusion Modification in Cast Niobium Microalloyed Steels

 , , and
Abstract
:1. Introduction
2. Experimental Procedure
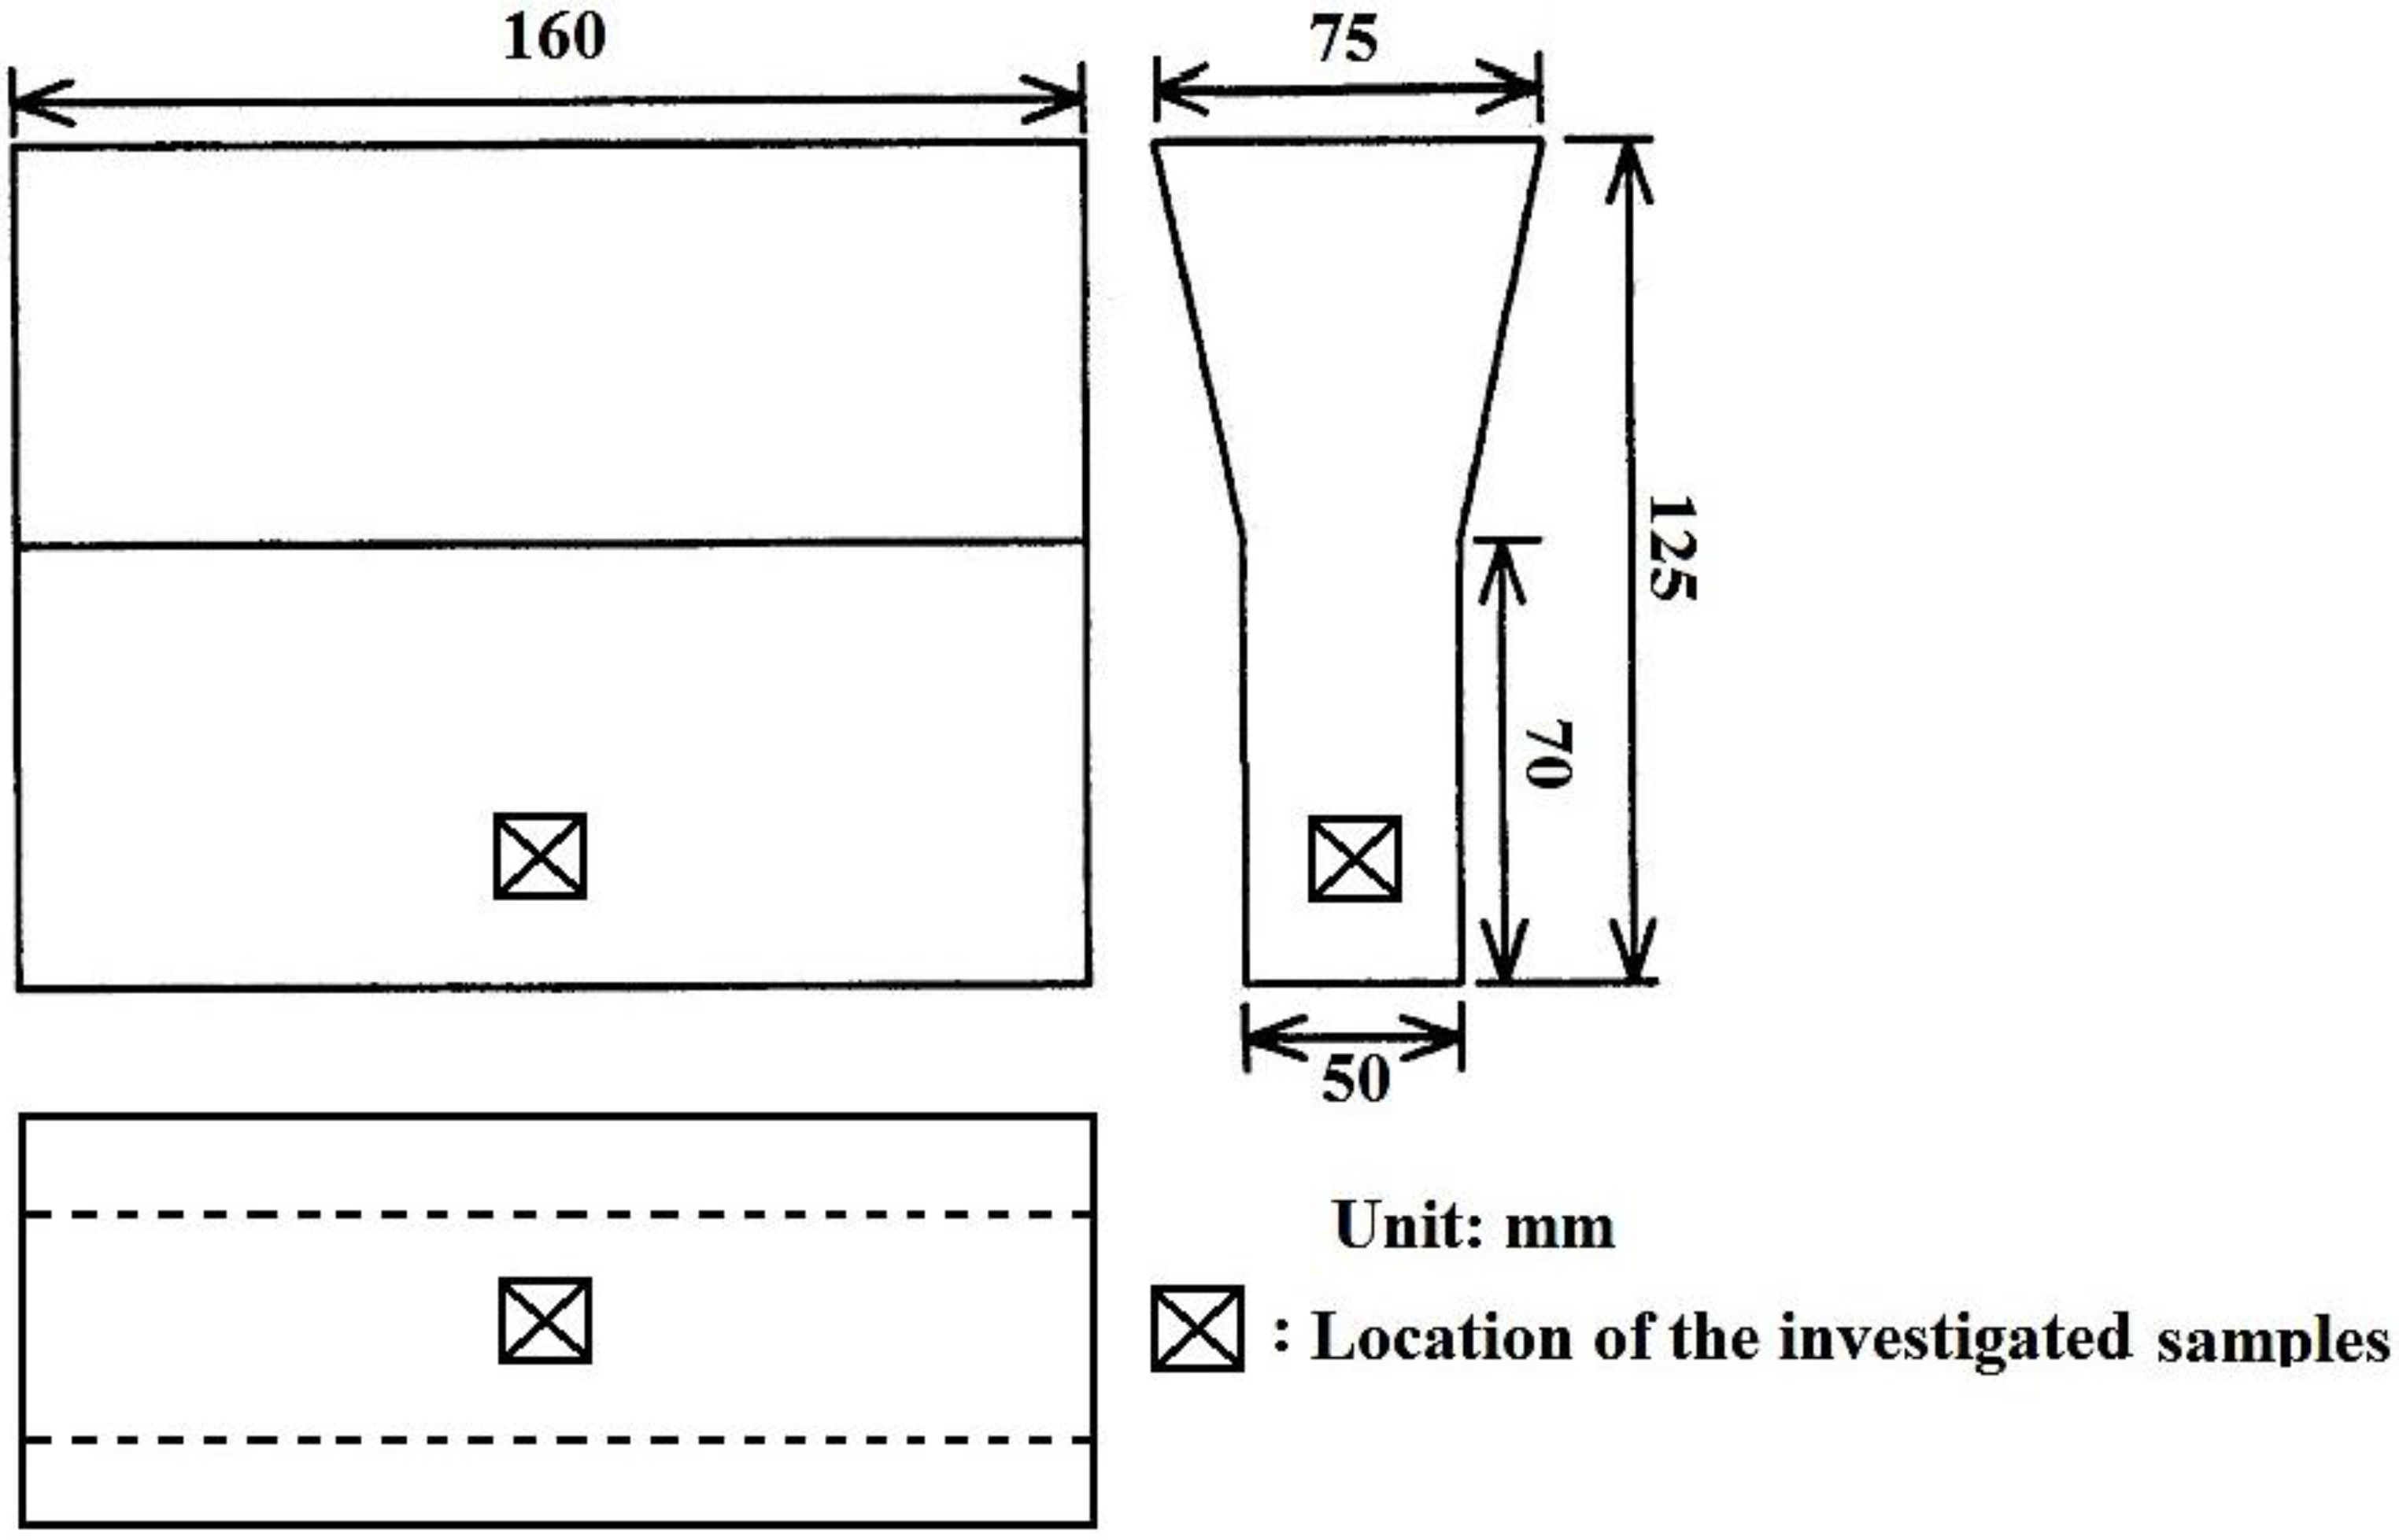
2.1. Casting and History of Samples
2.2. Sample Preparation and Metallographic Observations
3. Results
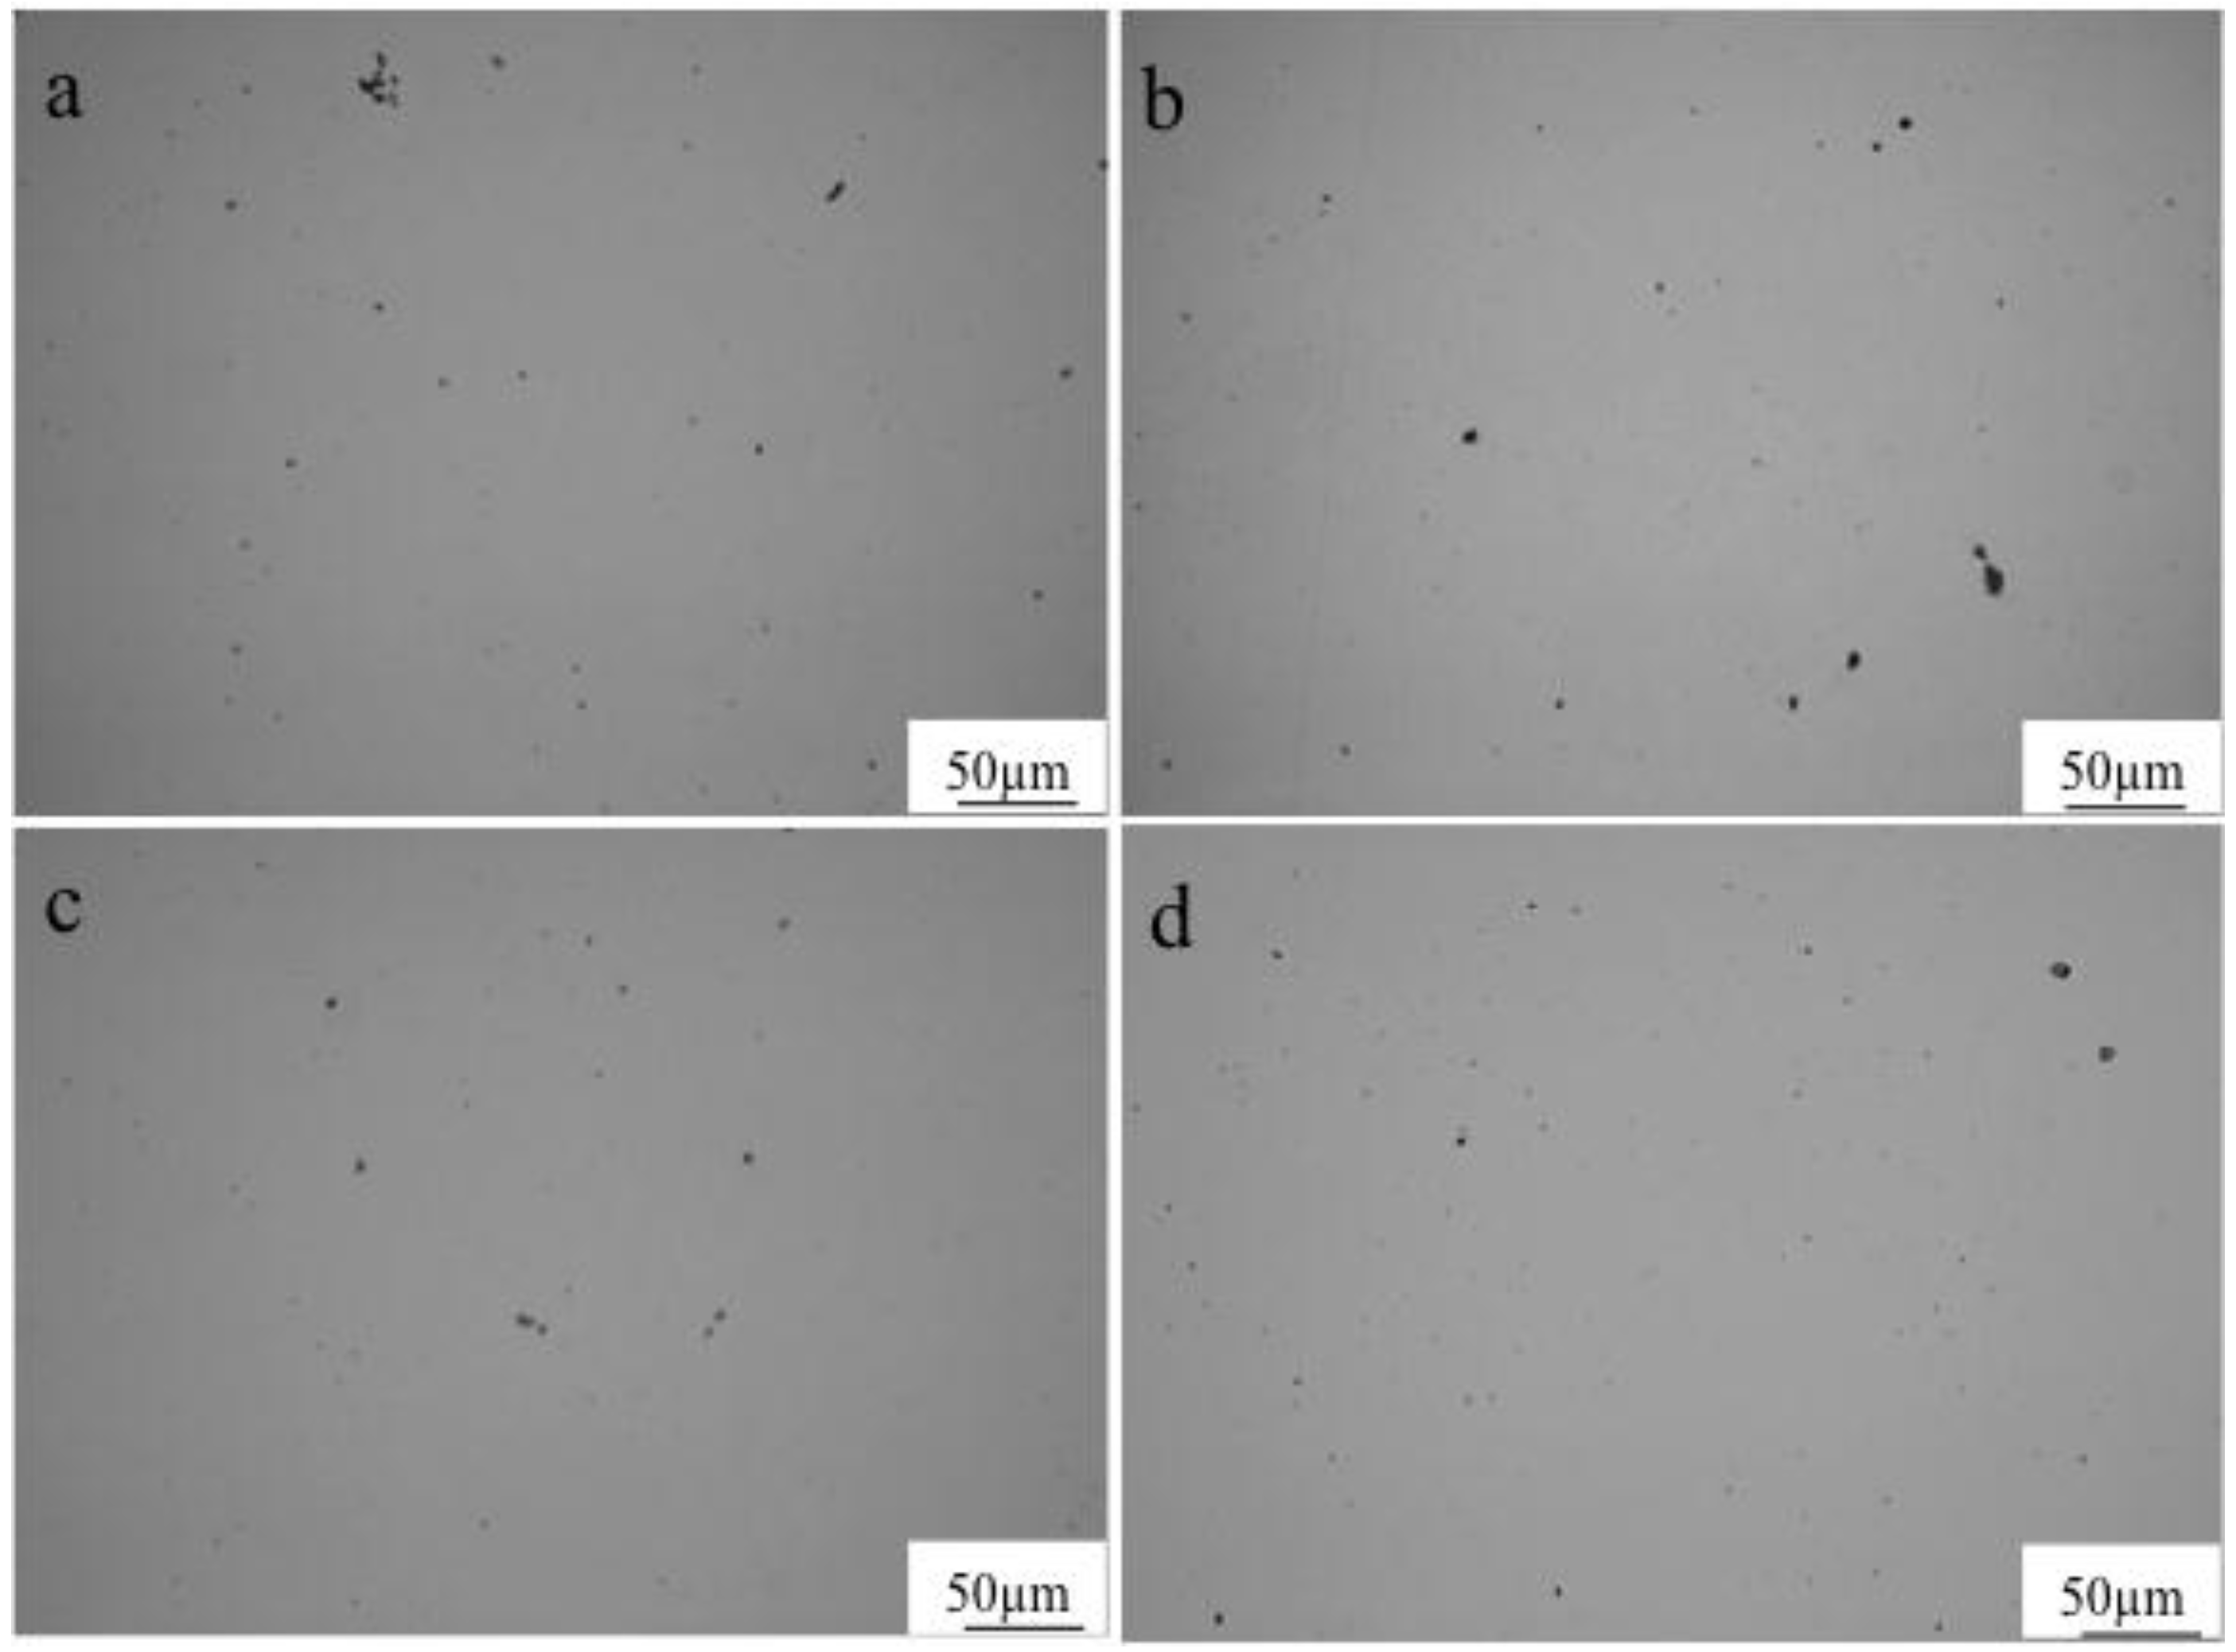
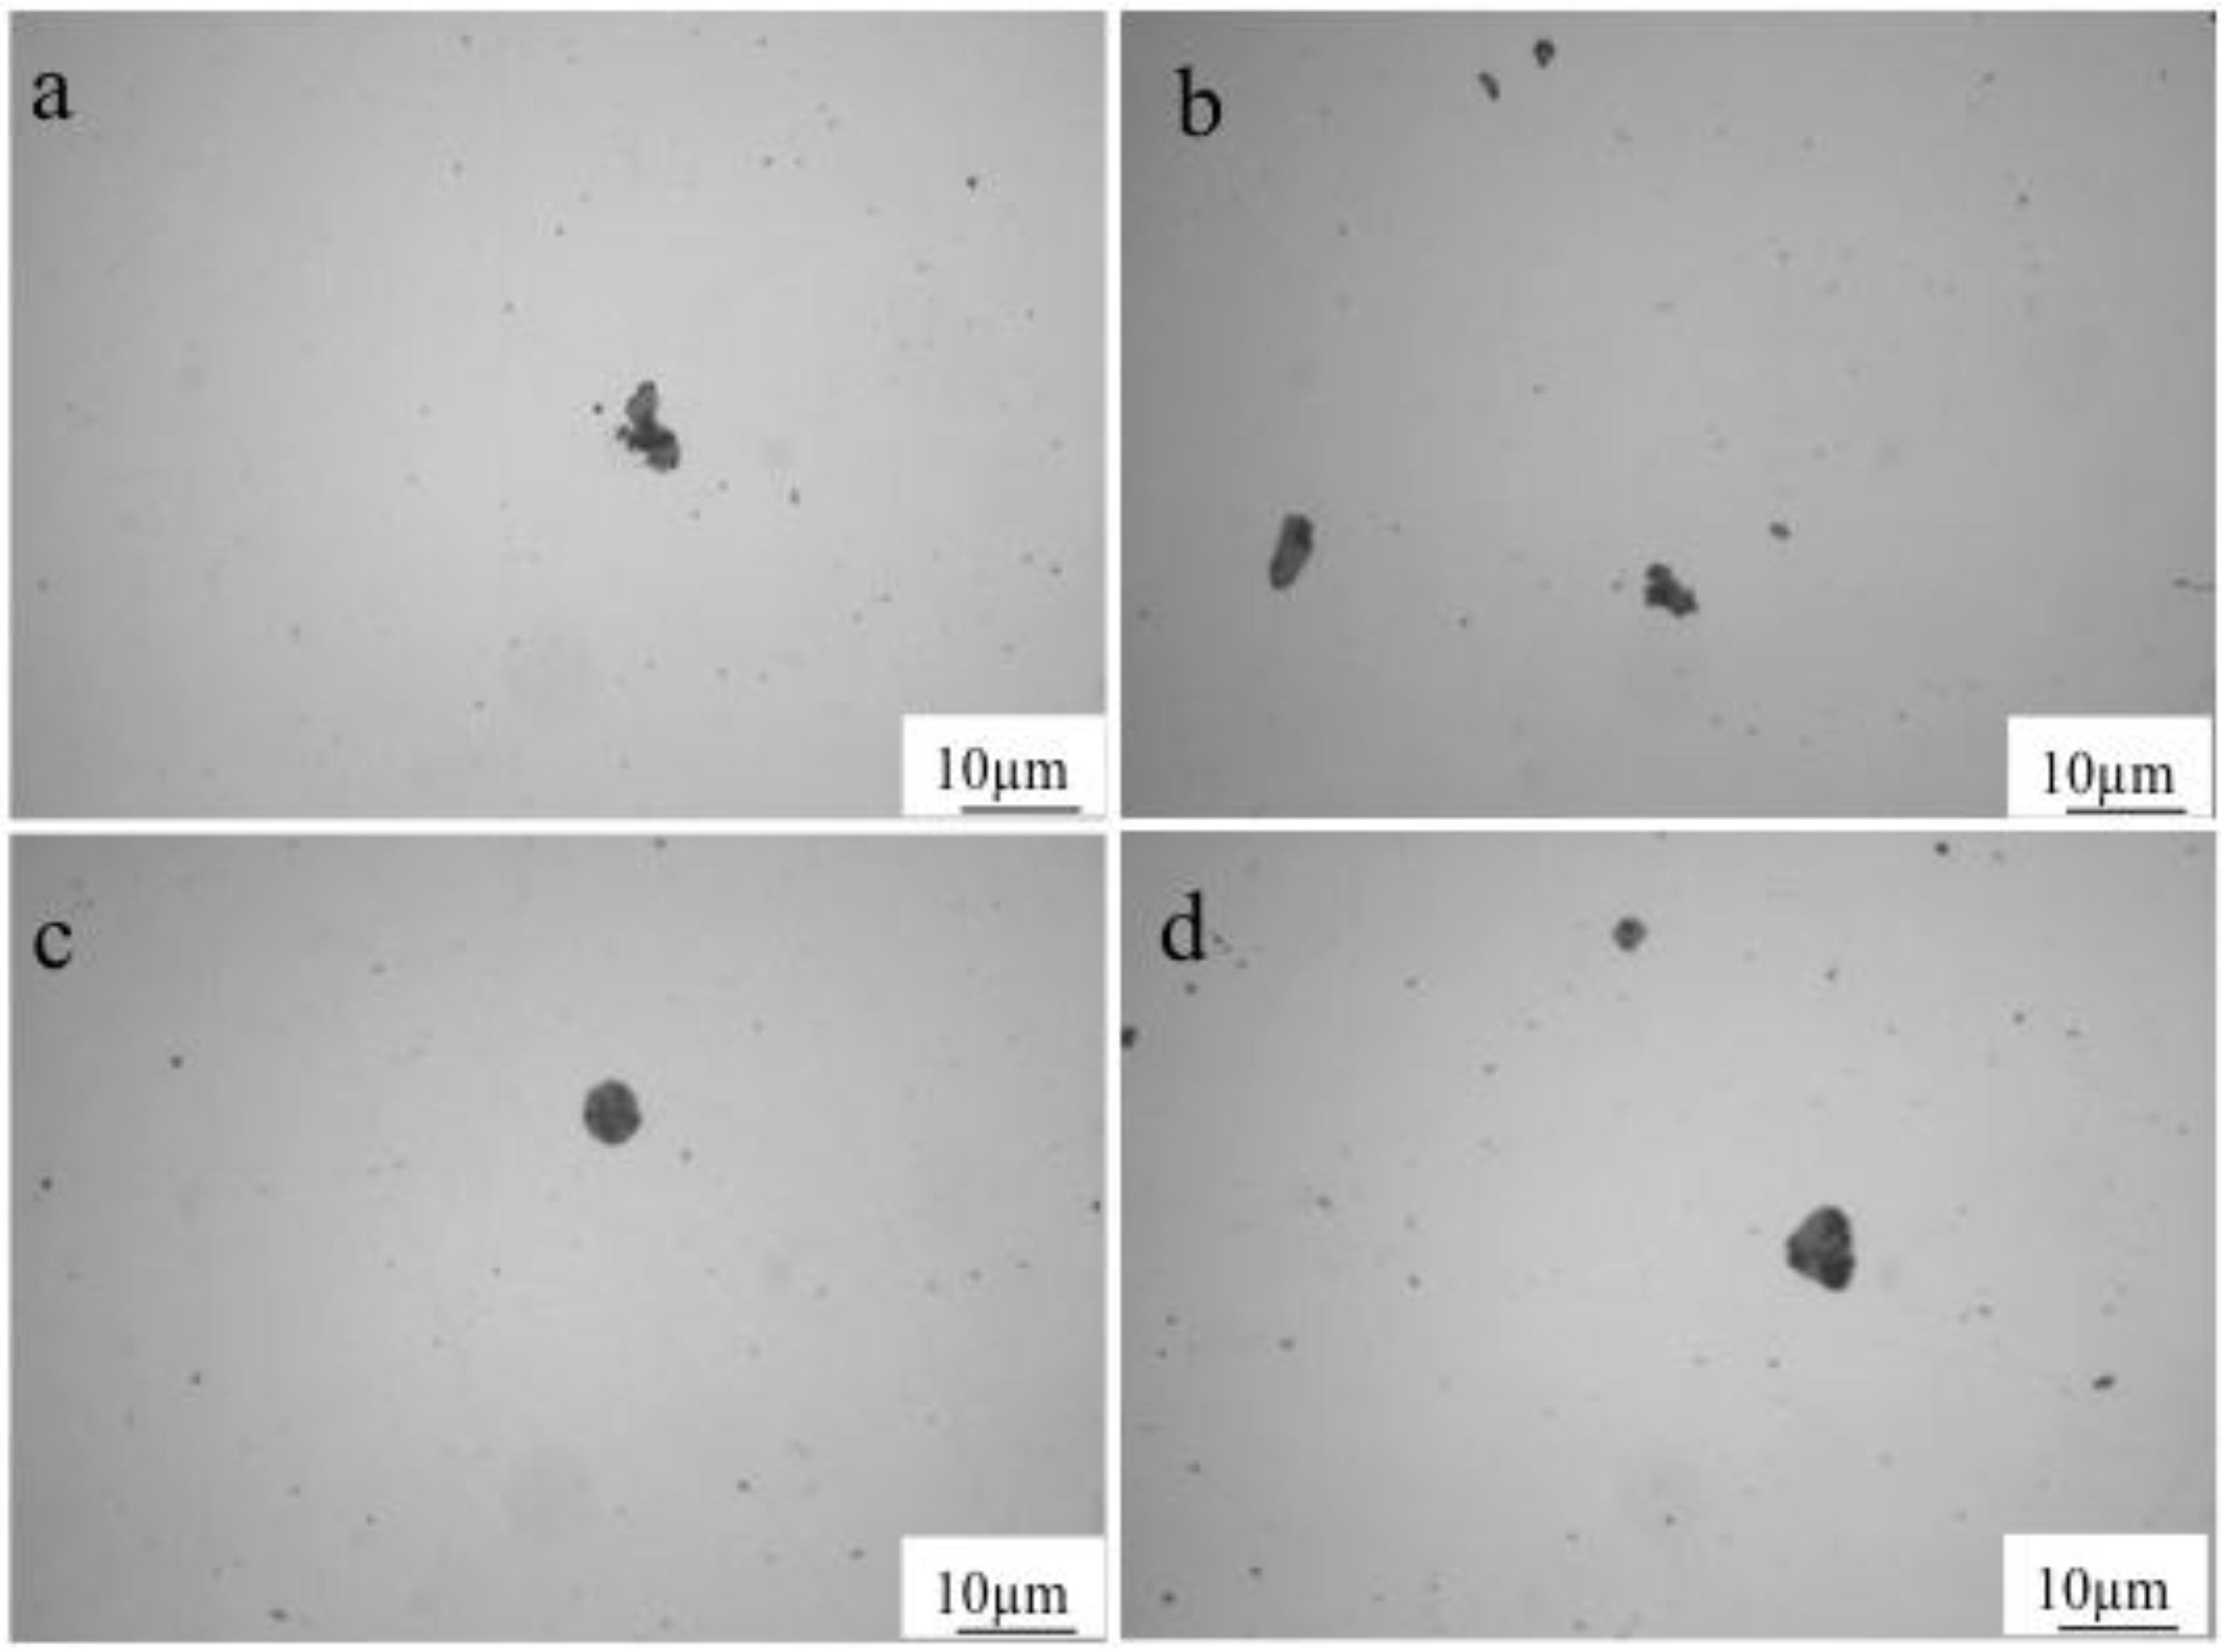
3.1. OM Observations and Image Analyses of the Inclusions
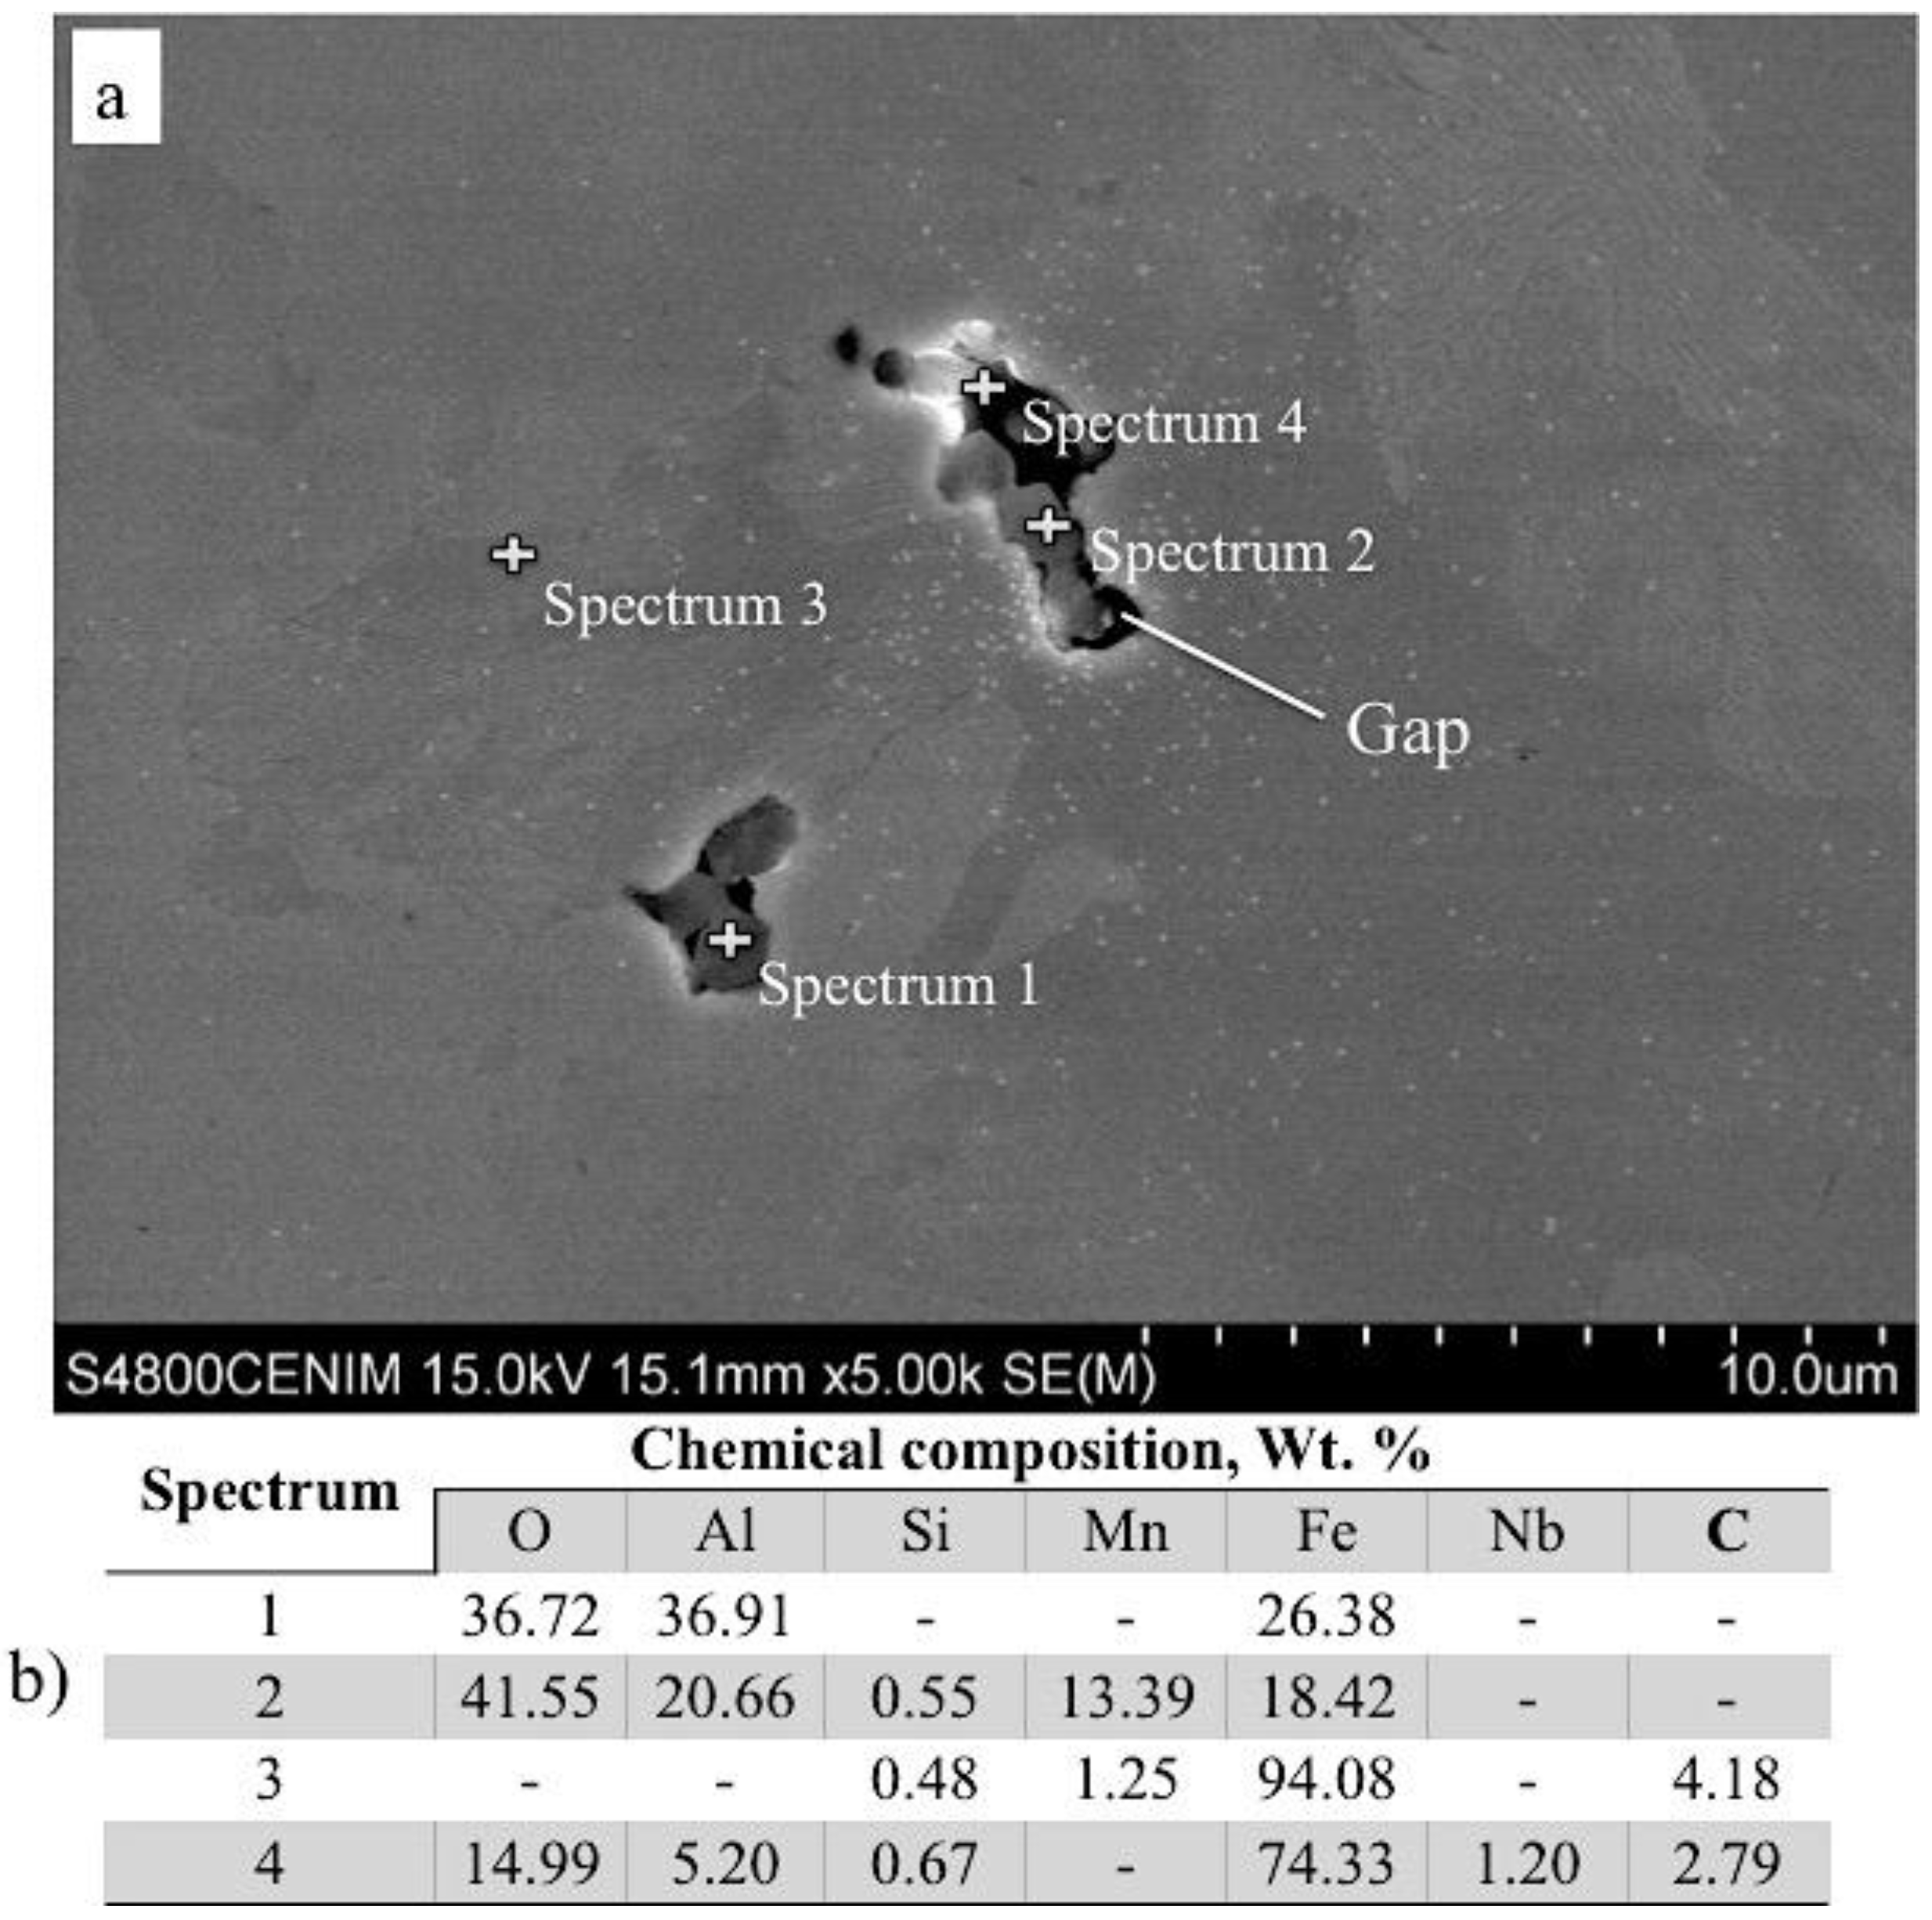
3.2. Inclusion Characterization by SEM
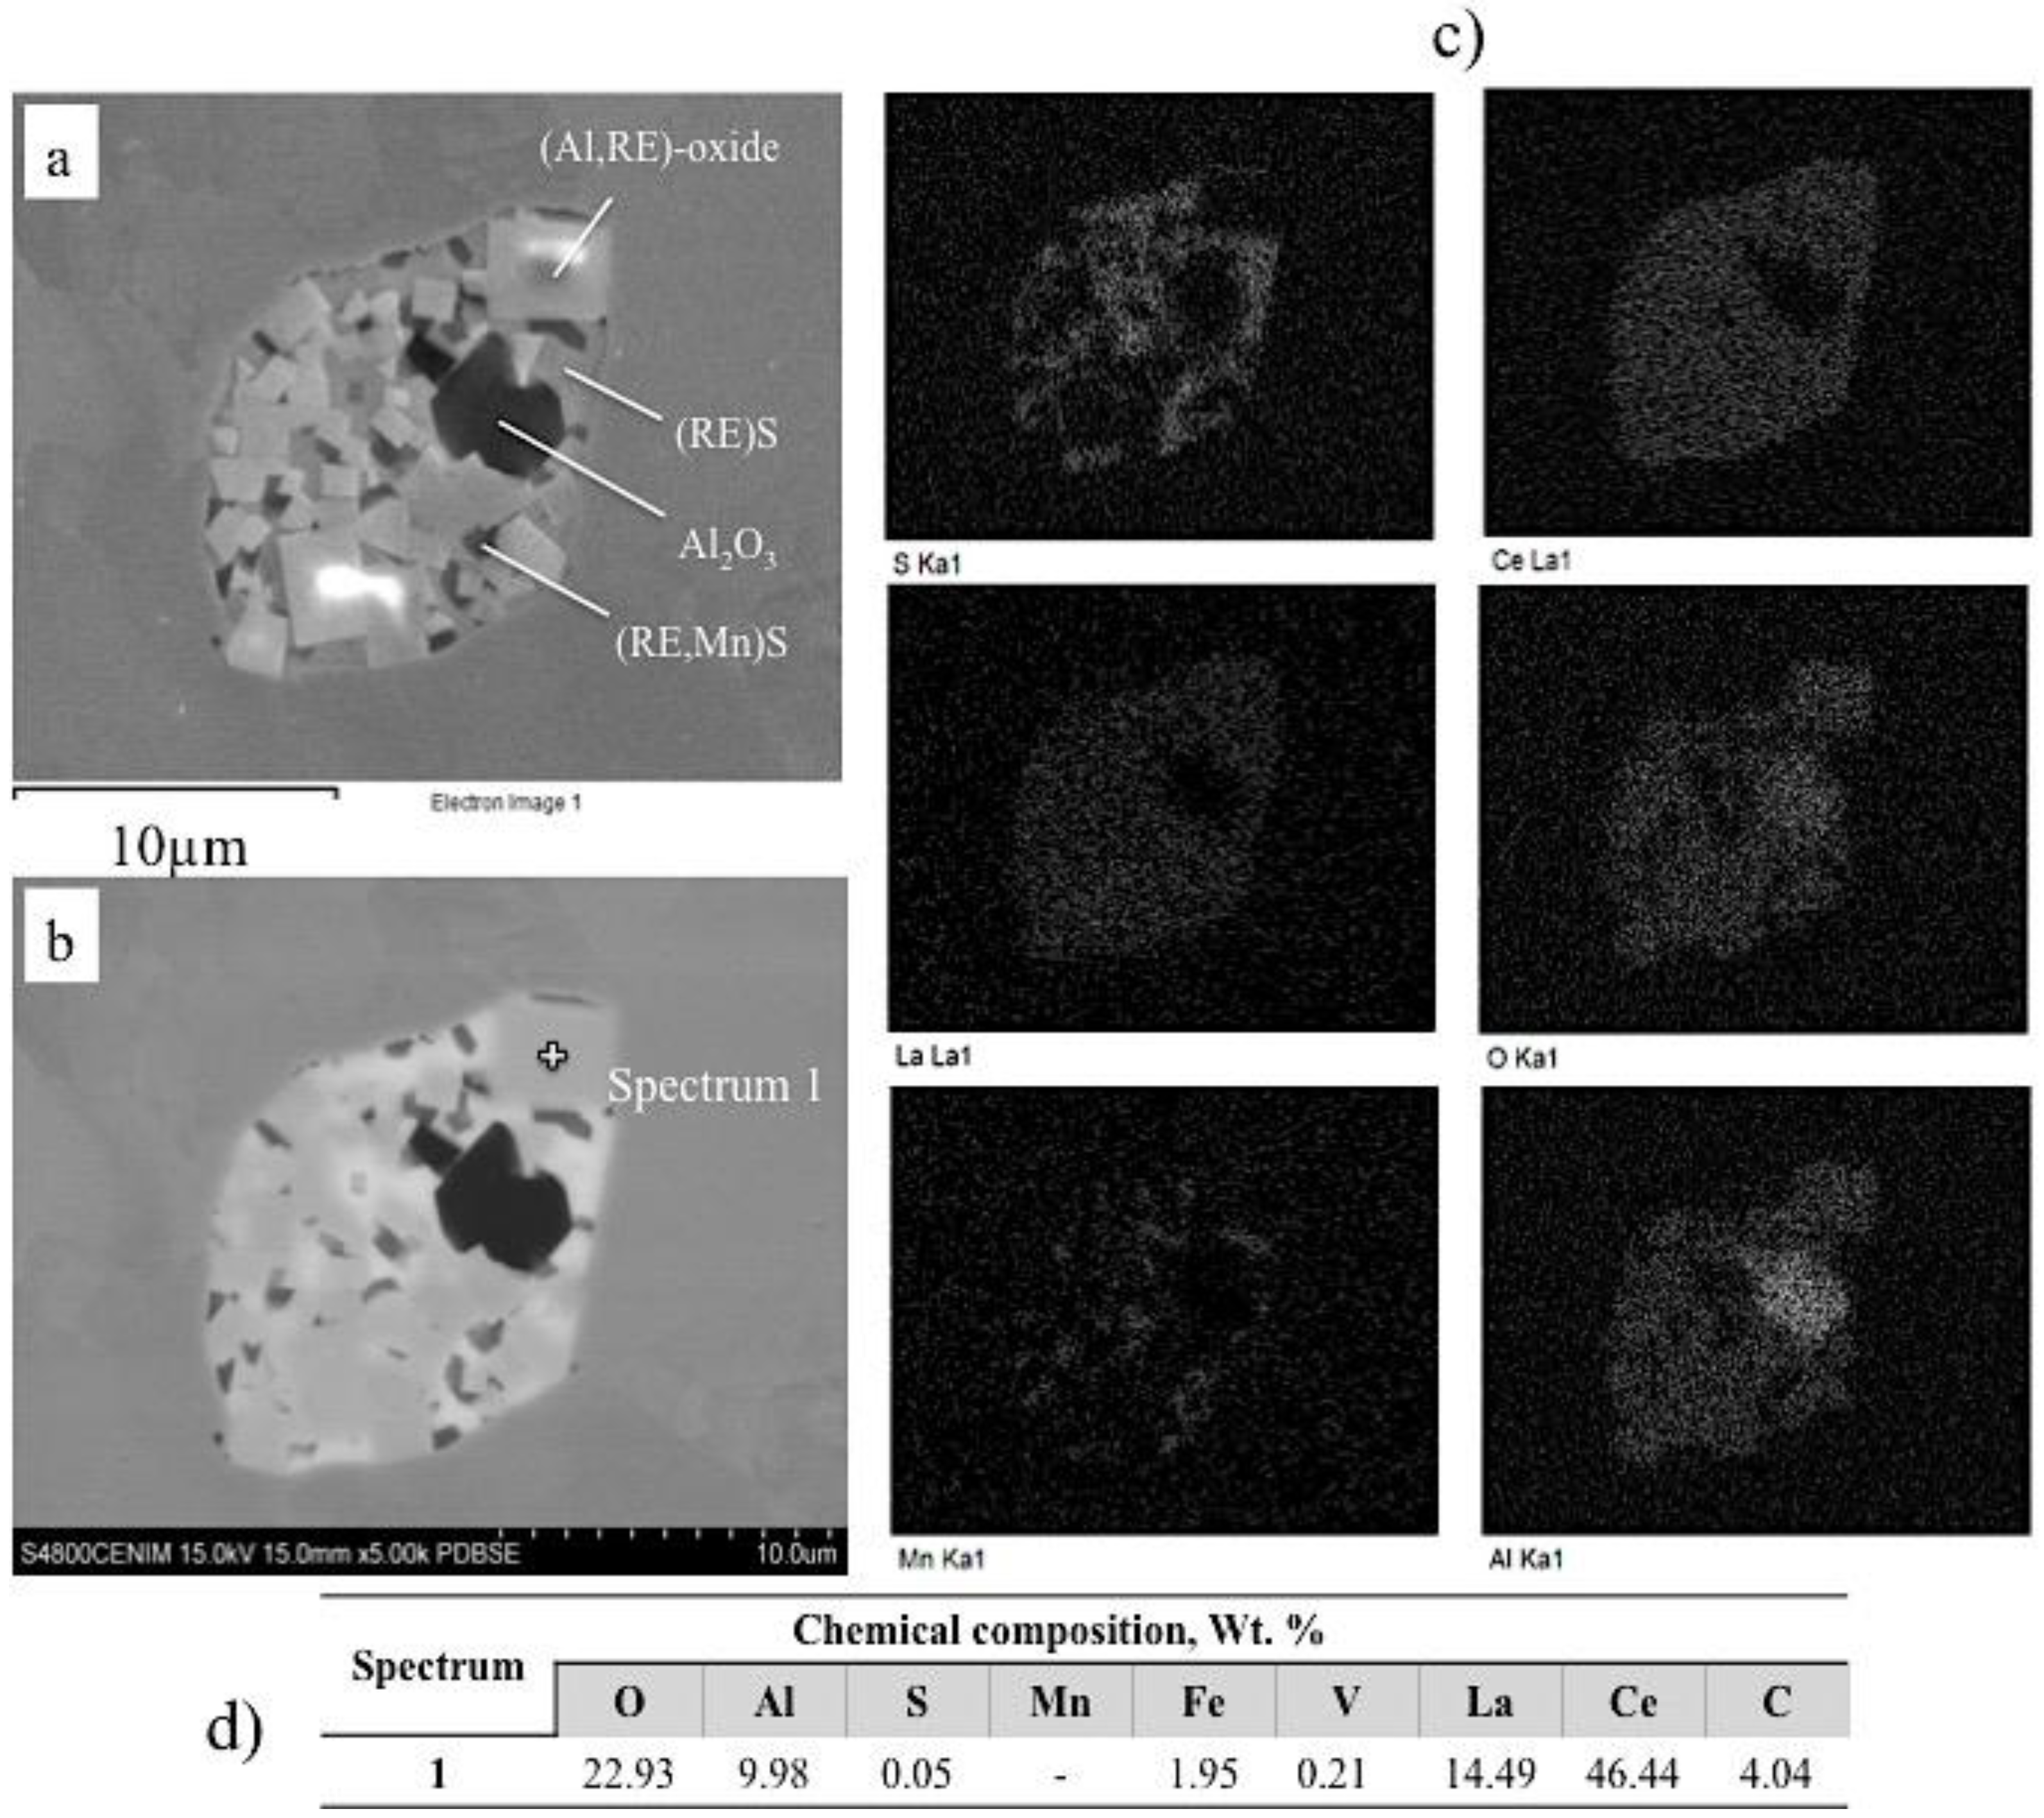
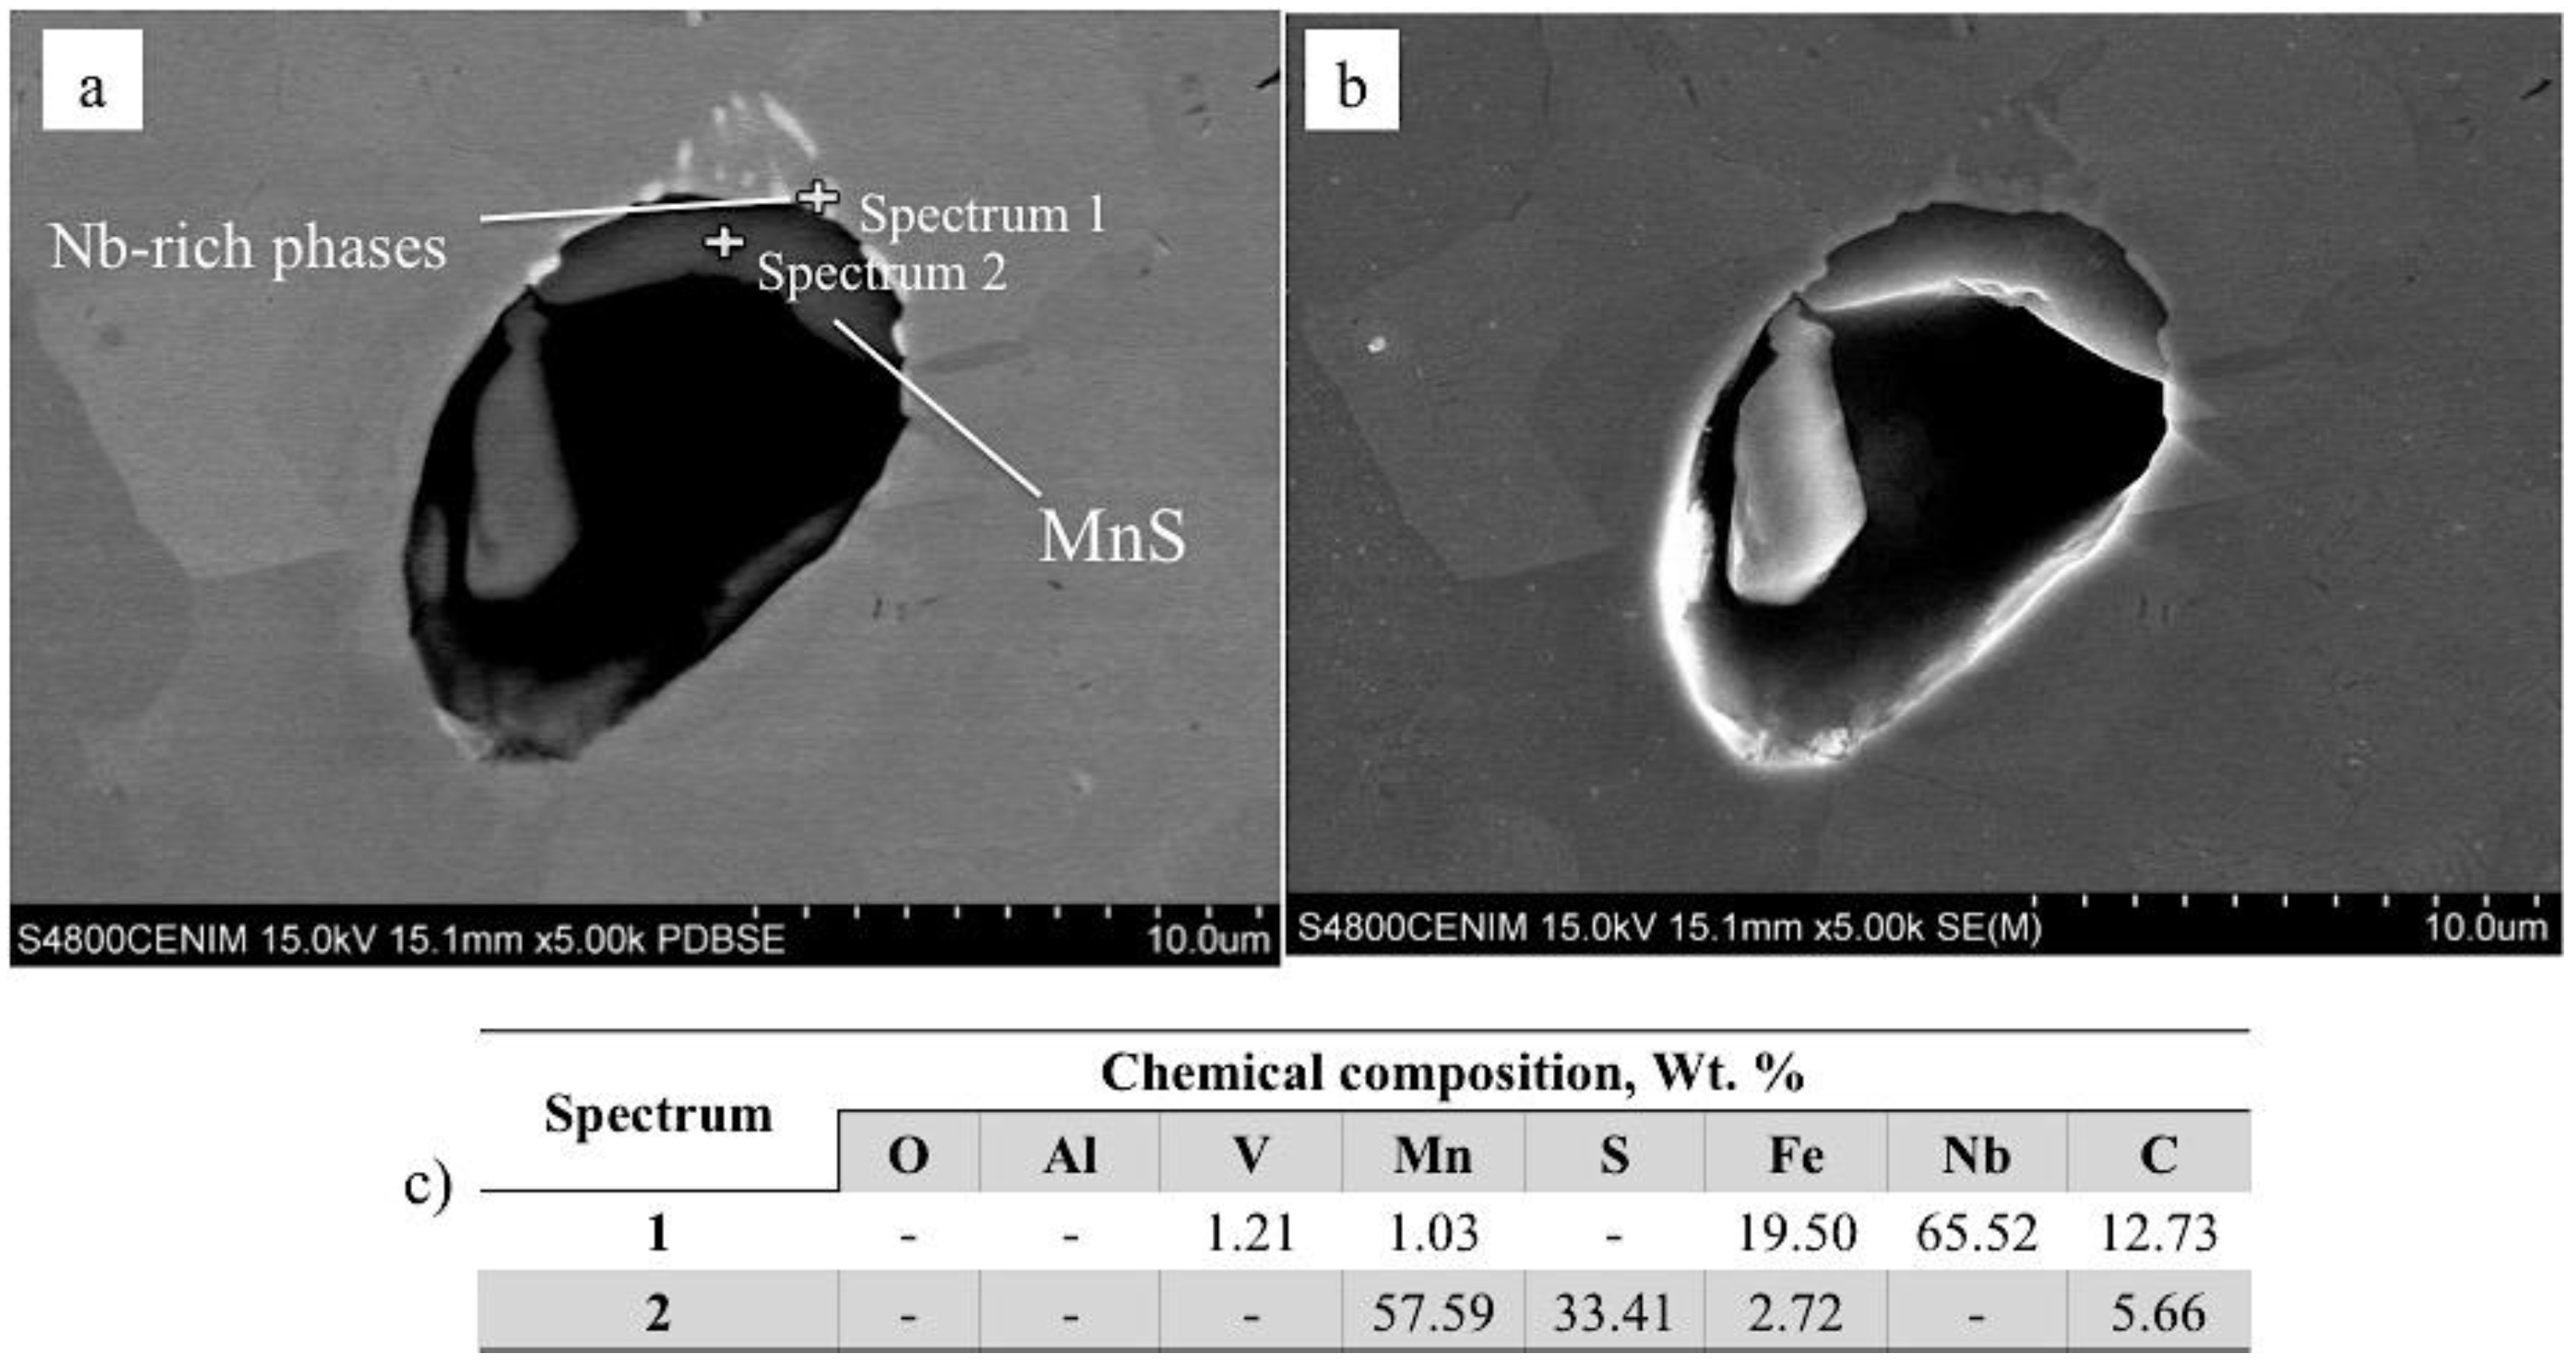
3.2.1. Sample RE1
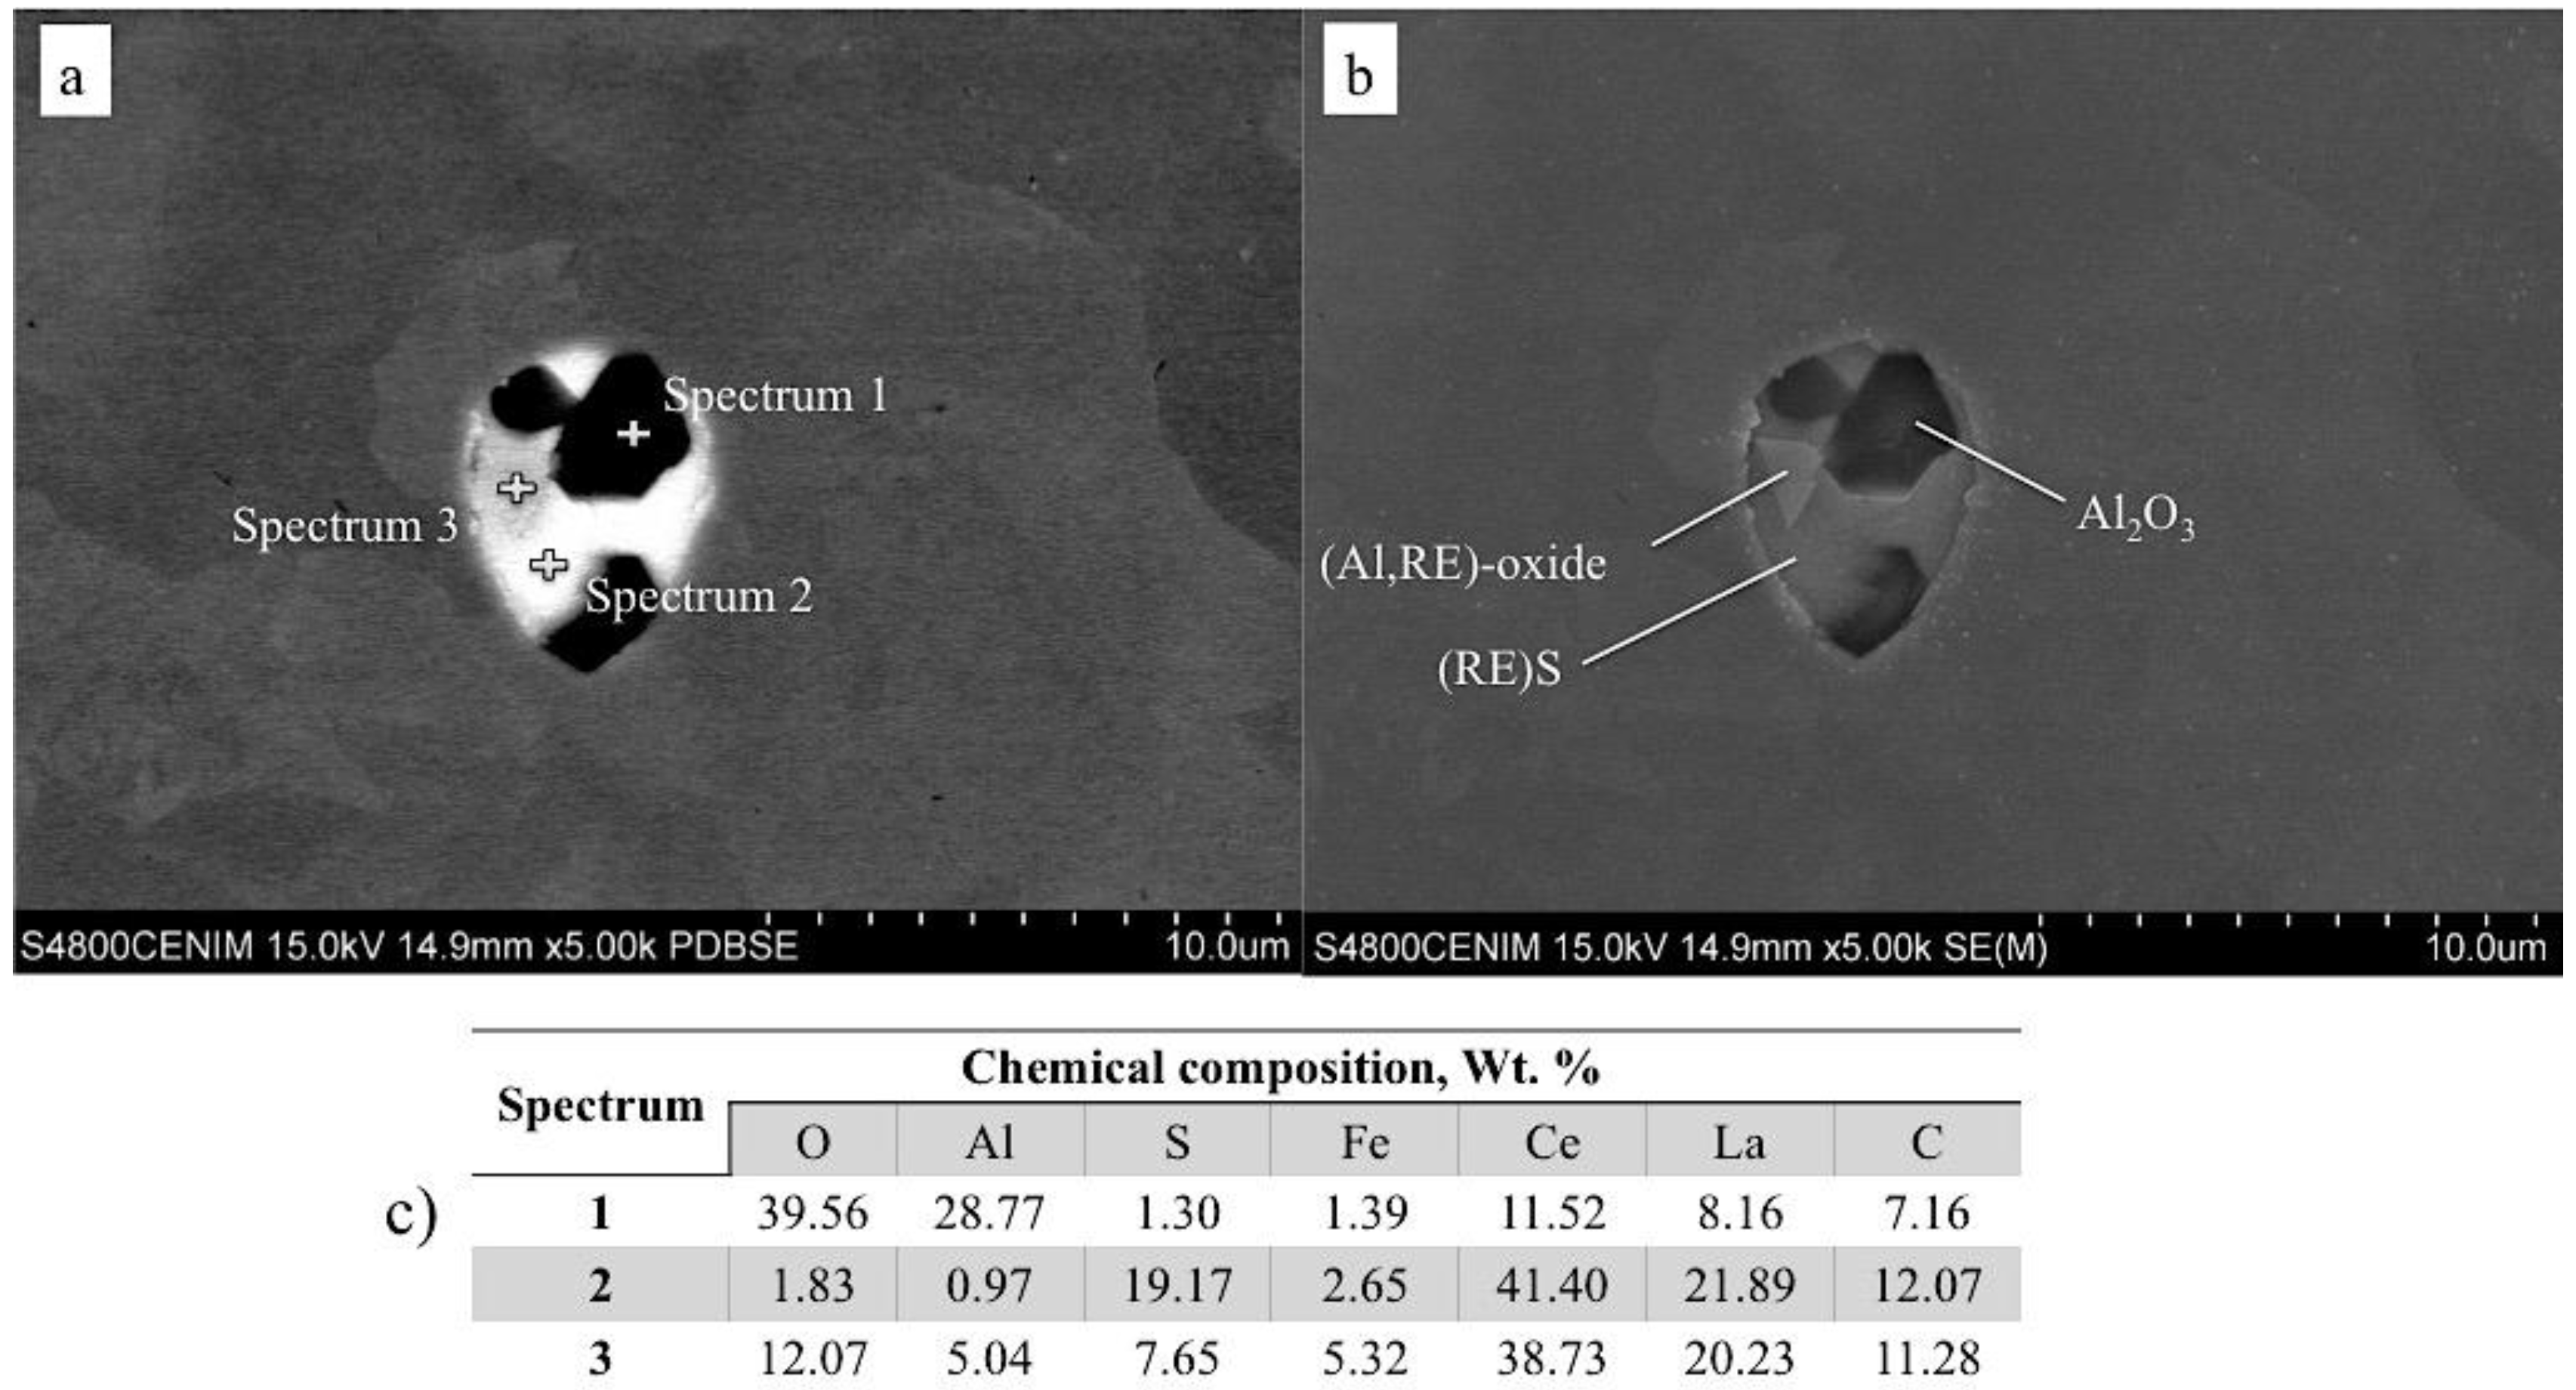
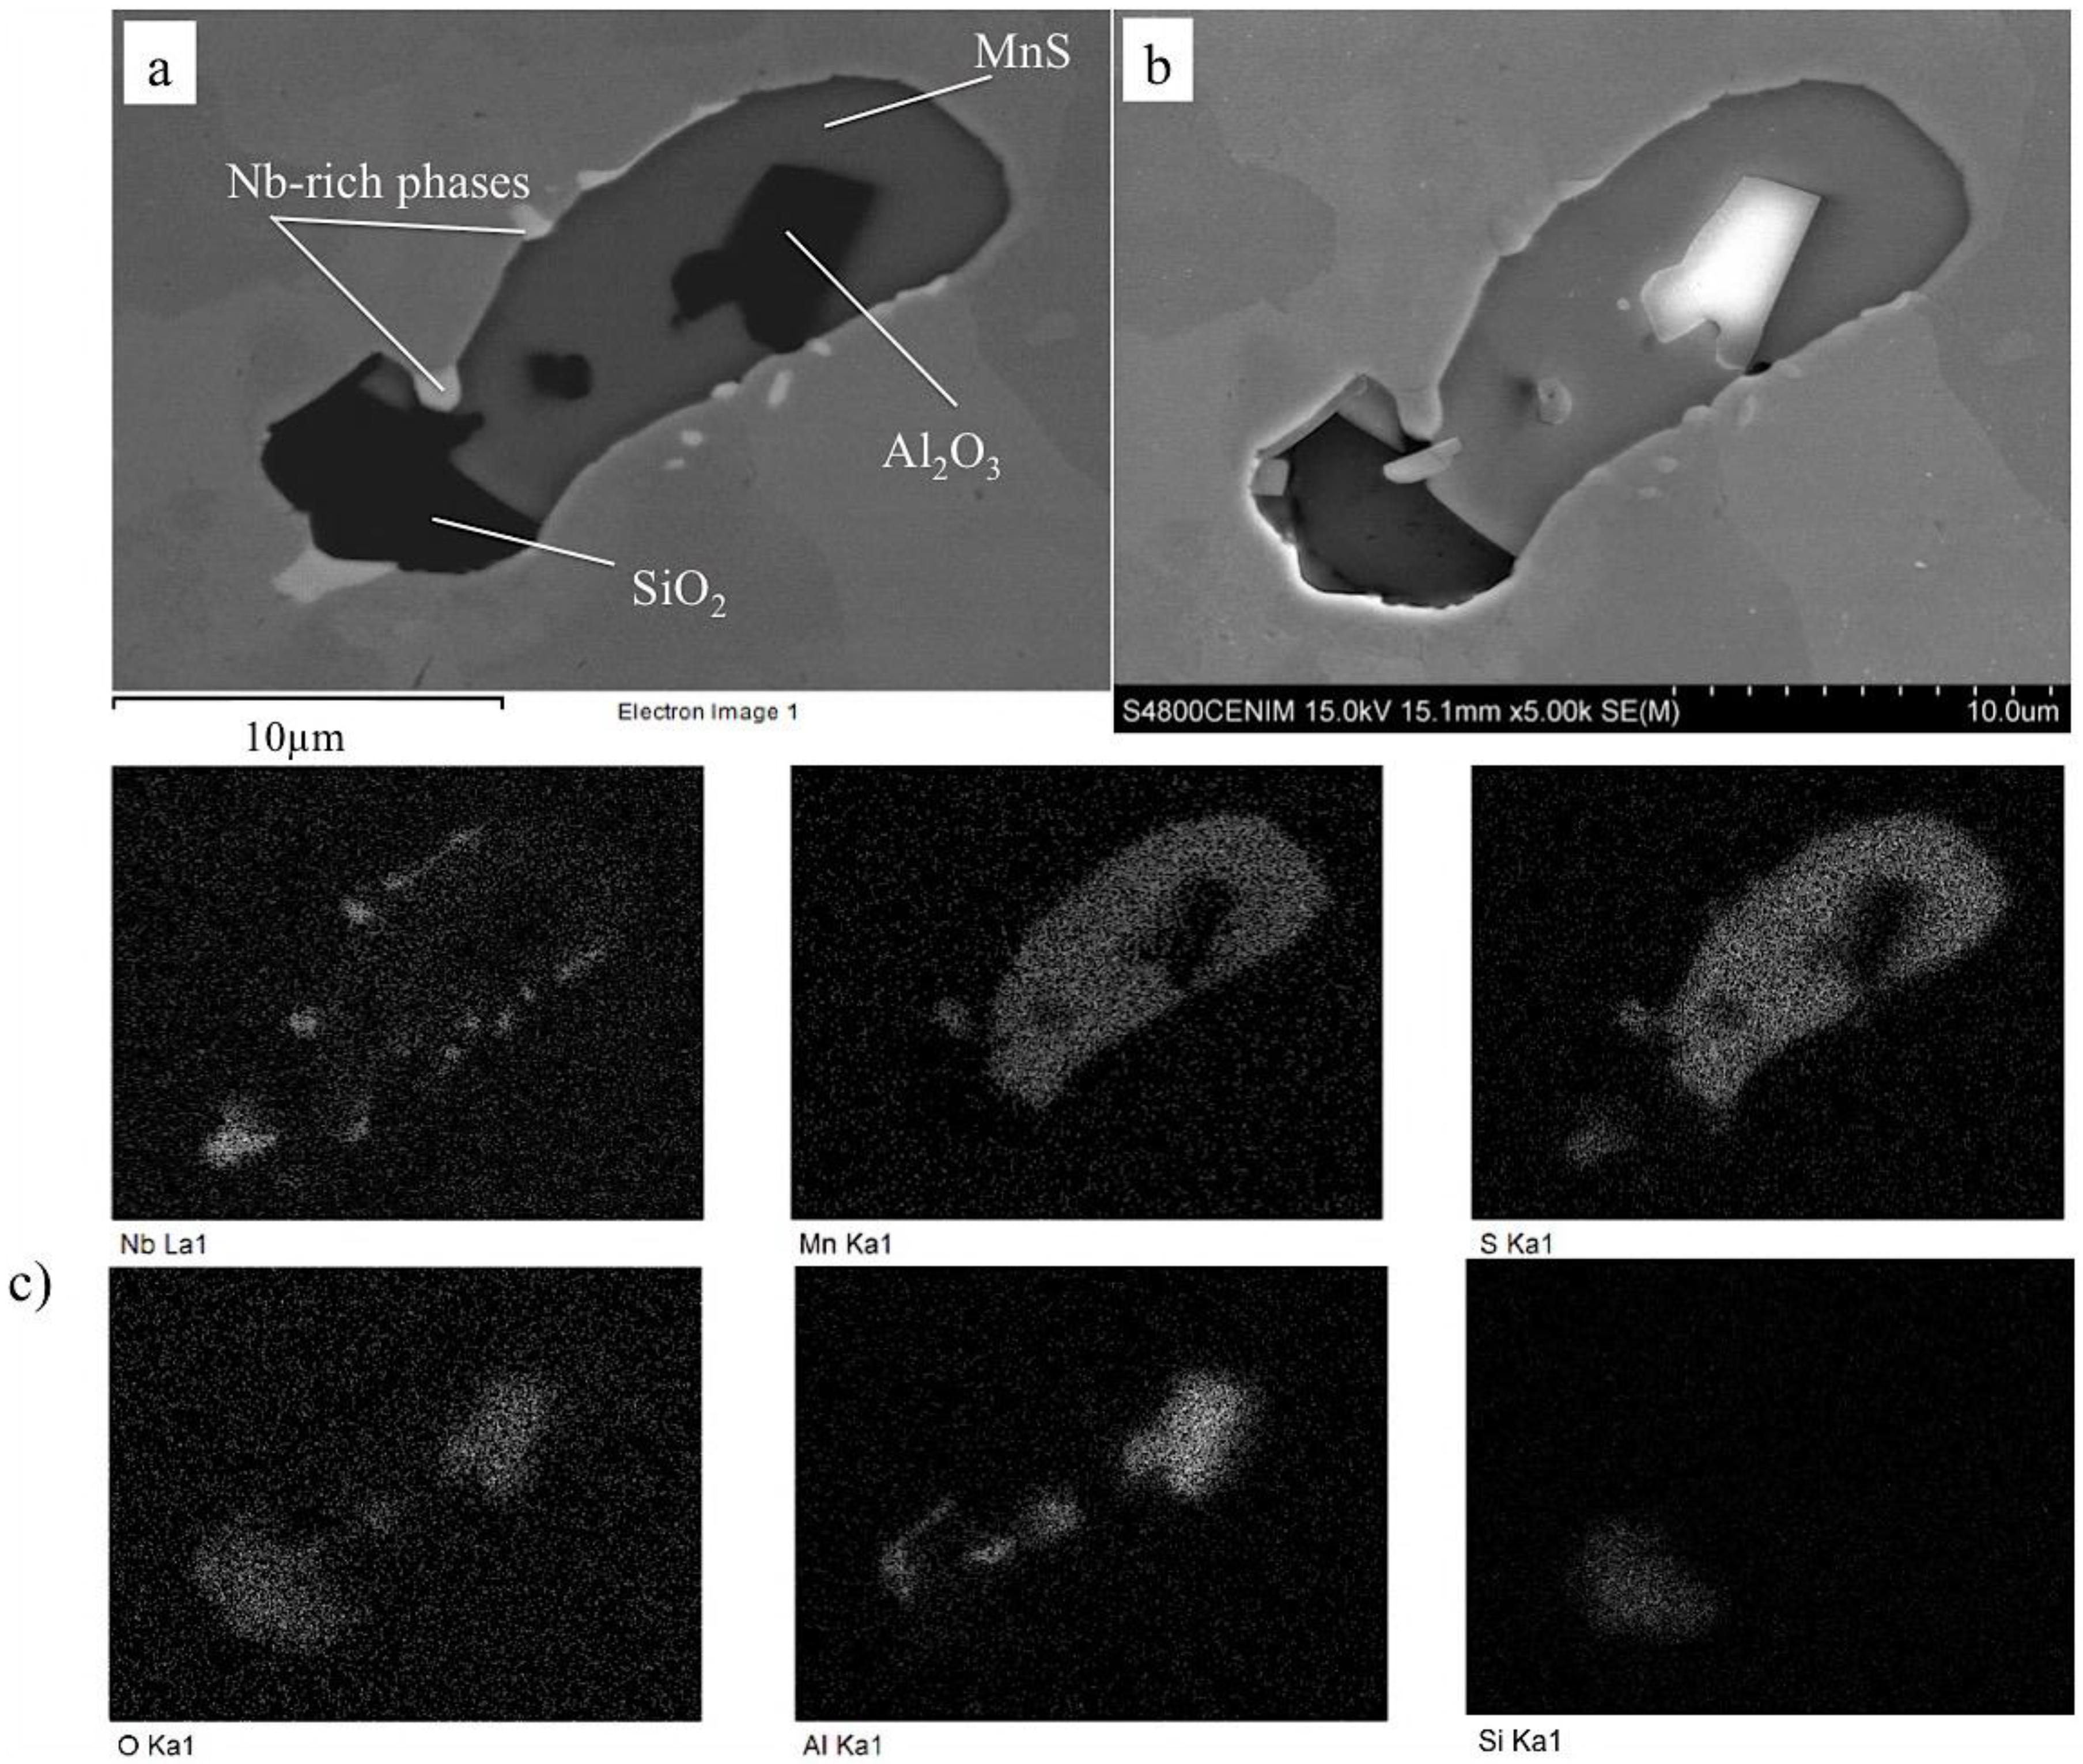
3.2.2. Sample RE2
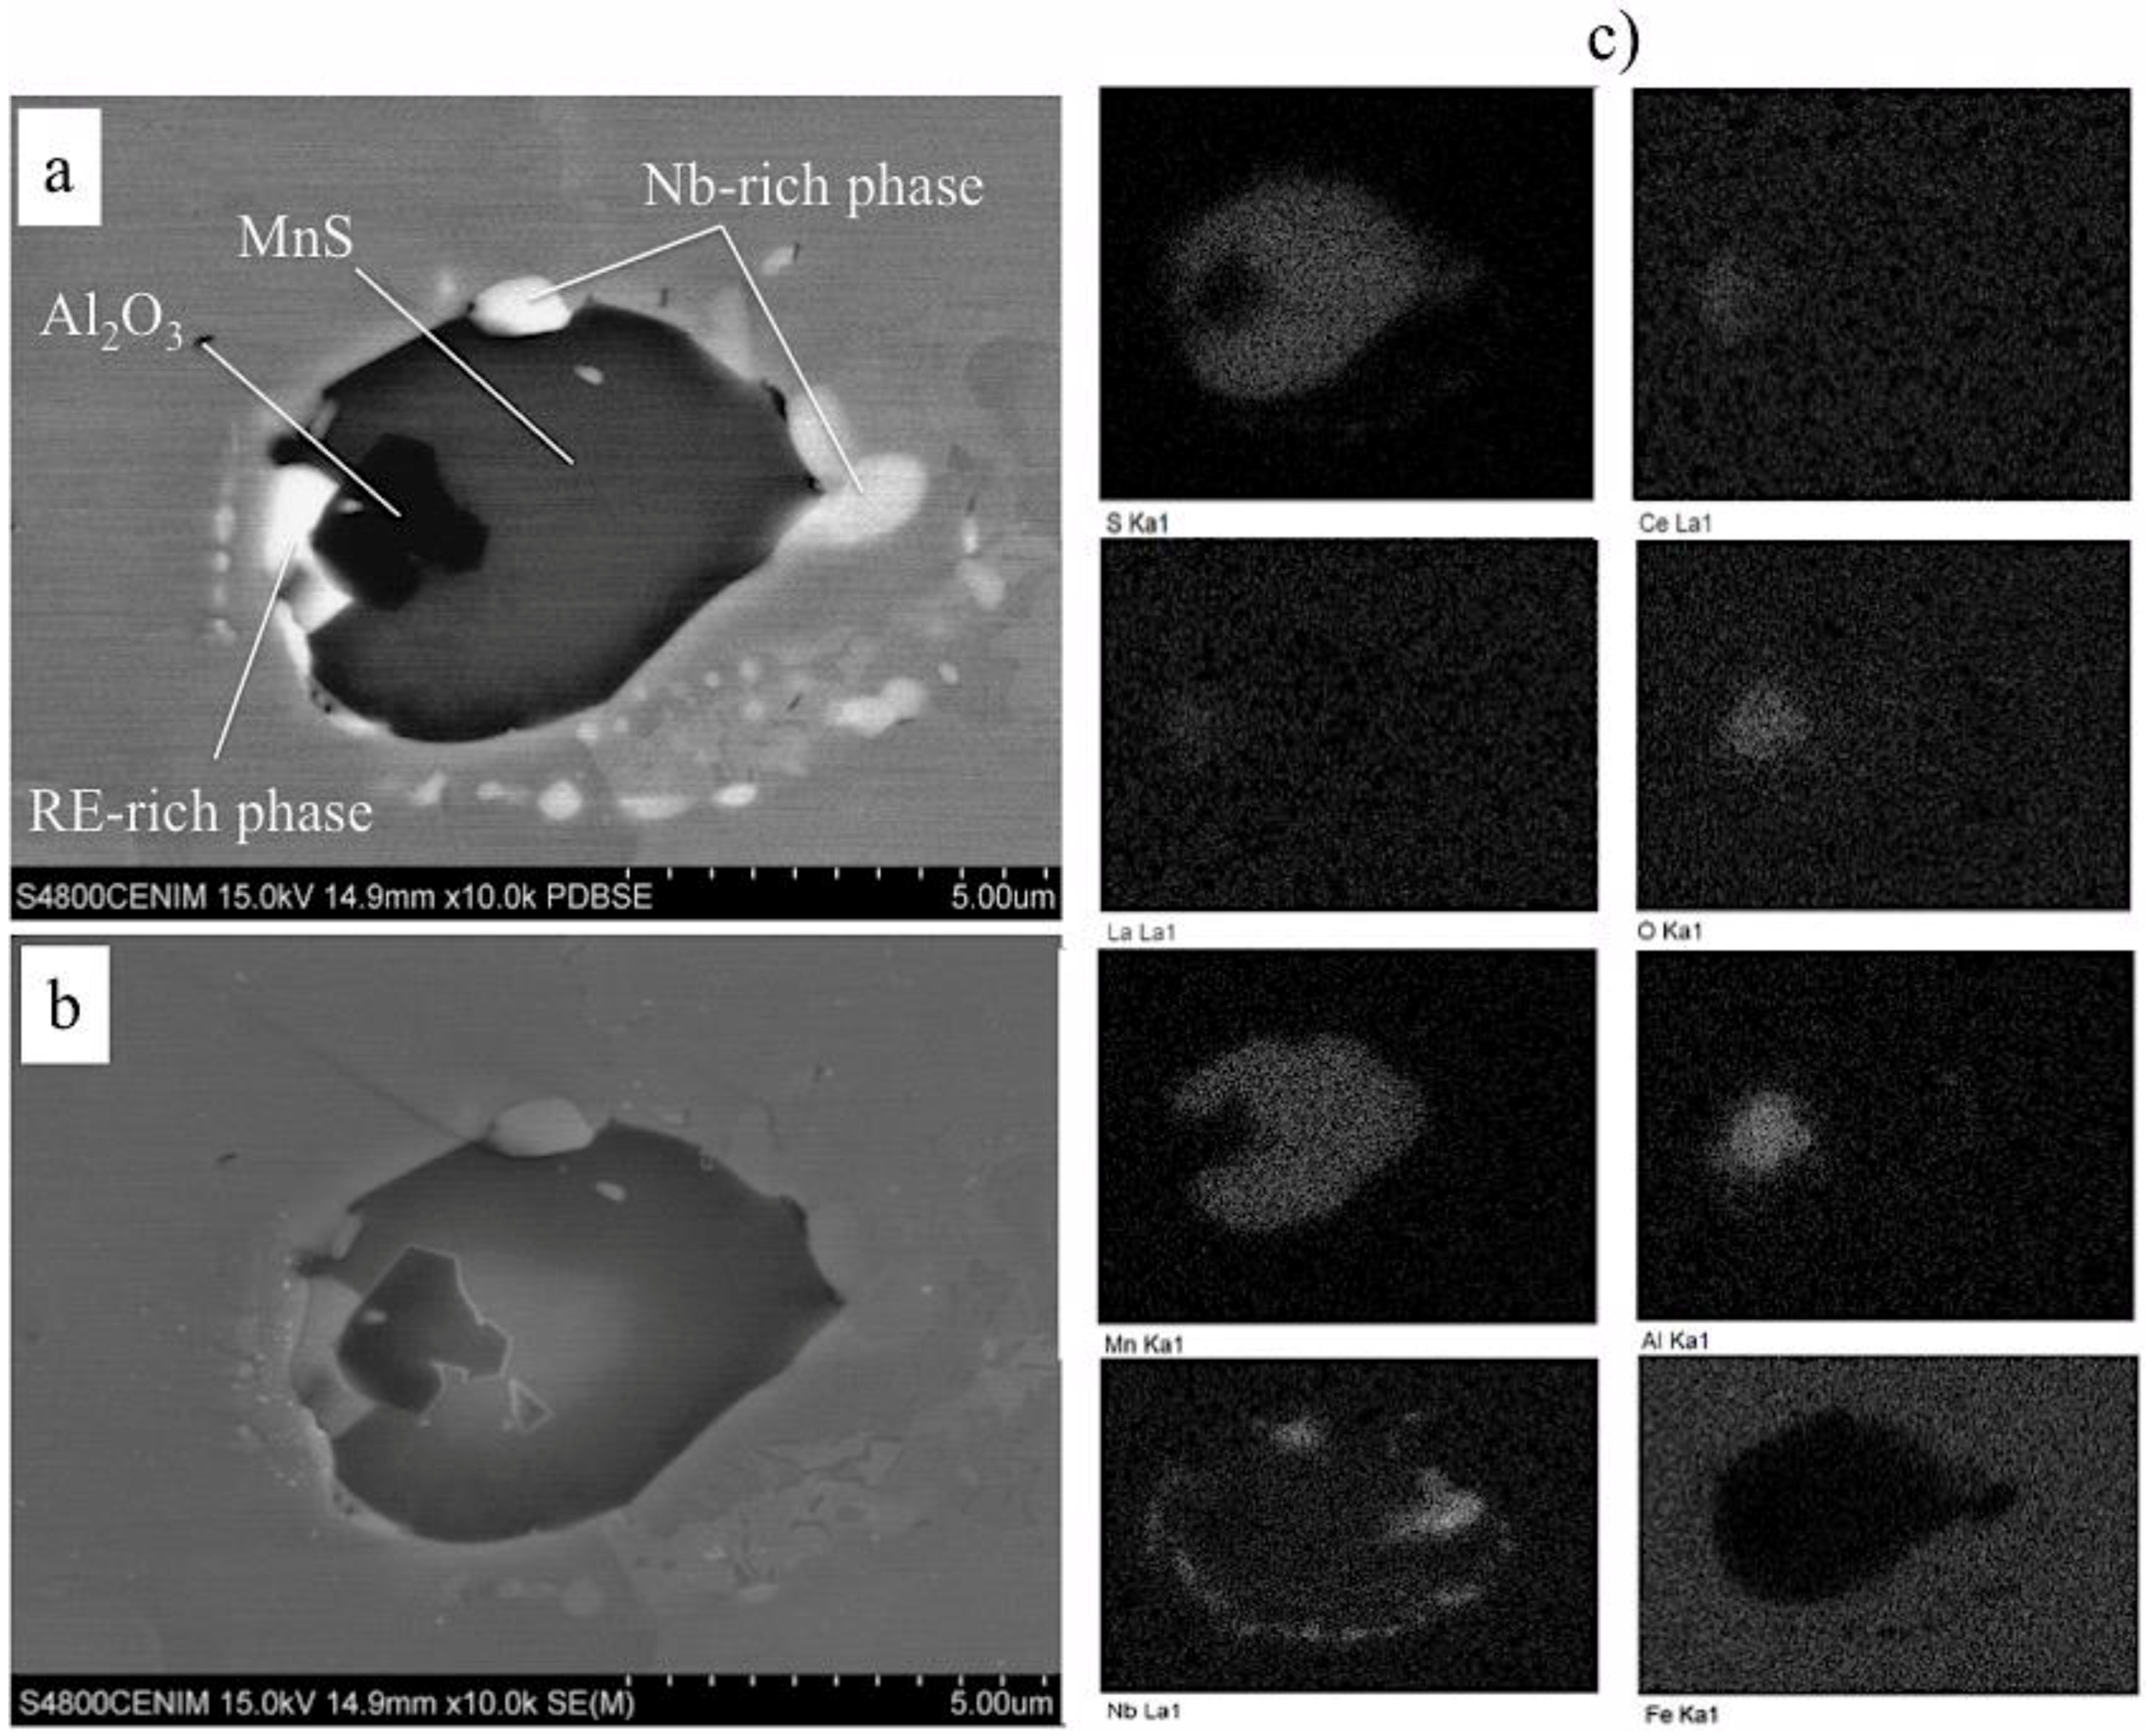
3.2.3. Samples RE3 and RE4
4. Discussion
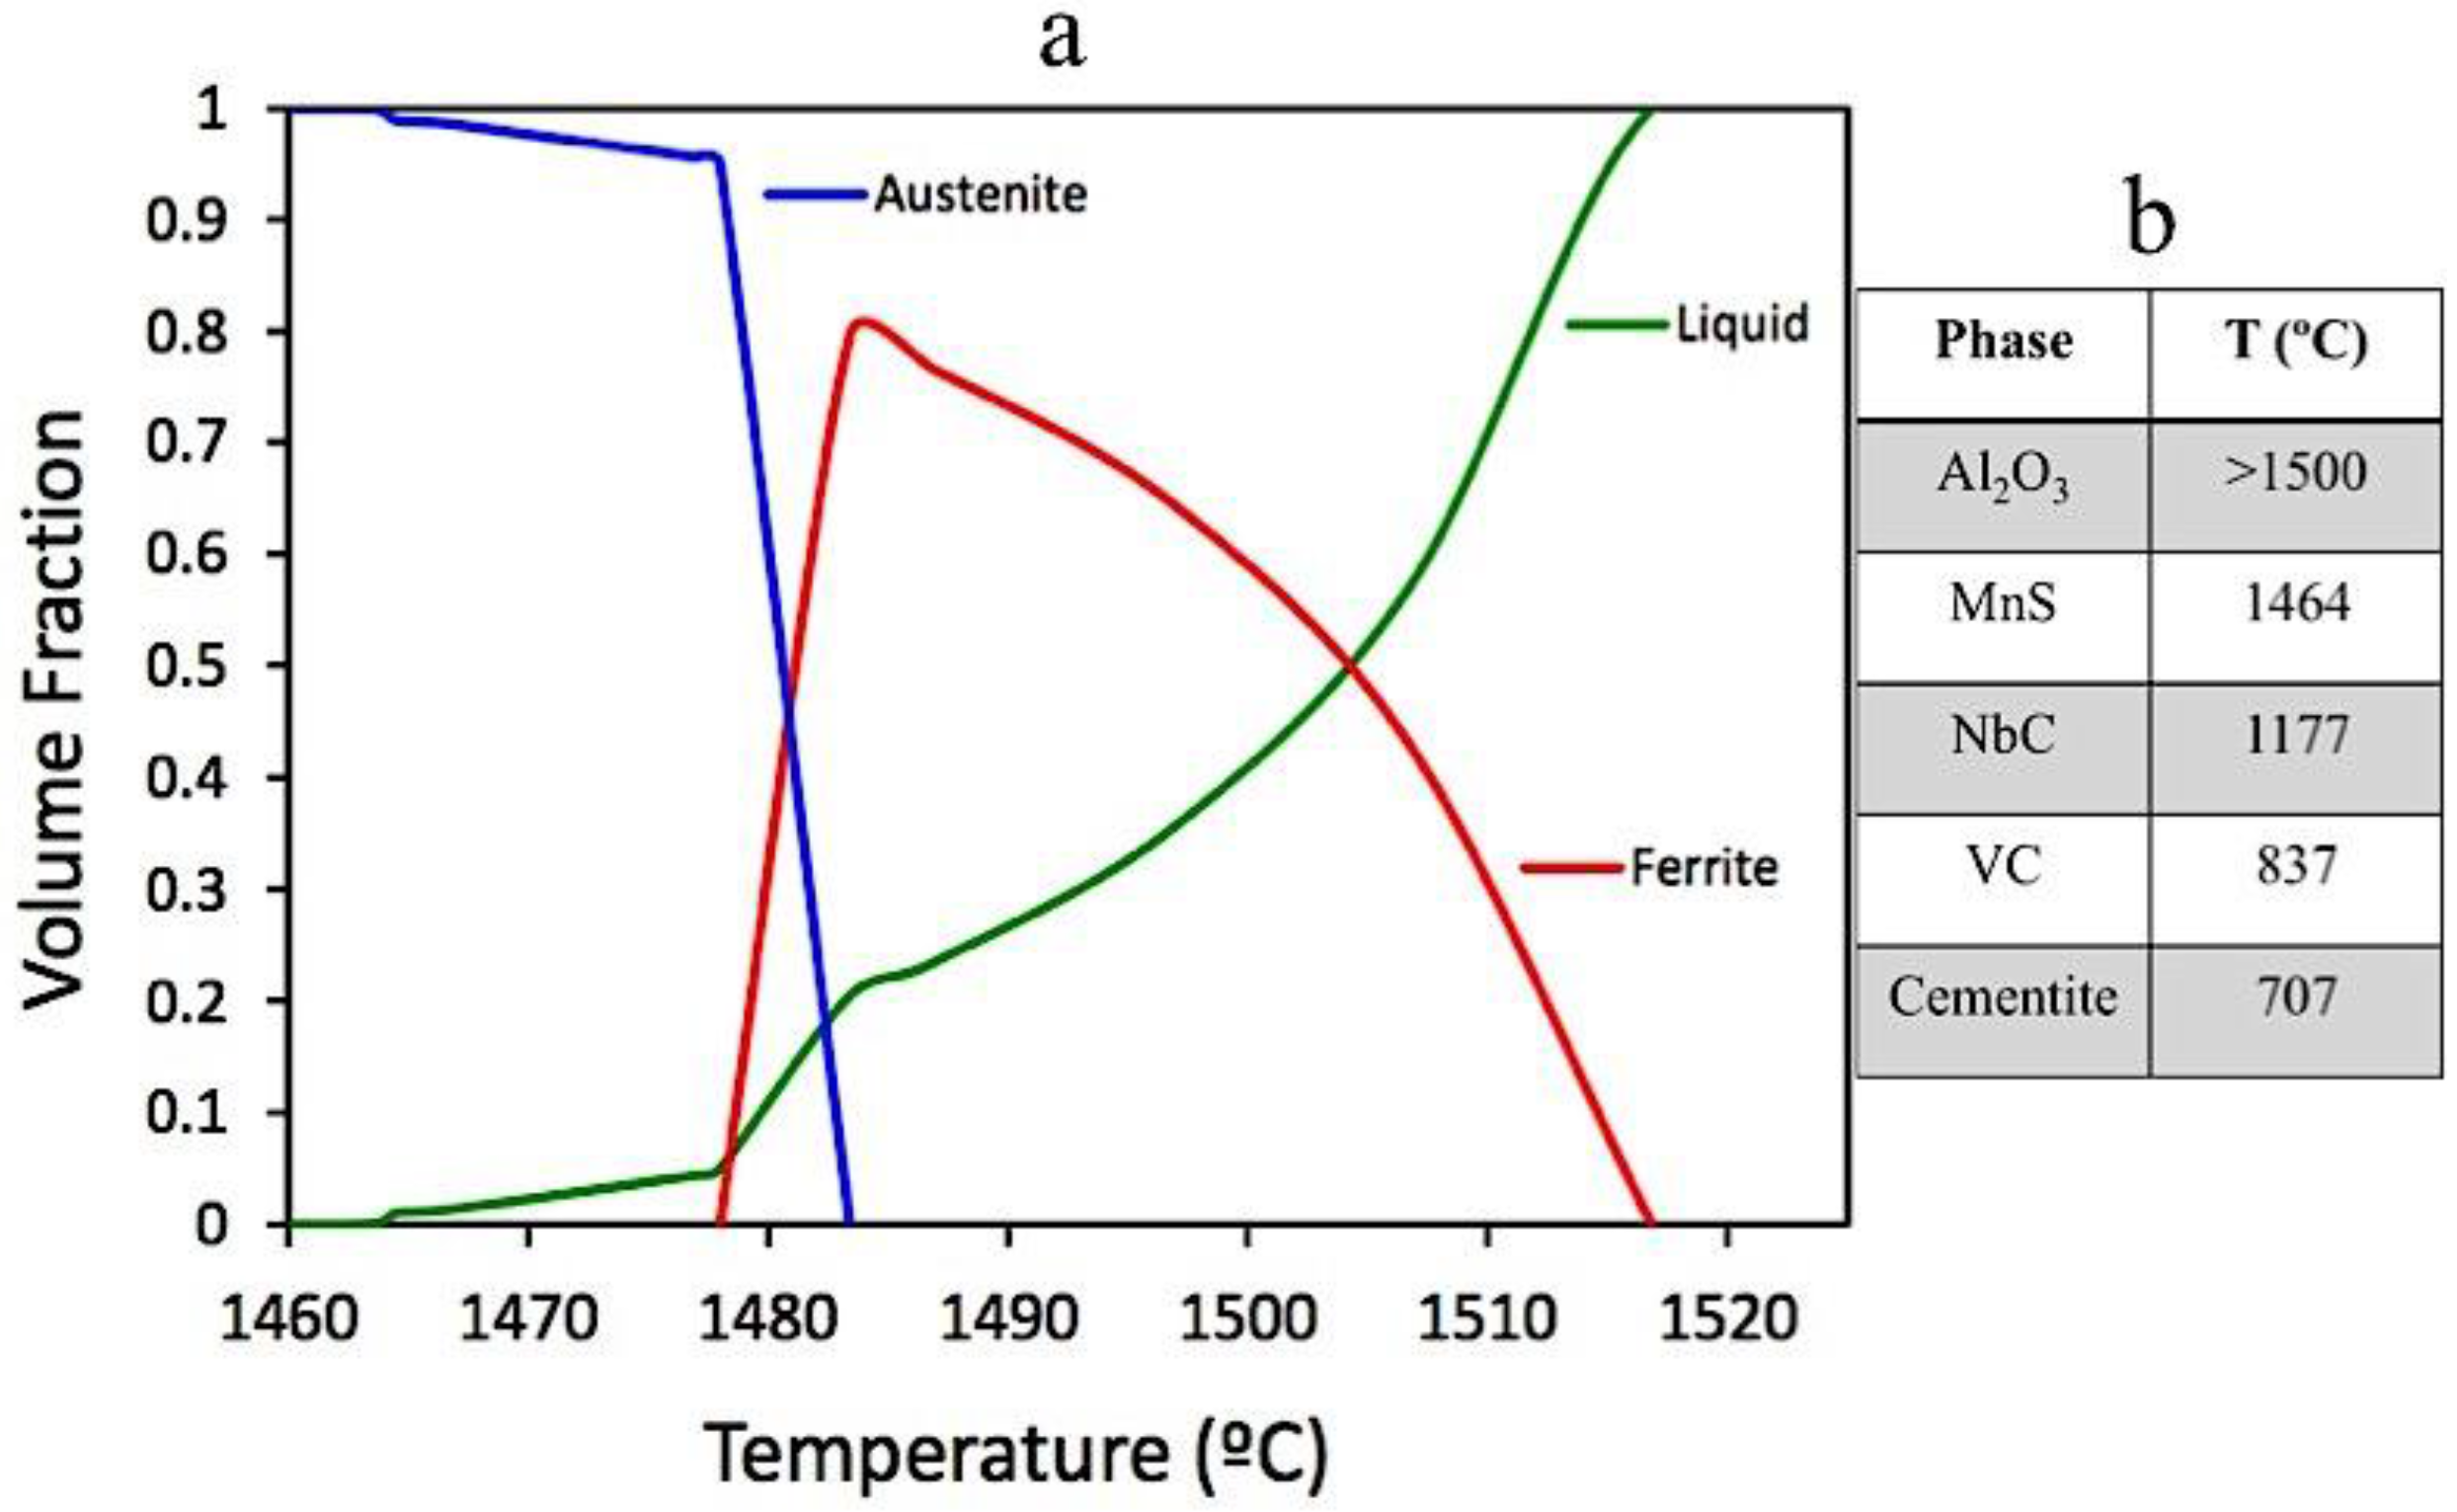
4.1. Nature of Inclusions: Volume Fraction, Size and Roundness
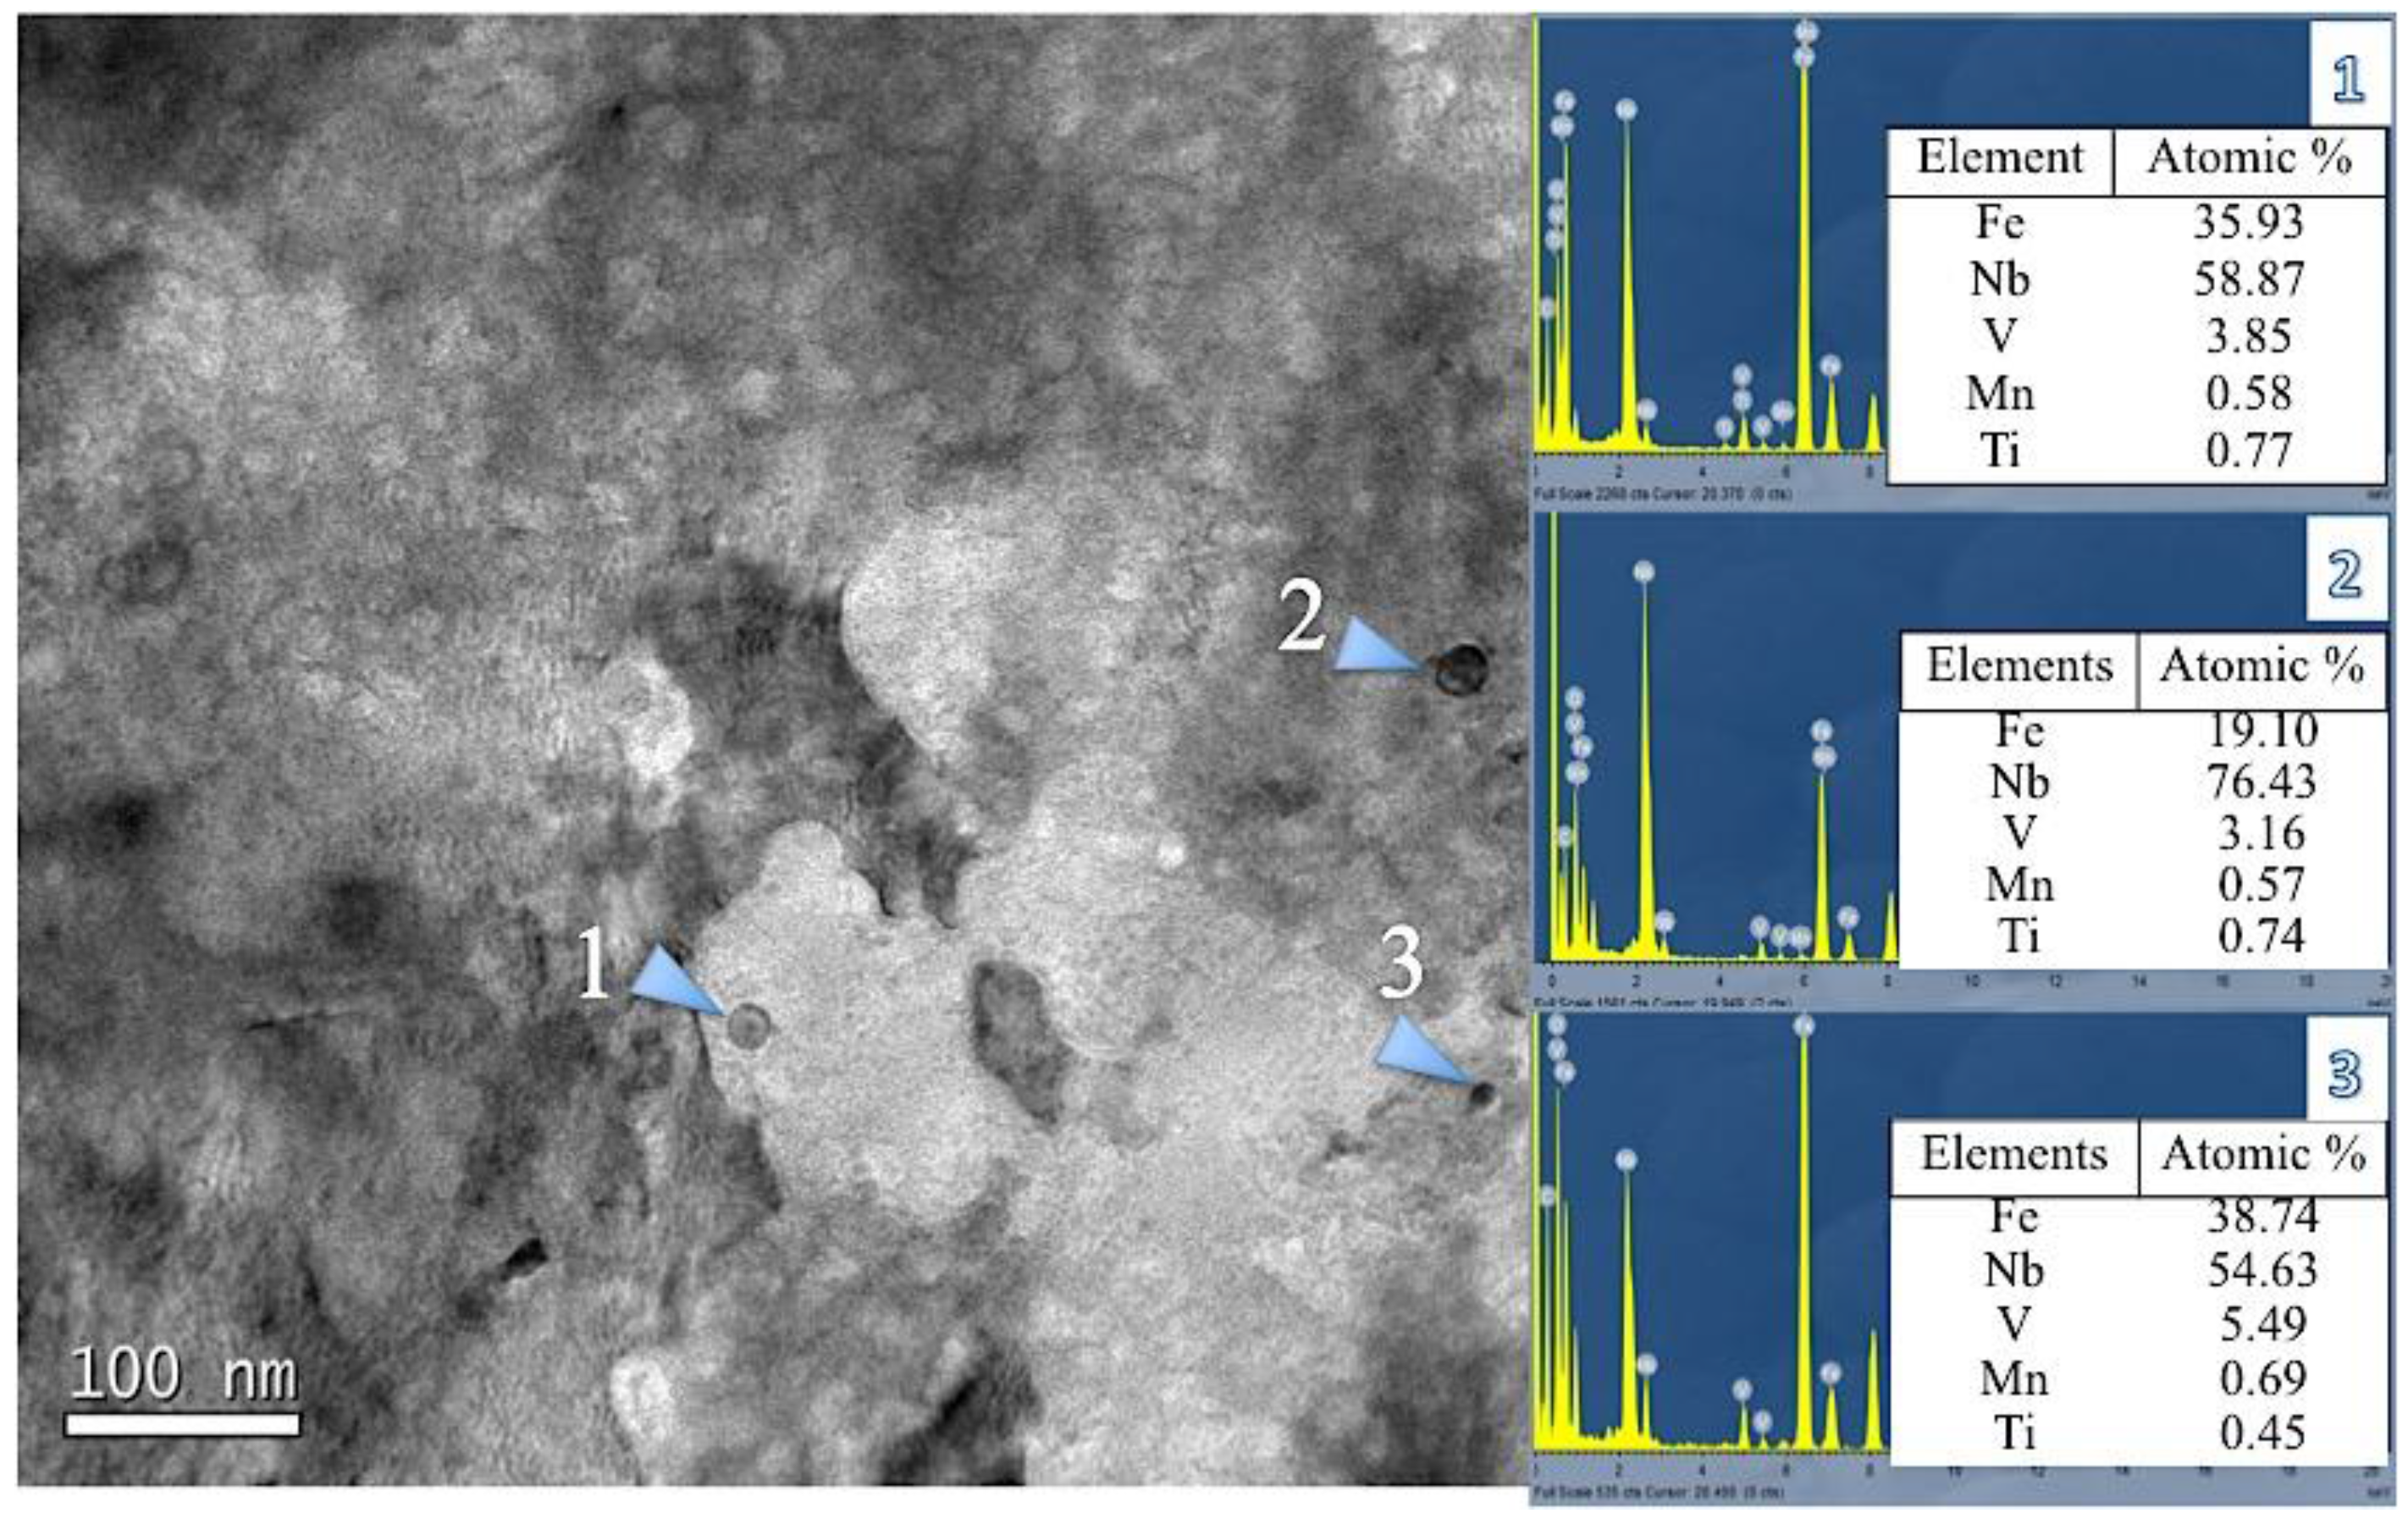
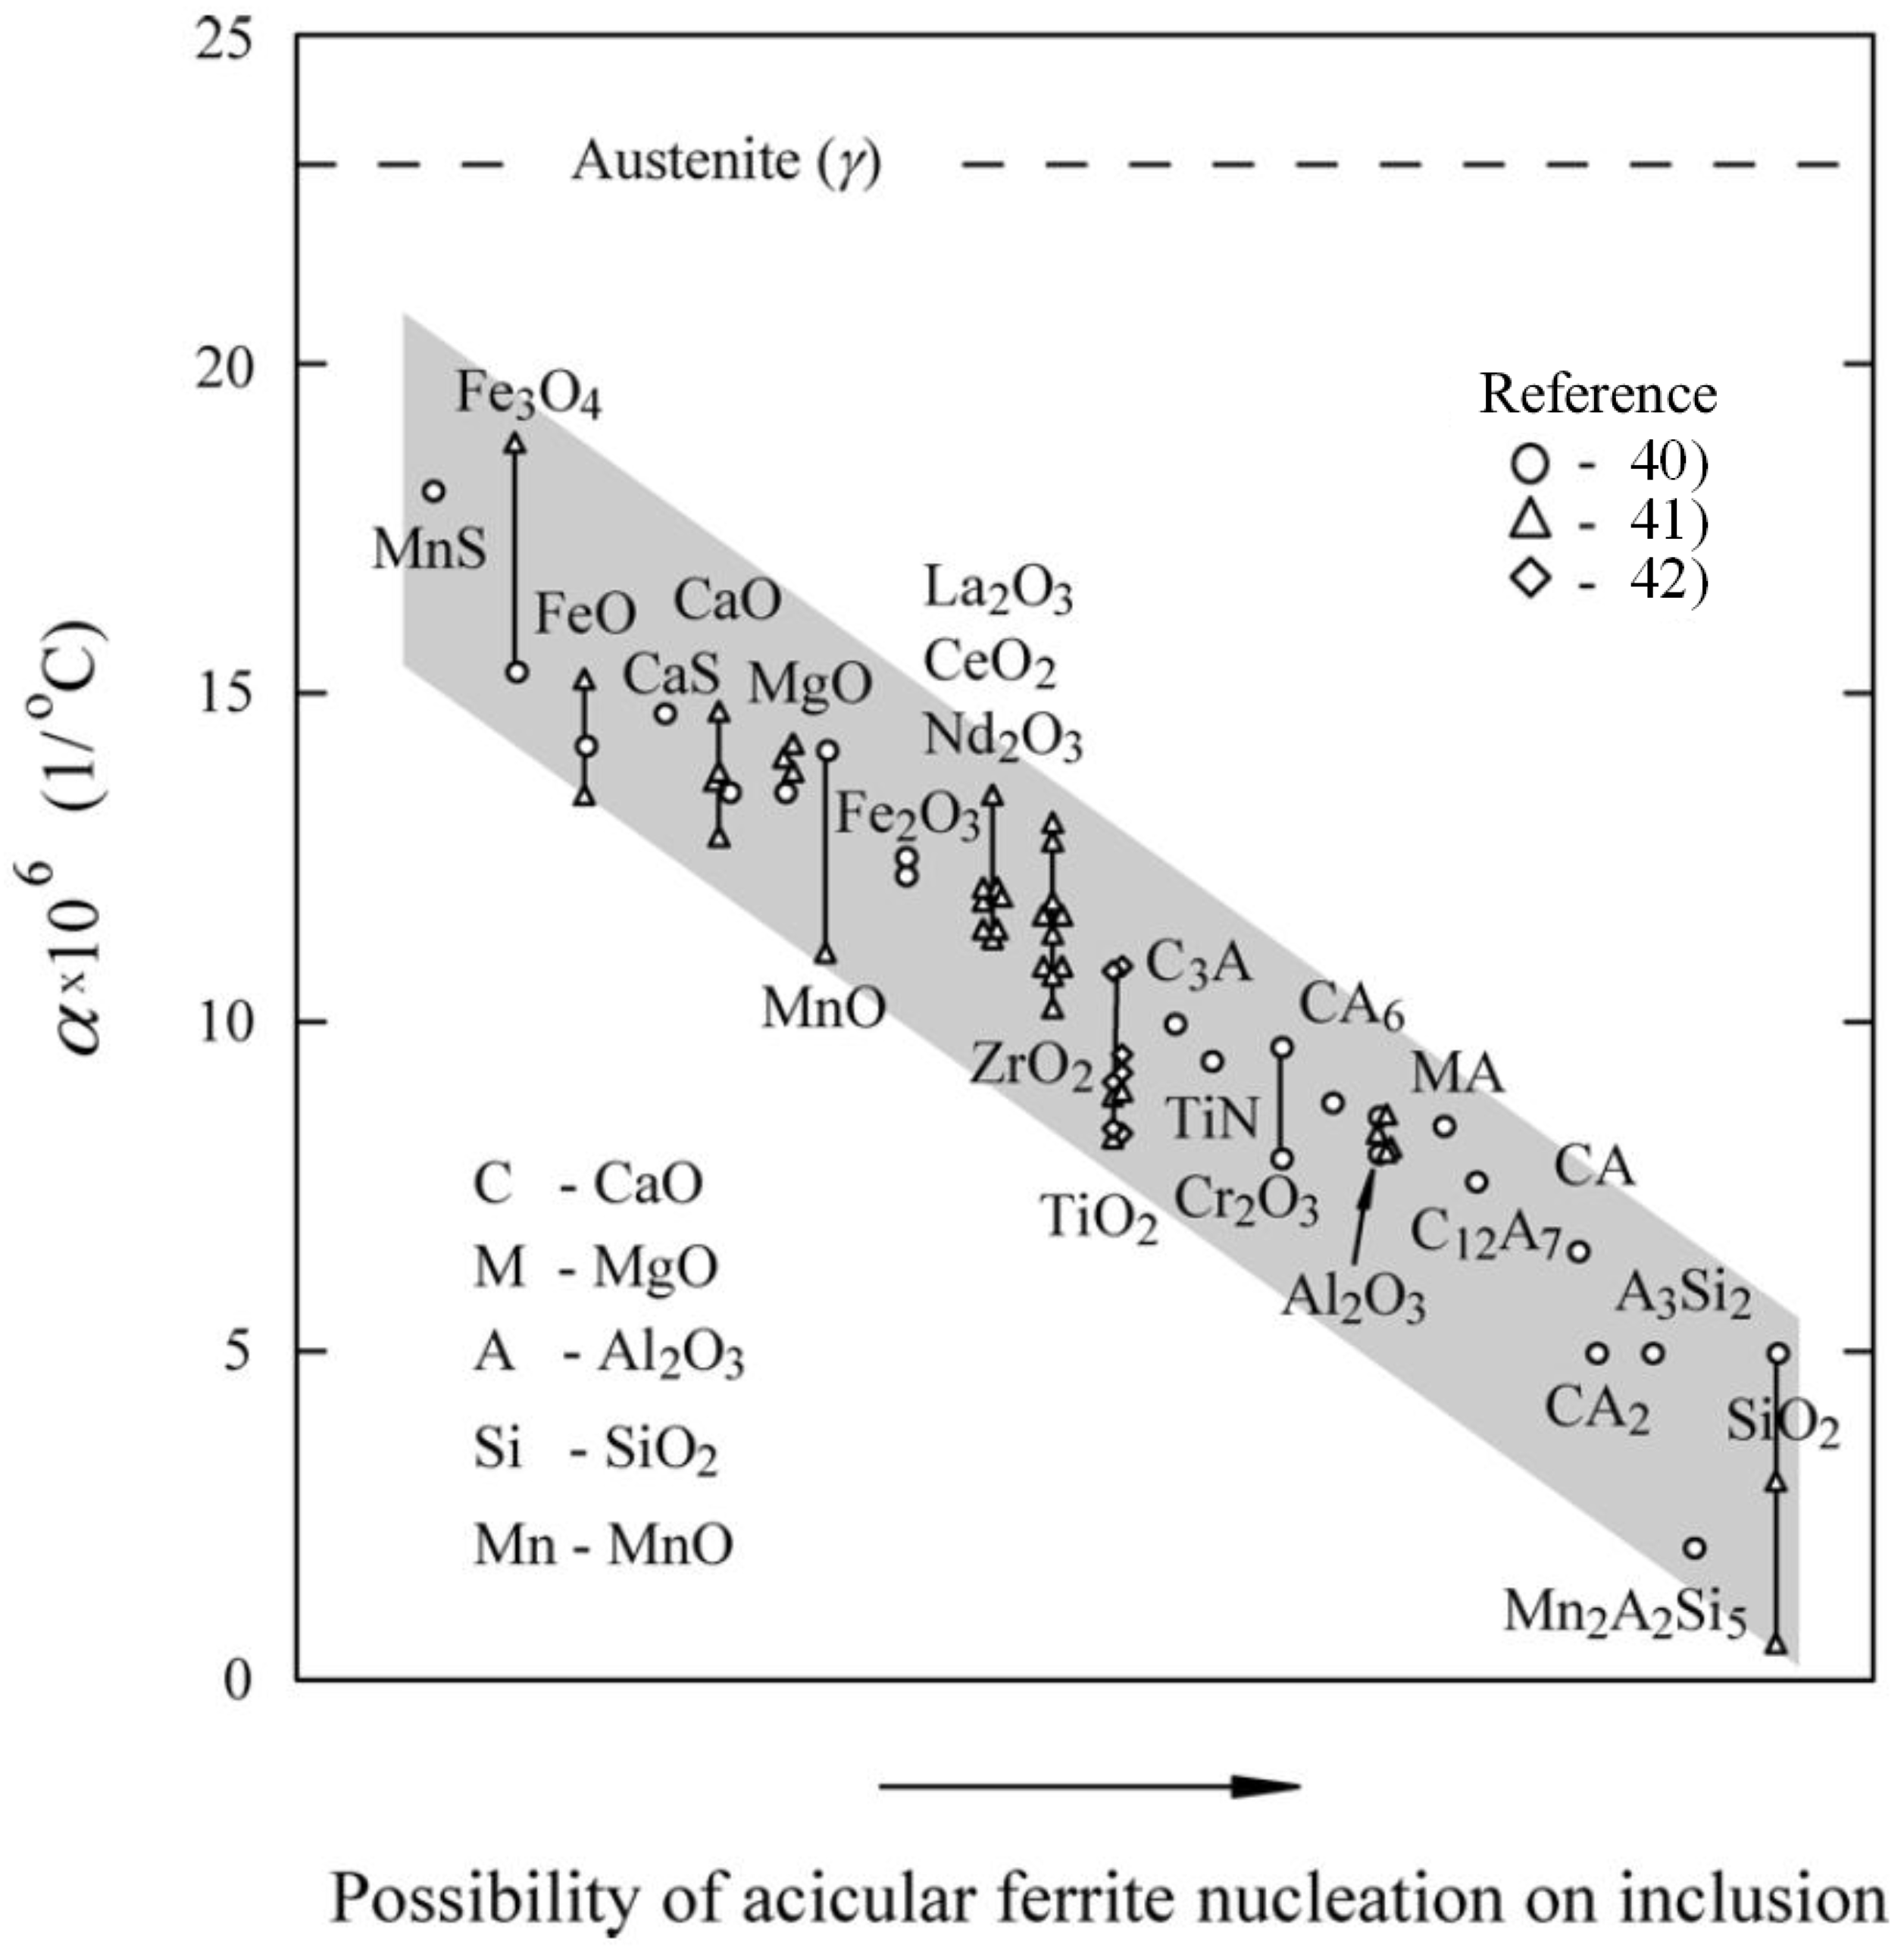
4.2. Influence of RE Addition on the Accumulation of Nb-rich Phases Around MnS and Nanoprecipitation
5. Conclusions
Acknowledgments
Author Contributions
Conflicts of Interest
References
- Thornton, P.A. The influence of nonmetallic inclusions on the mechanical properties of steel: A review. J. Mater. Sci. 1971, 6, 347–356. [Google Scholar] [CrossRef]
- Bytyqi, A.; Puksic, N.; Jenko, M.; Godec, M. Characterization of the inclusions in spring steel using light microscopy and scanning electron microscopy. Mater. Tehnol. 2011, 45, 55–59. [Google Scholar]
- Zhang, L.; Thomas, B.G. State of the art in the control of inclusions during steel ingot casting. Metall. Mater. Trans. B 2006, 37, 733–761. [Google Scholar] [CrossRef]
- Shi, G.; Zhou, S.; Ding, P. Investigation of nonmetallic inclusions in high-speed steels. Mater. Charact. 1997, 38, 19–23. [Google Scholar] [CrossRef]
- Gao, J.; Fu, P.; Liu, H.; Li, D. Effects of rare earth on the microstructure and impact toughness of H13 steel. Metals 2015, 5, 383–394. [Google Scholar] [CrossRef]
- Senberger, J.; Cech, J.; Zadera, A. Influence of compound deoxidation of steel with Al, Zr, rare earth metals, and Ti on properties of heavy castings. Arch. Foundry Eng. 2012, 12, 99–104. [Google Scholar] [CrossRef]
- Opiela, M.; Kamińska, M. Influence of the rare-earth elements on the morphology of non-metallic inclusions in microalloyed steels. JAMME 2011, 47, 149–156. [Google Scholar]
- Wang, L.M.; Lin, Q.; Yue, L.J.; Liu, L.; Guo, F.; Wang, F.M. Study of application of rare earth elements in advanced low alloy steels. J. Alloy. Compd. 2008, 451, 534–537. [Google Scholar] [CrossRef]
- Grajcar, A.; Kaminska, M.; Galisz, U.; Bulkowski, L.; Opiela, M.; Skrzypczyk, P. Modification of non-metallic inclusions in high-strength steels containing increased Mn and Al contents. JAMME 2012, 55, 245–255. [Google Scholar]
- Paul, S.K.; Chakrabarty, A.K.; Basu, S. Effect of rare earth additions on the inclusions and properties of a Ca-Al deoxidized steel. Metall. Trans. B 1982, 13, 185–192. [Google Scholar] [CrossRef]
- Opiela, M.; Grajcar, A. Modification of non-metallic inclusions by rare-earth elements in microalloyed steels. Arch. Foundry Eng. 2012, 12, 129–134. [Google Scholar] [CrossRef]
- Kimanov, B.M. Removing oxide and sulfide inclusions from molten steel by filtration. Steel Transl. 2008, 38, 641–646. [Google Scholar] [CrossRef]
- Vahed, A.; Kay, D.A.R. Thermodynamics of rare earths in steelmaking. Metall. Trans. B 1976, 7, 375–383. [Google Scholar] [CrossRef]
- Wu, Y.; Wang, L.; Du, T. Thermodynamics of rare earth elements in liquid iron. J. Less Common Met. 1985, 110, 187–193. [Google Scholar] [CrossRef]
- Garrison, M.W., Jr.; Maloney, L.J. Lanthanum additions and the toughness of ultra-high strength steels and the determination of appropriate lanthanum additions. Mater. Sci. Eng. A 2005, 403, 299–310. [Google Scholar]
- Akila, R.; Jacob, K.T.; Shukla, A.K. Gibbs energies of formation of rare earth oxysulfides. Metall. Trans. B 1987, 18, 163–168. [Google Scholar] [CrossRef]
- Ma, Q.; Wu, C.; Cheng, G.; Li, F. Characteristic and formation mechanism of inclusions in 2205 duplex stainless steel containing rare earth elements. Mater. Today Proc. 2015, 2, 300–305. [Google Scholar] [CrossRef]
- Handerhan, K.J.; Garrison, W.M. Effects of rare earth additions on the mechanical properties of the secondary hardening steel AF1410. Scr. Metall. 1988, 22, 409–412. [Google Scholar] [CrossRef]
- Belyakova, A.F.; Kryankovskii, Y.V.; Paisov, I.V. Effect of rare earth metals on the structure and properties of structural steel. Met. Sci. Heat Treat. 1965, 7, 588–593. [Google Scholar] [CrossRef]
- Liu, H.-L.; Liu, C.-J.; Jiang, M.-F. Effect of rare earths on impact toughness of a low-carbon steel. Mater. Des. 2012, 33, 306–312. [Google Scholar] [CrossRef]
- Liu, H.L.; Liu, C.J.; Jiang, M.F. Effects of rare earths on the austenite recrystallization behavior in X80 pipeline steel. Adv. Mat. Res. 2010, 129–131, 542–546. [Google Scholar] [CrossRef]
- Muro, P.; Gimenez, S.; Iturriza, I. Sintering behaviour and fracture toughness characterization of D2 matrix tool steel, comparison with wrought and PM D2. Scr. Mater. 2002, 46, 369–373. [Google Scholar] [CrossRef]
- Porter, D.A.; Easterling, K.E.; Sherif, M. Phase Transformations in Metals and Alloys, 3rd ed.; Revised Reprint; CRC Press: London, UK, 2009. [Google Scholar]
- Torkamani, H.; Raygan, S.; Rassizadehghani, J. Comparing microstructure and mechanical properties of AISI D2 steel after bright hardening and oil quenching. Mater. Des. 2014, 54, 1049–1055. [Google Scholar] [CrossRef]
- Kasińska, J. Influence of rare earth metals on microstructure and inclusions morphology G17CrMo5–5 cast steel. Arch. Metall. Mater. 2014, 59, 993–996. [Google Scholar] [CrossRef]
- Muan, A.; Osborn, E.F. Phase Equilibria among Oxides in Steelmaking; Addison-Wesley: Boston, MA, USA, 1965. [Google Scholar]
- Davis, J.R. Alloying: Understanding the Basics; ASM International: Novelty, OH, USA, 2001; p. 647. [Google Scholar]
- Najafi, H.; Rassizadehghani, J.; Asgari, S. As-cast mechanical properties of vanadium/niobium microalloyed steels. Mater. Sci. Eng. A 2008, 486, 1–7. [Google Scholar] [CrossRef]
- Najafi, H.; Rassizadehghani, J.; Norouzi, S. Mechanical properties of as-cast microalloyed steels produced via investment casting. Mater. Des. 2011, 32, 656–663. [Google Scholar] [CrossRef]
- Rassizadehghani, J.; Najafi, H.; Emamy, M.; Eslami-Saeen, G. Mechanical properties of V-, Nb-, and Ti-bearing as-cast microalloyed steels. J. Mater. Sci. Technol. 2007, 23, 779–784. [Google Scholar]
- Sosnin, V.V.; Longinov, A.M.; Barantseva, I.V.; Povkova, N.A.; Lyasotskii, I.V. Distribution of niobium and titanium carbonitrides in continuous-cast microalloy steels. Steel Transl. 2010, 40, 590–594. [Google Scholar] [CrossRef]
- Chen, C.Y.; Yen, H.W.; Kao, F.H.; Li, W.C.; Huang, C.Y.; Yang, J.R.; Wang, S.H. Precipitation hardening of high-strength low-alloy steels by nanometer-sized carbides. Mater. Sci. Eng. A 2009, 499, 162–166. [Google Scholar] [CrossRef]
- San Martin, D.; Caballero, F.G.; Capdevila, C.; Garcia de Andres, C. Austenite grain coarsening under the influence of niobium carbonitrides. Mater. Trans. 2004, 45, 2797–2804. [Google Scholar]
- Vivas, J.; Celada-Casero, C.; San Martín, D.; Serrano, M.; Urones-Garrote, E.; Adeva, P.; Aranda, M.M.; Capdevila, C. Nano-precipitation strengthened G91 by thermo-mechanical treatment optimization. Metall. Mater. Trans. A 2016, 47, 5344–5351. [Google Scholar] [CrossRef]
- Mousavi Anijdan, S.H.; Rezaeian, A.; Yue, S. The effect of chemical composition and austenite conditioning on the transformation behavior of microalloyed steels. Mater. Charact. 2012, 63, 27–38. [Google Scholar] [CrossRef]
- Vivas, J.; Capdevila, C.; Jimenez, J.; Benito-Alfonso, M.; San-Martin, D. Effect of ausforming temperature on the microstructure of G91 steel. Metals 2017, 7, 236. [Google Scholar] [CrossRef]
- Sohaciu, M.; Predescu, C.; Vasile, E.; Matei, E.; Savastru, D.; Berbecaru, A. Influence of MnS inclusions in steel parts on fatigue resistence. Dig. J. Nanomater. Biostruct. 2013, 8, 367–376. [Google Scholar]
- Drar, H. Metallographic and fractographic examination of fatigue loaded PM-steel with and without MnS additive. Mater. Charact. 2000, 45, 211–220. [Google Scholar] [CrossRef]
- Enomoto, M. Nucleation of phase transformations at intragranular inclusions in steel. Met. Mater. 1998, 4, 115–123. [Google Scholar] [CrossRef]
- Samsonov, G.V. Physico-Chemical Properties of Oxides. Handbook; Metallurgiya: Moscow, Russia, 1978; p. 130. (In Russian) [Google Scholar]
- Brooksbank, D.; Andrews, K.W. Stress fields around inclusions and their relation to mechanical properties. J. Iron Steel Inst. 1972, 210, 246–255. [Google Scholar]
- Touloukian, Y.S. The Thermo-Physical Properties of High Temperatures of Solids Materials; Macmillan Co.: New York, NY, USA, 1967; p. 462. [Google Scholar]
- Sarma, D.S.; Karasev, A.V.; Jonsson, P.G. On the role of non-metallic inclusions in the nucleation of acicular ferrite in steels. ISIJ Int. 2009, 49, 1063–1074. [Google Scholar] [CrossRef]
- Cverna, F. Asm Ready Reference: Thermal Properties of Metals; ASM International: Materials Park, OH, USA, 2002. [Google Scholar]
- Pan, F.; Zhang, J.; Chen, H.L.; Su, Y.H.; Kou, C.L.; Su, Y.H.; Chen, S.H.; Lin, K.J.; Hsieh, P.H.; Hwang, W.S. Effects of rare earth metals on steel microstructures. Materials 2016, 9, 417. [Google Scholar] [CrossRef] [PubMed]


| Compound | A, J mol−1 | B, J (mol K)−1 | ΔG°1873 K kJ mol−1 |
|---|---|---|---|
| Ce2O3 | −1.30 × 10⁶ | 374 | −600 |
| La2O3 | −1.44 × 10⁶ | 337 | −810 |
| Ce2S3 | −1.02 × 10⁶ | 340 | −383 |
| La2S3 | −1.27 × 10⁶ | 417 | −490 |
| Compound | Melting Point °C | Density kg/m3 |
|---|---|---|
| Ce2O3 | ~2177 | 6200 |
| La2O3 | ~2249 | 6500 |
| Ce2S3 | ~2150 | 5020 |
| La2S3 | ~2099 | 5000 |
| Elements | C | Si | Mn | S | P | V | Nb | Mo | Cu | Al | Cr |
|---|---|---|---|---|---|---|---|---|---|---|---|
| wt. % | 0.16 | 0.30 | 1.00 | 0.01 | 0.02 | 0.11 | 0.05 | 0.01 | 0.09 | 0.04 | 0.06 |
| Steels | Elements, ppm | ||||
|---|---|---|---|---|---|
| Ce | La | Ce + La | O | N | |
| RE1 | <10 | <10 | --- | 96 ± 10 | 113 ± 4 |
| RE2 | 37.5 | 17.5 | 55.0 | 116 ± 35 | 114 ± 3 |
| RE3 | 127.0 | 72.5 | 199.5 | 93 ± 6 | 112 ± 3 |
| RE4 | 192.0 | 100.0 | 292.0 | 110 ± 14 | 114 ± 1 |
| Steels | Area Fraction, % | Average Area, (µm2) | Average Size, (µm) | Average Roundness Factor |
|---|---|---|---|---|
| RE1 | 0.123 ± 0.004 | 1.35 ± 0.06 | 1.31 | 0.71 ± 0.02 |
| RE2 | 0.138 ± 0.005 | 1.54 ± 0.07 | 1.40 | 0.74 ± 0.03 |
| RE3 | 0.105 ± 0.004 | 1.21 ± 0.04 | 1.24 | 0.83 ± 0.02 |
| RE4 | 0.134 ± 0.005 | 1.38 ± 0.05 | 1.32 | 0.82 ± 0.03 |
© 2017 by the authors. Licensee MDPI, Basel, Switzerland. This article is an open access article distributed under the terms and conditions of the Creative Commons Attribution (CC BY) license (http://creativecommons.org/licenses/by/4.0/).
Share and Cite
Torkamani, H.; Raygan, S.; Mateo, C.G.; Rassizadehghani, J.; Vivas, J.; Palizdar, Y.; San-Martin, D. The Influence of La and Ce Addition on Inclusion Modification in Cast Niobium Microalloyed Steels. Metals 2017, 7, 377. https://doi.org/10.3390/met7090377
Torkamani H, Raygan S, Mateo CG, Rassizadehghani J, Vivas J, Palizdar Y, San-Martin D. The Influence of La and Ce Addition on Inclusion Modification in Cast Niobium Microalloyed Steels. Metals. 2017; 7(9):377. https://doi.org/10.3390/met7090377
Chicago/Turabian StyleTorkamani, Hadi, Shahram Raygan, Carlos Garcia Mateo, Jafar Rassizadehghani, Javier Vivas, Yahya Palizdar, and David San-Martin. 2017. "The Influence of La and Ce Addition on Inclusion Modification in Cast Niobium Microalloyed Steels" Metals 7, no. 9: 377. https://doi.org/10.3390/met7090377