Study of the Microstructure Evolution and Properties Response of a Friction-Stir-Welded Copper-Chromium-Zirconium Alloy

1
State Key Laboratory of High Performance Complex Manufacturing, Central South University, Changsha 410083, China
2
Light Alloy Research Institute, Central South University, Changsha 410083, China
3
State Key Laboratory of Powder Metallurgy, Central South University, Changsha 410083, China
*
Author to whom correspondence should be addressed.
Metals 2017, 7(9), 381; https://doi.org/10.3390/met7090381
Submission received: 17 August 2017
/
Revised: 9 September 2017
/
Accepted: 11 September 2017
/
Published: 19 September 2017
(This article belongs to the Special Issue Recent Achievements in Rotary, Linear and Friction Stir Welding of Metals Alloys)
Abstract
:In this article, the copper-chromium-zirconium (CuCrZr) alloys plates with 21 mm in thickness were butt joined together by means of FSW (friction stir welding). The properties of the FSW joints are studied. The microstructure variations during the process of FSW were investigated by optical microscopy (OM), electron back-scattered diffraction (EBSD), and transmission electron microscopy (TEM). The results show that the grains size in the nugget zone (NZ) are significantly refined, which can be attributed to the dynamic recrystallization (DRX). The microstructure distribution in the NZ is inhomogeneous and the size of equiaxed grains are decreased gradually along the thickness direction from the top to bottom area of the welds. Meanwhile, it is found that the micro-hardness and tensile strength of the welds are slightly increased along the thickness direction from the top to the bottom area of the welds. All the nano-strengthening precipitates in the BM are dissolved into the Cu matrix in the NZ. Therefore, the decreases in hardness, tensile strength, and electrical conductivity can be attributed to the comprehensive effect of dissolution of nano-strengthening precipitates into the supersaturation matrix and severe DRX in the welded NZ.
1. Introduction
The copper-chromium-zirconium (CuCrZr) alloy is a new functional structure material and widely applied in industry owing to its excellent combinations of electrical conductivity, vacuum compatibility, and outstanding mechanical properties at elevated temperature [1,2,3,4]. However, due to the extreme high thermal diffusivity (i.e., approximately 10 to 100 times higher than that in some steels and nickel alloys [5,6,7]), copper alloys are generally classified as non-weldable alloys which cannot be fabricated by conventional techniques, such as fusion welding. Durocher et al. [8,9], Drezet et al. [10], and Gogari [11] found that hot cracking frequently occurs during electron beam welding of the CuCrZr alloys. Feng et al. [12] observed the appearance of residual stress and impurities introduced by the flash butt welding process, which thus caused the decrease of the electrical conductivity. Kanigalpula et al. [13] revealed the presence of voids and cracks in the microstructure of the investigated alloys after electron beam welding. Therefore, the fusion welding, such as the flash butt welding and the electron beam welding, are considered as an unattractive method for the welding of the CuCrZr alloy.
In comparison with fusion welding, friction stir welding (FSW), invented by The Welding Institute (TWI) of the UK in 1991 [14], is a relatively new solid-state joining process. The FSW process is proved to be a perfect choice for copper alloys [7,15,16,17,18], and it has been successfully implemented in industrial applications [19,20]. However, little research has been carried out on the CuCrZr alloy fabricated by FSW. Moreover, limited research related to the microstructure evolution of the CuCrZr alloy in the FSW process has been reported so far.
In this study, the FSW was introduced to successfully weld the 21 mm thickness of the CuCrZr plate. The properties including the micro-hardness, tensile strength, and electrical conductivity of the CuCrZr alloy joints are studied. The microstructures around the welding joints are investigated by OM, TEM, and EBSD.
2. Materials and Methods
The chemical compositions of the CuCrZr alloy in this work are listed in Table 1. The plates with 21 mm in thickness were longitudinally butt-welded using a computer-controlled FSW machine and the welding tool with a shoulder of 36 mm in diameter and a conical pin of 20 mm in length, as shown in Figure 1. The plunging depth and plunging speed of the tool were selected as 1 mm and 0.5 mm/s, respectively. The pin rotation speed and travel speed were chosen as 1500 rpm and 150 mm/min, respectively. The microstructures of the FSW sample perpendicular to the welding direction are analyzed by OM with a confocal laser scanning microscope (CLSM, ZEISS, Oberkochen, Germany), TEM, and EBSD. For the CLSM observation, the specimens were polished by diamond paste, etched in a solution of 40 mL distilled water, 10 mL hydrochloric acid, and 2 g iron (III) chloride. Intermetallic particles found in micrograph were further analyzed by EDS for determination of the elemental composition. For the TEM study, some thin foils of 0.5 mm thinness were cut out from different zones. Then, the foils were grinded into one of a thickness of 70 μm~80 μm and punched out several (Φ3 mm) discs for electro twin polishing in a solution of 75% methanol and 25% nitric acid under the parameters of the temperature ranging from −30 °C~−20 °C, and at a voltage of 10 V. TEM experiments were conducted on the Tecnai G2 F20 (FEI Corporation, Hillsboro, OR, USA) with an acceleration voltage of 120 keV. For the EBSD analysis, the corresponding sampling positions in the NZ were shown in Figure 2. Also, the data was collected using a FEI Quanta 650 FEG scanning electron microscopy (FEI Corporation, Hillsboro, OR, USA).
In order to investigate the mechanical properties of the welded joints, the block was further cut along the plate thickness direction into three layers (top, middle and bottom) with a thickness of 5 mm, as seen in Figure 2. The Vickers micro-hardness measurements were conducted on the cross section for each layer using a Vickers indenter, wherein a 100 g load was imposed and held for 10 s. To further explore the zone-related Vickers micro-hardness, points with 2 mm apart from each other were selected for measurements. The tensile properties at room temperature of the welded joints for each layer were also examined using an Instron-8032 testing machine (Grove City, PA, USA) with a crosshead speed of 2 mm/min. The facture surfaces were analyzed on a field emission scanning electron microscopy (SEM Quanta 650).
To study the effects of the microstructure evolution on electrical conductivities, tests on both the parent material and the welded alloy were carried out at each layer by employing a double bridge circuit and dc currents (intensity up to 50 A) under a ventilated condition at a constant temperature of 25 °C.
3. Results and Discussions
3.1. Microstructure of FSW Joints
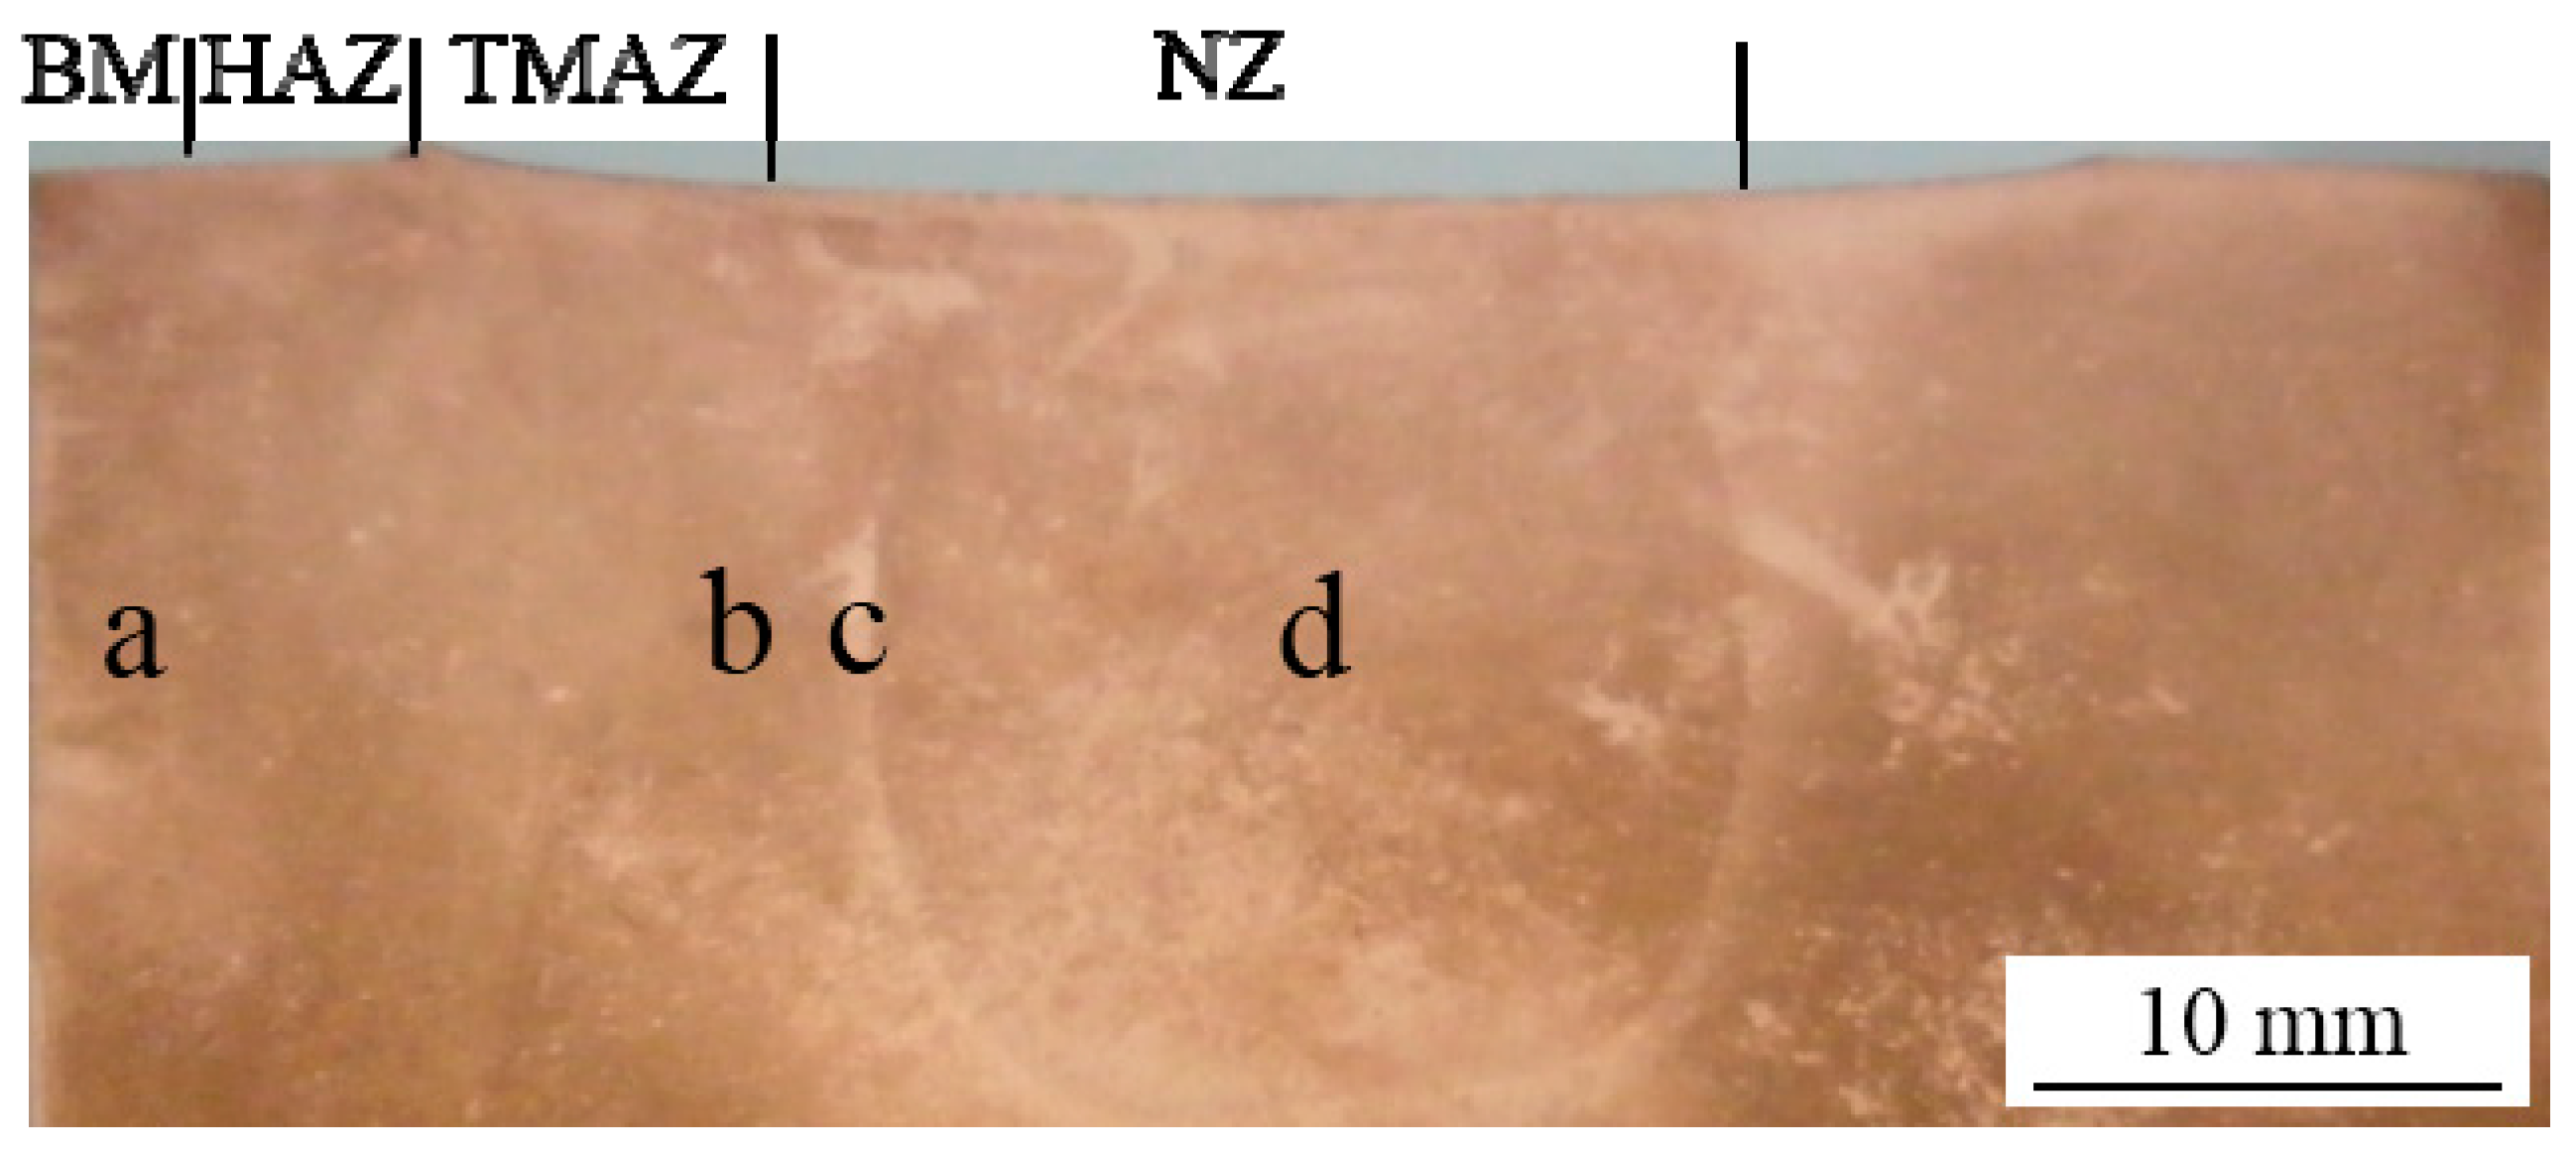
The picture FSW joint of the CuCrZr alloy is shown in Figure 3. Clearly, there are four distinguishable zones of the FSW joint including: (a) the base metal (BM); (b) the heat affected zone (HAZ); (c) the thermo-mechanically-affected zone (TMAZ); and (d) the nugget zone (NZ); these all occur during the process of FSW.
Figure 4 shows the OM picture microstructures corresponding to locations “a”, “b”, “c”, and “d”, which are indicted in Figure 3. In the BM, larger lath and coarse grains are apparently observed and considerable numbers of irregularly shaped particles can be found distributed randomly in the Cu matrix, as shown in Figure 4a. To further reveal the composition of these particles, the EDS mapping analysis is performed and the results are presented in Figure 5. The results show that the element Cr is found to concentrate in the particles, while element Cu is absent in these locations but distributed uniformly in the alloy matrix. The concentration of Zr is not detected based on the results of EDS, as demonstrated in Figure 5d. These findings are consistent with previous reports [21,22].
In the HAZ, as seen in Figure 4b, the grain structures are similar to that of the base metal, but some newly formed grains around the large grains driven from static recrystallization are detected. Within this HAZ, as seen in Figure 4c, a unique metallurgical zone in FSW experiencing both high frictional heating temperatures and plastic deformation is generally defined as TMAZ [23,24,25]. The microstructure of TMAZ is characterised by a highly deformed structure with an upward flowing pattern next to the NZ owing to the rotated deformation. Meanwhile, in the NZ, severe plastic deformation and a significant rise in temperature make the dynamic recrystallization (DRX) become apparent [23,24,26,27,28,29,30,31,32,33,34,35,36,37,38], resulting in the existence of near fully equiaxed grains. In addition, the particles that exist randomly in the BM are refined and distribute uniformly in the NZ, as shown in Figure 4d.
To further uncover the microstructure details of nugget zone (NZ), the technique of EBSD was employed. Figure 6 shows the inverse pole figure (IPF) corresponding to three different locations along the thickness direction of NZ. As seen in Figure 6a, nearly equiaxed grains appear at the top of NZ. As distance away from the top increases, the grain size was found to decrease gradually (Figure 6b,c). During the FSW process, a large amount of heat that arose from severe deformation was formed. The deformation heat then dissipated toward to the surroundings and the base steel that was attached to the welded CuCrZr alloy. The high thermal conductivity of the base steel makes the larger amount of dissipated heat at the bottom. In addition, the heat produced at the top is higher than that at the bottom, leading to temperature gradients and thus a diverse microstructure.
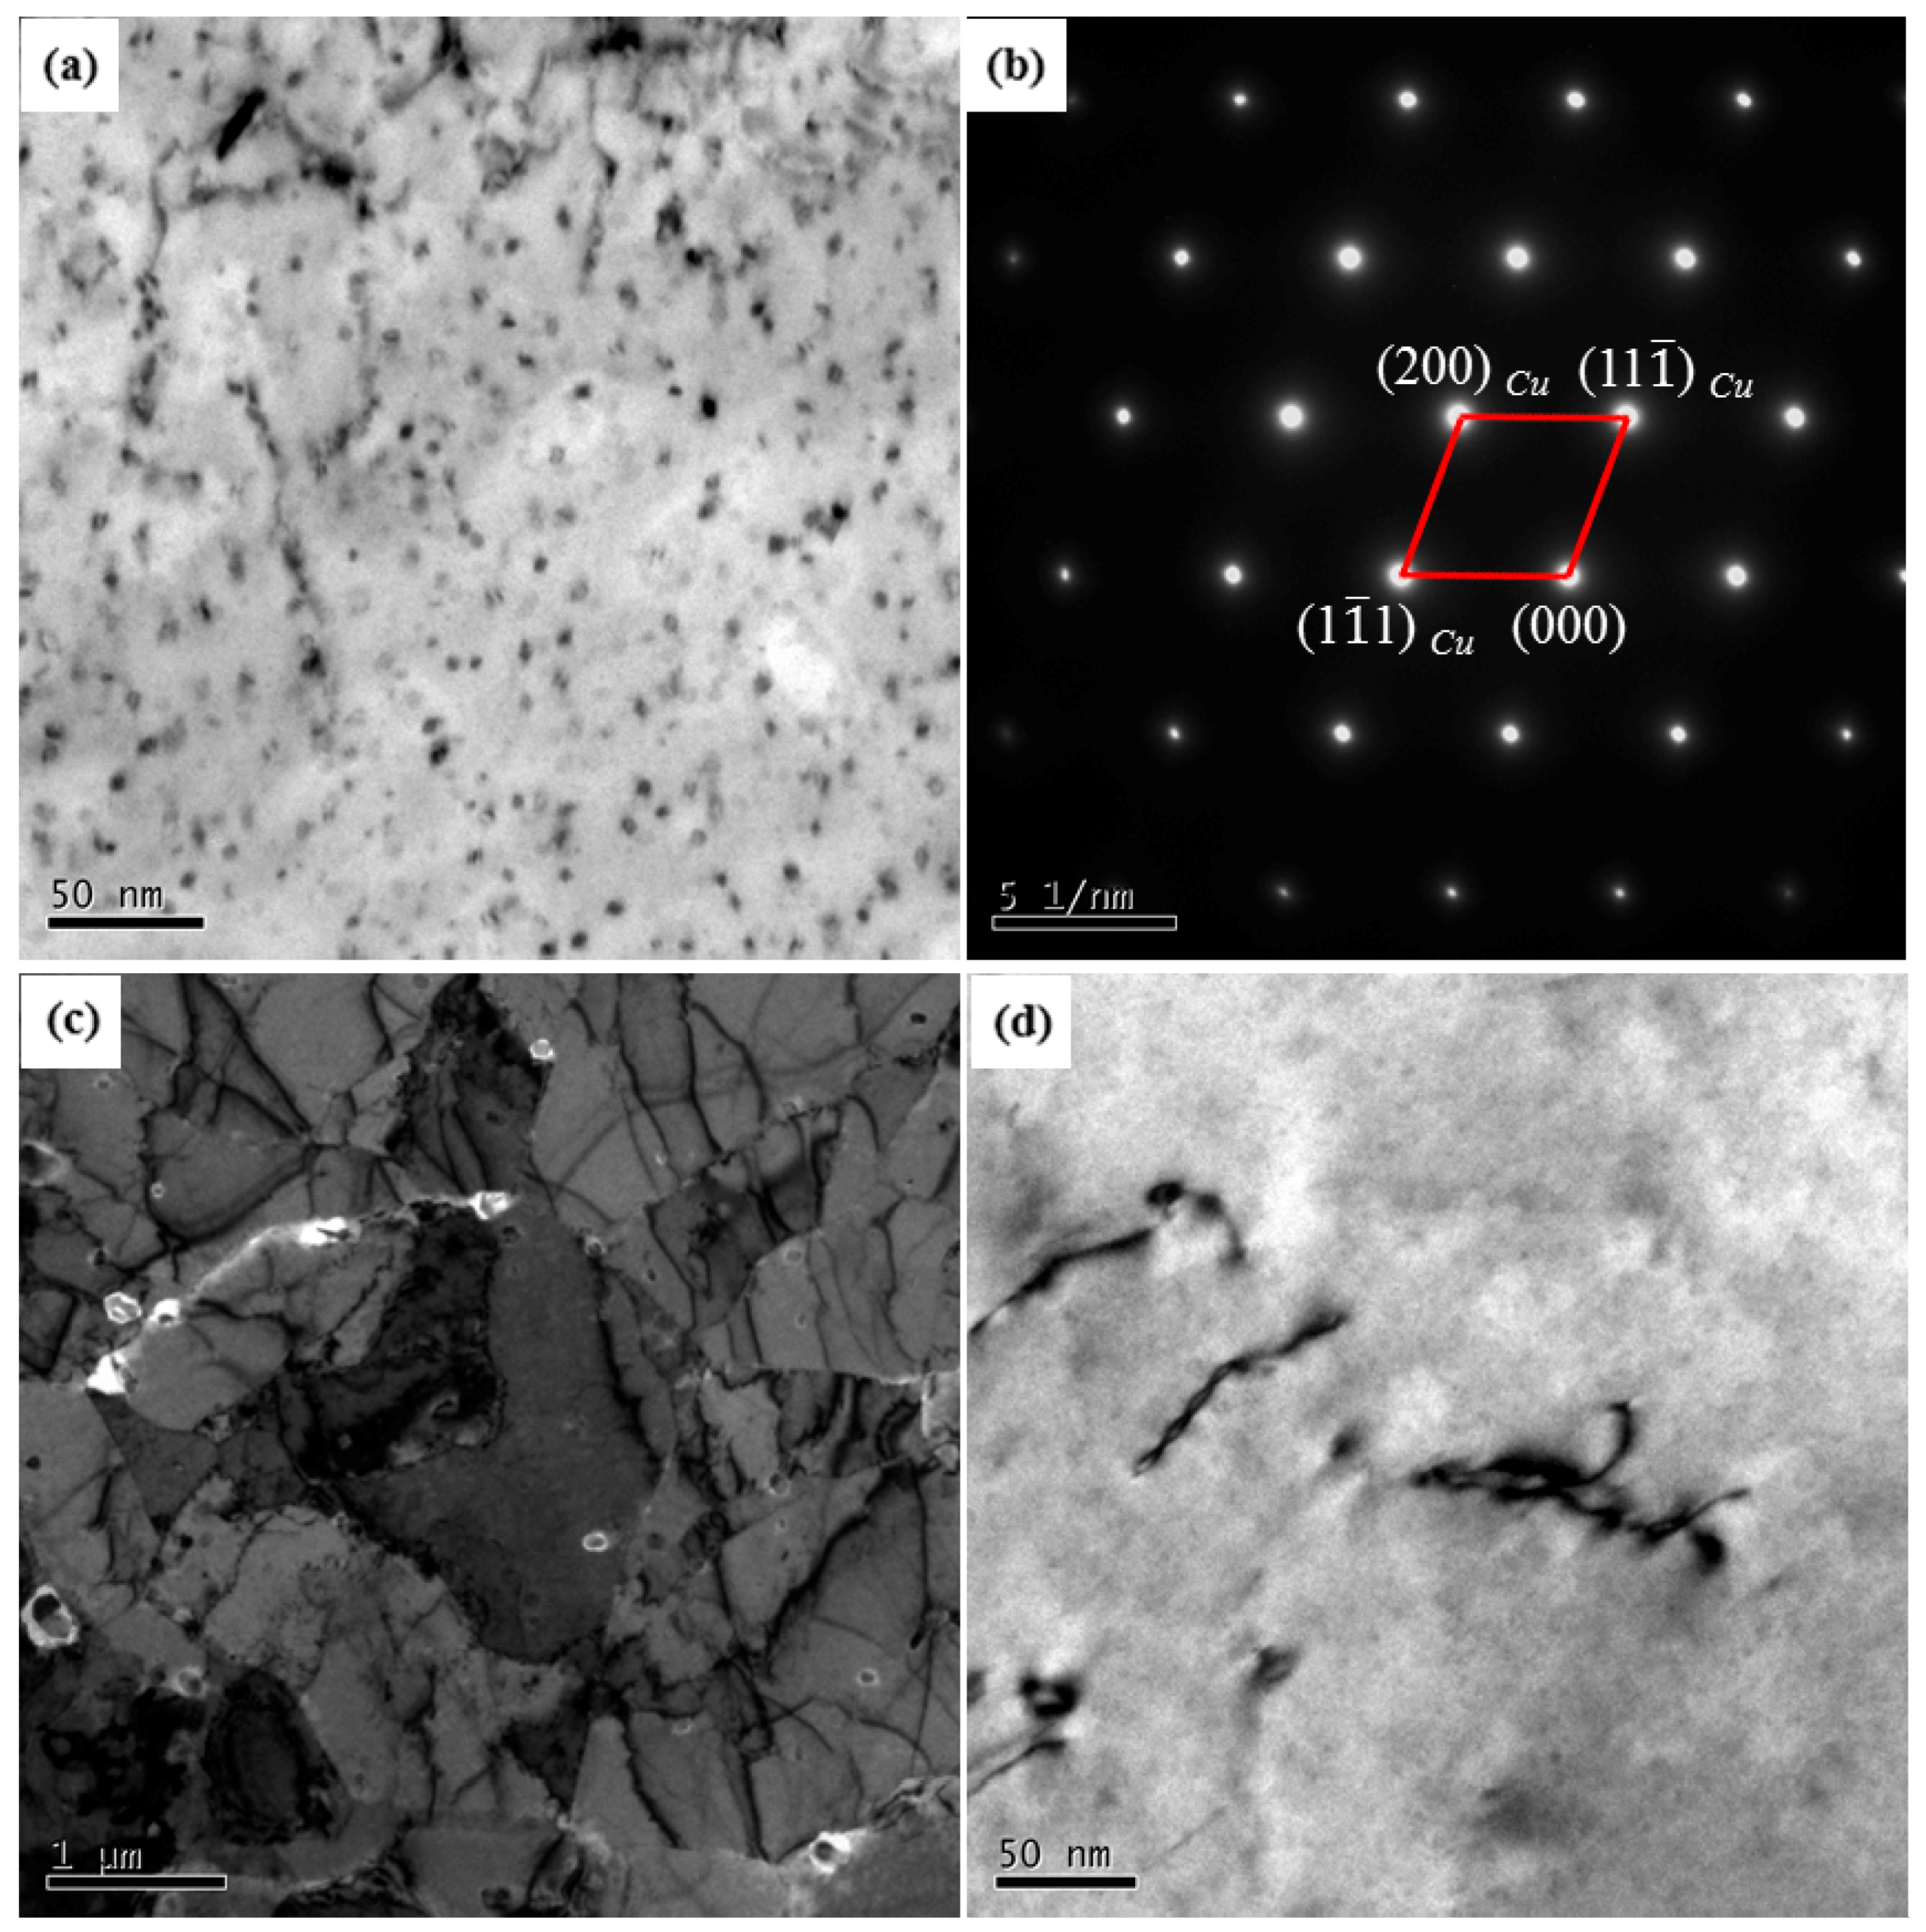
The TEM micrographs of BM and NZ are shown in Figure 7. Figure 7a,b shows a bright field TEM micrograph and the corresponding selected area electron diffraction pattern (SADP) of the Cu matrix in the BM alloy. As shown in Figure 7a, all the strengthening precipitates are presented as an equiaxed shape with a range of 2–5 nm in diameter, decorating uniformly inside the grains of the Cu matrix. Moiré fringes in two directions, nearly perpendicular to each other, were clearly observed in some of the precipitates in Figure 7a. It was identified that most of the Moiré fringes were parallel to the planes of the Cu matrix [31]. In the <110> Cu directions, no Moiré fringes can be found in the precipitates. A contrast associated with the strain fields surrounding the precipitates was observed, suggesting that the precipitates were coherent with the matrix. The SADP of the Cu matrix did not reveal any diffraction spots from the fine precipitates.
TEM micrographs of BM and NZ are shown in Figure 7. Figure 7a,b shows a bright field TEM micrograph and the corresponding selected area electron diffraction pattern (SADP) of the Cu matrix in the BM alloy. As shown in Figure 7a, all the strengthening precipitates are presented as equiaxed shape with a range of 2 nm–5 nm in diameter, decorating uniformly inside the grains of the Cu matrix. Moiré fringes in two directions, nearly perpendicular to each other, were clearly observed in some of the precipitates in Figure 7a. It was identified that most of the Moiré fringes were parallel to the planes of the Cu matrix [31]. In the <110> Cu directions, no Moiré fringes can be found in the precipitates. A contrast associated with the strain fields surrounding the precipitates was observed, suggesting that the precipitates were coherent with the matrix. The SADP of the Cu matrix did not reveal any diffraction spots from the fine precipitates.
In the NZ, sub-grains can be obviously observed around the small recrystallized grains, while nano-strengthening precipitates are absent (Figure 7c). The results of SADP on these regions did not reveal any streaks, as can be seen in Figure 7d. Källgren [19] found that the friction heat can raise the temperature up to over 800 °C between the rotating shoulder, the pin, and the workpiece during the FSW process of the Cu alloy. For the high strength CuCrZr alloy, the peak welding temperature should be higher than for pure copper. High welding temperatures and thermal cycling during FSW can result in the dissolution of nano-strengthening precipitates into the supersaturating matrix in NZ. Similar results can also be found in Heinz [30], Rhodes et al. [25], Sato et al. [39], Liu et al. [40], and Jata et al. [41].
3.2. Properties
3.2.1. Micro-Hardness
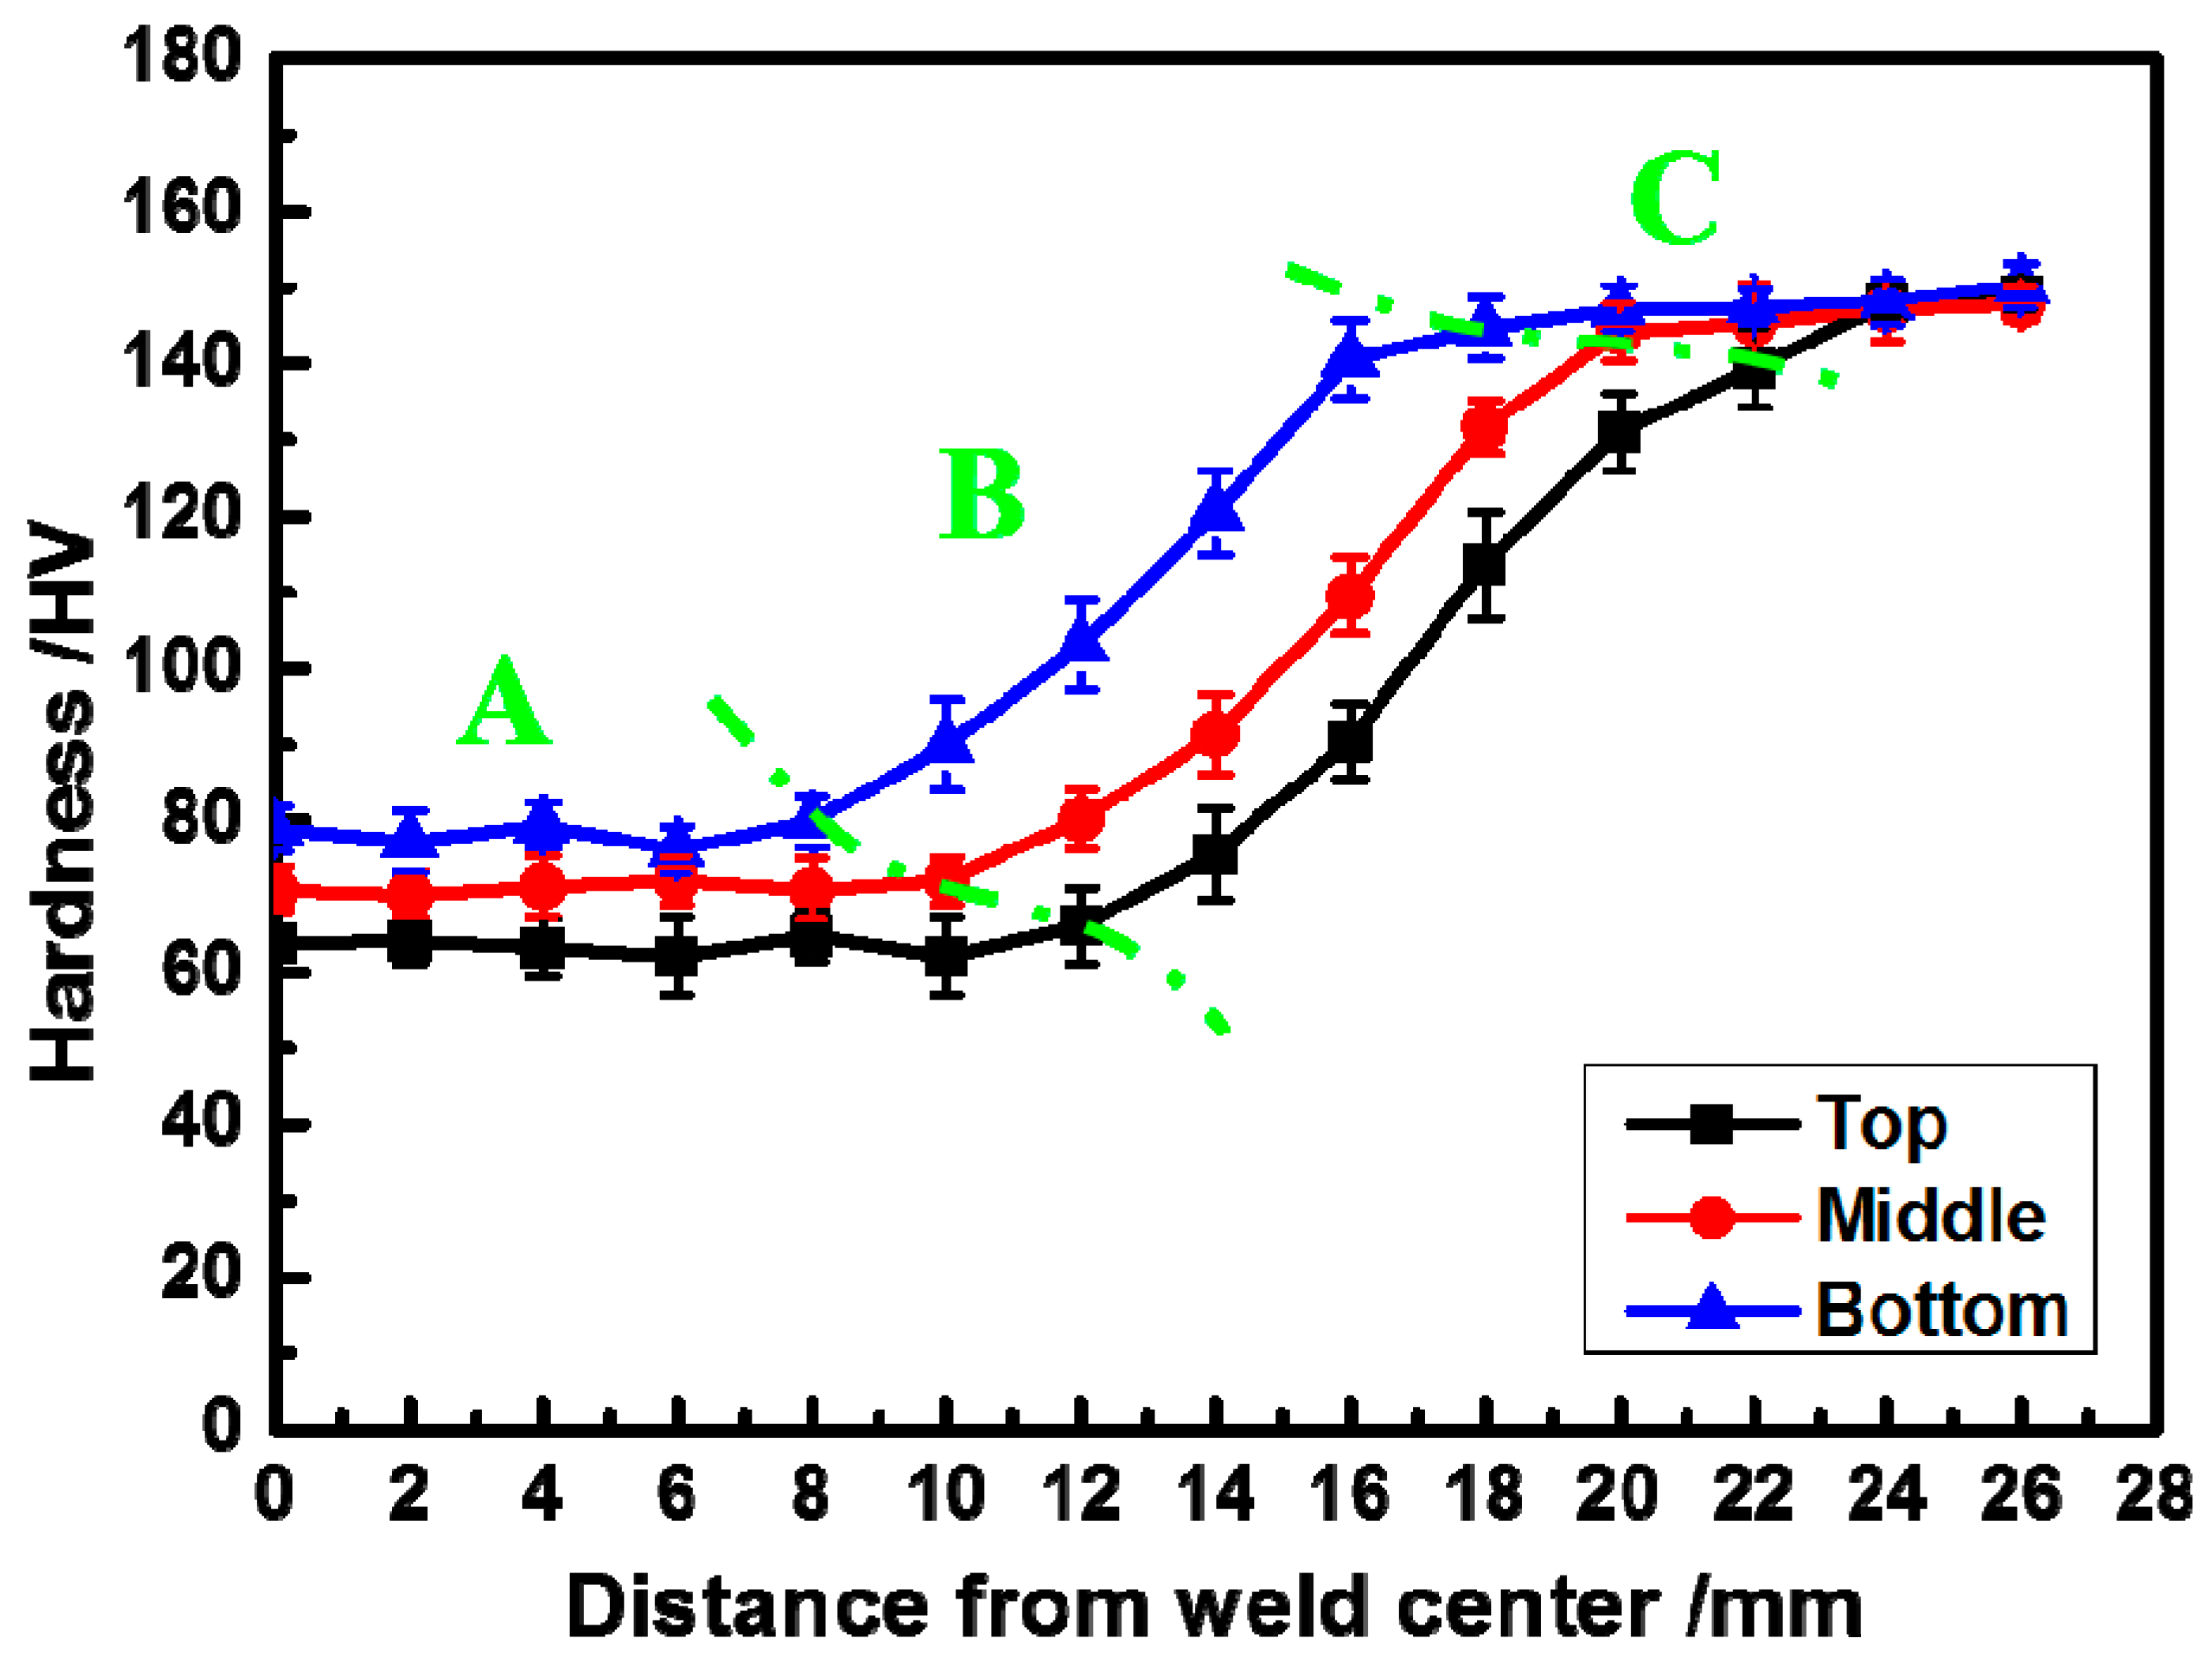
Figure 8 shows the micro-hardness of three distinct zones: (A) NZ; (B) the transition zone, TMAZ, and HAZ; and (C) the BM corresponding to different layers. As shown in Figure 8, the NZ had the lowest hardness with the average value of 64 HV in the top layer, 70 HV in the middle layer, and 80 HV in the bottom layer, respectively. It is found that the value of micro-hardness from the centre to the edge increases with increasing distance, and the highest micro-hardness appears in the base metal. From the demonstration of average hardness values, the tendency of variation can be summarized as followed: top > middle > bottom, and BM > HAZ > TMAZ > NZ. It’s widely accepted that the hardness of the CuCrZr alloy is dependent on the grain size and the distribution of the nano-strengthening precipitates. In the NZ, the grain size is small but the hardness is low; this indicates that the grain size plays a secondary role in determining the hardness. In this case, the nano-strengthening precipitates play a major role in affecting the value of the hardness. As indicated by Figure 7d, the nano-strengthening precipitates in the NZ are nearly absent owing to the elevated temperature that arose during the FSW process. It is be reasonably concluded that the remarkable decrease of hardness in the NZ is mainly attributed to the dissolution of nano-strengthening precipitates (Figure 7d).
Generally, the temperature in the top layer should be the highest one owing to the heat that was released from the bottom layer to the platform. In this case, the gradient microstructures occur, wherein a fraction of the nano-strengthening precipitates will remain in the bottom layer alloy but near-totally dissolve into the Cu matrix. Compared to the bottom, the lowest hardness in the top of the weld NZ could be attributed to the more severe DRX, with larger grain sizes caused by the higher welding temperature at the top of weld [42].
3.2.2. Tensile Strength
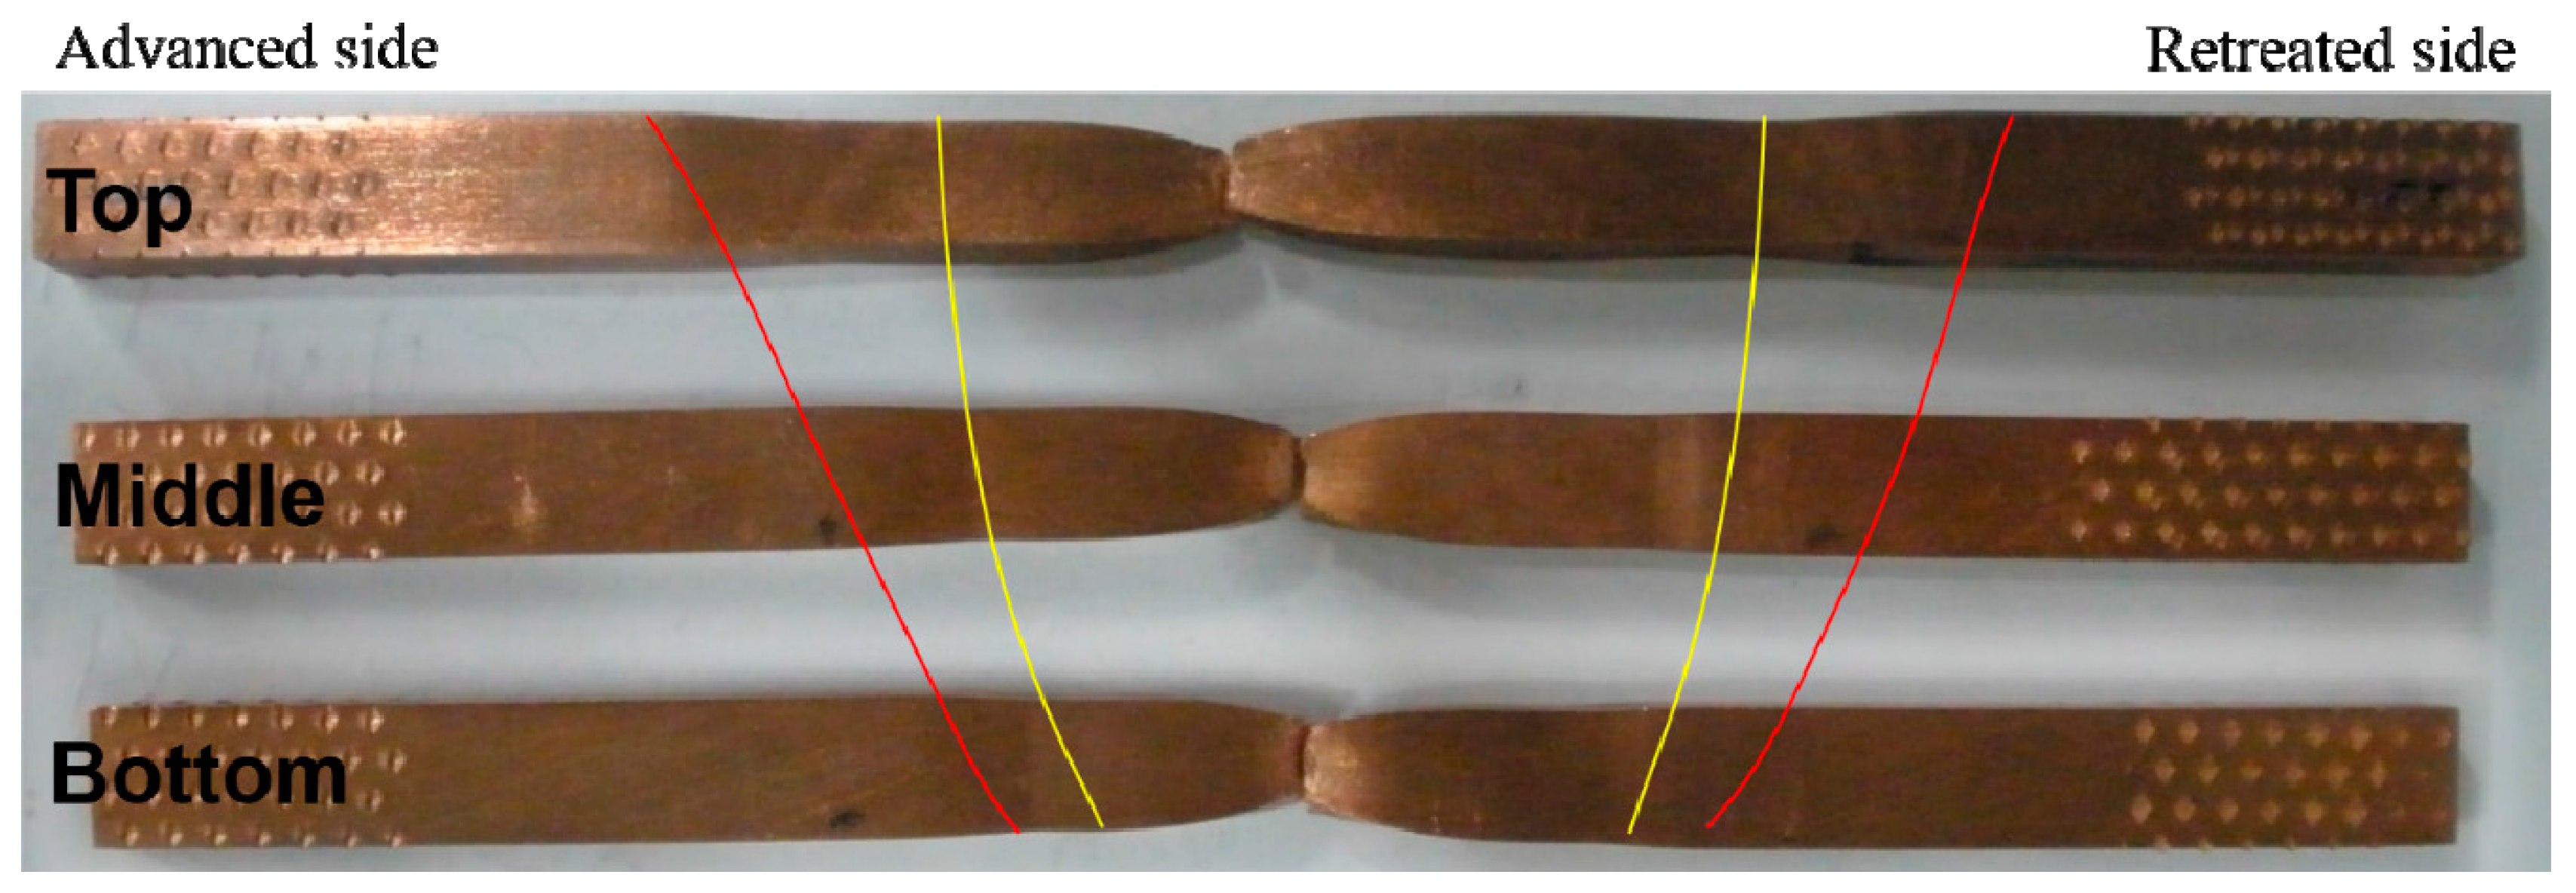
In order to study the tensile strength of the welded joints of the CuCrZr alloy along the joint thickness direction, tensile tests were performed on specimens with dimensions of 120 mm × 4 mm × 4 mm which have been signed according to their slice positions in the welding joint, as shown in Figure 2. The fracture locations of the joints are shown in Figure 9. It is obvious that all the weld joints are severely necking fractured in the NZ.
As illustrated in Figure 10, the average tensile strength of the welded alloys is determined to be 269 MPa (equivalent to 60% of the base metal strength) and the average elongation is 18.3% (much higher than that of the base metal). Along the thickness direction, it can be found that the tensile strength of the welds is slightly increased from the top to the bottom area of the welds. However, an opposite tendency is found for the elongation. This phenomenon can be attributed to the two microstructure-related aspects of nano-strengthening precipitates and the size of grains at the fracture location, which have been discussed in the previous sections.
To further investigate the fracture mechanisms, the fracture appearance is examined and shown in Figure 11. From the fracture morphology, it is found that the major fracture mechanism of the FSW is the joints behaviors ductile. The ductile fracture is apparently presented in both the fracture morphology of the base metal and the welded alloy. However, for case of the welded joint, larger voids were observed than for that of base metal, as shown in Figure 11a,b.
3.2.3. Electrical Conductivity
The high electrical conductivity of the CuCrZr alloys is one of the reasons that they are widely be used in industry. Hence, in this study, the electrical conductivity of the FSW CuCrZr alloy joints were measured. The specimen sampling is parallel to the direction of the weld, with a dimension of 2 mm thickness × 2 mm width ×120 mm length for the electrical conductivity test.
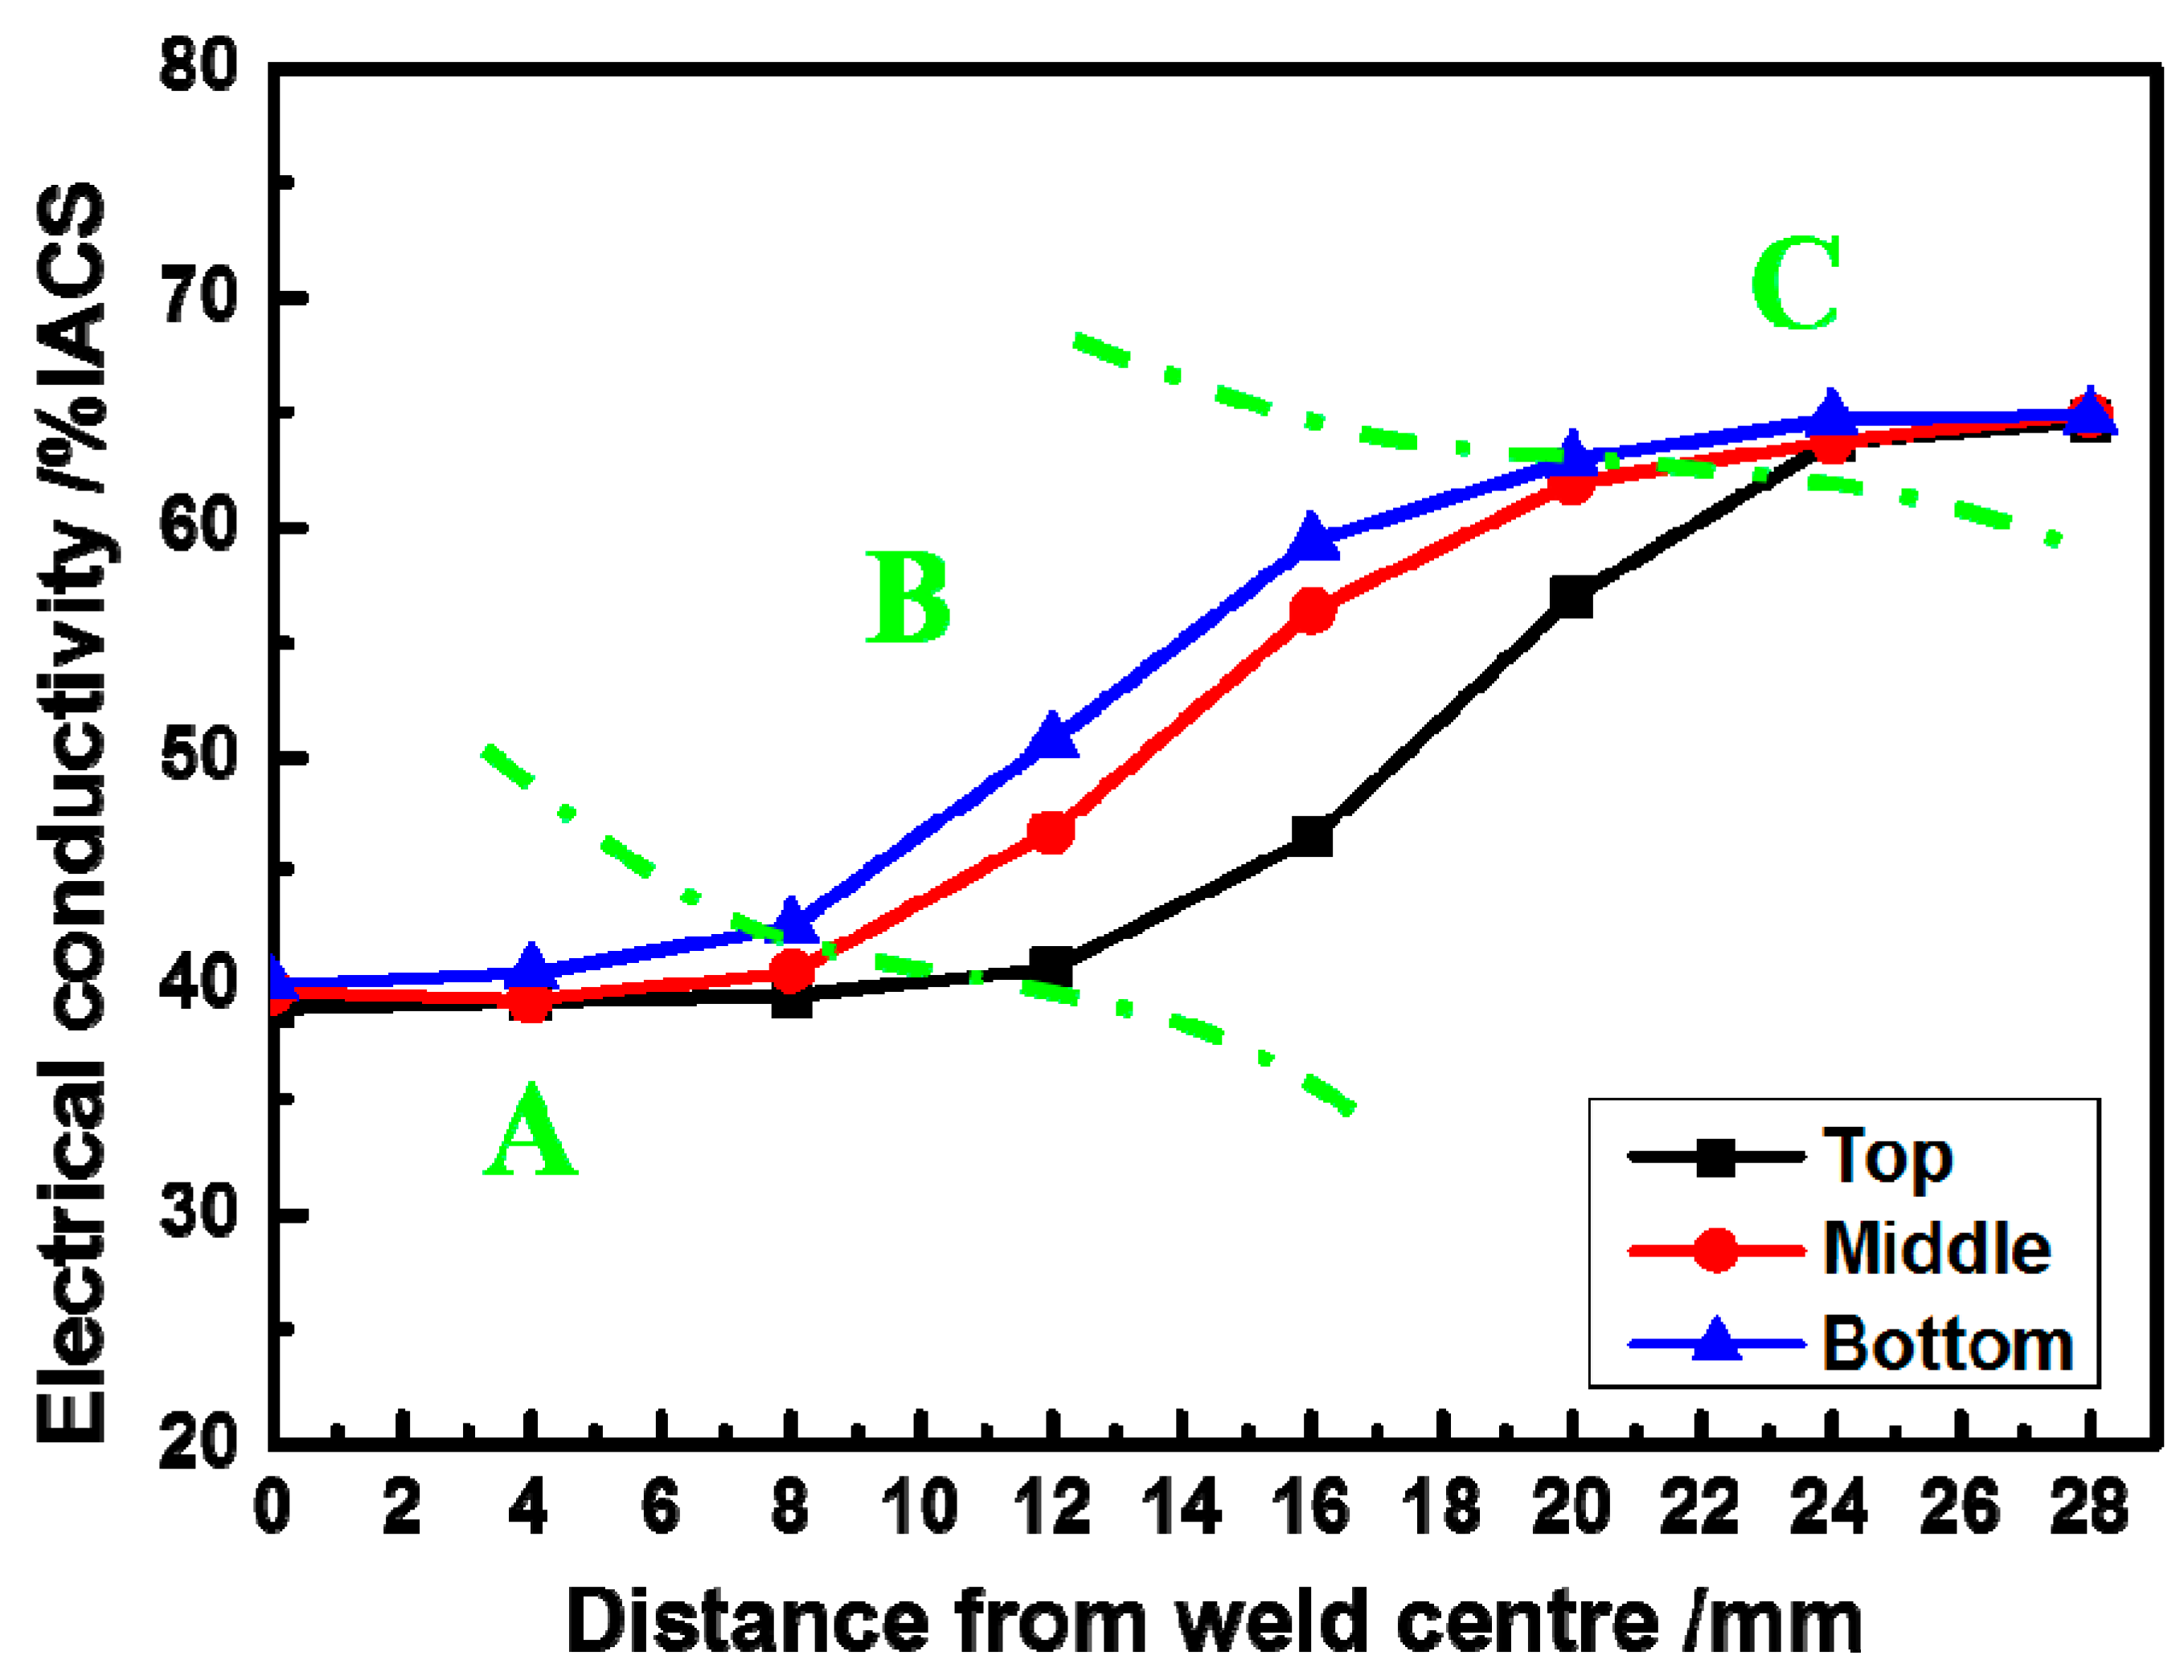
Figure 12 shows the variations of electrical conductivity corresponding to three distinct zones: (A) NZ; (B) Transition zone, TMAZ and HAZ; and (C) BM, all at different height layers.
As seen in Figure 12, the variation of the electrical conductivity of the sample in the NZ is slight but keeps constant (~40% IACS) at a certain distance from the welded center (~8 mm), which then starts to increase to 50~60% IACS in the transition zone (TMAZ and HAZ). The highest value (~65% IACS) of electrical conductivity was obtained in the base metal.
It is well documented that the electrical conductivity is mainly affected by the electron scattering of the solid solution atoms. A theoretical model to describe the relationships between temperature, impurity content, and the electrical resistance of a metal solid solution is given by Matthiessen’s rule [43]: ρi(T) = ρi + ρm(T), where ρi is the residual resistivity and ρm(T) is the resistivity of pure metal. The value of ρi is determined by impurity concentration [44]. The ρi was reported to play a leading role at lower temperatures and an increase of ρi will result in an increase of the resistivity of the alloy.
Based on the above analysis, the contribution of a high welding temperature and thermal cycling during FSW resulted in the dissolution of the nano-strengthening precipitates into the supersaturation matrix in the weld zone (Figure 7d). The increase of the degree of supersaturation would lead to the higher lattice distortion of the matrix and thus the scattering of the electrons would increase. Therefore, the value of ρi will increase correspondingly. During the FSW process of the CrCuZr alloy, the gradual re-dissolution of solute atoms to the matrix leads to an increase of ρi, and then the electrical conductivity decreases with the increasing welding temperature. Moreover, the significant occurrence of the recovery and recrystallization would lead to the continuous occurrence of the crystal lattice distortion and thus accelerate the decrease of the electrical conductivity in the NZ of the FSW CuCrZr alloy.
4. Conclusions
The microstructure and properties of a friction stir welded CuCrZr alloy are investigated. Some important conclusions can be drawn as follows:
- The weld zone that is defect-free is formed in the condition of 1500 rpm and 150 mm/min. The microstructure near the weld zone is very different from that of the base metal. HAZ is characterized by some newly formed grains around the large grains. TMAZ is characterized by a highly deformed structure with an upward flowing pattern, and the fine and equaxed grain structure is apparently found in the NZ.
- The strengthening precipitates with a range of 2 nm–5 nm in diameter are coherently exhibited with the Cu matrix in the BM. After FSW, however, all the nano-strengthening precipitates are dissolved into the Cu matrix in the NZ. Also, the grains’ size is significantly refined owing to the occurrence of DRX. The coarse chromium-rich particles are crushed into finer ones, which distribute more uniformly in the NZ.
- Along the thickness direction, the microstructure distribution is inhomogeneous and the size of the equiaxed grains in the NZ is decreased gradually from the top to the bottom area of the welds because of the distinctive heat production and the heat dissipation on the welding joint. That led to the micro-hardness and tensile strength of the welds, which are slightly increased from the top to the bottom area of the welds.
- Decreases in hardness, tensile strength, and electrical conductivity are detected in the welded NZ, which result from the comprehensive effect of the dissolution of the nano-strengthening precipitates into the supersaturation matrix and severe DRX.
Acknowledgments
This work was supported by the National Basic Research Program of China (“973 Program”, 2014CB046605) and Nonferrous Metal Oriented Advanced Structural Materials and Manufacturing Cooperative Innovation Center (“2011 Program”). The authors would like to thank the co-workers at the State Key Laboratory of High Performance Complex Manufacturing of Central South University for their invaluable suggestions and discussions on the current research.
Author Contributions
Diqiu He was the principle investigator of the research. Ruilin Lai and Junyuan Lin carried out the welding tests. Guoai He and Youqing Sun characterized the microstructure of the welded samples. Ruilin Lai performed mechanical tastings, hardness, fractography, and wrote the paper.
Conflicts of Interest
The authors declare no conflict of interest.
References
- Davis, J.W.; Kalinin, G.M. Material properties and design requirements for copper alloys used in ITER. J. Nucl. Mater. 1998, 258–263, 323–328. [Google Scholar] [CrossRef]
- Correia, J.B.; Davies, H.A.; Sellars, C.M. Strengthening in rapidly solidified age hardened Cu-Cr and Cu-Cr-Zr alloys. Acta Mater. 1997, 45, 177–190. [Google Scholar] [CrossRef]
- Batra, I.; Dey, G.; Kulkarni, U.; Banerjee, S. Microstructure and properties of a Cu–Cr–Zr alloy. J. Nucl. Mater. 2001, 299, 91–100. [Google Scholar] [CrossRef]
- Zhang, D.; Mihara, K.; Tsubokawa, S.; Suzuki, H. Precipitation characteristics of Cu–15Cr–015Zr in situ composite. Mater. Sci. Technol. 2000, 16, 357–363. [Google Scholar] [CrossRef]
- Sakthivel, T.; Mukhopadhyay, J. Microstructure and mechanical properties of friction stir welded copper. J. Mater. Sci. 2007, 42, 8126–8129. [Google Scholar] [CrossRef]
- Mishra, R.S.; Ma, Z. Friction stir welding and processing. Mater. Sci. Eng. R Rep. 2005, 50, 1–78. [Google Scholar] [CrossRef]
- Lee, W.-B.; Jung, S.-B. The joint properties of copper by friction stir welding. Mater. Lett. 2004, 58, 1041–1046. [Google Scholar] [CrossRef]
- Durocher, A.; Ayrault, D.; Chagnot, C.; Lipa, M.; Saikaly, W. CuCrZr alloy hot cracking during electron beam welding. J. Nucl. Mater. 2007, 367, 1208–1212. [Google Scholar] [CrossRef]
- Durocher, A.; Lipa, M.; Chappuis, P.; Schlosser, J.; Huber, T.; Schedler, B. TORE SUPRA experience of copper chromium zirconium electron beam welding. J. Nucl. Mater. 2002, 307, 1554–1557. [Google Scholar] [CrossRef]
- Drezet, J.; Ayrault, D.; Wisniewski, J.; Barras, M.; Pilvin, P.; Carron, D.; Primaux, F. Hot tearing susceptibility of a CuCrZr alloy during electron beam welding. Mater. Tech. 2010, 98, 287–296. [Google Scholar] [CrossRef]
- Gogari, H.J. Materials Characterization of Electron Beam Welded CuCrZr Joint for ITER High Heat Flux Component. Ph.D. Thesis, Institute for Plasma Research, Gandhinagar, India, May 2014. [Google Scholar]
- Feng, H.; Jiang, H.; Yan, D.; Rong, L. Microstructure and Mechanical Properties of a CuCrZr Welding Joint After Continuous Extrusion. J. Mater. Sci. Technol. 2015, 31, 210–216. [Google Scholar] [CrossRef]
- Kanigalpula, P.; Chatterjee, A.; Pratihar, D.; Jha, M.; Derose, J. Effects of Electron Beam Welding on Microstructure, Microhardness, and Electrical Conductivity of Cu-Cr-Zr Alloy Plates. J. Mater. Eng. Perform. 2015, 24, 4681–4690. [Google Scholar] [CrossRef]
- Thomas, W.M.; Nicholas, E.; Needham, J.; Murch, M.; Temple-Smith, P.; Dawes, C. Improvements Relating to Friction Welding. Patent EP 0,653,265, 17 May 1995. [Google Scholar]
- Liu, H.; Shen, J.; Huang, Y.; Kuang, L.; Liu, C.; Li, C. Effect of tool rotation rate on microstructure and mechanical properties of friction stir welded copper. Sci. Technol. Weld. Join. 2009, 14, 577–583. [Google Scholar] [CrossRef]
- Xie, G.; Ma, Z.; Geng, L. Development of a fine-grained microstructure and the properties of a nugget zone in friction stir welded pure copper. Scr. Mater. 2007, 57, 73–76. [Google Scholar] [CrossRef]
- Nakata, K. Friction stir welding of copper and copper alloys. Weld. Int. 2005, 19, 929–933. [Google Scholar] [CrossRef]
- Celik, S.; Cakir, R. Effect of friction stir welding parameters on the mechanical and microstructure properties of the Al-Cu butt joint. Metals 2016, 6, 133. [Google Scholar] [CrossRef]
- Källgren, T. Friction Stir Welding of Copper Canisters for Nuclear Waste. Ph.D. Thesis, KTH, Stockholm, Sweden, July 2005. [Google Scholar]
- Cederqvist, L.; Garpinger, O.; Hägglund, T.; Robertsson, A. Cascade control of the friction stir welding process to seal canisters for spent nuclear fuel. Control Eng. Pract. 2012, 20, 35–48. [Google Scholar] [CrossRef]
- Mei, Z.; Guobiao, L.; Zidong, W.; Maokui, Z. Analysis of precipitation in a Cu-Cr-Zr alloy. Res. Dev. 2008, 5, 268–271. [Google Scholar]
- Deng, J.Q.; Zhang, X.Q.; Shang, S.Z.; Zhao, Z.X.; Ye, Y.F. Deformation Processing and Mechanical Properties of Cu-10Cr-0.4Zr In Situ Composite Microwires. Mater. Sci. Forum Trans. Tech. Publ. 2011, 682, 89–95. [Google Scholar] [CrossRef]
- Mahoney, M.; Rhodes, C.; Flintoff, J.; Bingel, W.; Spurling, R. Properties of friction-stir-welded 7075 T651 aluminum. Metall. Mater. Trans. A 1998, 29, 1955–1964. [Google Scholar] [CrossRef]
- Ma, Z.; Mishra, R.S.; Mahoney, M.W. Superplastic deformation behaviour of friction stir processed 7075Al alloy. Acta Mater. 2002, 50, 4419–4430. [Google Scholar] [CrossRef]
- Rhodes, C.; Mahoney, M.; Bingel, W.; Spurling, R.; Bampton, C. Effects of friction stir welding on microstructure of 7075 aluminum. Scr. Mater. 1997, 36, 69–75. [Google Scholar] [CrossRef]
- Li, Y.; Murr, L.; McClure, J. Flow visualization and residual microstructures associated with the friction-stir welding of 2024 aluminum to 6061 aluminum. Mater. Sci. Eng. A 1999, 271, 213–223. [Google Scholar] [CrossRef]
- Kwon, Y.; Saito, N.; Shigematsu, I. Friction stir process as a new manufacturing technique of ultrafine grained aluminum alloy. J. Mater. Sci. Lett. 2002, 21, 1473–1476. [Google Scholar] [CrossRef]
- Tang, W.; Guo, X.; McClure, J.; Murr, L.; Nunes, A. Heat input and temperature distribution in friction stir welding. J. Mater. Process. Manuf. Sci. 1998, 7, 163–172. [Google Scholar] [CrossRef]
- Abdollah-Zadeh, A.; Saeid, T.; Sazgari, B. Microstructural and mechanical properties of friction stir welded aluminum/copper lap joints. J. Alloys Compd. 2008, 460, 535–538. [Google Scholar] [CrossRef]
- Heinz, B.; Skrotzki, B. Characterization of a friction-stir-welded aluminum alloy 6013. Metall. Mater. Trans. B 2002, 33, 489–498. [Google Scholar] [CrossRef]
- Murr, L.; Liu, G.; McClure, J. Dynamic recrystallization in friction-stir welding of aluminium alloy 1100. J. Mater. Sci. Lett. 1997, 16, 1801–1803. [Google Scholar] [CrossRef]
- Sato, Y.S.; Park, S.H.C.; Kokawa, H. Microstructural factors governing hardness in friction-stir welds of solid-solution-hardened Al alloys. Metall. Mater. Trans. A 2001, 32, 3033–3042. [Google Scholar] [CrossRef]
- Salem, H.G.; Reynolds, A.P.; Lyons, J.S. Microstructure and retention of superplasticity of friction stir welded superplastic 2095 sheet. Scr. Mater. 2002, 46, 337–342. [Google Scholar] [CrossRef]
- Su, J.-Q.; Nelson, T.; Mishra, R.; Mahoney, M. Microstructural investigation of friction stir welded 7050-T651 aluminium. Acta Mater. 2003, 51, 713–729. [Google Scholar] [CrossRef]
- Charit, I.; Mishra, R.S.; Mahoney, M.W. Multi-sheet structures in 7475 aluminum by friction stir welding in concert with post-weld superplastic forming. Scr. Mater. 2002, 47, 631–636. [Google Scholar] [CrossRef]
- Ma, Z.; Mishra, R.S.; Mahoney, M.W.; Grimes, R. High strain rate superplasticity in friction stir processed Al–Mg–Zr alloy. Mater. Sci. Eng. A 2003, 351, 148–153. [Google Scholar] [CrossRef]
- Saeid, T.; Abdollah-Zadeh, A.; Sazgari, B. Weldability and mechanical properties of dissimilar aluminum–copper lap joints made by friction stir welding. J. Alloys Compd. 2010, 490, 652–655. [Google Scholar] [CrossRef]
- Heidarzadeh, A.; Saeid, T. Prediction of mechanical properties in friction stir welds of pure copper. Mater. Des. 2013, 52, 1077–1087. [Google Scholar] [CrossRef]
- Sato, Y.S.; Kokawa, H.; Enomoto, M.; Jogan, S. Microstructural evolution of 6063 aluminum during friction-stir welding. Metall. Mater. Trans. A 1999, 30, 2429–2437. [Google Scholar] [CrossRef]
- Liu, G.; Murr, L.; Niou, C.; McClure, J.; Vega, F. Microstructural aspects of the friction-stir welding of 6061-T6 aluminum. Scr. Mater. 1997, 37, 355–361. [Google Scholar] [CrossRef]
- Jata, K.; Sankaran, K.; Ruschau, J. Friction-stir welding effects on microstructure and fatigue of aluminum alloy 7050-T7451. Metall. Mater. Trans. A 2000, 31, 2181–2192. [Google Scholar] [CrossRef]
- Chang, C.; Lee, C.; Huang, J. Relationship between grain size and Zener–Holloman parameter during friction stir processing in AZ31 Mg alloys. Scr. Mater. 2004, 51, 509–514. [Google Scholar] [CrossRef]
- Balcerek, K.; Marucha, C.; Rafalowicz, J.; Wawryk, R. Deviation from matthiessen’s rule for thermal conductivity of quenched Zn-doped Cd crystals in the temperature range 5–20 K. Int. J. Thermophys. 1993, 14, 1229–1234. [Google Scholar] [CrossRef]
- Xie, H.; Mi, X.; Huang, G.; Gao, B.; Yin, X.; Li, Y. Effect of thermomechanical treatment on microstructure and properties of Cu-Cr-Zr-Ag alloy. Rare Met. 2011, 30, 650–656. [Google Scholar] [CrossRef]
Figure 1.
Schematic presentation of friction stir welding technique and the tool geometry used for this work.
Figure 1.
Schematic presentation of friction stir welding technique and the tool geometry used for this work.
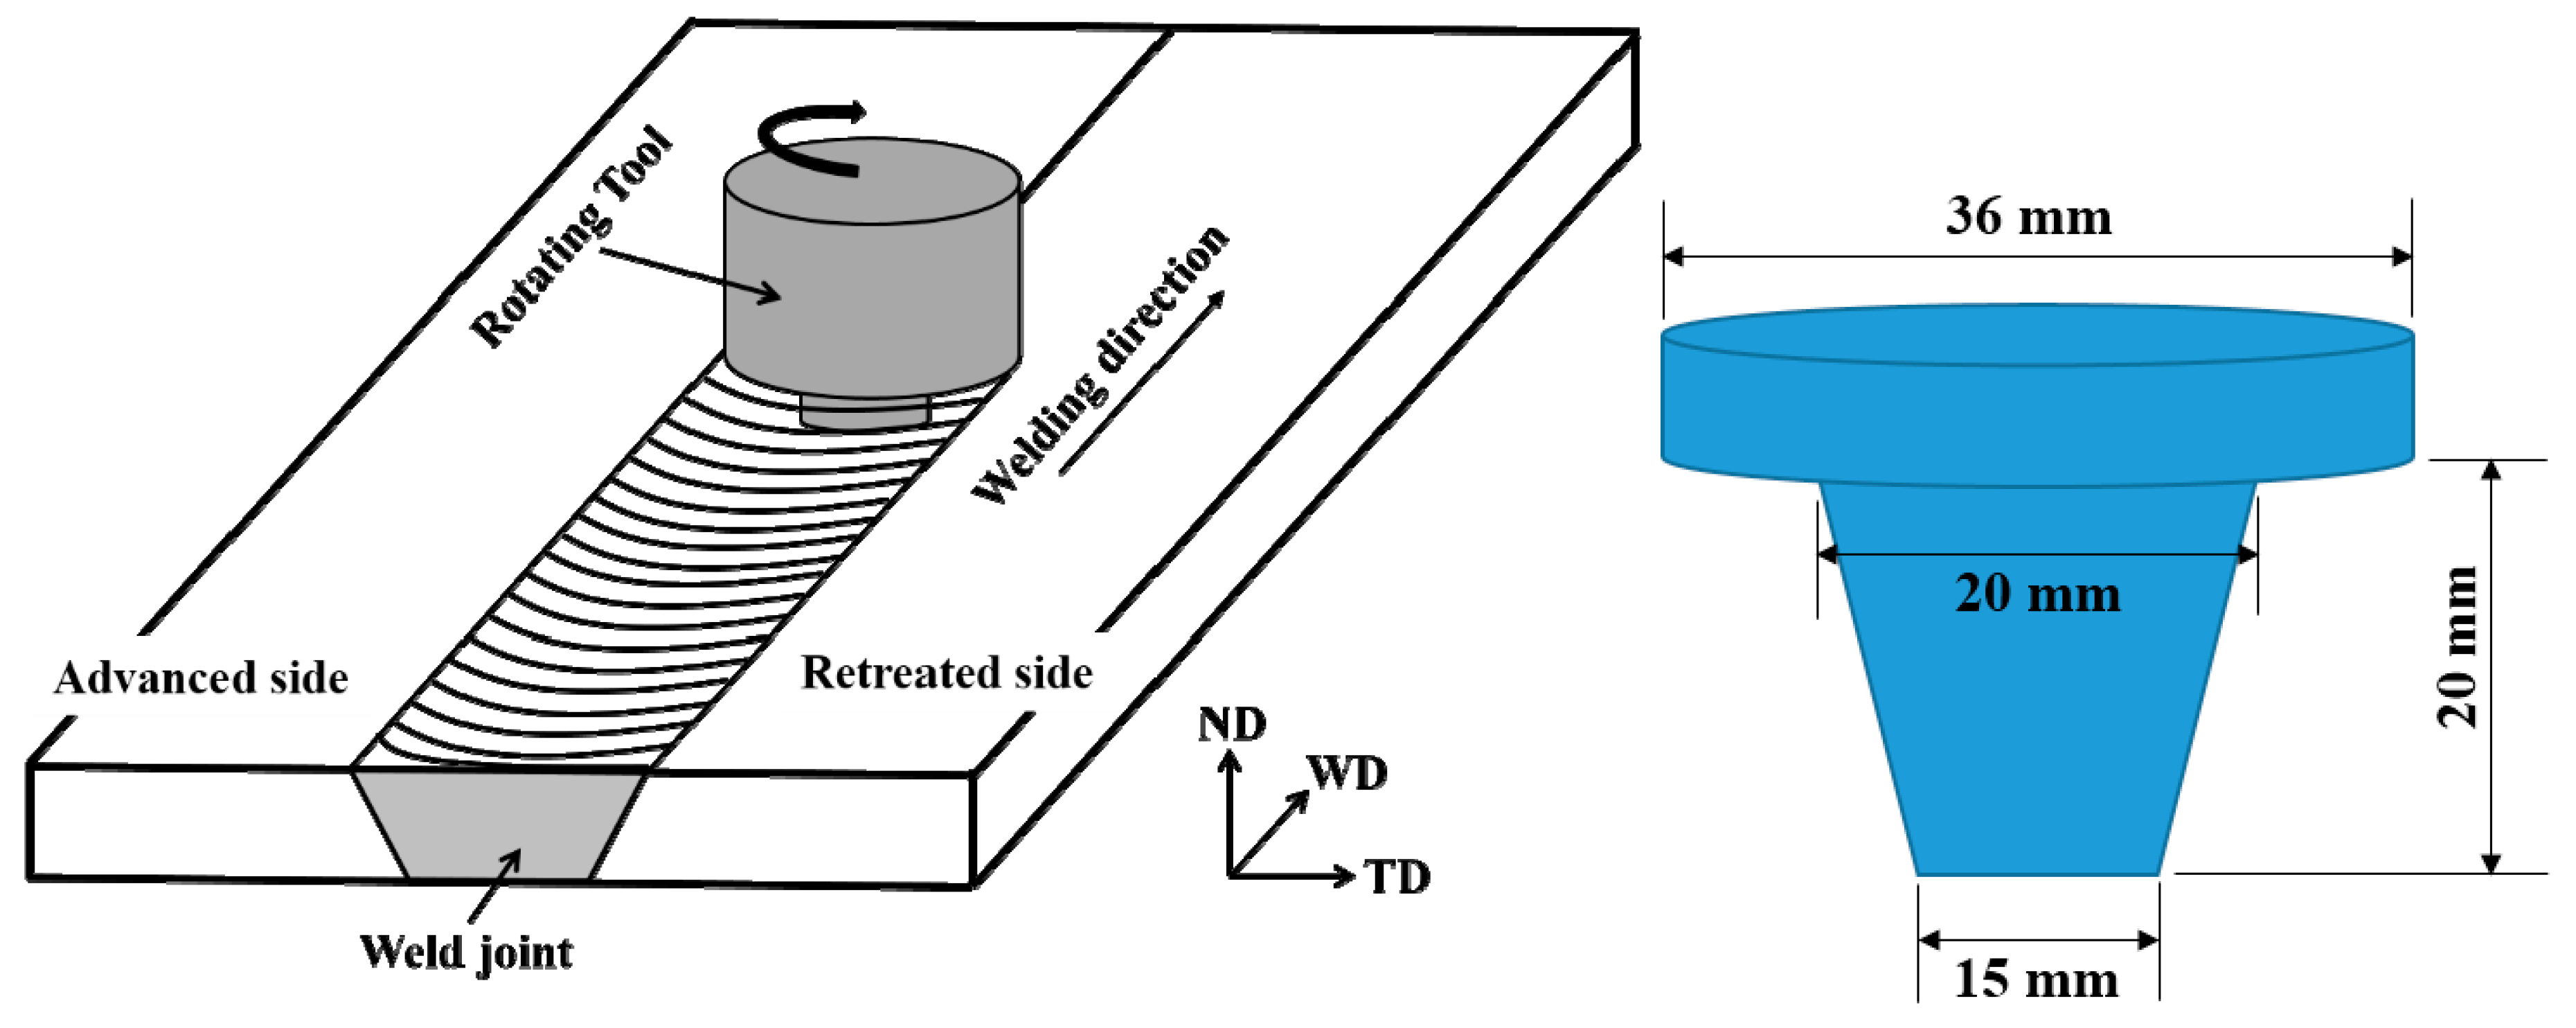
Figure 2.
Schematic of three layers for tensile strength and vickers hardness, and electrical test and three locations (a–c) for the electron back-scattered diffraction (EBSD) test.
Figure 2.
Schematic of three layers for tensile strength and vickers hardness, and electrical test and three locations (a–c) for the electron back-scattered diffraction (EBSD) test.
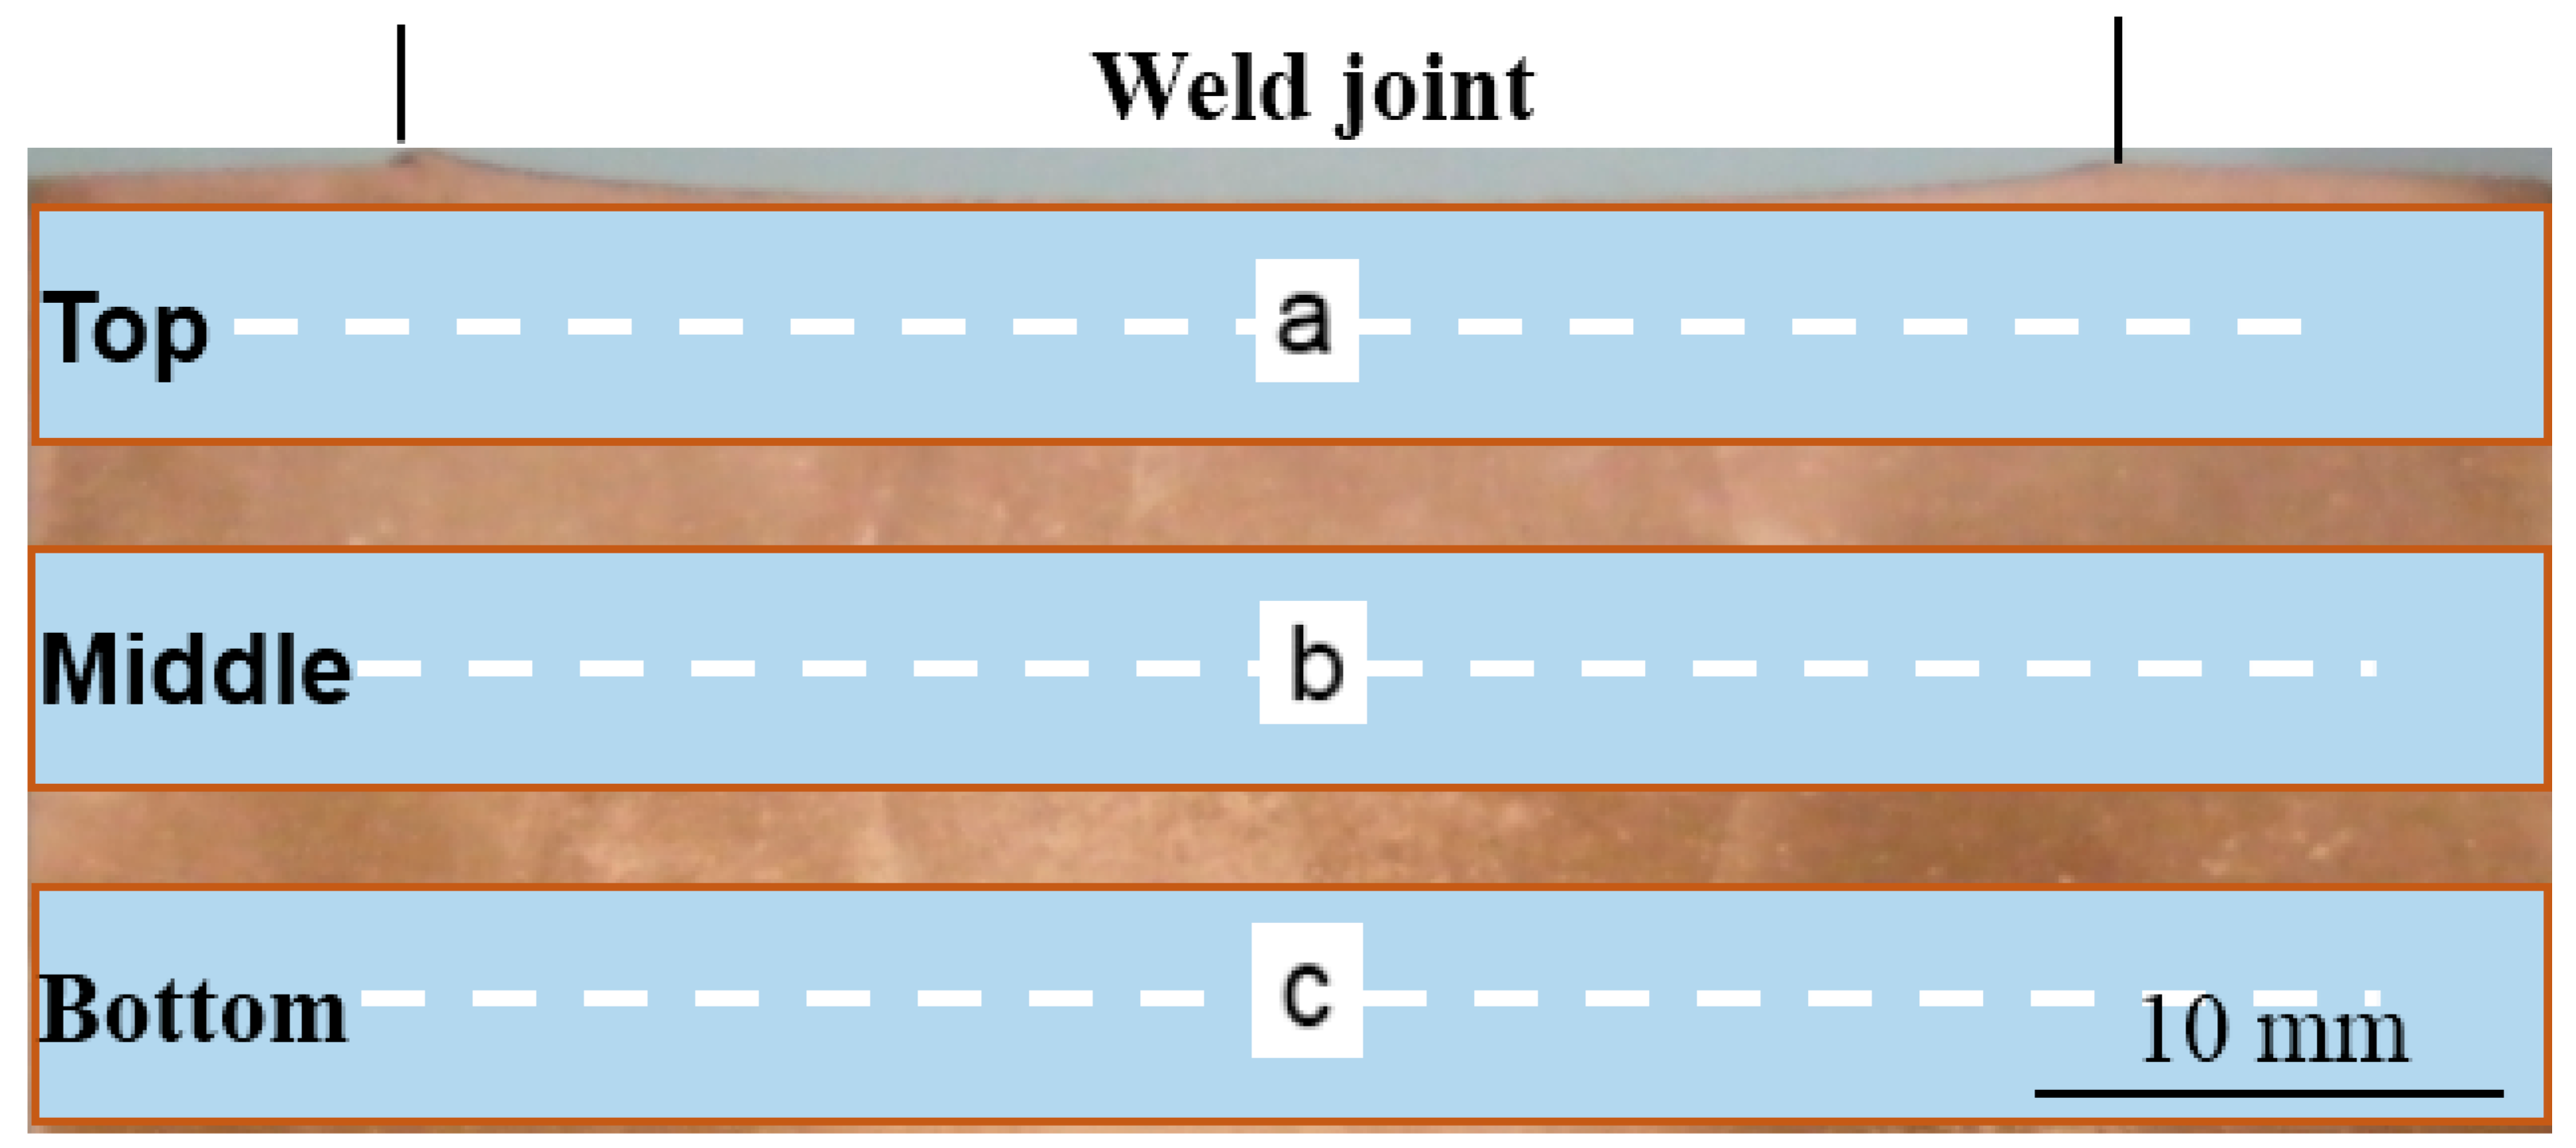
Figure 3.
Picture of the cross sections of the friction stir-welded CuCrZr joints, showing the different weld zone regions from base metal (BM) to nugget zone (NZ).
Figure 3.
Picture of the cross sections of the friction stir-welded CuCrZr joints, showing the different weld zone regions from base metal (BM) to nugget zone (NZ).

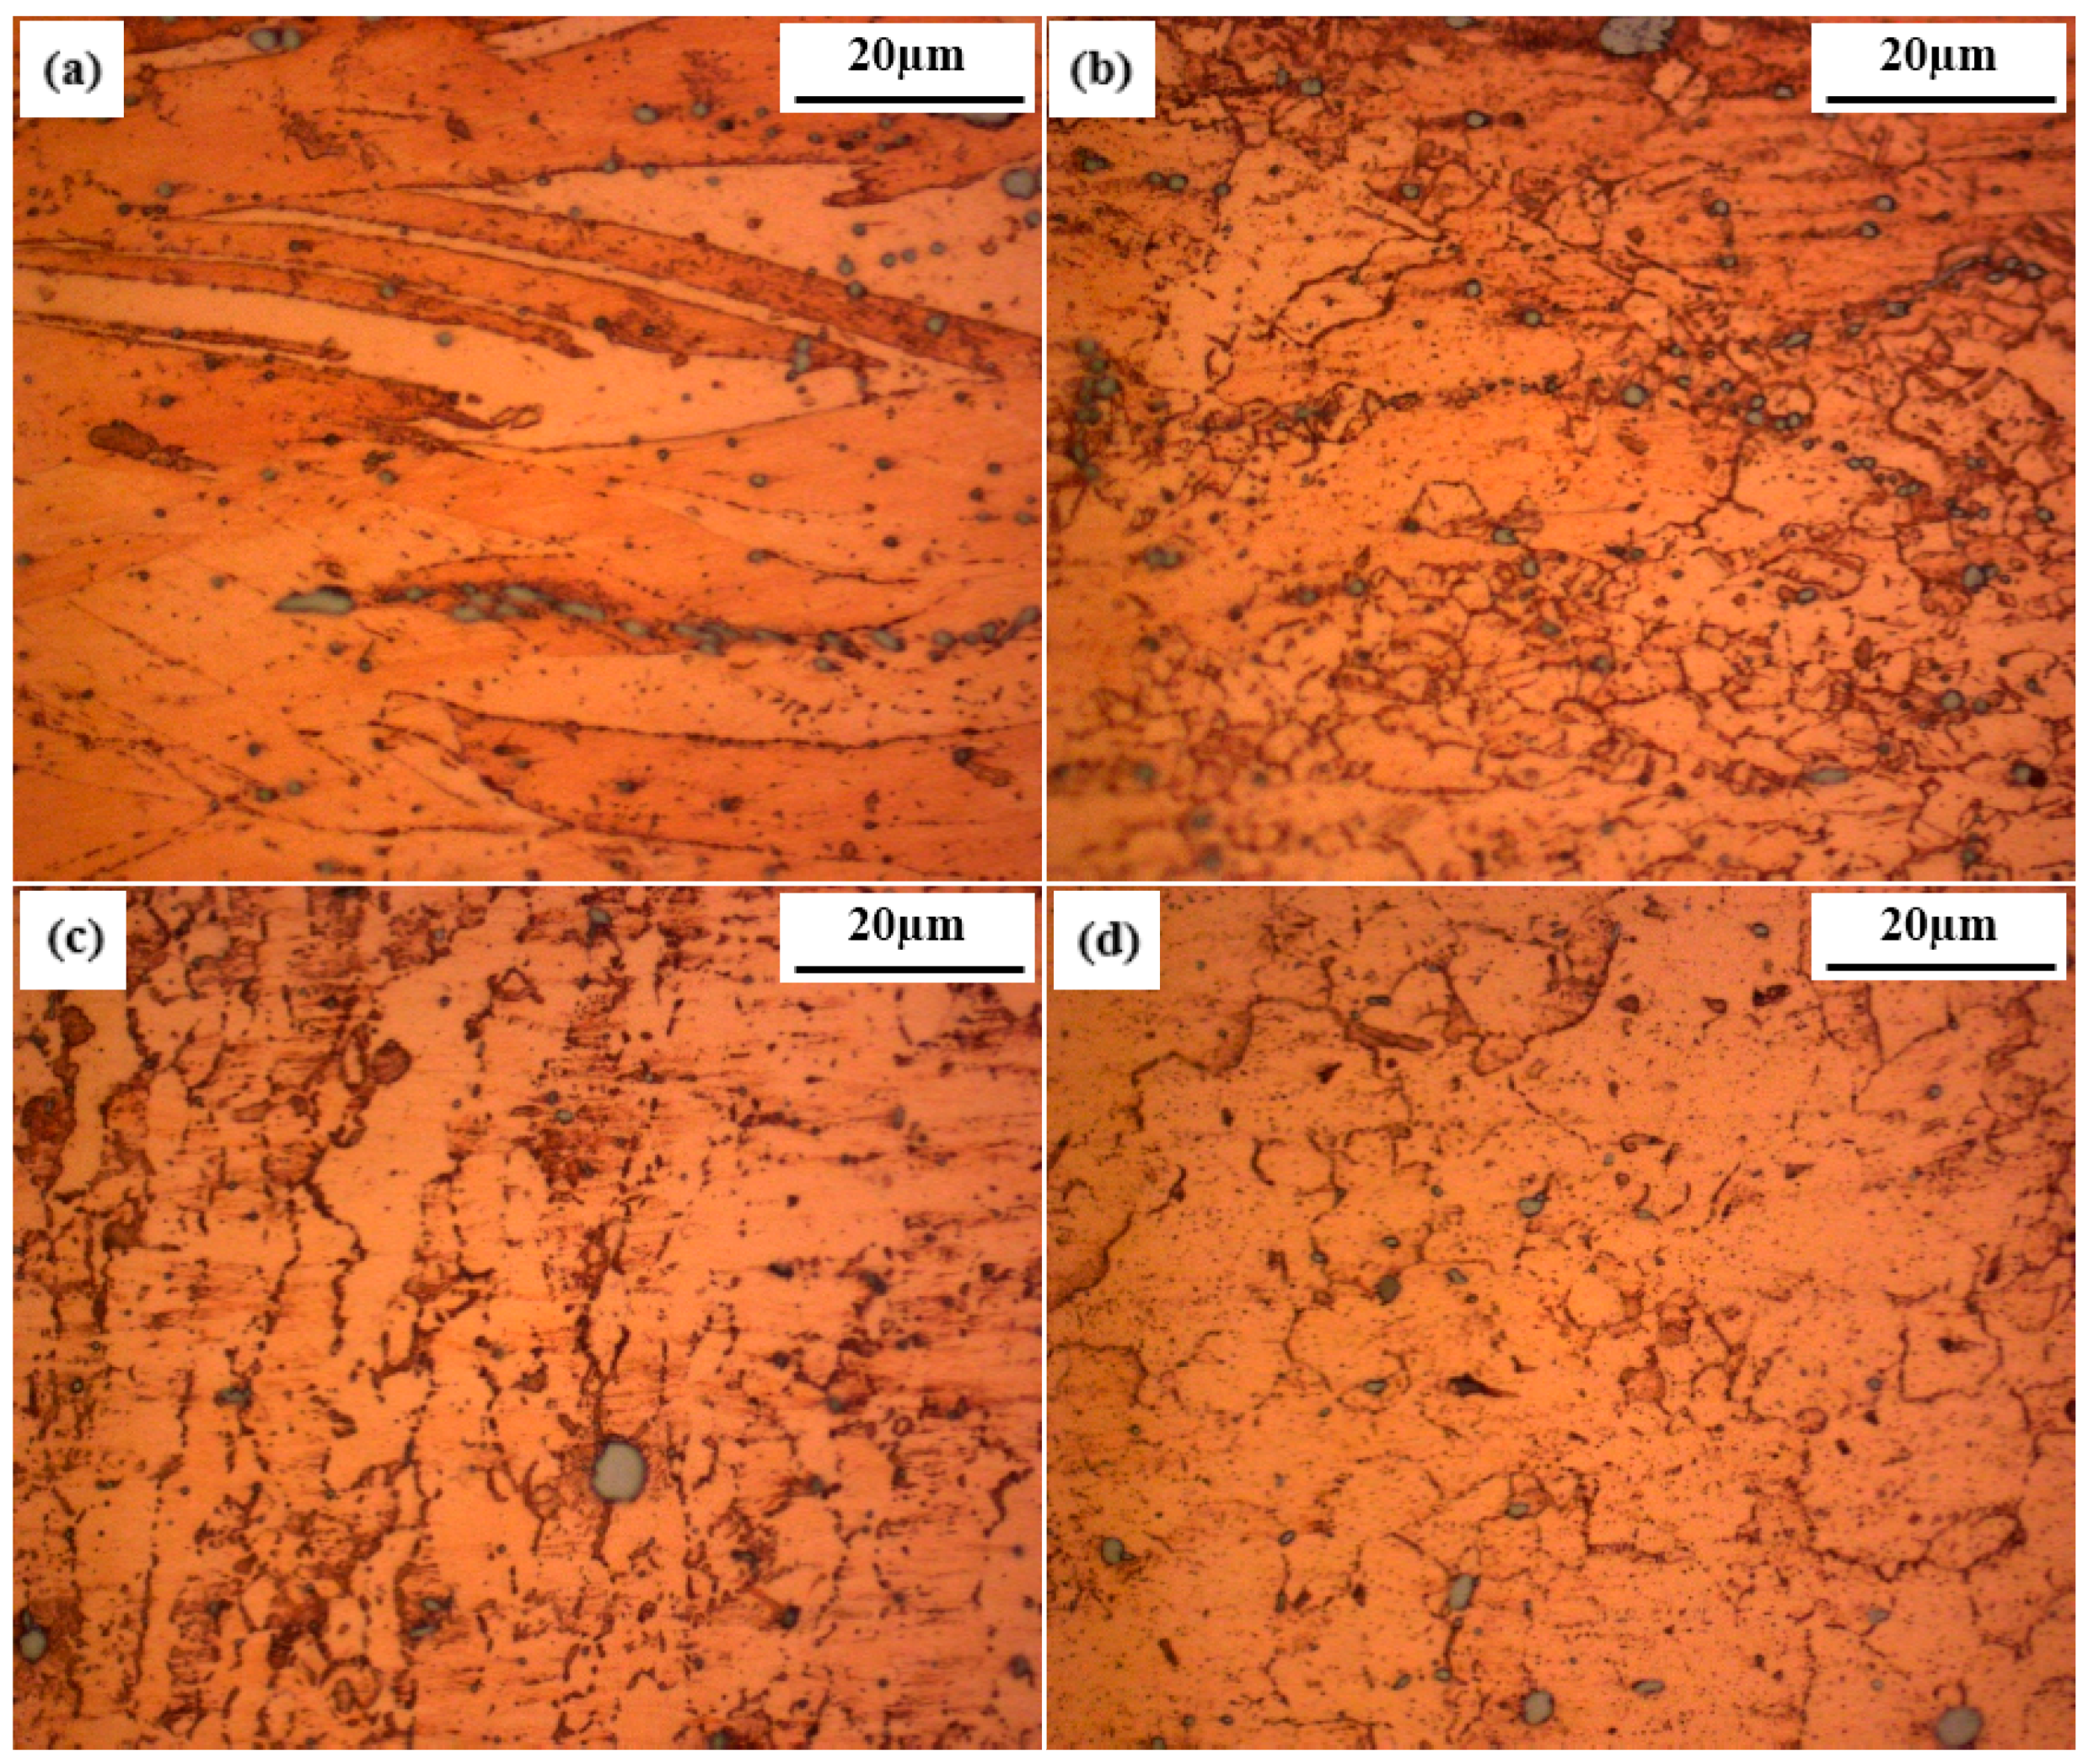
Figure 4.
Microstructures of friction stir-welded CuCrZr alloy joints. (a) Base metal (BM), (b) heat affected zone (HAZ), (c) thermo-mechanically affected zone (TMAZ), and (d) nugget zone (NZ).
Figure 4.
Microstructures of friction stir-welded CuCrZr alloy joints. (a) Base metal (BM), (b) heat affected zone (HAZ), (c) thermo-mechanically affected zone (TMAZ), and (d) nugget zone (NZ).

Figure 5.
Scanning electron microscopy (SEM-EDX) mapping analysis of CuCrZr alloy. (a) Micrograph of the surface revealing the presence of intermetallic particles, (b) Copper, (c) Chromium, (d) Zirconium.
Figure 5.
Scanning electron microscopy (SEM-EDX) mapping analysis of CuCrZr alloy. (a) Micrograph of the surface revealing the presence of intermetallic particles, (b) Copper, (c) Chromium, (d) Zirconium.
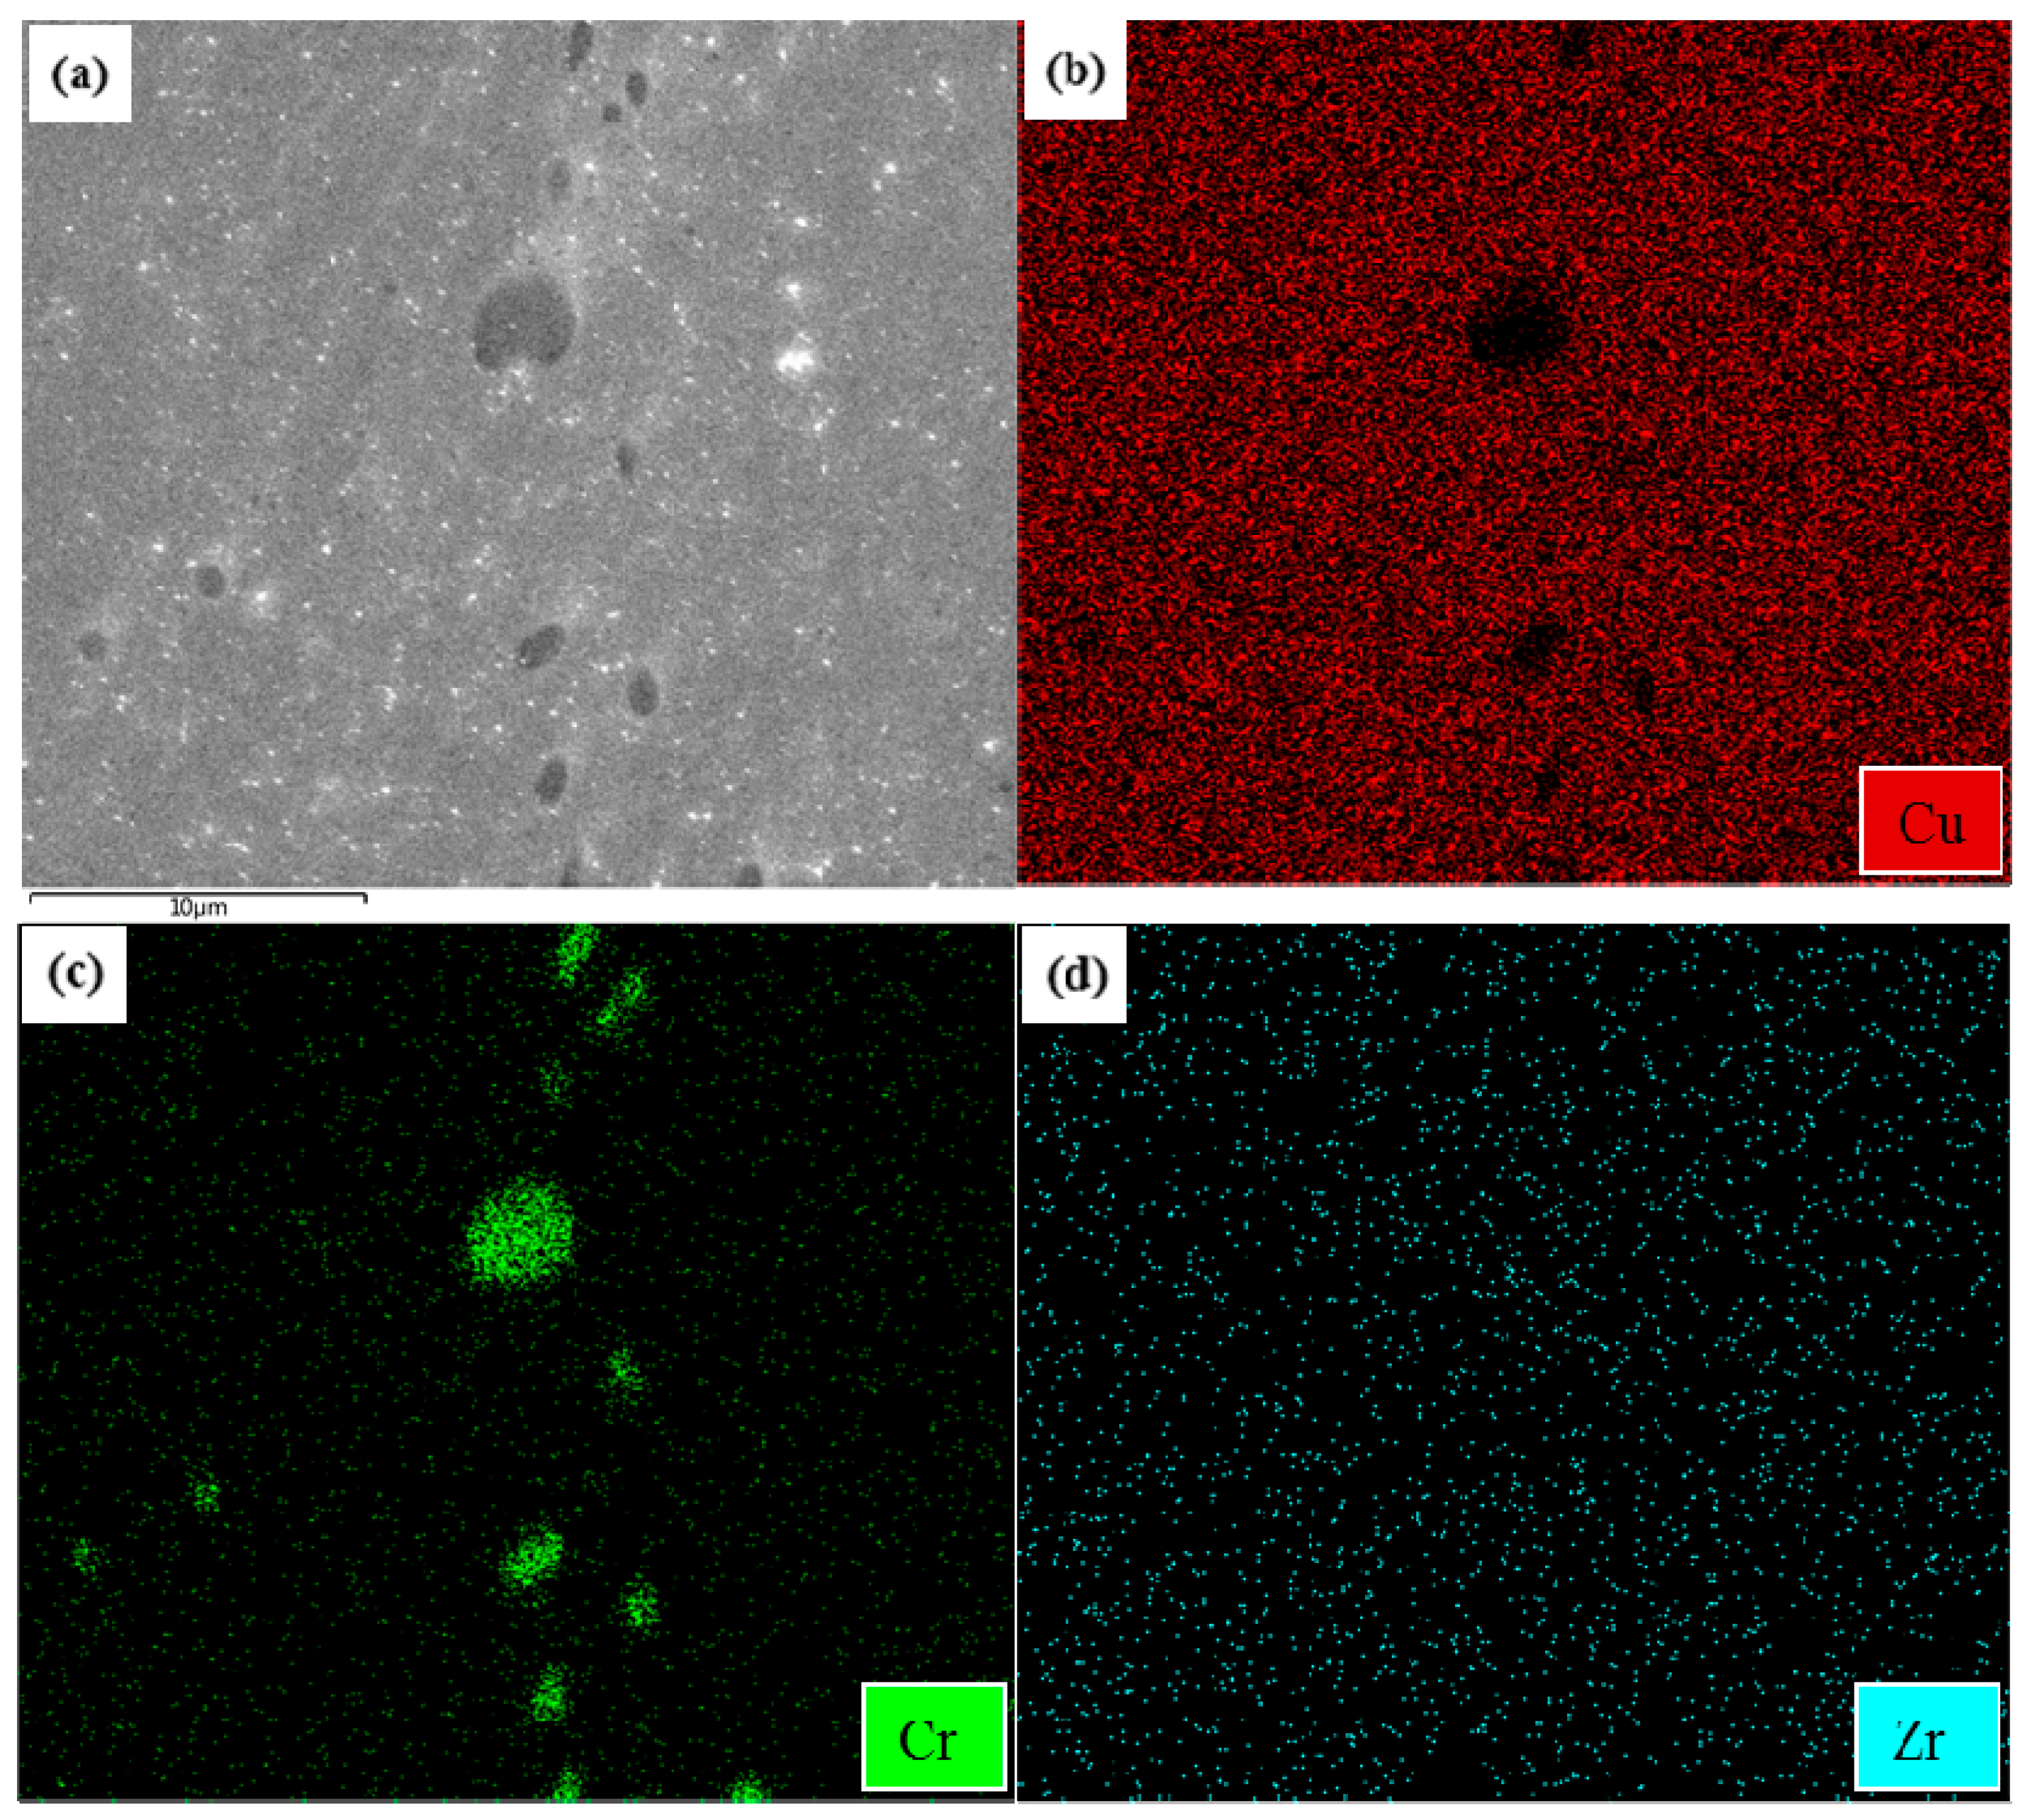
Figure 6.
EBSD reconstructed microstructure: (a) Top of NZ; (b) Middle of NZ; (c) Bottom of NZ.
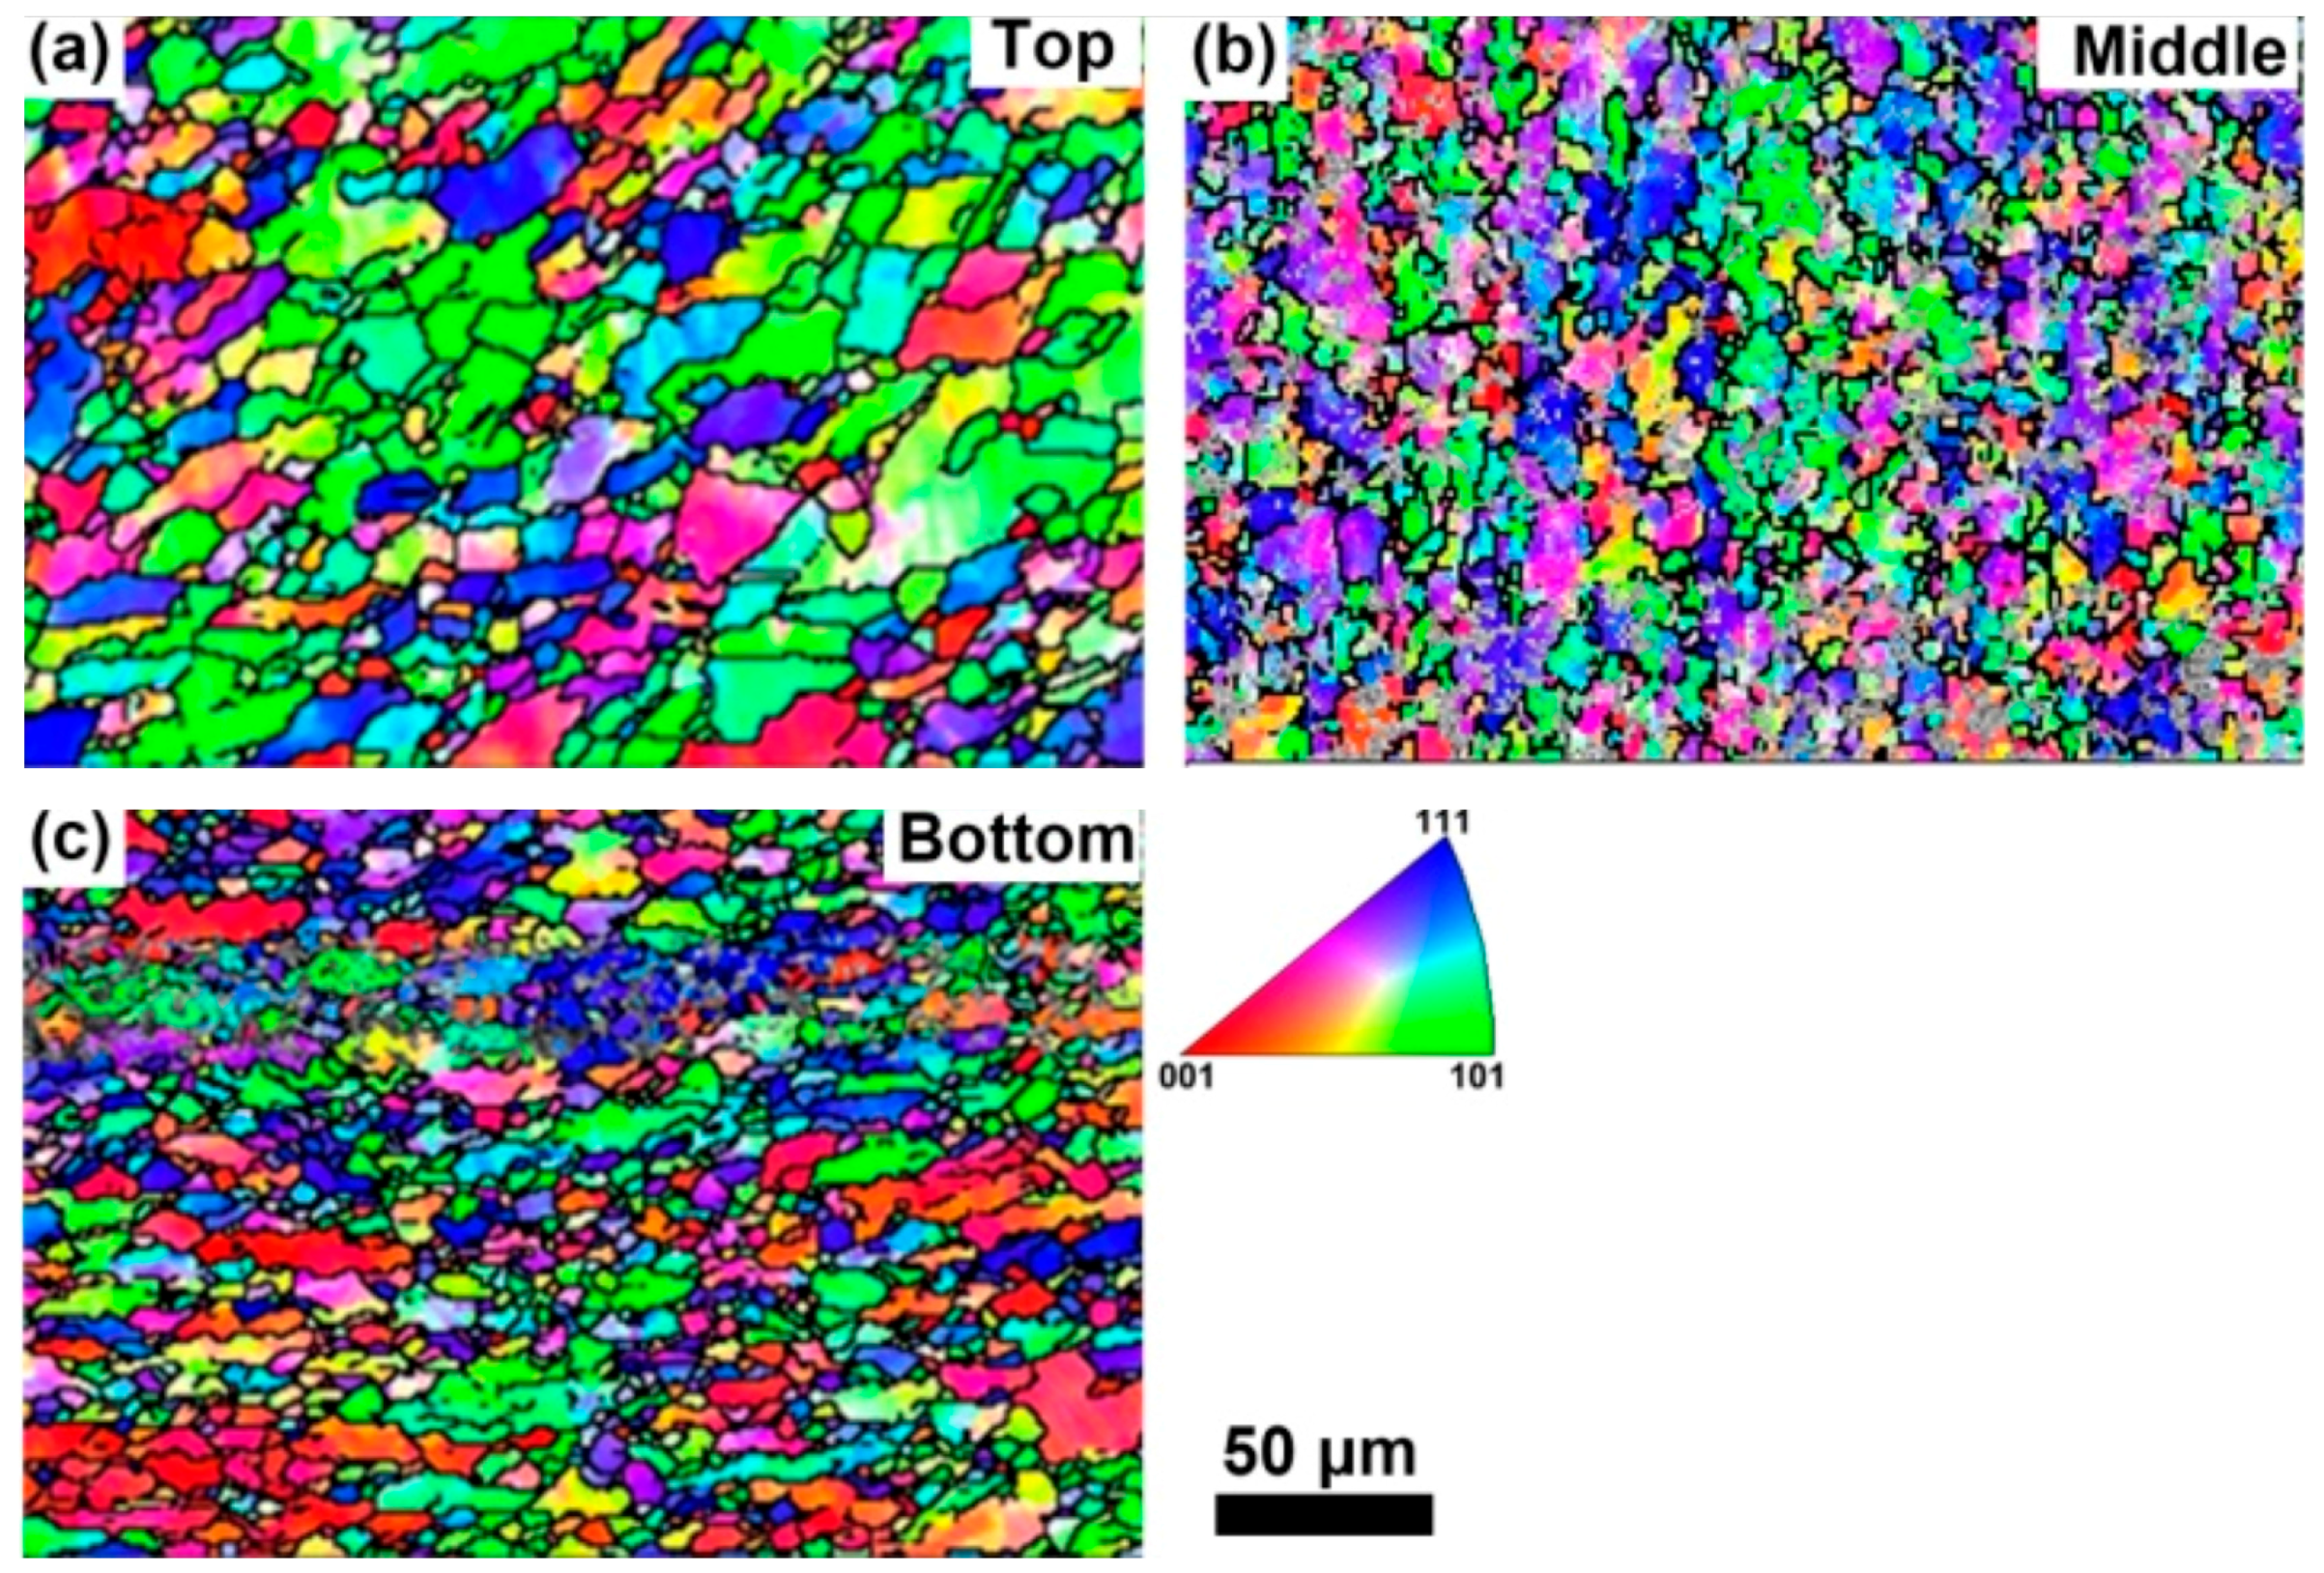
Figure 7.
TEM micrographs of (a) the BM showing precipitates and exhibiting Moiré fringes; (b) the corresponding SAED pattern of BM; (c) shows that the small recrystallized grains of the NZ contain sub-grains; and (d) no precipitates showing in fine grains of NZ and the corresponding SAED pattern.
Figure 7.
TEM micrographs of (a) the BM showing precipitates and exhibiting Moiré fringes; (b) the corresponding SAED pattern of BM; (c) shows that the small recrystallized grains of the NZ contain sub-grains; and (d) no precipitates showing in fine grains of NZ and the corresponding SAED pattern.

Figure 8.
Typical hardness profiles across the weld of an friction stir welding (FSW) copper–chromium–zirconium alloy. A: Nugget zone (NZ); B: transition zone: thermo-mechanically affected zone (TMAZ) and Heat affected zone (HAZ); and C: base metal (BM).
Figure 8.
Typical hardness profiles across the weld of an friction stir welding (FSW) copper–chromium–zirconium alloy. A: Nugget zone (NZ); B: transition zone: thermo-mechanically affected zone (TMAZ) and Heat affected zone (HAZ); and C: base metal (BM).

Figure 9.
Typical fracture location of the FSW CuCrZr alloy joints.

Figure 10.
Transverse tensile properties of weld nugget in FSW CuCrZr alloy at room-temperature.
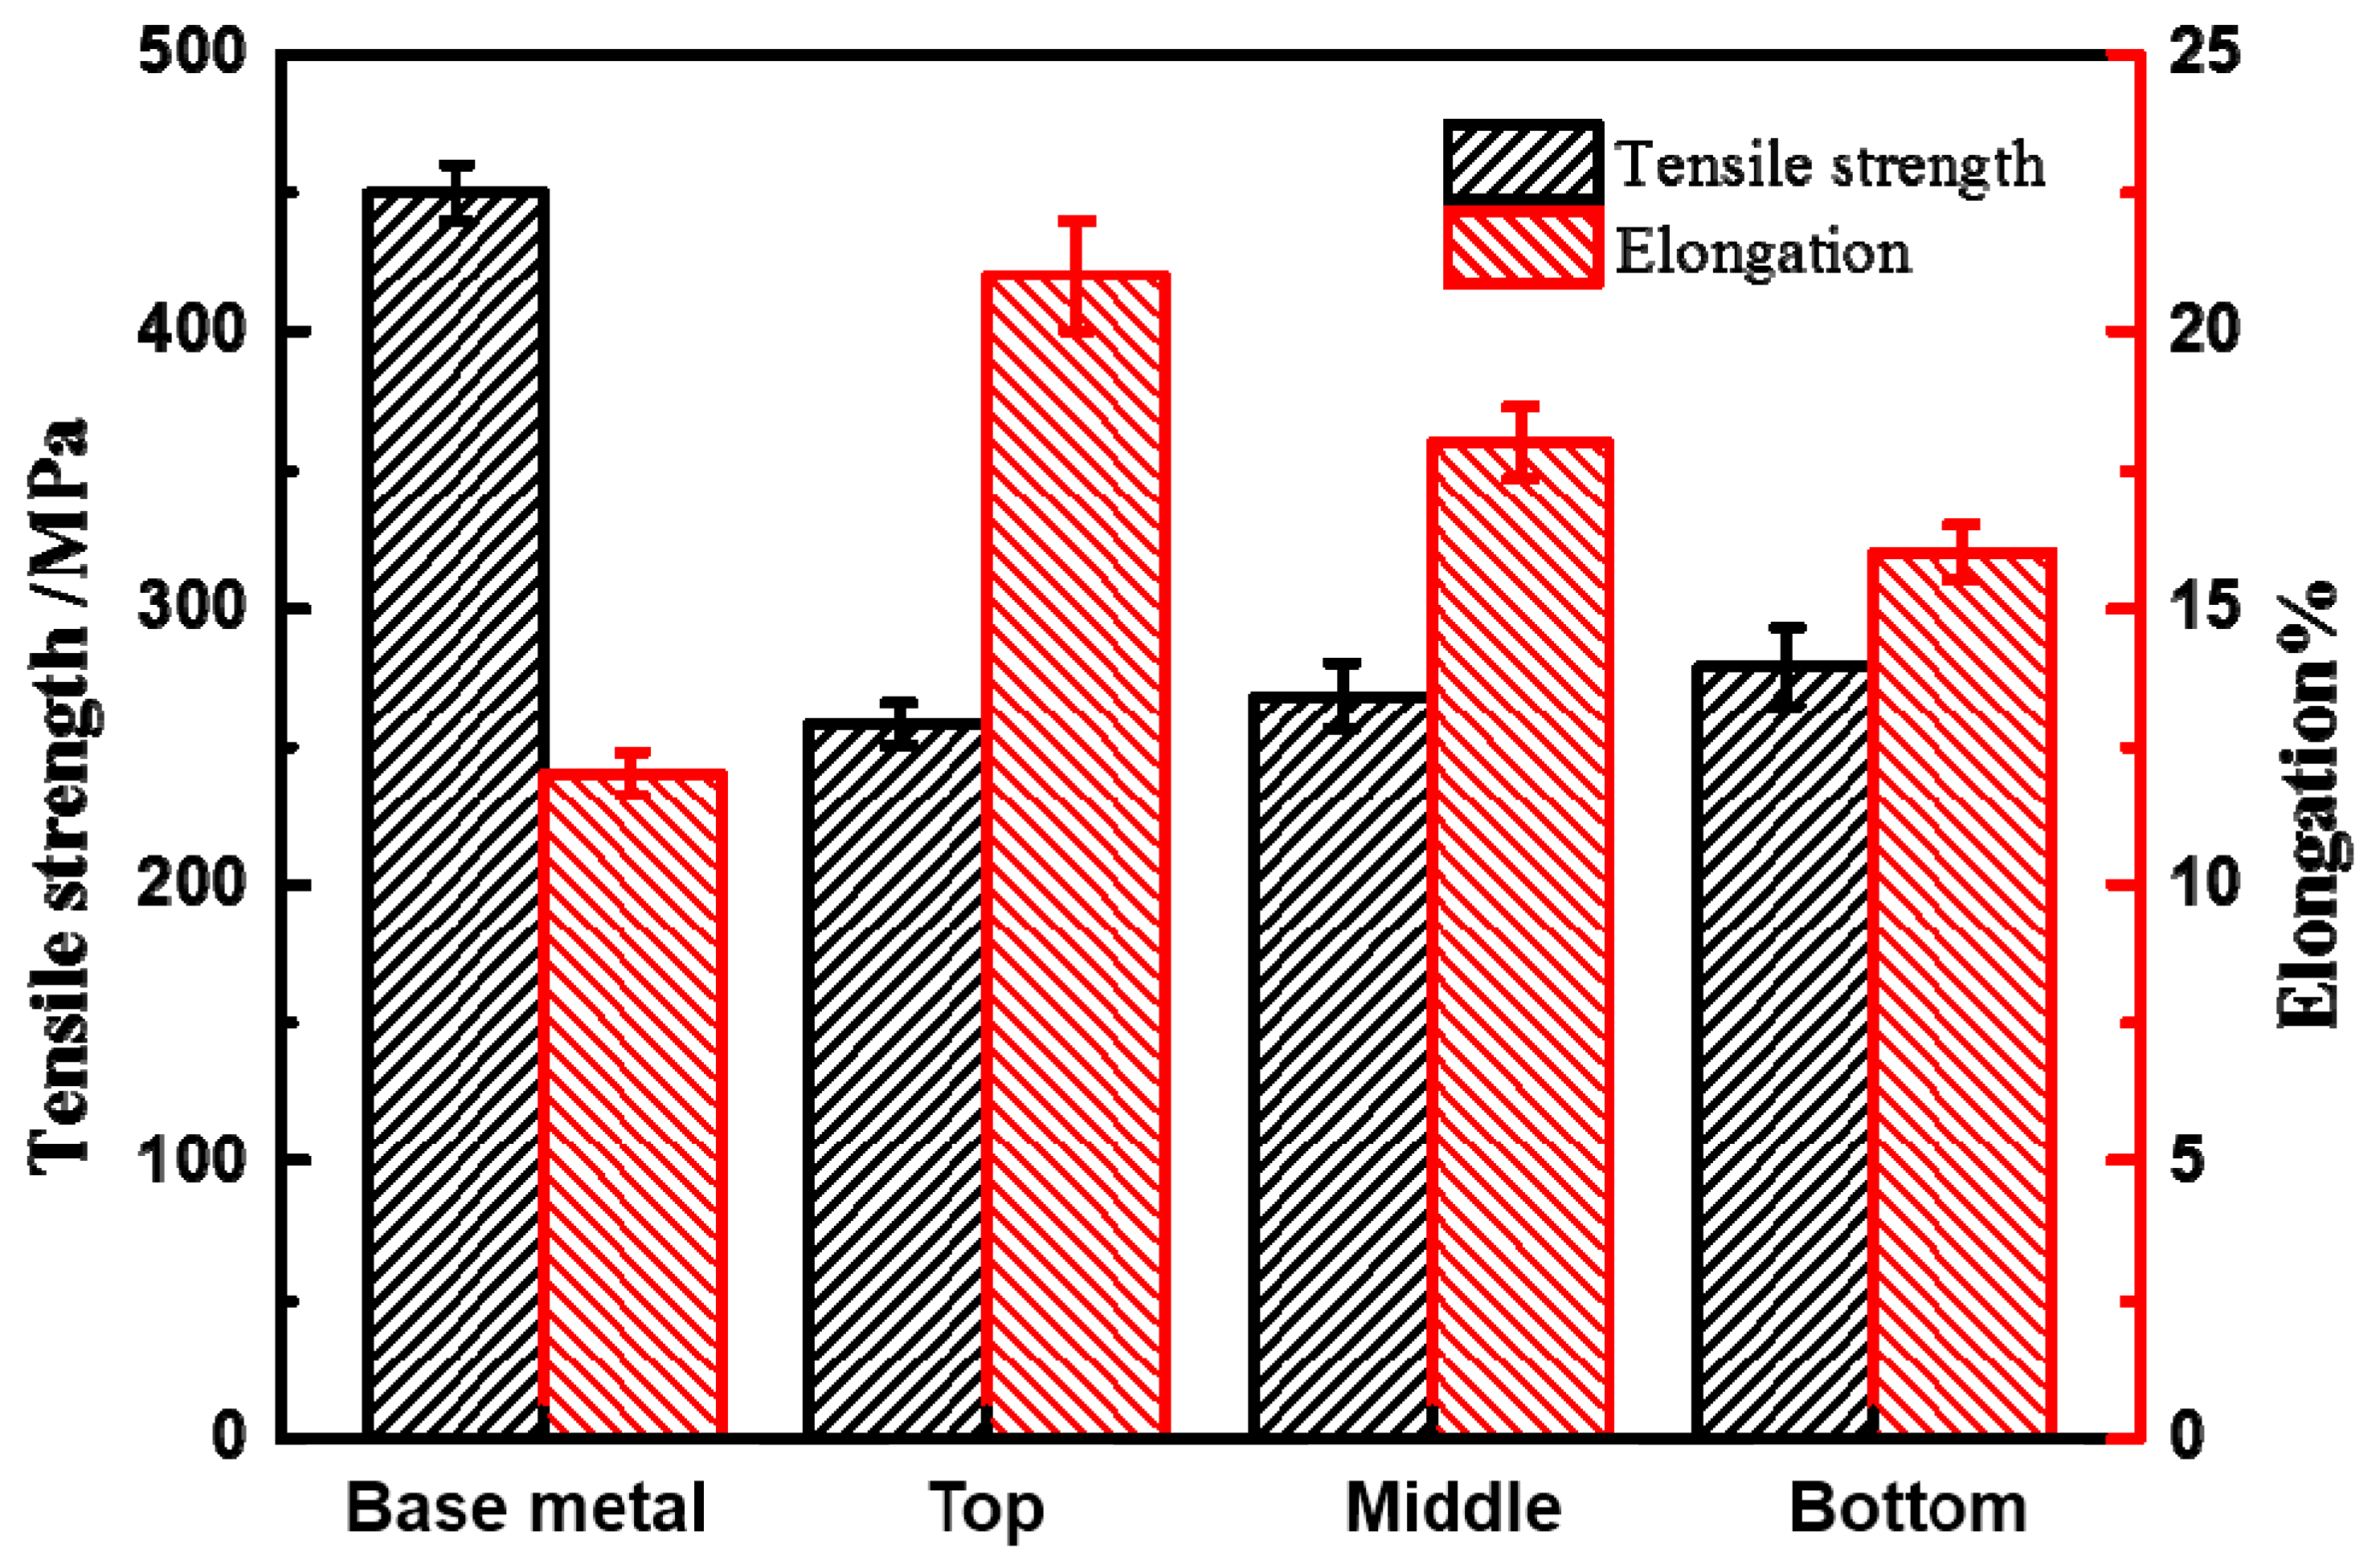
Figure 11.
SEM images of the fracture appearance: (a) base metal (BM); and (b) as-welded alloy.
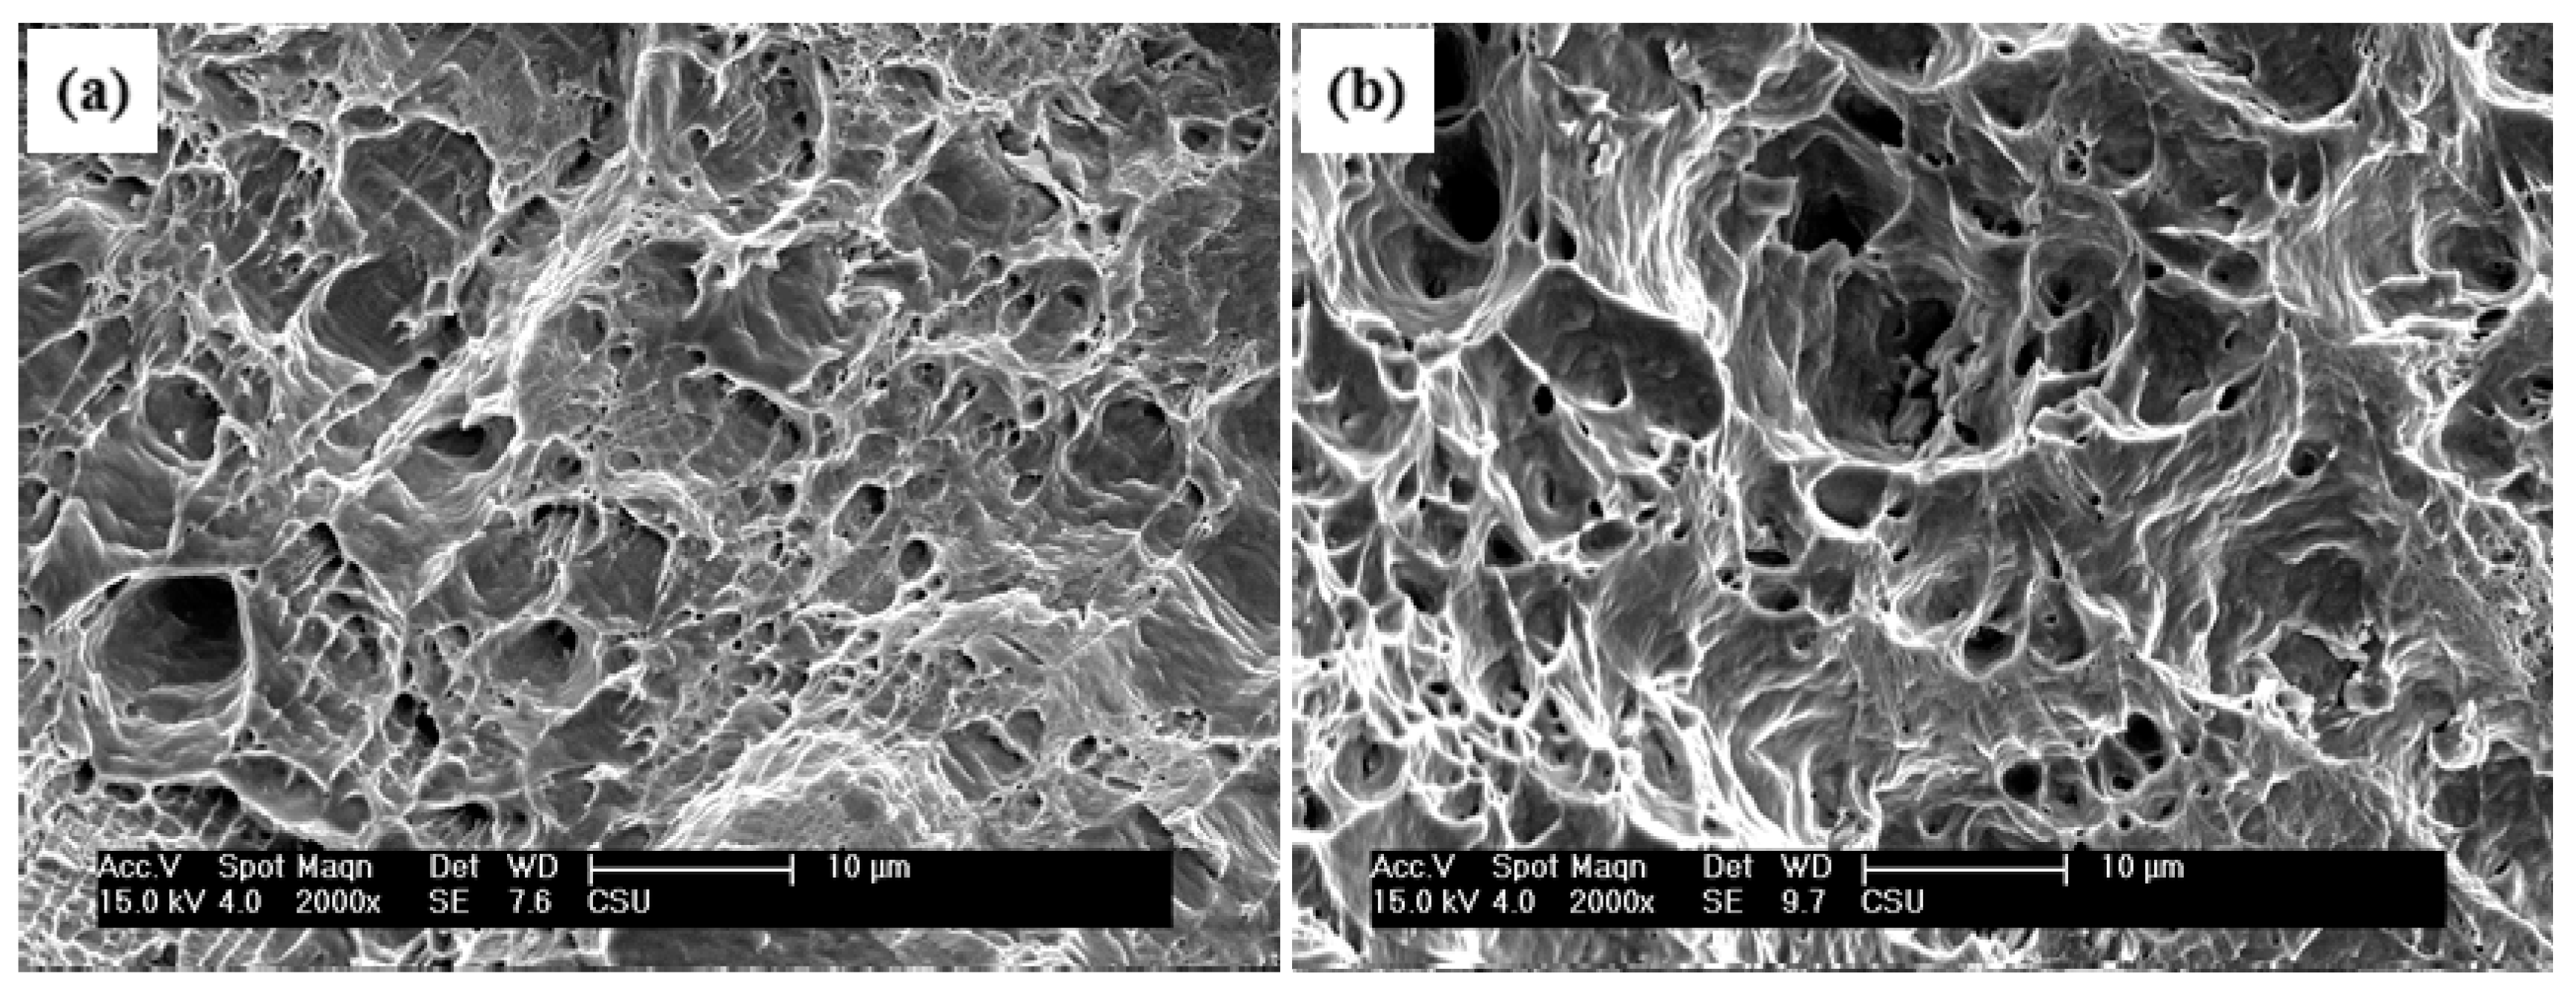
Figure 12.
Electrical conductivity of FSW CuCrZr joints: A: nugget zone (NZ); B: transition zone: Thermo-mechanically affected zone (TMAZ) and heat affected zone (HAZ); and C: base metal (BM).
Figure 12.
Electrical conductivity of FSW CuCrZr joints: A: nugget zone (NZ); B: transition zone: Thermo-mechanically affected zone (TMAZ) and heat affected zone (HAZ); and C: base metal (BM).

Table 1.
The chemical compositions of the copper-chromium-zirconium alloy plate.
| Cu | Cr | Zr | Al | Mg | Fe | Si | Pb |
|---|---|---|---|---|---|---|---|
| Bal. | 0.8 | 0.3 | 0.25 | 0.1 | 0.09 | 0.04 | 0.02 |
© 2017 by the authors. Licensee MDPI, Basel, Switzerland. This article is an open access article distributed under the terms and conditions of the Creative Commons Attribution (CC BY) license (http://creativecommons.org/licenses/by/4.0/).
Share and Cite
MDPI and ACS Style
Lai, R.; He, D.; He, G.; Lin, J.; Sun, Y. Study of the Microstructure Evolution and Properties Response of a Friction-Stir-Welded Copper-Chromium-Zirconium Alloy. Metals 2017, 7, 381. https://doi.org/10.3390/met7090381
AMA Style
Lai R, He D, He G, Lin J, Sun Y. Study of the Microstructure Evolution and Properties Response of a Friction-Stir-Welded Copper-Chromium-Zirconium Alloy. Metals. 2017; 7(9):381. https://doi.org/10.3390/met7090381
Chicago/Turabian StyleLai, Ruilin, Diqiu He, Guoai He, Junyuan Lin, and Youqing Sun. 2017. "Study of the Microstructure Evolution and Properties Response of a Friction-Stir-Welded Copper-Chromium-Zirconium Alloy" Metals 7, no. 9: 381. https://doi.org/10.3390/met7090381
Note that from the first issue of 2016, this journal uses article numbers instead of page numbers. See further details here.