The α → ω Transformation in Titanium-Cobalt Alloys under High-Pressure Torsion
by
Askar R. Kilmametov
1, 
Yulia Ivanisenko
1,
Boris B. Straumal
1,2,3,*, 
Alena S. Gornakova
2,
Andrey A. Mazilkin
1,2 and
Horst Hahn
1 1
Karlsruhe Institute of Technology (KIT), Institute of Nanotechnology, Hermann-von-Helmholtz-Platz 1, 76344 Eggenstein-Leopoldshafen, Germany
2
Institute of Solid State Physics, Russian Academy of Sciences, Ac. Ossipyan str. 2, Chernogolovka 142432, Russia
3
National University of Science and Technology (MISIS), Leninskii prosp. 4, Moscow 119049, Russia
*
Author to whom correspondence should be addressed.
Metals 2018, 8(1), 1; https://doi.org/10.3390/met8010001
Submission received: 10 November 2017
/
Revised: 10 December 2017
/
Accepted: 18 December 2017
/
Published: 21 December 2017
(This article belongs to the Special Issue Deformation-Induced Phase Transformations in Steels and Non-Ferrous Alloys)
Abstract
:The pressure influence on the α → ω transformation in Ti–Co alloys has been studied during high pressure torsion (HPT). The α → ω allotropic transformation takes place at high pressures in titanium, zirconium and hafnium as well as in their alloys. The transition pressure, the ability of high pressure ω-phase to retain after pressure release, and the pressure interval where α and ω phases coexist depend on the conditions of high-pressure treatment. During HPT in Bridgeman anvils, the high pressure is combined with shear strain. The presence of shear strain as well as Co addition to Ti decreases the onset of the α → ω transition from 10.5 GPa (under quasi-hydrostatic conditions) to about 3.5 GPa. The portion of ω-phase after HPT at 7 GPa increases in the following sequence: pure Ti → Ti–2 wt % Co → Ti–4 wt % Co → Ti–4 wt % Fe.
1. Introduction
Titanium and titanium alloys are attractive materials for various applications due to their high strength-to-density ratio, excellent corrosion resistance, and good biocompatibility [1]. The structure and properties of titanium alloys can be tailored by using the combination of alloying, as well as thermal and mechanical treatments [1]. They are especially effective because titanium has different allotropic modifications. The low temperature α-titanium crystallizes in the hexagonal close packed (hcp) crystal structure (space group P63/mmc, Wyckoff positions 2c) with the ratio of the lattice parameters c/a = 1.58. Above 882 °C, the body centered cubic (bcc) βTi is stable, which crystallizes in the space group Im3m, where the Ti atoms occupy the Wyckoff positions 2a. Titanium also possesses a high pressure ω-phase. The crystal structure of ωTi is hexagonal (space group P6/mmm), and the Ti atoms occupy the Wyckoff positions 1a and 2d. The retention of the ω-phase after pressure release at ambient conditions made possible the studies of this metastable state [2,3]. Metastable ω-phase can be achieved without high pressure in certain Ti-based alloys as well. It depends on the alloying content, quenching rates or isothermal annealing conditions [4,5].
The formation of ω-phase in Ti is facilitated by its specific electronic structure, namely by the occupied narrow d-band and the broad sp-bands. Under the applied pressure, the sp-bands rise faster in energy, causing electrons to be transferred into d-band [6]. This process is known as s-d transition and governs the structural properties of the transition metals. The β-phase stabilizing elements (e.g., Nb, Cr, Zr, Fe, Ni, Cu, and Co) are mostly transition ones and rich in d-electrons. Thus, this type of alloying increases the d-electron concentration and can, therefore, provide an additional driving force for the α → ω transformation. In other words, the alloying with β-phase stabilizers can be considered as the equivalent of pressure for the α → ω phase transformation. Hennig [7] concluded from ab-initio calculations that the alloying with β-stabilizing elements such as V, Mo, Fe or Ta should lead to a decrease in the onset pressure of the α → ω transformation. The combined effect of pressure application and β-stabilizer alloying was experimentally studied only in a limited number of works [8,9,10], using Zr–Nb, Ti–Nb and Ti–V alloys. As a result, the ω-formation pressure first decreases with the increase in β-stabilizer concentration, and then (after a certain value of β-stabilizer content) rapidly grows up with further increase in solute concentration.
Severe plastic deformation (SPD) not only decreases the grain size towards a few hundreds of nanometers [11]. SPD also induces various phase transformations [12] such as formation [13,14,15] or decomposition [16,17,18,19,20] of supersaturated solid solution, dissolution of particles of a second solid phase [21,22,23,24,25,26], amorphization [27,28,29,30,31,32] and nanocrystallization [33,34,35]. Among this variety, very interesting are the phase transformations with formation of high-pressure phases. The α → ω allotropic transformation takes place at high pressures in titanium, zirconium and hafnium as well as in their alloys [3,4,5,6,7,8,9,10]. The transition pressure, the ability of high pressure ω-phase to retain after pressure release, and the pressure interval where α- and ω-phases coexist depend on the conditions of high-pressure treatment [2,36,37,38,39,40,41,42,43,44,45,46,47,48]. A number of SPD techniques include the application of high pressure, especially the high pressure torsion (HPT) one. It is known that the combination of shear strain with high pressure (i.e., in case of HPT) decreases the onset of the α → ω transition in comparison with quasi-hydrostatic conditions [2,49,50,51]. The goal of this work is to study how the Co addition to Ti influences formation of the ω-phase under HPT.
2. Experimental
In this work, we studied titanium-cobalt alloys with 2 and 4 wt % Co. The alloys were produced from the high purity components (99.9% Ti and 99.97% Co) using the inductive melting in high vacuum. The melt was poured in vacuum into the water-cooled cylindrical copper crucible of 10 mm diameter. The 0.7 mm thick disks were cut from the as-cast block using the spark erosion, ground, and chemically etched. These disks were individually sealed in the evacuated silica ampoules with residual pressure of 4 × 10⁻⁴ Pa. The ampoules with samples inside have been annealed at T = 940 °C, 79 h (Ti–2 wt % Co alloy) and T = 800 °C, 91 h (Ti–4 wt % Co alloy) and then quenched in water at room temperature (without breaking the ampoules). The annealing temperatures are in the one-phase β-area of the Ti–Co phase diagram. Afterwards, the thin disks were deformed by HPT in a Bridgman anvil type unit (at room temperature, up to 7 GPa, with the rate of 1 rotation-per-minute for five rotations). One sample was pressed at 7 GPa during 5 min without anvil rotations. Five minutes is the time equal to the duration of HPT treatment for five rotations at 1 rpm. All samples for further investigations were cut from the deformed disks at a distance of r = 3 mm from the sample center.
HPT was performed using a custom built computer-controlled device manufactured by W. Klement GmbH, Lang, Austria. The HPT machine permits to measure the torsion torque during HPT. The torsion torque increased during 1–2 anvil rotations in all alloys and pure Ti and then remained almost unchanged. In other words, it reached a steady state, as was observed previously in other alloys [16,17,18,19,20,51,52]). The central part (about 3 mm in diameter) of each disk after HPT was excluded from further investigations (since it is low-deformed).
X-ray diffraction (XRD) patterns were obtained in the Bragg–Brentano geometry in a powder diffractometer Philips X’Pert (PANalytical, Amsterdam, The Netherlands) with Cu-Kα radiation. The Pseudo-Voigt function was used for fitting of XRD peak profiles. Lattice parameters were evaluated by the Fityk open source [53] software using a Rietveld-like whole profile refinement. Relative amount of α, β and ω phases were estimated based on the comparison of the integrated intensities. Pure polycrystalline titanium was used as reference. SEM studies have been done using the Tescan Vega TS5130 MM microscope (TESCAN, Brno, Czech Republic) equipped with the LINK energy-dispersive X-ray spectrometer (Oxford Instruments, Oxford, UK). Transmission electron microscopy (TEM) and high resolution TEM (HRTEM) observations have been made by using an aberration corrected TITAN 80–300 transmission electron microscope. The cross section TEM and HRTEM specimens were cut from HPT discs at a 3 mm distance from the disc center. They were further thinned in a FEI Strata 400S dual beam facility. Radial intensity distribution in diffraction patterns was calculated using the Process Diffraction open source [54] software package.
3. Results
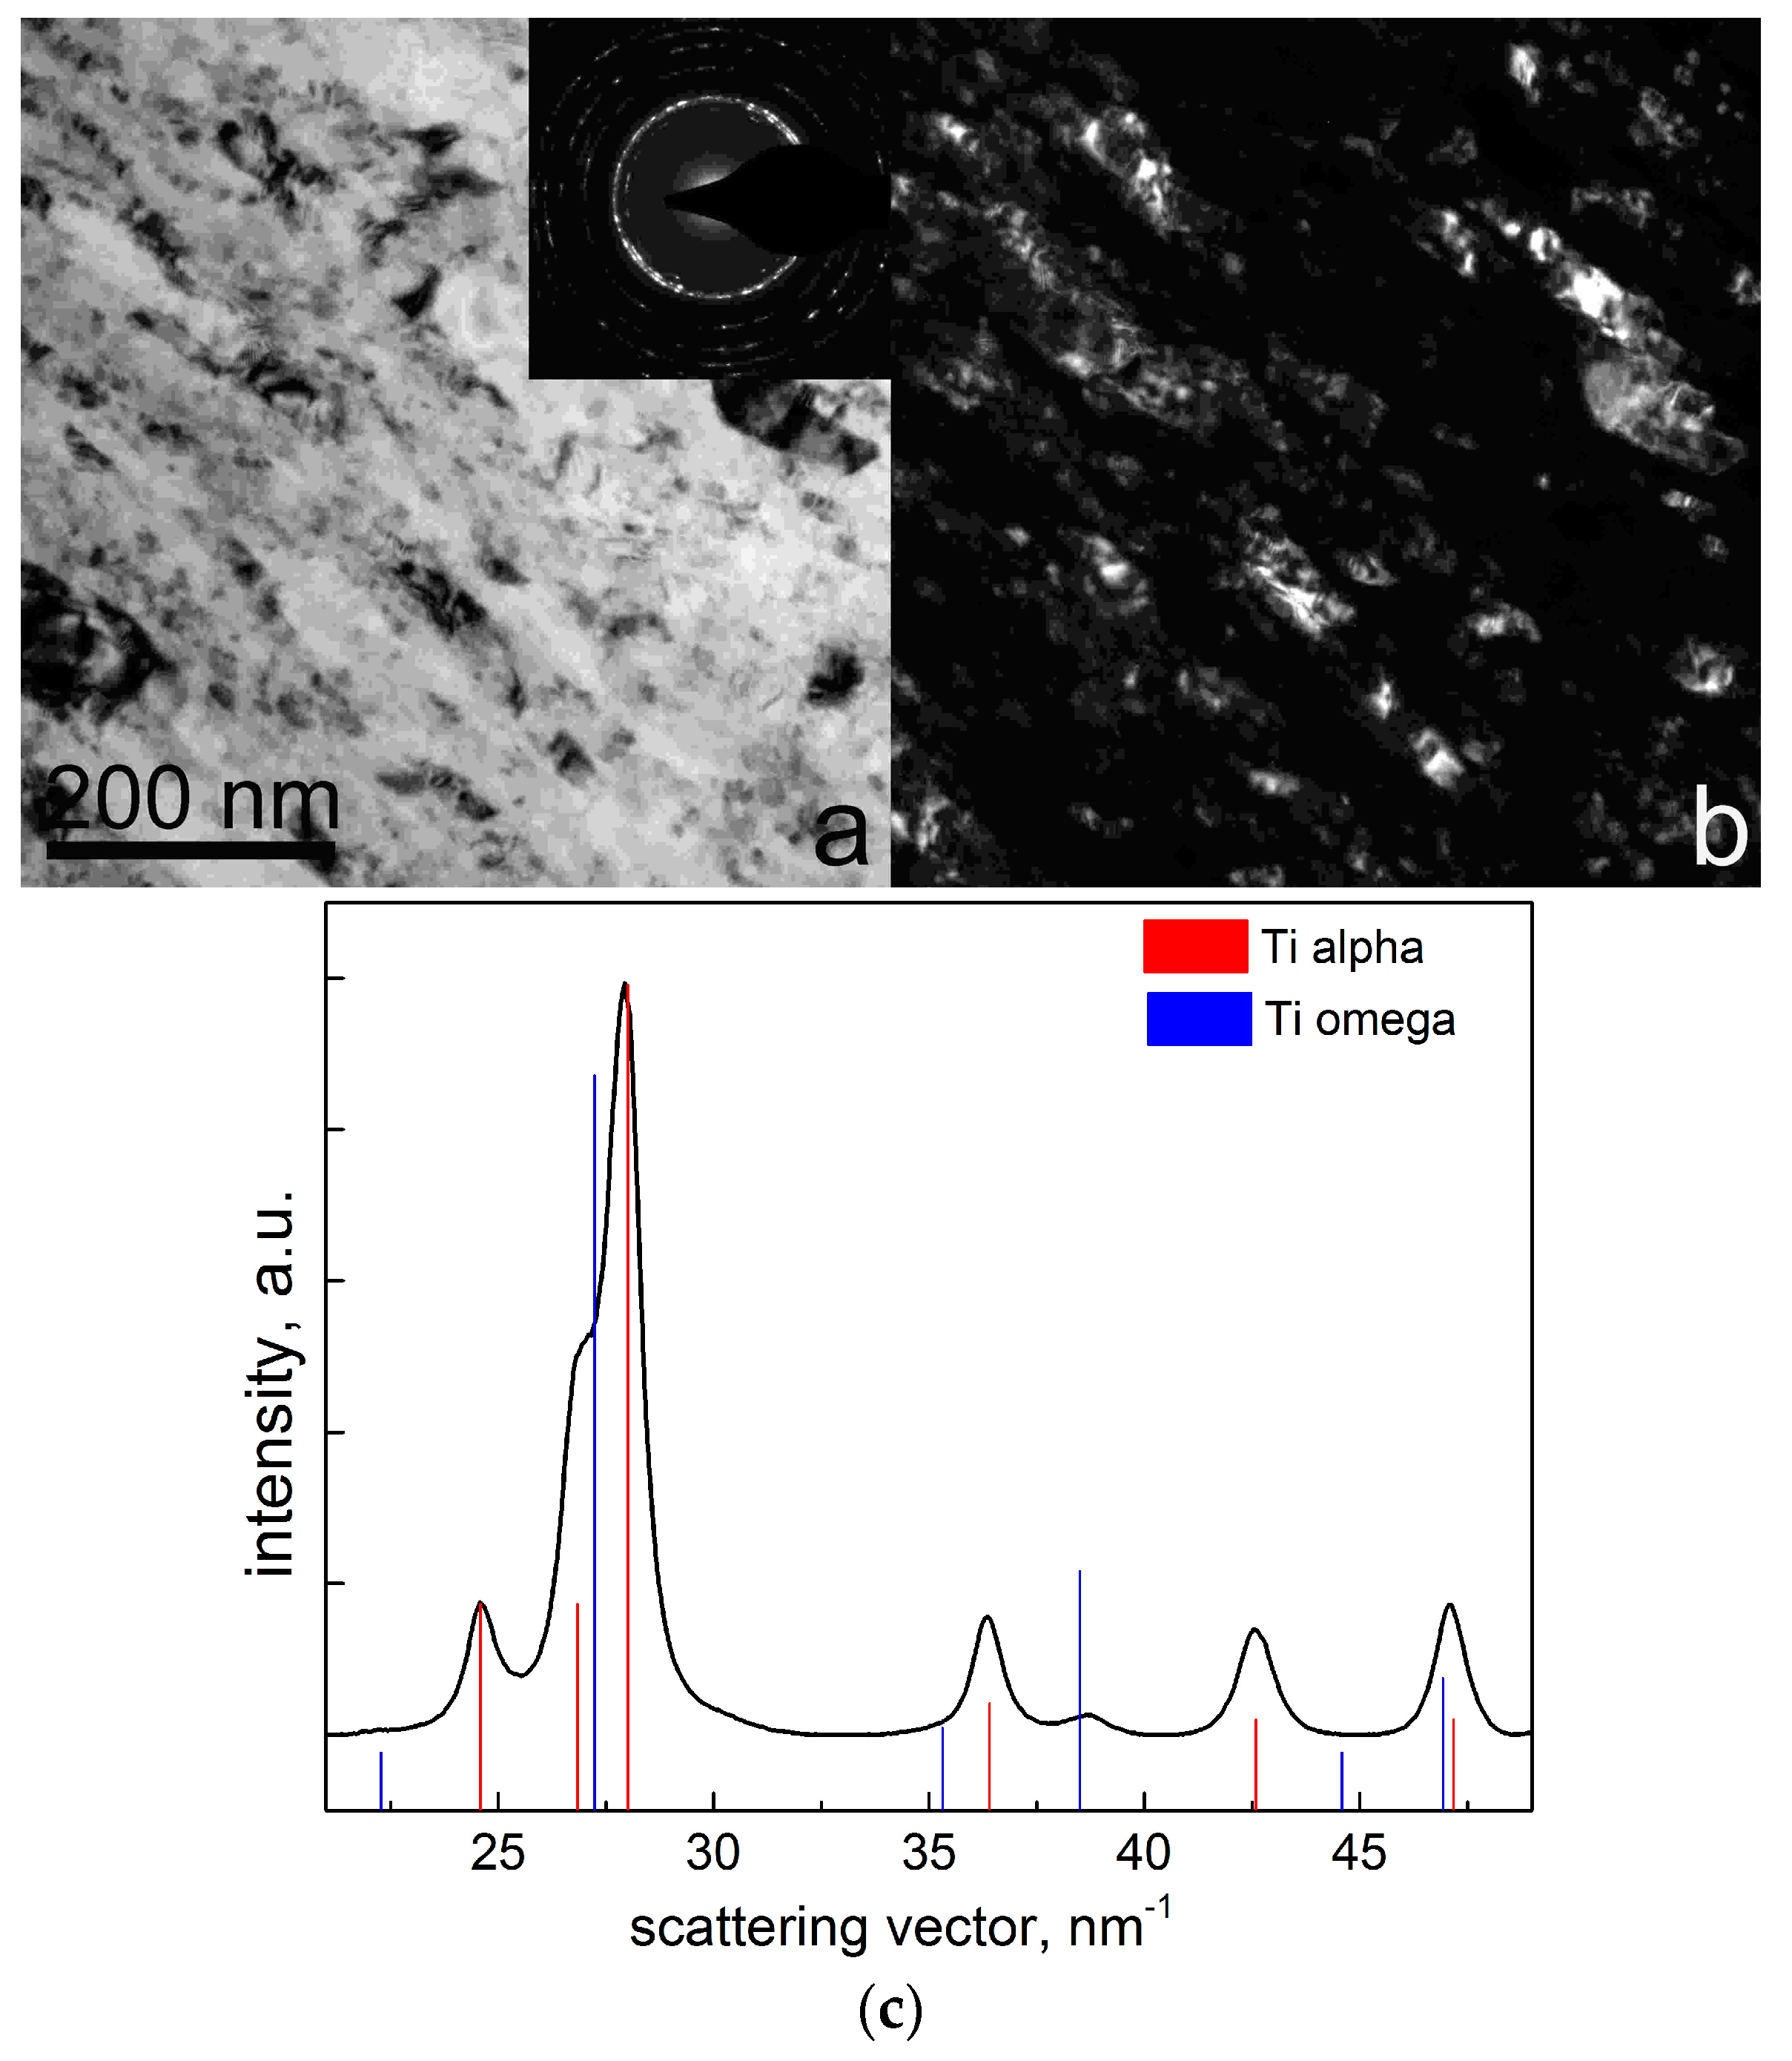
Figure 1 shows the bright and dark field TEM micrographs as well as electron diffraction pattern of the Ti–2 wt % Co alloy subjected to HPT at 7 GPa, 1 rpm, and five rotations. The TEM micrographs demonstrate a very homogeneous structure with slightly elongated fine grains with the size of 50–100 nm. The selected area diffraction pattern and the radial intensity distribution (insets in Figure 1a,c, respectively) confirm that the sample contains α- and ω-phases.
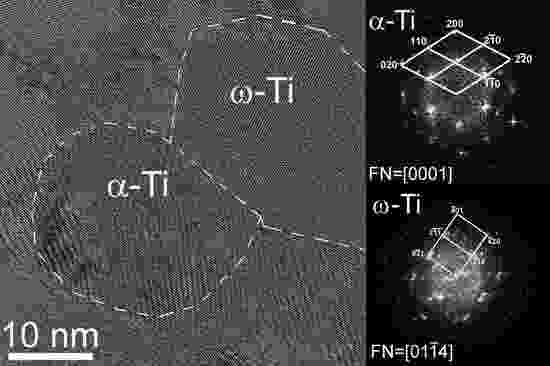
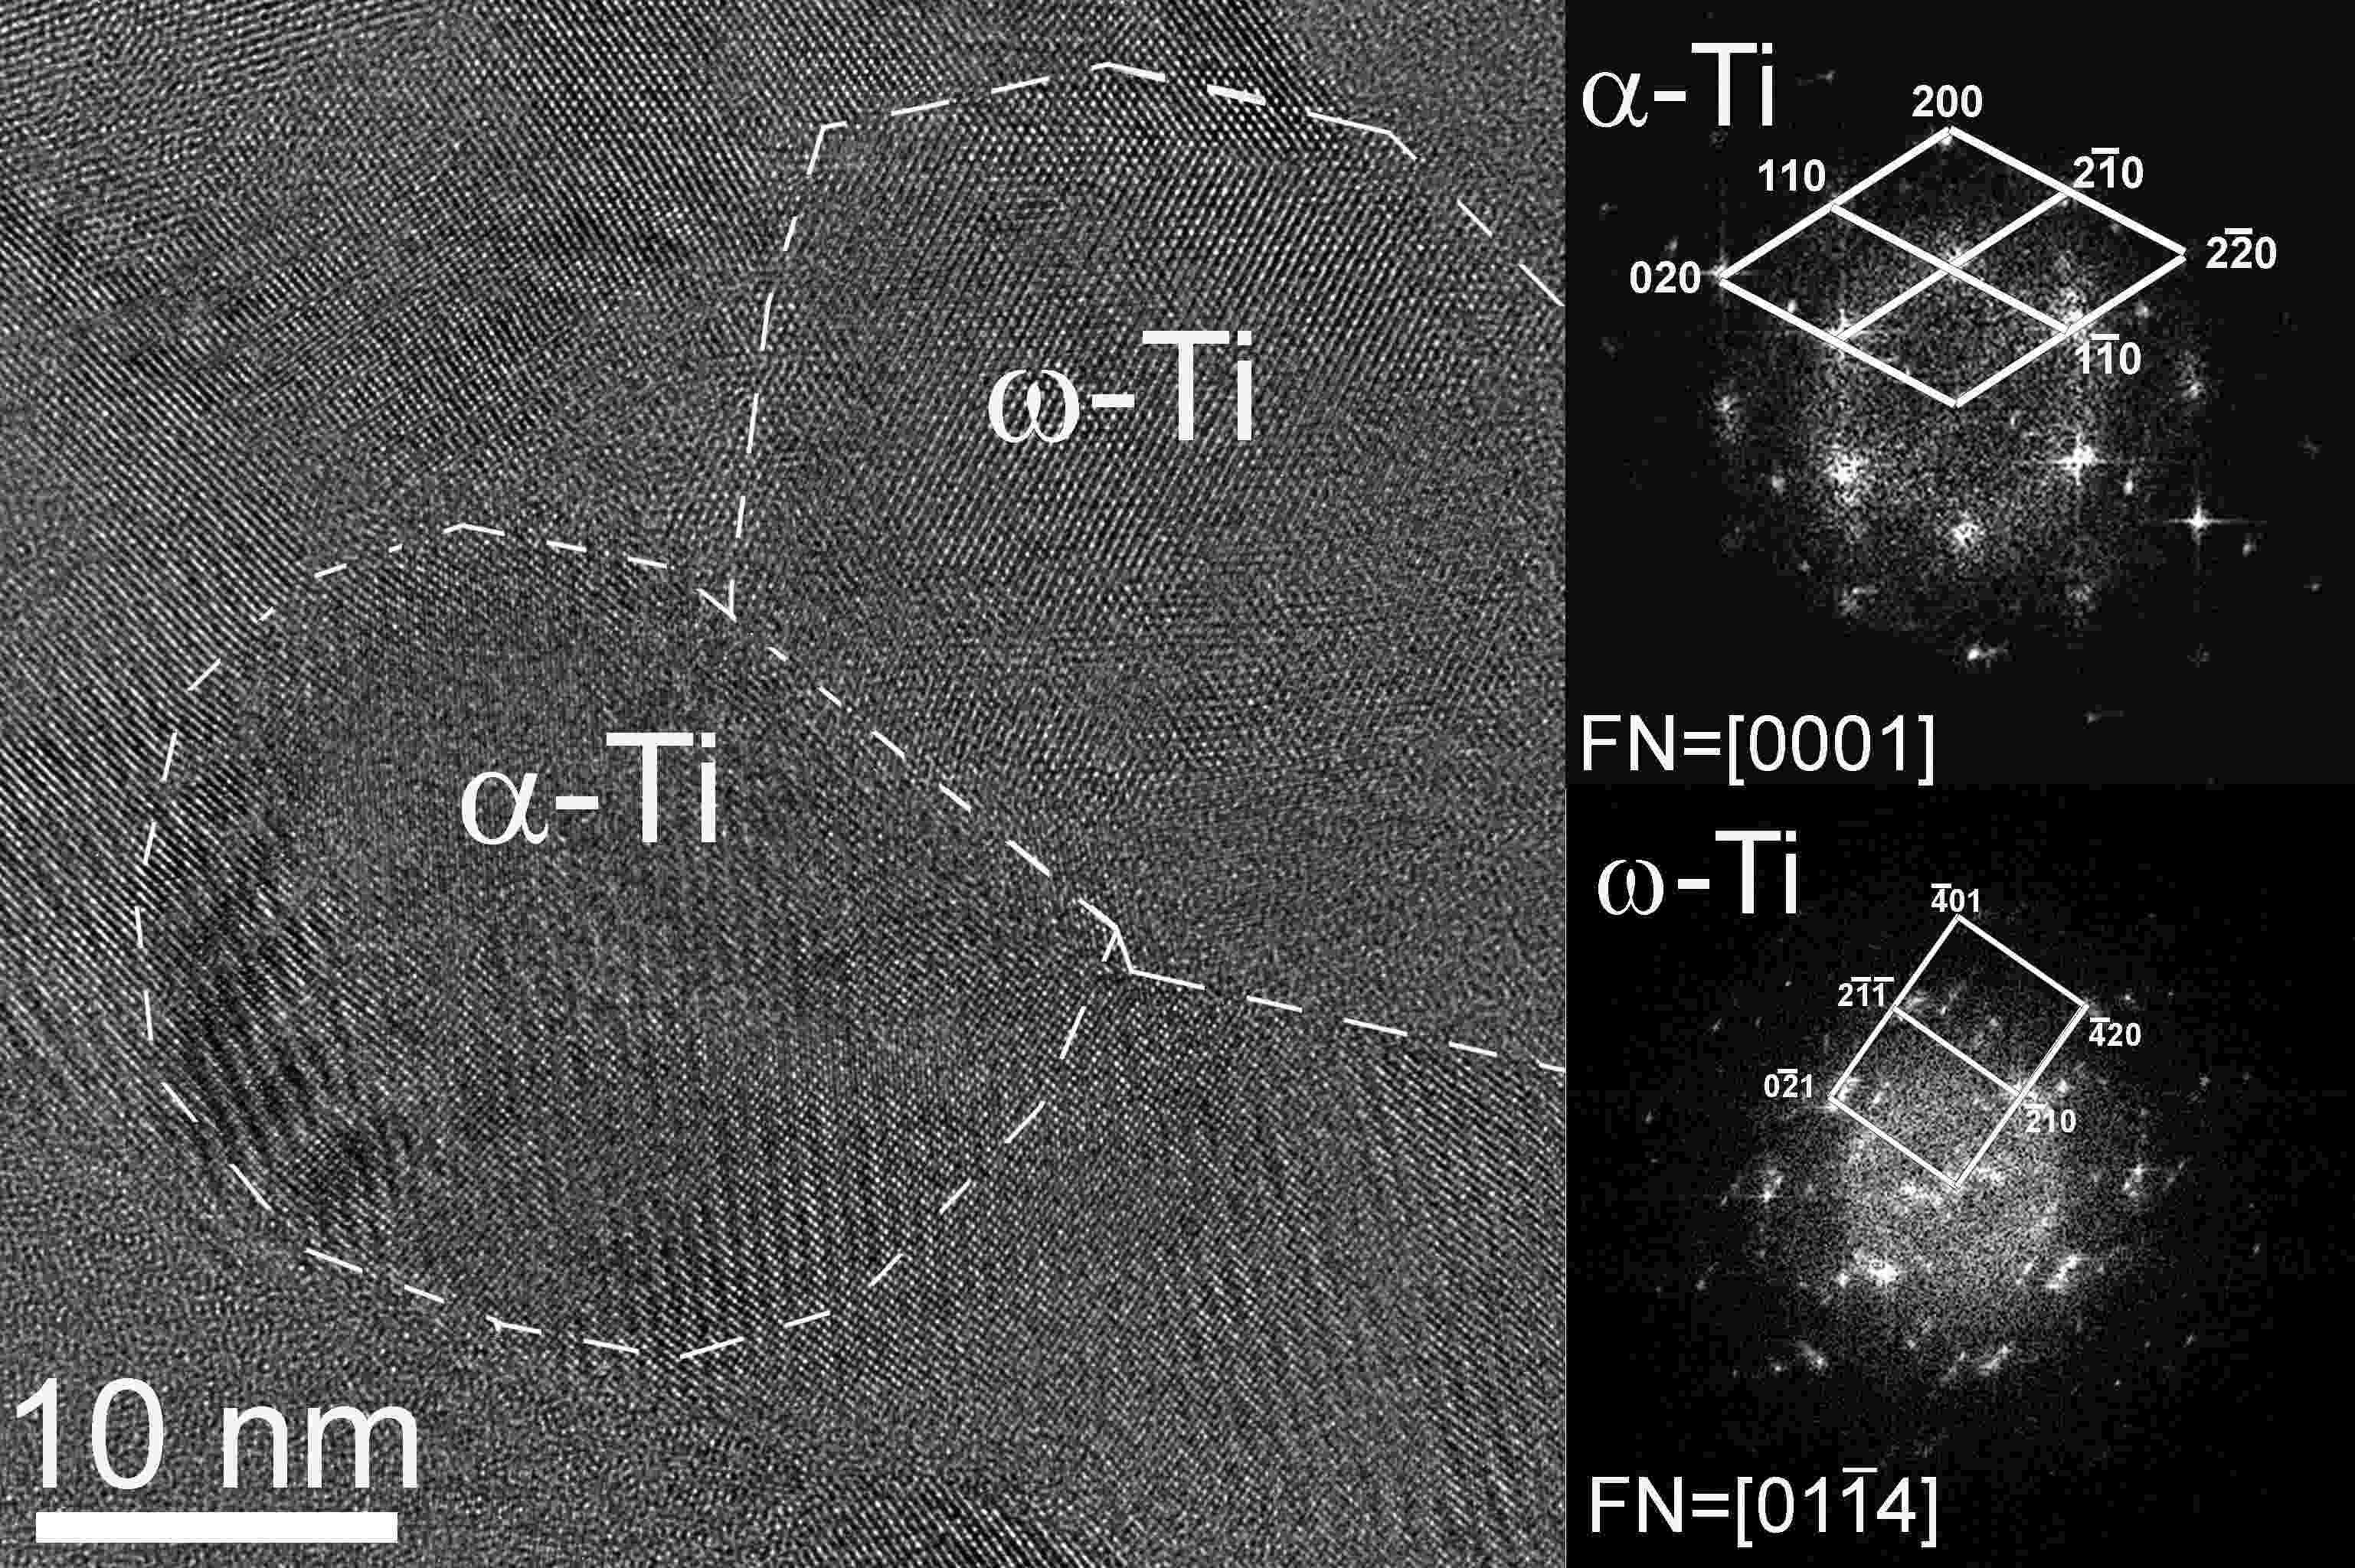
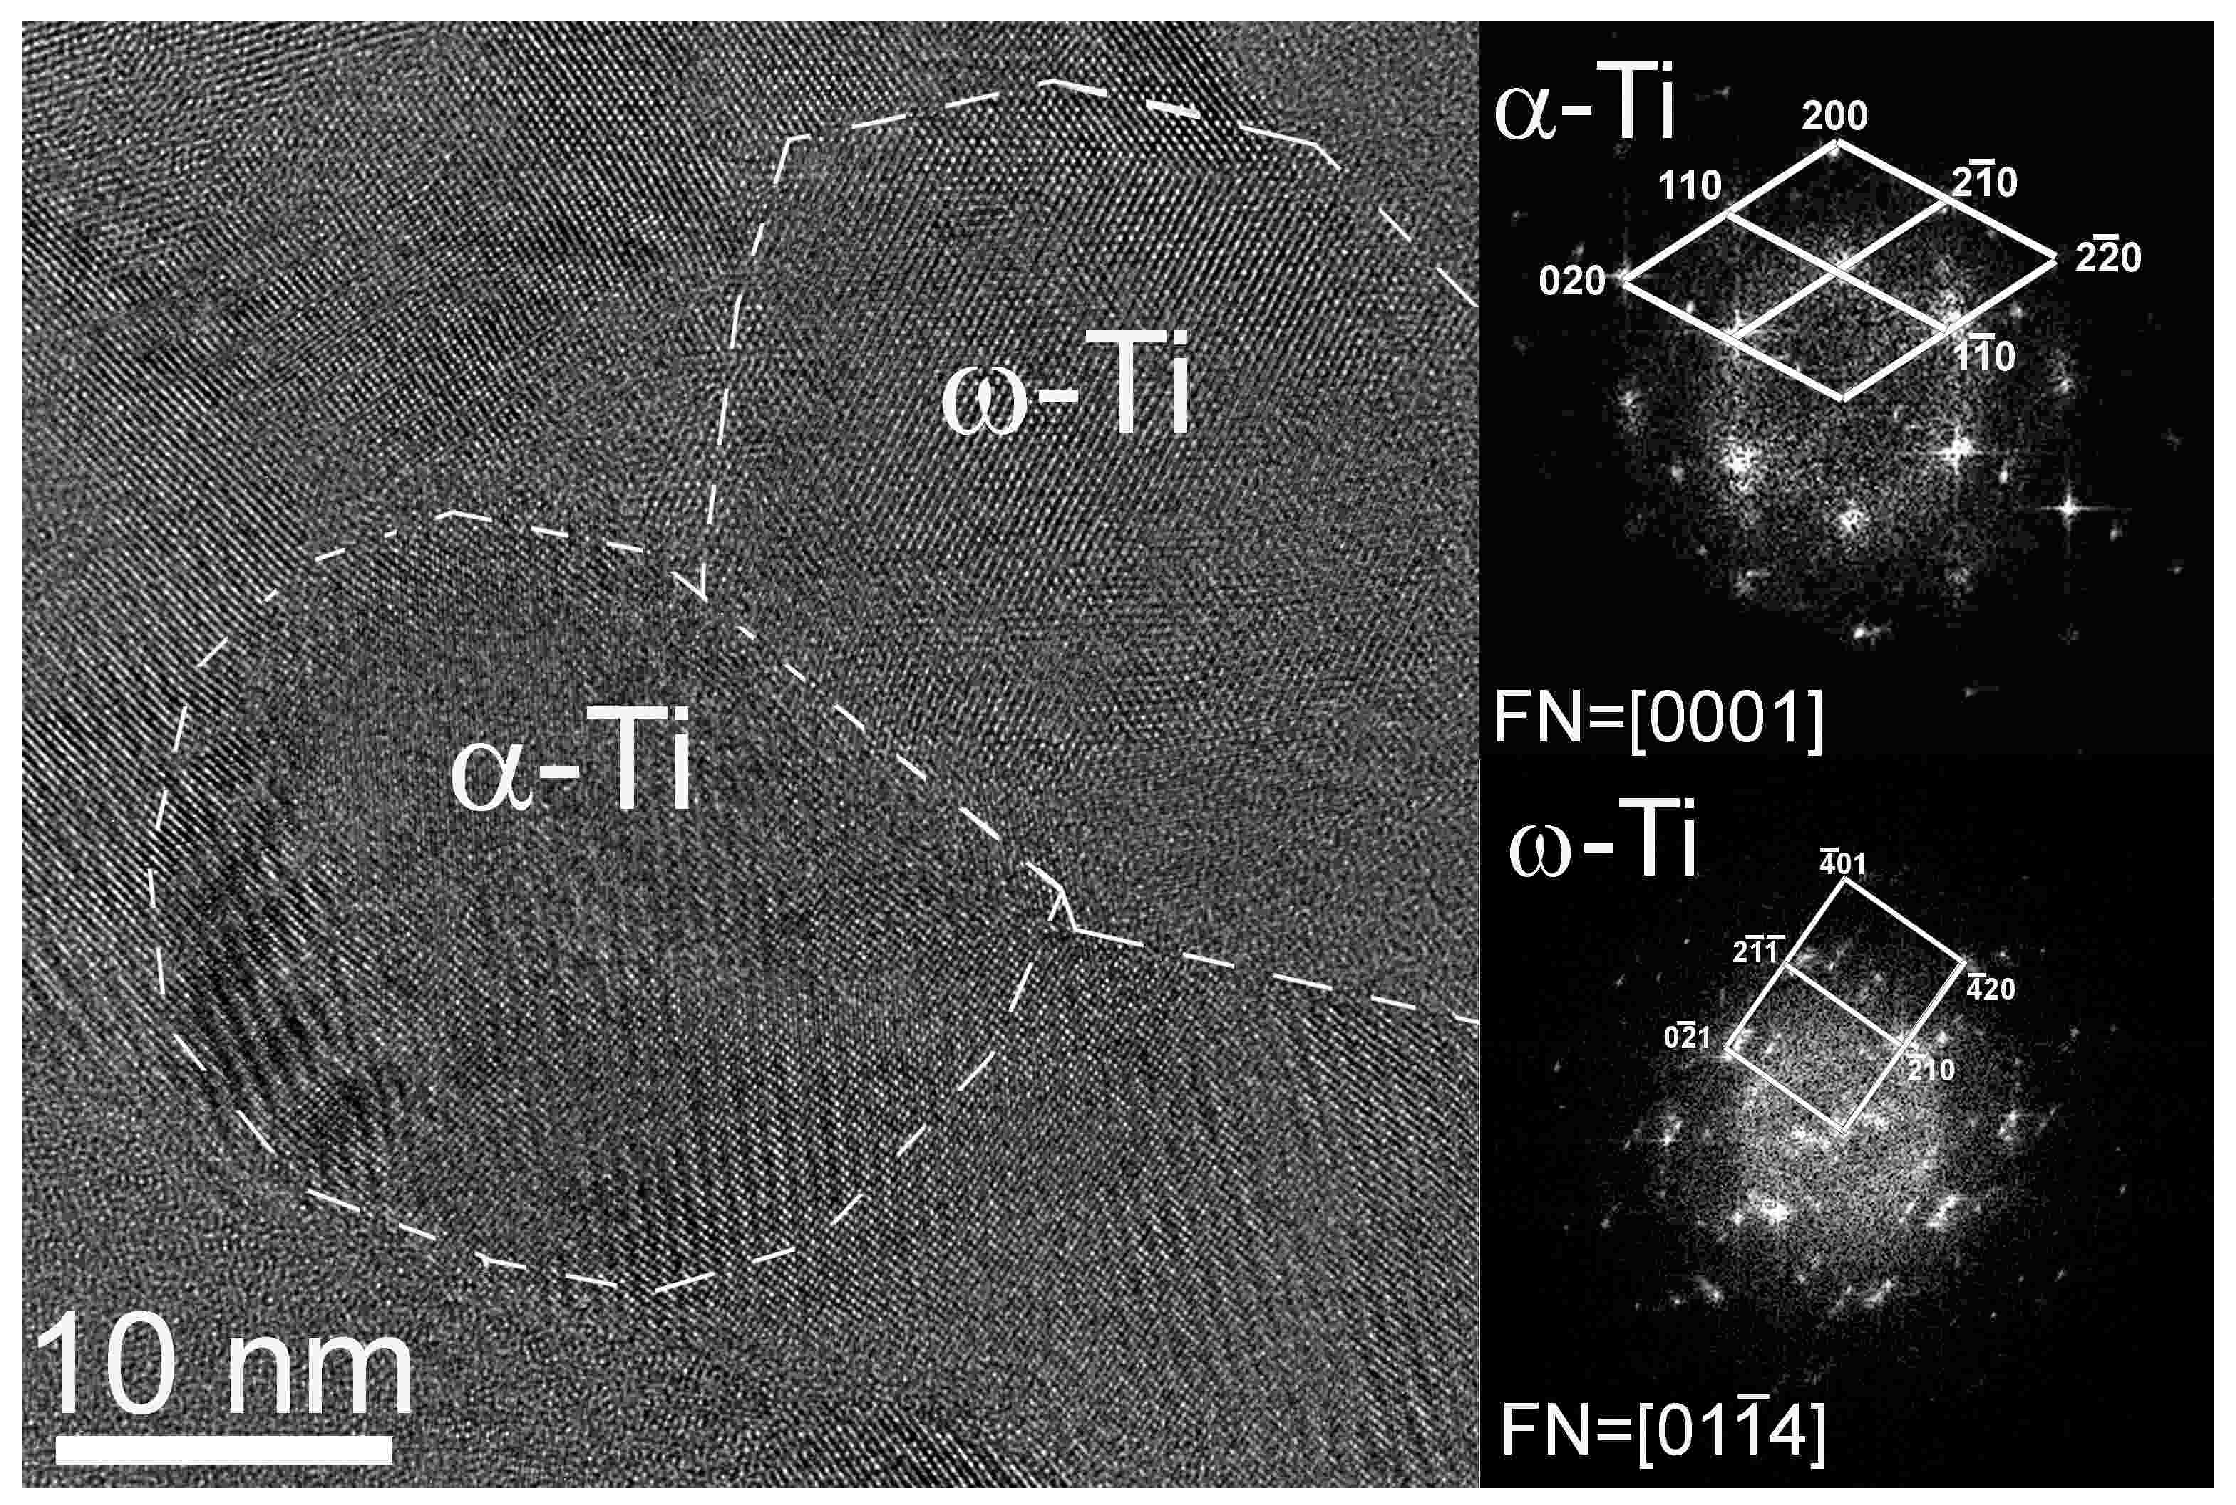
Figure 2 shows the high-resolution transmission electron (HRTEM) micrograph of the Ti–2 wt % Co as-cast alloy subjected to HPT at 7 GPa, 1 rpm, and five rotations. The contiguity between two nanosized grains of α- and ω-phase is visible. Respective two-dimensional networks are shown in fast Fourier transformations (FFTs) for α- and ω-phases. From FFTs, normal directions (FN, film normal) along the FN = [0001] and FN = axis are observed for α- and ω-phases, correspondingly. Mutual orientation of these two grains corresponds to the orientation relationship: .
In Figure 3 the X-ray diffraction patterns of Ti–2 wt % Co alloy are shown. In the initial state (Figure 3a, bottom), only the α- and β-phases are present. After uniaxial compression in HPT machine up to 7 GPa without rotation (middle pattern in Figure 3a), the XRD pattern slightly changed. The α- and β-phases remained, but the intensities of diffraction peaks redistributed revealing the compression texture. After HPT at 2 GPa (top curve) the appearance of the ω-phase peaks is slightly pronounced, but the peaks of β-phase vanish. When HPT pressure is further increased (Figure 3b, bottom for 3 GPa, middle curve for 4 GPa and top curve for 7 GPa, respectively), the amount of ω-phase increased at the expense of α-phase.
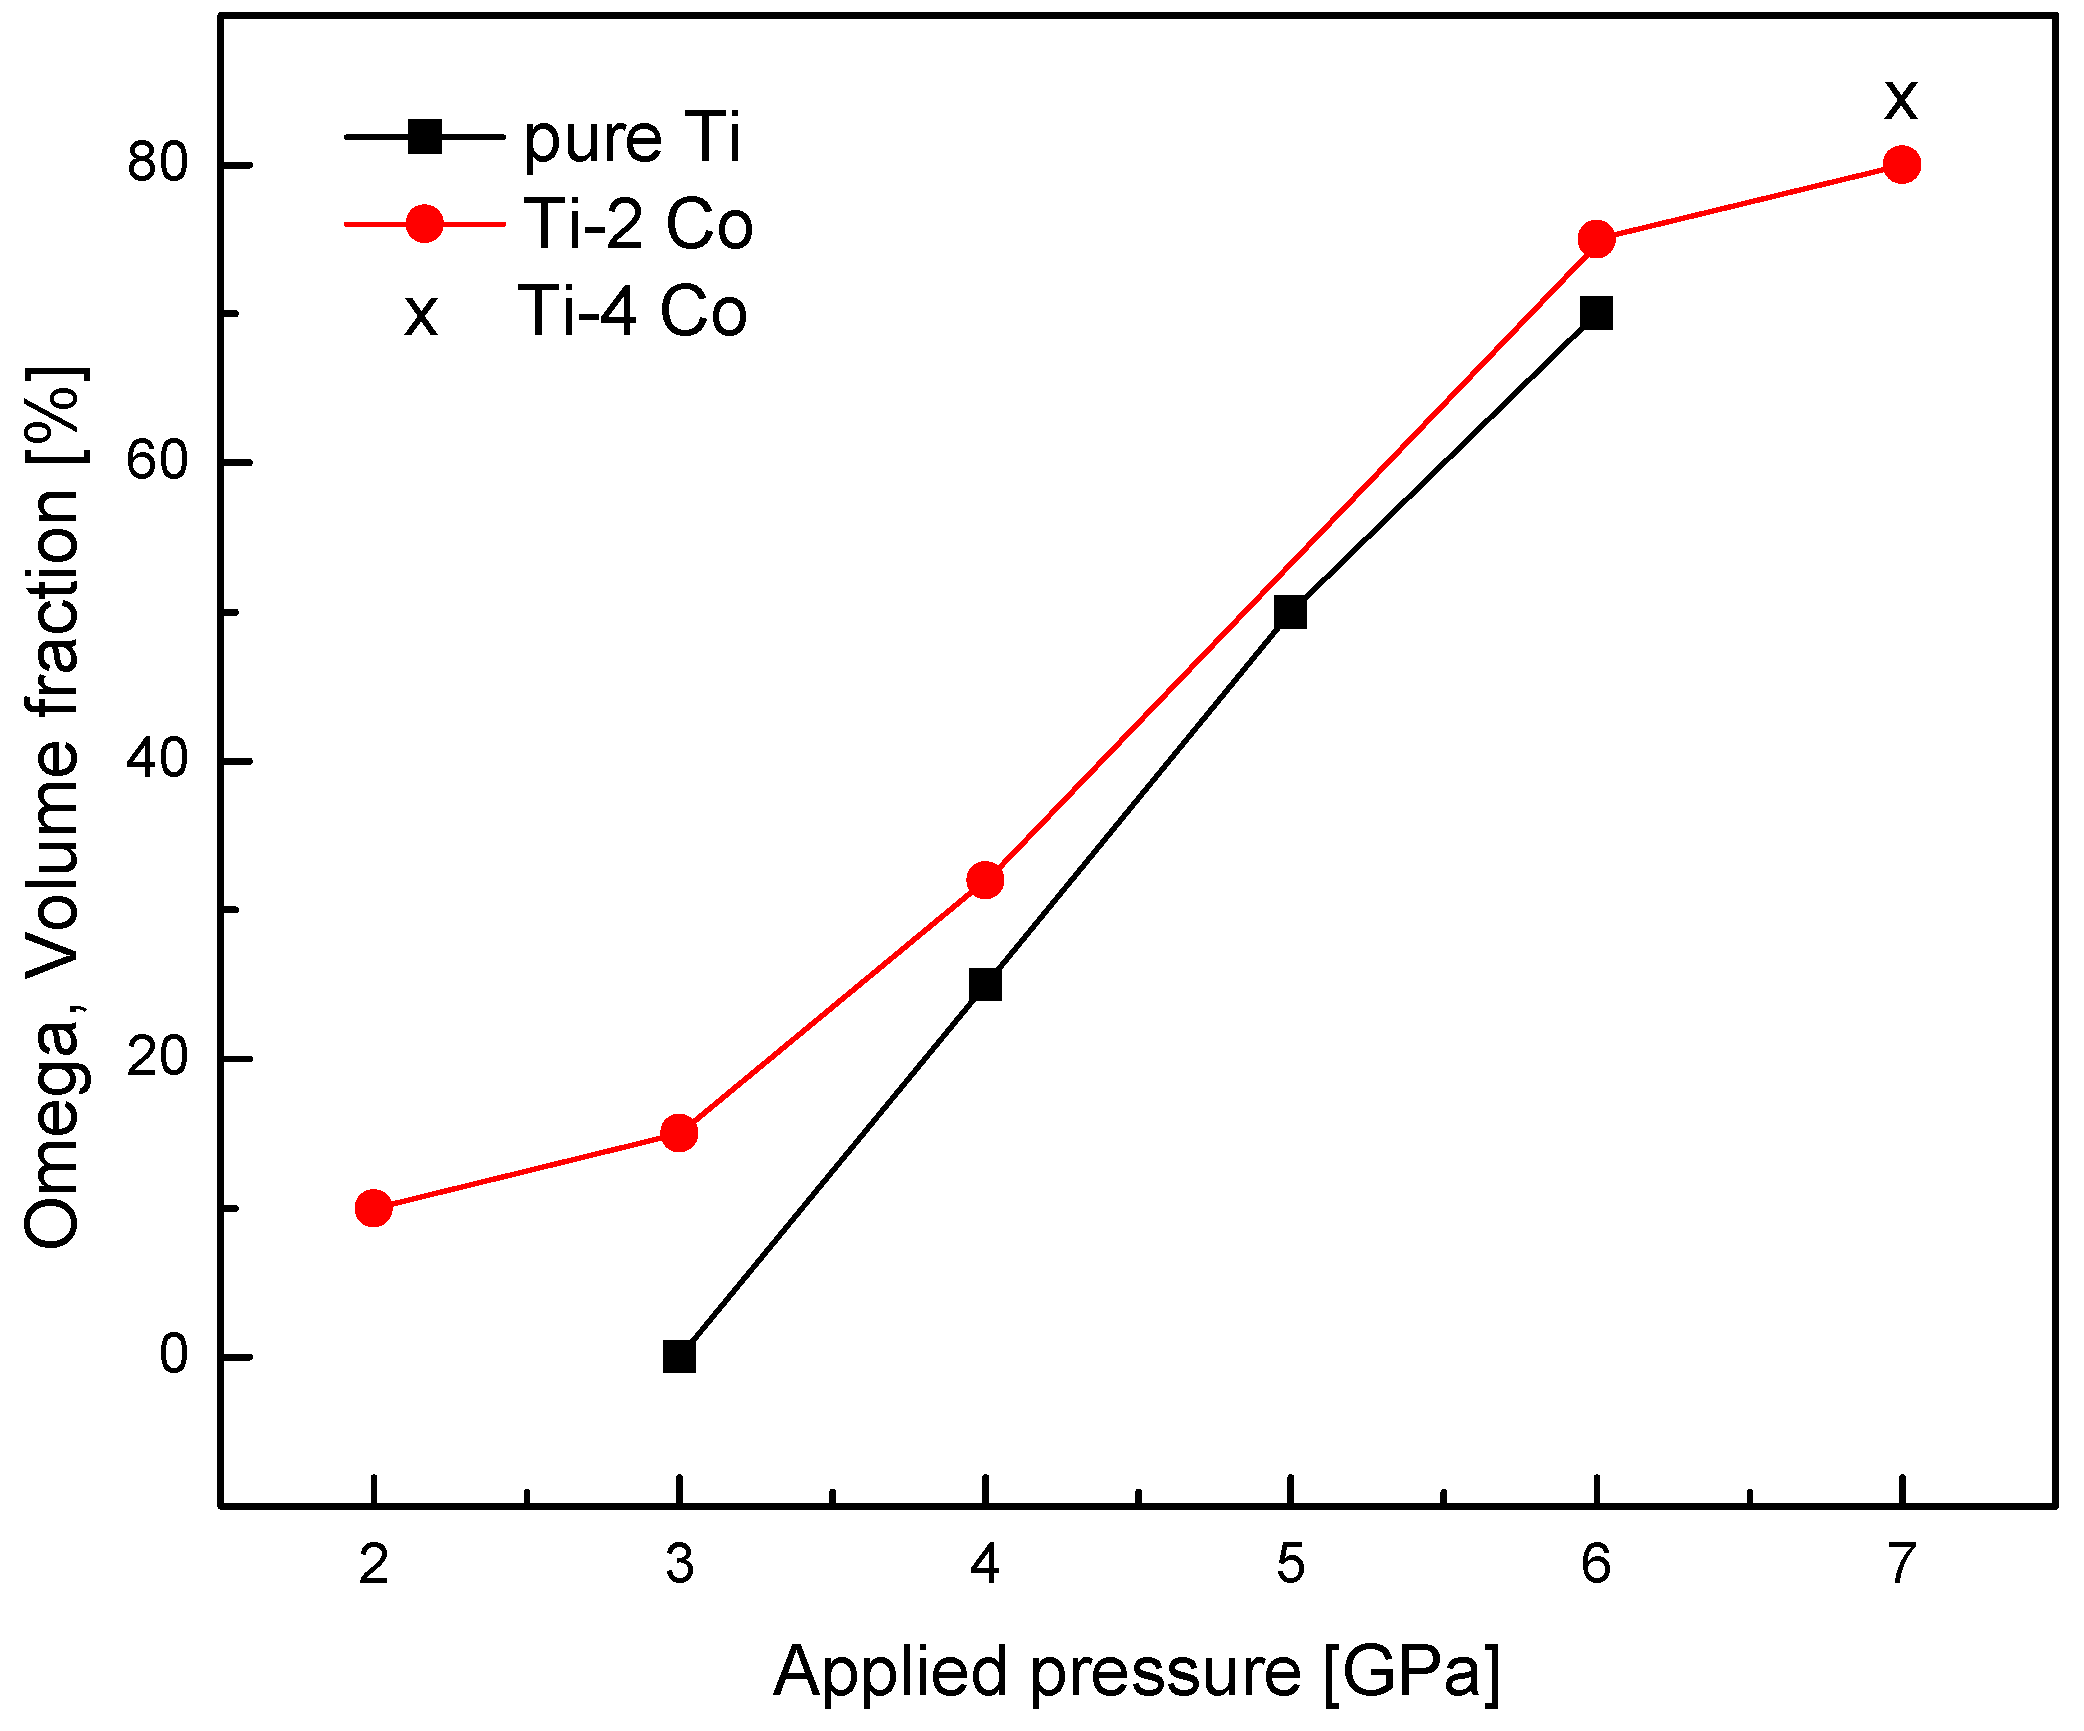
Figure 4 shows an increase of the ω-phase portion in Ti–2 wt % Co alloy from approximately 5% at 2 GPa to 80% at 7 GPa. The curve for pure titanium [48] is given for comparison. The α-to-ω transformation in the Ti–2 wt % Co alloy develops at lower pressures. The amount of ω-phase in the Ti–4 wt % Co alloy measured after HPT at 7 GPa is higher than that in the Ti–2 wt % Co alloy.
4. Discussion
The formation of ω-phase in Ti, Zr, and Hf, and their alloys have attracted much theoretical work and computer simulations [3,7,10,55,56,57,58,59,60,61,62,63,64,65,66,67,68]. Already in 2001, Greef et al. performed the first-principles electronic structure calculations and constructed the equilibrium free energies for the α- and ω-phases in Ti [55]. In such a way, they modeled the Hugoniot shock-induced α–ω transition in titanium. According to their model, the Hugoniot shock area consists of three segments: a metastable α-phase region, a transition region, and an ω-phase branch. All the Hugoniot data are consistent with an α- to ω-phase transition occurring at ~12 GPa. Later Trinkle et al. proposed the new direct mechanism for the pressure driven α to ω martensitic transformation in pure titanium [3]. A systematic algorithm enumerated all possible mechanisms whose energy barriers are evaluated. The proposed homogeneous mechanism emerges with a barrier at least four times lower than other mechanism [3]. The crystallographic mechanism of the α ↔ ω (or α ↔ β ↔ ω) phase transformation was described in Reference [3] as being based on two possible orientation relationships: OR 1 and OR 2 . However, the using of different pseudopotentials to represent titanium (such as those of Ackland, Mishin, Kim or Hennig) can lead to the significant differences in the calculation results [56,57,58]. Thus, the apparently arbitrary choices in the reference configuration can lead to significant differences in the calculated quantities [56].
Further studies demonstrated that the impurities (such as interstitial O, N, and C, or substitutional Al and V) can block the α- to ω-phase transformation in titanium [7,56,59]. The ab initio methods yield the changes in both the relative stability of phases and energy barrier between the phases. Later a tight-binding model was developed [60] for titanium that accurately reproduces the structural energies and electron eigenvalues from all-electron density-functional calculations for a previously published study [3] of the titanium α to ω transformation. A fitting method was used that matched the correctly symmetrized wave functions of the tight-binding model to those of the density-functional calculations at high symmetry points [60]. Optimization of the parameters of a modified embedded atom potential to a database of density-functional calculations yielded an accurate and transferable potential as verified by comparison to experimental and density-functional data for phonons, surface and stacking fault energies, and energy barriers for homogeneous martensitic transformations [61]. Molecular-dynamics simulations as well as first-principles electronic-structure calculations permitted to calculate the pressure-temperature phase diagram of titanium [61,62]. The density-functional theory permitted also to estimate the influence of coordination number and bond length on the phase stability and orbital occupation in titanium [63]. Using a proper solid-state nudged elastic band method employing two climbing images combined with density functional theory DFT + U methods for accurate energetics, the details of the pressure-induced α to ω transformation at the coexistence pressure have been determined [64]. Two transition states were found along the minimal-enthalpy path and a metastable body-centered orthorhombic structure was discovered, with stable phonons, a lower density than the end-point phases, and decreasing stability with increasing pressure [64]. In [65], the lattice parameters of the equilibrium structure of α-phase were determined in terms of the Gibbs free energy using the Epitaxial Bain Path method and the effect of pressure on the lattice parameters was revealed.
In Reference [66], a geometric model for the transformation of a bcc lattice into a hcp lattice has been developed. The transformation is described as the mutual reconstruction of coordination polyhedra of bcc and hcp lattices through an intermediate configuration coinciding with the crystal structure of the ω-phase. On the language of the algebraic geometry the transformation is effected as the transformation of the 11-atomic fragment of the {3, 4, 3} polytope into the 11-atomic fragment of the {3, 3, 5} polytope [66]. The relative stability of ω-phase in comparison with body-centered-cubic, face-centered-cubic, and hexagonal-close-packed structures has been studied in reference [67] for 27 transition elements from the viewpoint of thermodynamical and dynamical stability based on first-principles calculations. For the group 4 elements (Ti, Zr, and Hf), the ω structure is almost the lowest in energy among the investigated crystal structures and is also dynamically stable. The mechanism of ω- to α-phase back transformation includes the vacancies. It was found that the distorted ω-phase with defects is similar to the hexagonal α-phase structure with vacancies. It was confirmed that these vacancies could easily be occupied by Ti atoms and could form then a perfect α phase [68].
Experimentally determined transition pressure for the α–ω phase transition in pure titanium lies at room temperature between 2 and 12 GPa, depending on the experimental conditions [38,39,40,41,42,43,44,45,46]. The high-pressure measurements in ideal hydrostatic conditions (i.e., in liquids or gases) are usually possible only below a certain pressure. Thus, at room temperature a completely hydrostatic environment cannot be sustained above 13 GPa [69,70] due to solidification of all known pressure media including helium. All other high-pressure media possess the non-zero shear modulus. Therefore, all high-pressure experiments even without torsion always include some shear, and this fact can be responsible for the scatter of α-Ti to ω-Ti transition pressure.
Bridgman first reported the phase transition in titanium at 3.5 GPa based on the measurements of sample volume [38]. The interval between 9 and 13 GPa has been reported by Young et al. (as cited in [40]). Jamieson et al. used the “amorphous” boron as a pressure vessel to produce the quasi-hydrostatic pressures for in-situ X-rays observations of α-Ti to ω-Ti transition [40,41,42]. Silver chloride was employed as the pressure medium in the two-stage high-pressure apparatus in [43]. Synchrotron X-ray diffraction experiments were conducted using a cubic anvil apparatus at beamline X17B2 of the National Synchrotron Light Source (NSLS), Brookhaven National Laboratory and at beamline BL14B1 of the Spring-8, Japan [44]. Briefly, a mixture of amorphous boron and epoxy resin was used as pressure-transmitting medium and the amorphous carbon was used as furnace material. The Ti samples were surrounded by NaCl powders and packed into a cylindrical container of boron nitride, 1.0 mm inner diameter and 2.0 mm length [44]. The transition pressure has been determined as 5.5 GPa [44].
D. Errandonea et al. systematically studied the effects of uniaxial stress on the pressure-induced α → ω transition in titanium [2]. They underline that the uniaxial stress component of the stress tensor may be quite substantial and different (even at the low pressure where the α → ω transformation was observed in Ti) in the quasi-hydrostatic environment generated in the diamond-anvil cell (DAC) by many authors [2,45,46,47,48]. Therefore, D. Errandonea et al. performed four different sets of experiments using DAC with the sample loaded under four different pressure transmitting media (argon, 4:1 methanol-ethanol mixture, NaCl, and without pressure medium), which provided different hydrostatic conditions. The hydrostaticity of the pressure medium decreases following the sequence: argon → (methanol-ethanol) → NaCl → (no pressure medium). Their experiments revealed that: (1) the onset of the transition depends on the pressure medium used, going from 4.9 GPa (no pressure medium) to 10.5 GPa (argon pressure medium); (2) the α- and ω-phases can coexist in the rather large pressure range depending on the pressure medium; and (3) the hysteresis and quenchability of the ω phase is affected by differences in the sample pressure environment [2].
In [37], the profiles of shock waves have been measured in titanium at pressures between 5.8 and 24.9 GPa. The splitting of a shock wave has been observed driven by the α-Ti to ω-Ti first order phase transition at 11.9 GPa. Y.K. Vohra et al. observed that the onset of α → ω transition in titanium depends on the impurity content [45]. It increases from 2.9 to 6.0 GPa with increasing concentration of oxygen and other impurities. In the Bridgman anvils, the pyrophyllite gasket and steatite discs were employed for sample containment and for pressure medium, respectively [45].
Alloying of titanium alters the temperature of the α ↔ β phase transformation, and may also change the pressure of the α ↔ β ↔ ω transformation. In general, the alloying elements modify the Gibbs energy of the phases (and thus their stability) and the energy barrier of the phase transformation [7]. Regarding their effect on transformation, the alloying elements can be divided into two groups: α-stabilizers (e.g., Al, O, N), which increase the temperature of the α → β transformation, and β-stabilizers (e.g., Nb, Cr, Zr, Fe, Ni, Cu, and Co), which decrease the transformation temperature. The β-stabilizers are mostly the d-electron rich transition elements. Therefore, the alloying by the β-stabilizers leads to the increase of d-electron concentration. Thus, it can provide an additional driving force for the α → ω transformation. In other words, the alloying with β-phase stabilizers can be considered as the pressure equivalent for the α → ω phase transformation. Hennig concluded from the ab initio calculations employing the density functional theory (DFT) that the alloying with β-stabilizer elements such as V, Mo, Fe, and Ta should lead to a decrease in the onset pressure of the α → ω transformation [7]. Recently, systematic studies of the HPT-induced ω-phase formation in Ti-Fe alloys revealed new possibilities for the experimental studies of the α → ω and β → ω transformations, facilitated by the combination of shear strain with high pressure [50,71].
If the Bridgman anvils are rotating (HPT conditions) the external shear is added to the quasi-hydrostatic conditions. The external shear eases the α → ω transformation in titanium. Edalati et al. observed its onset between 4 and 6 GPa in constrained conditions (upper and lower anvils had a circular flat-bottom hole at the center) [72]. Yu. Ivanisenko et al. studied the HPT of pure titanium in non-constrained conditions (flat anvils) and observed the onset of α → ω transformation at 3 GPa [49]. The amount of ω-phase increased from 0% at 2 GPa to about 70% at 6 GPa (Figure 4) [49].
In contrast to [49], where the samples before HPT contained only α-phase, the starting state after annealing in β-area and quenching contains the mixture of α- and β-phases. A number of diffraction peaks typical for the (α + β) Ti-alloy can be seen in the XRD patterns in Figure 2a (lower curve). A closer look reveals the redistribution of the integral intensities between the (110) and (200) XRD peaks of the β-phase after the pressure application (without torsion, middle curve). The intensity of XRD peaks redistributed in favor of the (110) one pointing towards the formation of the <110> texture. It should be noted here that, according to the theoretical predictions, the <110> texture component plays an important role for the α → β → ω phase transformation via the atomic shuffling within the (0001)α planes, which is expected for the transformation pathways obeying one of the orientation relationships for the (0001)α || (110)β || (01 1)ω or (0001)α || (011)β || (11 0)ω pathways [3]. After HPT at 2 GPa, the (200) peak of β-phase completely disappeared, and a strong (0002) peak corresponding to the α-phase is observed instead (Figure 2a, upper curve). When the HPT pressure increased up to 3 GPa and higher, a substantial decrement in the intensity of the (0002) α-peak was accompanied by the appearance of a typical XRD (100 + 110) doublet from the ω-phase (Figure 2b). As one can see, in the Ti–2%Co: (i) the high uniaxial pressure leads to noticeable sharpening of the <110> β-phase texture component; and (ii) the simultaneous application of high pressure and shear accelerates the appearance of the ω-phase due to the strong shear component. In Figure 2, we see that mutual orientation of α- and ω-grains corresponds to the orientation relationship: . This special orientation relationship is known as OR 1 and has been predicted for α- and ω-phases in [3,5] together with OR 2 . The presence of this special orientation relationship speaks for the martensitic mechanism of the α → ω transformation in the Ti–Co alloys during HPT.
Our results demonstrate that the addition of cobalt decreases the starting pressure of α/β → ω transformation in comparison with pure titanium. The first portions of ω-phase appear in the Ti–2 wt % Co alloy already at 2 GPa in comparison with 3.5 GPa in pure Ti. Figure 4 shows how the portion of ω-phase increased from 5% at 2 GPa to 80% at 7 GPa in the Ti–2 wt % Co alloy. The curve for pure titanium [49] is given for comparison. Formation of the ω-phase in the Ti–2 wt % Co alloy starts at lower pressures. However, at the beginning the portion of ω-phase in the Ti–2 wt % Co alloy increased with increasing HPT pressure slower than in pure titanium. On the other hand, the presence of shear strain during HPT decreases the onset of the α → ω transition in pure Ti from 10.5 GPa (under quasi-hydrostatic conditions) to about 3.5 GPa. The portion of ω-phase after HPT at 7 GPa in the Ti–4 wt % Co (cross in Figure 4) is higher than in the Ti–2 wt % Co alloy (circle). We observed earlier that, in the Ti–4 wt % Fe alloy, the amount of ω-phase is close to 100% [49]. Thus, the portion of ω-phase after HPT at 7 GPa increases in the following sequence: pure Ti → Ti–2 wt % Co → Ti–4 wt % Co → Ti–4 wt % Fe.
5. Conclusions
The high pressure torsion (HPT) of Ti–Co alloys leads to the α → ω and β → ω transformations. Similar to pure titanium, the onset of α/β → ω transition is at 2 GPa. It is lower than in pure titanium (4 GPa). However, the portion of ω-phase increases with increasing pressure in Ti–2 wt % Co alloy more slowly than in pure Ti. If only the pressure between Bridgeman anvils is applied, without torsion, the ω phase does not appear even at 7 GPa. On the other hand, the presence of shear strain during HPT decreases the onset of the α → ω transition in Ti from 10.5 GPa (under quasi-hydrostatic conditions) to about 3.5 GPa. The portion of ω-phase after HPT at 7 GPa increases in the following sequence: pure Ti → Ti–2 wt % Co → Ti–4 wt % Co → Ti–4 wt % Fe.
Acknowledgments
This work was partially supported by Ministry of Education and Science of the Russian Federation (grant 14.А12.31.0001), the Russian Foundation for Basic Research (grants 15-53-06008 and 16-53-12007), by Deutsche Forschungsgemeinschaft (project numbers RA 1050/20-1, IV 98/5-1, HA 1344/32-1, and FA 999/1-1) as well as by the Karlsruhe Nano Micro Facility (KNMF, www.knmf.kit.edu).
Author Contributions
Askar R. Kilmametov and Yulia Ivanisenko conceived and designed the HPT experiments, Askar R. Kilmametov performed the XRD measurements, Boris B. Straumal and Alena S. Gornakova prepared the alloys and performed the anneals, Andrey A. Mazilkin performed TEM measurements, Boris B. Straumal and Horst Hahn wrote the paper.
Conflicts of Interest
The authors declare that no conflict of interest exists.
References
- Donachie, M.J., Jr. Titanium: A Technical Guide, 2nd ed.; ASM International: Geauga County, OH, USA, 2000. [Google Scholar]
- Errandonea, D.; Meng, Y.; Somayazulu, M.; Häusermann, D. Pressure-induced α → ω transition in Titanium metal: A systematic study of the effects of uniaxial stress. Phys. B 2005, 355, 116–125. [Google Scholar] [CrossRef]
- Trinkle, D.R.; Hennig, R.G.; Srinivasan, S.G.; Hatch, D.M.; Jones, M.D.; Stokes, H.T.; Albers, R.C.; Wilkins, J.W. New mechanism for the α to ω martensitic transformation in pure titanium. Phys. Rev. Lett. 2003, 91, 025701. [Google Scholar] [CrossRef] [PubMed]
- Sikka, S.K.; Vohra, Y.K.; Chidambaram, R. ω-phase in materials. Prog. Mater. Sci. 1982, 27, 245–310. [Google Scholar] [CrossRef]
- Hickman, B.S. The formation of ω phase in Ti and Zr alloys: A review. J. Mater. Sci. 1969, 4, 554–563. [Google Scholar] [CrossRef]
- Gupta, S.C.; Joshi, K.D.; Banerjee, S. Experimental and theoretical investigations on d and f electron systems under high pressure. Metall. Mater. Trans. A 2008, 39, 1593–1601. [Google Scholar] [CrossRef]
- Hennig, R.; Trinkle, D.R.; Bouchet, J.; Srinivasan, S.G.; Albers, R.C.; Wilkins, J.W. Impurities block the α to ω martensitic transformation in Titanium. Nat. Mater. 2005, 4, 129–133. [Google Scholar] [CrossRef] [PubMed]
- Afonikova, N.S.; Degtyareva, V.F.; Litvin, Y.A.; Rabinkin, A.G.; Skakov, Y.A. Superconductivity and crystal structure of Ti-Nb alloys after high-pressure action up 120 kbar. Sov. Phys. Sol. State 1973, 15, 746–749. [Google Scholar]
- Vohra, Y.K.; Sikka, S.K.; Menon, E.S.K.; Krishnan, R. High-pressure studies on a prototype ω forming alloy system. Acta Metall. 1981, 29, 457–470. [Google Scholar] [CrossRef]
- Dey, G.K.; Tewari, R.; Banerjee, S.; Jyoti, G.; Gupta, S.C.; Joshi, K.D.; Sikka, S.K. Formation of a shock deformation induced ω phase in Zr20Nb alloy. Acta Mater. 2004, 52, 5243–5254. [Google Scholar] [CrossRef]
- Valiev, R.Z.; Islamgaliev, R.K.; Alexandrov, I. Bulk nanostructured materials from severe plastic deformation. Prog. Mater. Sci. 2000, 45, 103–189. [Google Scholar] [CrossRef]
- Straumal, B.; Korneva, A.; Zięba, P. Phase transitions in metallic alloys driven by the high pressure torsion. Arch. Civ. Mech. Eng. 2014, 14, 242–249. [Google Scholar] [CrossRef]
- Lojkowski, W.; Djahanbakhsh, M.; Burkle, G.; Gierlotka, S.; Zielinski, W.; Fecht, H.J. Nanostructure formation on the surface of railway tracks. Mater. Sci. Eng. A 2001, 303, 197–208. [Google Scholar] [CrossRef]
- Gavriljuk, V.G. Decomposition of cementite in pearlitic steel due to plastic deformation. Mater. Sci. Eng. A 2003, 345, 81–89. [Google Scholar] [CrossRef]
- Sauvage, X.; Wetscher, F.; Pareige, P. Mechanical alloying of Cu and Fe induced by severe plastic deformation of a Cu–Fe composite. Acta Mater. 2005, 53, 2127–2135. [Google Scholar] [CrossRef]
- Straumal, B.B.; Baretzky, B.; Mazilkin, A.A.; Phillipp, F.; Kogtenkova, O.A.; Volkov, M.N.; Valiev, R.Z. Formation of nanograined structure and decomposition of supersaturated solid solution during high pressure torsion of Al–Zn and Al–Mg. Acta Mater. 2004, 52, 4469–4478. [Google Scholar] [CrossRef]
- Mazilkin, A.A.; Straumal, B.B.; Rabkin, E.; Baretzky, B.; Enders, S.; Protasova, S.G.; Kogtenkova, O.A.; Valiev, R.Z. Softening of nanostructured Al–Zn and Al–Mg alloys after severe plastic deformation. Acta Mater. 2006, 54, 3933–3939. [Google Scholar] [CrossRef]
- Straumal, B.B.; Protasova, S.G.; Mazilkin, A.A.; Rabkin, E.; Goll, D.; Schütz, G.; Baretzky, B.; Valiev, R. Deformation-driven formation of equilibrium phases in the Cu–Ni alloys. J. Mater. Sci. 2012, 47, 360–367. [Google Scholar] [CrossRef]
- Straumal, B.B.; Kilmametov, A.R.; Kucheev, Y.O.; Kurmanaeva, L.; Ivanisenko, Y.; Baretzky, B.; Korneva, A.; Zięba, P.; Molodov, D.A. Phase transitions during high pressure torsion of Cu–Co alloys. Mater. Lett. 2014, 118, 111–114. [Google Scholar] [CrossRef]
- Straumal, B.; Valiev, R.; Kogtenkova, O.; Zieba, P.; Czeppe, T.; Bielanska, E.; Faryna, M. Thermal evolution and grain boundary phase transformations in severe deformed nanograined Al–Zn alloys. Acta Mater. 2008, 56, 6123–6131. [Google Scholar] [CrossRef]
- Cepeda-Jiménez, C.M.; García-Infanta, J.M.; Zhilyaev, A.P.; Ruano, O.A.; Carreño, F. Influence of the thermal treatment on the deformation-induced precipitation of a hypoeutectic Al–7 wt % Si casting alloy deformed by high-pressure torsion. J. Alloys Compd. 2011, 509, 636–643. [Google Scholar] [CrossRef] [Green Version]
- Ivanisenko, Y.; Lojkowski, W.; Valiev, R.Z.; Fecht, H.J. The mechanism of formation of nanostructure and dissolution of cementite in a pearlitic steel during high pressure torsion. Acta Mater. 2003, 51, 5555–5570. [Google Scholar] [CrossRef]
- Straumal, B.B.; Mazilkin, A.A.; Protasova, S.G.; Dobatkin, S.V.; Rodin, A.O.; Baretzky, B.; Goll, D.; Schütz, G. Fe–C nanograined alloys obtained by high pressure torsion: Structure and magnetic properties. Mater. Sci. Eng. A 2009, 503, 185–189. [Google Scholar] [CrossRef]
- Sagaradze, V.V.; Shabashov, V.A. Deformation-induced anomalous phase transformations in nanocrystalline FCC Fe–Ni based alloys. Nanostruct. Mater. 1997, 9, 681–684. [Google Scholar] [CrossRef]
- Ohsaki, S.; Kato, S.; Tsuji, N.; Ohkubo, T.; Hono, K. Bulk mechanical alloying of Cu–Ag and Cu/Zr two-phase microstructures by accumulative roll-bonding process. Acta Mater. 2007, 55, 2885–2895. [Google Scholar] [CrossRef]
- Straumal, B.B.; Dobatkin, S.V.; Rodin, A.O.; Protasova, S.G.; Mazilkin, A.A.; Goll, D.; Baretzky, B. Structure and properties of nanograined Fe–C alloys after severe plastic deformation. Adv. Eng. Mater. 2011, 13, 463–469. [Google Scholar] [CrossRef]
- Sergueeva, A.V.; Song, C.; Valiev, R.Z.; Mukherjee, A.K. Structure and properties of amorphous and nanocrystalline NiTi prepared by severe plastic deformation and annealing. Mater. Sci. Eng. A 2003, 339, 159–165. [Google Scholar] [CrossRef]
- Prokoshkin, S.D.; Khmelevskaya, I.Y.; Dobatkin, S.V.; Trubitsyna, I.B.; Tatyanin, E.V.; Stolyarov, V.V.; Prokofiev, E.A. Alloy composition, deformation temperature, pressure and post-deformation annealing effects in severely deformed Ti-Ni based shape memory alloys. Acta Mater. 2005, 53, 2703–2714. [Google Scholar] [CrossRef]
- Sauvage, X.; Renaud, L.; Deconihout, B.; Blavette, D.; Ping, D.H.; Hono, K. Solid state amorphization in cold drawn Cu/Nb wires. Acta Mater. 2001, 49, 389–394. [Google Scholar] [CrossRef]
- Miyazaki, T.; Terada, D.; Miyajima, Y.; Suryanarayana, C.; Murao, R.; Yokoyama, Y.; Sugiyama, K.; Umemoto, M.; Todaka, T.; Tsuji, N. Synthesis of non-equilibrium phases in immiscible metals mechanically mixed by high pressure torsion. J. Mater. Sci. 2011, 46, 4296–4301. [Google Scholar] [CrossRef]
- Mazilkin, A.A.; Abrosimova, G.E.; Protasova, S.G.; Straumal, B.B.; Schütz, G.; Dobatkin, S.V.; Bakai, A.S. Transmission electron microscopy investigation of boundaries between amorphous “grains” in Ni50Nb20Y30 alloy. J. Mater. Sci. 2011, 46, 4336–4342. [Google Scholar] [CrossRef]
- Straumal, B.B.; Mazilkin, A.A.; Protasova, S.G.; Goll, D.; Baretzky, B.; Bakai, A.S.; Dobatkin, S.V. Formation of two amorphous phases in the Ni60Nb18Y22 alloy after high pressure torsion. Kovove Mater. Metall. Mater. 2011, 49, 17–22. [Google Scholar] [CrossRef]
- Glezer, A.M.; Plotnikova, M.R.; Shalimova, A.V.; Dobatkin, S.V. Severe plastic deformation of amorphous alloys: I. Structure and mechanical properties. Bull. Russ. Acad. Sci. Phys. 2009, 73, 1233–1236. [Google Scholar] [CrossRef]
- Abrosimova, G.E.; Aronin, A.S.; Dobatkin, S.V.; Kaloshkin, S.D.; Matveev, D.V.; Rybchenko, O.G.; Tatyanin, E.V.; Zverkova, I.I. The formation of nanocrystalline structure in amorphous Fe-Si-B alloy by severe plastic deformation. J. Metastab. Nanocryst. Mater. 2005, 24, 69–72. [Google Scholar] [CrossRef]
- Henits, P.; Révész, A.; Zhilyaev, A.P.; Kovács, Z. Severe plastic deformation induced nanocrystallization of melt-spun Al85Y8Ni5Co2 amorphous alloy. J. Alloys Compd. 2008, 461, 195–199. [Google Scholar] [CrossRef]
- Zilbershtein, V.A.; Nosova, G.I.; Estrin, E.I. α-ω transformation in Ti and Zr. Fiz. Met. Metalloved. 1973, 35, 584–589. [Google Scholar]
- Zilbershtein, V.A.; Chistotina, N.P.; Zharov, A.A.; Grishina, N.S.; Estrin, E.I. α-ω transformation in Ti and Zr by shear deformation under pressure. Fiz. Met. Metalloved. 1975, 39, 445–447. [Google Scholar]
- Bridgman, P.W. Rough compressions of 177 substances to 40,000 atm. Proc. Am. Acad. Arts Sci. 1948, 76, 71–87. [Google Scholar] [CrossRef]
- Kutzar, A.R.; Pawlovskii, M.N.; Komissarov, V.V. Observation of a two-wave shock configuration in Titanium. JETP Lett. 1982, 35, 108–112. [Google Scholar]
- Jamieson, J.C. Crystal structures of Titanium, zirconium, and hafnium at high pressures. Science 1963, 140, 72–73. [Google Scholar] [CrossRef] [PubMed]
- Jamieson, J.C.; Lawson, A.W. X-ray diffraction studies in the 100 kilobar pressure range. J. Appl. Phys. 1962, 33, 776–780. [Google Scholar] [CrossRef]
- Jamieson, J.C. Crystal structures at high pressures of metal-lic modification of silicon and germanium. Science 1963, 139, 762–763. [Google Scholar] [CrossRef] [PubMed]
- Jayaraman, A.; Clement, W.; Kennedy, G.C. Solid-solid transitions in Titanium and zirconium at high pressures. Phys. Rev. 1963, 131, 644–649. [Google Scholar] [CrossRef]
- Zhang, J.; Zhao, Y.; Hixon, R.S.; Gray, G.T., III; Wang, L.; Wataru, U.; Saito, H.; Hattori, T. Experimental constraints on the phase diagram of Titanium metal. J. Phys. Chem. Solid 2008, 69, 2559–2563. [Google Scholar] [CrossRef]
- Vohra, Y.K.; Sikka, S.K.; Vaidya, S.N.; Chidambaram, R. Impurity effects and reaction kinetics of the pressure-induced α→ω transformation in Ti. J. Phys. Chem. Solid 1977, 38, 1293–1296. [Google Scholar] [CrossRef]
- Akahama, Y.; Kawamura, H.; Bihan, T.L. New δ (Distorted-bcc) Titanium to 220 GPa. Phys. Rev. Lett. 2001, 87, 275503. [Google Scholar] [CrossRef] [PubMed]
- Vohra, Y.K.; Spencer, P.T. Novel γ-phase of Titanium metal at megabar pressures. Phys. Rev. Lett. 2001, 86, 3068–3071. [Google Scholar] [CrossRef] [PubMed]
- Ming, L.C.; Manghnani, M.; Katahara, M. Phase transformations in the Ti-V system under high pressure up to 25 GPa. Acta Metall. 1981, 29, 479–485. [Google Scholar] [CrossRef]
- Ivanisenko, Y.; Kilmametov, A.; Roesner, H.; Valiev, R.Z. Evidence of α→ω phase transition in Titanium after high pressure torsion. Int. J. Mater. Res. 2008, 99, 36–41. [Google Scholar] [CrossRef]
- Kilmametov, A.R.; Ivanisenko, Y.; Mazilkin, A.A.; Straumal, B.B.; Gornakova, A.S.; Fabrichnaya, O.B.; Kriegel, M.J.; Rafaja, D.; Hahn, H. The α→ω and β→ω phase transformations in Ti–Fe alloys under high-pressure torsion. Acta Mater. 2018, 144, 337–351. [Google Scholar] [CrossRef]
- Straumal, B.B.; Kilmametov, A.R.; Ivanisenko, Y.; Gornakova, A.S.; Mazilkin, A.A.; Kriegel, M.J.; Fabrichnaya, O.B.; Baretzky, B.; Hahn, H. Phase transformations in Ti-Fe alloys induced by high pressure torsion. Adv. Eng. Mater. 2015, 17, 1835–1841. [Google Scholar] [CrossRef]
- Straumal, B.B.; Pontikis, V.; Kilmametov, A.R.; Mazilkin, A.A.; Dobatkin, S.V.; Baretzky, B. Competition between precipitation and dissolution in Cu–Ag alloys under high pressure torsion. Acta Mater. 2017, 122, 60–71. [Google Scholar] [CrossRef]
- Wojdyr, M. Fityk: A general-purpose peak fitting program. J. Appl. Crystallogr. 2010, 43, 1126–1128. [Google Scholar] [CrossRef]
- Lábár, J.L. Consistent indexing of a (set of) SAED pattern(s) with the Process Diffraction program. Ultramicroscopy 2005, 103, 237–249. [Google Scholar] [CrossRef] [PubMed]
- Greeff, C.W.; Trinkle, D.R.; Albers, R.C. Shock-induced α–ω transition in Titanium. J. Appl. Phys. 2001, 90, 2221–2226. [Google Scholar] [CrossRef]
- Tegner, B.E.; Ackland, G.J. Pseudopotential errors in Titanium. Comput. Mater. Sci. 2012, 52, 2–6. [Google Scholar] [CrossRef]
- Mendelev, M.I.; Underwood, T.L.; Ackland, G.J. Development of an interatomic potential for the simulation of defects, plasticity, and phase transformations in Titanium. J. Chem. Phys. 2016, 145, 154102. [Google Scholar] [CrossRef] [PubMed]
- Rawat, S.; Mitra, N. Compression twinning and structural phase transformation of single crystal Titanium under uniaxial compressive strain conditions: Comparison of inter-atomic potentials. Comput. Mater. Sci. 2017, 126, 228–237. [Google Scholar] [CrossRef]
- Dai, J.H.; Song, Y.; Yang, R. Influence of impurities on phase stability of martensites in Titanium. Philos. Mag. 2012, 92, 2272–2285. [Google Scholar] [CrossRef]
- Trinkle, D.R.; Jones, M.D.; Hennig, R.G.; Rudin, S.P.; Albers, R.C.; Wilkins, J.W. Empirical tight-binding model for Titanium phase transformations. Phys. Rev. B 2006, 73, 094123. [Google Scholar] [CrossRef]
- Hennig, R.G.; Lenosky, T.J.; Trinkle, D.R.; Rudin, S.P.; Wilkins, J.W. Classical potential describes martensitic phase transformations between the α, ß, and ω Titanium phases. Phys. Rev. B 2008, 78, 054121. [Google Scholar] [CrossRef]
- Rudin, S.P.; Jones, M.D.; Albers, R.C. Thermal stabilization of the hcp phase in titanium. Phys. Rev. B 2004, 69, 094117. [Google Scholar] [CrossRef]
- Huang, L.-F.; Grabowski, B.; McEniry, E.; Trinkle, D.R.; Neugebauer, J. Importance of coordination number and bond length in Titanium revealed by electronic structure investigations. Phys. Status Solid B 2015, 252, 1907–1924. [Google Scholar] [CrossRef]
- Zarkevich, N.A.; Johnson, D.D. Titanium α → ω phase transformation pathway and a predicted metastable structure. Phys. Rev. B 2016, 93, 020104. [Google Scholar] [CrossRef]
- Jafari, M.; Jahandoost, A.; Vaezzadeh, M.; Zarifi, N. Effect of pressure on the electronic structure of hcp Titanium. Condens. Matter Phys. 2011, 14, 23601. [Google Scholar] [CrossRef]
- Kraposhin, V.S.; Talis, A.L.; Wang, Y.J. Description of polymorphic transformations of Ti and Zr in the framework of the algebraic geometry. Mater. Sci. Eng. A 2006, 438–440, 85–89. [Google Scholar] [CrossRef]
- Ikeda, Y.; Tanaka, I. Stability of the ω structure of transition elements. Phys. Rev. B 2016, 93, 094108. [Google Scholar] [CrossRef]
- Kim, S.-H.; Kang, S.J.; Park, M.-H.; Yang, C.-W.; Lee, H.-C.; Han, H.N.; Kim, M. Vacancy-mediated ω-assisted α-phase formation mechanism in titanium–molybdenum alloy. Acta Mater. 2015, 83, 499–506. [Google Scholar] [CrossRef]
- Duffy, T.S.; Shen, G.; Heinz, D.L.; Shu, J.; Ma, Y.; Mao, H.K.; Hemley, R.J.; Singh, A.K. Lattice strains in gold and rhenium under nonhydrostatic compression to 37 GPa. Phys. Rev. B 1999, 60, 15063. [Google Scholar] [CrossRef]
- Loubeyre, P.; le Toulec, R.; Häusermann, D.; Hanfland, M.; Hemley, R.; Mao, H.K.; Finger, L.W. X-ray diffraction and equation of state of hydrogen at megabar pressures. Nature 1996, 383, 702–704. [Google Scholar] [CrossRef]
- Kilmametov, A.; Ivanisenko, Y.; Straumal, B.B.; Mazilkin, A.A.; Gornakova, A.S.; Kriegel, M.J.; Fabrichnaya, O.B.; Rafaja, D.; Hahn, H. Transformations of α′ martensite in Ti–Fe alloys under high pressure torsion. Scr. Mater. 2017, 136, 46–49. [Google Scholar] [CrossRef]
- Edalati, K.; Matsubara, E.; Horita, Z. Processing pure Ti by high-pressure torsion in wide ranges of pressures and strain. Metall. Mater. Trans. A 2009, 40, 2079–2086. [Google Scholar] [CrossRef]
Figure 1.
Transmission electron micrograph and electron diffraction pattern of the Ti–2 wt % Co as-cast alloy subjected to HPT at 7 GPa, 1 rpm, and five rotations: (a) bright field image with inset (upper right corner) showing the selected area electron diffraction pattern; (b) dark field image; and (c) radial intensity distribution respective to the diffraction pattern. Intensities were integrated along the Debye rings. Red bar charts show the positions of the reflections from α-Ti. Blue bar charts show the positions of the reflections from ω-Ti.

Figure 2.
High-resolution transmission electron (HRTEM) micrograph of the Ti–2 wt % Co as-cast alloy subjected to HPT at 7 GPa, 1 rpm, and five rotations. The contact between two nanograins of α-phase and ω-phase is shown. Corresponding fast Fourier transformations (FFTs) are shown for α- and ω-phases. In ω-phase, the section of the reciprocal lattice with FN = and that in α-phase with FN = [0001] are shown. Two-dimensional networks corresponding to these FNs are shown in FFTs.

Figure 3.
X-ray diffraction patterns of Ti–2 wt % Co alloy: (a) initial (bottom), compressed under 7 GPa (middle) and subjected to HPT at 2 GPa (top); and (b) subjected to HPT at 3 GPa (bottom), 4 GPa (middle) and 7 GPa (top). The patterns are vertically shifted for clarity.
Figure 3.
X-ray diffraction patterns of Ti–2 wt % Co alloy: (a) initial (bottom), compressed under 7 GPa (middle) and subjected to HPT at 2 GPa (top); and (b) subjected to HPT at 3 GPa (bottom), 4 GPa (middle) and 7 GPa (top). The patterns are vertically shifted for clarity.
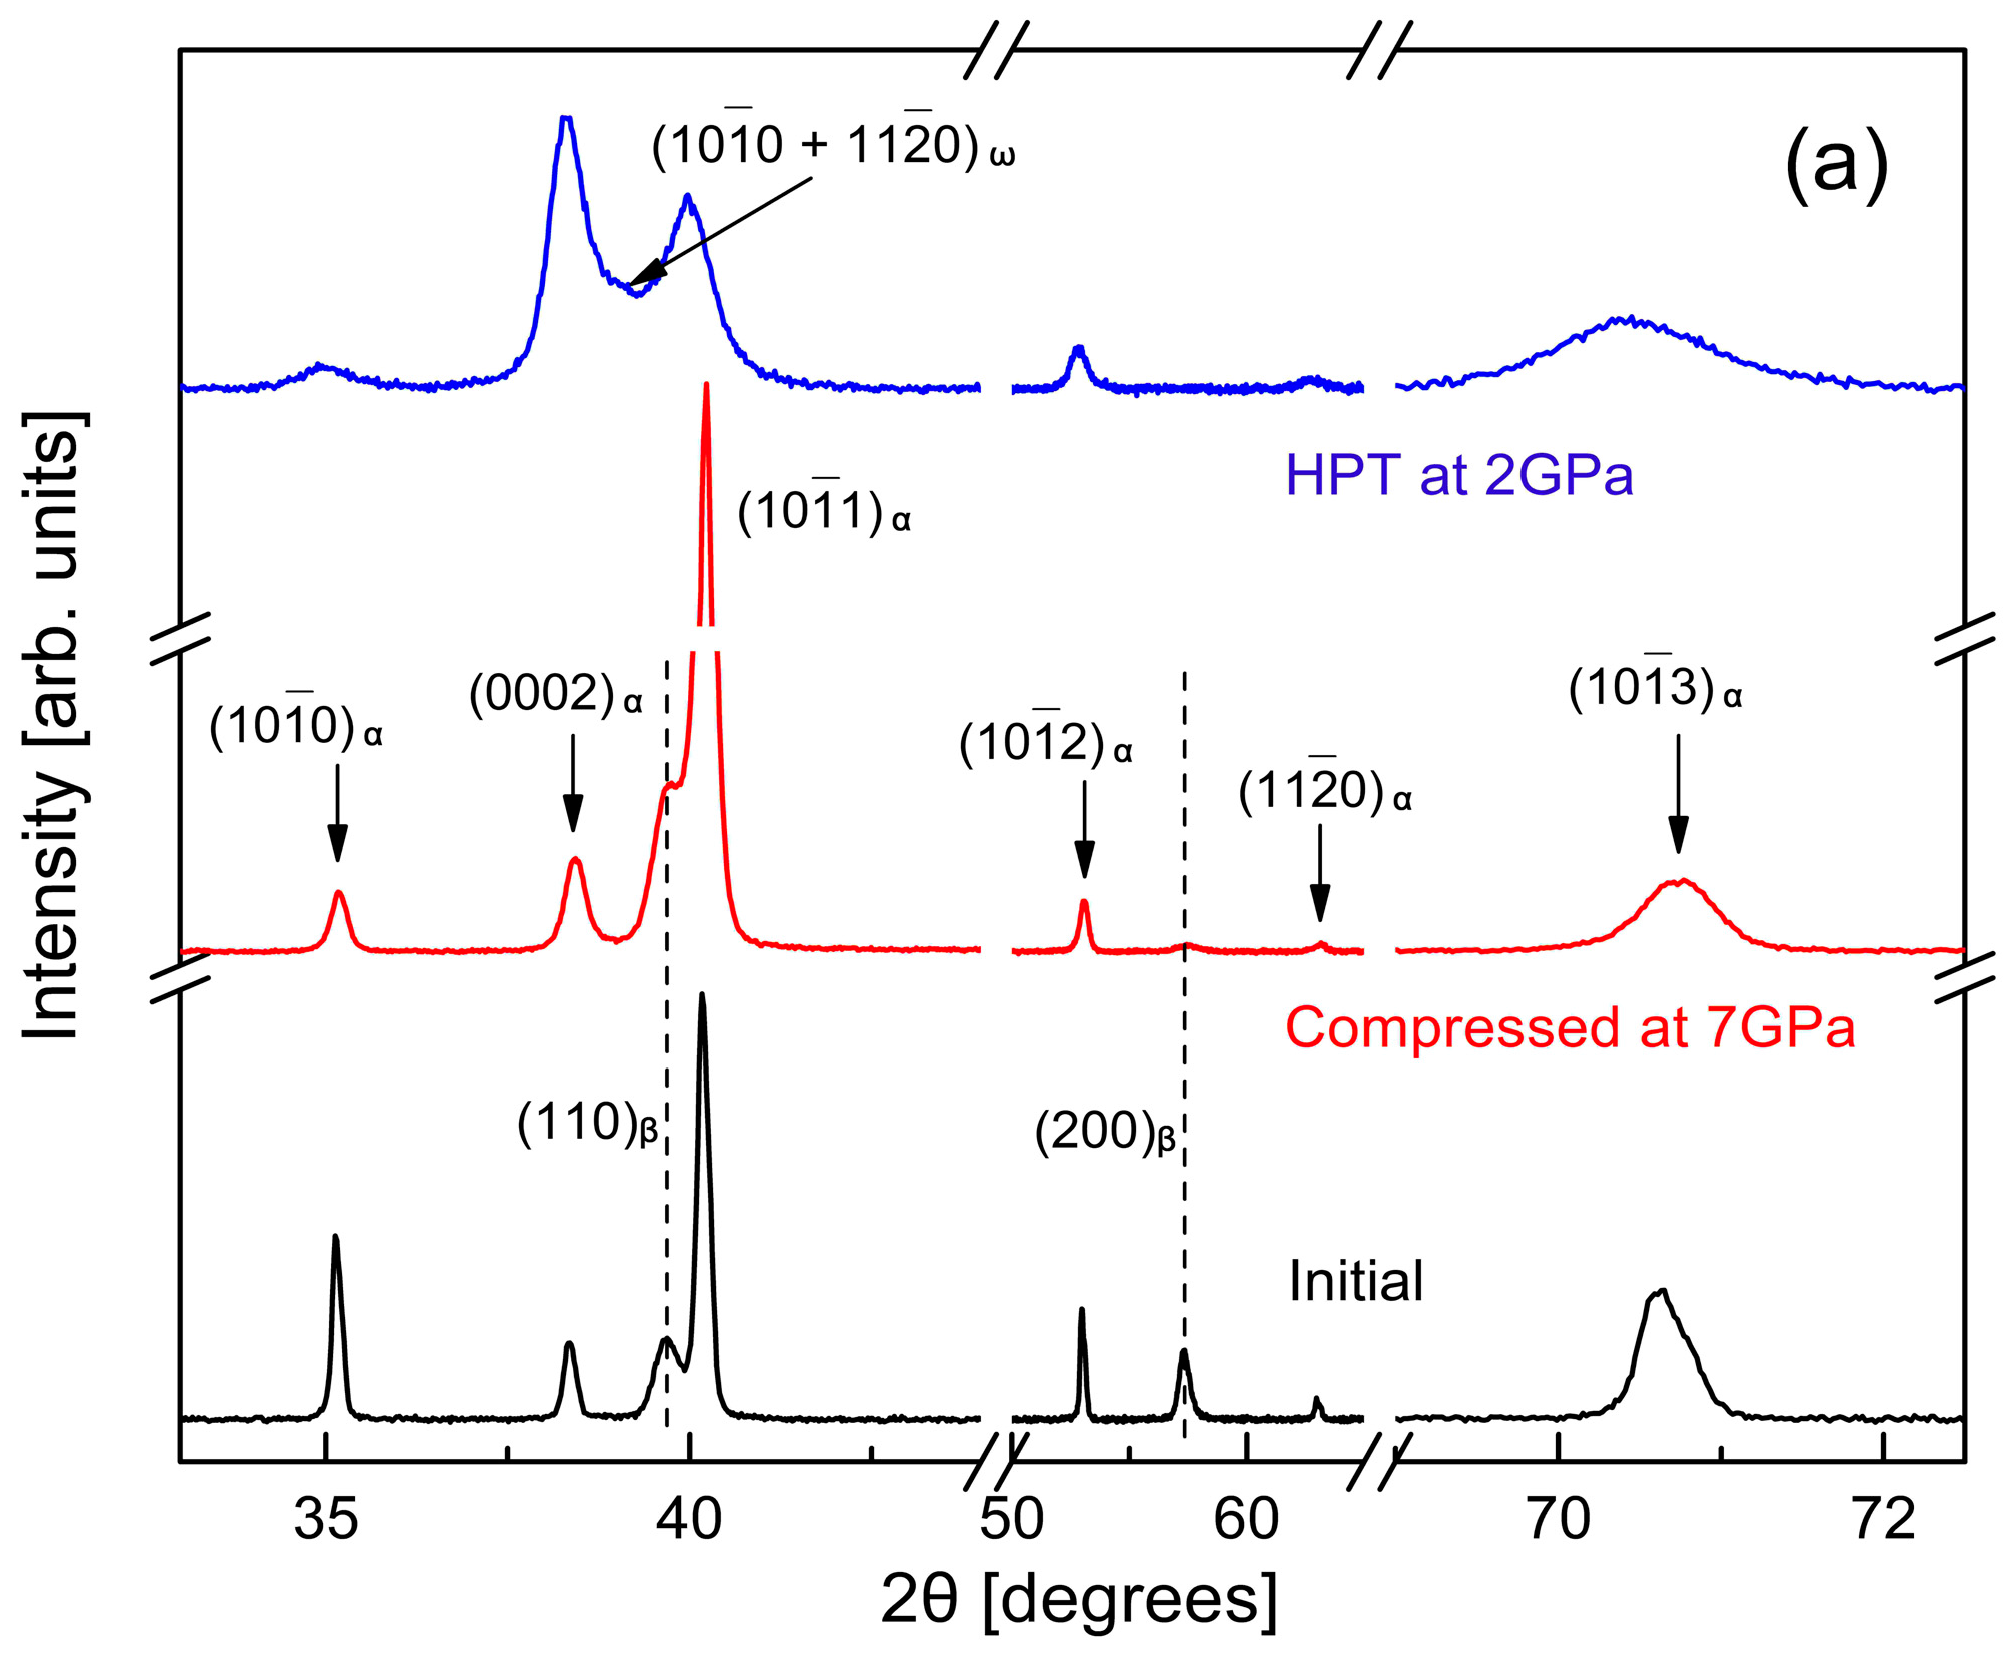
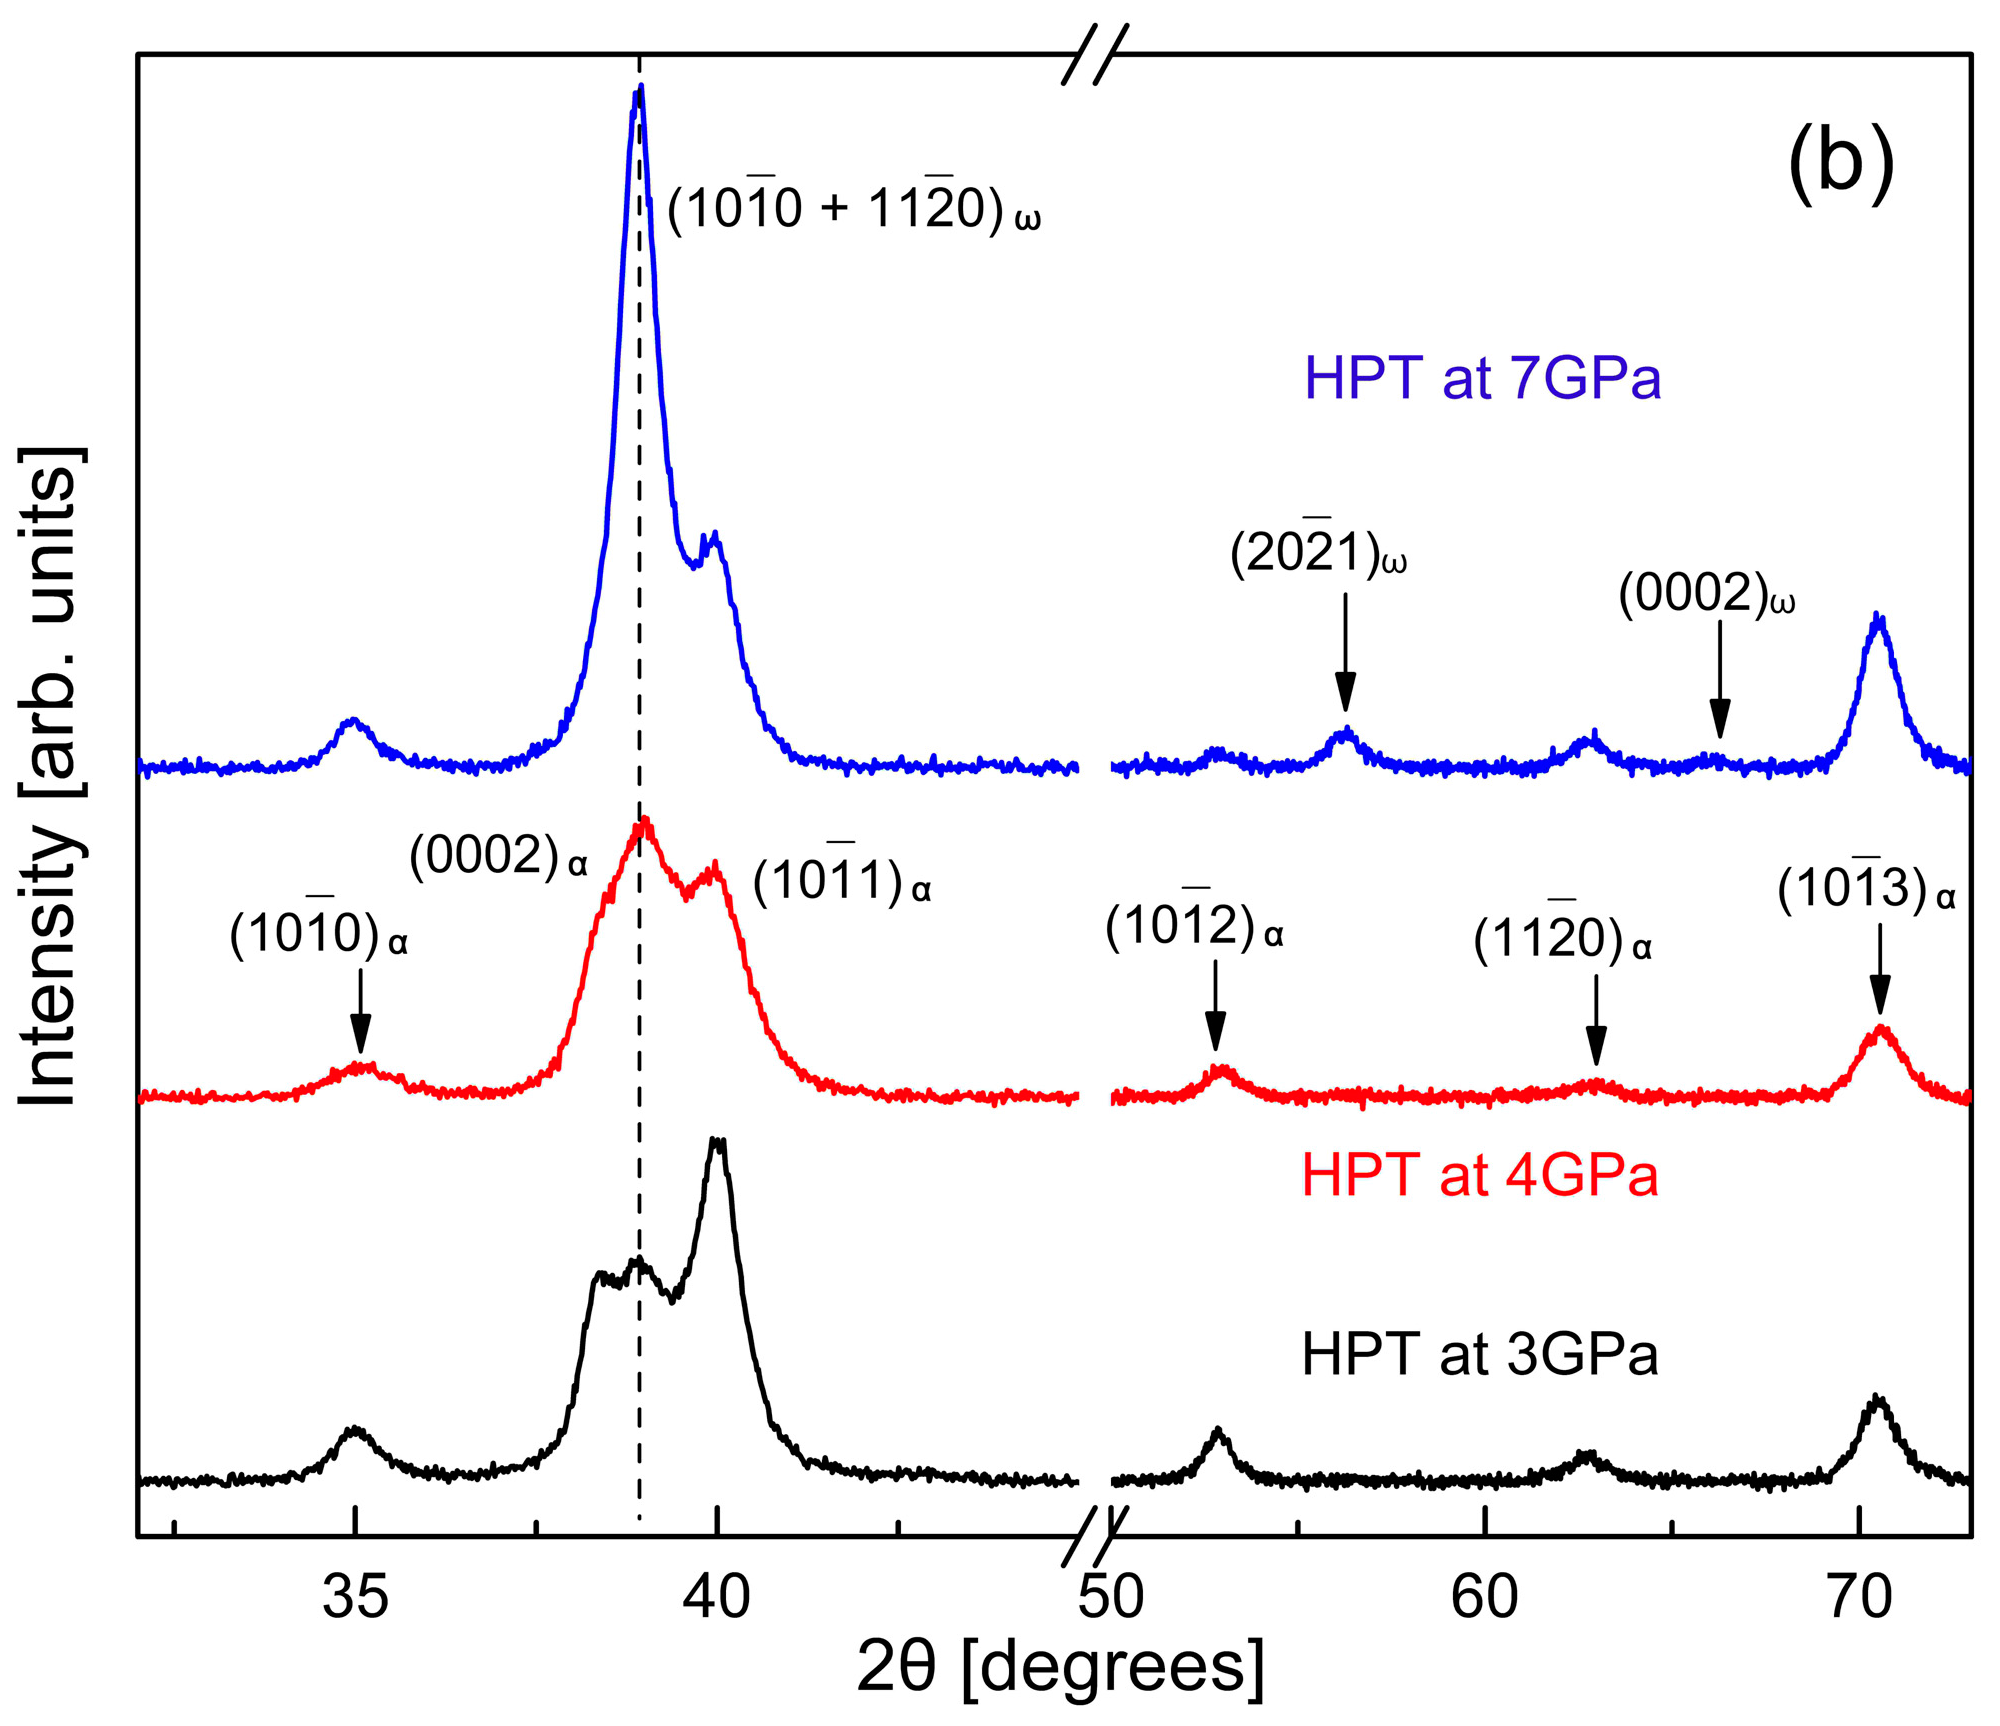
Figure 4.
Pressure dependence of the volume fraction of ω-phase after HPT in pure titanium (squares) [18], Ti–2 wt % Co alloy (circles) and Ti–4% Co alloy (cross).
Figure 4.
Pressure dependence of the volume fraction of ω-phase after HPT in pure titanium (squares) [18], Ti–2 wt % Co alloy (circles) and Ti–4% Co alloy (cross).
© 2017 by the authors. Licensee MDPI, Basel, Switzerland. This article is an open access article distributed under the terms and conditions of the Creative Commons Attribution (CC BY) license (http://creativecommons.org/licenses/by/4.0/).
Share and Cite
MDPI and ACS Style
Kilmametov, A.R.; Ivanisenko, Y.; Straumal, B.B.; Gornakova, A.S.; Mazilkin, A.A.; Hahn, H. The α → ω Transformation in Titanium-Cobalt Alloys under High-Pressure Torsion. Metals 2018, 8, 1. https://doi.org/10.3390/met8010001
AMA Style
Kilmametov AR, Ivanisenko Y, Straumal BB, Gornakova AS, Mazilkin AA, Hahn H. The α → ω Transformation in Titanium-Cobalt Alloys under High-Pressure Torsion. Metals. 2018; 8(1):1. https://doi.org/10.3390/met8010001
Chicago/Turabian StyleKilmametov, Askar R., Yulia Ivanisenko, Boris B. Straumal, Alena S. Gornakova, Andrey A. Mazilkin, and Horst Hahn. 2018. "The α → ω Transformation in Titanium-Cobalt Alloys under High-Pressure Torsion" Metals 8, no. 1: 1. https://doi.org/10.3390/met8010001
Note that from the first issue of 2016, this journal uses article numbers instead of page numbers. See further details here.