Article

Investigation of Structural-Phase States and Features of Plastic Deformation of the Austenitic Precipitation-Hardening Co-Ni-Nb Alloy

by
Aidyn Tussupzhanov
1,2,3,*,
Dosym Yerbolatuly
1,
Ludmila I. Kveglis
1,3 and
Aleksander Filarowski
2,4,5
1
S. Amanzholov East Kazakhstan State University, Department of Physics and Technology, 30 Gvardeiskoi Divisii Str. 34, 070020 Ust-Kamenogorsk, Kazakhstan
2
Faculty of Chemistry, Wroclaw University, F. Joliot-Curie Str. 14, 50-383 Wroclaw, Poland
3
Polytechnical Institute of Siberian Federal University, Svobodny Ave 79, 660041 Krasnoyarsk, Russia
4
Frank Laboratory of Neutron Physics, JINR, 141-980 Dubna, Russia
5
Department of Physics, Industrial University of Tyumen, 625-000 Tyumen, Russia
*
Author to whom correspondence should be addressed.
Metals 2018, 8(1), 19; https://doi.org/10.3390/met8010019
Submission received: 6 November 2017 / Revised: 11 December 2017 / Accepted: 23 December 2017 / Published: 30 December 2017

Abstract

:
This article presents the results of investigation of the influence of holding temperature during the quenching process on the microstructure and superplasticity of the Co-Ni-Nb alloy. Temperature-strain rate intervals of the deformation of the superplasticity effects are stated. The optimal regimes of the preliminary treatment by quenching and rolling as well as the routine of the superplastic deformation of the Co-Ni-Nb alloy are defined. The interval of the temperatures of the precipitation, morphology, composition, type and parameters of the lattice of the secondary phase, which appears after the annealing + rolling (to 90%) Co-Ni-Nb alloy, are determined.

1. Introduction

The application of the superplasticity (SP) effect in the technology of metal treatment under pressure enables the production of metallic parts of complex configuration in a single operation. This approach reduces energy consumption and cost of the items and increases labor productivity [1,2,3]. Therefore, of specific interest are high-strength disperse-hardening alloys with the base of cobalt and nickel, which are highly resistant to treatment and become fragile after standard methods of treatment [4]. The paper [5] presents phase diagrams of the triple Co-Ni-Nb systems, where there were performed identification of phases that may form at the micro level, to predict how the microstructure changes upon the heat treatment used. Most effort has been focused on mechanisms of superplasticity [6]. A practical application of the SP of alloys poses important problems to be solved: the features of the precipitation and parameters of particles of the secondary phases, as well as the detection of basic and accommodative mechanisms of superplastic deformation (SPD). The understanding of these phenomena will allow for a deeper insight into the nature of superplasticity of alloys, and form the basis for the development of new methods of treatment for the design of structures with optimal technological properties. So far the literature has presented no data on the influence of holding temperature before quenching on superplastic properties of the Co-Ni-Nb alloy and the contradictory information about the secondary phases, defined in the given alloy. Such types of alloys are employed as a conducting spring in dental lighting devices [7].
Therefore, this suggests the following tasks:
  • The influence of quenching temperature on the structure and superplastic properties of the Co-Ni-Nb alloys;
  • The study of peculiarities of the formation of fine-grained superplastic structures at the annealing temperature of the rolled samples;
  • The influence of structure and phase composition on the superplasticity of an alloy;
  • The definition of optimal deformation regime.

2. Materials and Methods

The Co-Ni-Nb alloy samples were prepared in accordance with GOST-9651-84 and had chemical composition: base—Co, wt. 28%-Ni, wt. 5%-Nb, wt. 0.2%-Si. The quenching was performed in room temperature water. The deformation treatment was performed on a standard rolling mill. The thermal treatment of the samples was carried out in a tube-type furnace “SUOL-4” (Tula-Therm, Tula, USSR) in quartz tubes, where vacuum was maintained with a residual pressure less than 10−3 MPa. The superplastic deformation was completed on the 1246R device in vacuum with a residual pressure 10−5 MPa. The study of a microstructure was made on “HITACHI S-3400N” (HITACHI, Japan) in the scanning electron microscope by the regime of secondary electrons under the accelerating tension of 25 kV voltage. The analysis of a phase state of the samples was performed on the X-ray diffractometer “DRON-3” with using Co Kα and Cu Kα X-rays (Burevestnik inc, St. Petersburg, Russia). The elemental analysis was performed by the energy dispersive X-ray fluorescence spectrometer SRV-1 (TechnoAnalit, Ust-Kamenogorsk, Kazahstan). The tube with a molybdenum anode BS-1 (U = 25 kV, I = 30 mA) and the energy resolution semiconductor detector were used (170 eV). The exposure time was 180 s. The Scanning Electron Microscopy (SEM) images were prepared using Hitachi S-3400N equipped with detector EDS Thermo Scientific Ultra Dry operating at 5 kV/10 kV. Microhardness measurements of the samples were performed on a PMT-3 microhardener (GEO-NDT, Moscow, Russia), with an indentor load P = 100 and a holding time of 10 s. As an indenter, a regular tetrahedral diamond pyramid with a vertex angle of 136° was used to measure the microhardness, similar to the method for determining the Vickers hardness.

3. Results and Discussion

3.1. Structural-Phase State of Co-Ni-Nb Alloy after the Quenching

The metallographic (Figure 1a) and X-ray diffraction (Figure 2a (2)) studies show that quenching of the Co-Ni-Nb alloy at 1423 K for 10 min creates a one phase state with the formation of homogeneous solid solution Nb in Co-Ni matrix, having face-centered cubic lattice with a parameter a = 0.356 nm. The microstructure of the initial state sample of the Co-Ni-Nb alloy is characterized by equigranular grains and the presence of twins, which are traced in almost every grain (Figure 1a,b). The average size of grains determined by the intercept method is about 30 µm (Figure 2a). However, according to the data presented in paper [8], which revealed the quenching temperature and the influence of the regime of the consequent ageing on the service properties of the Co-Ni-Nb alloy, the most optimal combination of the durability properties (the relaxation stability and low electric resistance) is reached as a result of quenching at 1223 K (10 min) and ageing at 873 K (5 h).
The data obtained by the methods of optic microscopy (Figure 1b) and X-ray diffraction analysis (Figure 2a) also establish that the Co-Ni-Nb alloy takes the state of only one γ-phase in solid solution both after quenching at 1223 K (10 min) and after quenching at a much higher temperature than 1423 K. The structure of the alloy quenched at 1223 K features grains of less size (d = 18 µm) and much fewer twins (Figure 1b).

3.2. The Results of the Studies of the Secondary Phase of Co-Ni-Al Alloy

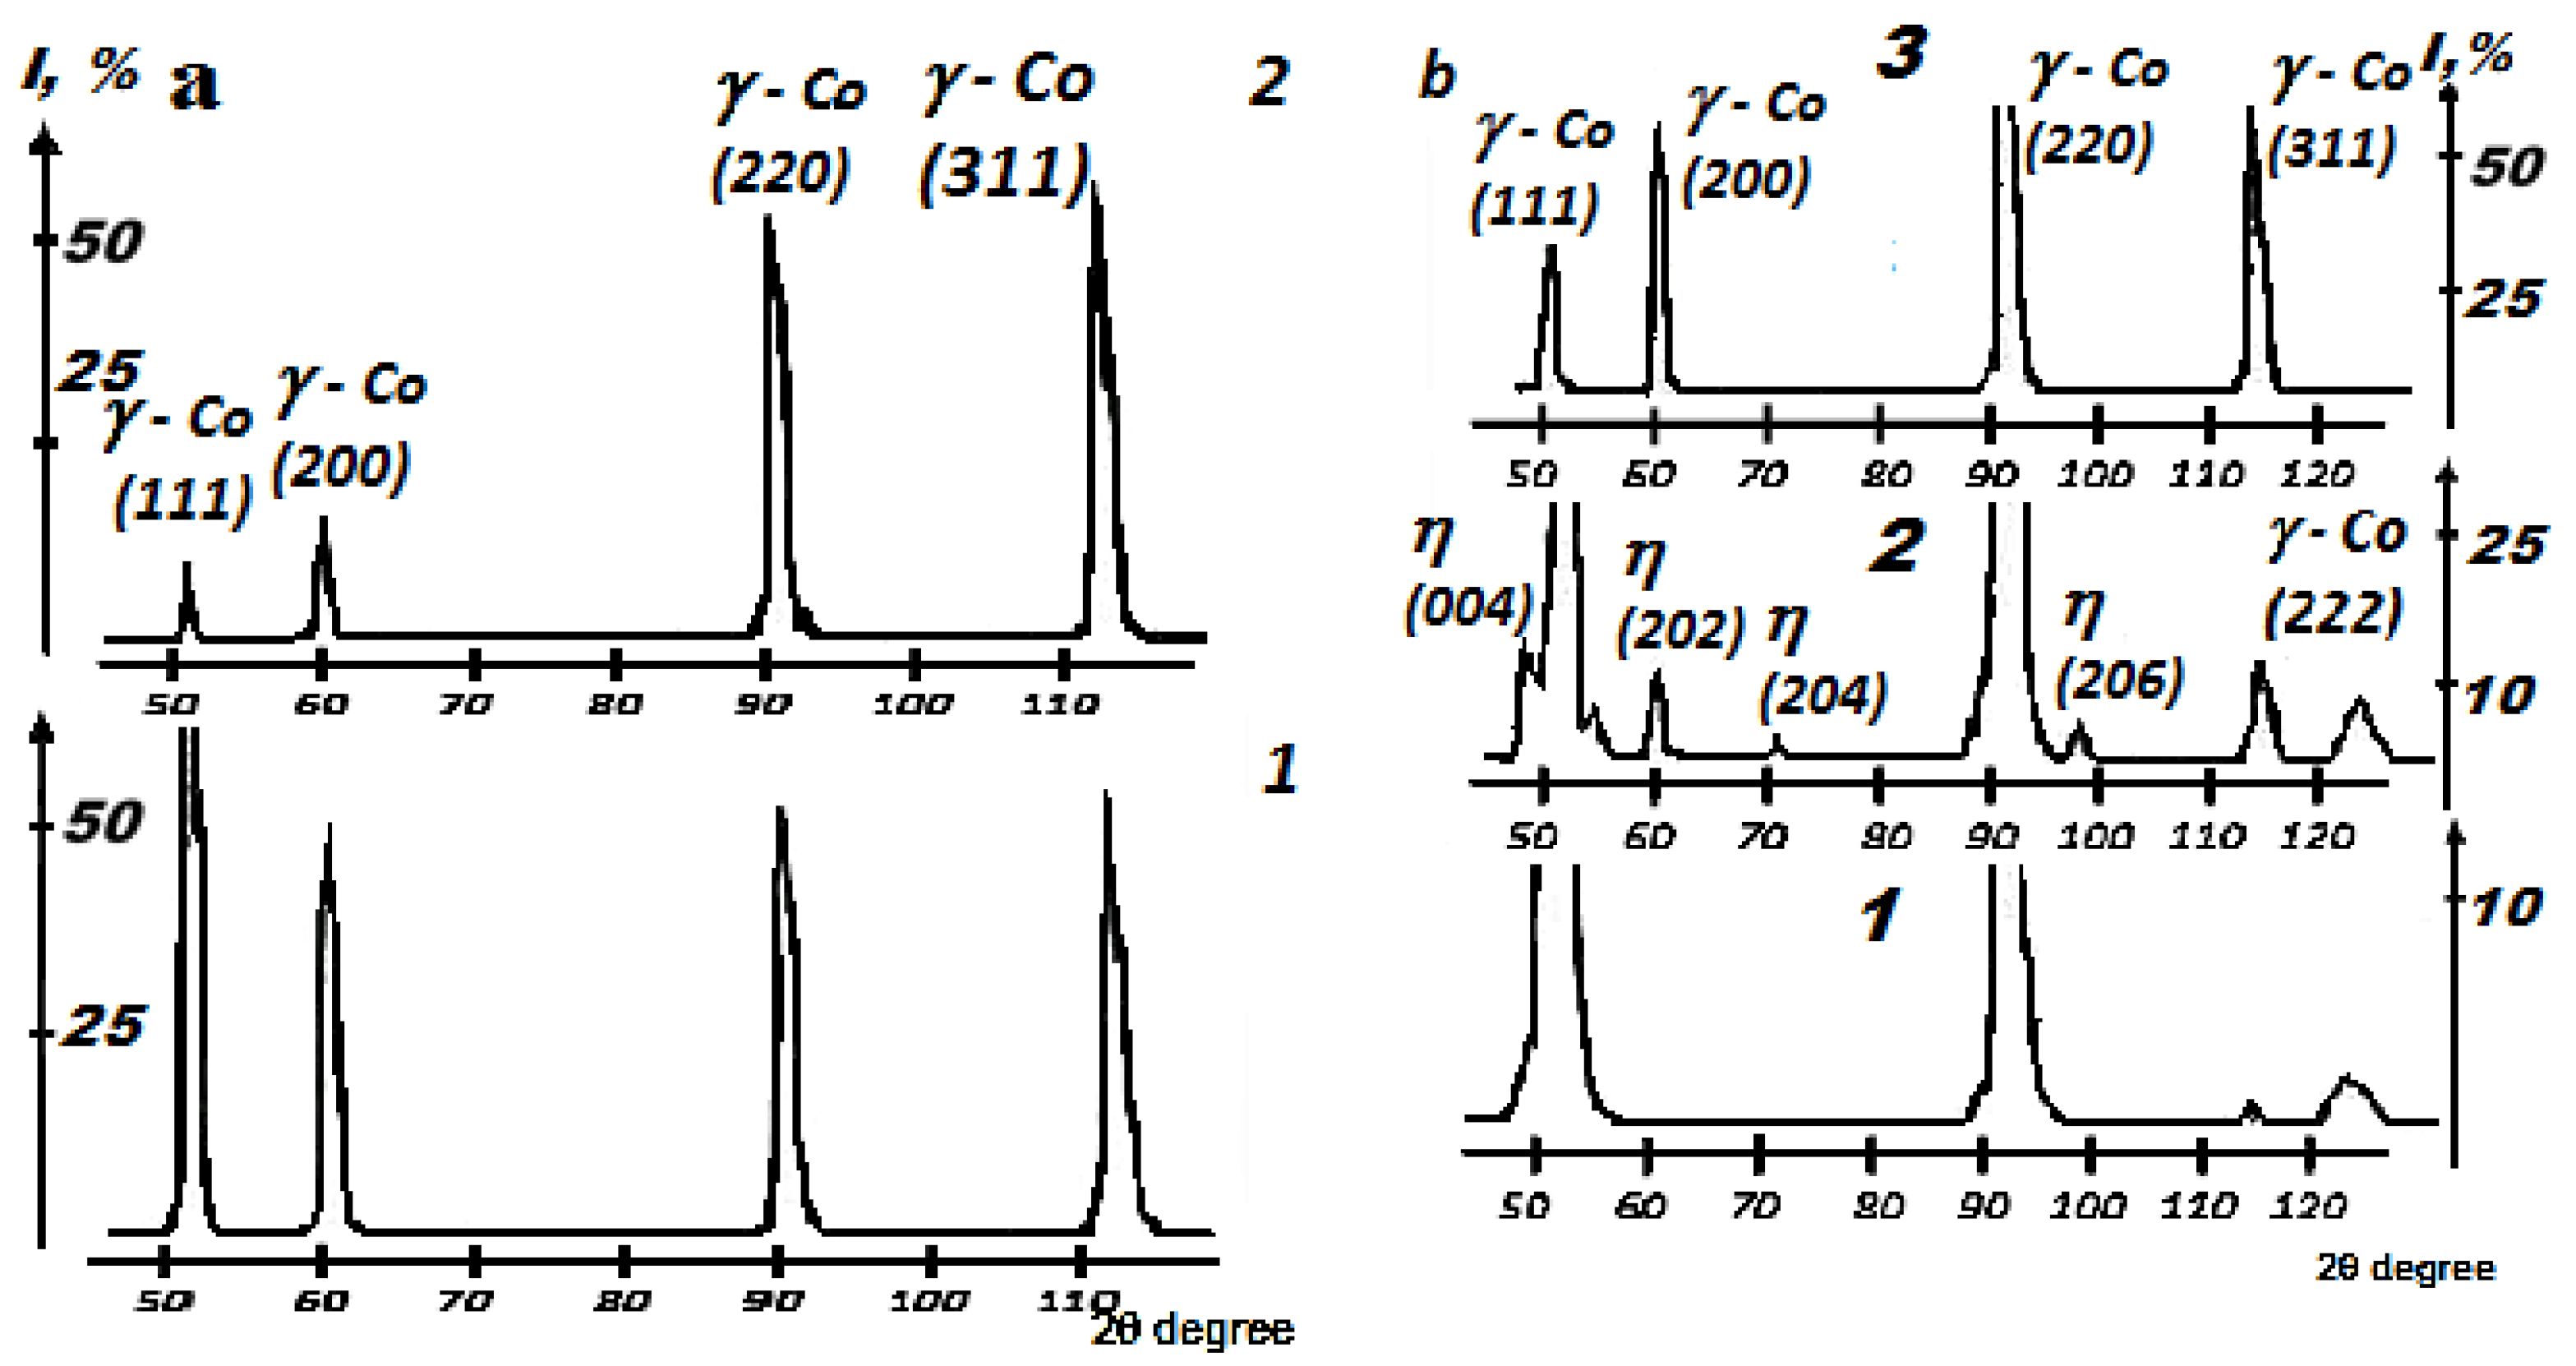
Annealing at 773 K (1 h) + rolling (90%) the Co-Ni-Nb alloy did not evoke decomposition of γ-phase of solid solution (Figure 2b). The X-ray diffraction of annealing at 973 K of alloy shows reflexes of the secondary phase with the hexagonal close-packed (HCP) lattice (Figure 2b). The electron microscopy (Figure 3 and 
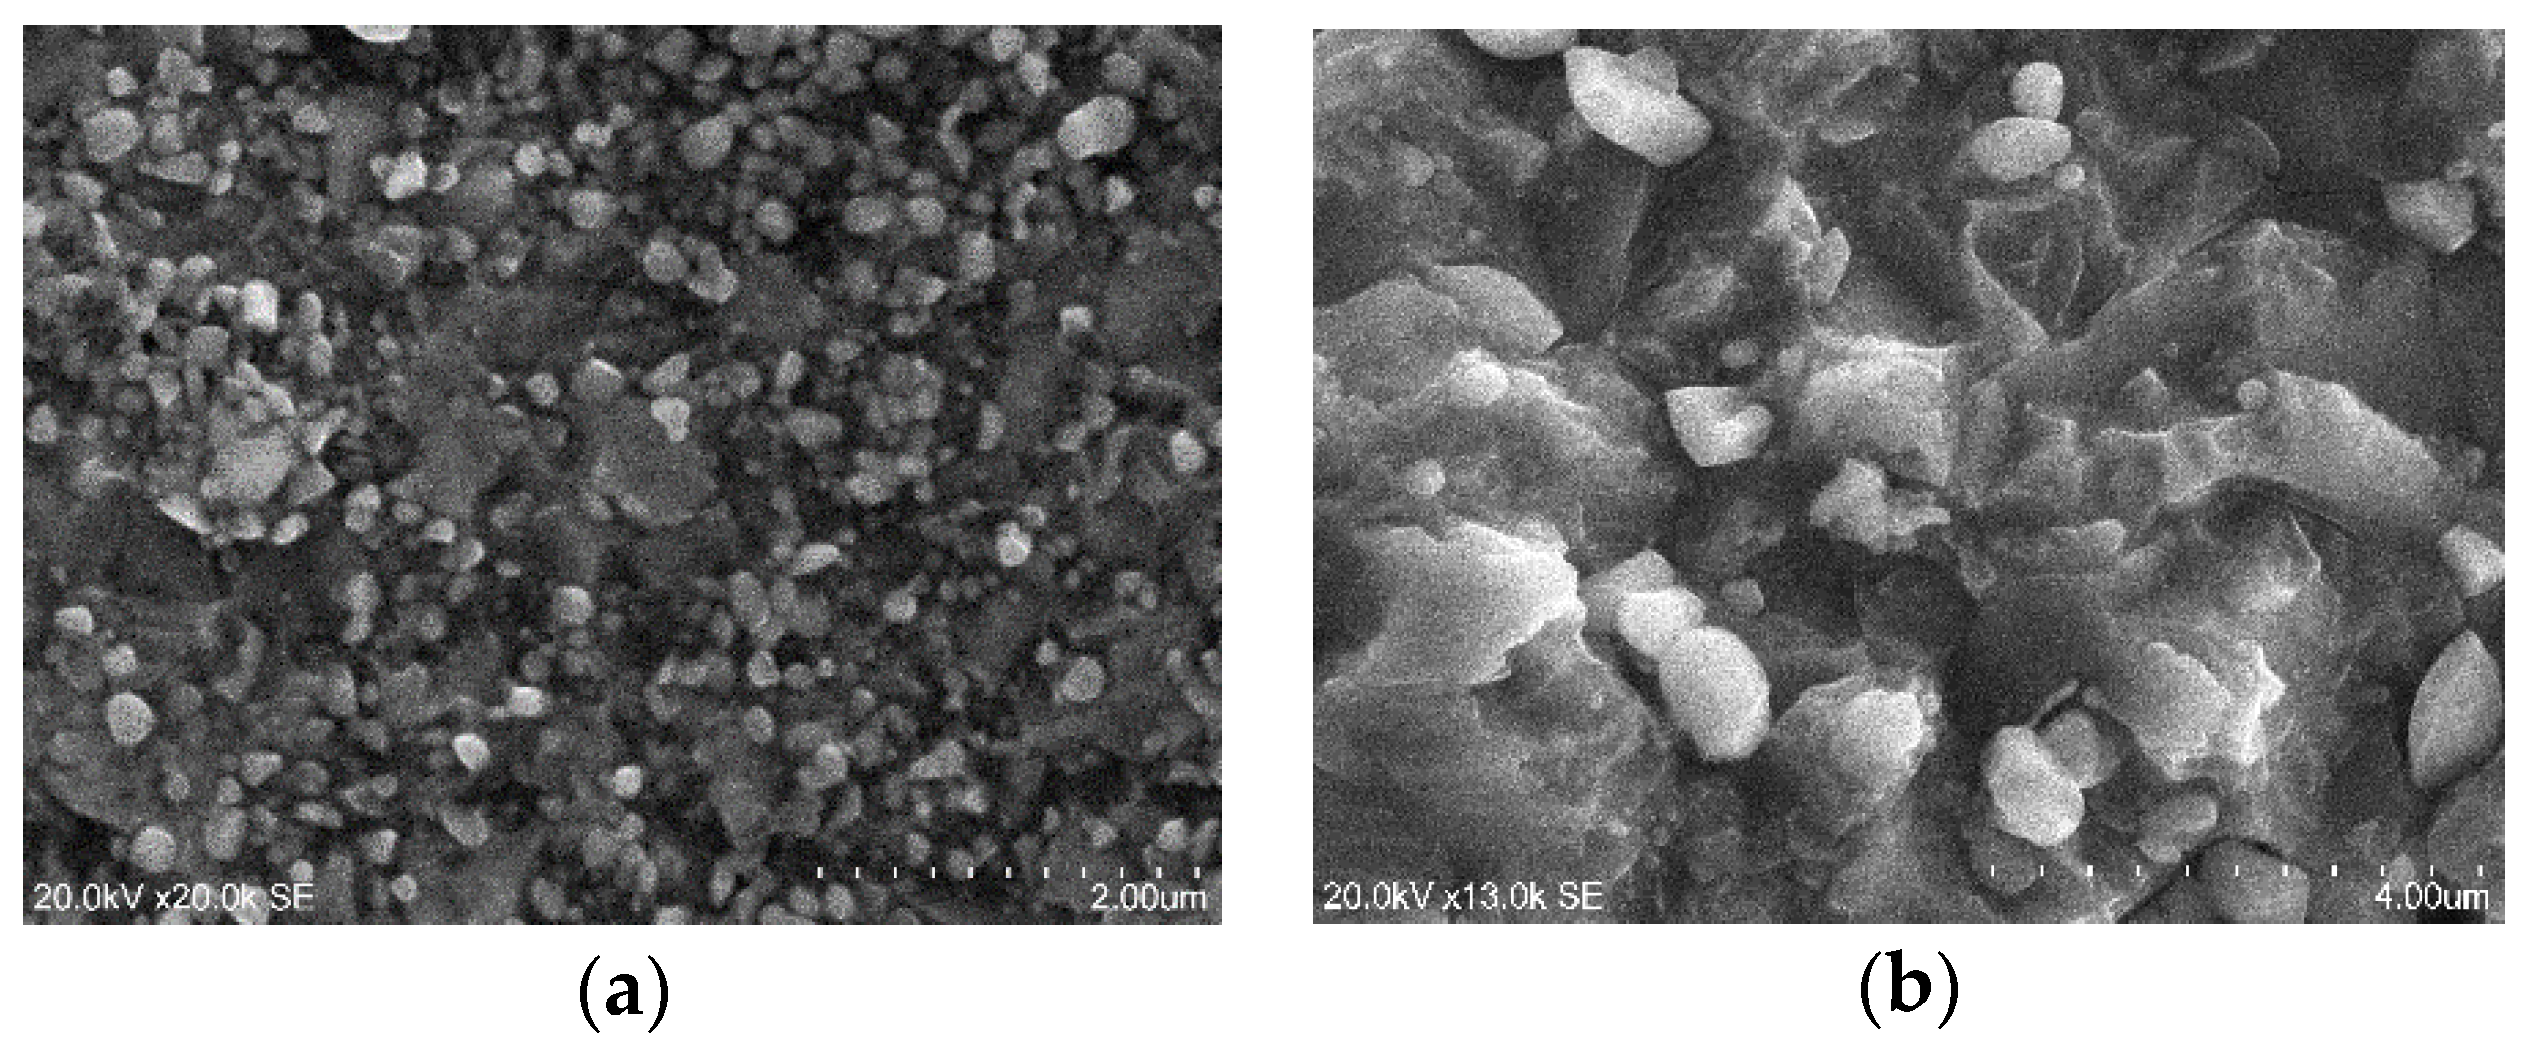
Figure 4) and metallographic methods confirm the appearance of the secondary phase of spherical shape after rolling (90%) and annealing of the Co-Ni-Nb alloy.
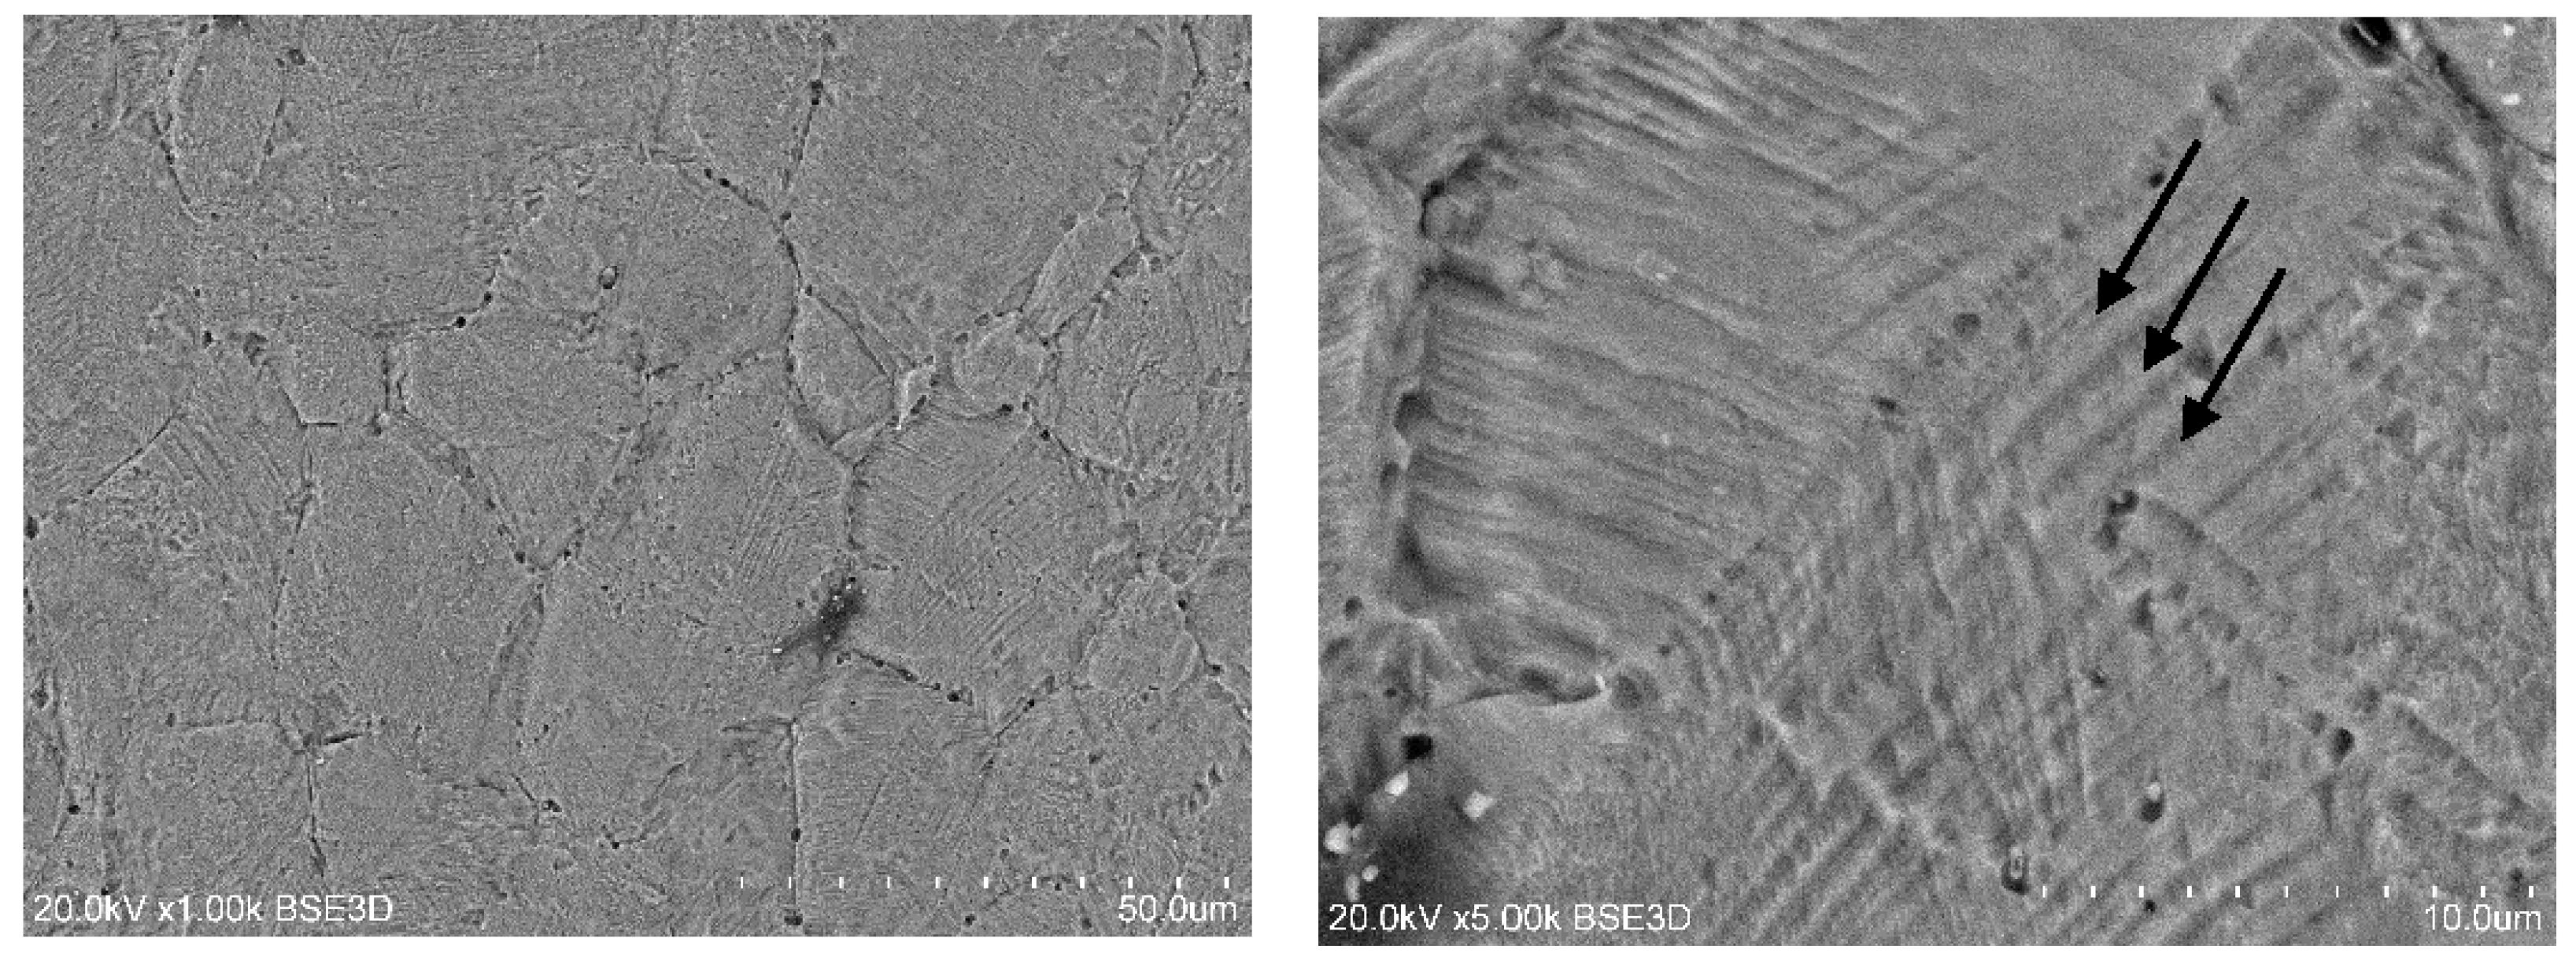
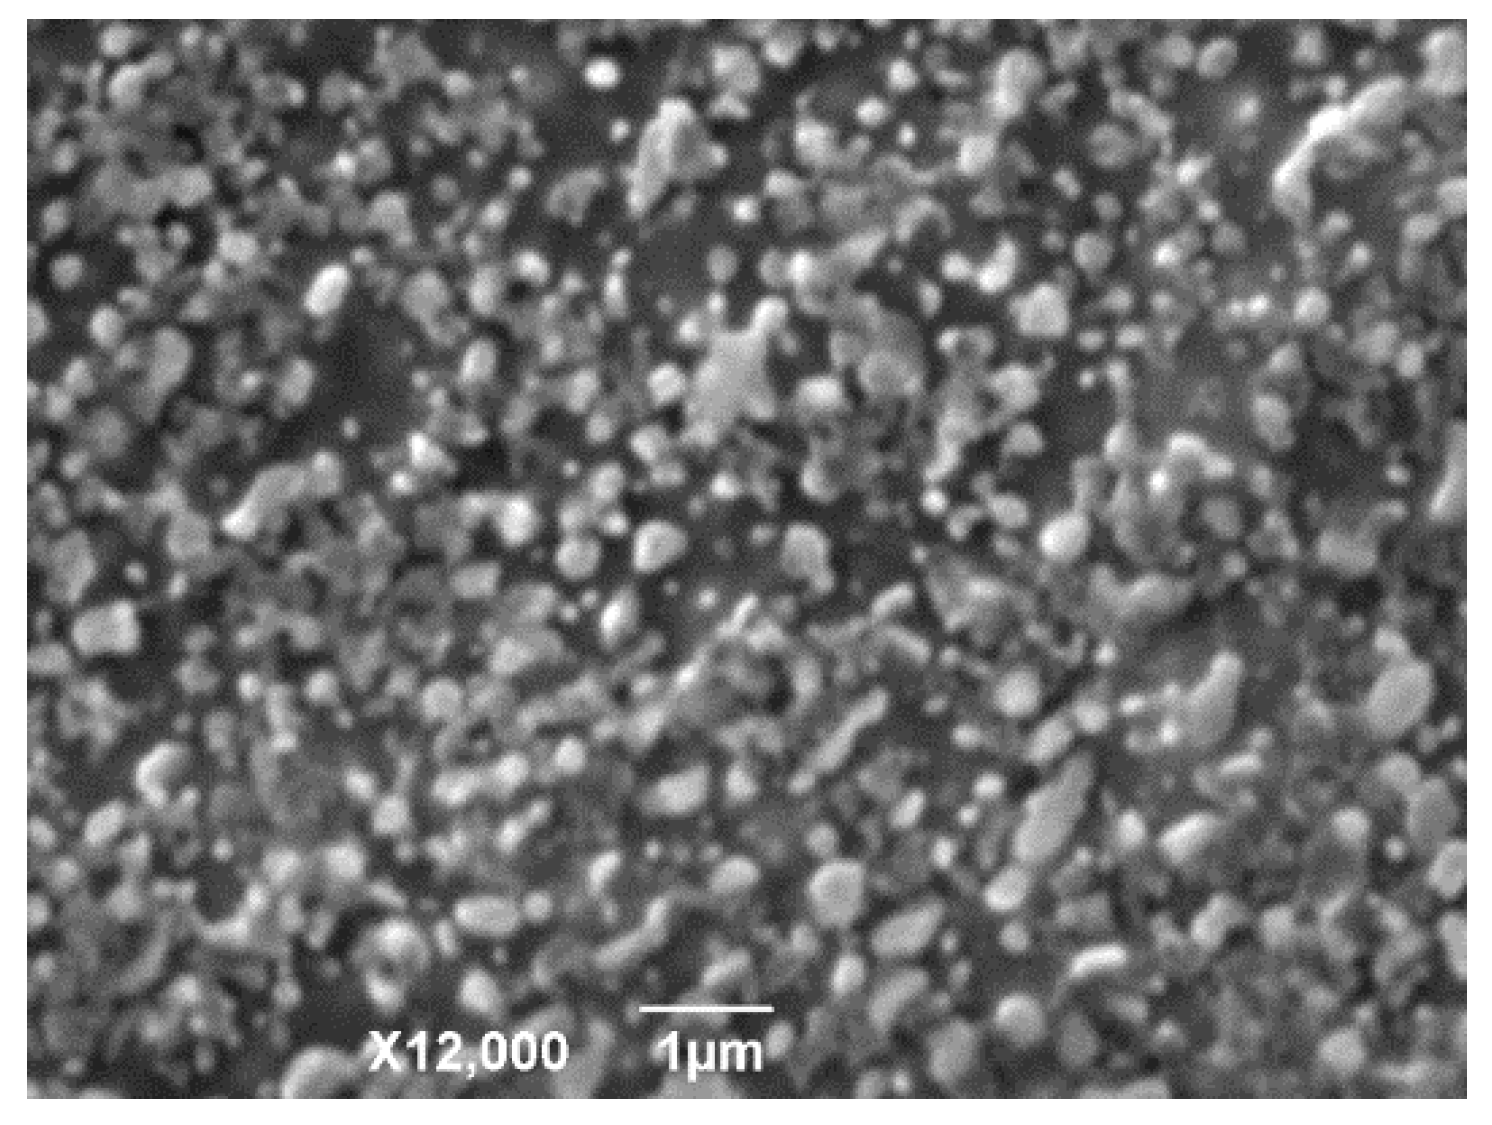
The analysis of the structure of the surface of the Co-Ni-Nb alloy by the scanning electron microscopy makes it possible to state that particles of the secondary phase at tempering can precipitate not only on the edges of grains (Figure 3a) but also inside in their volume. As a result, at the initial stage of decomposition of the alloy a matrix structure with finer particles of the secondary phase is formed (Figure 3b). The size of the matrix grains equals <d> = 2–3 µm after annealing at 1153 K (25 min), and the size of particles of the precipitation is <d> = 0.2–0.4 µm.
With the elongation of the annealing time up to 1 h, earlier precipitated particles inside new grains quickly dissolve. As a result, particles merge at the boundary of the grains due to the inflow of released atoms.
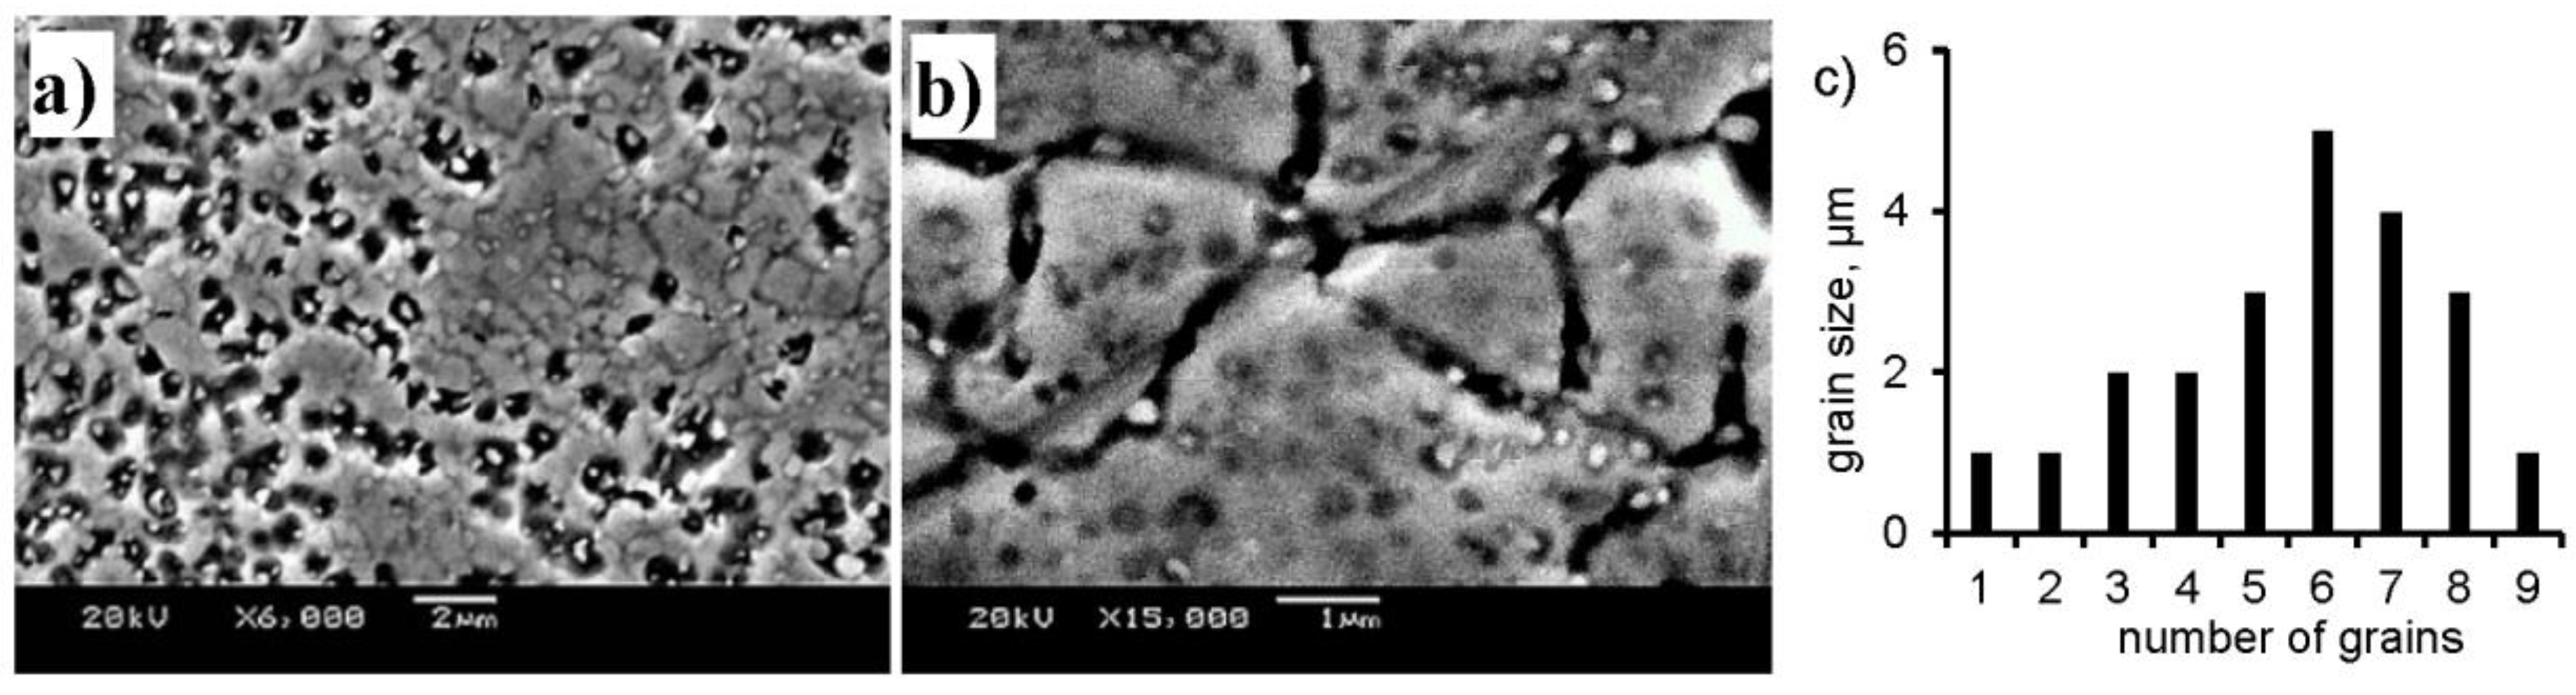
HCP phase of precipitation starts from the ageing temperature at 923–973 K. After 4 h of annealing at 1073 K the size of particles of the secondary η-phase begin growing and the alloy has two-phase micro duplex structure of grains with the equiaxed grain (Figure 4). The body of the grains is almost free from dislocation, and the size of secondary phases grains is smaller than 1 µm. A similar type of structure of grains with the non-coherent high angle grain boundaries is considered favorable for the realization of the superplasticity effect.
In this paper, the parameters of the lattice, the composition of dark particles in hexagonal close-packed (HCP) phase (Figure 4) are established by the X-ray and electron-microscopic analysis. HCP phase have lattice parameters a = 5.62 Å and c = 7.90 Å. It is noteworthy that under the annealing of the rolled (90%) Co-Ni-Nb alloy particles of HCP phase precipitating within the interval of 973 K–1153 K take a spherical shape. This result differs from that presented in referennce [8,9], where particles had a plate shape. Paper [9] stated that the ageing of the Co-Ni-Nb alloy evokes precipitation of the equiaxed particles of the high-temperature stable phase within the interval of 1123–1223 K.
Rolling and annealing of the Co-Ni-Nb alloy, preliminary quenched from the temperature higher than 1223 K (10 min), results in the formation of two-phase micro duplex structure under a continuous recrystallization and precipitation of the secondary phase. However, it is stated that the temperature interval of HCP-phase precipitation is expanding significantly and covers the range of 873–1213 K, which is 90 K larger than after the annealing at 1423 K (10 min). This fact explains the temperature decrease of the annealing of the Co-Ni-Nb alloy from 1423 K to 1223 K, because the thermal processing of similar hetero-phase alloys usually brings about the expanding of the temperature interval of precipitation and stabilization of secondary phases, which improves the exploiting properties.
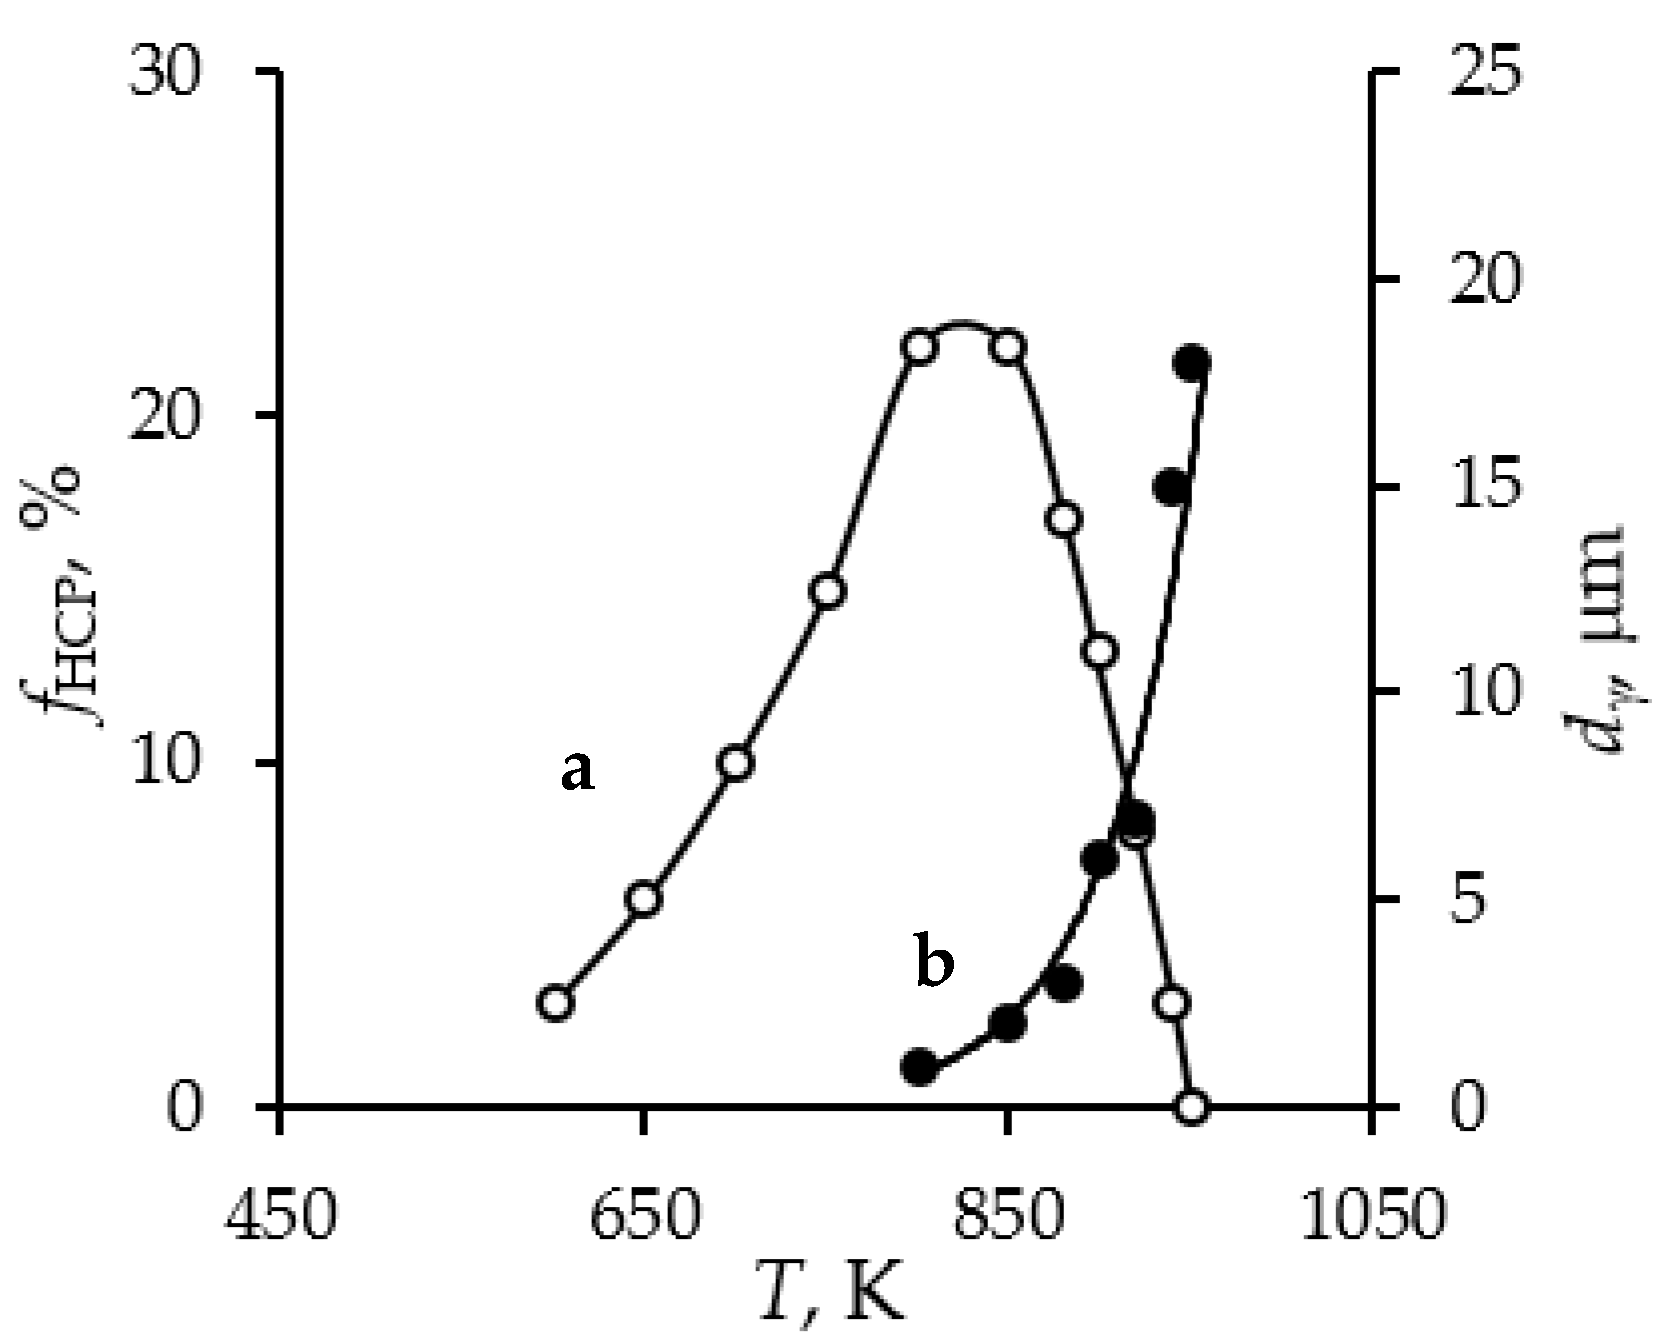
The character of the dependence of both volume faction of HCP-phase and grain size of the matrix on the annealing temperature has been defined. A visible precipitation of the HCP-phase starts at 873 K and, under further temperature increase, grows, reaching the maximum value at 1073–1123 K (Figure 5 curve-a). Dissolution of the particles of HCP-phase in the matrix above 1123 K and the consequent reduction of its volume faction evoke the dramatic growth of the matrix grains (Figure 5 curve-b). The obtained results show that the particles of HCP-phase precipitated under the annealing of rolled (90%) Co-Ni-Nb alloy hinder the growth of matrix grains and, therefore, stabilize the microstructure in the wide temperature interval.
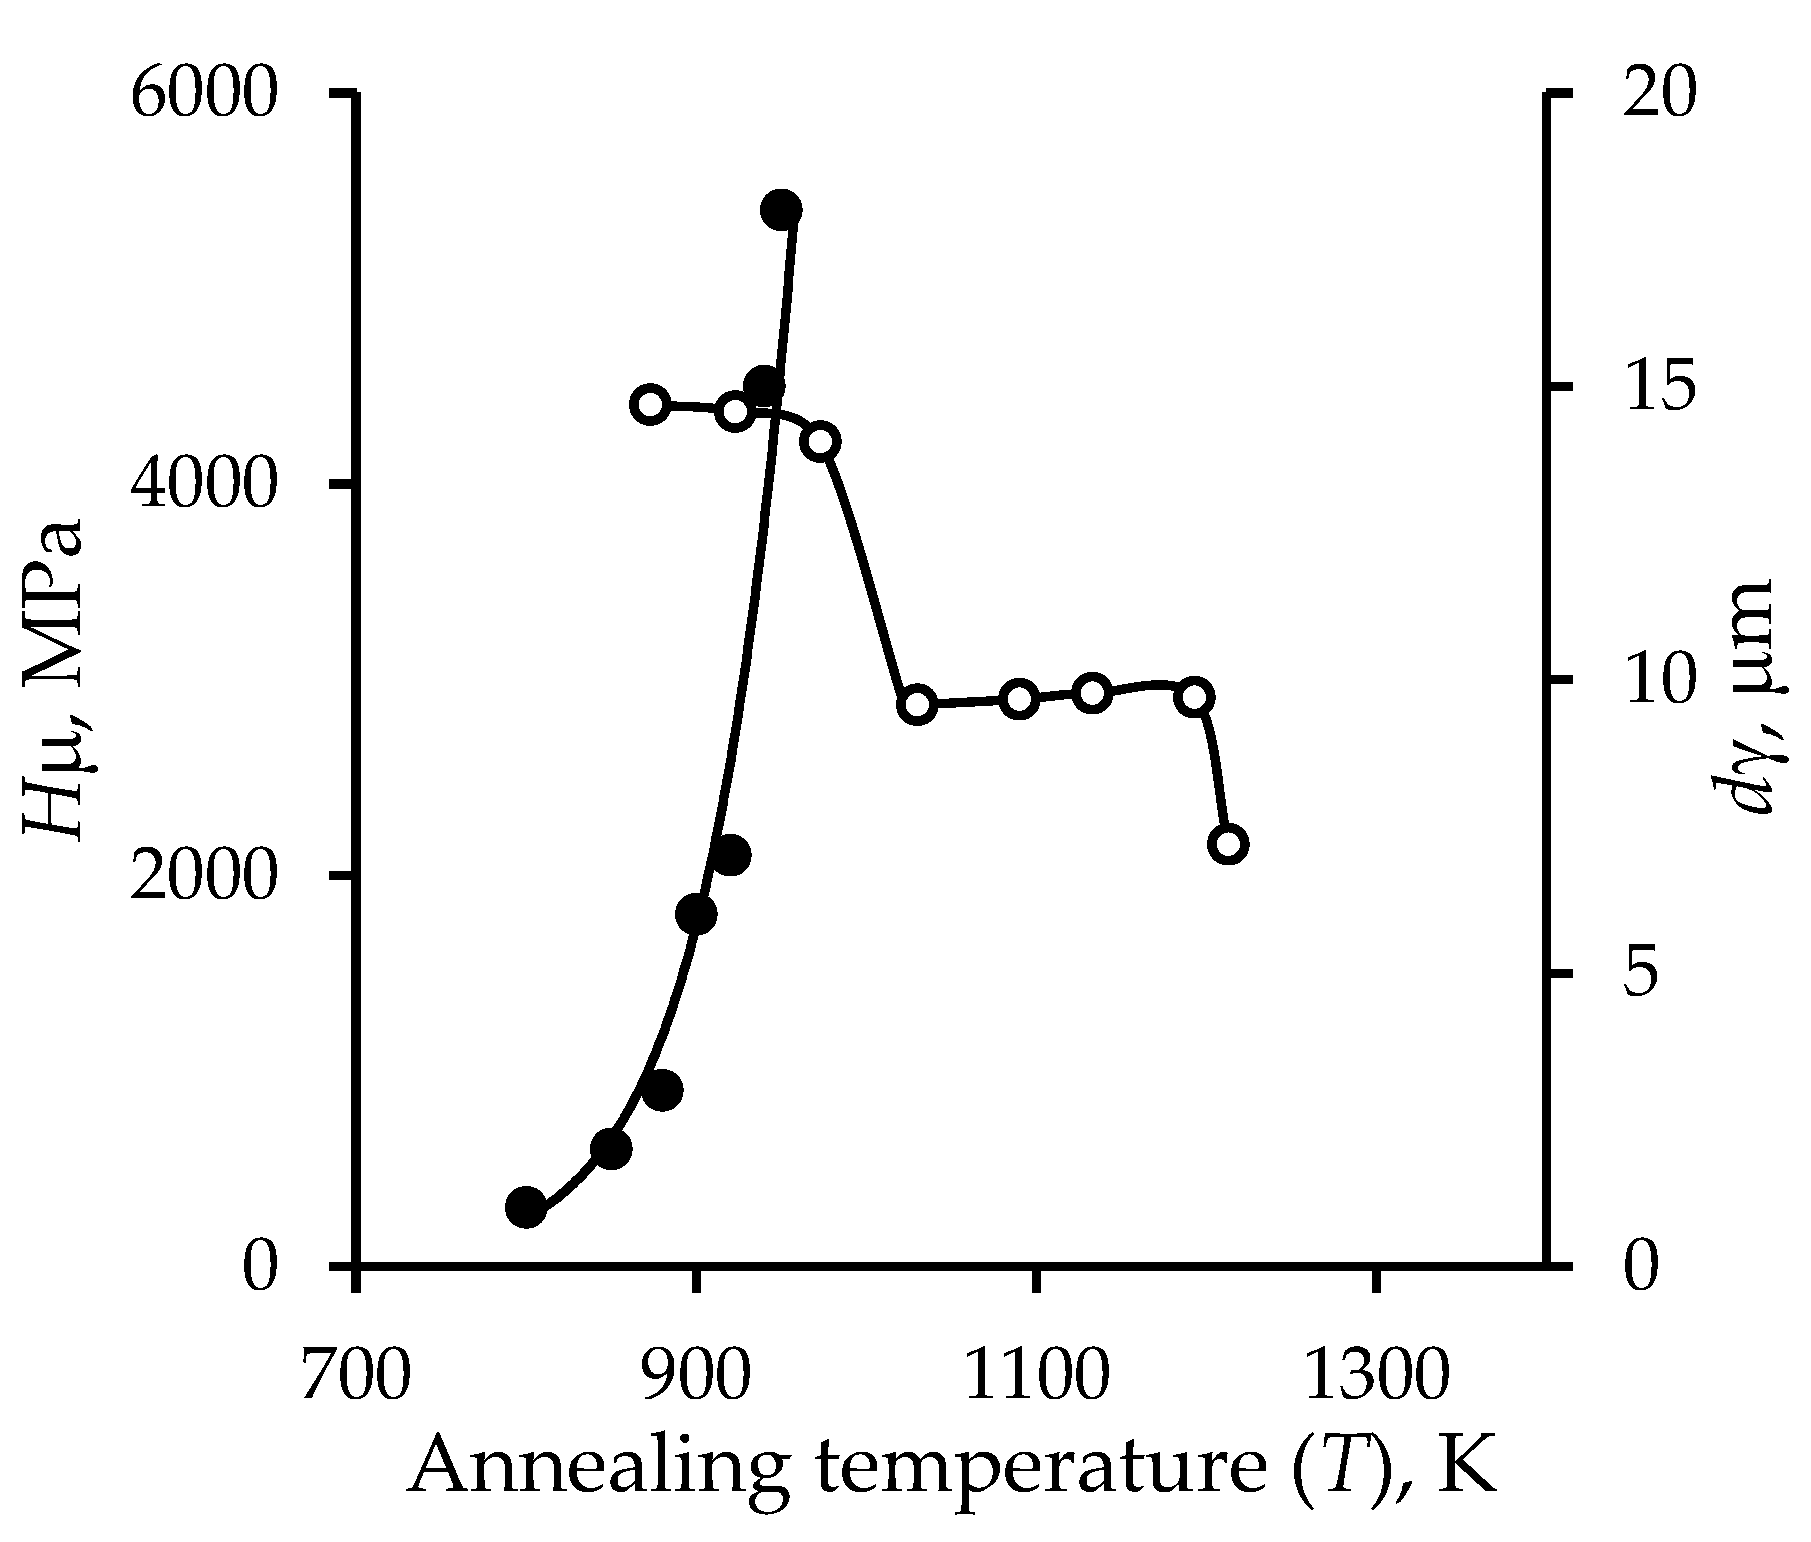
The dependence of microhardness (Hμ) on the annealing temperature of the studied alloy presents the decrease of the microhardness value at 973–1023 K (Figure 6). It is most likely related to the beginning of the recrystallization process and removal of hardening caused by the preliminary rolling. The rectilinear part on the graph (about 1100 K), observed under further temperature increase, is explained by the precipitation and growth of the HCP-phase particles, which stabilize the matrix structure and the alloy hardness to some extent. Above 1193–1213 K a dramatic decrease in micro-hardness occurs because of the reverse process of the dissolution of the phase particles in the matrix and transition of the alloy into the one-phase state. Thereof, the HCP-phase particles precipitation at the annealing of the 90% rolled alloy not only stabilize the microstructure but also promote the stability of micro-hardness.
To define the element composition of HCP phase and analyze the changes in the element concentration in the matrix, X-ray fluorescence analysis of the samples has been made. The studies of the composition of the samples have been performed after quenching at 1223 K, 90% rolling and annealing at 1153 K (25 min), because such procedure of treatment contributes to the improvement of superplasticity properties and a large amount of HCP-phase. After electrochemical etching of the obtained samples at 1153 K (25 min), the concentration of cobalt decreases, but the amount of niobium, reversely, increases compared to the polished sample (Table 1).
The results of the X-ray fluorescent analysis of the chemical composition of the HCP-phase particles, obtained by the precipitation on anode and mounted on the replica are presented in Table 1. They are clearly different from the matrix with the small concentration of cobalt and saturated niobium with the concentration up to 17%.
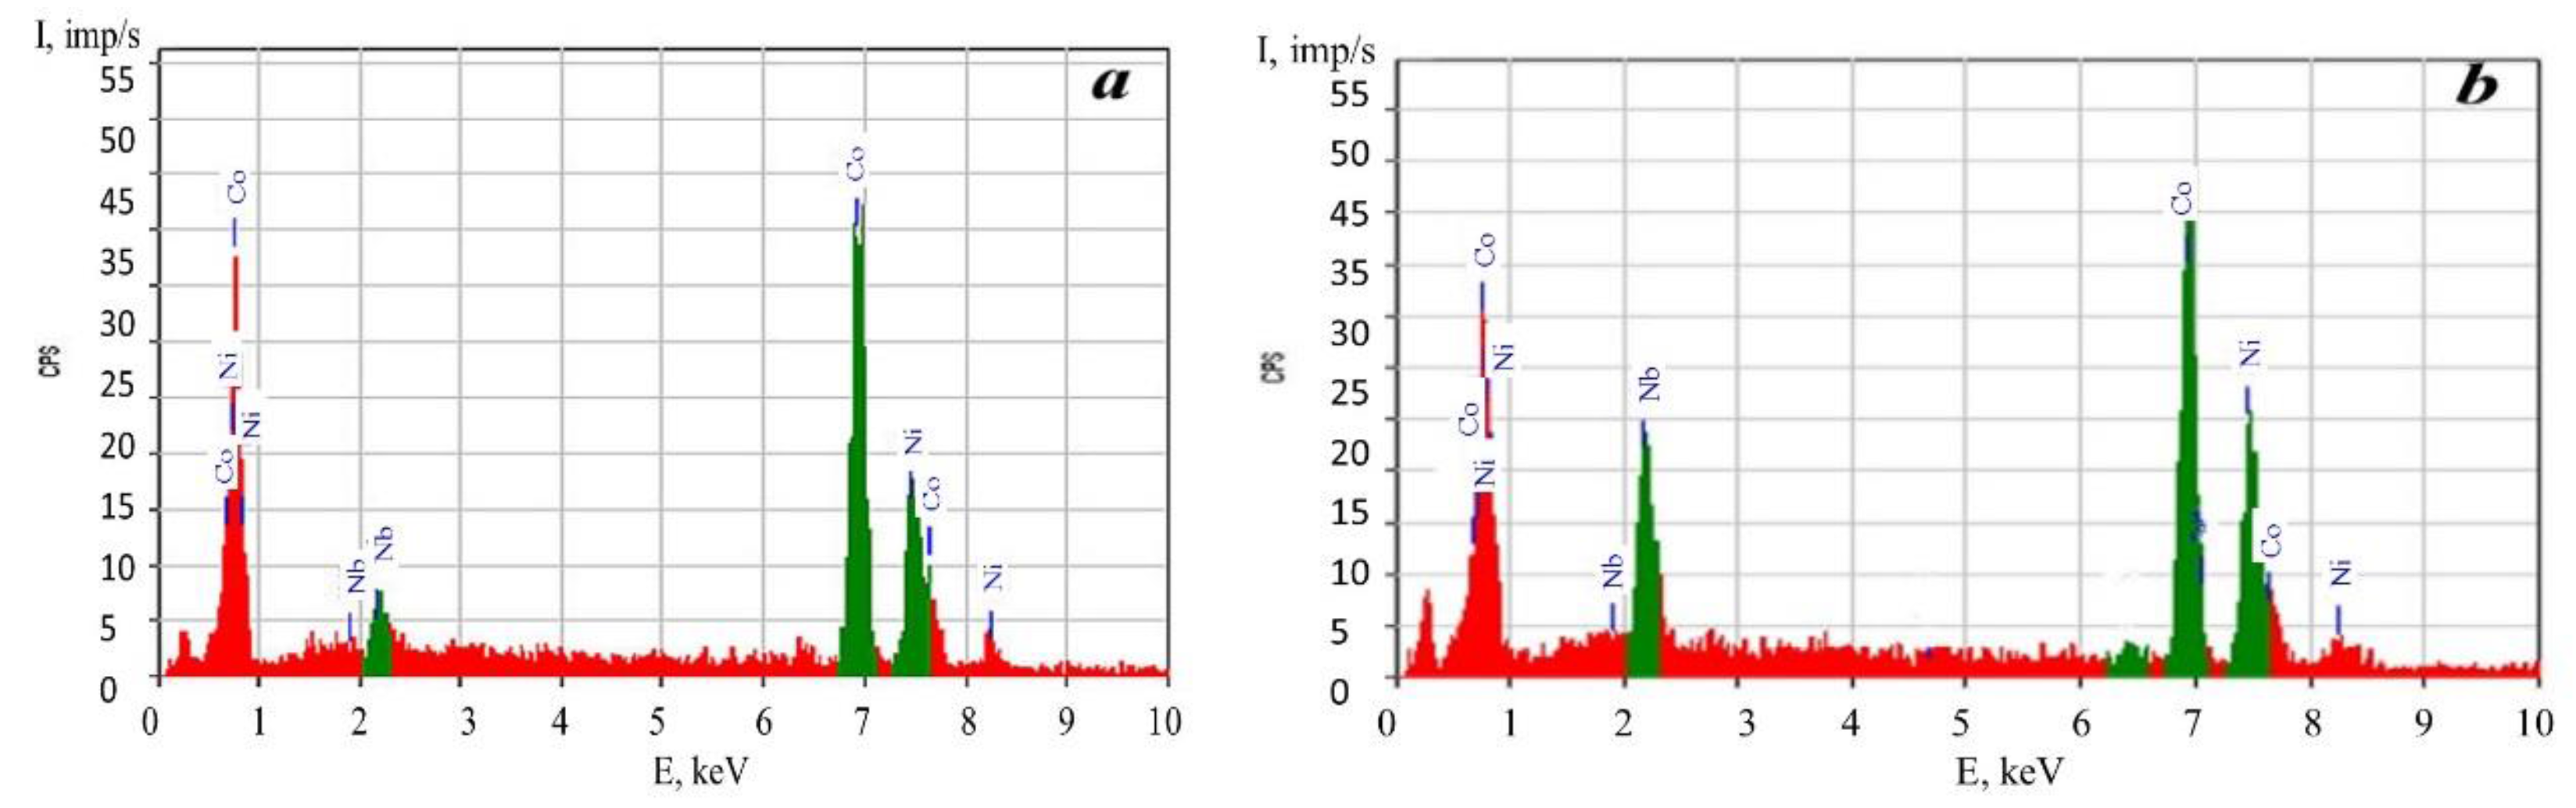
The analysis of the chemical composition of microzones of the studied alloy (Table 2) performed on the scanning electron microscope equipped with the microanalyzer (Figure 7), presents a good agreement with the X-ray-fluorescent analysis.
According to obtained results, the samples in HCP phase consist of 52–55% Co, 29–31% Ni and 15–18% Nb (Table 1 and Table 2).

3.3. The Results of the Analysis of the Influence of Quenching Regime and Temperature—Strain Rate Conditions Deformation on the Superplasticity of the Co-Ni-Nb Alloy

In paper [10] superplasticity of the Co-Ni-Nb alloy is detected in the samples quenched at 1423 K (10 min) and 87% rolled at the deformation temperature 1143 K and the strain rate equals 0.7 × 10⁻³ s−1. Therefore, the oversaturated solid solution of the Co-Ni-Nb alloy was obtained at 1423 K (10 min).
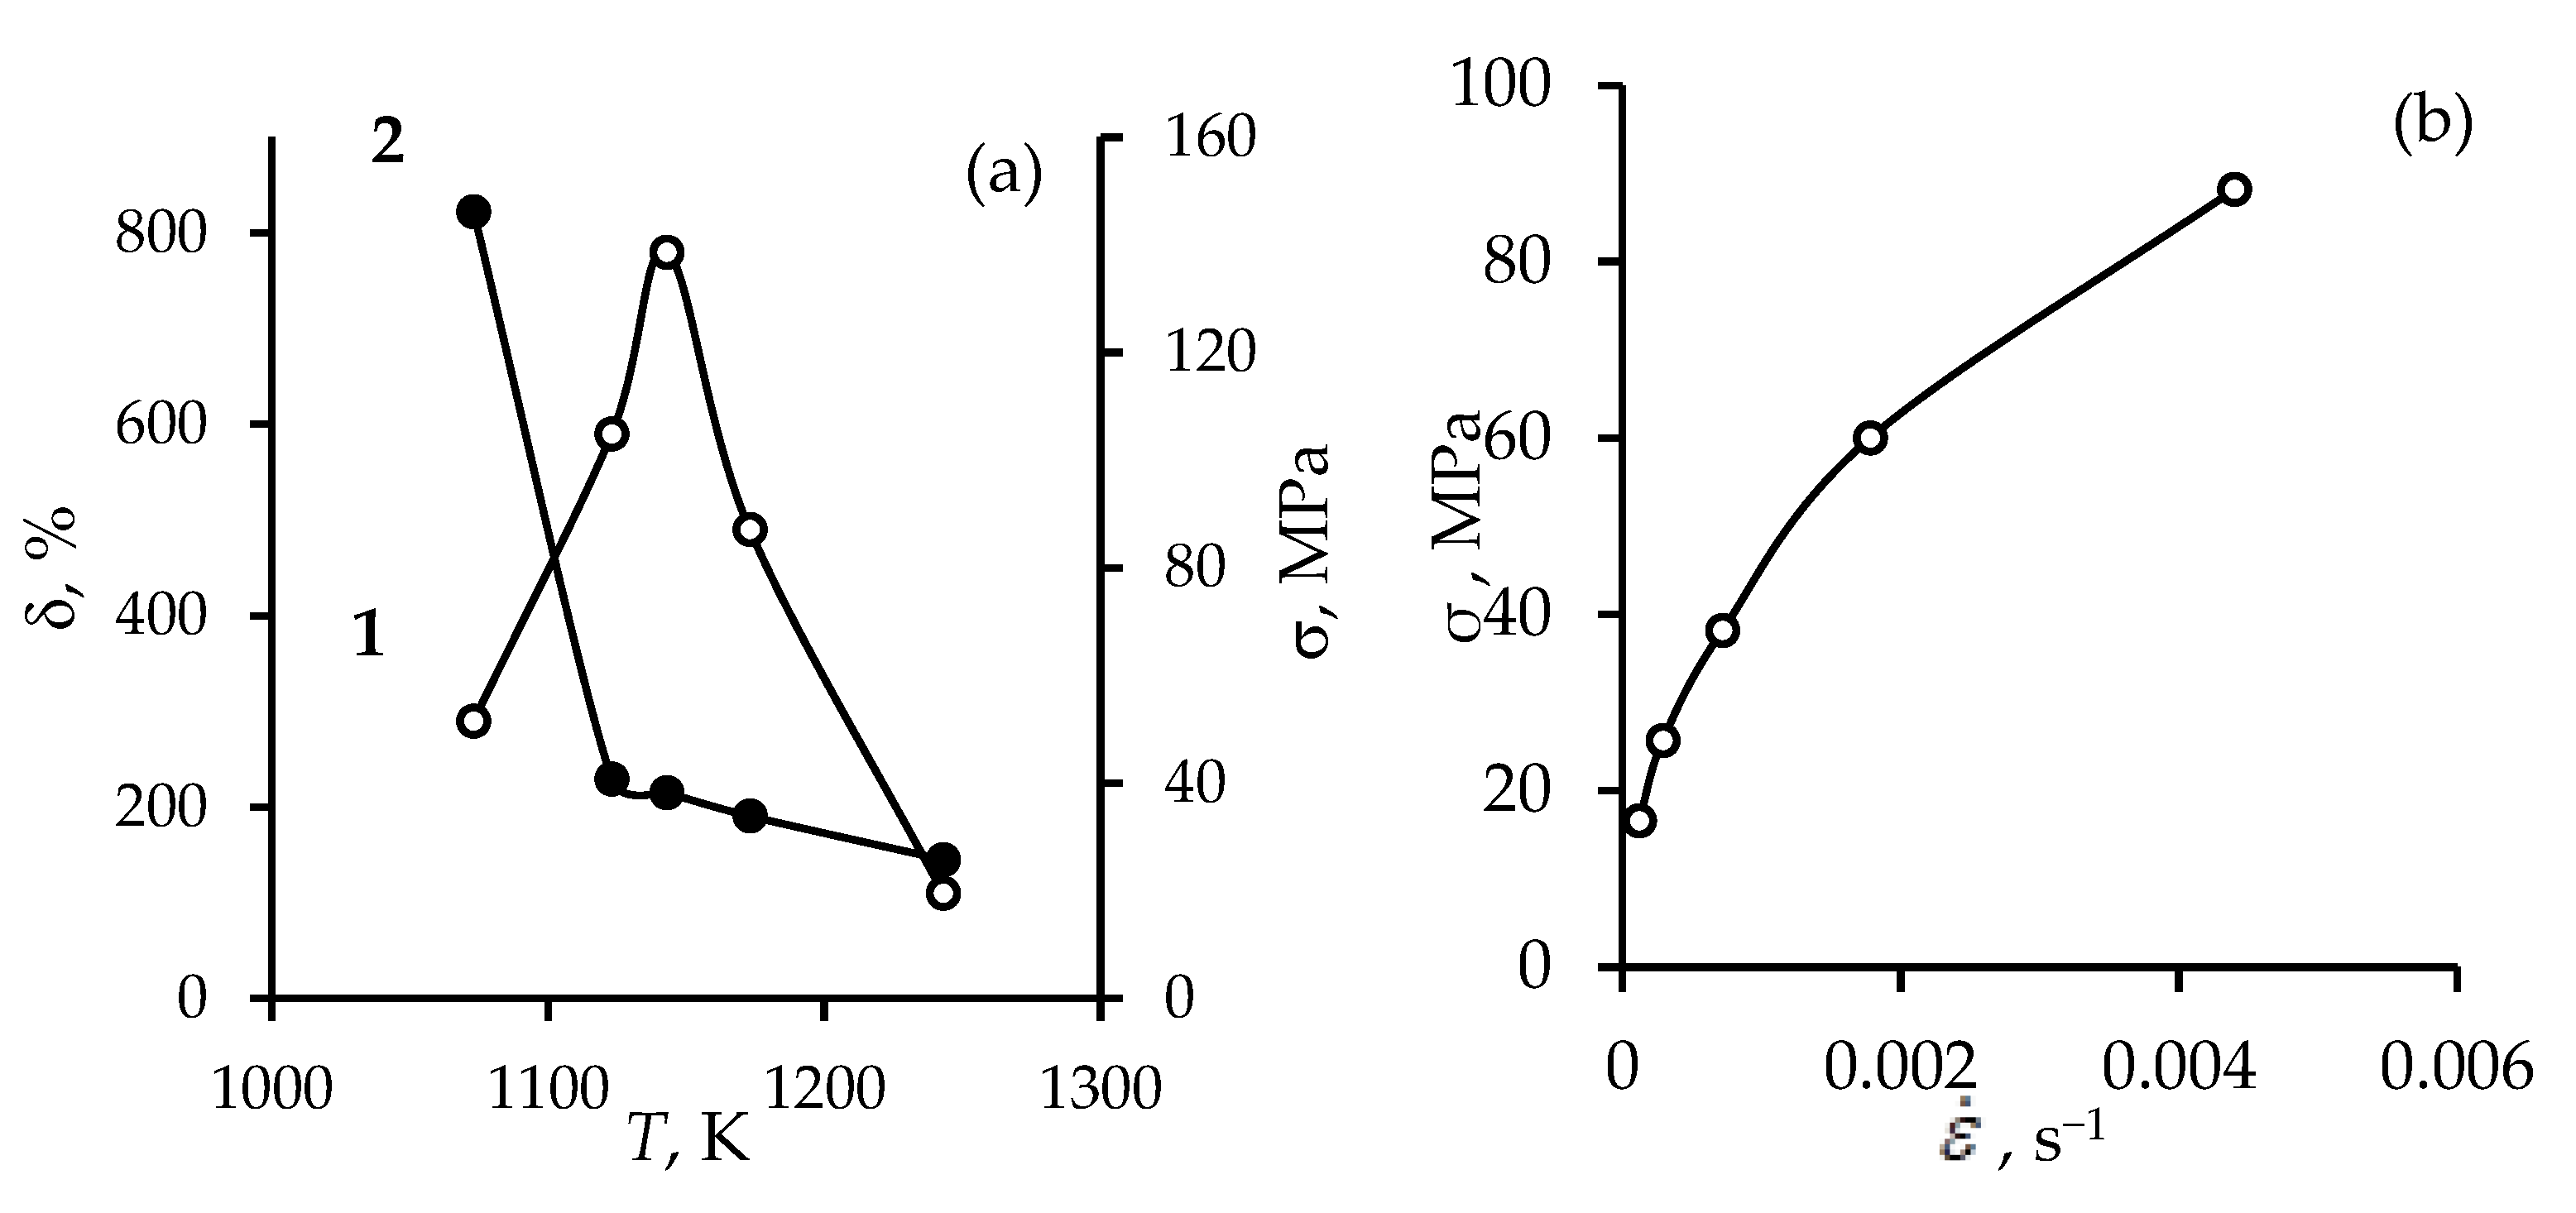
67CoNi5Nb alloy, rolled to 60% at high temperature strain, reveals the signs of superplasticity. The highest ductility value δ = 158% and the index m = 0.41, which describes the sensitivity of the flow rate of stress to strain, are achieved at 1203 K and ε ˙ = 1.2 × 10⁻⁴ s−1, correspondingly.
After quenching at 1423 K (10 min) and 90% rolling the Co-Ni-Nb alloy shows the effect of superplasticity in the deformation range of 1053–1243 K. Maximum values of the relative residual elongation (δ) and the m index reach 780% and 0.44, respectively, at the deformation temperature 1143 K and velocity 0.72 × 10⁻³ s−1 (Figure 8a). The experimentally defined dependence of the tensile strength (σ) of the Co-Ni-Nb alloy on the deformation velocity ( ε ˙ ) at 1143 K for optimal superplasticity is precisely (R2 = 0.9994) described by the σ = 1111.7 × ε ˙ 0,4644 function (Figure 8b). Conformity of this dependence with the common empirical σ = k × ε ˙ m equation verifies a viscose state of the Co-Ni-Nb alloy after being treated. This empirical equation was used to calculate the value of coefficient k (1111.7) and the value of the index of the strain rate sensitivity of the flow tension (m) ≈ 0.46, the latter is close to 0.44 obtained with Hedworth-Stowell method [11]. The decrease of the alloy quenching temperature from 1423 K to 1223 K leads (at superplastic deformation TSPD = 1143 K and ε ˙ = 1 × 10⁻³ s−1) to the improvement of the ductility from 780 to 1140%.
There are two reasons for the plasticity strengthening for the Co-Ni-Nb alloy after quenching from 1223 K and 90% rolling. The first reason is that the grain size (d) after quenching from 1223 K equals 18 µm. This is 3.5 to 4 times less than after quenching from 1423 K. The second reason is that after quenching from 1223 K (10 min) the twin quantity is much smaller (compare Figure 1 and Figure 9a). The twins are known to worsen superplastic properties of alloys [2,3]. Therefore, the quenching of the Co-Ni-Nb alloy from 1423 K proves to be inefficient due to insufficient plasticity at superplastic deformation, since relative elongation after the break is 1.6 times smaller than after quenching from 1223 K.
The experimental results can find their practical application in the improvement of technological plasticity of the Co-Ni-Nb alloy. Therefore, the following regime of treatment can be suggested: quenching from 1223 K (10 min) + 90% rolling and superplastic deformation at 1143 K and ε ˙ = 1 × 10⁻³ s−1. Such a regime makes it possible to obtain a structure with good technological characteristics and optimal combination of exploiting features.
Next, for the further studies of the alloy, processing was employed—quenching at 1223 K (10 min) + 90% rolling and annealing at 1153 K (20 min). This processing helped produce a fine-grain superplastic structure with an average grain size (d) of the matrix ≈ 2.7 µm. The metallographic pictures show the precipitation of spherical particles on the borders of the matrix with the average size of grains (d) equal from 1 to 1.5 µm (Figure 4b). This fact is in agreement with the above-presented results for superplastic deformation. This phenomenon was verified by X-ray diffraction and electron-microscopy measurements which show that optimal superplastic properties are typical for the alloy with two-phase fine-grain structure (d = 4 µm), consisting of grains of γ-matrix and particles of the secondary HCP-phase. The volume part of HCP-phase particles (<fη>) defined with the methods of quantitative metallography is 17–20%. The samples of the Co-Ni-Nb alloy were subjected to deformation at T = 1143 K and ε ˙ = 1 × 10⁻³ s−1. The determined degree of deformation at the relative residual elongation (δ) equals 26%.
In the course of experiments on the deformation of the studied alloy it was stated that superplastic deformation provokes the growth of the grain size. This growth is much faster in the working part of sample than in the non-deformed zones. After 26% deformation an average size of grains increased, twice reaching <d> = 5.4 µm. Moreover, the grains are expanding in all directions and their number is decreasing.
The obtained characteristics of microstructure features and results of mechanical tests are presented in Table 3.
After the superplastic deformation of the samples with the initial grain size d0 = 2.7 µm (at T = 1143 K and ε ˙ = 1 × 10⁻³ s−1) no significant formation of intergranular voids and cracks is observed as it was for the alloy with a large initial size. It means that superplastic deformation triggers accommodative processes. Using the metallographic and X-ray methods it was shown that during superplastic deformation the dissolution of HCP-phase particles occur under optimal conditions. The pictures of the structure (Figure 9) clearly present the dissolution of spherical particles of HCP-phase, which is accompanied by the formation of shear transformation zones [12,13,14,15,16] near the boundaries of the matrix. The growth of grains and their consequent decrease in number is observed in the zones of the structure lacking particles of the secondary phase (Figure 9), since the temperature of the beginning of the reverse dissolution of the HCP-phase particles coincides with the optimal temperature of the superplastic deformation. This phenomenon supports the fact that the directed mass-transfer on grain boundary is an accommodative process, initiated by the dissolution of the secondary phase particles, which causes the grain growth and removal of the defects arising from the grain boundary sliding. The authors of the papers [17,18] suggest considering the process of the re-orientation and the growth of the grains under super-plastic deformation as a result of transformation of part of the material into the liquid state. The liquid component facilitates the sliding of the grains’ boundaries and acts as a soft sliding. However, this liquid oiling is not a liquid as it is. Such a state is called liquid-like and it is considered a shifting transformation zone where the switching of chemical bonds takes place fully or to some extent [11]. Such switching is obviously a solid phase phenomenon, bringing about a decrease of Gibbs energy and is non-reversible as a mechanical-chemical reaction, which causes the formation of new products and gives off heat [19].
In the SPD process, the material is in the state of intense dynamic loading; in such a case the Stokes-Einstein equation can be used to describe the behavior of the alloy. The Stokes-Einstein Equation (1) as well as the dynamic viscosity Equation (2) are used for calculation of the energy:
η = η 0 exp E η RT
η ~ τ µ
where η0 is a coefficient independent from temperature, Еη is the activation of relaxation energy of a viscous flow and τ—structural relaxation time.
According to Landau and Lifshitz [20], under extreme conditions, viscosity can be equated for the product of the relaxation time by the shear modulus. According to [4], the time of structural relaxation for the 67CoNi5Nb alloy is 4 h at 400 °C and it equals 5 h at 450 °C. On the basis of Equations (1) and (2) one can obtain the equation for the activation of relaxation energy:
E η = R T S P D l n τ 1 τ 2
The estimated value of the activation of relaxation energy is 120 kJ/mol for non-superplastic materials [21], and for a superplastic material it is 2.1 kJ/mol.

4. Conclusions

The studies have shown an impact of temperature on microstructure (a grain size of the matrix, the presence of twins, and a phase composition) and superplastic properties of the Co-Ni-Nb alloy. Metallographic and X-ray diffraction methods have proved that the quenching temperature decrease from 1423 K (10 min) to 1223 K (10 min) does not change the phase composition. A significant reduction of the number of twins was observed after the quenching of the studied alloy at 1223 K (10 min) compared to the procedure at 1423 K (10 min). The decrease of the alloy quenching temperature from 1423 K to 1223 K leads to the improvement of the ductility from 780% to 1140%. This phenomenon is conditioned by the following processes: firstly, a grain size is decreasing by 3.5–4 times with the quenching temperature decrease to 1223 K (10 min), and secondly, the twins number is also reducing. The Co-Ni-Nb alloy after quenching from 1223 K (10 min) and rolling by 90% demonstrates the superplasticity effect in the deformation temperature range of 1053–1243 K.
The transformation of the HCP-phase particles during the superplastic deformation under optimal conditions was found. Moreover, alongside the dissolution of the spherical particles of HCP-phase the formation of “shear transformation” zones take place nearby the matrix boundaries. The growth of the grain size and the decrease of the number of grains were observed in the zones without the secondary phase. Since the temperature of the beginning of the reverse transformation of the HCP-phase particles coincides with the optimal temperature of superplastic deformation, it is assumed that the accommodative process in the shear transformation zones under the deformation influences the transformation of the secondary phase. This shear transformation zone is characterized by the repaired defects arising from the grain boundary sliding.

Acknowledgments

A.T. acknowledges the financial support Bolashak International Scholarship Program of Kazakhstan. Authors gratefully acknowledge the financial support of Polish Government Plenipotentiary for JINR in Dubna (Grant No. 389/07.06.2017, p. 20).

Author Contributions

The development of the experiments was carried out by D. Yerbolatuly and A. Tussupzhanov. The images design and the experiments were completed by A. Tussupzhanov. The X-ray results were analyzed by D. Yerbolatuly. L.I. Kveglis accomplished the analysis and consolidation of all experimental studies. A. Filarowski made a research of the microstructure and took part in the data analysis.

Conflicts of Interest

The authors declare no conflict of interest.

References

  1. Hosford, W.F. Mechanical Behavior of Materials; Cambridge University Press: Cambridge, UK, 2005. [Google Scholar]
  2. Kaibyshev, O.A. Superplasticity of Alloys, Intermetallics and Ceramics; Springer-Verlag: Berlin, Germany, 1992. [Google Scholar]
  3. Pilling, J.; Ridley, N. Superplasticity in Crystalline Solids; Institute of Metals: London, UK; Brookfield, VT, USA, 1989. [Google Scholar]
  4. Molotilov, B.V. Precision Alloys, Handbook; Metallurgy: Moscow, Russia, 1974. [Google Scholar]
  5. Wang, Y.M.; Liu, H.S.; Zheng, F.; Jin, Z.P. The isothermal section of the Co–Ni–Nb ternary system at 1123 K determined by diffusion triple technique. J. Alloys Compd. 2008, 454, 501–505. [Google Scholar] [CrossRef]
  6. Nieh, T.G.; Wadsworth, J. Microstructural characteristics and deformation properties in superplastic intermetallics. Mater. Sci. Eng. A 1997, 88, 239–240. [Google Scholar] [CrossRef]
  7. Xhunga, I.K. Recessible Task Lighting. U.S. Patent 20110103075 A1, 5 May 2011. [Google Scholar]
  8. Borisov, A.K.; Goryushkina, N.M. Properties of current-conducting spring alloy 67KN5B in relation to degree of deformation and heat treatment. Met. Sci. Heat Treat. 1972, 14, 950–954. [Google Scholar] [CrossRef]
  9. Tushinskii, L.I. New Methods of Hardening and Metal Processing; Novosibirsk State Technical University: Novosibirsk, Russia, 1980; pp. 71–79. [Google Scholar]
  10. Radashin, M.V.; Nazarov, U.K.; Abrosov, V.N. The Superplasticity of Precipitation-Hardening Alloy 67KN5B. In Proceedings of the Evolution of Defect Structures in Metals and Alloys, Barnaul, Russia, 1992; p. 178. [Google Scholar]
  11. Hedworth, J.; Stowell, M.J. The measurement of strain-rate sensitivity in superplastic alloys. J. Mater. Sci. 1971, 6, 1061–1069. [Google Scholar] [CrossRef]
  12. Langer, J.S. Instabilities and pattern formation in crystal growth. Rev. Mod. Phys. 1980, 52, 1–28. [Google Scholar] [CrossRef]
  13. Falk, M.L.; Langer, J.S. Shear transformation zone theory elasto-plastic transition in amorphous solids. Phys. Rev. 1998, E57, 7192–7204. [Google Scholar]
  14. Lemaitre, A.; Carlson, J. Boundary lubrication with a glassy interface. Phys. Rev. E 2004, 69. [Google Scholar] [CrossRef] [PubMed]
  15. Maloney, C.; Lemaitre, A. Universal breakdown of elastisity at the onset of material failure. Phys. Rev. Lett. 2004, 93. [Google Scholar] [CrossRef] [PubMed]
  16. Lemaitre, A. Origin of a repose angle: Kinetics of rearrangement for granular materials. Phys. Rev. Lett. 2002, 89. [Google Scholar] [CrossRef] [PubMed]
  17. Straumal, B.B.; Sauvage, X.; Baretzky, B.; Mazilkin, A.A.; Valiev, R.Z. Grain boundary films in Al–Zn alloys after high pressure torsion. Scr. Mater. 2014, 70, 59–62. [Google Scholar] [CrossRef]
  18. Protasova, S.G.; Kogtenkova, O.A.; Straumal, B.B.; Zięba, P.; Baretzky, B. Inversed solid-phase grain boundary wetting in the Al–Zn system. J. Mater. Sci. 2011, 46, 4349–4353. [Google Scholar] [CrossRef]
  19. Zel’dovich, Ya.B.; Rayzer, Yu.P. Physics of Shock Waves and High-Temperature Hydrodynamic Phenomena; Nauka: Moscow, Russia, 2008. [Google Scholar]
  20. Landau, L.D.; Lifshitz, E.M. Theory of Elasticity, 3rd ed.; Butterworth-Heinemann: Oxford, UK, 1986; Volume 7. [Google Scholar]
  21. Noskova, N.I. Physics of Deformation of Nanocrystalline Metals and Alloys. In Proceedings of the 1X International Seminar Dislocation structure and mechanical properties of metals and alloys, Yekaterinburg, Russia, 2002; pp. 91–92. [Google Scholar]
Figure 1. Structural-phase state of the Co-Ni-Nb alloy: (left side) initial sample microstructure and (right side) fragment microstructure with twins (black arrows).
Metals 08 00019 g001
Figure 2. Fragments of diffractograms of Co-Ni-Nb alloy: (a) after quenching at 1223 K (10 min) (1) and at 1423 K (10 min) (2); (b) after annealing at 773 K (1 h) (1), 973 K (1 h) (2) and at 1173 (1 h) (3).
Metals 08 00019 g002
Figure 3. Scanning electron microscopy of the Co-Ni-Nb alloy structure after annealing at 773 K (1 h) + 90% rolling at room temperature and the annealing at 1153 K (25 min) (picture (a) with 6000 magnification and picture (b) with 15,000 magnification) and grain size histogram (c) obtained by the intercept method.
Metals 08 00019 g003
Figure 4. Pictures of secondary phase precipitations after rolling-mill (90%) and annealing for 5 min at 1143 K obtained with the Scanning Electron Microscope.
Metals 08 00019 g004
Figure 5. Dependences of the volume faction of HCP-phase (fHCP, curve-a) and grain size of γ-matrix (dγ, curve-b) of the Co-Ni-Nb alloy (preliminary quenching from 1223 K (10 min) and 90% rolling) on the annealing temperature (T).
Metals 08 00019 g005
Figure 6. The dependence of the microhardness (Hμ) on the annealing temperature (T) of the studied alloy after the quenching at 1223 K (10 min) and 90% rolling.
Metals 08 00019 g006
Figure 7. X-ray fluorescence spectra of the Co-Ni-Nb alloy measured in matrix (a) and particle (b) of secondary phase.
Metals 08 00019 g007
Figure 8. The mechanical properties of the Co-Ni-Nb alloy at the superplastic deformation. Dependencies of the relative residual elongation (δ) (curve 1) and the tensile strength (σ) (curve 2) on the superplastic deformation temperature (T) obtained at velocity = 0.72 × 10⁻³ s−1 (a) and dependence of the tensile strength (σ) on the stretching speed ( ε ˙ ) at T = 1143K (b).
Metals 08 00019 g008
Figure 9. The structures of the Co-Ni-Nb alloys before (a) and after (b) superplastic deformation at temperature 1143 K and ε ˙ = 1 × 10⁻³ s−1 (d0 = 2.7 µm).
Metals 08 00019 g009
Table 1. Data of the chemical composition of the samples of the Co-Ni-Nb alloy obtained on an X-ray-fluorescent energy-dispersion spectrometer.
Treatment of the Studied SampleAmount in wt. % (in Mass)
MnCoNiNb
quenching at 1223 К, 90% rolling and annealing at 1153 К (25 min)
after polishing<0.567.8 ± 0.928.5 ± 0.953.2 ± 0.8
after etching<0.567.0 ± 0.928.7 ± 0.963.8 ± 0.81
participles of HCP-phase on the coal replica 53.3 ± 0.9529.9 ± 0.9816.8 ± 0.85
Table 2. Data on the elements composition of the samples of the Co-Ni-Nb alloy obtained on the electron microscope with the microanalyzer.
Treatment of the Studied SampleAmount in wt. % (in Mass)
MnCoNiNb
quenching at 1223 К, 90% rolling and annealing at 1153 К (25 min)
Matrix-65.0 ± 0.729.9 ± 0.85.1 ± 0.6
HCP–phase-54.0 ± 0.630.2 ± 0.815.8 ± 0.6
Table 3. Characteristics of microstructure features and results of mechanical tests depending on the conditions for sample preparation.
Treatment of the Studied SampleGrain Size, μmPhase CompositionMicrohardness, MPa
preliminary quenching from 1223 K (10 min) and 90% rolling18FCC4405
preliminary quenching from 1223 K (10 min) and 90% rolling and TSPD = 1143 K and ε ˙ = 1 × 10⁻³ s−1-*FCC + HCP2860
* The track of the grain size of the matrix is not possible to define after SPD.

