Choosing the Production Function Model for an Optimal Measurement of the Restructuring Efficiency of the Polish Metallurgical Sector in Years 2000–2015


1
Production Engineering Department, Faculty of Materials Engineering and Metallurgy, Silesian University of Technology, 44-100 Gliwice, Poland
2
International Economics Department, Faculty of Economics and International Relations, Cracow University of Economics, 31-510 Kraków, Poland
*
Author to whom correspondence should be addressed.
Metals 2018, 8(1), 23; https://doi.org/10.3390/met8010023
Submission received: 15 December 2017
/
Revised: 26 December 2017
/
Accepted: 28 December 2017
/
Published: 31 December 2017
Abstract
:Between 2000 and 2015, the Polish metallurgical sector was subject to serious restructuring. Presented research aimed at providing a framework for possibly most accurate measurement of efficiency of this process. The study employed: (I) Quantitative research for elaboration of production function models: power regression Cobb-Douglas function with its developments; (II) Qualitative research: Analytic Hierarchy Process for assessment of relevance of efficiency evaluation criteria in reference to various production function models in metallurgy sector: (i) sectoral added value (net production); (ii) production sold; and, (iii) steel production volume. Criteria relevance has been assessed by scientists and practitioners with specialization in metallurgy. As a result the sectoral added value function has been chosen as the one that optimally reflects sector’s restructuring efficiency. This, in turn, constitutes a qualitative confirmation of previous research result, which has been verified with a quantitative method. Practical outcome is a more precise modelling of efficiency of restructuring processes in the metallurgical sector, both for scientific and business needs. The main research limitations originate from the sector itself—in order to make our tool more universal, further research should be led in parallel branches of industry.
1. Introduction
The systemic transformation in Poland forced companies to adapt to a new, competition-based economic reality. Since 1989, centrally planned economy has been constantly substituted by the free market. This meant privatization and commercialization of state-owned enterprises and development of the private sector, which in long term has increased their susceptibility for market signals [1]. Governmental programs aiming at intensive restructuring of the metallurgical sector have been implemented since 1992, which led to the increase of its efficiency. First programs (before 1997) were not systemic, nor complex, being rather spontaneous reactions of metallurgical companies to unfavourable environmental conditions. Nevertheless, since 1998, governmental restructuring programs have taken the form of consistent sets of remedial recommendations, which in turn became fully monitored by the European Commission since 2003. In 2007, this body confirmed the readiness of the Polish metallurgical sector for efficient free market functioning, continuing its monitoring activities until 2010.
Restructuring programs of Polish metallurgical industry targeted at [2]:
- A radical reduction of employment (127,000 people leaving the sector in years 1990–2015) [3];
- Lowering steel production to the market demand level (actually yearly average is around 9 mln. tons, in comparison to more than 13 mln. tons in the 90ties) [4];
- Increase in labour efficiency (switch from 84 tons/employee in the 90ties to 465 tons/employee in 2015);
- Withdrawal of outdated open-hearth furnace technology—completed in 2002 [5];
- Development of BOF and EAF technologies and implementation of production automation—actually 55% of Polish steel is being produced in converters (BOF) and the rest with EAF technology, with a tendency to lower the share of converter production during market downturn periods (down to 45% in 2009);
- Introducing new methods of organization and management, which allowed Polish ironworks to reach World Class Manufacturing global production standards [11].
Actually, the Polish metallurgical sector is dominated by foreign capital (e.g., ArcelorMittal) and it is not fully exploiting its production capacities. Shortages in market supply are being equalized by steel imports from EU and non-EU countries, leaving the metallurgical sector with a negative trade balance.
Efficiency of transformation of Polish metallurgical industry has been assessed through numerous governmental research grants. Once restructuring was accomplished, most analyses, evaluations, diagnoses, and prognostics are being performed for scientific or commercial purposes, with mostly quantitative and sometimes qualitative methodology. First group of methods is applied for elaboration of production prognostic models (volume and inventory planning), the second for expert evaluations of accuracy of quantitative planning.
The combination of quantitative and qualitative methods came from the need of a deeper insight into the restructuring processes in metallurgical industry. Production function models that were obtained through application of quantitative Cobb-Douglas function (based on long-term observation of changes in metallurgical production) occurred to be an approximation of a more complex reality. Qualitative verification via expert opinions on relations between production factors and production output enriches the analysis, as experts have an independent vision of restructuring effects. Even if expert opinions are subjective and production function models are objective, only a combination of qualitative and quantitative research offers a complex perspective and provides an integral research methodology on the development of enterprises [12].
2. Materials and Methods
This paper is composed of two parts. The first presents quantitative models of the production function elaborated in former research to reflect the restructuring of Polish metallurgical industry. The second part demonstrates a decision-making model build within the Analytic Hierarchy Process (AHP) framework.
2.1. Production Function Models
Analysed production function models have been based on statistical data from years 2000–2015, and the assumptions of Cobb-Douglas power function:
where P is the production output generated by the input of L—labour and C—capital, with b being a structural parameter [13]. The formula with its later developments [14,15,16,17,18,19] (e.g., extended by the constant elasticity of substitution [20]) is widely used to assess the scale of production within an economy, industry, or company.
The production function formula employed for quantitative testing of metallurgical industry production function models was a two-factor Cobb-Douglas power function:
where Pt is the production output generated in t time period, L1t is the input of labour in t time period, C2t is the input of capital in t time period, whereas b0, a1, a2 are structural parameters of the production function.
To simplify the notation the random component has been omitted in the model. This was possible because neither the stochastic properties of the models, nor their estimation were our concern. Model 2 has a static character, as the time, t, is not perceived here as a structural parameter.
In order to bring into the scope the impact of technical and organizational progress on the Polish metallurgical sector, a modified Tinbergen power function [21] has been employed:
where additional structural parameter y is a measure of effects of technical and organizational progress. Due to such modifications, Model 3 obtained a dynamic character.
For construction of quantitative models the following methods have been employed [22] (pp. 27–28): classical least-squares method, with estimation of linear function parameters (via Microsoft Excel regression tool) and nonlinear estimation Gauss-Newton and Levenberg-Marquardt algorithms (via Statistica software, academic license). Statistical significance p(α) 0.05 has been adopted. Other statistical measures were: multiple correlation coefficient R, coefficient of determination R2, convergence factor ϕ2, standard error Se, coefficient of variation Ve, and Fisher-Snedecor distribution (for H0: α1 = α2 = 0 verification Vs H1 stating that at least one of the α1, α2 parameters ≠ 0). Following tests have been employed for quantitative verification of statistical hypotheses [23]: structural parameters significance, regression linearity, randomness of residuals, normality of distribution of random component, and homoscedasticity of random components’ variance.
For each model, we hypothesized that a non-linear (power) relationship exists between the dependent variable P and explanatory variables L (labour) and C (capital). Depending on the tested production function model, the dependent variable P meant: (i) sectoral added value (net production) (PLN); (ii) production sold (PLN); and, (iii) steel production volume (mln. tons). Only statistically valid (positively verified) production function models have been accepted for further research, i.e., sectoral added value and production sold—contrary to models that are expressed by steel production volume [24].
Production function models came from the estimation of their parameters based on statistical data from Polish metallurgical sector. With various factors describing added value or production sold, the specifics of analyzed models changed significantly. Table 1 presents data sets employed for these calculations.
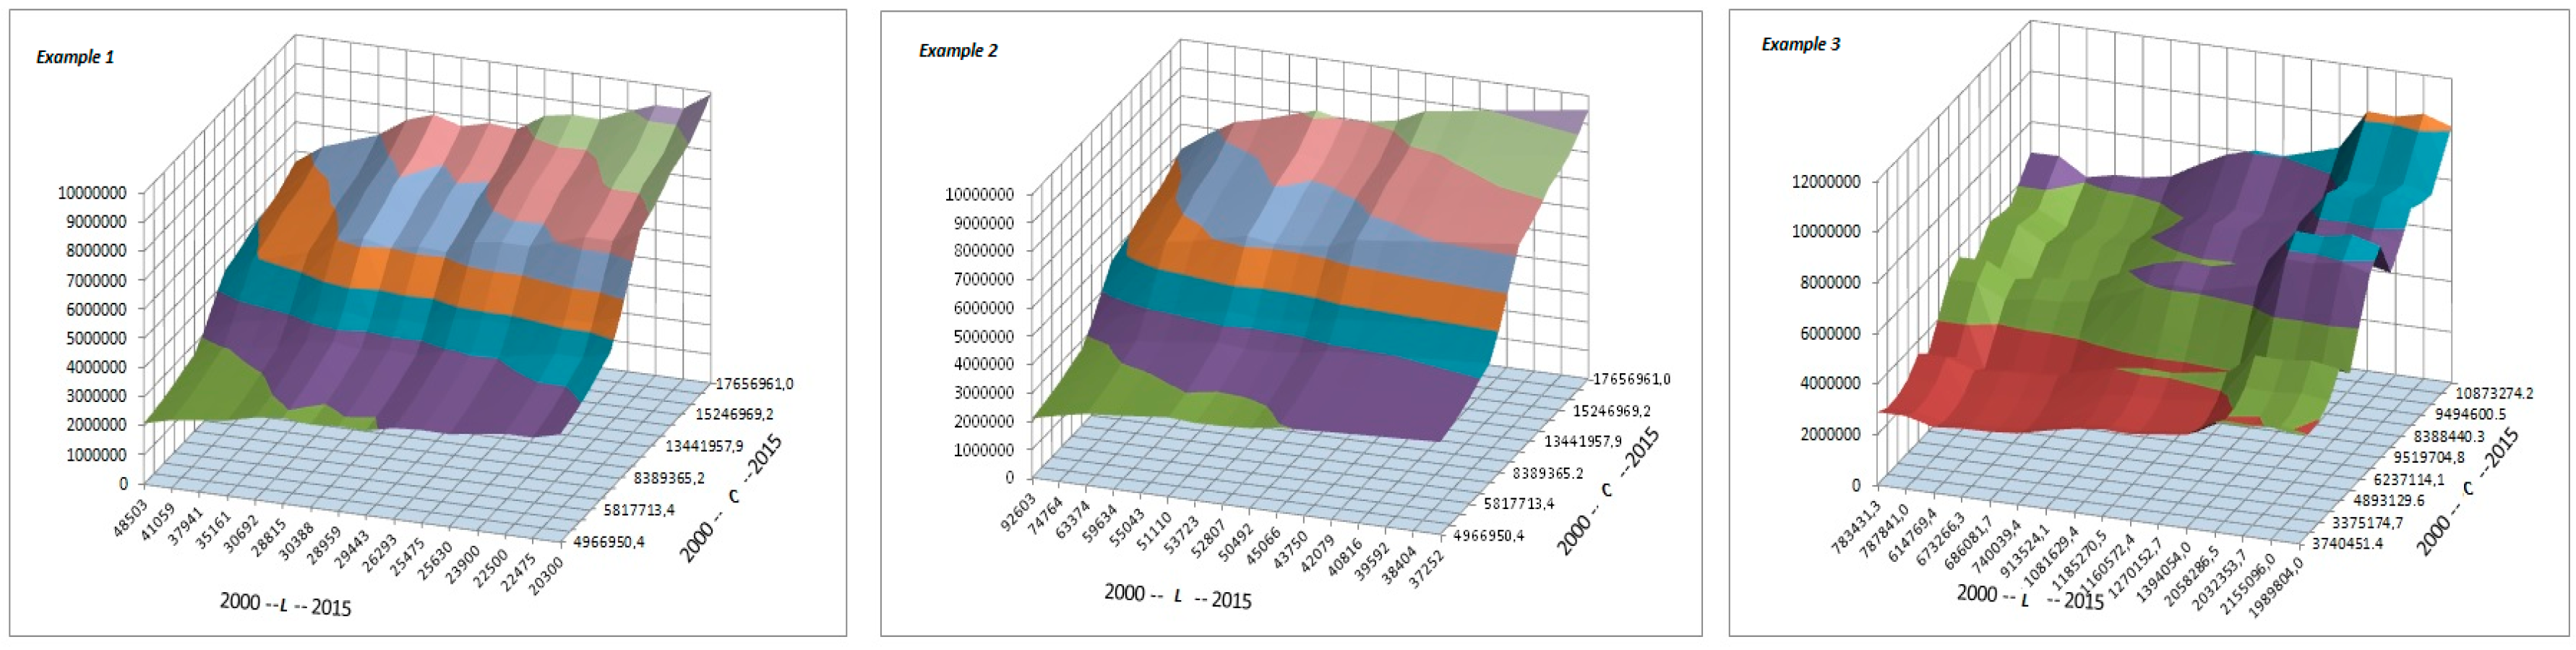
Examples of factor-dependent changes of efficiency of the production function described by sectoral added value can be found below:
Example 1 (static model):
where: P = sectoral added value; C = noncurrent assets; L = number of working people.
In Model 1, the elasticity of production with respect to the value of noncurrent assets (EP/C = 0.7799) was positive, but the elasticity of production with respect to the number of working people (EP/L = −0.6523) was negative. In consequence, the economies of scale of production understood as the sum of all elasticities of the power function were <1 (EP/C + EP/L = 0.1276), which meant that the inputs were growing faster than the production outputs (declining production efficiency).
Example 2 (static model):
where: P = sectoral added value; C = noncurrent assets; L = working time.
In Model 2 the elasticity of production with respect to the value of noncurrent assets (EP/C = 0.8435) was positive, but the elasticity of production with respect to the working time (EP/L = −0.4830) was negative. In consequence, the economies of scale of production understood as the sum of all elasticities of the power function were <1 (EP/C + EP/L = 0.3605), which meant that the inputs were growing faster than the production outputs (declining production efficiency).
Example 3 (static model):
where: P = sectoral added value; C = noncurrent assets less depreciation costs, with regard to production capacity of the noncurrent assets; L = labour costs.
In Model 3, the elasticity of production with respect to the value of noncurrent assets less depreciation costs, with regard to production capacity of the noncurrent assets (EP/C = 0.7150) was positive, and the elasticity of production with respect to labour costs (EP/L = 0.4284) was positive, too. In consequence, the economies of scale of production, understood as the sum of all elasticities of the power function, were >1 (EP/C + EP/L = 1.1434), which meant that the inputs were growing slower than the production outputs (growing production efficiency).
Figure 1 represents static models from Examples 1–3 graphically. Function distribution in first two models (Examples 1 & 2) are similar, as the economies of scale were declining (EP/C + EP/L < 1). Nevertheless, the distribution of the function presented in last model (Example 3, growing economies of scale, EP/C + EP/L > 1) differs. A similar situation has been observed in models where the dependent variable was described by metallurgical production sold, i.e., a negative correlation between variable P (output) and variable L (number of employees or actual working time in the steel industry in Poland in years 2000–2015), and a positive correlation between variable P (output) and variable C (noncurrent assets, noncurrent assets less depreciation costs, with regard to the production capacity of the noncurrent assets in Polish steel industry).
Example 4 (dynamic model):
where: P = sectoral added value; C = noncurrent assets; L = labour costs.
In this model (Example 4), the growth of production volume is due to the technical and organizational progress, although its influence eγt did not exceed 6.4%.
2.2. Decision-Making Model
Młody [26] (p. 169) states that in the current economic reality, companies are forced, more than ever, to make decisions regarding effective management of international operations’ portfolio, including the reduction of activities in foreign markets. For this reason the choice of a right measure to assess the efficiency of company’s operations, including restructuring processes, becomes crucial. In metallurgical industry such enhancement of the decision-making process is mostly performed with quantitative, sometimes with qualitative, but hardly every with a mixed quantitative-qualitative approach [12]. Peleckis [26] observes that decision-making can be influenced by the emotions of the individual, which is another argument in favour of the implementation of qualitative methodology into the scope of this research. For these reasons, we have decided to expand our quantitative research by additional verification through qualitative methodology. AHP has been chosen for this purpose.
The AHP method has been invented by Saaty [27]. Kou et al. [28] state that AHP was initially developed, making the most use of field data, laboratory results, and experts’ experience, for applications in multicriteria decision-making, planning, and resource allocation, and in conflict resolution. Further discussion of the method can be found in [29,30], whereas its critique in [31,32,33], answered in [34].
The AHP method has been widely used to enhance multicriteria decision-making processes in various branches of industry, e.g., manufacturing [35], supply chain management [36], technology transfer [37], and others. Nevertheless, we have not found any applications that aimed at qualitative verification of formerly obtained quantitative research results in the metallurgical sector. From this perspective, our application of AHP method could be considered as innovative.
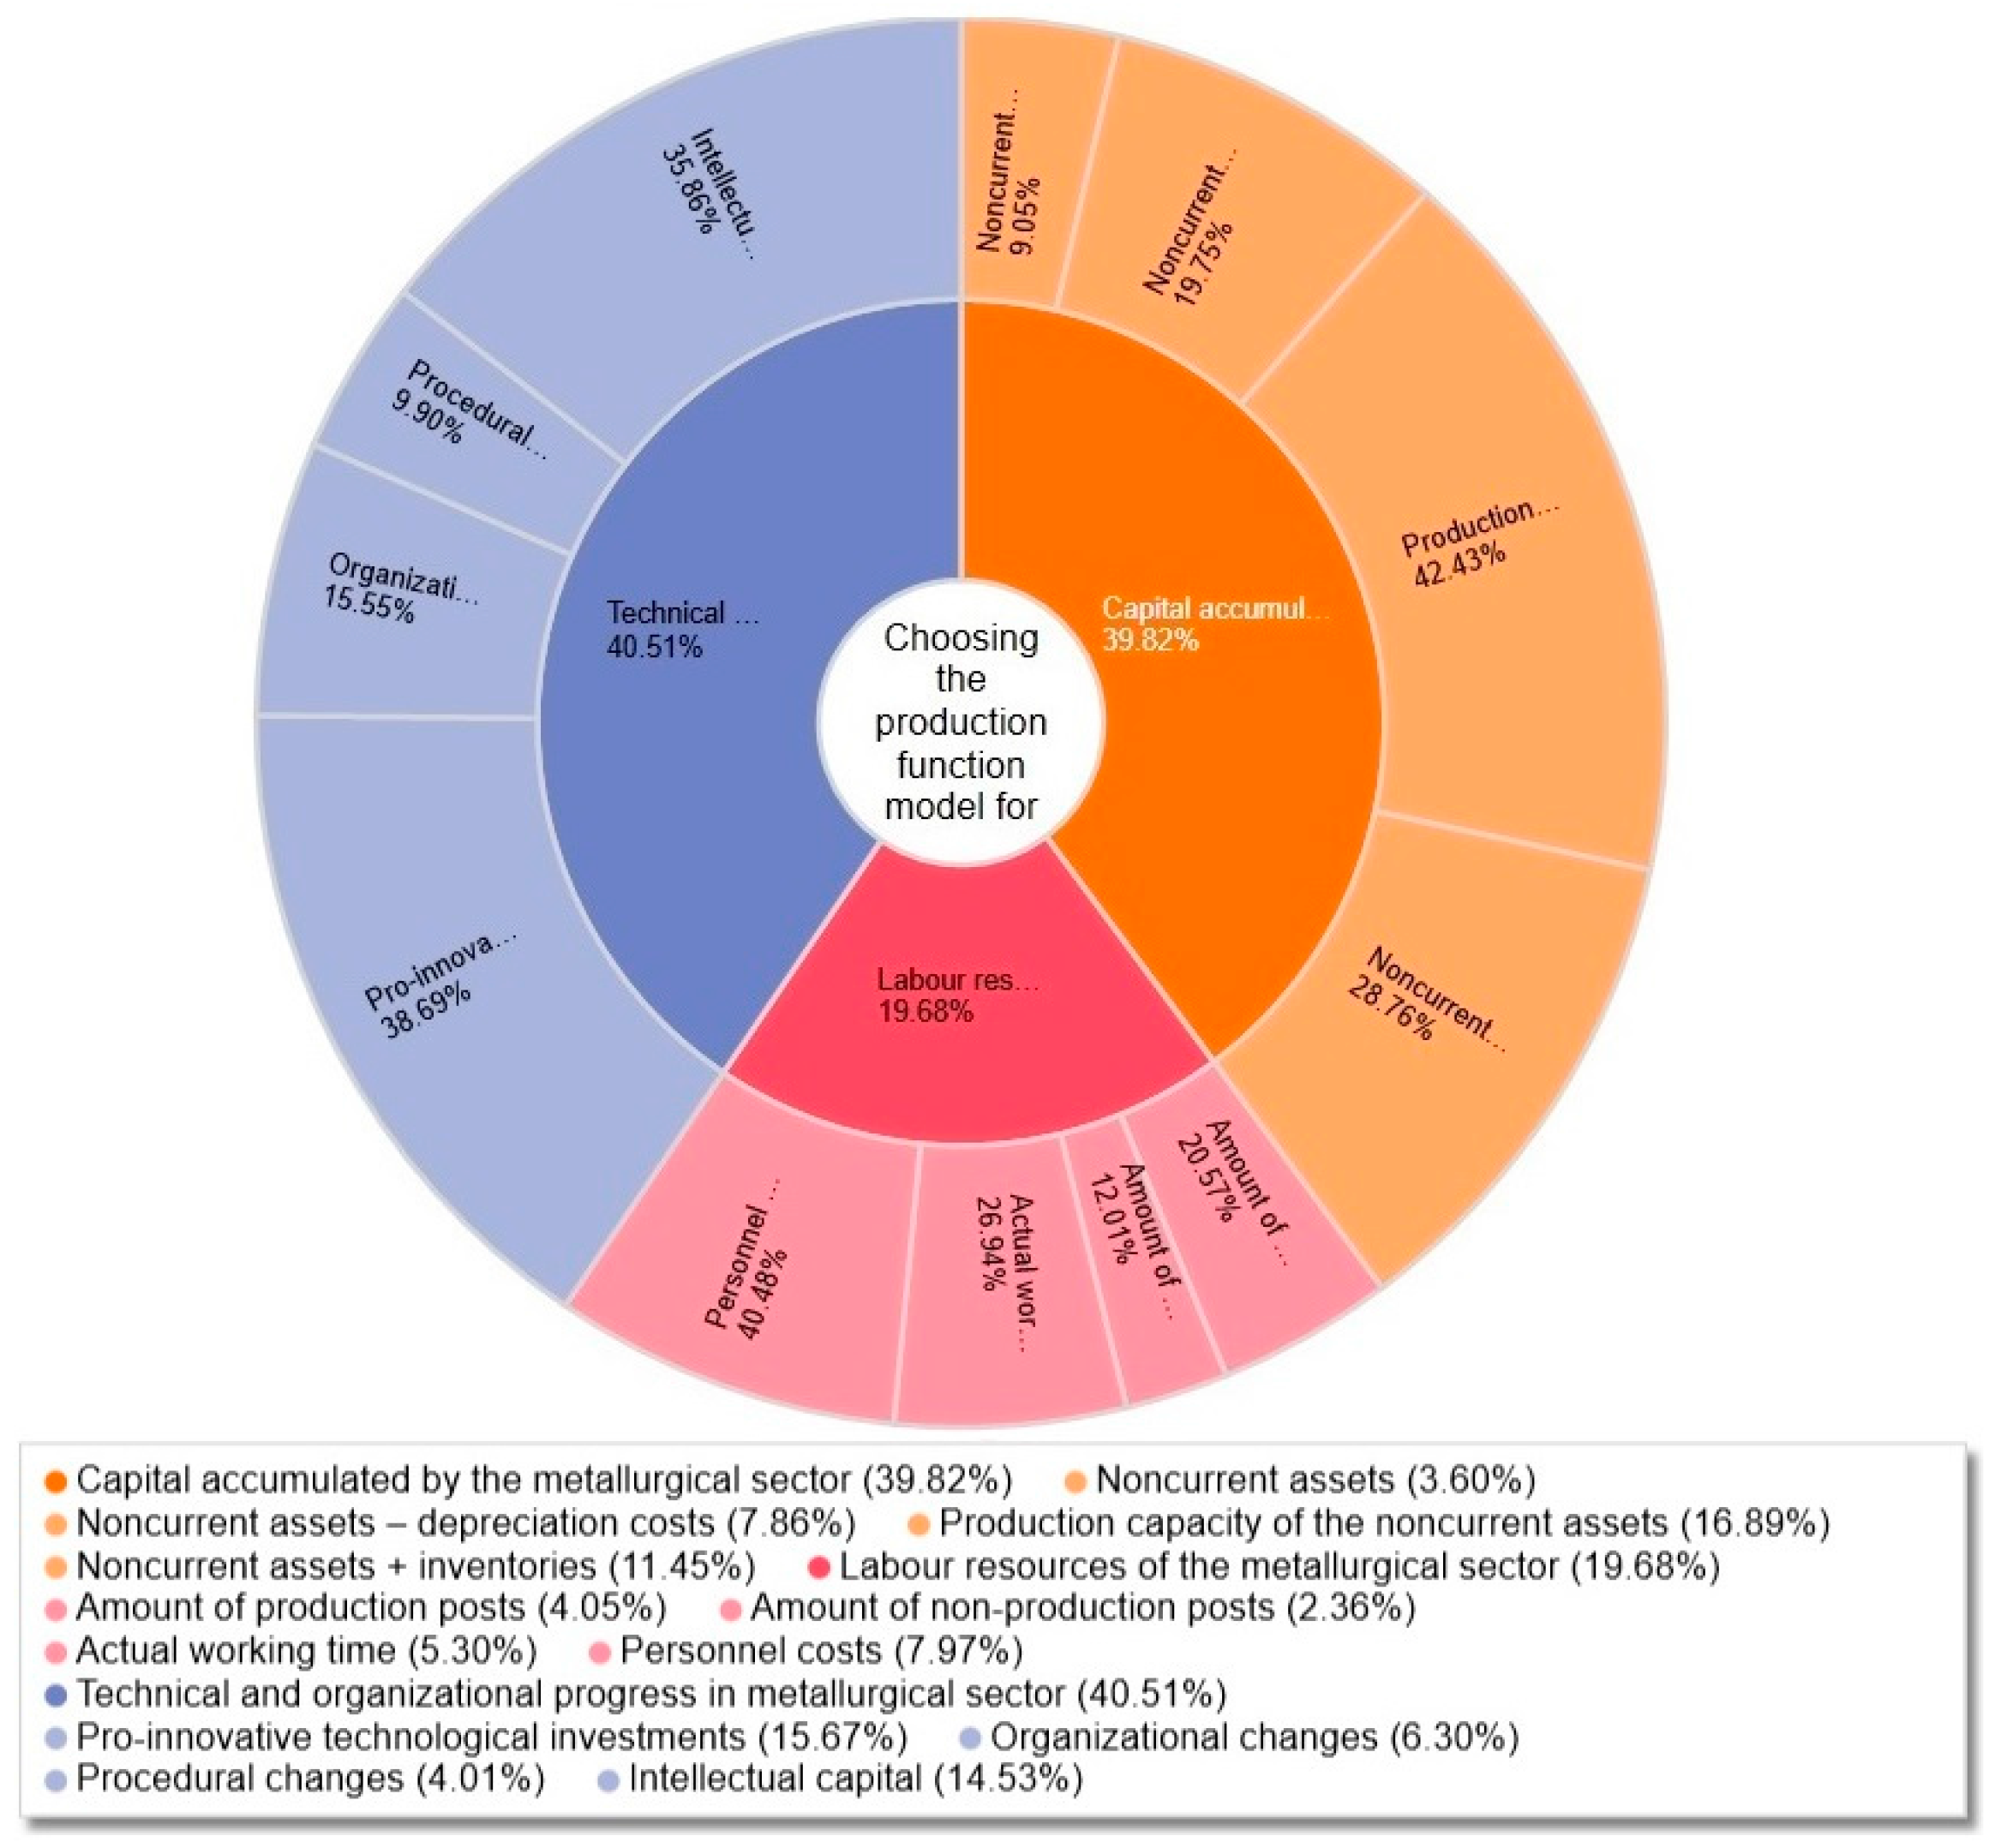
The main goal of the AHP-based decision-making model is to choose the production function model that best reflects the restructuring efficiency of the Polish metallurgical industry. Decision alternatives are the three production functions discussed in the precedent section. Decision criteria originate from previous research [38] and are composed of three main criteria with sub-criteria: (I) Capital accumulated by the metallurgical sector: (i) noncurrent assets; (ii) noncurrent assets—depreciation costs; (iii) production capacity of the noncurrent assets; and, (iv) noncurrent assets + inventories; (II) Labour resources of the metallurgical sector: (i) amount of production posts; (ii) amount of non-production posts; (iii) actual working time); and, (iv) personnel costs; (III) Technical and organizational progress in metallurgical sector: (i) pro-innovative technological investments; (ii) organizational changes; (iii) procedural changes; and, (iv) intellectual capital. Detailed description of each criterion can be found in [38].
Expert evaluations of relevance of qualitative decision-making criteria have been provided by scientists and practitioners from two leading metallurgical centres, with two biggest ironworks in Poland—Katowice (Silesian University of Technology: Faculty of Materials Engineering and Metallurgy) and Cracow (Cracow University of Technology: Material Engineering Institute and Production Engineering Institute; AGH—University of Science and Technology: Department of Engineering of Cast Alloys and Composites). The preselection of experts has been performed on basis of their academic achievements in the field of metallurgy (scientists) and managerial or counselling experience at restructuring in the metallurgical sector (practitioners).
Expert significance rankings have been collected online via personalized links through the Expert Choice Inc. Comparion™ Suite, academic license. Complete data grids for all of the evaluations, including the inconsistency report, are available for inspection. The inconsistency ratio assumption (IR ≤ 0.1) [39] (p. 61) has been maintained by eliminating one respondent (out of 9) whose evaluations where not consistent in more than 10%.
3. Results
Research results that are presented in this section come from experts’ preference statements about each pair of decision criteria and sub-criteria. They constitute preferences from all pairwise comparisons, provided by every evaluator. As a result of performed evaluations, a hierarchy of decision alternatives has been obtained. The first place in this ranking is given to the alternative (production function model) that accordingly to experts meets all decision criteria (presented in Table 2) simultaneously to the highest extent. The last place in this ranking is granted to the production function model that reflects the inflicted hierarchy of decision criteria less accurately than higher ranked alternatives. Figure 2 represents the results of expert evaluations in AHP-based decision-making model (normalized for all the evaluators).
It can be seen that experts point at the production function model expressed by sectoral added value (net production of the entire metallurgical sector) as the one that best reflects restructuring efficiency of Polish metallurgical industry (35.73%). Second place has been attributed to the production function expressed by sector’s steel production volume (32.25%), and third to the production function expressed by metallurgical production sold. Figure 3 shows the results of expert evaluations with regard to the influence of each of the three major criteria on particular decision alternatives.
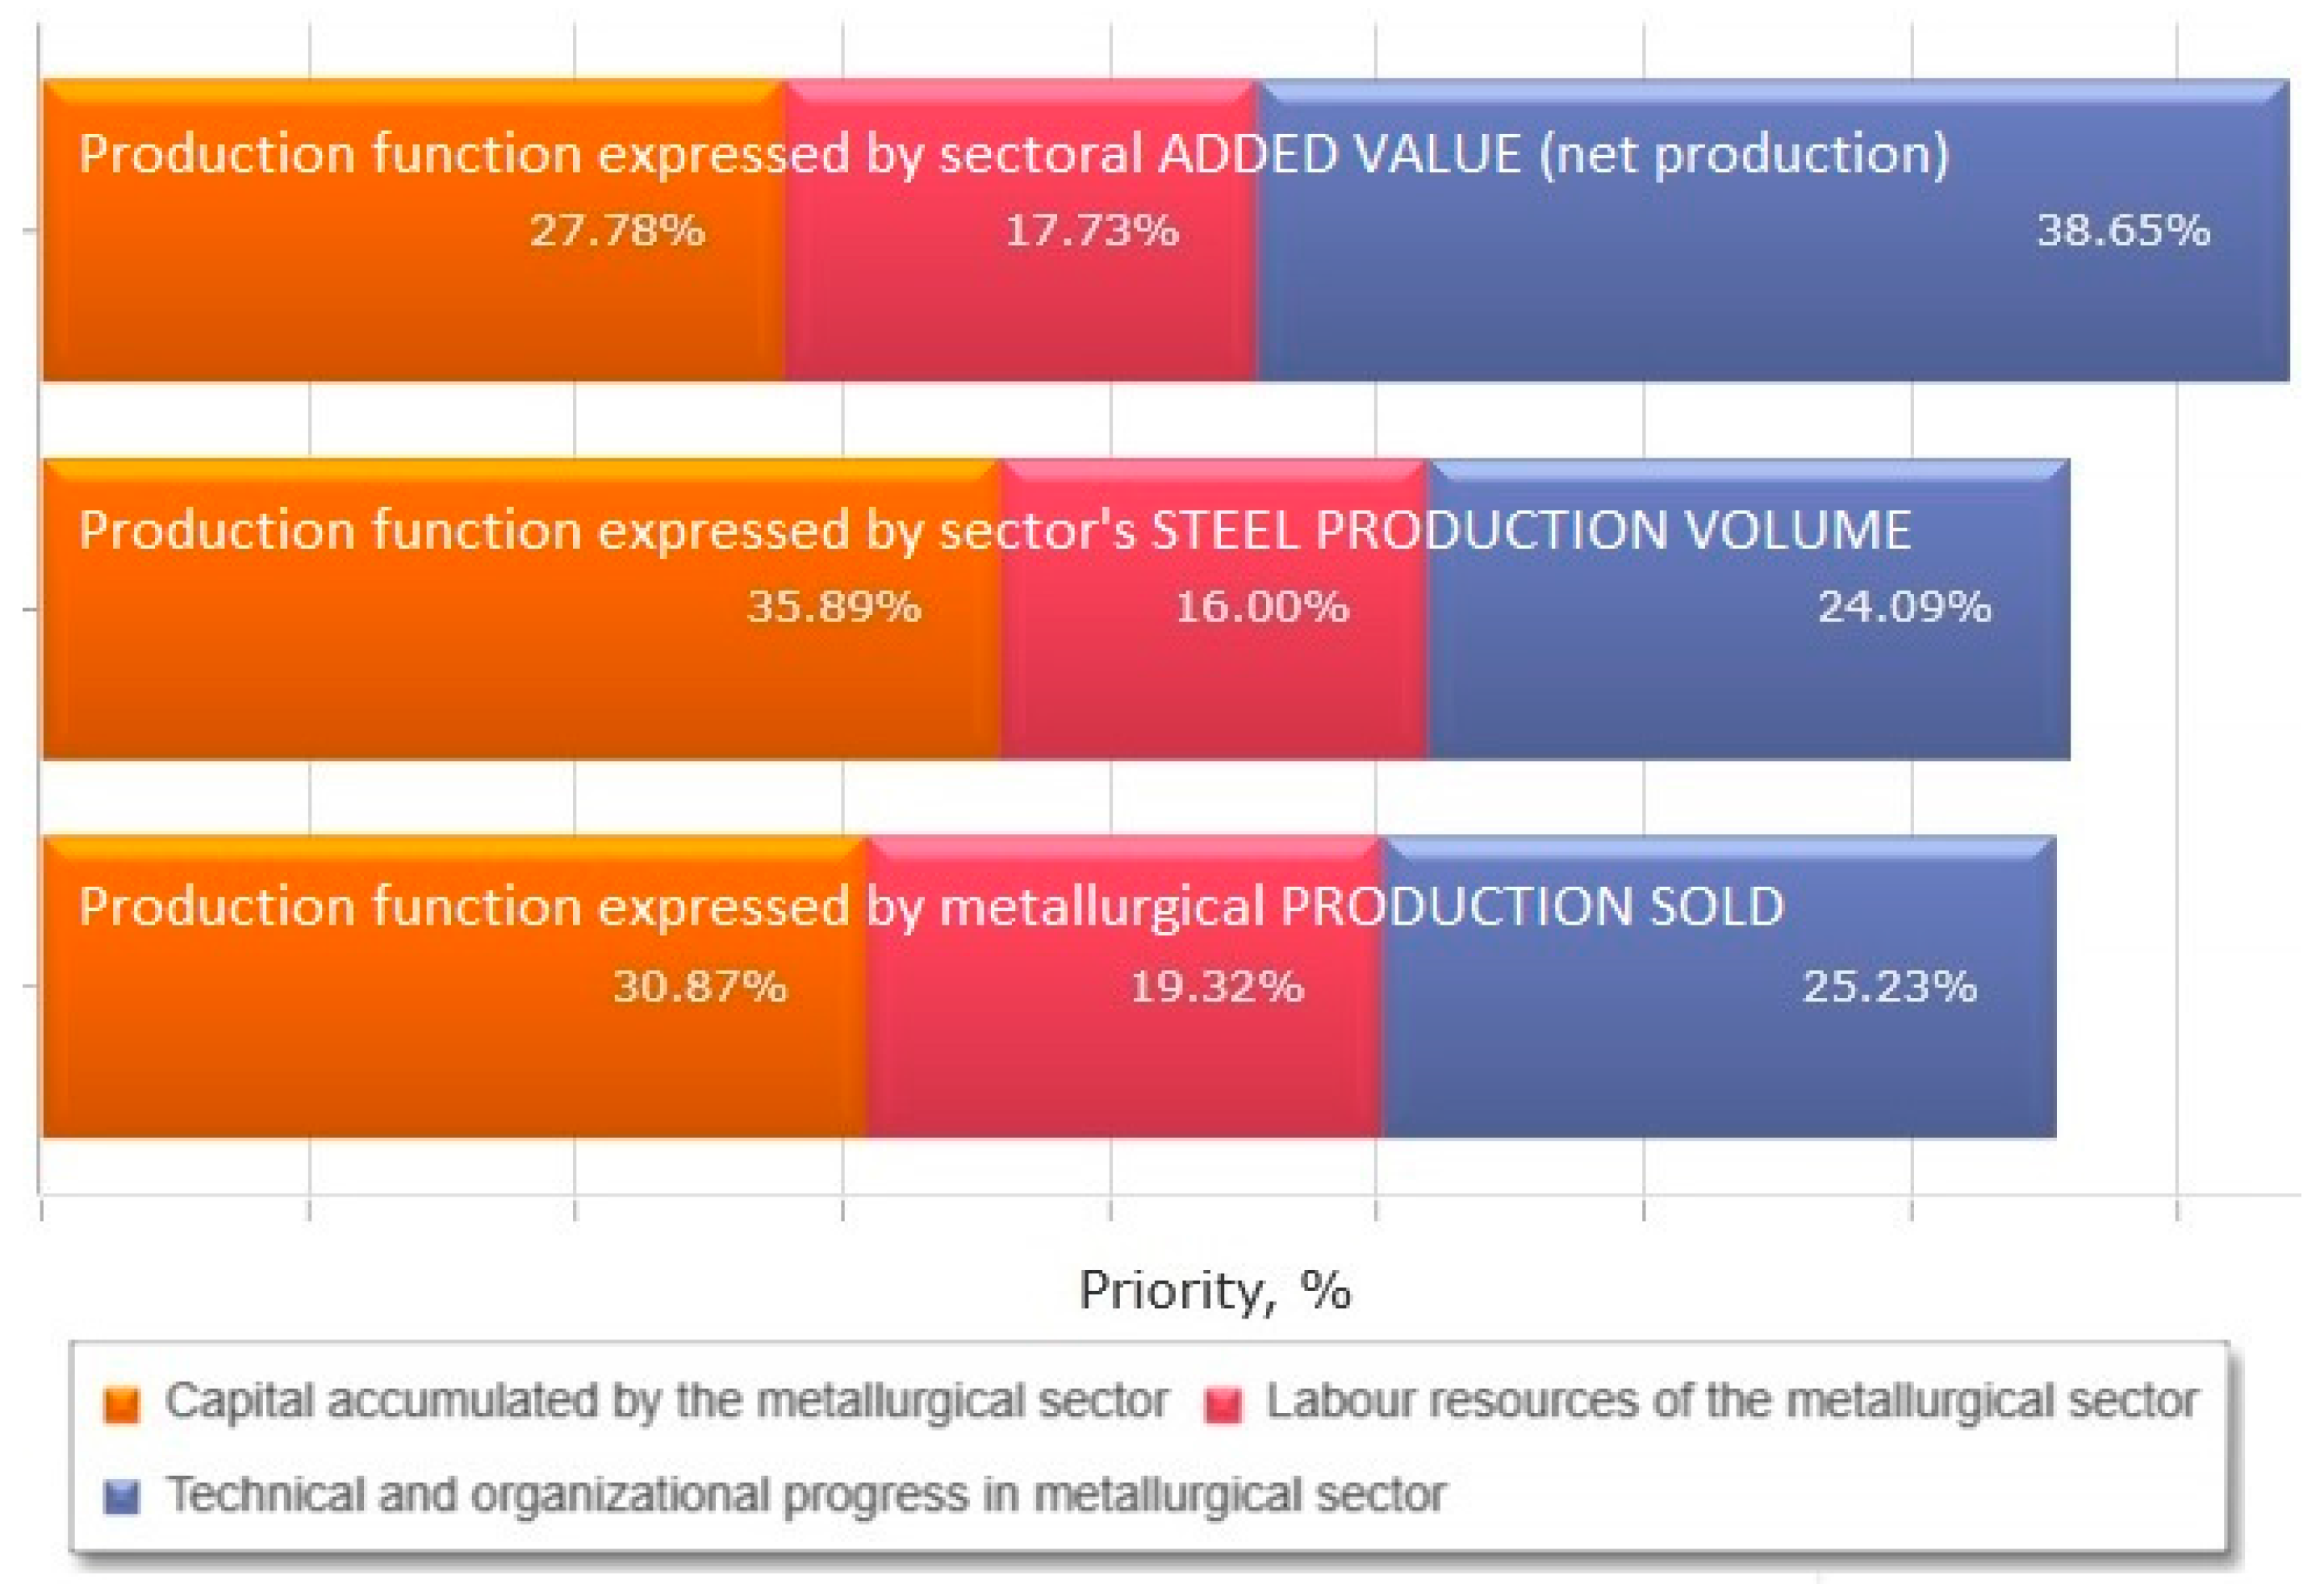
One can notice that the significance of the technical and organizational progress in the metallurgical sector is most important in our best decision alternative, i.e., production function expressed by sectoral added value (38.65%). 2nd and 3rd production functions show a significantly lower susceptibility to this criterion (respectively, 24.09% and 25.23%), although they seem to be more dependent on sector’s capitalization (respectively, 35.89% and 30.87%). The structure, quality, and availability of labour resources contributed to the largest extent to the production function expressed by metallurgical production sold (19.32%). This in turn seems to be consistent with the outcome of former quantitative research pointing at the dependence of sector’s restructuring efficiency from labour resources, especially from the amount of non-production posts.
Table 2 presents local and global prioritizations of decision criteria and sub-criteria from expert evaluations.
The local priorities are the ratio-scale weights of a sub-criteria node with respect to the parent criterion, whereas global priorities are the ratio-scale weights of any parent criterion with respect to the main goal. In presented research, the global priorities sum up to 100.01%, because of the imperfect inconsistency level of evaluators’ answers (but still acceptable—IR ≤ 0.1). The issue has been further explained in [30].
A graphical presentation of the prioritization of all decision criteria presented in Table 2, with regard to the main goal of AHP decision-making model (choosing the production function model for an optimal measurement of the restructuring efficiency of the Polish metallurgical sector in years 2000–2015) can be found on the hierarchical pie chart below (Figure 4). Criteria, sub-criteria, and data are the same as in Table 2.
As mentioned before, the complimentary aim of this publication was to verify the outcome of former quantitative research with qualitative methods. Whereas, experts’ first choice is consistent with former results, the second-best solution contradicts their outcome. We will try to provide explanations of this discrepancy in the following section.
4. Discussion
The main limitations of this research came from a predefined set of decision-making criteria. Probably, with a more specific focus the research could provide us with a more detailed analysis of efficiency of particular restructuring actions. Nevertheless, as discussed before, the scope of this paper was slightly different.
Obtained qualitative results mostly confirmed the results of former quantitative research, as the production function that seems to best reflect the restructuring efficiency in Polish metallurgical sector is the one that is expressed by the sectoral added value. At the same time, quantitative research proved the production function expressed by steel production volume to be non-relevant for modelling of these restructuring processes. Potential explanations are the following:
- From decision-maker’s perspective: as the 1st decision alternative obtained a significantly higher ranking that both 2nd and 3rd, neither 2nd nor 3rd can be perceived as a credible second-best solution—they both need to be rejected.
- From the perspective of former quantitative research: for the needs of econometric analysis of restructuring efficiency of Polish metallurgical sector, the dependent variable P expressed by the steel production volume (in mln. tons), together with explanatory variables C and L did not pass the statistical verification. Therefore, no production function models could be constructed on basis of this variable. Nevertheless, the rejection of this dependent variable in econometric analysis did not exclude its utilization in qualitative research. It can happen that the steel production volume, in reality, does reflect some aspects of the efficiency of restructuring processes, but the issue needs further research.
- In frames of AHP methodology: the IR ≤ 0.1 inconsistency ratio assumption still leaves space for a 10% inconsistency in expert evaluations; a very low distance between 2nd and 3rd decision alternatives (∆ = 0.23%) suggests a possibility of misinterpreting the evaluations with regard to ranking of two last decision alternatives.
Despite the fact that this inconsistency seems to be of low significance (due to the distance between 2nd and 3rd decision alternatives)—and whatever explanation of this discrepancy adopted—the issue definitely merits further research.
This paper constitutes an attempt to apply a joint quantitative-qualitative research methodology for an analysis of efficiency of restructuring of production processes in a given sector of industry. The first part of our research provided objective information on quantitative relations that occur in a real metallurgical production environment. The second brought a subjective evaluation of interaction between each production factor and production effects.
The adopted quantitative-qualitative methodology allowed for identifying the influence of particular production factors on steel production volume, both from an econometric and expert perspective. Together with the elaborated AHP multicriteria decision-making model, such a joint approach can become a powerful tool for managerial applications in production engineering in such fields as: transformation to market economy, strengthening of presence and efficiency in international steel market, adaptation to changing prices of metallurgical production, anticipation of changes in costs of resources and energy, reaction to internationalization processes in metallurgical sector, elaboration of production prognostics, and many others. It can be also employed for further scientific research.
Our further research will focus on the following: production function models based on steel production volume that have already been constructed for Polish metallurgical sector [40] will be put under expert evaluations in the context of potential reaction scenarios [41] in a complex economic, social, and ecological environment.
Acknowledgments
This publication was co-financed by: (i) the Faculty of Economics and International Relations of Cracow University of Economics in frames of a grant awarded to maintain its research potential (063/WE-KMSG/01/2017/S/7063); (ii) the National Science Centre of Poland (DEC 2013/11/D/HS4/04070) within a research project entitled “The Application of Analytic Hierarchy Process for Analyzing Material and Non-material Determinants of Life Quality of Young Europeans” lead by Remigiusz Gawlik, Ph.D. between 2014 and 2017.
Author Contributions
The contribution of both authors is equal and counts for 50% of all research and article preparation activities. Bożena Gajdzik conceived and designed the quantitative research, gathered quantitative data and performed calculations; Remigiusz Gawlik conceived and designed the qualitative research, created the decision-making model, provided the academic licence for the use of Expert Choice Comparion Suite software, gathered and analysed data from qualitative research; the literature review, description of the research methodology as well as writing of the paper have been conducted by both authors.
Conflicts of Interest
The authors declare no conflict of interest.
References
- Borowiecki, R. Effectiveness of Enterprises’s Restructuring and Economic Analysis as an Instrument of Restructuring Management. Acta Oeconomica Cassoviensia 1998, 2, 17–23. [Google Scholar]
- Gajdzik, B. The road of Polish steelworks towards market success—Changes after restructuring process. Metalurgija 2013, 52, 421–424. [Google Scholar]
- Gajdzik, B.; Ocieczek, W. Soft restructuring process in metallurgical enterprises in Poland. Metalurgija 2015, 54, 729–732. [Google Scholar]
- Gajdzik, B. Analysis of the size of steel production in Polish steel industry. In Proceedings of the METAL 2016 25th Anniversary International Conference on Metallurgy and Materials, Brno, Czech Republic, 25–27 May 2016; Tanger: Ostrava, Czech Republic, 2016; pp. 1787–1792. [Google Scholar]
- Gajdzik, B.; Janiszewski, K. Technological effects of metallurgical industry restructuring in Poland. Solid State Phenomena 2013, 212, 187–190. [Google Scholar] [CrossRef]
- Kłosok-Bazan, I.; Gajdzik, B.; Machnik-Słomka, J.; Ocieczek, W. Environmental aspects of innovation and new technology implementation in metallurgical industry. Metalurgija 2015, 54, 433–436. [Google Scholar]
- Gajdzik, B. The ecological value of metallurgical enterprise after privatization and restructuring. Metalurgija 2012, 51, 129–132. [Google Scholar]
- Gajdzik, B.; Burchart-Korol, D. Eco-innovation in manufacturing plants illustrated with an example of steel products development. Metalurgija 2011, 50, 63–66. [Google Scholar]
- Gajdzik, B. Comprehensive classification of environmental aspects in metallurgical enterprise. Metalurgija 2012, 51, 541–544. [Google Scholar]
- Szczucka-Lasota, B.; Gajdzik, B.; Węgrzyn, T.; Wszołek, Ł. Steel Weld Metal Deposit Measured Properties after Immediate Micro-Jet Cooling. Metals 2017, 7, 339. [Google Scholar] [CrossRef]
- Gajdzik, B. World Class Manufacturing in metallurgical enterprise. Metalurgija 2013, 52, 131–134. [Google Scholar]
- Szymszal, J.; Gajdzik, B.; Kaczmarczyk, G. The use of modern statistical methods to optimize production systems in foundries. Arch. Foundry Eng. 2016, 16, 115–120. [Google Scholar] [CrossRef]
- Cobb, C.W.; Douglas, P.H. A Theory of Production. Am. Econ. Rev. 1928, 18, 139–165. [Google Scholar]
- Chenery, H.B.; Clark, P. Interindustry Economics; John Willey & Son, Inc.: New York, NY, USA, 1959. [Google Scholar]
- Walters, A.A. Production and cost functions: An econometric survey. Econometrica 1963, 31, 1–66. [Google Scholar] [CrossRef]
- Brown, M. (Ed.) The Theory and Empirical Analysis of Production; Columbia University Press: New York, NY, USA, 1967. [Google Scholar]
- Intriligator, M.D. Mathematical Optimization and Economic Theory; Prentice Hall: Englewood Cliffs, NJ, USA, 1971. [Google Scholar]
- Pawłowski, Z. An Econometric Analysis of the Production Process; PWN: Warsaw, Poland, 1976. [Google Scholar]
- Welfe, W. The Econometric Models of the Polish Economy; PWE: Warsaw, Poland, 1992. [Google Scholar]
- Arrow, K.J.; Chenery, H.; Minhas, B.; Solow, R.W. Capital-labor substitution and economic efficiency. Rev. Econ. Stat. 1963, 42, 225–250. [Google Scholar] [CrossRef]
- Tinbergen, J. Production, Income and Welfare: The Search for an Optimal Social Order; University of Nebraska Press: Lincoln, NE, USA, 1985. [Google Scholar]
- Borkowski, B.; Dudek, H.; Szczęsny, W. Ekonometria: Wybrane Zagadnienia; PWN: Warsaw, Poland, 2004. [Google Scholar]
- Intriligator, M.D. Econometric Models, Techniques and Applications; North-Holland: Amsterdam, The Netherlands, 1978. [Google Scholar]
- Młody, M. Backshoring in Light of the Concepts of Divestment and De-internationalization: Similarities and Differences. Entrep. Bus. Econ. Rev. 2016, 4, 167–180. [Google Scholar] [CrossRef]
- Database of the Central Statistical Office of Poland (GUS). Available online: www.stat.gov.pl (accessed on 7 December 2017).
- Peleckis, K. The Use of Game Theory for Making Rational Decisions in Business Negotiations: A Conceptual Model. Entrep. Bus. Econ. Rev. 2015, 3, 105–121. [Google Scholar] [CrossRef]
- Saaty, T.L. The Analytic Hierarchy Process; McGraw-Hill: New York, NY, USA, 1980. [Google Scholar]
- Kou, C.; Xiao, P.; Kang, A.; Mikhailenko, P.; Baaj, H.; Wu, Z. Methods to Evaluate the Aging Grades of Reclaimed Asphalt Binder. Appl. Sci. 2017, 7, 1209. [Google Scholar] [CrossRef]
- Gawlik, R. The use of Analytic Hierarchy Process to analyse international corporations’ operating environment. Crac. Rev. Econ. Manag. 2012, 891, 19–30. [Google Scholar]
- Gawlik, R. Encompassing the work-life balance into early career decision-making of future employees through the Analytic Hierarchy Process. In Advances in Intelligent Systems and Computing Series: Advances in Human Factors, Business Management and Leadership; Kantola, J.I., Barath, T., Nazir, S., Eds.; AHFE 2017. Advances in Intelligent Systems and Computing, vol. 594; Springer International Publishing AG: Cham, Switzerland, 2018; pp. 137–147. ISBN 978-3-319-60371-1. [Google Scholar] [CrossRef]
- Belton, V.; Gear, A.E. On a shortcoming of Saaty’s method of analytic hierarchies. Omega 1983, 11, 228–230. [Google Scholar] [CrossRef]
- Dyer, J.S. Remarks on the Analytic Hierarchy Process. Manag. Sci. 1990, 36, 249–258. [Google Scholar] [CrossRef]
- Barzilai, J. Notes on the Analytic Hierarchy Process. In Proceedings of the 2001 NSF Design, Service & Manufacturing Grantees & Research Conference, Tampa, FL, USA, 7–10 January 2001; National Science Foundation: Tampa, FL, USA; pp. 1–6. [Google Scholar]
- Saaty, T.L.; Vargas, L.; Whitaker, R. Addressing with brevity criticism of the Analytic Hierarchy Process. Int. J. Anal. Hierarchy Process 2009, 1, 121–134. [Google Scholar] [CrossRef]
- Wang, G.; Tian, X.; Hu, Y.; Evans, R.D.; Tian, M.; Wang, R. Manufacturing Process Innovation-Oriented Knowledge Evaluation Using MCDM and Fuzzy Linguistic Computing in an Open Innovation Environment. Sustainability 2017, 9, 1630. [Google Scholar] [CrossRef]
- Poh, K.L.; Liang, Y. Multiple-Criteria Decision Support for a Sustainable Supply Chain: Applications to the Fashion Industry. Informatics 2017, 4, 36. [Google Scholar] [CrossRef]
- Dinmohammadi, A.; Shafiee, M. Determination of the Most Suitable Technology Transfer Strategy for Wind Turbines Using an Integrated AHP-TOPSIS Decision Model. Energies 2017, 10, 642. [Google Scholar] [CrossRef]
- Gajdzik, B. Application of the Cobb-Douglas production function for analysis of production in Polish steel industry. In Proceedings of the METAL 2017 26th Anniversary International Conference on Metallurgy and Materials, Brno, Czech Republic, 24–26 May 2017; Tanger: Ostrava, Czech Republic, 2017. [Google Scholar]
- Marona, B.; Wilk, A. Tenant Mix Structure in Shopping Centres: Some Empirical Analyses from Poland. Entrep. Bus. Econ. Rev. 2016, 4, 51–65. [Google Scholar] [CrossRef]
- Gajdzik, B. Prognostic modeling of total steel production and according to production technology in Poland. Metalurgija 2017, 56, 241–244. [Google Scholar]
- Gajdzik, B. The Predictive Scenario Analysis in a Business Model: Variants of Possible Steel Production Trajectories and Efficiency in Poland. In Strategic Performance Management, New Concepts and Contermproray Trends; Jabłoński, M., Ed.; Nova Science Publishers, Inc.: Hauppauge, NY, USA, 2017; pp. 235–252. ISBN 978-1-53612-682-2. [Google Scholar]
Figure 1.
Graphical illustration of Cobb-Douglas production function models for Polish steel industry in restructuring period of 2000–2015 (in thous.). Source: own elaboration based on research results.
Figure 1.
Graphical illustration of Cobb-Douglas production function models for Polish steel industry in restructuring period of 2000–2015 (in thous.). Source: own elaboration based on research results.

Figure 2.
Aggregated results of experts’ rankings in frames of Analytic Hierarchy Process (AHP) decision alternatives. Source: own elaboration based on research results.
Figure 2.
Aggregated results of experts’ rankings in frames of Analytic Hierarchy Process (AHP) decision alternatives. Source: own elaboration based on research results.
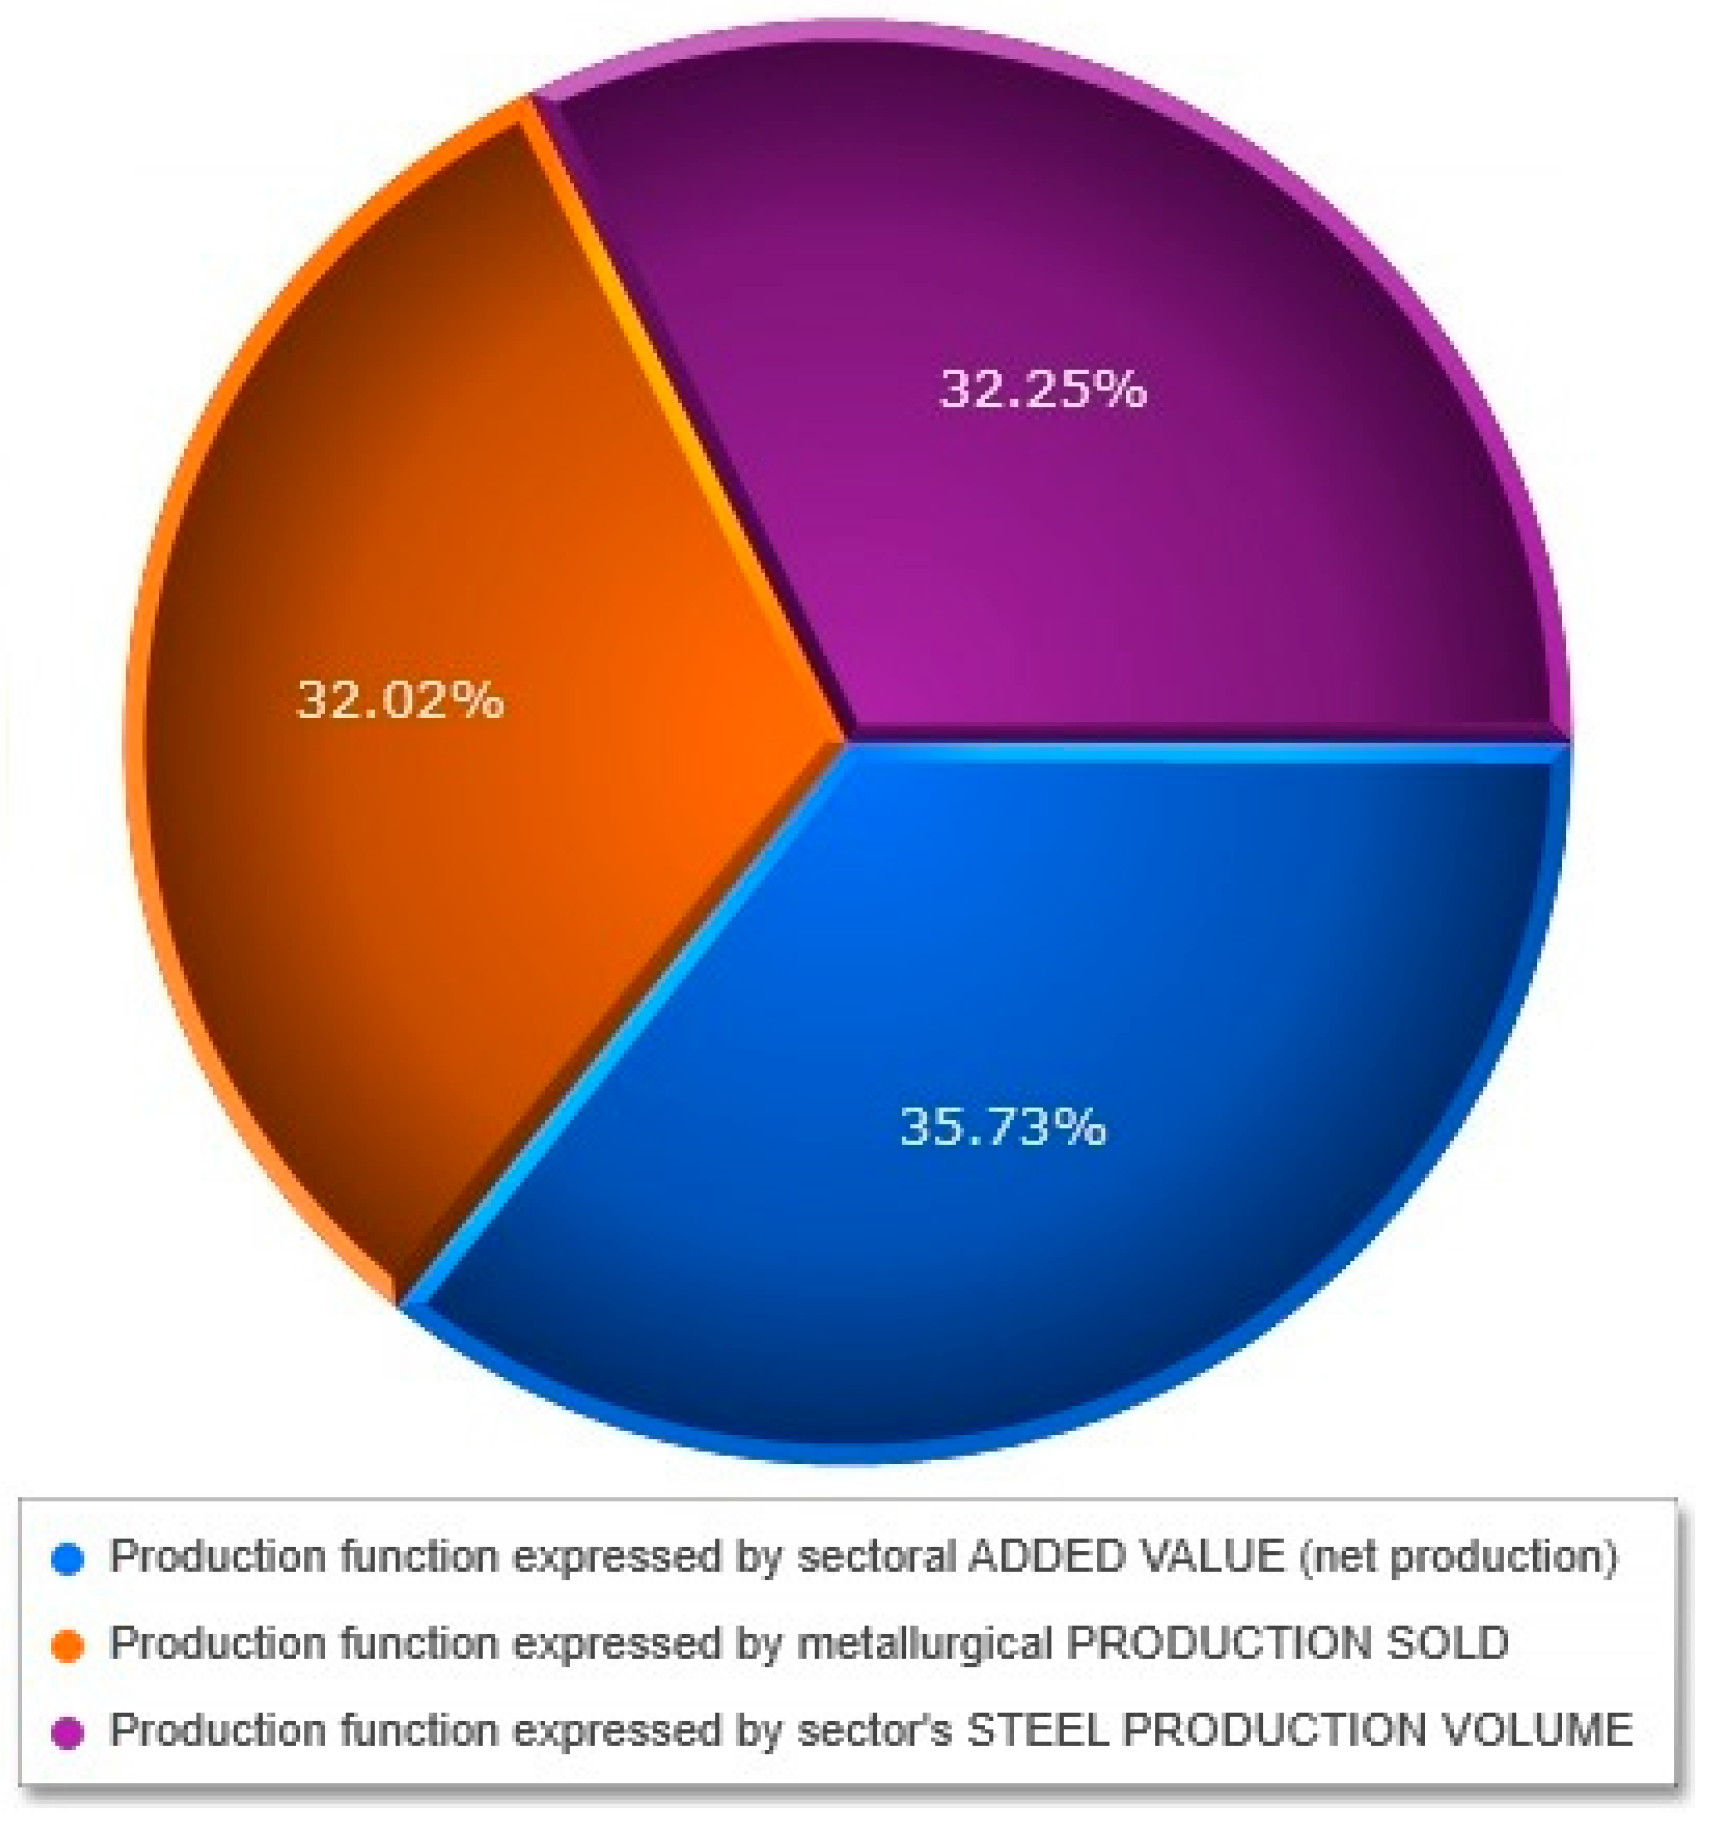
Figure 3.
Criteria-sensitive results of experts’ rankings in frames of AHP decision alternatives. Source: own elaboration based on research results.
Figure 3.
Criteria-sensitive results of experts’ rankings in frames of AHP decision alternatives. Source: own elaboration based on research results.
Figure 4.
Graphical presentation of prioritization of decision criteria and sub-criteria. Source: own elaboration based on research results.
Figure 4.
Graphical presentation of prioritization of decision criteria and sub-criteria. Source: own elaboration based on research results.

Table 1.
Statistical data employed for modelling of production functions in Polish metallurgical sector.
Table 1.
Statistical data employed for modelling of production functions in Polish metallurgical sector.
| Year | Steel Prod. | Net Product.* | Production Sold * | Employment | Working Time ** | Personnel Costs | Noncurrent Assets * | Depreciation Costs * | Inventories |
|---|---|---|---|---|---|---|---|---|---|
| Units | mln. Tons | kPLN | kPLN | Persons | hrs | kPLN | kPLN | kPLN | kPLN |
| 2000 | 10.498 | 2,368,816 | 5,594,079 | 48,503 | 92,603 | 960,635 | 3,740,451 | 475,558 | 1,200,118 |
| 2001 | 8.809 | 2,354,104 | 6,510,389 | 41,059 | 74,764 | 1,001,291 | 3,303,025 | 455,410 | 880,650 |
| 2002 | 8.367 | 2,478,104 | 7,634,910 | 37,941 | 63,374 | 805,283 | 3,375,175 | 363,009 | 771,513 |
| 2003 | 9.107 | 2,855,602 | 8,732,778 | 35,161 | 59,634 | 861,849 | 3,826,378 | 521,455 | 945,948 |
| 2004 | 10.578 | 3,510,601 | 11,034,345 | 30,692 | 55,043 | 877,946 | 4,893,130 | 475,292 | 1,761,401 |
| 2005 | 8.336 | 3,726,759 | 11,749,752 | 28,815 | 51,110 | 951,725 | 4,112,924 | 504,061 | 1,704,774 |
| 2005 | 9.992 | 4,333,148 | 14,068,288 | 30,388 | 53,723 | 1,181,508 | 6,237,114 | 520,332 | 2,217,204 |
| 2007 | 10.631 | 5,059,092 | 16,948,513 | 28,959 | 52,807 | 1,282,866 | 8,479,986 | 616,023 | 2,783,153 |
| 2008 | 9.727 | 5,639,094 | 18,559,869 | 29,443 | 50,492 | 1,500,126 | 9,519,705 | 620,372 | 3,465,137 |
| 2009 | 7.128 | 6,246,660 | 18,630,690 | 26,293 | 45,066 | 1,413,797 | 7,243,792 | 632,130 | 2,731,506 |
| 2010 | 7.993 | 6,808,157 | 21,225,904 | 25,475 | 43,750 | 1,616,132 | 8,388,440 | 733,173 | 3,242,684 |
| 2011 | 8.776 | 7,893,795 | 25,711,174 | 25,630 | 42,079 | 1,782,271 | 9,849,655 | 804,536 | 4,515,567 |
| 2012 | 8.348 | 8,531,358 | 27,069,137 | 23,900 | 40,816 | 2,458,427 | 9,494,601 | 861,211 | 4,509,595 |
| 2013 | 7.950 | 8,527,592 | 27,558,472 | 22,500 | 39,592 | 2,034,230 | 9,343,192 | 845,370 | 5,141,268 |
| 2014 | 8.558 | 9,324,705 | 29,113,443 | 22,475 | 38,404 | 2,157,034 | 10,873,274 | 842,098 | 5,155,518 |
| 2015 | 9.202 | 1,0353,553 | 30,943,324 | 20,300 | 37,252 | 2,309,704 | 12,408,001 | 659,700 | 5,522,684 |
* In constant prices (GDP deflator of the Central Statistical Office of Poland (GUS) has been used); ** Actual working time; Source: own elaboration based on [25].
Table 2.
Local and global prioritization of decision criteria and sub-criteria (%).
| CRITERIA and Sub-Criteria | Prioritization (%) | |
|---|---|---|
| Local | Global | |
| CAPITAL ACCUMULATED BY THE METALLURGICAL SECTOR | 39.82% | 39.82% |
| Noncurrent assets | 9.05% | 3.60% |
| Noncurrent assets—depreciation costs | 19.75% | 7.86% |
| Production capacity of the noncurrent assets | 42.43% | 16.89% |
| Noncurrent assets + inventories | 28.76% | 11.45% |
| LABOUR RESOURCES OF THE METALLURGICAL SECTOR | 19.68% | 19.68% |
| Amount of production posts | 20.57% | 4.05% |
| Amount of non-production posts | 12.01% | 2.36% |
| Actual working time | 26.94% | 5.30% |
| Personnel costs | 40.48% | 7.97% |
| TECHNICAL AND ORGANIZATIONAL PROGRESS IN METALLURGICAL SECTOR | 40.51% | 40.51% |
| Pro-innovative technological investments | 38.69% | 15.67% |
| Organizational changes | 15.55% | 6.30% |
| Procedural changes | 9.90% | 4.01% |
| Intellectual capital | 35.86% | 14.53% |
Source: own elaboration based on research results.
© 2017 by the authors. Licensee MDPI, Basel, Switzerland. This article is an open access article distributed under the terms and conditions of the Creative Commons Attribution (CC BY) license (http://creativecommons.org/licenses/by/4.0/).
Share and Cite
MDPI and ACS Style
Gajdzik, B.; Gawlik, R. Choosing the Production Function Model for an Optimal Measurement of the Restructuring Efficiency of the Polish Metallurgical Sector in Years 2000–2015. Metals 2018, 8, 23. https://doi.org/10.3390/met8010023
AMA Style
Gajdzik B, Gawlik R. Choosing the Production Function Model for an Optimal Measurement of the Restructuring Efficiency of the Polish Metallurgical Sector in Years 2000–2015. Metals. 2018; 8(1):23. https://doi.org/10.3390/met8010023
Chicago/Turabian StyleGajdzik, Bożena, and Remigiusz Gawlik. 2018. "Choosing the Production Function Model for an Optimal Measurement of the Restructuring Efficiency of the Polish Metallurgical Sector in Years 2000–2015" Metals 8, no. 1: 23. https://doi.org/10.3390/met8010023
Note that from the first issue of 2016, this journal uses article numbers instead of page numbers. See further details here.