Article

Low-Cycle Fatigue Behaviour of AISI 18Ni300 Maraging Steel Produced by Selective Laser Melting

by
Ricardo Branco
1,*,
José D. M. Costa
1,
Filippo Berto
2,
Seyed Mohammad Javad Razavi
2,
José A. Martins Ferreira
1,
Carlos Capela
1,3,
Luís Santos
3 and
Fernando Antunes
1
1
CEMMPRE, Department of Mechanical Engineering, University of Coimbra, Rua Luís Reis Santos, 3030-788 Coimbra, Portugal
2
Department of Mechanical and Industrial Engineering, Norwegian University of Science and Technology (NTNU), Richard Birkelands vei 2b, 7491 Trondheim, Norway
3
Department of Mechanical Engineering, ESTG, Polytechnic Institute of Leiria, 2411-901 Leiria, Portugal
*
Author to whom correspondence should be addressed.
Metals 2018, 8(1), 32; https://doi.org/10.3390/met8010032
Submission received: 1 December 2017 / Revised: 26 December 2017 / Accepted: 1 January 2018 / Published: 5 January 2018

Abstract

:
Selective laser melting has received a great deal of attention in recent years. Nevertheless, research has been mainly focused on the technical issues and their relationship with the final microstructure and monotonic properties. Fatigue behaviour has rarely been addressed, and the emphasis has been placed on high-cycle regimes. The aim of this paper is, therefore, to study, in a systematic manner, the cyclic plastic behaviour of AISI 18Ni300 maraging steel manufactured by selective laser melting. For this purpose, low-cycle fatigue tests, under fully-reversed strain-controlled conditions, with strain amplitudes ranging from 0.3% to 1.0%, were performed. After testing, fracture surfaces were examined by scanning electron microscopy to identify the main fatigue damage mechanisms. The analysis of results showed a non-Masing material, with a slight strain-softening behaviour, and non-linear response in both the elastic and plastic regimes. In addition, this steel exhibited a very low transition life of about 35 reversals, far below the values of conventional materials with equivalent monotonic mechanical properties, which can be attributed to the combination of high strength and low ductility. The total strain energy density, irrespective of strain amplitude, revealed itself to be a quite stable parameter throughout the lifetime. Finally, the SEM analysis showed for almost all the tested samples cracks initiated from the surface and inner defects which propagated through the rest of the cross section. A ductile/brittle fracture, with a predominance of brittle fracture, was observed in the samples, owing to the presence of defects which make it easier to spread the microcracks.

Graphical Abstract

1. Introduction

Competitiveness at a global scale forces industry to develop efficient manufacturing processes and to reduce the product development cycles. Selective laser melting (SLM) is one promising technology able to meet these goals, allowing the production of complex geometries directly from three-dimensional CAD (computer aided design) models in short time frames and at low cost [1].
Selective laser melting, like other additive manufacturing processes, quickly produces physical objects layer-by-layer, transforming a three-dimensional problem into a bi-dimensional one. The technique is being increasingly used in different strategic sectors, namely automotive, aerospace, biomedical, and mould industries, among others. Its principle of operation consists of dividing the CAD model into several slices, which are successively formed via a high-power laser beam that scans over the surface of a thin powder layer previously deposited on a substrate [2]. In general, SLM products have a cast structure, high superficial roughness, microstructural heterogeneities, presence of pores, and thermal stresses, which are consequences of pronounced temperature gradients and significant cooling rates. Despite these drawbacks, several studies have suggested that their monotonic properties can be similar to those of the components manufactured using conventional processes [3].
However, a major concern regarding sintered products is the fatigue behaviour. Due to the combination of cyclic loading histories, stress concentration phenomena associated with the complex shapes, and defects and microstructural heterogeneities formed during the fabrication, they have high susceptibility to fatigue failure. Although there is extensive literature on SLM either devoted to the production of sintered objects using different metallic powders or to the influence of sintering parameters on microstructure and mechanical properties, very few studies have addressed the fatigue phenomenon [4,5,6,7,8,9,10,11,12,13,14,15]. The first studies, conducted in 2006, were focused on the fatigue behaviour of four-point bending specimens made of a laser sintered FeNiCu alloy [4]. A few years later, Leuders et al. [5] evaluated the fatigue resistance and crack growth rates in Ti-6Al-4V titanium alloys manufactured by SLM; Sehrt and Witt [6] investigated the fatigue strength of 17-4PH stainless steel samples, manufactured in horizontal and upright orientations, subjected to rotating bending; Stoffregen et al. [7] compared the fatigue resistance of SLM 17-4PH as-built and machined specimens; Croccolo et al. [8] addressed the effect of building orientation on fatigue strength in EOS maraging steel MS1 (Electro Optical Systems, Krailling/Munich, Germany) produced by direct metal laser sintering; and Spierings et al. [9] evaluated the fatigue resistance of 316L and 15-5PH stainless steel samples produced by SLM, and by conventional techniques. More recently, Kasperovich and Hausmann [10] optimised the process parameters in order to obtain improved fatigue resistance properties in Ti-6Al-4V samples produced by SLM; Santos et al. [11] examined the effect of scan speed, porosity, and microstructure on static mechanical properties, and fatigue strength of sintered AISI 18Ni300 alloy samples; Yadollahi et al. [12] tackled the influence of building orientation and heat treatment on fatigue behaviour in SLM 17-4PH stainless steel samples; Walker et al. [13] analysed the effect of building orientation and layer thickness on fatigue crack propagation in Ti-6Al-4V titanium alloys manufactured using SLM; Razavi et al. [14,15] assessed the fatigue strength of circular and blunt V-notched samples made of Ti-6Al-4V titanium produced by SLM.
The above-mentioned research has mainly been conducted under stress-controlled conditions, with focus on high-cycle fatigue regimes; systematic studies devoted to strain-controlled low-cycle fatigue are not available in the open literature. Therefore, existing information is clearly insufficient, and more work is needed to develop safe and durable sintered products, as well as adequate design criteria. Design criteria for the prevention of fatigue failure are usually established on the basis of stress-, strain-, or energy-based methods [16]. The first are traditionally used in high-cycle fatigue regimes, and relate the nominal stresses with the local fatigue strength; the other two, on the contrary, account for the localised plastic deformation and, consequently, rely on the knowledge of the cyclic properties, which are usually determined via strain-controlled fatigue tests.
This paper aims at studying the cyclic deformation behaviour of AISI 18Ni300 maraging steel manufactured by selective laser melting, as well as evaluating its cyclic mechanical properties. For this purpose, low-cycle fatigue tests are performed under fully-reversed strain-controlled conditions, with strain amplitudes lying between 0.3–1.0% in air at room temperature, using a constant strain rate. After the tests, fracture surfaces are evaluated by scanning electron microscopy (SEM) to identify the main fatigue damage micro-mechanisms. The paper is organized as follows. Section 2 gathers the main information on the experimental procedure. Section 3 starts with the analysis of microstructure and level of porosity, then addresses the cyclic deformation behaviour, the cyclic stress–strain response, and strain-life and energy-life relationships, and ends with the SEM examination of fracture surfaces. The last section presents the concluding remarks.

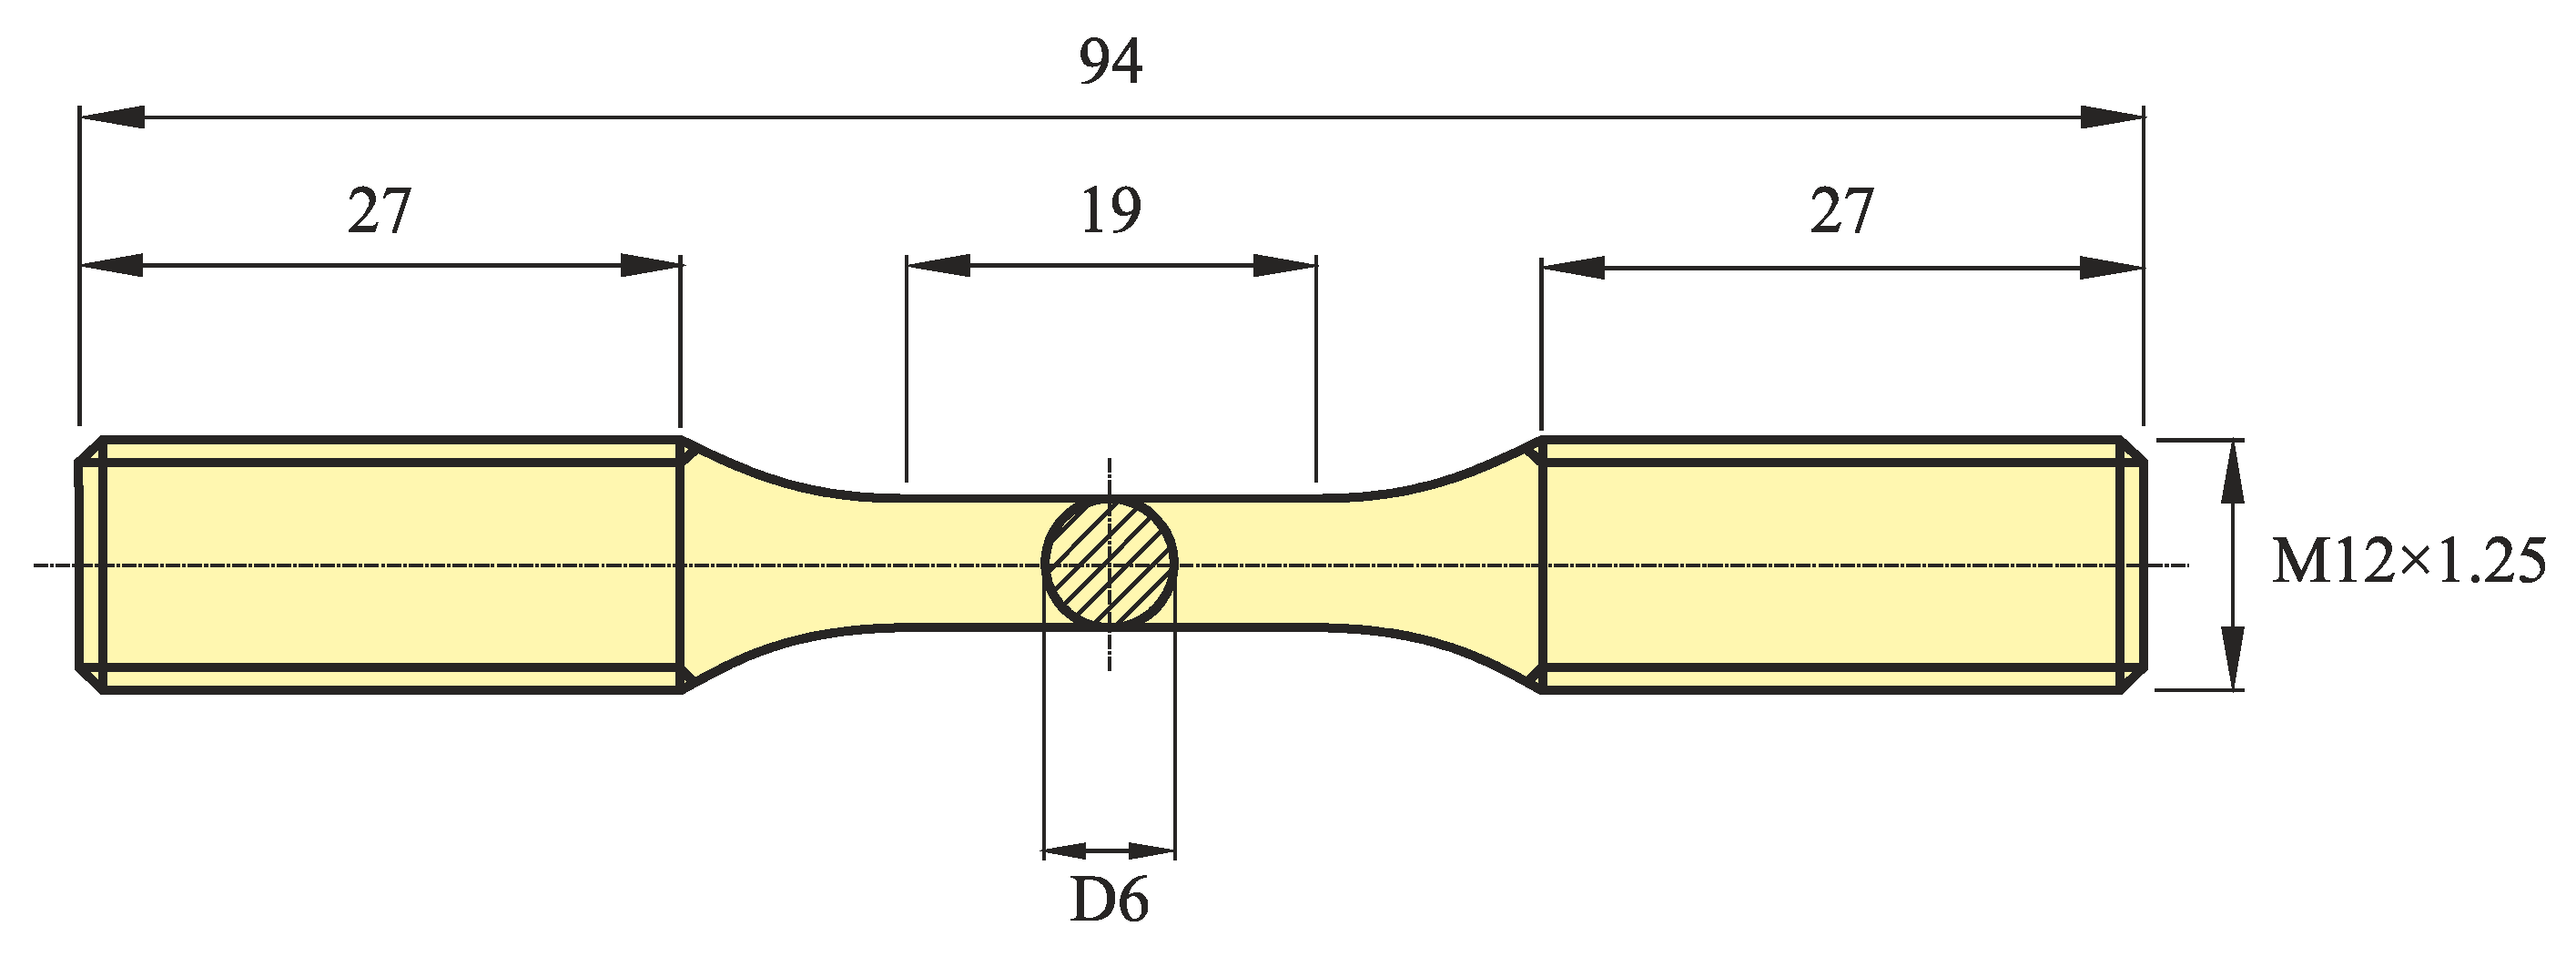
2. Experimental Procedure

The material used in this study was an AISI 18Ni300 maraging steel. Its nominal chemical composition in weight percentage, and its main mechanical properties are summarised in Table 1 and Table 2, respectively.
The specimens, schematised in Figure 1, were synthesised by Laser CUSING (Concept Laser GmbH, Lichtenfels, Germany) from a Concept Laser M3 linear printing system at a sintering scan speed of 200 mm/s. The layers were deposited vertically on a base plate in the direction of load application. After production, and before fatigue testing, surfaces were mechanically polished to a scratch-free condition.
Low-cycle fatigue tests were performed according to the recommendations of ASTM E606 in a 100 kN closed-loop servo-hydraulic testing machine (Zwick, Hereford, UK), under fully-reversed strain-controlled conditions (Rε = −1), with sinusoidal waveforms, and a constant strain rate (/dt) of 8 × 10⁻³ s−1. The strain amplitudes, as indicated in Table 3, lied in the range 0.3–1.0%.
The stress–strain response was acquired from a 12.5 mm-long gauge extensometer (model Instron 2620-601, Instron, Norwood, MA, USA), clamped directly to the gauge section of the specimen via two separated knife-edges, and connected to a digital data acquisition system. Each specimen was subjected to a constant strain amplitude until failure occurs. Tests were interrupted when specimens separated into two pieces.
Fracture surfaces were observed by scanning electron microscopy (Quanta FEG 450, Trondheim, Norway) to identify the main fatigue damage mechanisms. Samples were sectioned perpendicularly to the longitudinal axis of the specimen, and ultrasonically cleaned in trichloroethylene solution for ten minutes.
The material, in the as-received condition, following the recommendations outlined in ASTM E407-99, was examined by optical microscopy (Zeiss Axiotech 100HD microscope, Zeiss, Jena, Germany) to characterise the microstructure, and the level of porosity. Samples were etched with Picral, i.e., picric acid solution (4%) in ethyl alcohol, for 2 min.

3. Results and Discussion

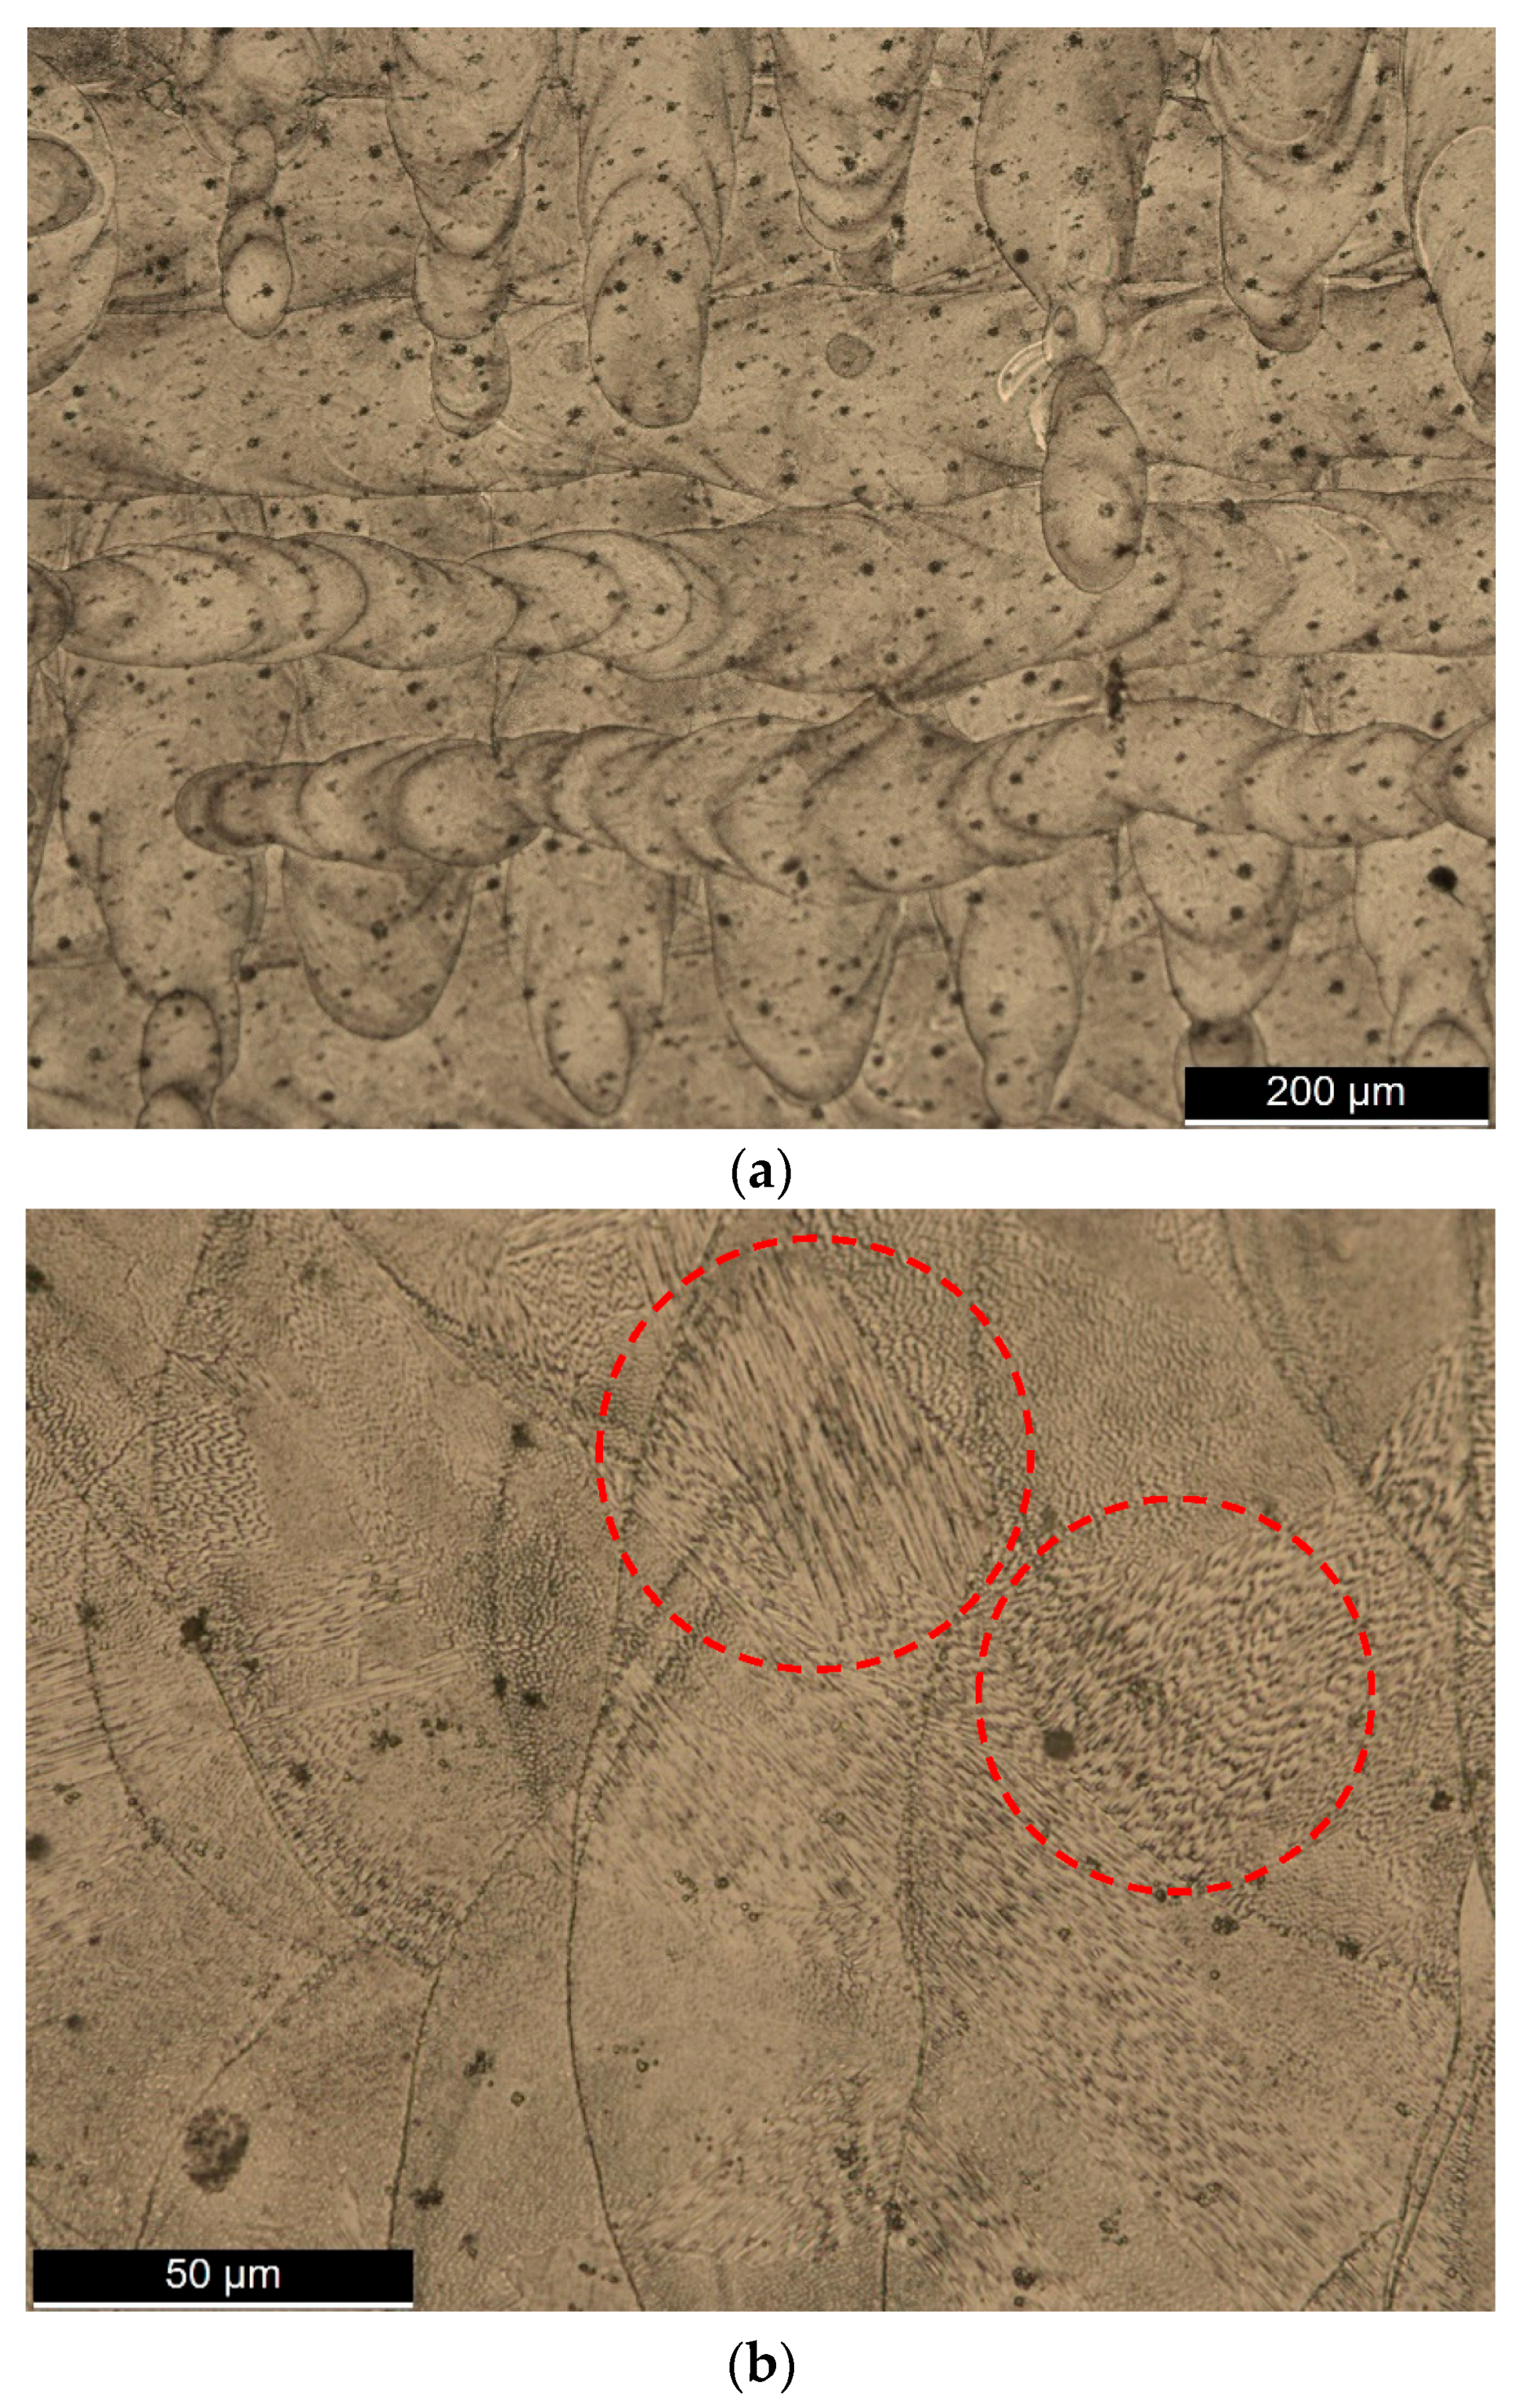
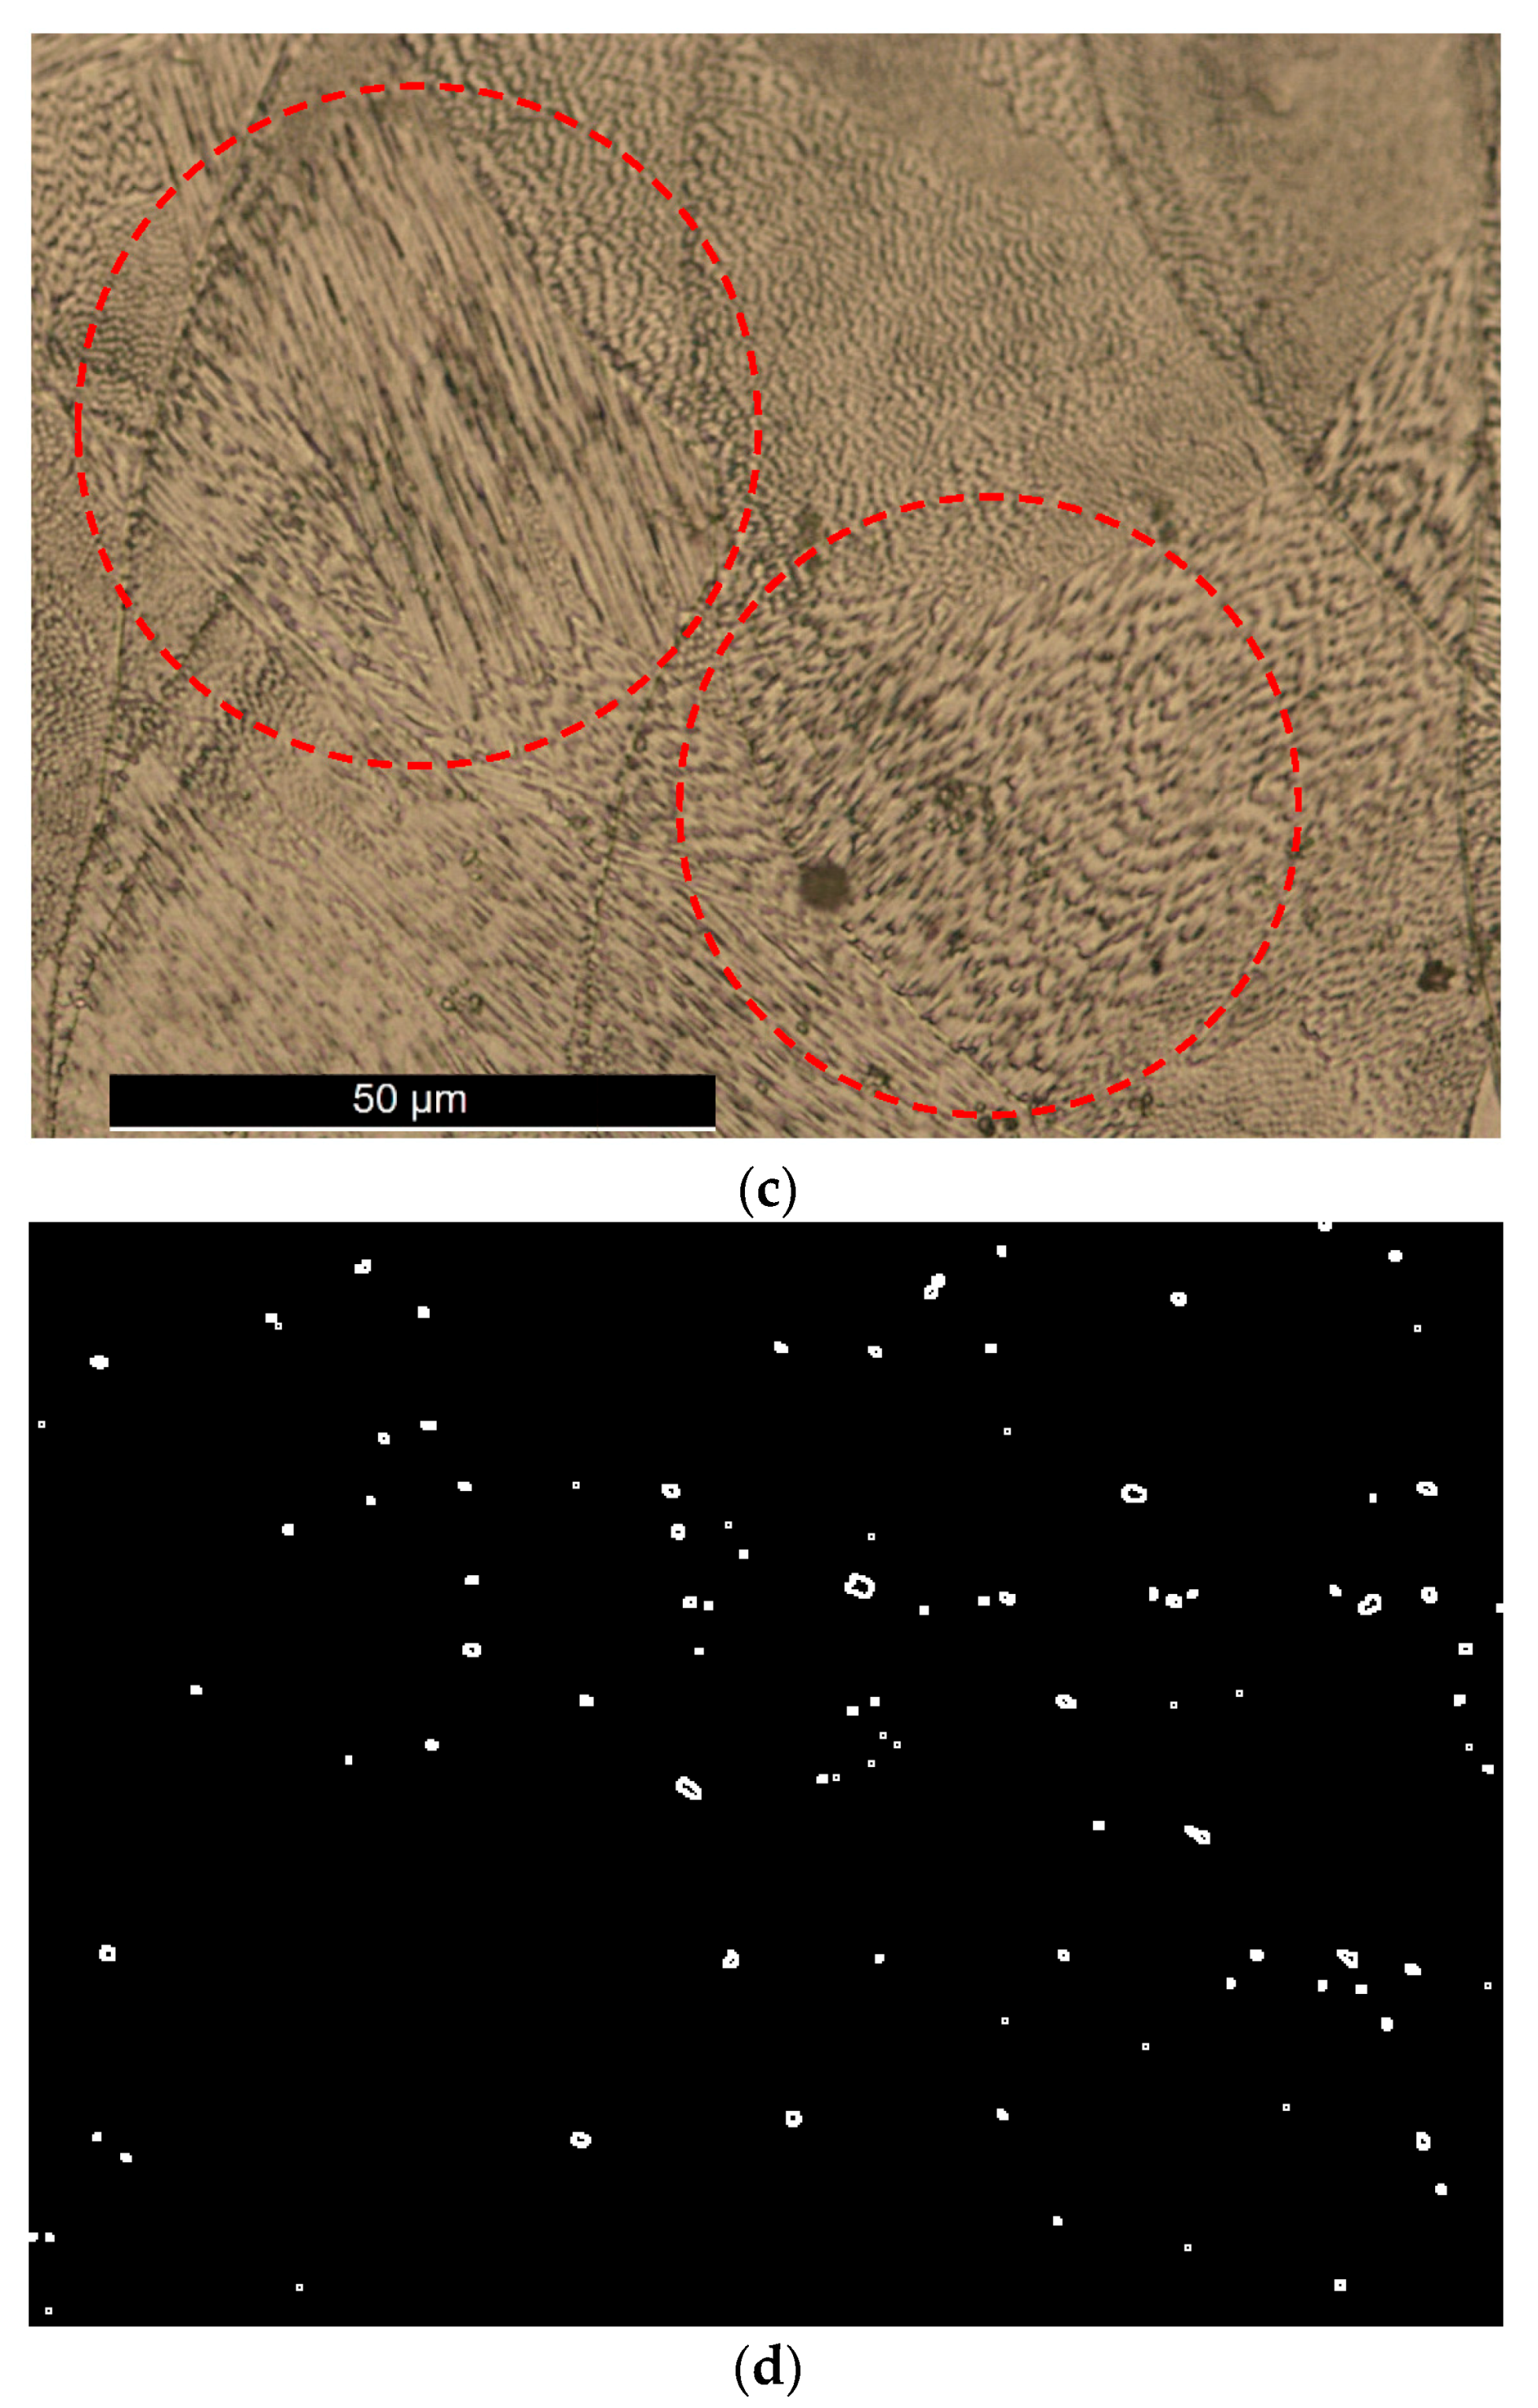
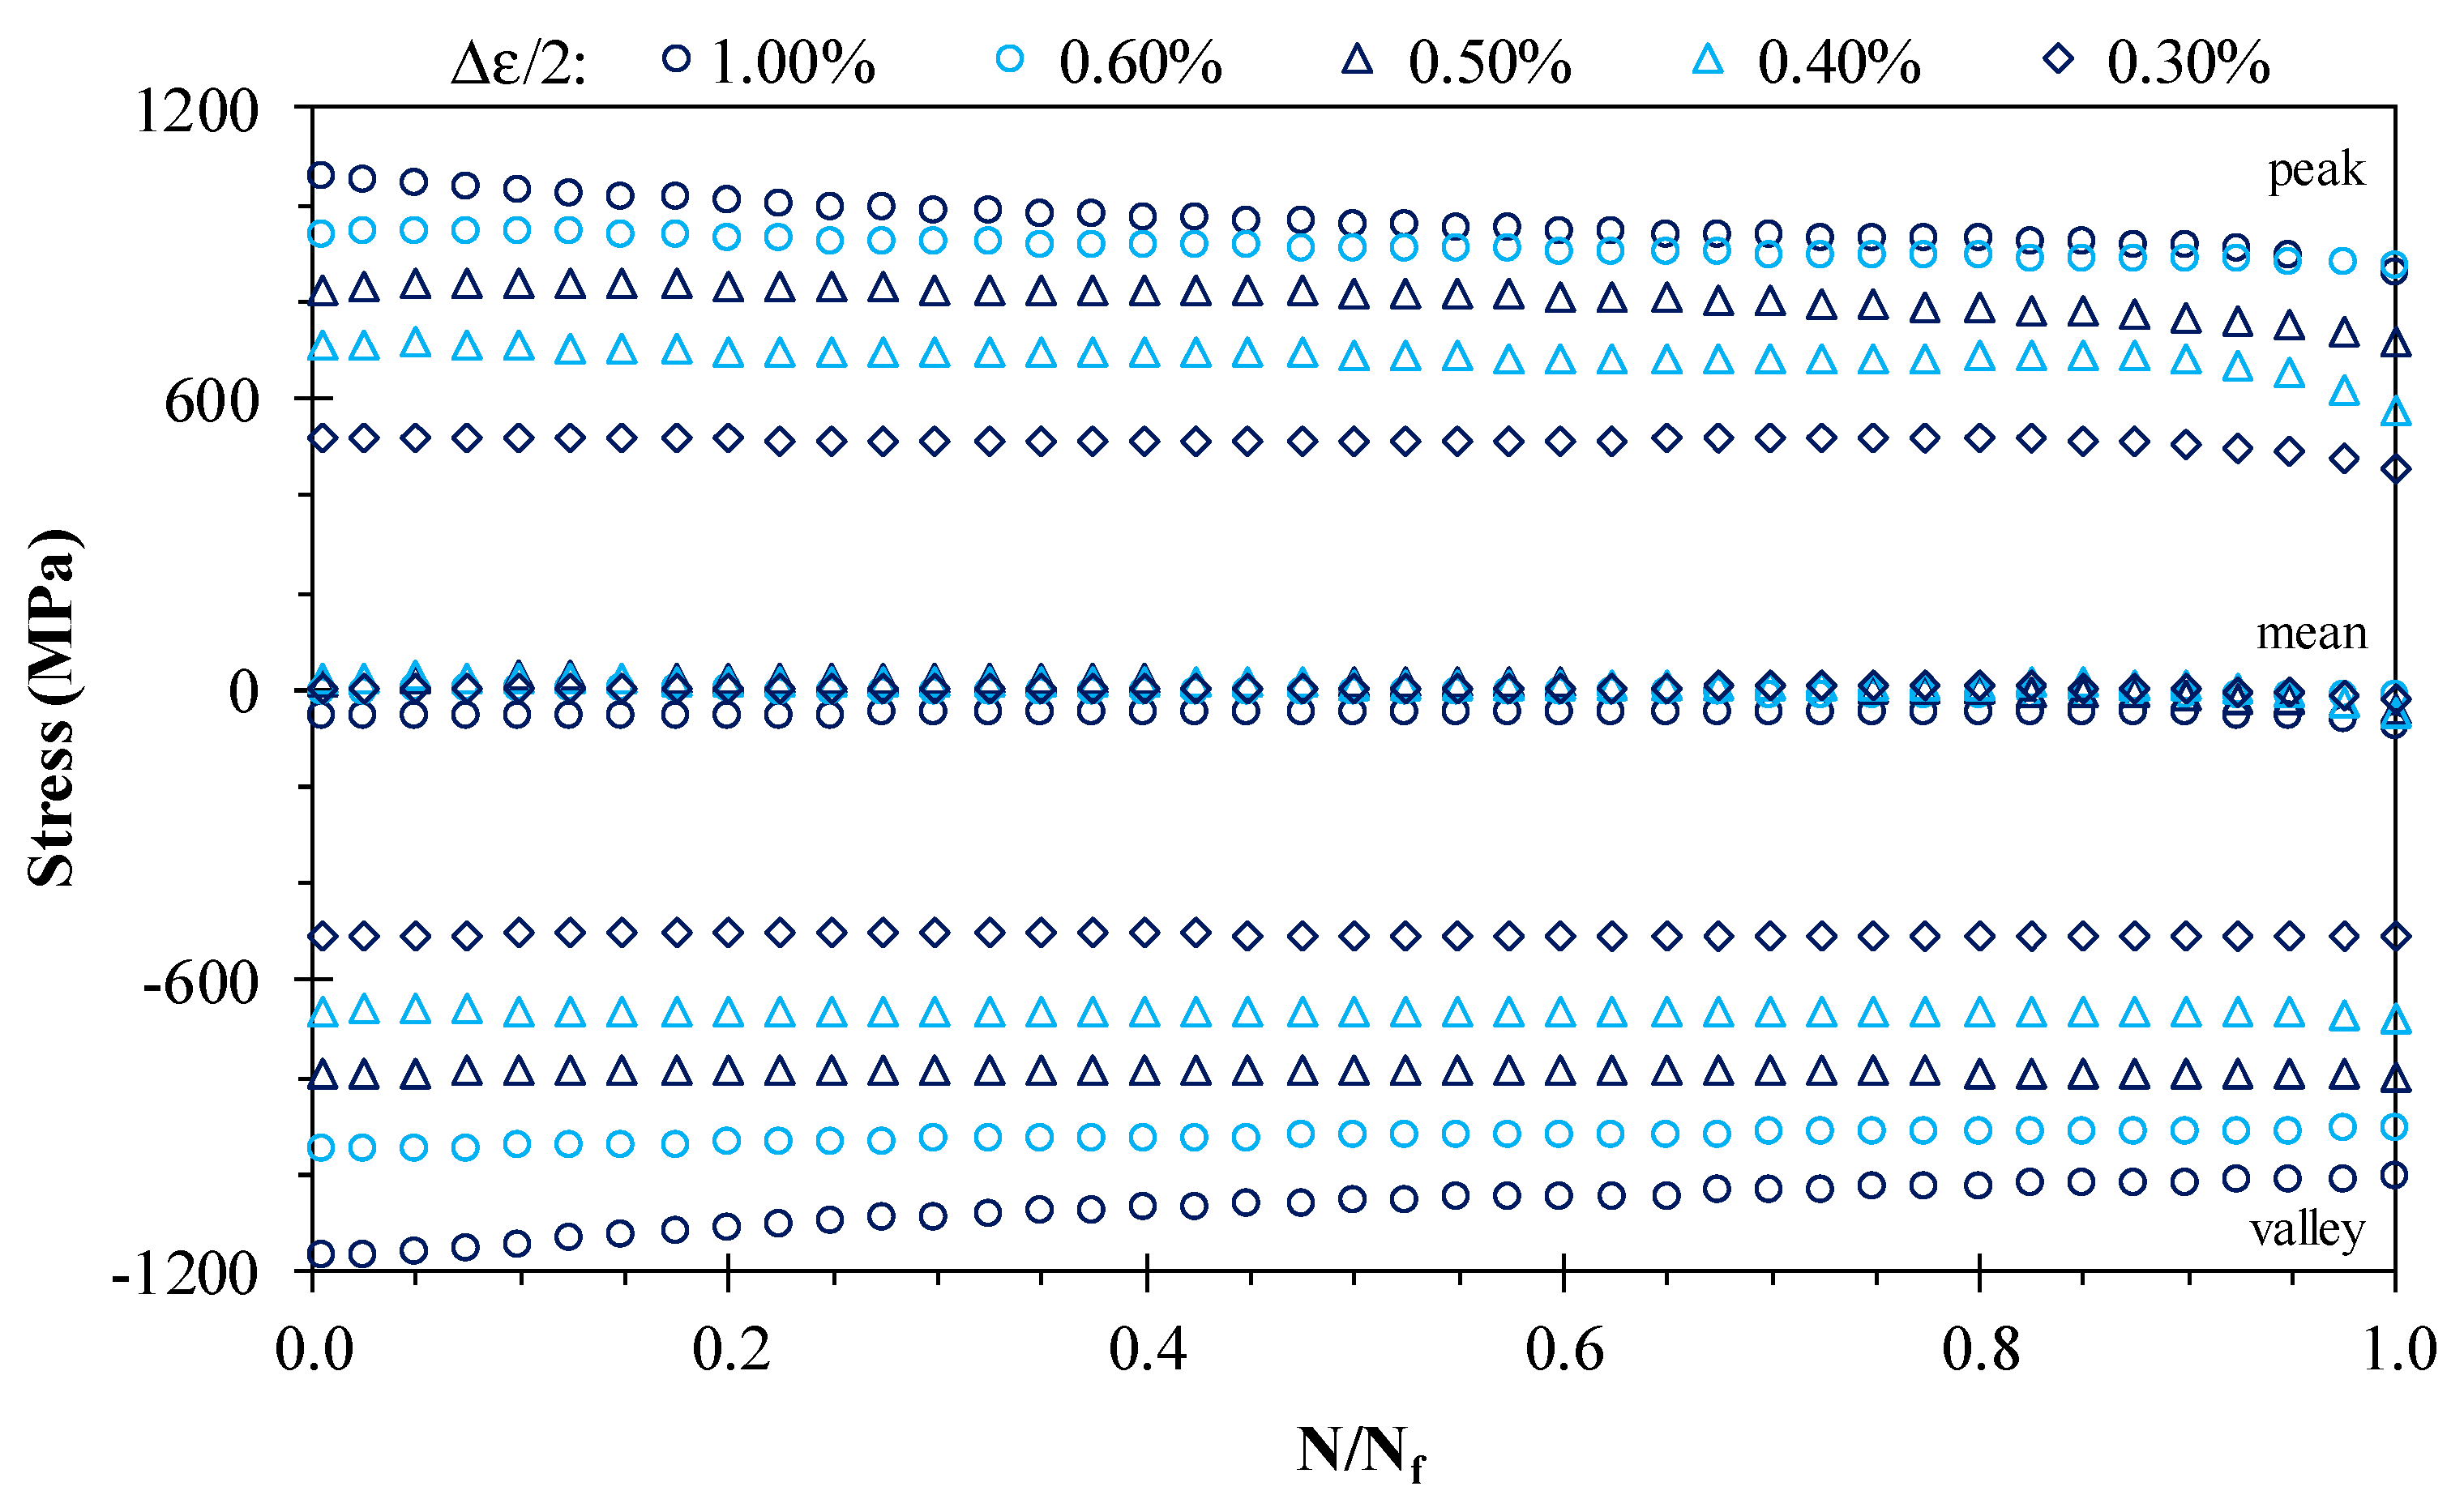
3.1. Microstructure and Porosity

The metallography in the longitudinal section of the sample, for different degrees of magnification, is exhibited in Figure 2. The microstructure is rather coherent and is essentially formed by elongated grains with about 150 μm long and 30–35 μm width. It is also possible to observe a considerable level of small porosities, as well as the formation of martensitic needles identified by the red circles in Figure 2b,c. The percentage of porosity, quantified via the Image J software (version 1.6.0, National Institutes of Health, Bethesda, MD, USA), was about 0.74 ± 0.09%. The modus operandi consisted of analysing contrast images (see Figure 2d) between the pores and the base material, obtained from the optical micrographs, and calculating the areas of each of those regions [9].

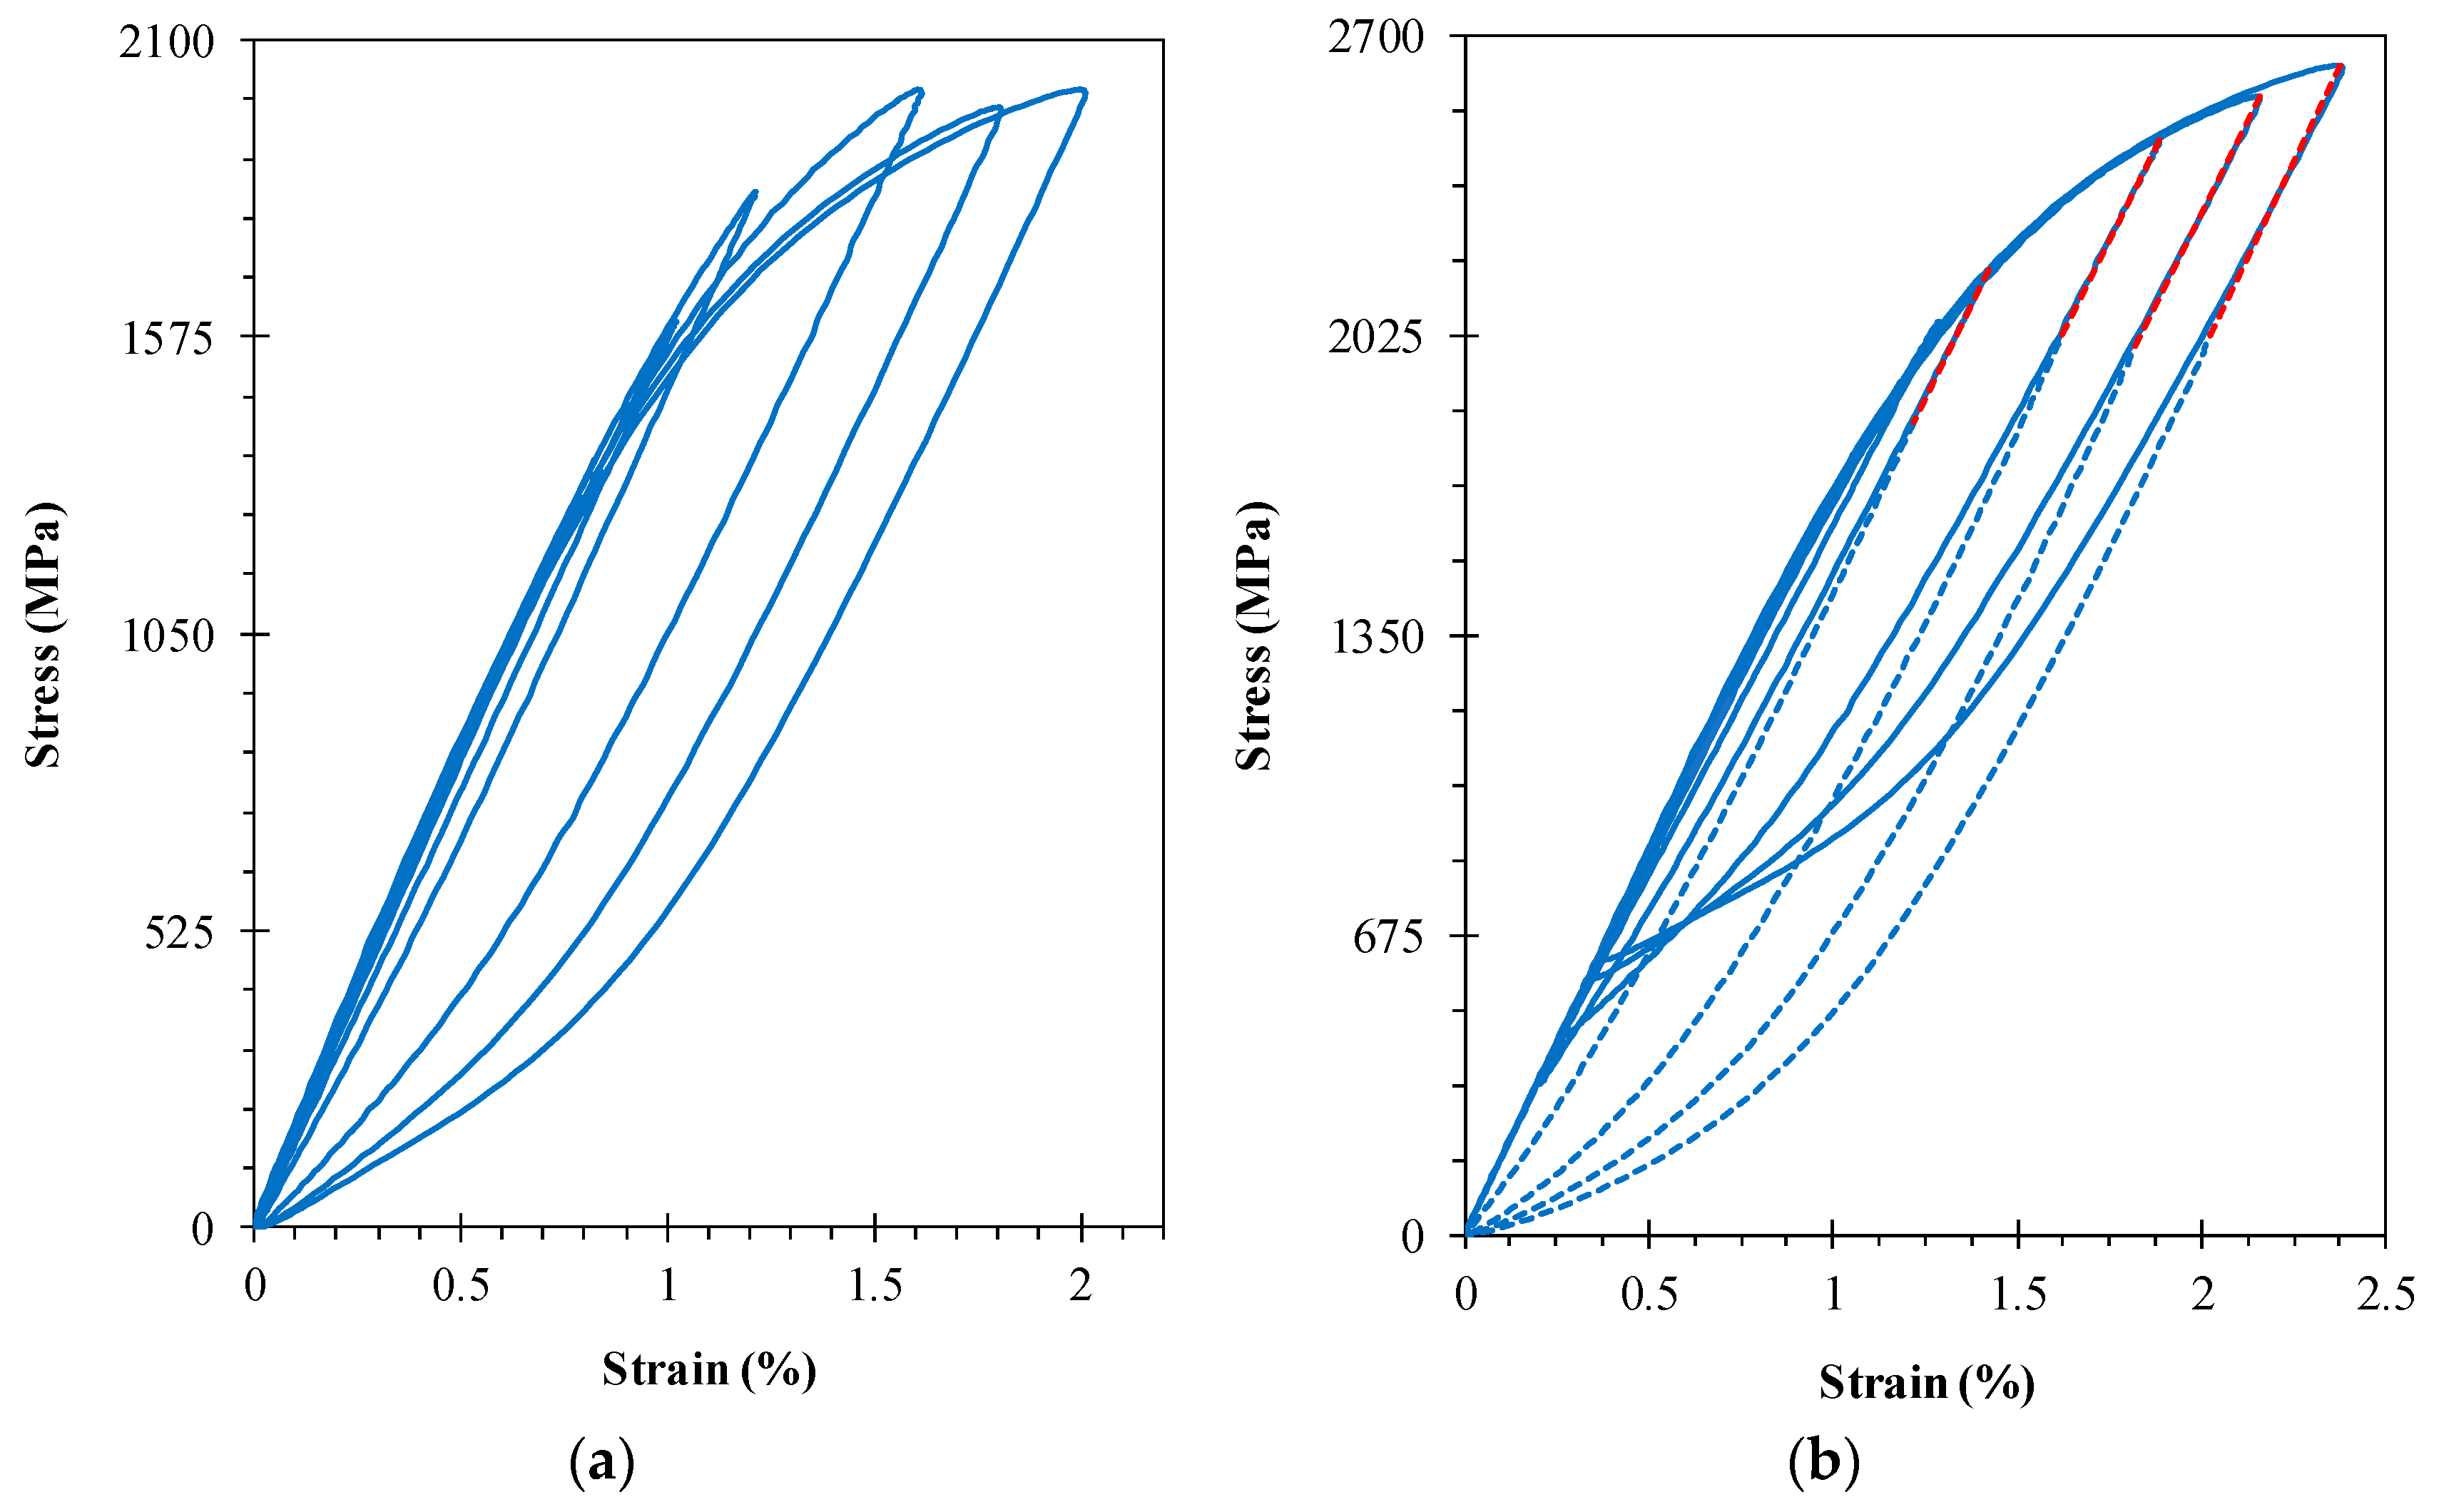
3.2. Cyclic Deformation Behaviour

Figure 3 presents the variations of peak, valley, and mean stresses with the life ratio at various strain amplitude levels, during the low-cycle fatigue tests. The peak stresses increase in a very short initial stage, only observable in the first 2–3 cycles; in a second stage, up to about 90% of life ratio, there is a continuous reduction of peak stresses at higher strain amplitudes, and a well-defined stable response at lower strain amplitudes; the third stage, for life ratios higher than 90%, shows an evident drop in peak stresses, irrespective of the applied strain amplitudes. The evolution of the valley stresses, as a function of the strain amplitudes, is also distinct: i.e., at higher strain amplitudes, the valley stresses progressively increase with the life ratio, while at lower strain amplitudes the valley stresses remained essentially constant. Regarding the mean stress, it slightly decreases with the number cycles throughout the entire test, regardless of the strain amplitude. In addition, higher strain amplitudes result in lower mean stresses.
The plastic strain energy density per cycle, accounted for as the area of the hysteresis loop, at various strain amplitudes is presented in Figure 4a. Figure 4b shows the total strain energy density per cycle, defined as the sum of the plastic and the tensile elastic strain energy density components. Overall, as can be seen from the figures, these parameters are quite stable over the course of its life. Initially, there is a slight softening region, more expressive at higher strain amplitudes, of about 10% of the total number of cycles followed by a saturated stage up to 90% of fatigue life, and a third region with small perturbations culminating in fatigue failure. The behaviour observed agrees with the empirical rule proposed by Smith et al. [17] which states that metals with the tensile strength to yield strength ratios lower than 1.2 cyclically soften.

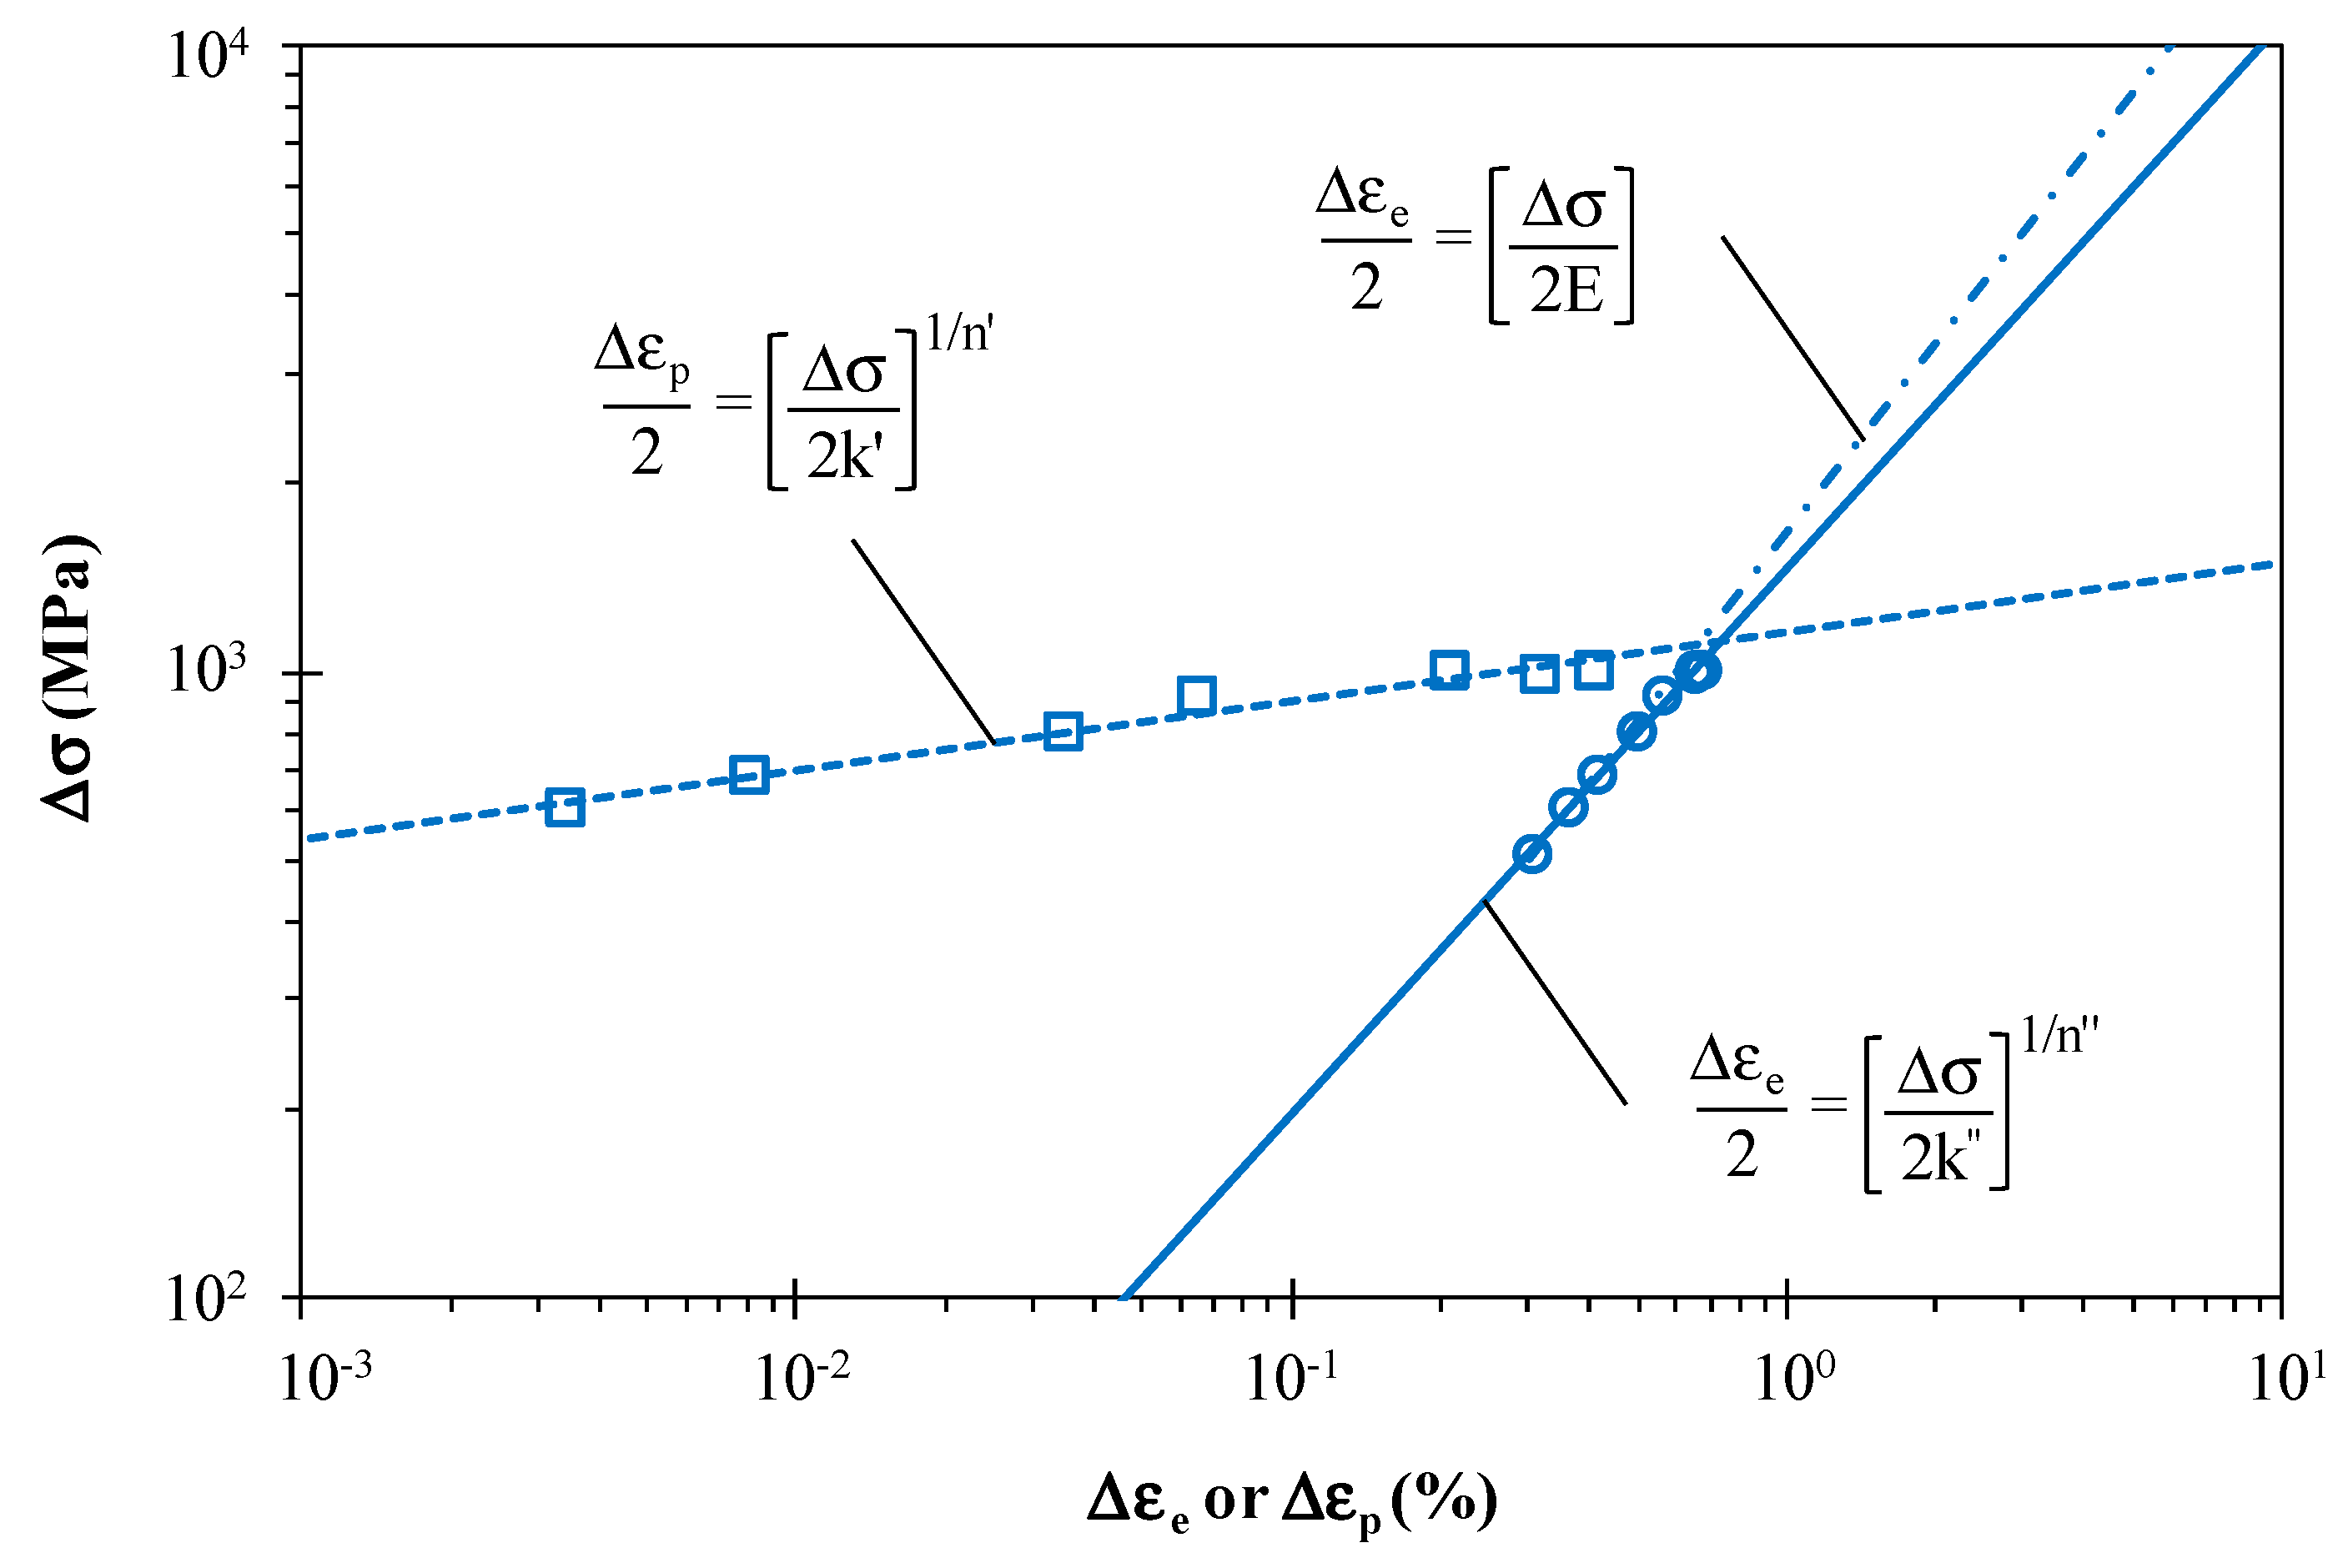
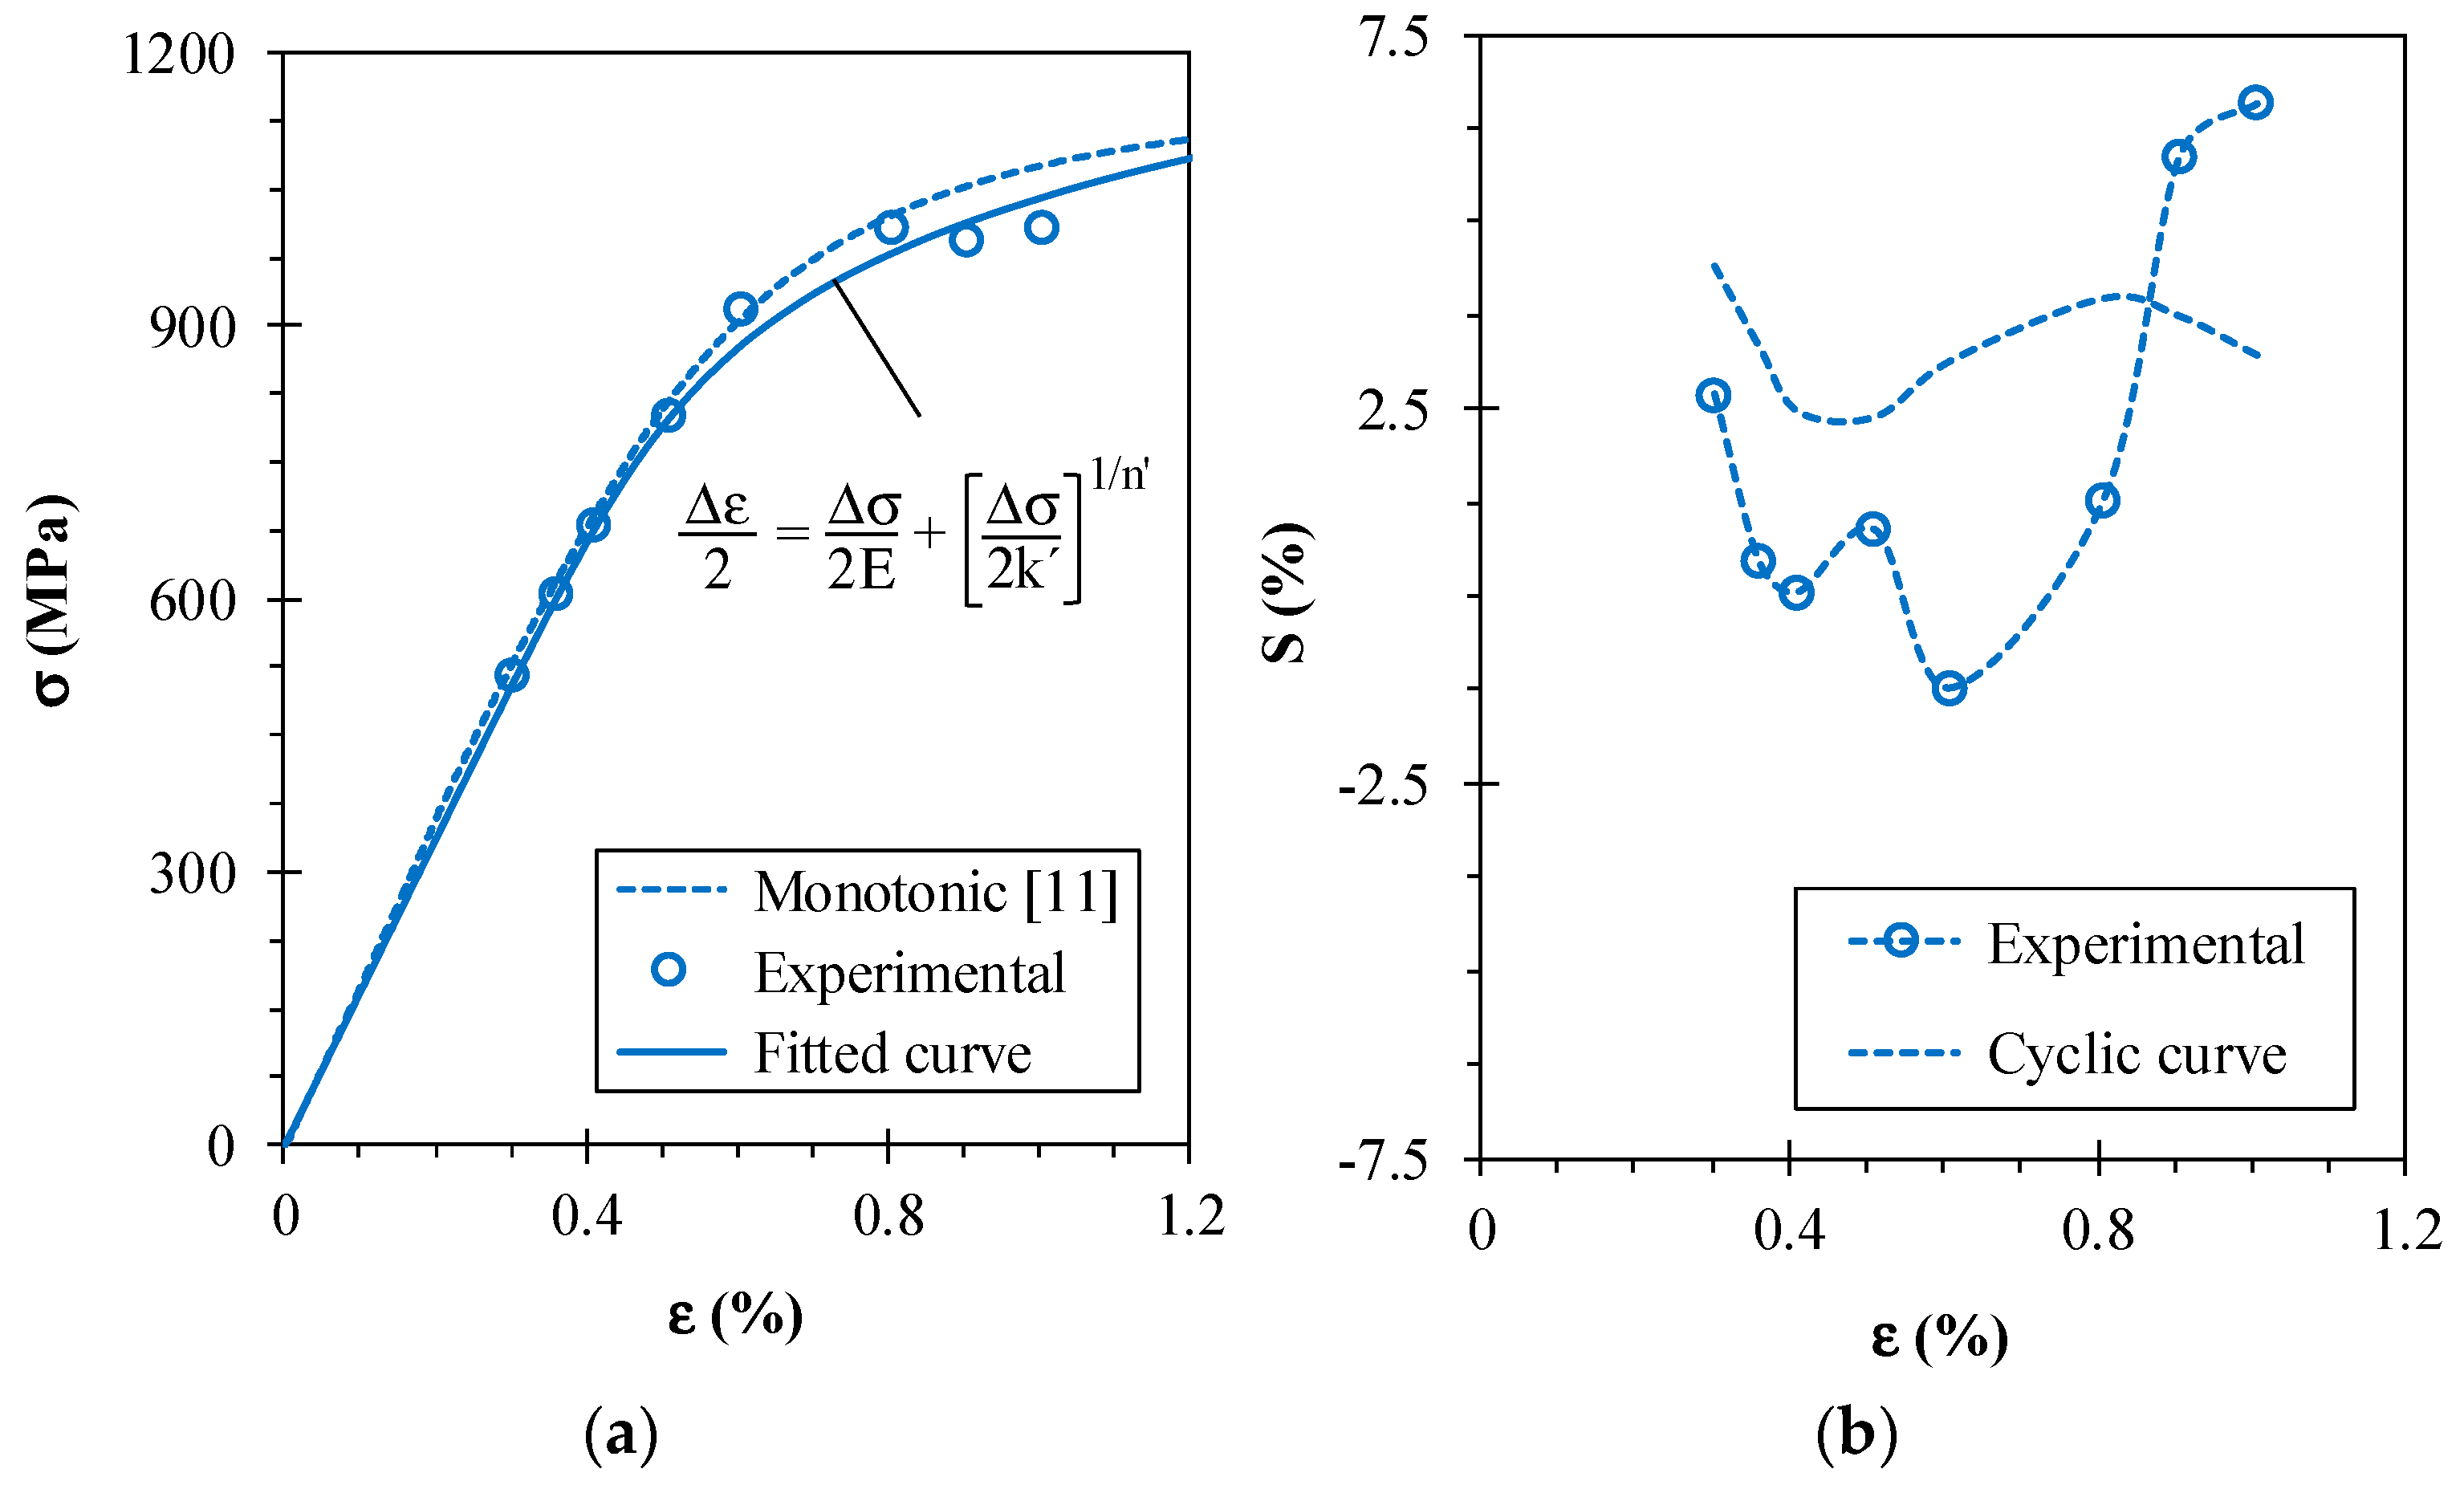
3.3. Cyclic Stress–Strain Response

The cyclic stress–strain response of the AISI 18Ni300 steel, relying on the fact that the saturated regime is achieved in the early stage of the tests, was studied via the data collected from the hysteresis loops at the half-life. Table 3 summarises the stress and strain amplitudes, as well as the plastic and the total strain energy densities experimentally measured from the selected circuits. Figure 5a displays the saturated cycles, in relative coordinates, with the lower tips tied together. Since the upper branches at different strain amplitudes do not follow a unique curve, the material does not exhibit Masing-type behaviour, being therefore a non-Masing material. The non-Masing effect is associated with the changes in the linear region of the stable circuits. This is clearly visible in Figure 5b, which shows the stable circuits, in relative coordinates, with the upper branches overlapped. In fact, regardless of the strain amplitude, there is a significant reduction of the linear region. This is usually associated with the formation of dislocation cells [18]. The dashed lines, plotted only for the four higher strain amplitudes, allow inferring the closeness of the stable circuits in relation to perfect Masing-type loops. As can be seen, the differences in the areas is appreciable, and the conversion of such circuits into Masing-type ones would require the increments of linear response represented by the dashed red lines. For the cases represented, i.e., strain amplitudes higher than 0.50%, the areas of the stable circuits area about 40–45% of the ideal ones.
Figure 6 exhibits the relationship between the cyclic stress amplitude and the plastic strain amplitude. As first suggested by Morrow [19], this relationship can be described by a power-law:
Δ σ 2 =   k ( Δ ε p 2 ) n
where k′ is the cyclic hardening coefficient, and n′ is the cyclic hardening exponent. Both constants were determined by linear regression, using the least square method, with a correlation coefficient equal to 0.982, and are given in Table 4.
The slopes of the curves of the hysteresis loops at the start of the loading cycle and immediately after the load reversal are assumed to be equal. Nevertheless, for cyclic loading, this is not entirely true. The effective elastic unloading modulus (E), defined as the slope of the linear portion of the stable hysteresis loop after strain reversal, is affected by the cyclic properties of the material. Figure 6 plots the cyclic stress amplitude against the elastic strain amplitude using the unloading moduli measured in the tests (dash-dotted line). The relation between these two variables, as already demonstrated in the literature [20,21,22], can be defined from a power law relationship similar to that of Equation (1). The coefficients, obtained using a best fitting technique with a correlation factor of 0.998, are listed in Table 4. For comparison purposes, a linear relationship determined with the value of E is also displayed. Therefore, not surprisingly, there is a clear variation of the unloading modulus with the strain amplitude, which denotes nonlinear behaviour not only in the plastic regime, but also in the plastic regime.
Figure 7a presents the cyclic stress–strain curve, written in the form:
Δ ε 2 = Δ σ 2 E +   ( Δ σ 2 k ) 1 / n
where k′ and n′ are, respectively, the cyclic hardening coefficient and exponent (see Table 4). In most of the cases investigated, this alloy exhibits a softening behaviour once the experimental points are below the monotonic curve. The degree of softening (S) is relatively small in the entire range and was estimated by the difference between the stress amplitudes of the first and the mid-life cycles. The outcome of this analysis is shown in Figure 7b. The values of S are relatively small in the entire range. Initially, the amount of softening decreases progressively for strain amplitudes in the interval 0.3–0.4%, except for Δε/2 = 0.5%, and then it increases rapidly to the maximum value, followed by a new reduction. The same calculations performed on the basis of the stress amplitudes of the cyclic stress–strain curve, instead of the stable circuits, are represented by the dashed line. On average, the results are similar, and the variations with the strain amplitude in a qualitative analysis are identical.

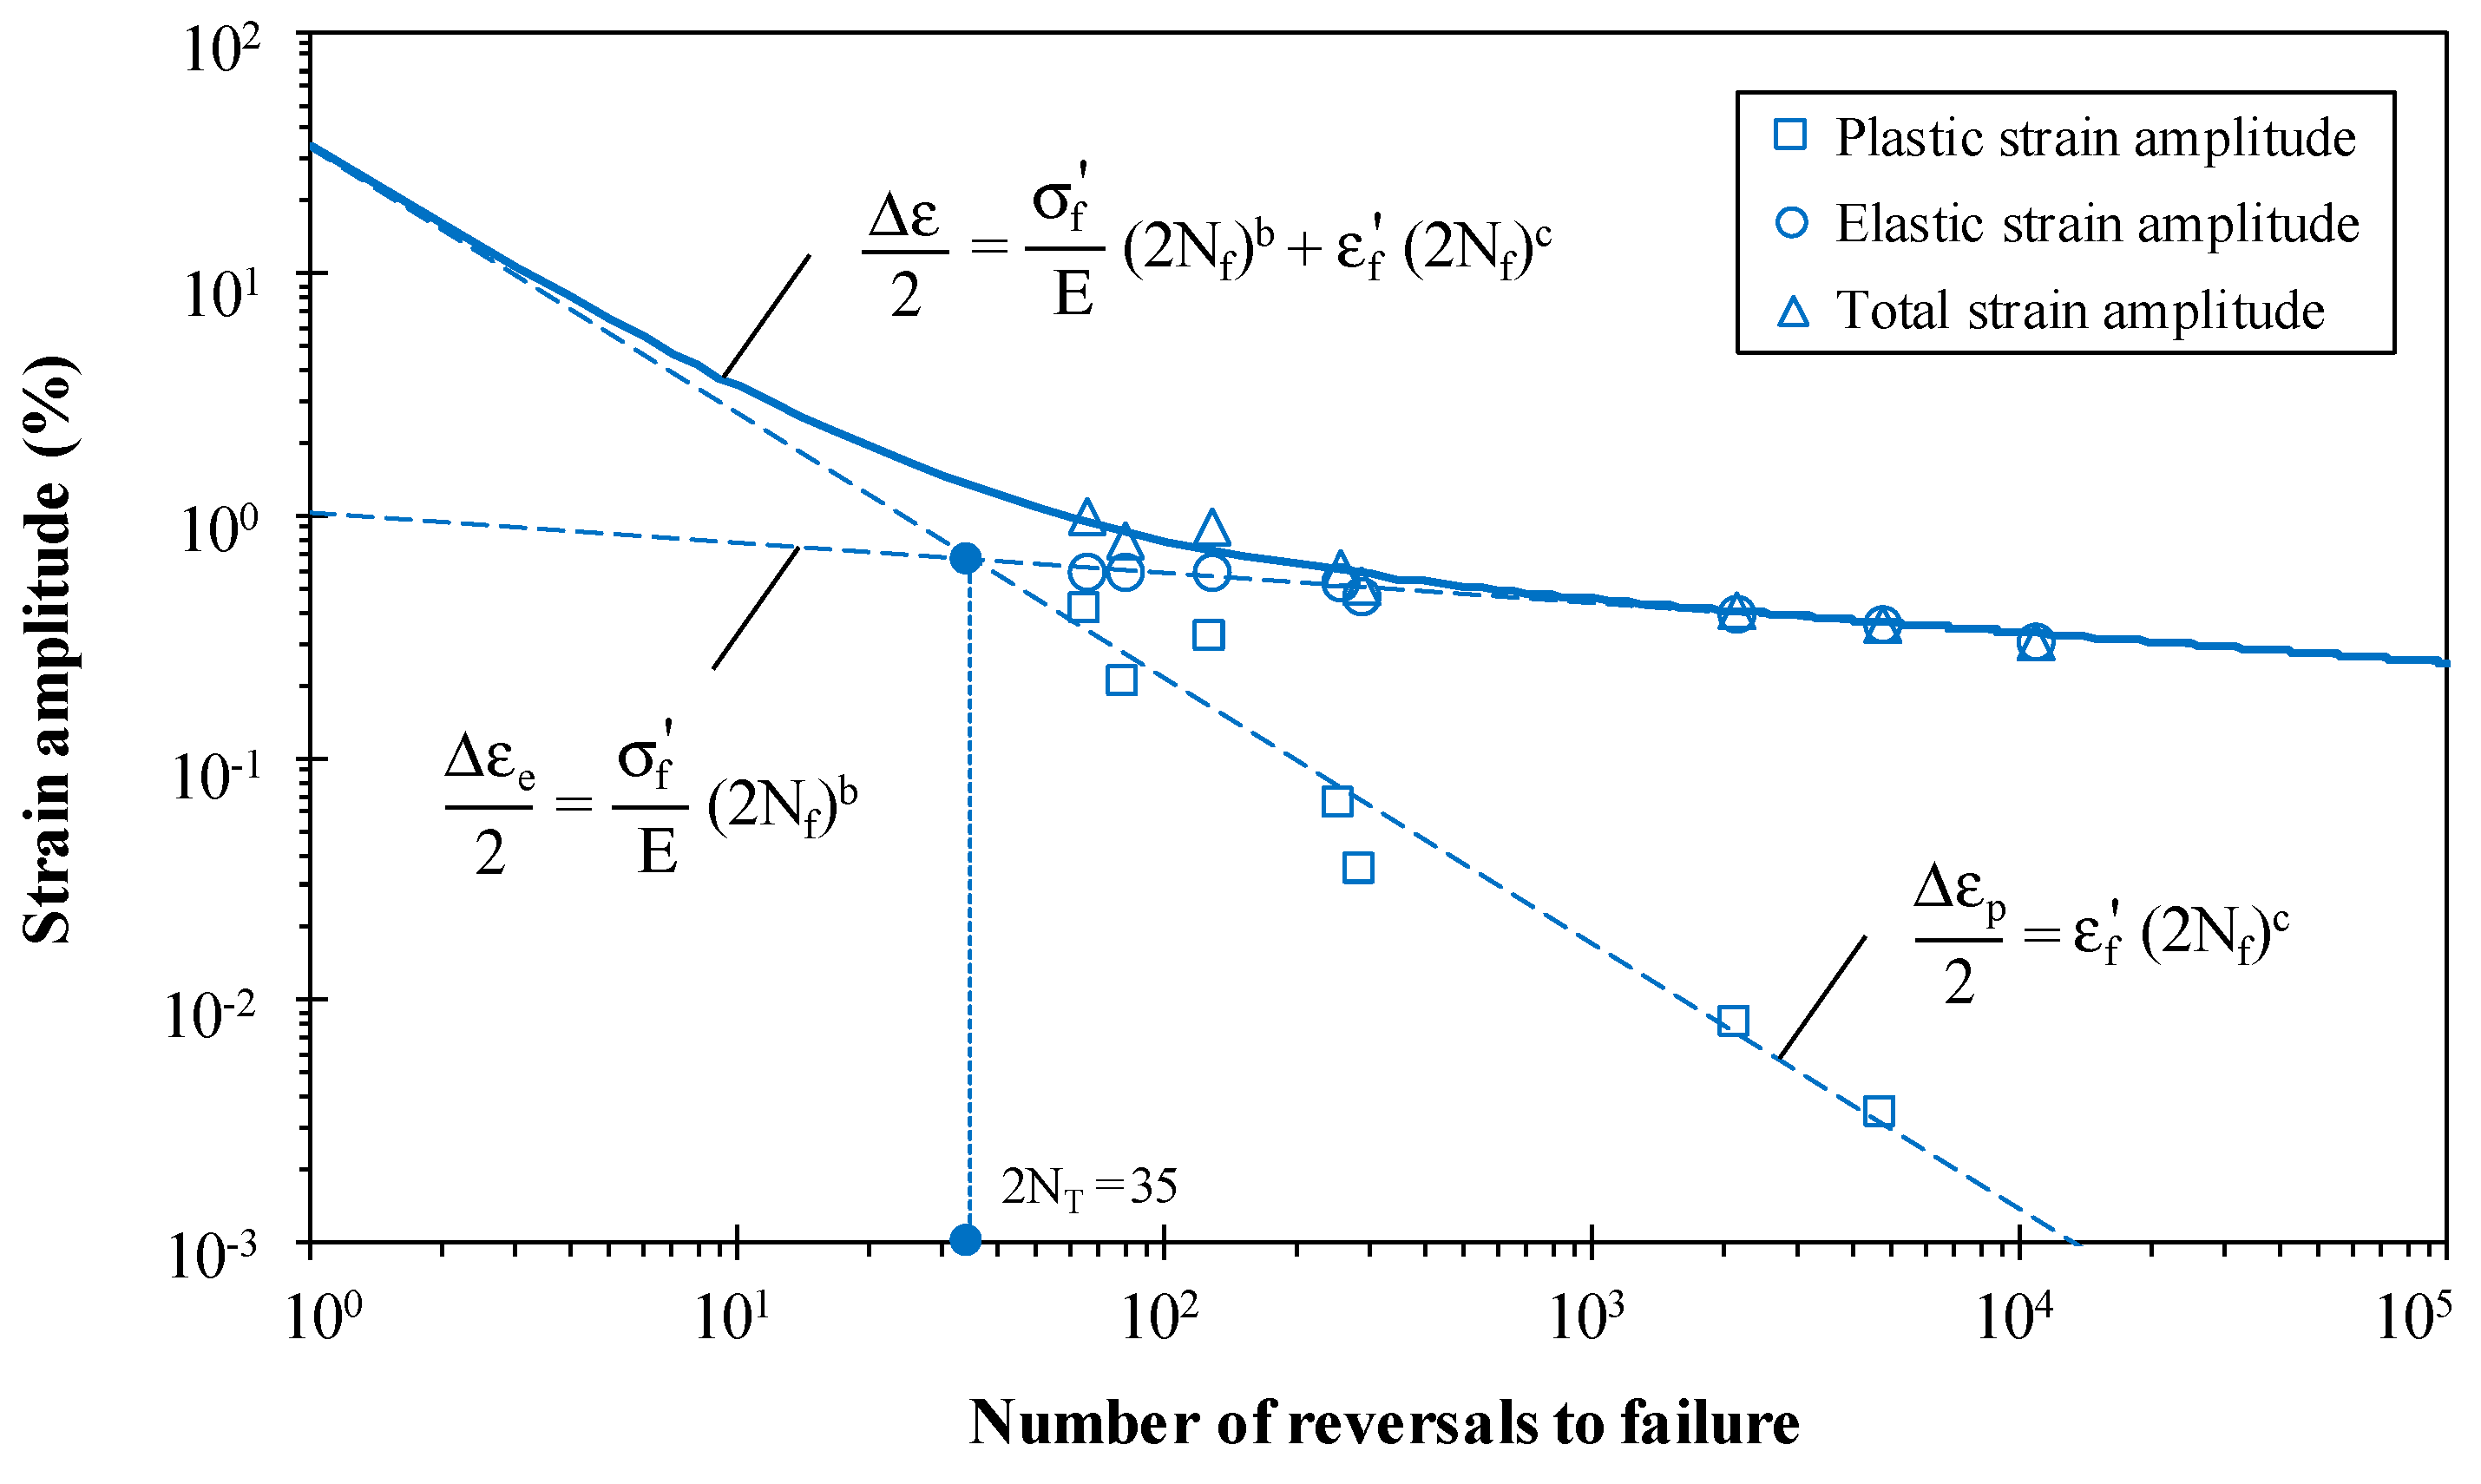
3.4. Strain–Life Relationship

The variation of elastic, plastic, and total strain amplitudes with the number of reversals to failure is shown in Figure 8. Based on the well-known Basquin and Coffin–Manson formulations, the fatigue mid-life and the total strain can be related as follow:
Δ ε 2 = Δ ε e 2 + Δ ε p 2 Δ ε 2 = σ f E   ( 2 N f )   b + ε f   ( 2 N f )   c
where σf′ is the fatigue strength coefficient, b is the fatigue strength exponent, εf′ is the fatigue ductility coefficient, and c is the fatigue ductility coefficient. The unknowns, evaluated by linear regression using the least square method, are listed in Table 5. Very satisfactory correlation factors were found for the Basquin (r = 0.975) and the Coffin–Manson (r = 0.981) relationships. The low transition life, only 35 reversals, is far below the typical values of conventional materials with equivalent monotonic mechanical properties. This results from the combination of high strength and low ductility. For example, this value is two orders of magnitude below the transition life of the DIN 34CrNiMo6 [23] high strength steel (2NT = 3038) which has a tensile strength slightly slower (σUTS = 1035 MPa) than the AISI 18NI300 (σUTS = 1147 MPa).

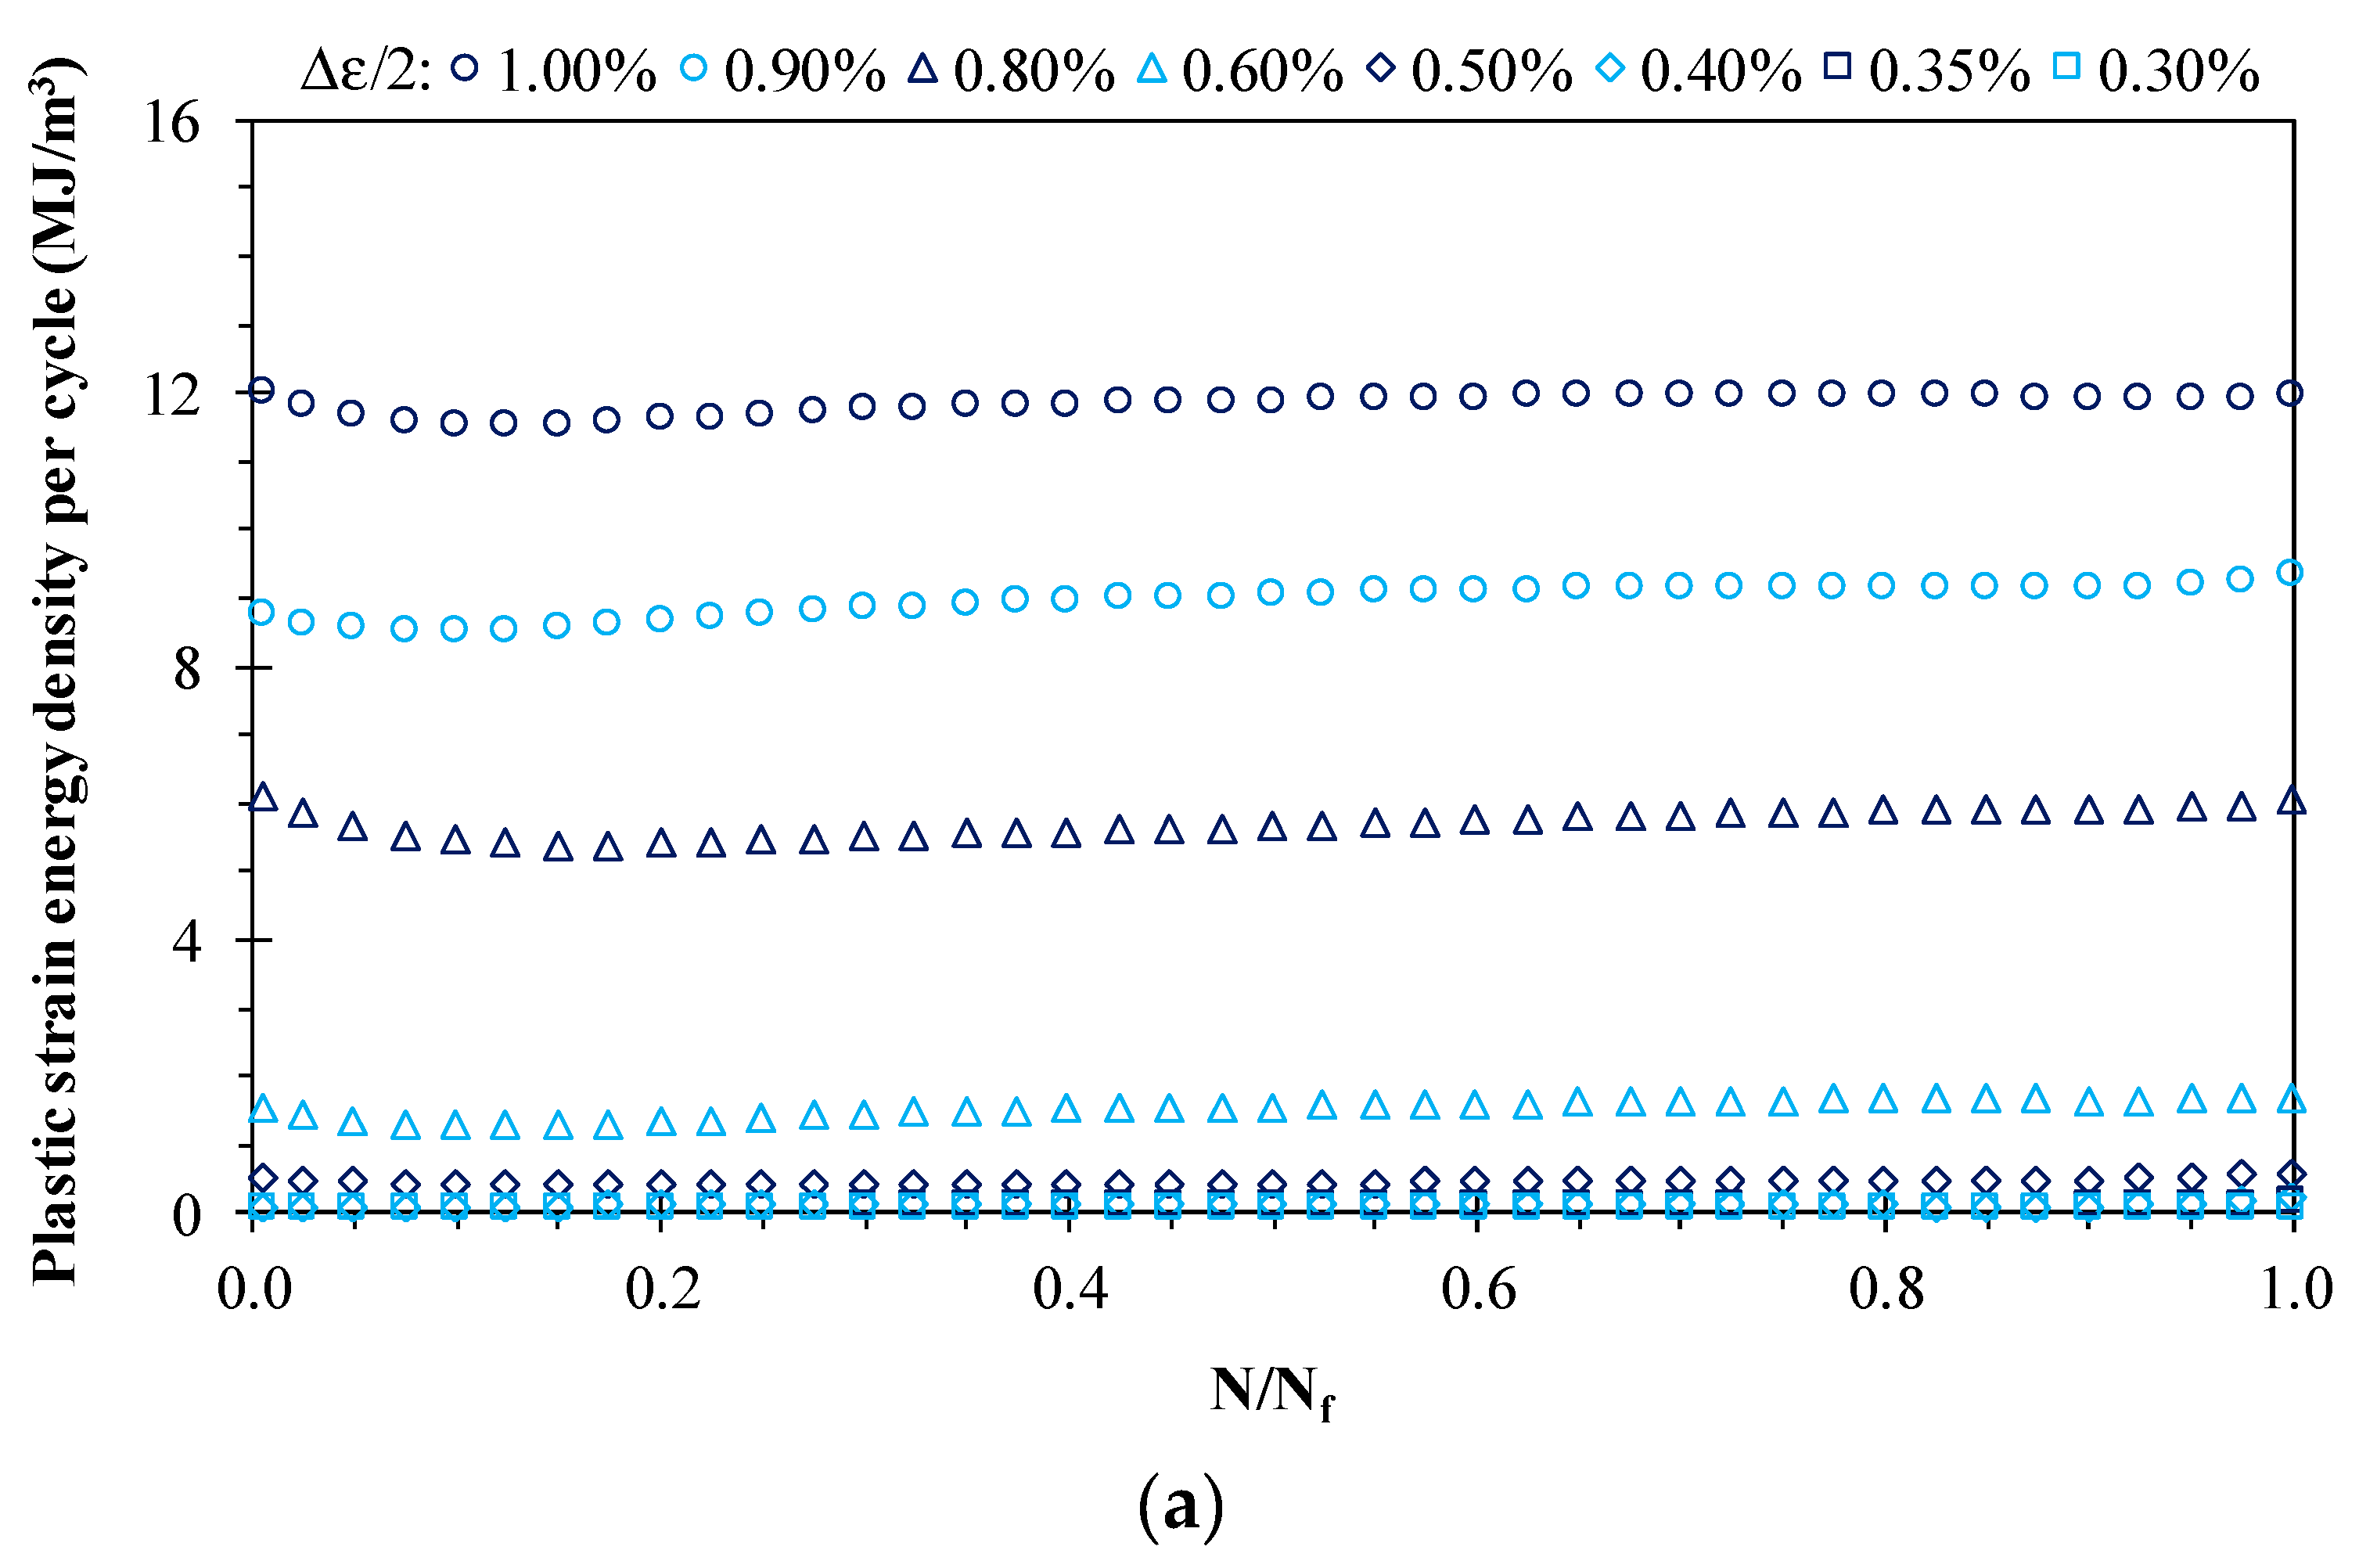
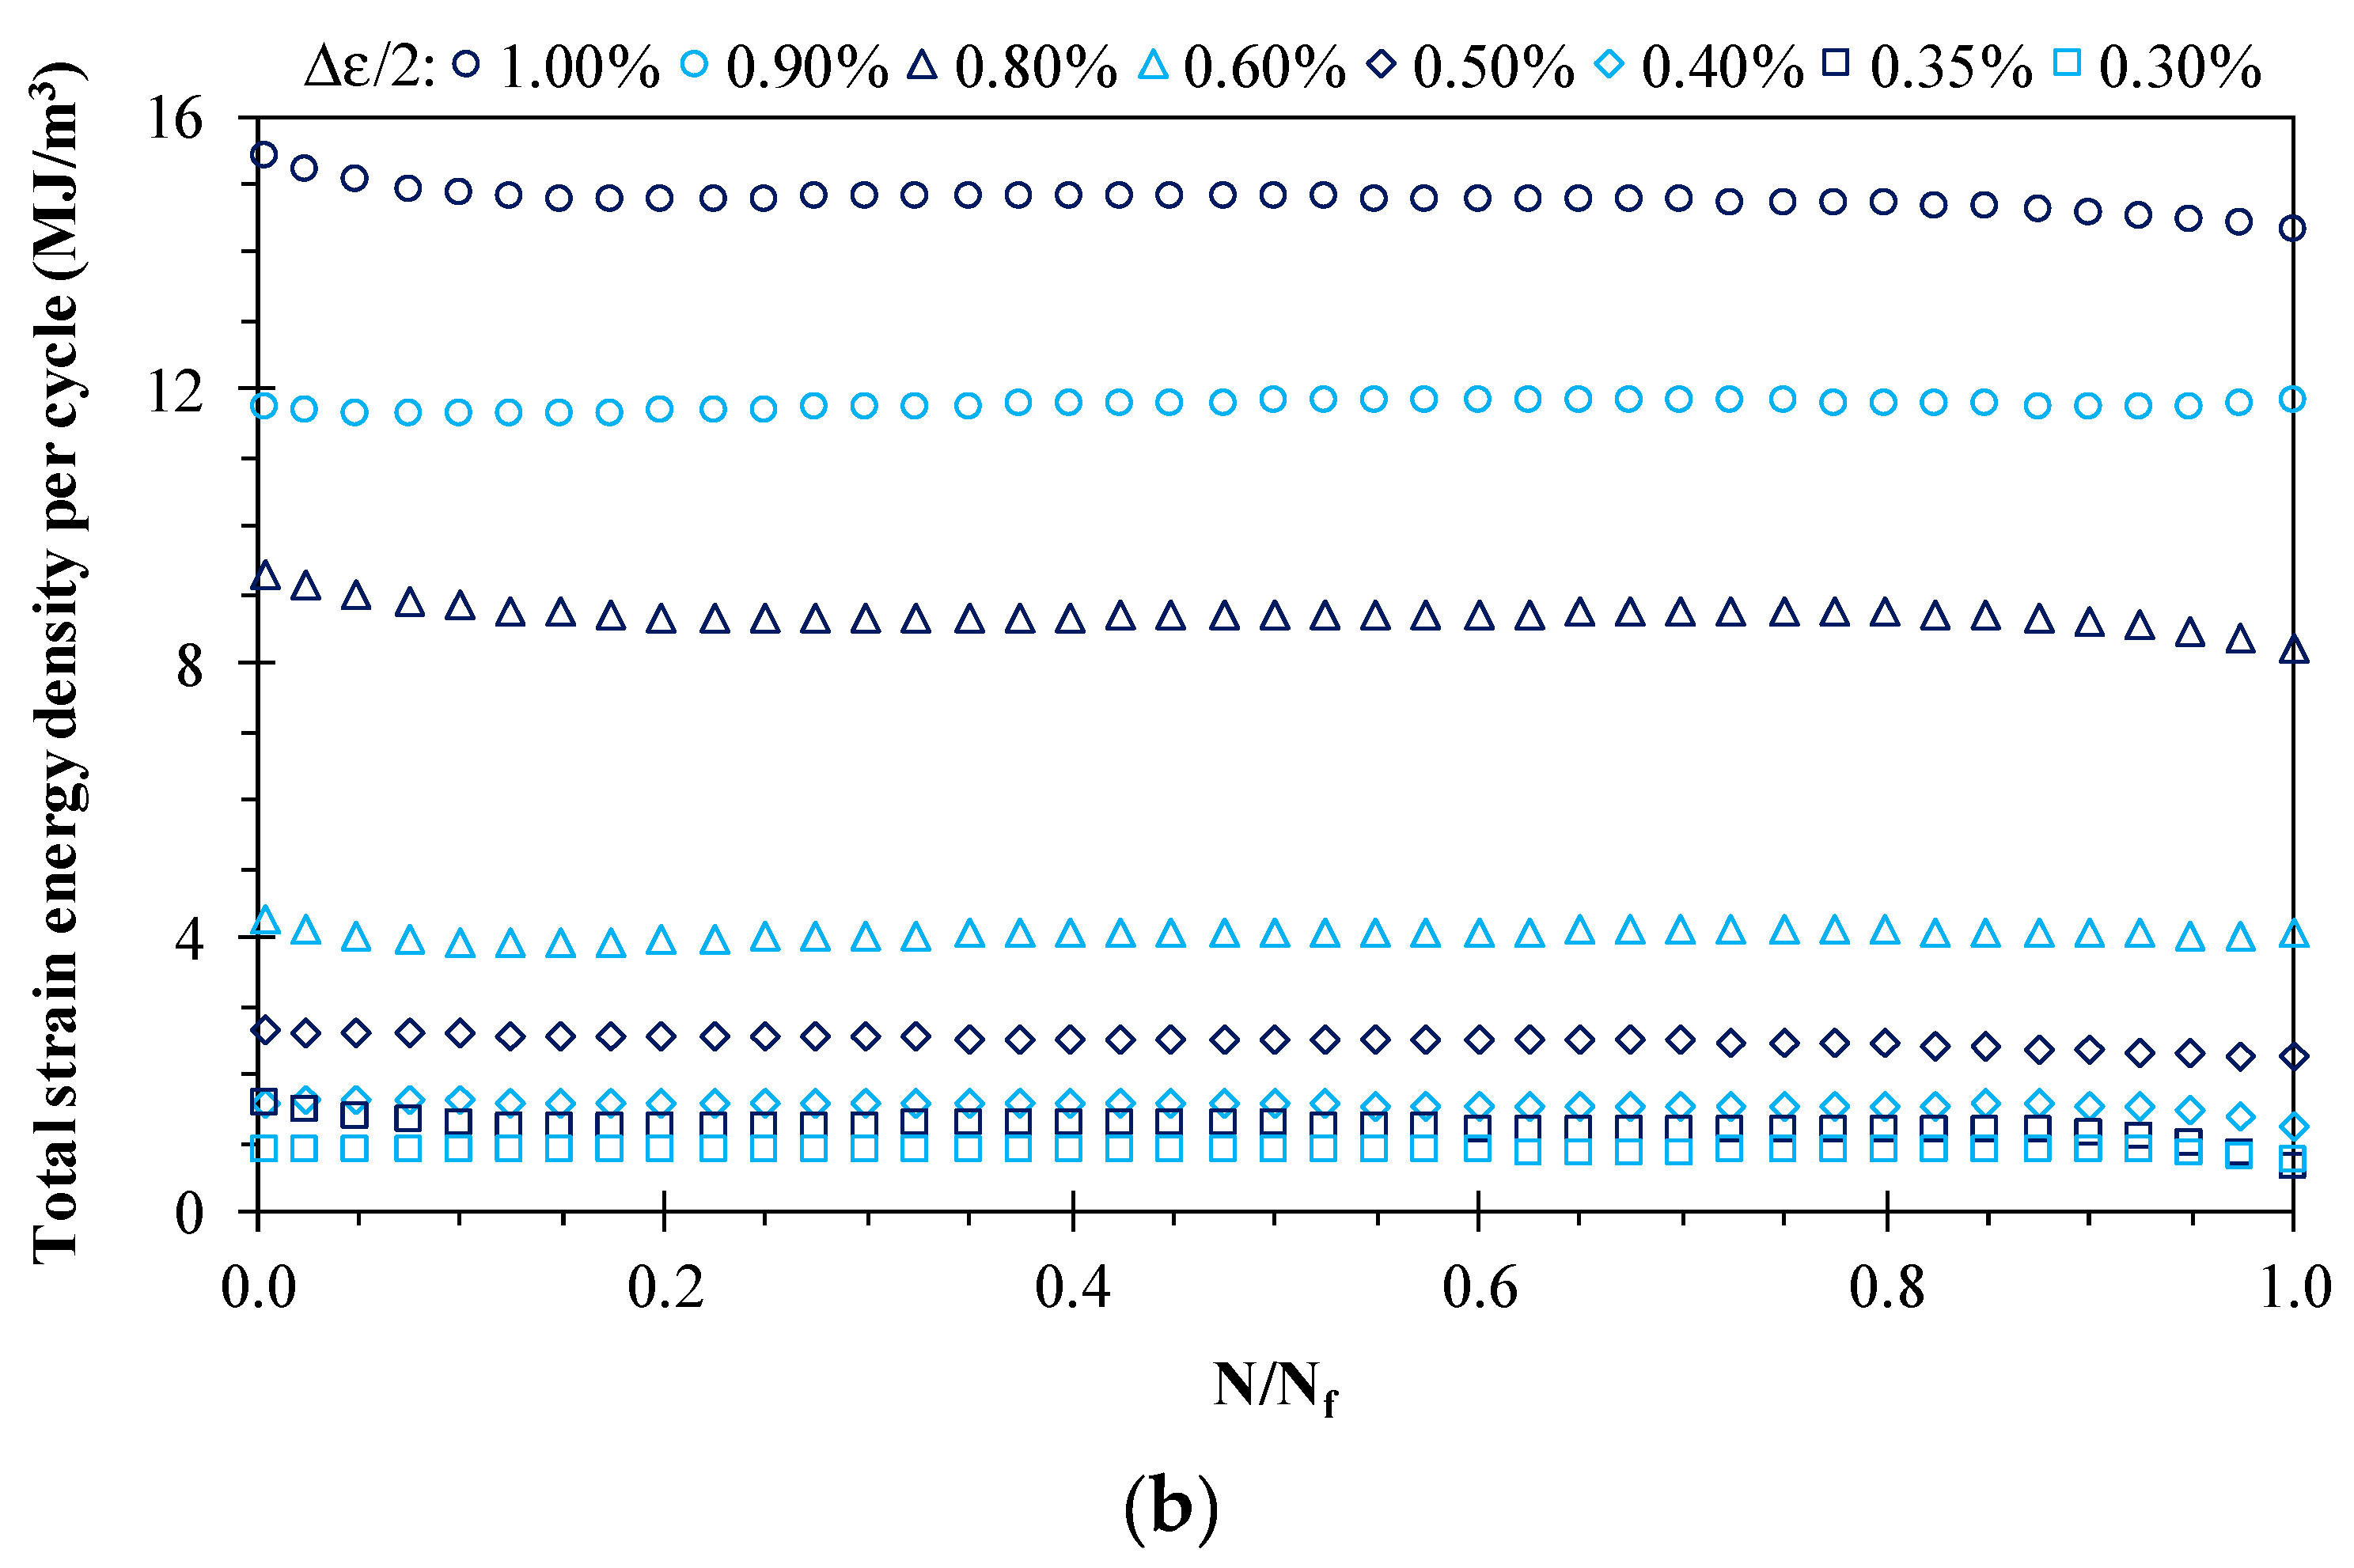
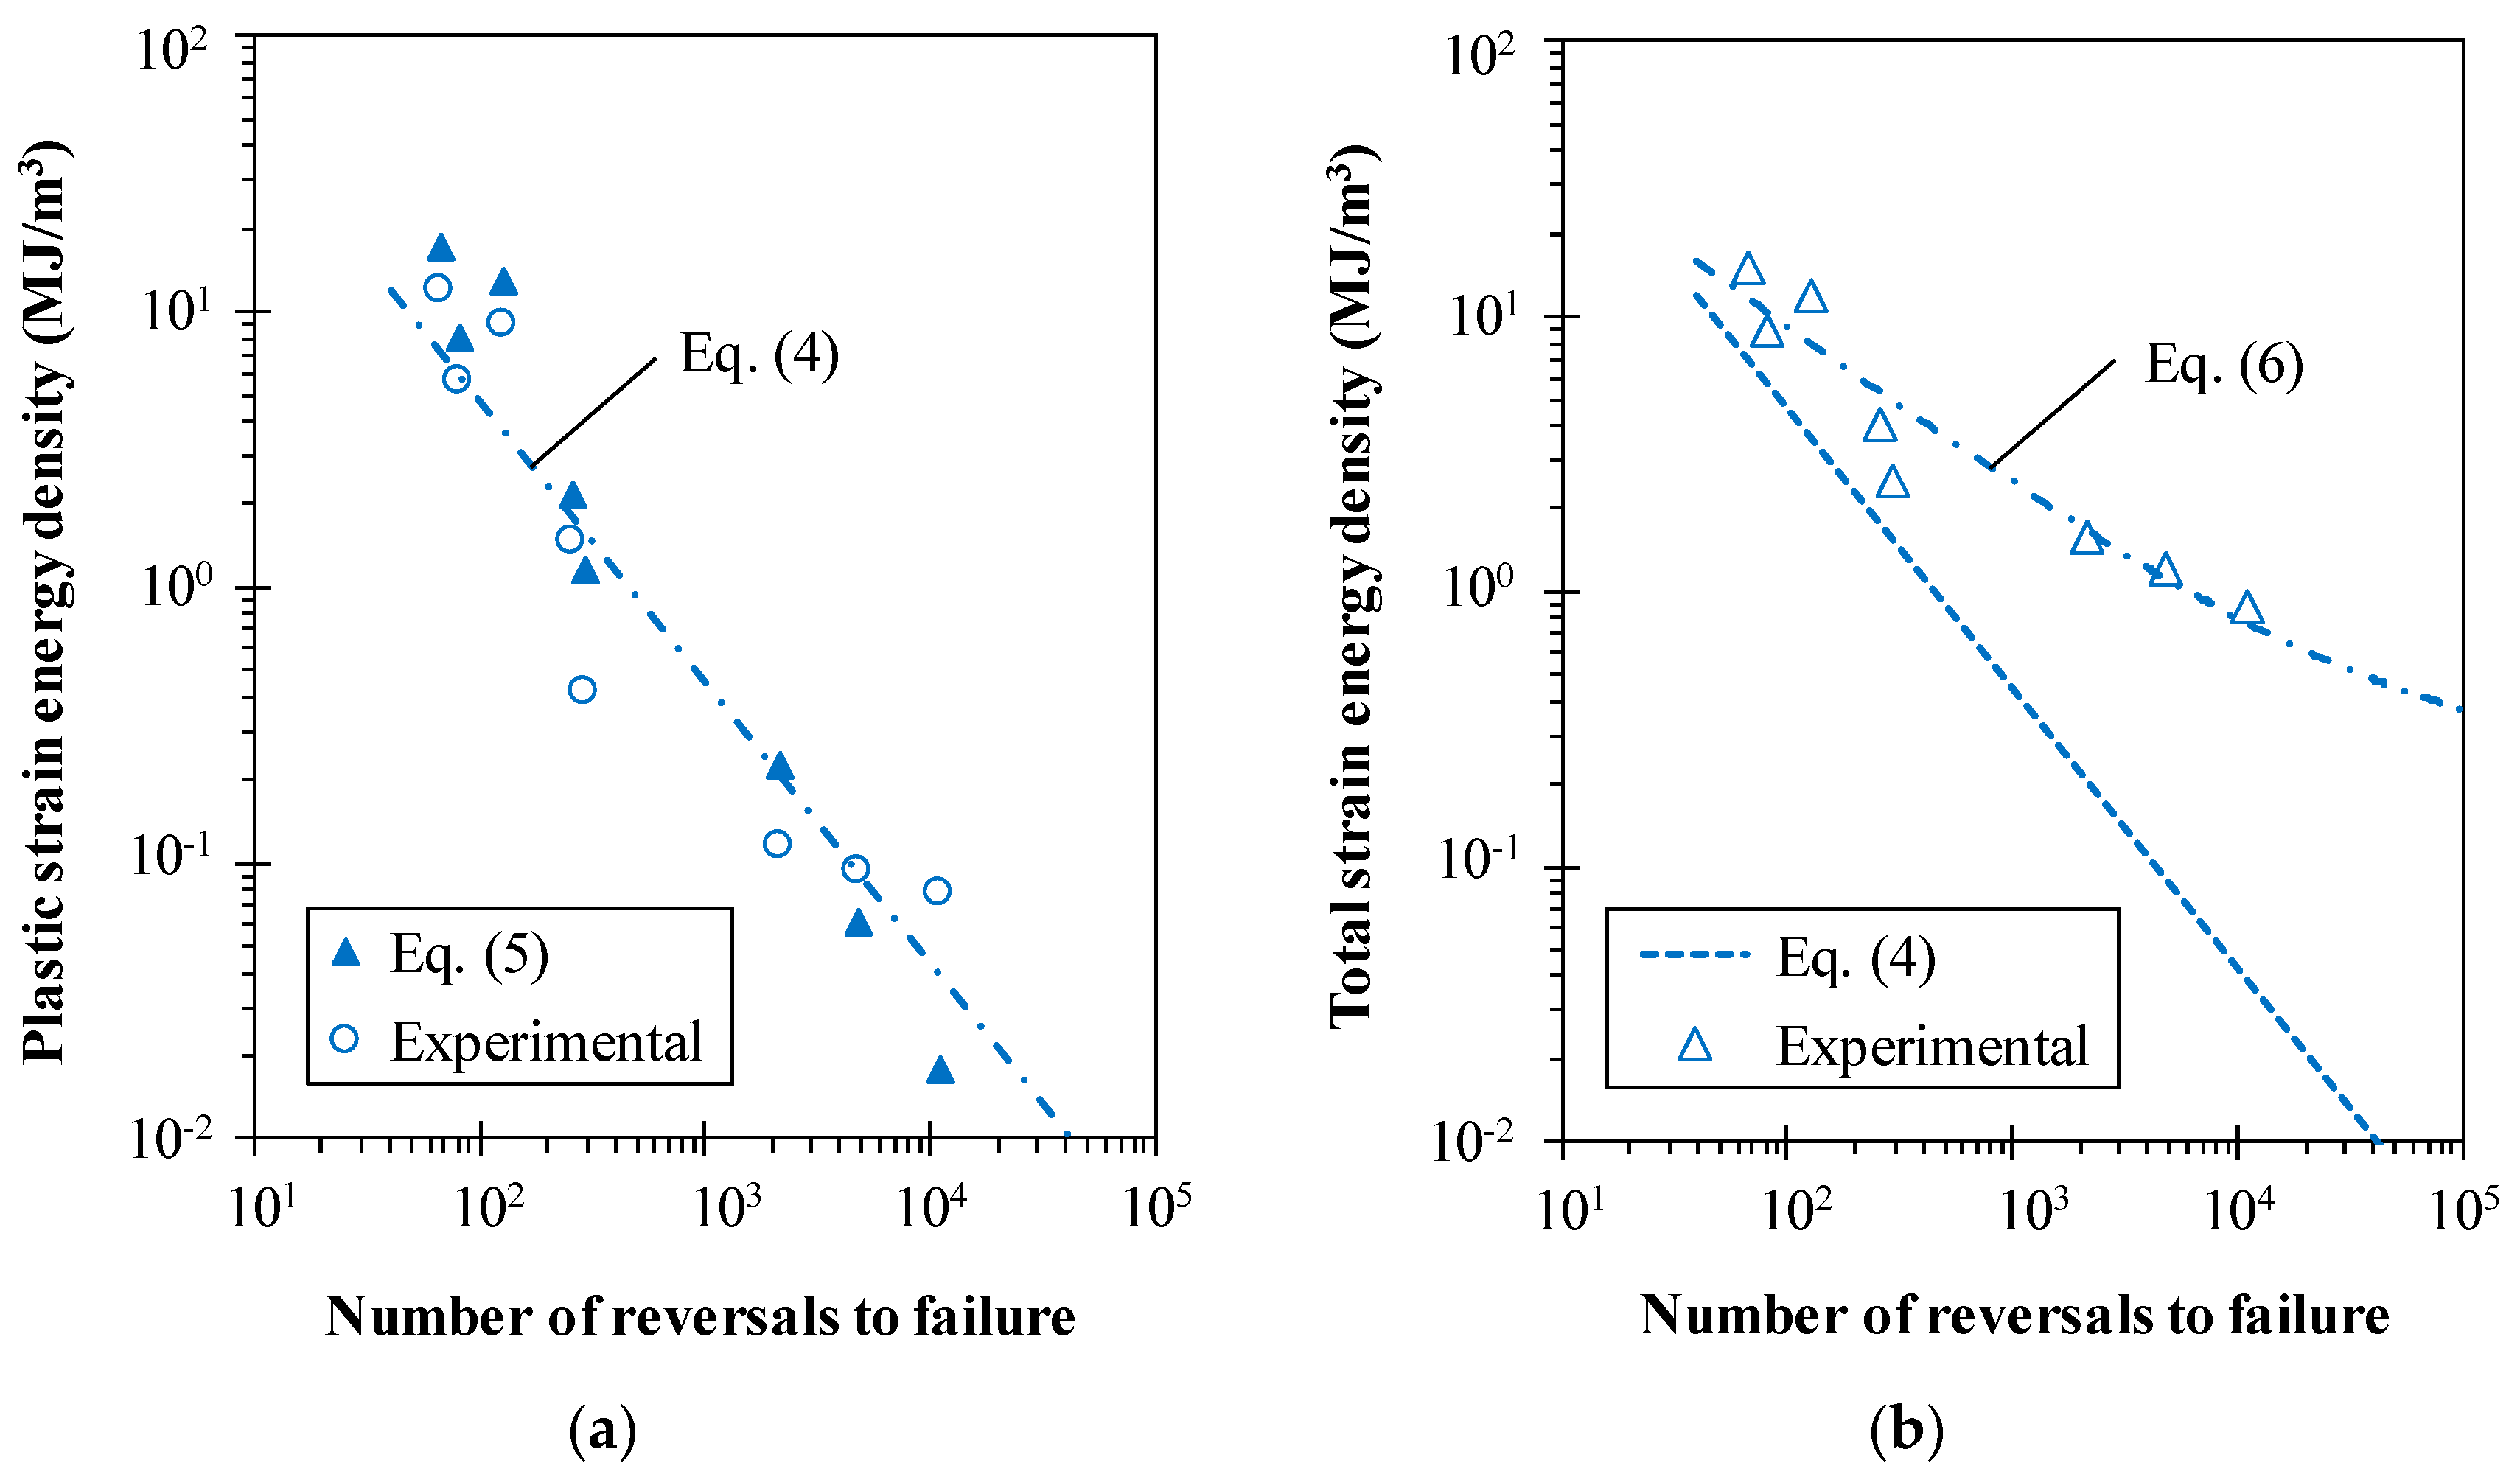
3.5. Energy-Life Relationship

Energy-based approaches assume that the dissipated strain energy density per cycle is a main contribution to the fatigue damage process. Both the plastic strain and the total strain energy densities, as demonstrated in Figure 4, are almost constant throughout the lifetime. This property is advantageous, since it can be used to directly estimate the accumulated fatigue damage through the energy dissipation. Figure 9a exhibits, in a log–log scale, the plastic strain energy density at the mid-life cycle against the number of reversals to failure. The relation between the variables mentioned above can be described by a power-law, i.e.,
Δ W p = κ p   ( 2 N f )   α p
where κp and αp are fitting constants, which were determined using a best fit technique, and are summarised in Table 6. Although there is some scatter, the correlation coefficient (r = 0.941) is satisfactory. For non-Masing materials, the value of ΔWp [24] can be estimated using the formula:
Δ W p = 1 n * 1 + n *   Δ σ   Δ ε p + 2 n * 1 + n *   δ σ 0 Δ ε p
where n* is the hardening exponent of the master curve and δσ0 = Δσ − Δσ*. The master curve is a unique curve defined by matching the upper branches of the hysteresis loops at different strain amplitudes (see Figure 5b). As can be seen, the differences relative to the experimental measurements are relative small.
The plastic strain energy density, as a fatigue damage parameter, is most appropriate under high strain levels, since it is difficult to measure close to the fatigue limit, resulting in higher errors and improper fatigue life assessments. Figure 9b presents the total strain energy density against the number of reversals to failure. The fitted function of ΔWp is also plotted for the sake of clarity. The total strain energy density is accounted for by the sum of the plastic and the tensile elastic strain energy densities of the mid-life hysteresis loops. It can be written as follows:
Δ W T = κ t   ( 2 N f )   α t + Δ W 0 e +
where κt and αt are constants, and Δ W 0 e + is the tensile elastic energy at the material fatigue limit estimated here at 2Nf = 107. The values of the coefficients are given in Table 6. Overall, the fitted function agrees well with the experimental observations. This formulation, unlike the former, can be used either in low- or high-cycle fatigue regime, and is sensitive to the mean stress. In a recent study, the fatigue crack initiation life in round bars with U-notches subjected to combined bending-torsion loading was predicted using this approach [25].
Regarding components having complex geometries, no specific design criteria have been presented so far to consider stress concentration phenomena arising from geometrical discontinuities [14,15]. Hence, the same methodology can be examined in future for the notched specimens produced by additive manufacturing.

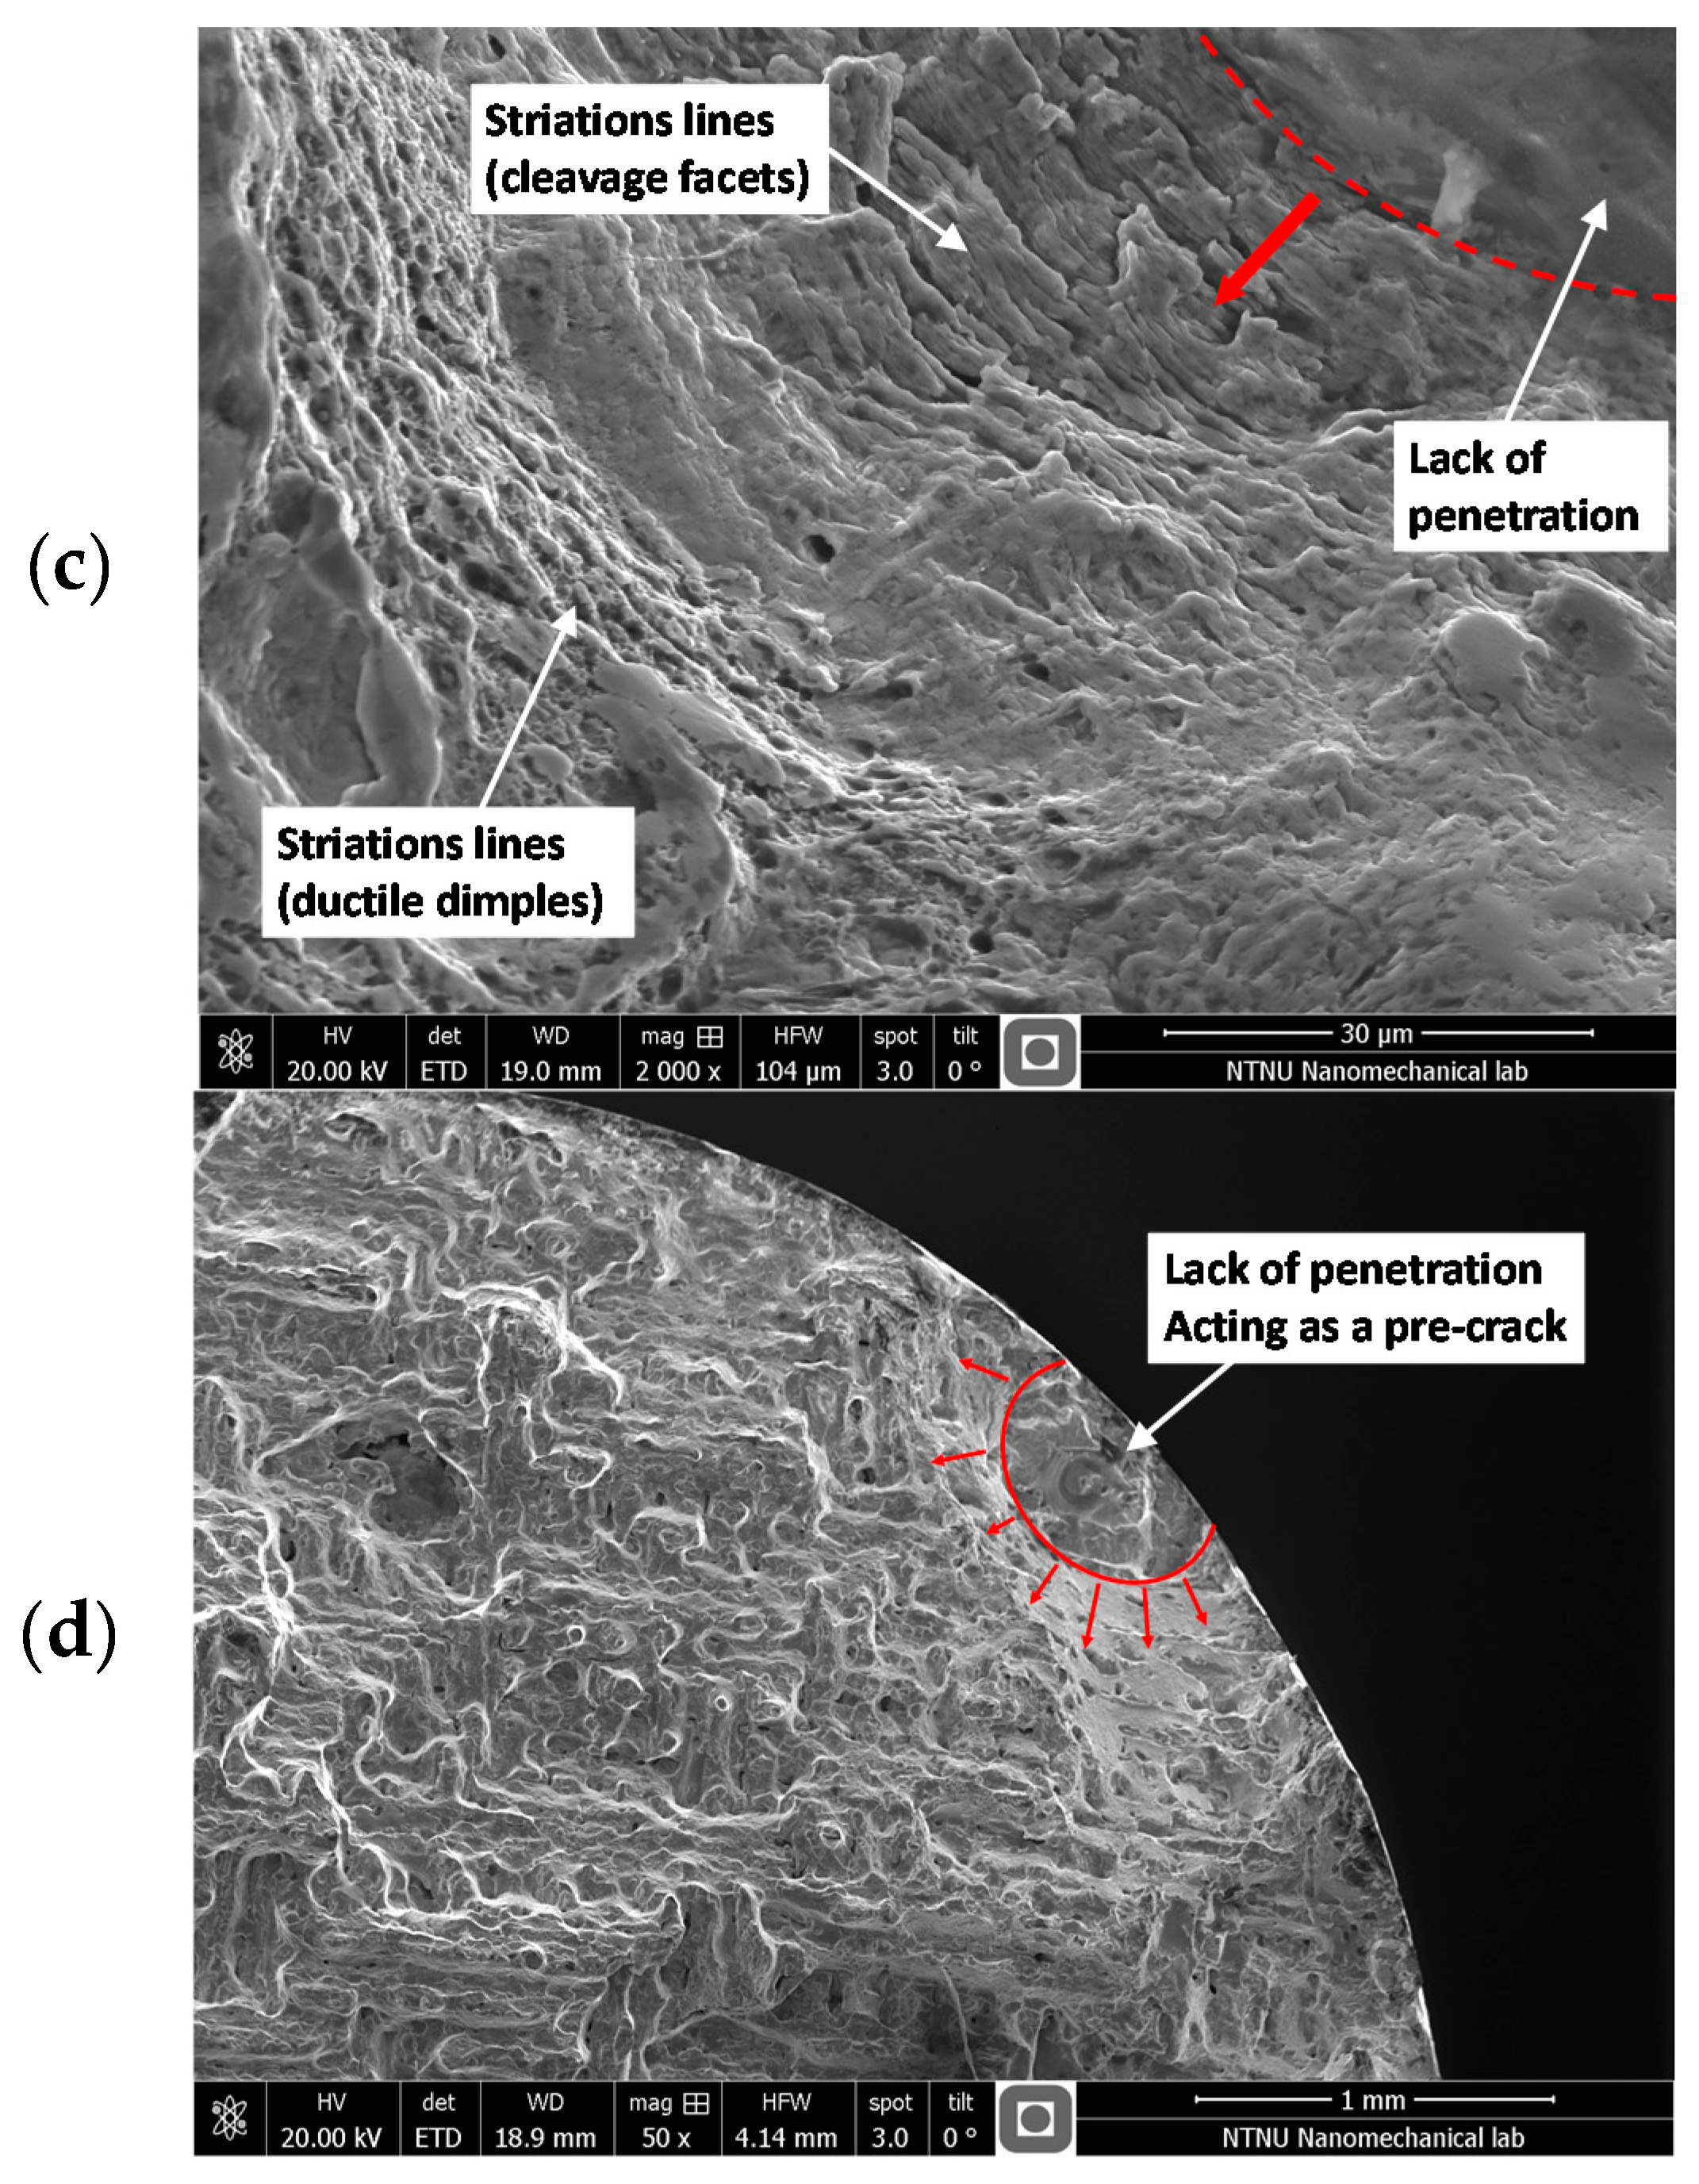
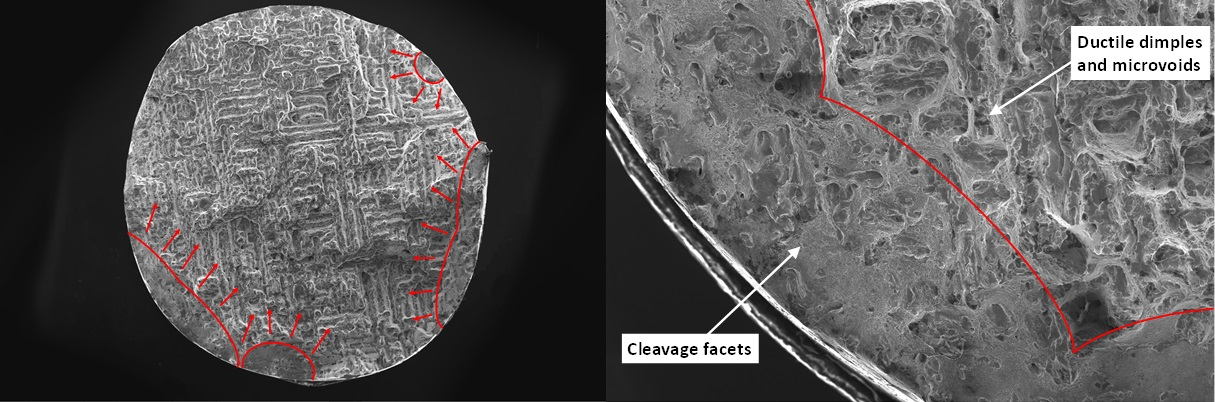
3.6. Analysis of Fracture Surfaces

The fracture surfaces of the samples were investigated by scanning electron microscope (SEM). SEM fractographs of the specimens tested under 0.60% strain amplitudes are shown in Figure 10 and Figure 11. Figure 10 illustrates the texture of the fracture surface of the sintered test samples, i.e., the shape and orientation of the particles deposited in each layer. Severe defects (e.g., voids and unmolten particles) in the material act as crack initiation points (see Figure 11). Hence, for almost all of samples, the fatigue crack initiated from the surface or inner defects and propagated through the cross section. According to Figure 10b,c, the fatigue crack initiation was characterized by considerable percentage of cleavage with a few number of dimples. While the inner cross section of the tested samples was mainly dominated by the ductile mode of fracture and characterized with ductile dimples and microvoids. A ductile/brittle fracture with a predominance of brittle fracture can be observed in the samples owing to the presence of the defects, which make it easier to spread the microcracks.

4. Conclusions

The paper addressed the low-cycle fatigue behaviour of AISI 18Ni300 steel manufactured by selective laser melting with a scan speed of 200 mm/s. A series of fully-reversed, strain-controlled tests at room temperature were conducted at strain amplitudes ranging from 0.3% to 1.0% in circular cross-section specimens. Before testing, the microstructure in the as-received form was analysed by optical microscopy. After testing, fracture surfaces were examined by scanning electron microscopy. The following conclusions can be drawn:
  • The microstructure was rather coherent and formed by elongated grains. High level of small porosities, as well as the existence of martensitic needles, was also observed.
  • The cyclic stresses response increased in a very short initial stage of about 2–3 cycles; then, it decreased continuously at higher strain amplitudes and remained almost constant at lower strain amplitudes; in a third stage, for life ratios higher than 90%, there was a rapid drop in cyclic stresses.
  • The plastic strain energy density per cycle was quite stable over the entire life. Initially, there was a slight softening region of about 10% of the total number of cycles; followed by a saturated region up to 90% of fatigue life; and a third region with small perturbations culminating in fatigue failure.
  • The mid-life hysteresis loops, bearing in mind that the saturated regimes are achieved in the early stage of the tests, can be selected as representative of the stable behaviour.
  • The degree of softening, evaluated from the maximum stress of the first and the mid-life circuits, was relatively small in the entire strain range studied. In a first stage, at smaller strain amplitudes, the degree of softening decreased; and, in a second stage, for strain amplitudes higher than 0.5%, it increased progressively to the maximum value of about 7%.
  • The material exhibited a non-Masing behaviour which was associated with the changes in the linear region of the stable circuits, possibly caused by the formation of dislocation cells. The areas of the stable loops, for strain amplitudes higher than 0.5%, were about 40–45% of the perfect Masing-type circuits.
  • The increase in strain amplitude decreased the unloading modulus. This is evidence of non-linear behaviour in both the elastic and the plastic regimes.
  • The very low transition life of about 35 reversals was far below the values of conventional materials with equivalent monotonic mechanical properties, which can be attributed to the combination of high strength and low ductility.
  • The plastic strain energy density at mid-life cycle can be satisfactorily related with the number of cycles to failure from a power-law. The total strain energy density, accounted for by the sum of the plastic and the tensile elastic strain energy densities of the mid-life hysteresis loops, is an adequate parameter for both high- and low-cycle fatigue regimes.
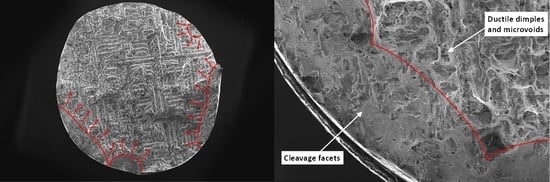
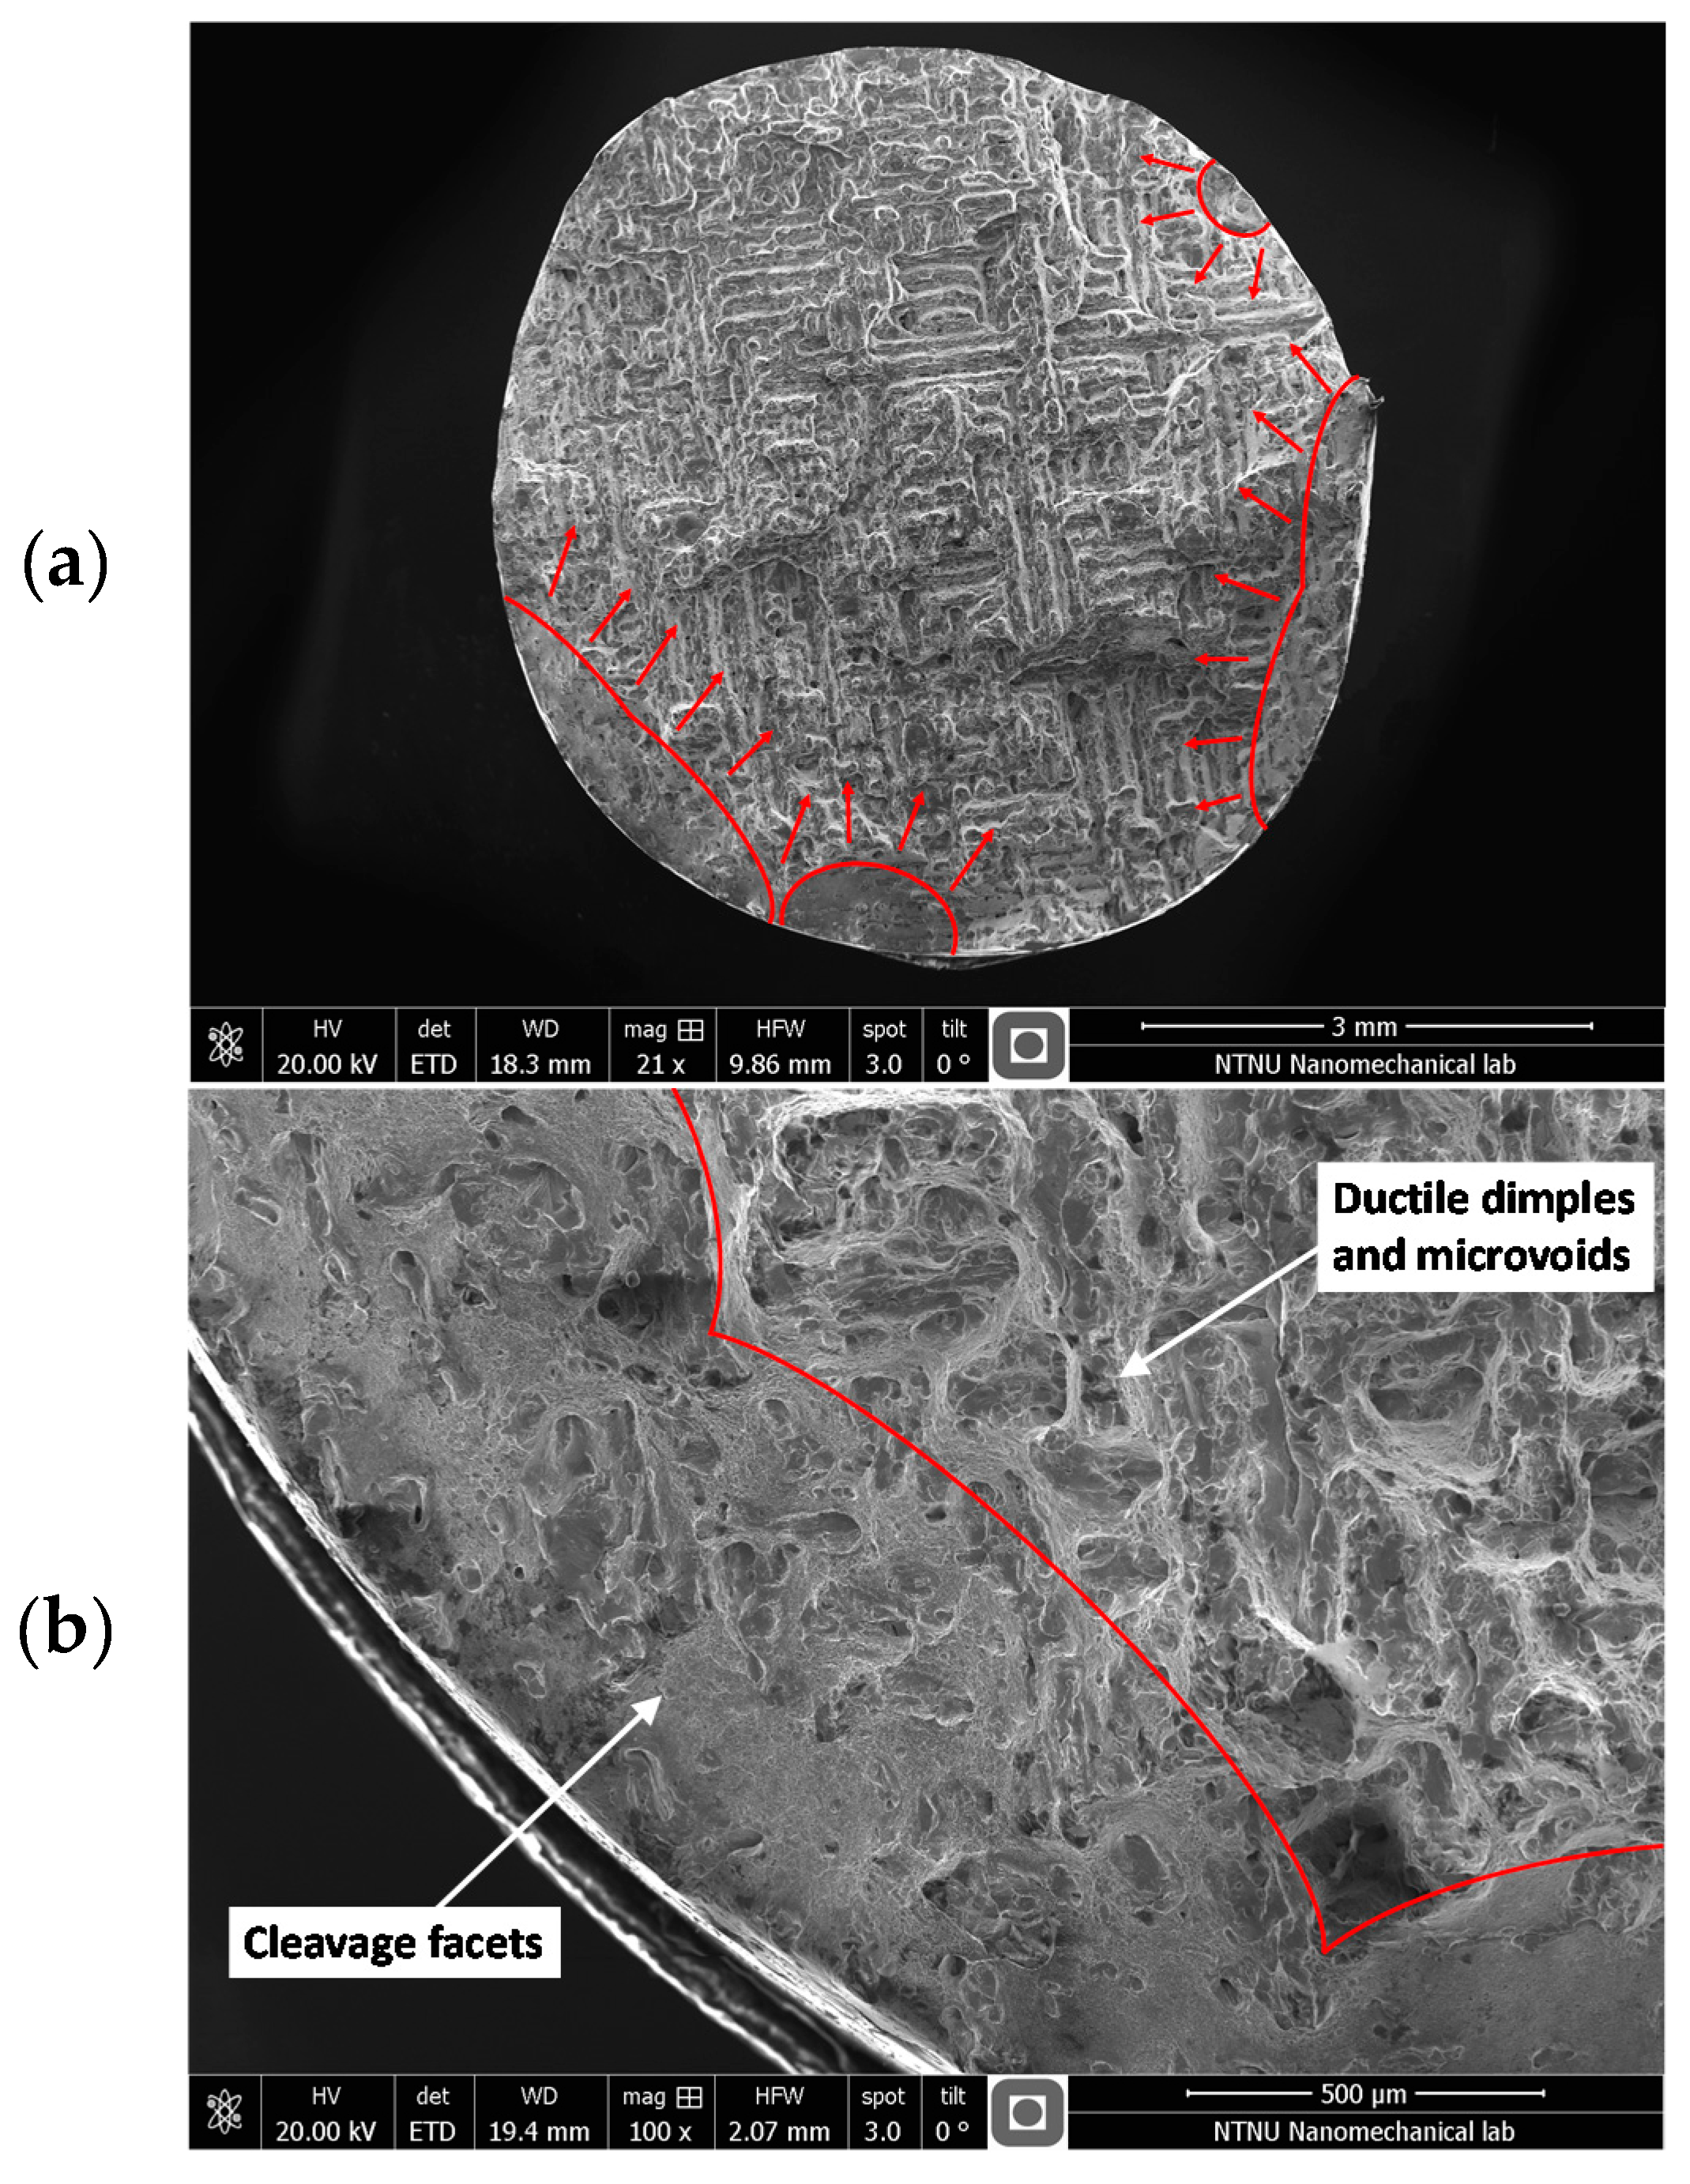
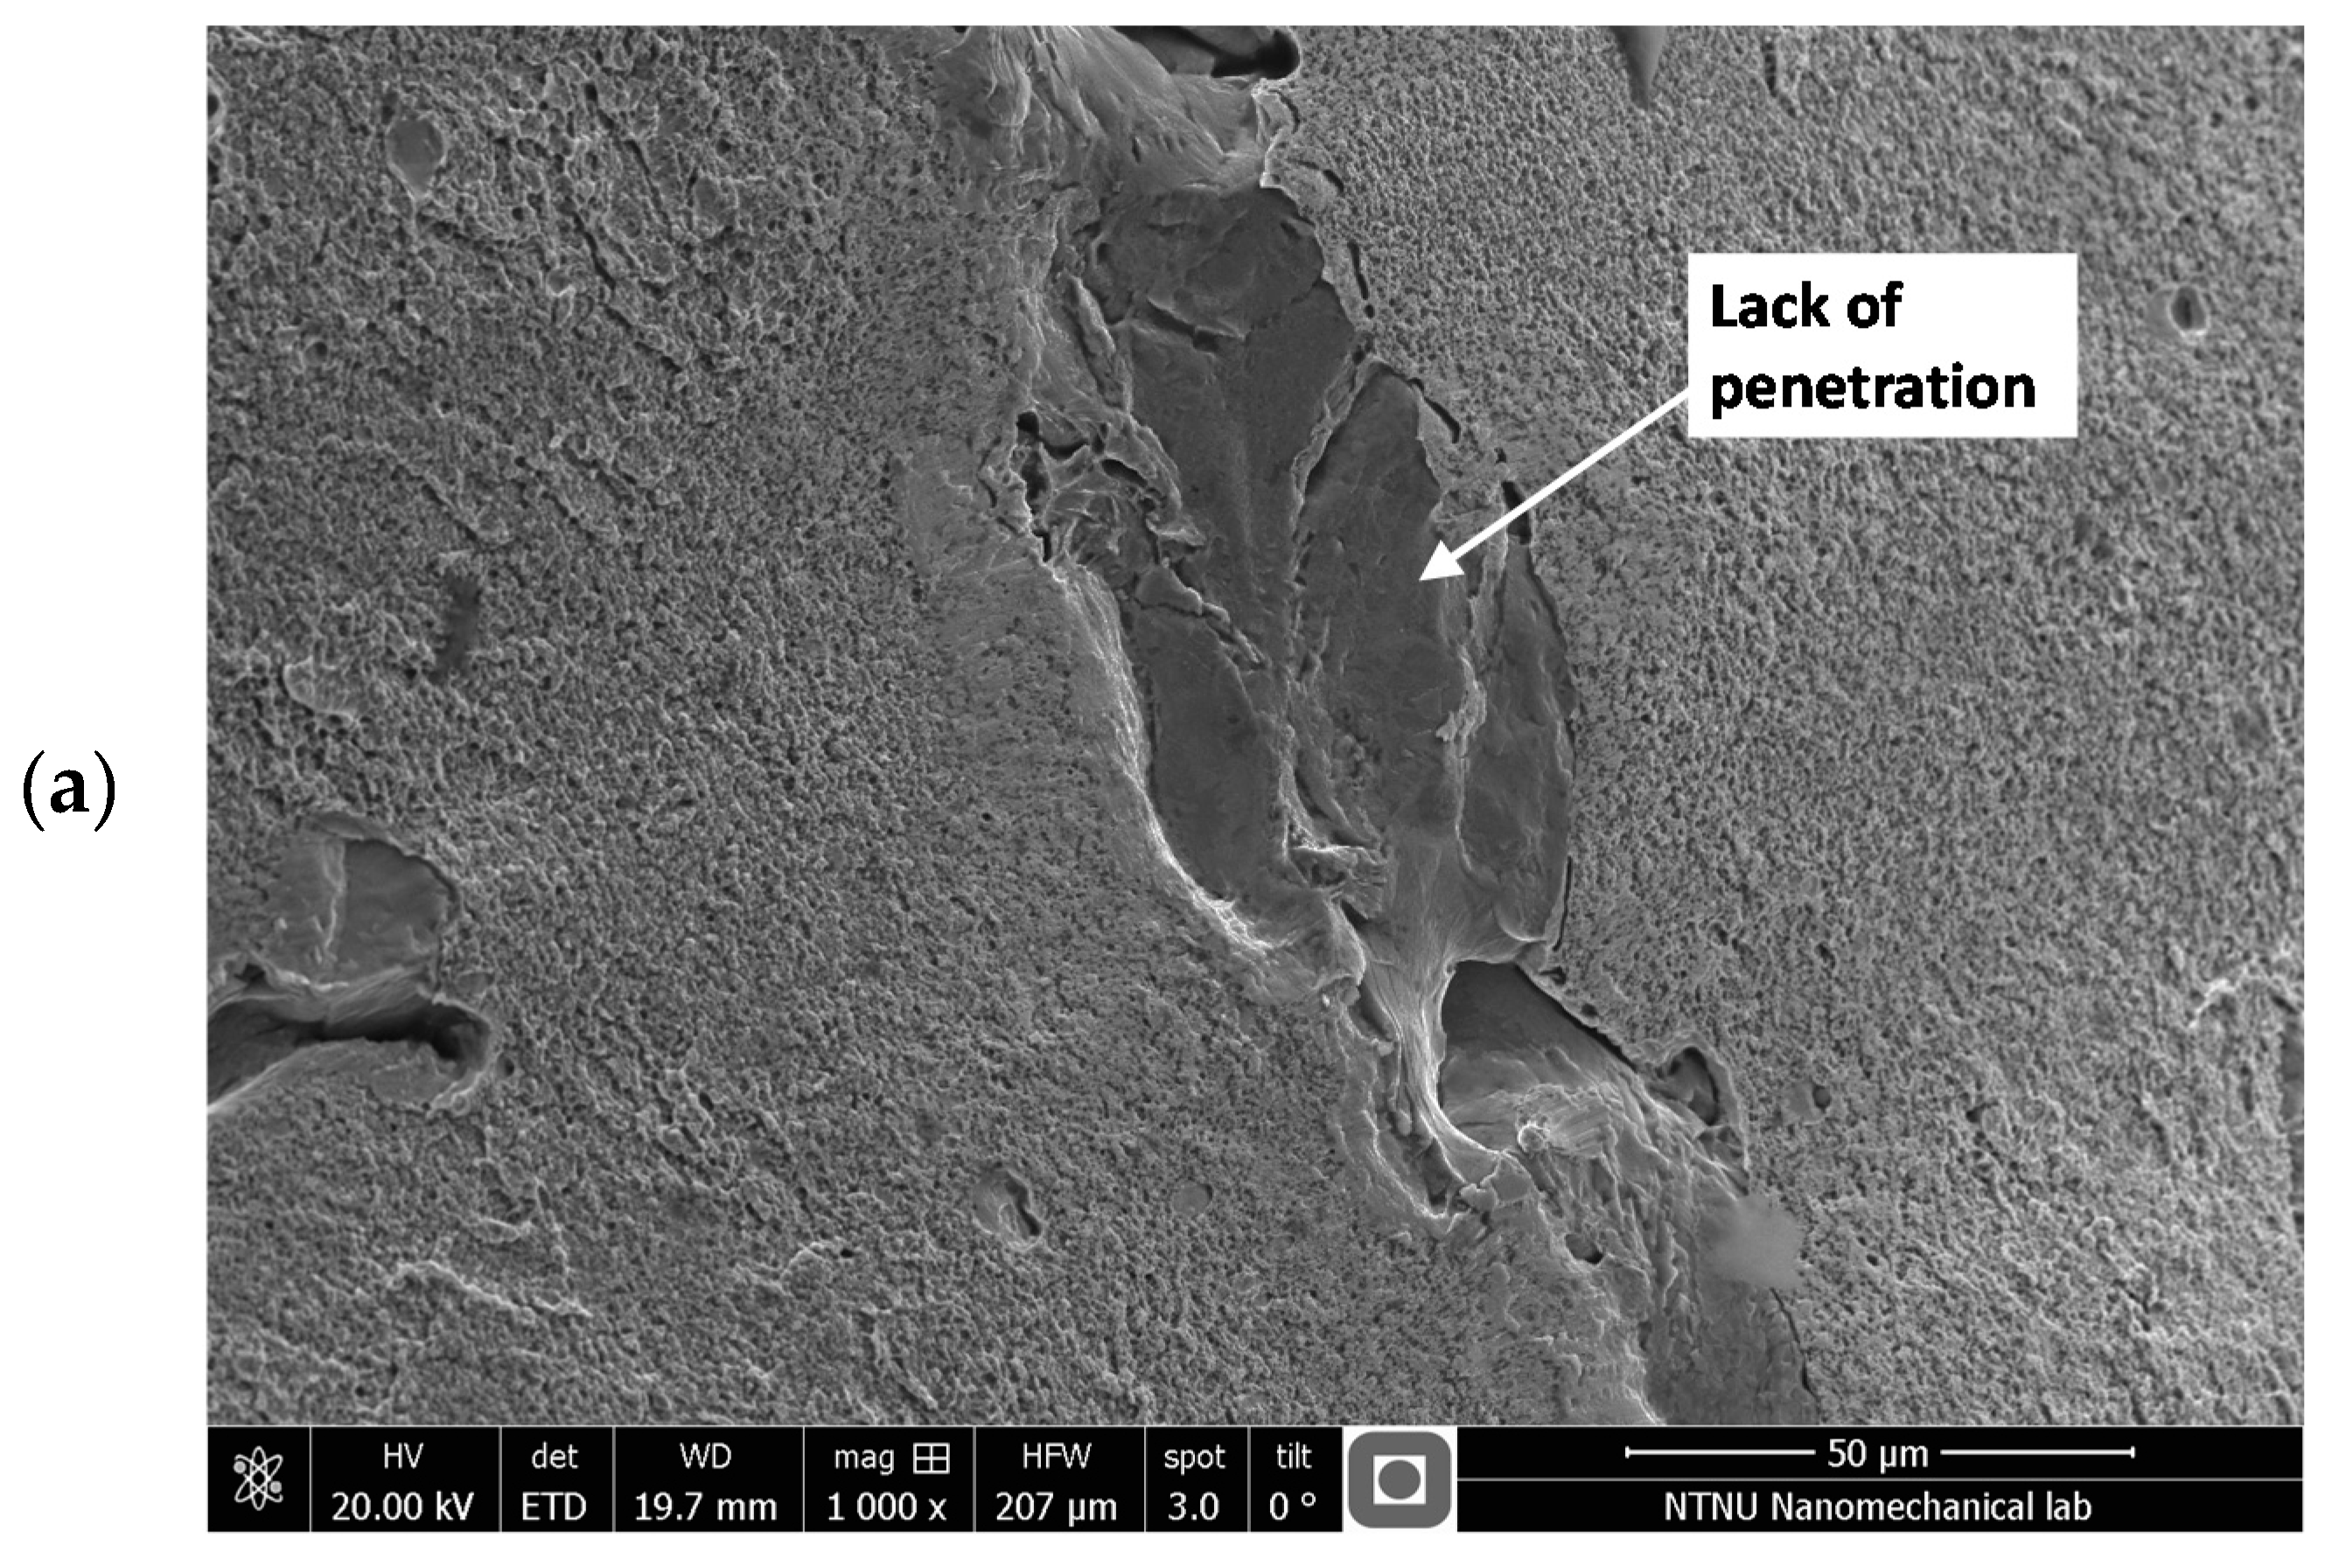
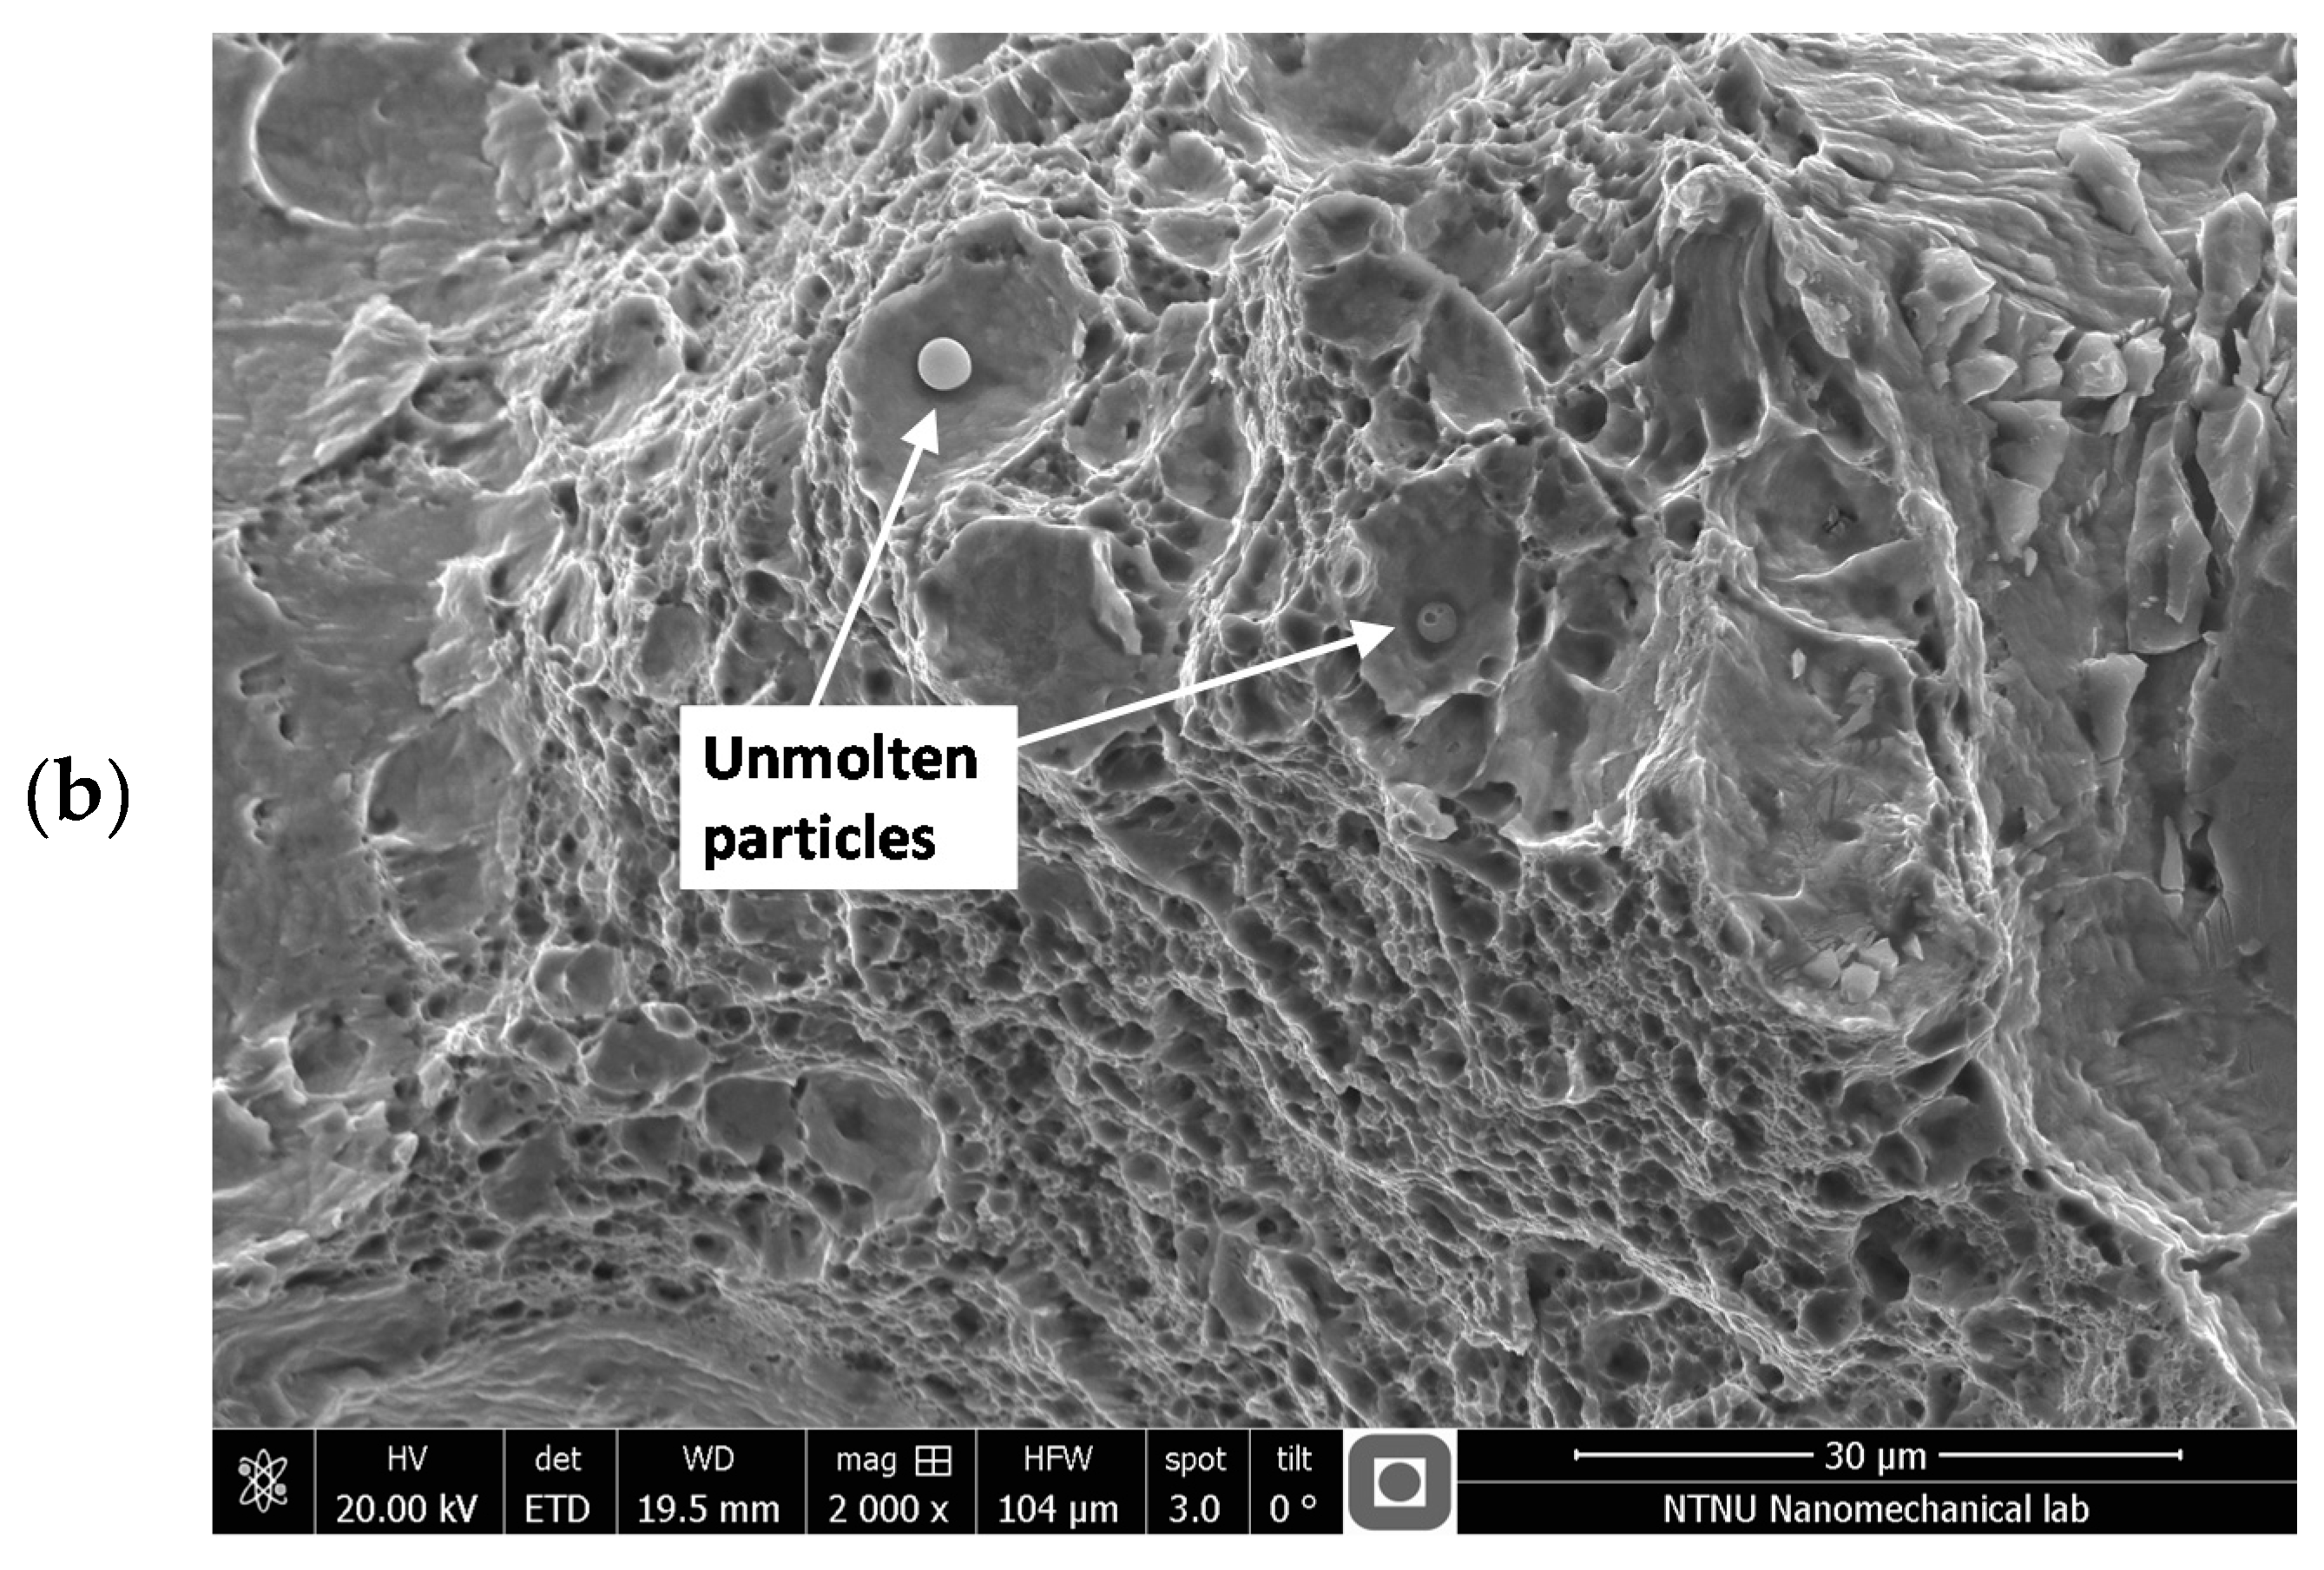
  • SEM analysis revealed that the fatigue crack nucleated from the surface and defects within the material. The presence of an unmolten area in the material led to a predominant brittle fracture mechanism in all the tested samples. Crack initiation was dominated by cleavage facets which was followed by ductile dimples and microvoids due to crack extension to the inner part of cross section.

Acknowledgments

The authors would like to acknowledge the sponsoring under the project No. 016713 (PTDC/EMS-PRO/1356/2014) financed by Project 3599: Promover a Produção Científica e Desenvolvimento Tecnológico e a Constituição de Redes Temáticas (3599-PPCDT) and FEDER funds.

Author Contributions

José D. M. Costa performed the low-cycle fatigue tests; José A. Martins Ferreira, Carlos Capela and Luís Santo analysed the microstructure; Filippo Berto and Seyed Mohammad Javad Razavi examined the fracture surfaces; Ricardo Branco and Fernando Antunes analysed the results; Ricardo Branco, Filippo Berto and Seyed Mohammad Javad Razavi wrote the paper.

Conflicts of Interest

The authors declare no conflict of interest.

References

  1. Santos, E.C.; Shiomi, M.; Osakada, K.; Laoui, T. Rapid manufacturing of metal components by laser forming. Int. J. Mach. Tools Manuf. 2006, 46, 1459–1468. [Google Scholar] [CrossRef]
  2. Yadroitsev, I.; Bertrand, P.; Smurov, I. Parametric analysis of the selective laser melting process. Appl. Surf. Sci. 2007, 253, 8064–8069. [Google Scholar] [CrossRef]
  3. Abe, F.; Osakada, K.; Shiomi, M.; Uematsu, K.; Matsumoto, M. The manufacturing of hard tools from metallic powders by selective laser melting. J. Mater. Process. Technol. 2001, 111, 210–213. [Google Scholar] [CrossRef]
  4. Wang, Y.; Bergstrom, J.; Burman, C. Four-point bending fatigue behaviour of an iron-based laser sintered material. Int. J. Fatigue 2006, 28, 1705–1715. [Google Scholar] [CrossRef]
  5. Leuders, S.; Thöne, M.; Riemer, A.; Niendorf, T.; Tröster, T.; Richard, H.; Maier, H. On the mechanical behaviour of titanium alloy TiAl6V4 manufactured by selective laser melting: Fatigue resistance and crack growth performance. Int. J. Fatigue 2013, 48, 300–307. [Google Scholar] [CrossRef]
  6. Sehrt, J.; Witt, G. Dynamic strength and fracture toughness analysis of beam melted parts. In Proceedings of the 36th International MATADOR Conference, Manchester, UK, 5–7 July 2010; pp. 385–388. [Google Scholar]
  7. Croccolo, D.; de Agostinis, M.; Fini, S.; Olmi, G.; Vranic, A.; Ciric-Kostic, S. Influence of the build orientation on the fatigue strength of EOS maraging steel produced by additive metal machine. Fatigue Fract. Eng. Mater. Struct. 2016, 39, 637–647. [Google Scholar] [CrossRef]
  8. Stoffregen, H.; Butterweck, K.; Abele, E. Fatigue analysis in selective laser melting: Review and investigation of thin-walled actuator housings. In Proceedings of the 25th Solid Freeform Fabrication Symposium, Austin, TX, USA, 4–6 August 2014. [Google Scholar]
  9. Spierings, A.B.; Starr, T.L.; Wegener, K. Fatigue performance of additive manufactured metallic parts. Rapid Prototyp. J. 2013, 19, 88–94. [Google Scholar] [CrossRef]
  10. Kasperovich, G.; Hausmann, J. Improvement of fatigue resistance and ductility of TiAl6V4 processed by selective laser melting. J. Mater. Process. Technol. 2015, 220, 202–214. [Google Scholar] [CrossRef]
  11. Santos, L.M.S.; Ferreira, J.A.M.; Jesus, J.S.; Costa, J.M.; Capela, C. Fatigue behaviour of selective laser melting steel components. Theor. Appl. Fract. Mech. 2016, 85, 9–15. [Google Scholar] [CrossRef]
  12. Yadollahi, A.; Shamsaei, N.; Thompson, S.; Elwany, A.; Bian, L. Effects of building orientation and heat treatment on fatigue behavior of selective laser melted 17-4 PH stainless steel. Int. J. Fatigue 2017, 94, 218–235. [Google Scholar] [CrossRef]
  13. Walker, K.F.; Liu, Q.; Brandt, M. Evaluation of fatigue crack propagation behaviour in Ti-6Al-4V manufactured by selective laser melting. Int. J. Fatigue 2017, 104, 302–308. [Google Scholar] [CrossRef]
  14. Razavi, S.M.J.; Ferro, P.; Berto, F. Fatigue assessment of Ti-6Al-4V circular notched specimens produced by selective laser melting. Metals 2017, 7, 291. [Google Scholar] [CrossRef]
  15. Razavi, S.M.J.; Ferro, P.; Berto, F.; Torgersen, J. Fatigue strength of blunt V-notched specimens produced by selective laser melting of Ti-6Al-4V. Theor. Appl. Fract. Mech. 2017, in press. [Google Scholar] [CrossRef]
  16. Socie, D.; Marquis, G. Multiaxial Fatigue; Society of Automotive Engineers: Warrendale, PA, USA, 2000. [Google Scholar]
  17. Smith, R.; Hirschberg, M.; Manson, S. Fatigue Behaviour of Materials under Strain Cycling in Low and Intermediate Life Range; NACA TN D-1574; National Advisory Committee for Aeronautics: Kitty Hawk, NC, USA, 1963. [Google Scholar]
  18. Raouf, H.A.; Topper, T.H.; Plumtree, A. Cyclically plasticity and masing behaviour in metals and alloys. In Proceedings of the 4th International Conference of Fracture (ICF4), Waterloo, ON, Canada, 19–24 June 1977. [Google Scholar]
  19. Morrow, J. Cyclic plastic strain energy and fatigue of metals. In International Friction, Damping and Cyclic Plasticity; ASTM STP 378; American Society for Testing and Materials: Philadelphia, PA, USA, 1965; pp. 45–87. [Google Scholar]
  20. Ellyin, F. Fatigue Damage, Crack Growth and Life Prediction, 1st ed.; Chapman & Hall: London, UK, 1997; ISBN 0-412-59600-8. [Google Scholar]
  21. Kujawski, D.; Ellyin, F. The effect of cyclic loading on the slope of the stress-strain immediately upon load reversal. Res. Mech. 1987, 22, 295–299. [Google Scholar]
  22. Branco, R.; Costa, J.D.; Antunes, F.V.; Perdigão, S. Monotonic and cyclic behaviour of DIN 34CrNiMo6 martensitic steel. Metals 2016, 6, 98. [Google Scholar] [CrossRef]
  23. Branco, R.; Costa, J.D.; Antunes, F.V. Low-cycle fatigue behaviour of 34CrNiMo6 high strength steel. Theor. Appl. Fract. Mech. 2012, 58, 28–34. [Google Scholar] [CrossRef]
  24. Lefebvre, D.; Ellyin, F. Cyclic response and inelastic strain energy in low cycle fatigue. Int. J. Fatigue 1984, 6, 9–15. [Google Scholar] [CrossRef]
  25. Branco, R.; Costa, J.D.; Berto, F.; Antunes, F.V. Fatigue life assessment of notched round bars under multiaxial loading based on the total strain energy density approach. Theor. Appl. Fract. Mech. 2017, in press. [Google Scholar] [CrossRef]
Figure 1. Specimen geometry of the low-cycle fatigue tests (dimensions in mm).
Metals 08 00032 g001
Figure 2. Optical micrographs of the AISI 18Ni300 maraging steel from a sample etched with Picral at magnifications of: (a) 100×; (b) 500×; (c) martensitic needles; (d) contrast image.
Metals 08 00032 g002aMetals 08 00032 g002b
Figure 3. Variation of peak, valley, and mean stresses with the normalised fatigue life during the low-cycle fatigue tests at various strain amplitudes.
Metals 08 00032 g003
Figure 4. Variation of: (a) plastic strain energy density per cycle; (b) total strain energy density per cycle with the normalised fatigue life during the low-cycle fatigue tests at various strain amplitudes.
Metals 08 00032 g004aMetals 08 00032 g004b
Figure 5. Mid-life circuits at different strain amplitudes with (a) lower tips tied together; (b) upper branches overlapped.
Metals 08 00032 g005
Figure 6. Relation between the cyclic stress amplitude and the elastic and plastic strain amplitude obtained using both the unloading moduli measured in the tests (dashed line) and the value of E determined from the monotonic tensile test (dash-dotted line).
Metals 08 00032 g006
Figure 7. (a) Cyclic stress–strain curve of the AISI 18Ni300 steel; (b) degree of softening versus strain amplitude.
Metals 08 00032 g007
Figure 8. Total, plastic, and elastic strain amplitudes versus number of reversals to failure.
Metals 08 00032 g008
Figure 9. (a) Plastic strain energy density versus number of reversals to failure; (b) Total strain energy density versus number of reversals to failure for the mid-life hysteresis loops.
Metals 08 00032 g009
Figure 10. SEM photographs of the tested samples showing multi-nucleation of fatigue cracks from surface (ac) and crack initiation from a defect (d). The red arrows illustrate the direction of fatigue crack propagation.
Metals 08 00032 g010aMetals 08 00032 g010b
Figure 11. Common defects observed on fracture surface: (a) lack of penetration, and (b) unmolten particles.
Metals 08 00032 g011aMetals 08 00032 g011b
Table 1. Chemical composition of AISI 18Ni300 manufactured with a scan speed of 200 mm/s [11].
CNiMnCoMoTiAlCrPSiMnFe
0.0118.20.659.05.00.60.050.30.010.10.04balance
Table 2. Mechanical properties of AISI 18Ni300 manufactured with a scan speed of 200 mm/s [11].
Porosity (%)Density (g/m3)Hardness (HV1)Young’s Modulus (GPa)Tensile Strength (MPa)Yield Strength (MPa)Strain at Failure (%)
0.74 ± 0.097.42354 ± 5168 ± 291147 ± 13910 ± 115.12 ± 0.001
Table 3. Summary of low-cycle fatigue program.
Specimen ReferenceTotal Strain Amplitude, Δε/2 (%)Elastic Strain Amplitude, Δεe/2 (%)Plastic Strain Amplitude, Δεp/2 (%)Stress Amplitude, Δσ/2 (MPa)Plastic Strain Energy Density, ΔWp (MJ/m3)Total Strain Energy Density, ΔWT (MJ/m3)Number of Cycles to Failure, Nf
D1001.0050.59750.40771005.011.92014.80333
D0900.9050.58910.3163990.88.99211.74364
D0800.8070.59840.20871006.55.6638.70340
D0600.6090.54420.0644915.31.4783.988129
D0500.5110.47640.0349801.30.4202.501145
D0400.4110.40350.0080678.70.1151.5611087
D0350.3620.35840.0034602.80.0941.2052399
D0300.3040.30500.0012512.90.0780.8635441
Table 4. Cyclic mechanical properties of AISI 18Ni300 steel manufactured with a scan speed of 200 mm/s.
k′ (MPa)nk″ (MPa)n
1921.210.110080,1460.8706
Table 5. Fatigue strength and fatigue ductility parameters of AISI 18Ni300 steel manufactured with a scan speed of 200 mm/s.
σ f (MPa)b ε f c
1798.73−0.13110.32784−1.0941
Table 6. Energy-based properties of AISI 18Ni300 manufactured with a scan speed of 200 mm/s.
κp (MJ/m3)αpκt (MJ/m3)αt Δ W 0 e + (MJ/m3)
513.400−1.0196140.6670.59740.2287

