Article

Precipitation Stages and Reaction Kinetics of AlMgSi Alloys during the Artificial Aging Process Monitored by In-Situ Electrical Resistivity Measurement Method

1
State Key Laboratory of Advanced Design and Manufacturing for Vehicle Body, College of Mechanical and Vehicle Engineering, Hunan University, Changsha 410082, China
2
College of Materials Science and Engineering, Hunan University, Changsha 410082, China
*
Author to whom correspondence should be addressed.
Metals 2018, 8(1), 39; https://doi.org/10.3390/met8010039
Submission received: 4 December 2017 / Revised: 1 January 2018 / Accepted: 5 January 2018 / Published: 11 January 2018

Abstract

:
The precipitation process and reaction kinetics during artificial aging, precipitate microstructure, and mechanical properties after aging of AlMgSi alloys were investigated employing in-situ electrical resistivity measurement, Transmission Electron Microscopy (TEM) observation, and tensile test methods. Three aging stages in sequence, namely formation of GP zones, transition from GP zones to β″ phase, transition from β″ to β′ phase, and coarsening of both phases, were clearly distinguished by the variation of the resistivity. It was discussed together with the mechanical properties and precipitate morphology evolution. Fast formation of GP zones and β″ phase leads to an obvious decrease of the resistivity and increase of the mechanical strength. The formation of β″ phase in the second stage, which contributes to the peak aging strength, has much higher reaction kinetics than reactions in the other two stages. All of these stages finished faster with higher reaction kinetics under higher temperatures, due to higher atom diffusion capacity. The results proved that the in-situ electrical resistivity method, as proposed in the current study, is a simple, effective, and convenient technique for real-time monitoring of the precipitation process of AlMgSi alloys. Its further application for industrial production and scientific research is also evaluated.

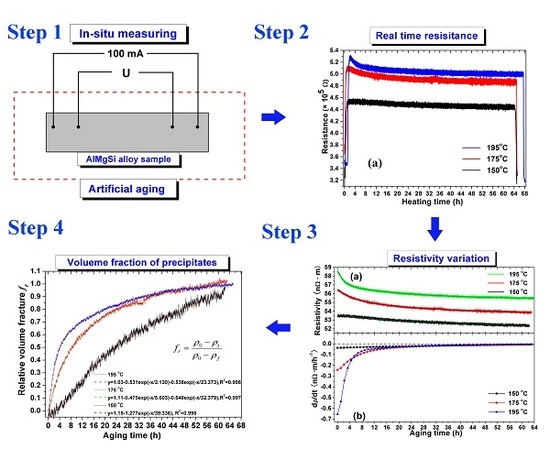
Graphical Abstract

1. Introduction

The light weighting features of the precipitation hardened AlMgSi aluminum alloys trigged tremendous investigation interest in recent years [1,2,3,4,5]. The precipitation behavior during the heat treatment process plays a decisive role in final performance of the AlMgSi alloys. Properties of these alloys, e.g., workability, mechanical strength, electrical conductivity, corrosion resistance etc., are greatly determined by the phase type, morphology, size distribution, and number density of their precipitates [1,3,6,7,8,9]. Therefore, a deep understanding of the precipitation behavior during the artificial aging process is crucial.
Significant achievements in the characterization of the precipitation behavior of AlMgSi alloys have been reached since the end of last centenary, with the assistance of advancing technologies, like High Resolution Transmission Electron Microscopy (HRTEM) [5,6,7,10,11,12,13], Atom Probe Tomography (APT) [1,13,14,15,16,17], Differential Scanning Calorimetry (DSC) [18,19,20], electrical resistivity measurements [21,22,23,24,25,26], Phase Field Crystal (PFC) modeling [4,24], etc. The precipitation sequence has been established and gradually accepted as: supersaturated solid solution (SSSS)→clusters/GP zones→β″→β′→β [27]. The clusters/GP zones are the early stage precipitates with size of several nanometers, usually formed during natural aging or first minutes of artificial aging process. β″ and β′ phases are formed in the artificial aging process before over ageing. β is the final stable phase. The AlMgSi alloys are usually strengthened by the meta-stable phases. However, debates in this field still remain. For example, detailed crystal structure and composition of the meta-stable phases, precipitation kinetics that is quite related to the natural aging effect, quantitative characterization of the precipitates is under debate [13,14,15,16]. The atomic structure and evolution of the early clusters are ambiguous yet [5,6,7]. Characterization accuracy and effectiveness are still dependent on the methods. Therefore, the investigation on the details of the precipitation process is still in progress.
Recently reported investigations proved that the electrical resistivity measurement method is feasible and convenient for quantitative analysis of the reaction kinetics and precipitate volume fraction in AlMgSi alloys [21,25,26]. When compared to the TEM, APT, and DSC techniques, its merits are: (i) it is sensitive due to the high sensitivity of resistivity to even atomic-scale changes of the microstructure, such as solution atoms, defects, precipitates; (ii) there are no need of complicated sample preparation or sophisticated equipments like TEM system; and, (iii) samples used are much larger than those for HRTEM, APT or DSC, so that the accuracy would be better [26]. The existing resistivity investigations of AlMgSi alloys were mostly conducted after aging and samples were immersed in liquid nitrogen to keep a constant temperature during testing [21,22,23,24,25,26]. This would cause time interval between the precipitation and the measuring, including the heating and cooling process. Some information about the evolution of the precipitates would be missing, due to the high time and temperature sensitivity of the precipitation in AlMgSi alloys. Transients experienced by the sample also require serious attention, especially when the heating and cooling rates fluctuates.
In the present study, we proposed an in-situ electrical resistivity measuring method, which is much easier and of higher efficiency, for the real-time monitoring of the precipitation behavior of AlMgSi alloys. The sample temperature and electrical resistivity was continuously measured during the whole thermal course from quenching to natural or artificial aging. By this method, details of the precipitation process were analyzed. The relationship between the precipitation-induced resistivity variation during the artificial aging process, mechanical properties after aging, microstructure evolution, and the precipitation behavior was investigated. The industrial and scientific application feasibility of the proposed in-situ electrical resistivity measurement method for describing the precipitation behavior of the AlMgSi alloys was evaluated.

2. Materials and Methods

6063 aluminum profiles with composition of 0.55Mg-0.43Si-0.20Fe-0.001Cu-0.001Mn-0.004Cr-0.01Ti-banance Al (wt %) were used as raw materials. After extrusion, the profiles were immediately quenched from 530 °C to room temperature by the water spray system on the profile extruding machine. Then, they were stored for one month before conducting artificial aging. 150 °C, 175 °C, and 195 °C were selected as low, medium, and high artificial aging temperatures, which can also be considered as representative of the temperatures in industrial production.
Electrical resistance was measured during the whole artificial aging process, on 4 × 35 × 150 mm sheet samples cut from the profiles, by a four-point probe system, as shown in Figure 1. Four pure aluminum wires with 0.6 mm in diameter and 1000 mm in length were used as the probes. The probes were spot welded on the sample surface. For consistency, the welding voltage was kept constant to obtain solder points with the same size. A constant current of 100 mA was applied to the sample by the outside two probes. The resulting potential (in the scale of nano-volt) was measured by the inner two probes and recorded by a counting computer. Then, the sample resistance R under the testing distance was calculated by the relationship of R = U/I, where U and I stands of voltage and current respectively. Sample temperature was measured by a thermocouple inserted into a hole with diameter of 1.2 mm drilled on the sample surface. Microstructure and precipitate morphology of samples after aging were investigated through transmission electron microscopy (TEM) and high resolution TEM (HRTEM) observations. Specimens for TEM were first mechanically grinded to about 100 µm in thickness and then further thinned by twin-jet electro-polishing with a solution of 30 vol % nitric acid and 70 vol % methanol at −20 °C, 24 V and 80 mA. TEM observations were performed on a Tecnai F20 TEM system (FEI, Hillsboro, OR, USA) operated at 200 KV. To verify the consistency of the results, at least ten spots in different crystal grains were analyzed for each specimen. Mechanical strength and elongation of samples after aging were measured by uniaxial tensile testing, according to ASMT standards E8M-09. Standard dumbbell-type tensile specimens with gauge length of 60 mm and width of 10 mm were used. Tests were performed on an INSTRON-3382 tensile testing machine (Instron, Norwood, MA, USA) with a stretching speed of 1 mm/min. For each aging situation, three specimens were tested in order to verify the tensile results were in consistence.

3. Results

3.1. Resistance and Resistivity

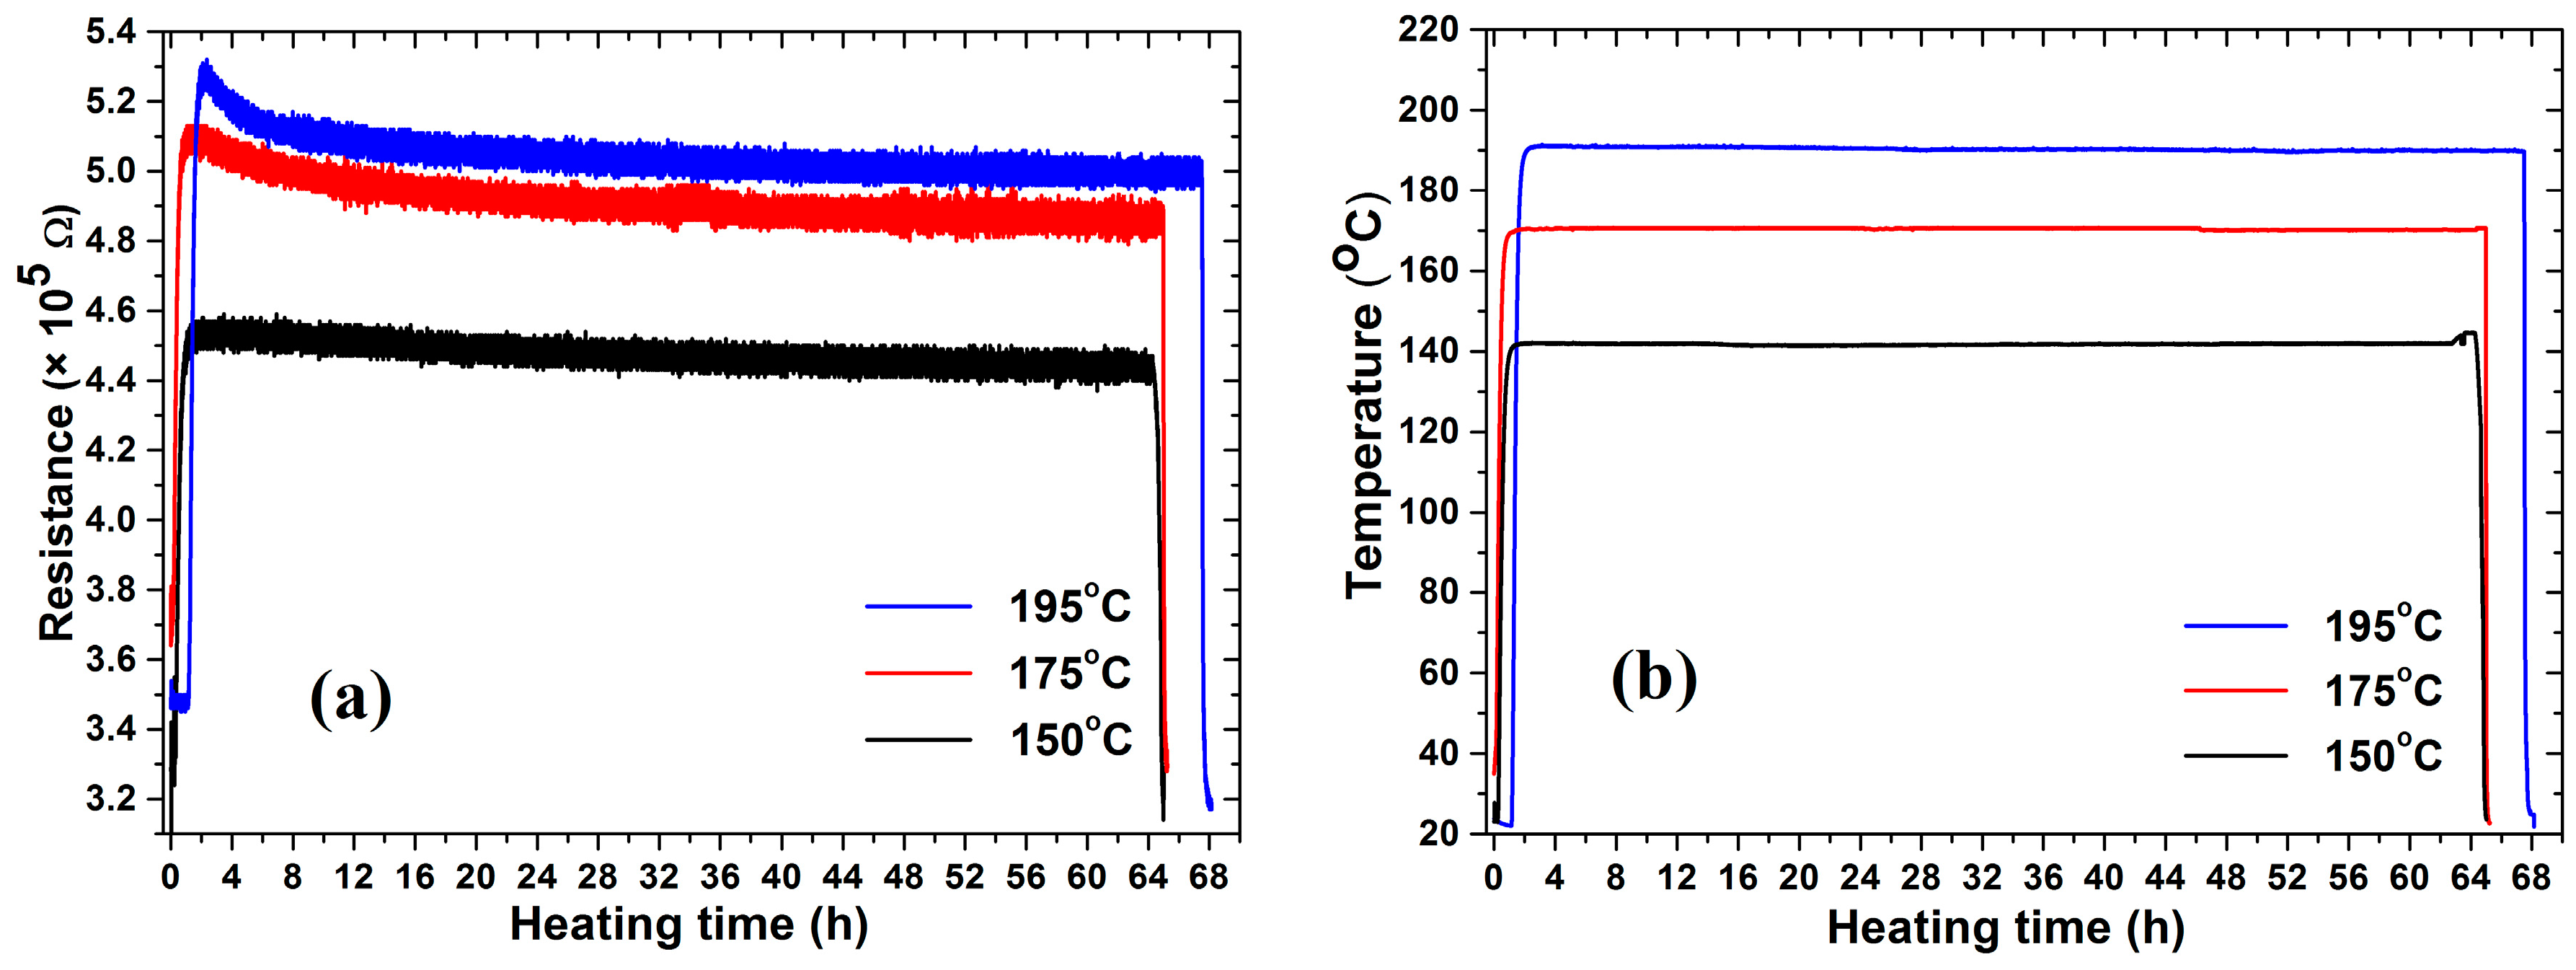
The real-time measured electrical resistance and sample temperature during the whole artificial aging process are shown in Figure 2. As shown in Figure 2a, the resistance sharply increased upon heating, and drastically decreased during cooling, a behavior that was caused by the temperature effect on the aluminum alloy matrix. After the aging temperature reached the pre-set value, the resistance gradually decreased as aging time was prolonged. During the aging process, the sample temperature was kept stable, as shown by Figure 2b.
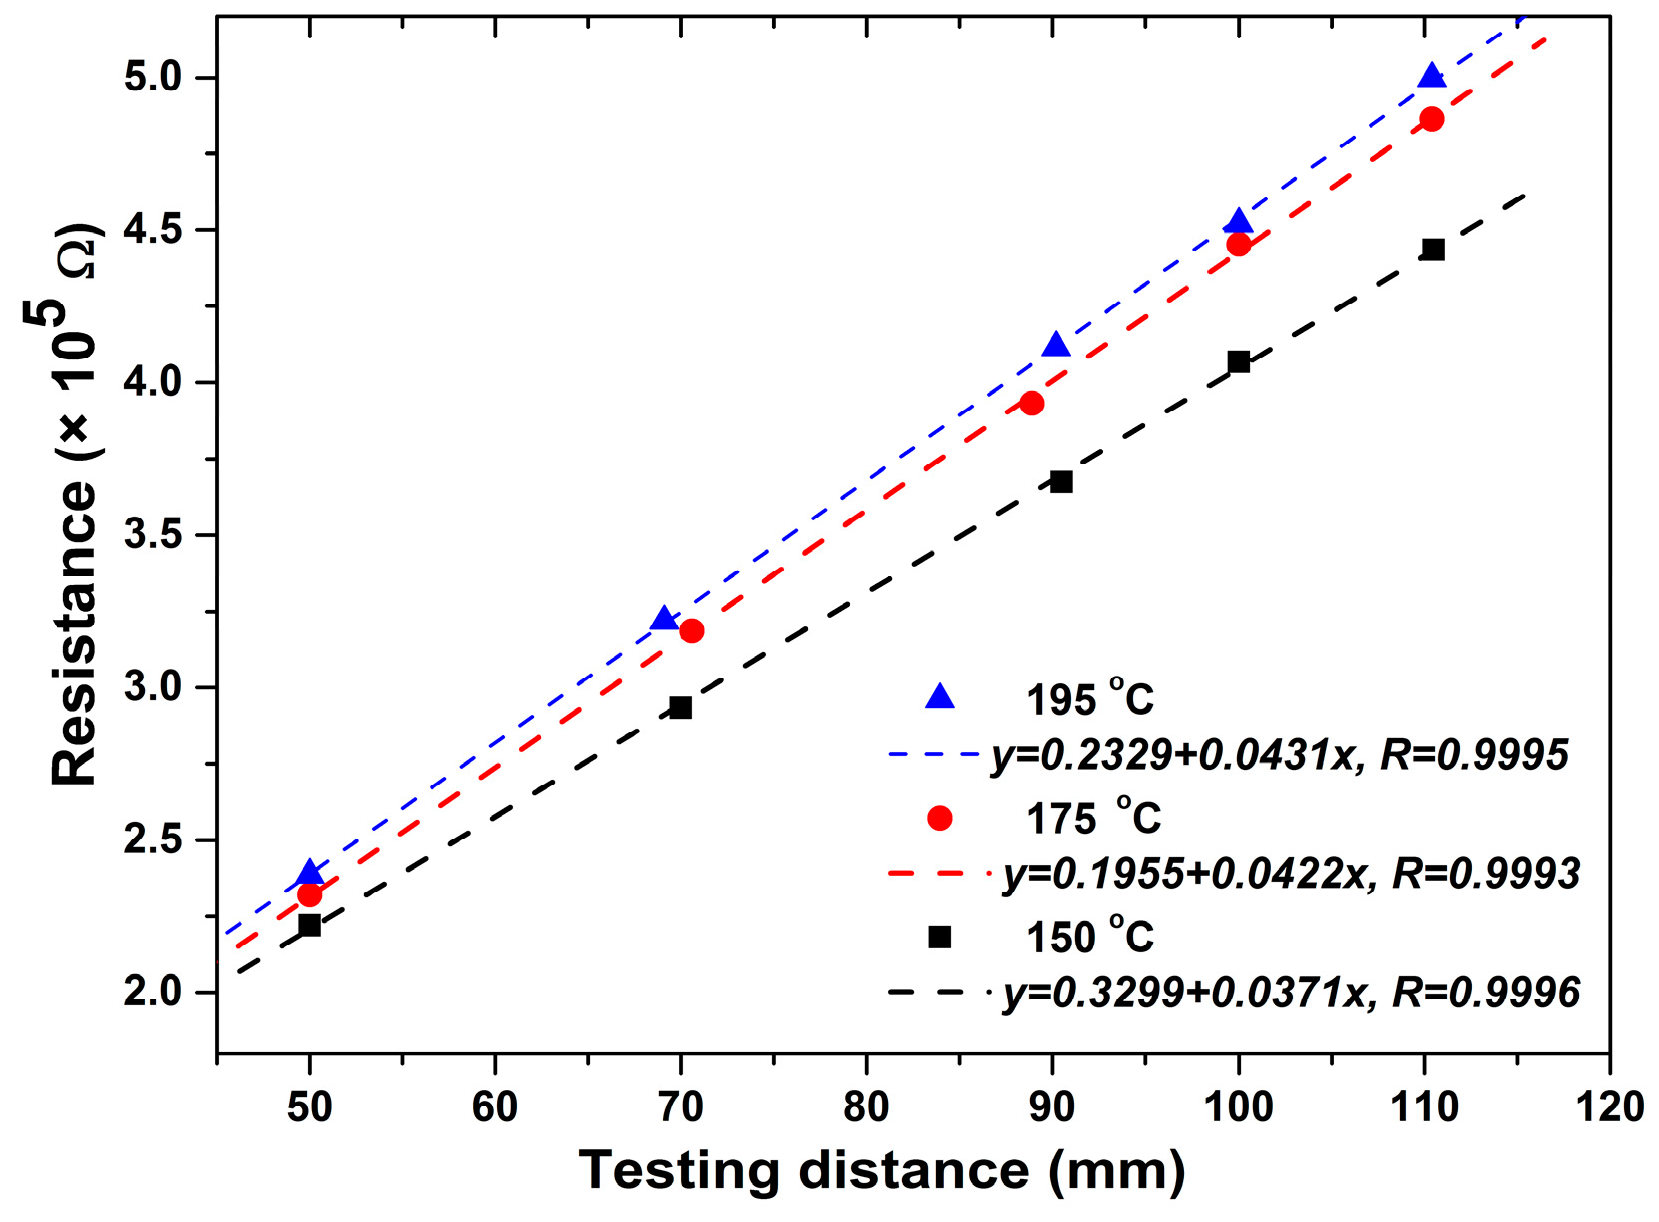
The real resistivity of the samples was calculated from the measured resistance and sample size values. The recorded resistance R comprises the system resistance of the instrument R0, contact resistance between the probes and sample Rc, and the real resistance of the sample Rs, as R = R0 + Rc + Rs. When the temperature reaches the pre-set value, the R0 and Rc can be considered to be constant. At a fixed temperature, the sample resistance Rs is proportional to the testing distance: Rs = ρsL/A, where ρs is the resistivity, L is the testing distance (namely the distance between the inner probes), A is the cross-sectional area of the sample. By varying the distance at the end of the aging process, series of total resistances R were obtained which should be proportional to the testing distances. Therefore, the fixed R0 and Rc value can be extracted from the intercept of linear fitting of the resistance values measured on different distances, as shown in Figure 3. By subtracting the R0 and Rc from R, the Rs was obtained. Then, the resistivity value was calculated using the expression ρs = Rs × A/L.
The variation of the resistivity with the aging time (in this case, the aging time is set as zero when the sample temperature reached the pre-set value) under different aging temperatures is shown in Figure 4. The electrical resistivity values are around several dozens of nΩ·m, which is in the same order of magnitude of those reported in the literature [24,25]. The resistivity of the samples continuously decreases with aging time, as in the case of the resistance value. By plotting the resistivity versus the logarithmic scale of the aging time, the curve was divided into two or three parts. In each part, the resistivity decreases linearly with the logarithmic scale of aging time, which has also been found in other studies [23,26]. In this way, the whole precipitation process was separated into two or three stages. It reflects that two or three different precipitation reaction types occurred. It can also be seen that these stages end at a different aging time. When the aging temperature is 195 °C and 175 °C, the first stage ends within 0.5 h and 1 h, respectively, while for 150 °C, it is prolonged to about 5 h. When the aging temperatures are 195 °C and 175 °C, the end of the second stage is after 4 h and 11 h, respectively. The end of the third stage, which seems to occur after a long time, is not clearly observed in the present study since the experimental aging time was limited to 60 h. Nevertheless, it can be easily concluded that, as expected, the sequence of reactions is faster when the temperature is higher.
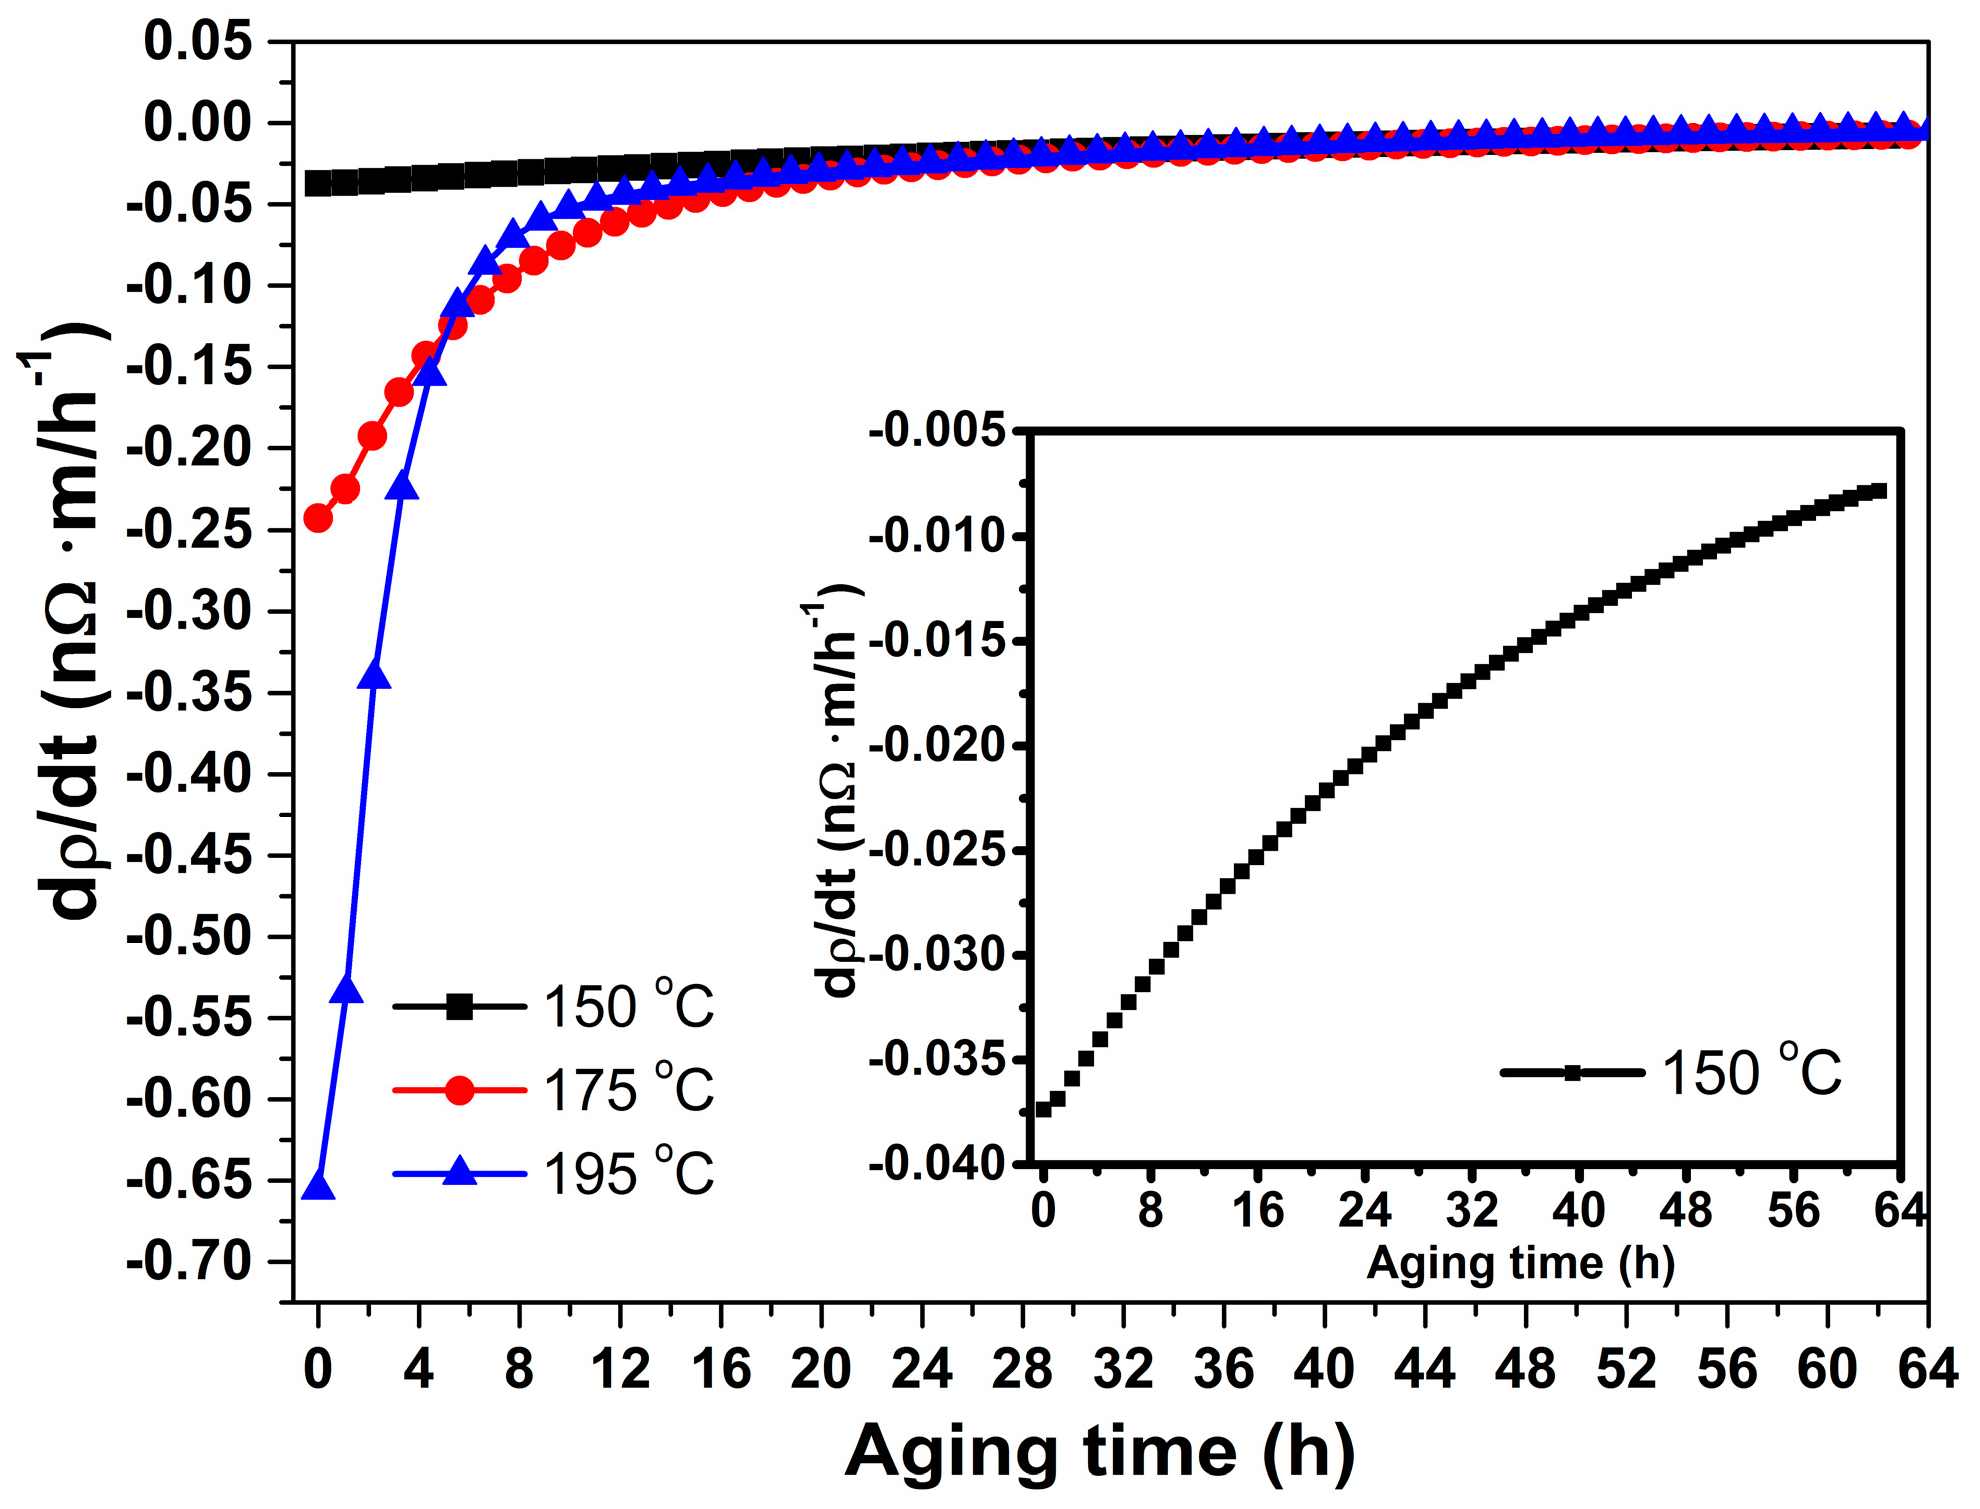
The derivative of the resistivity to the aging time, which would reflect the precipitation reaction rate, is shown in Figure 5. The figure shows that the reaction rate continuously decreases. When the aging temperature is 195 °C or 175 °C, the initial fast decrease in resistivity during the first stage, which comes at completion within several hours, is followed by a slower decrease in the second stage. The inflection point in the curves distinguishes the transition between the first and the second stages (4–6 h for 195 and 12–14 h for 175 °C, respectively). Such an obvious inflection point is not observed in the curve for 150 °C. The higher the aging temperature, the faster the initial decrease in resistivity. These phenomena should all be related to the precipitation type and reaction kinetics.

3.2. Mechanical Properties

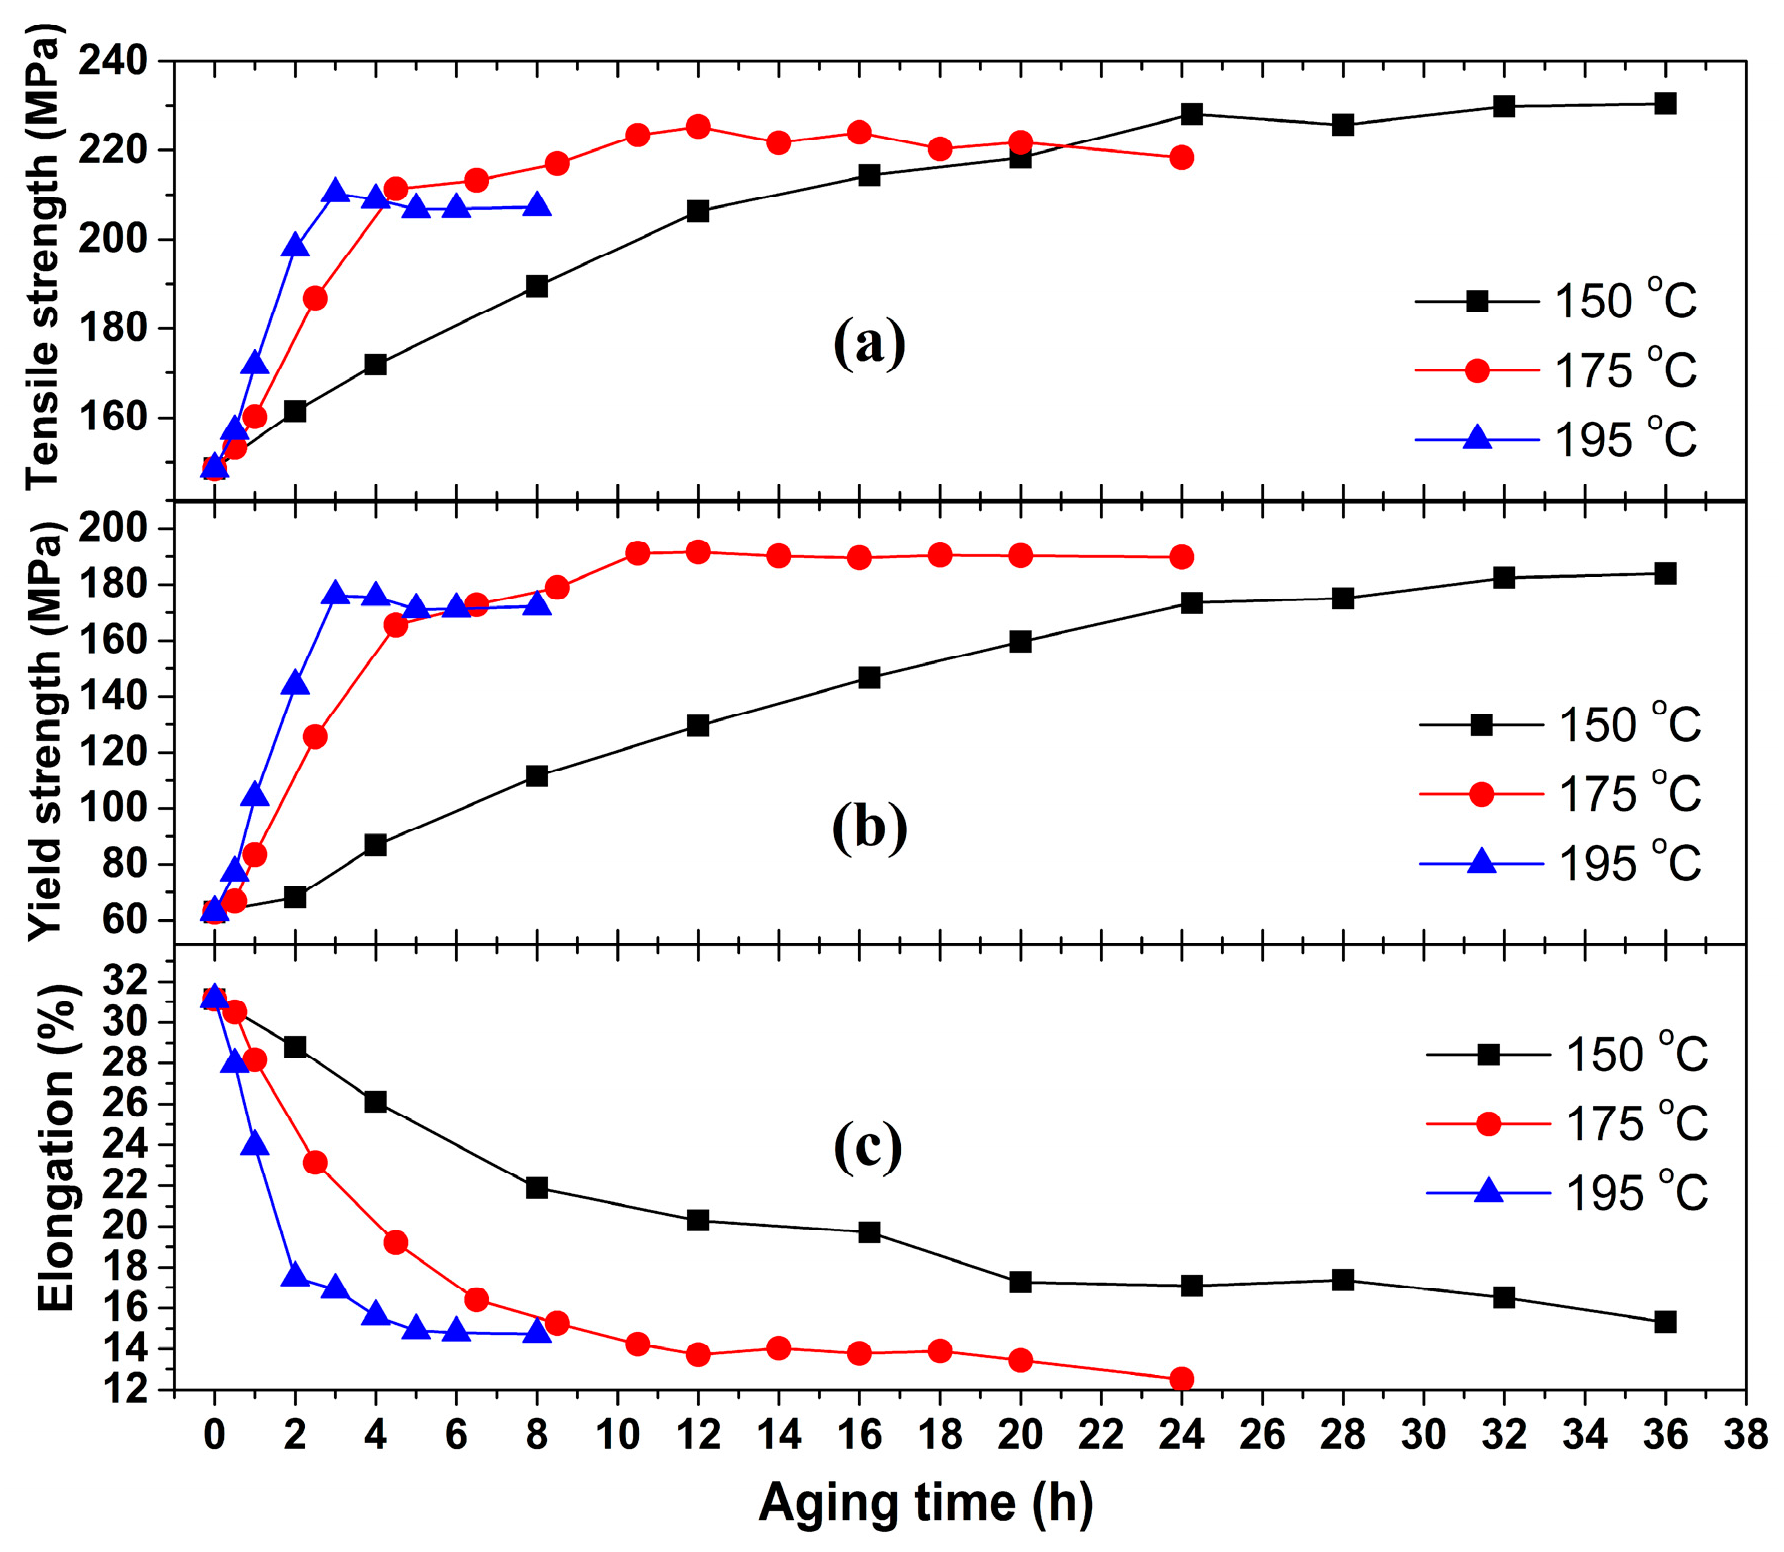
The relationship between the mechanical properties of the samples and aging temperature and time is shown in Figure 6. The tensile and yield strength firstly increase sharply with the aging time, and then reach a plateau at a maximum value, which is called peak aging strength. A slight decrease of the strength is observed for samples aged at 195 °C when aging time exceeds 4 h, which is called over aging phenomenon [28]. The time required for reaching the peak aging status, at the time when the strength reaches the maximum [28], is shorter when the aging temperature is higher (4 h for 195 °C, 11 h for 175 °C, and 36 h for 150 °C, designated as the peak aging time). The elongation values of the samples show continuous decrease in all the cases. It is also observed that the peak strength is higher when the aging temperature is lower, for example, the maximum tensile strength for samples aged at 150 °C reaches 231 MPa, while it is 209 MPa for those aged at 195 °C. These phenomena should all be related to the precipitation rate, phase type, number density, and size of the precipitates in the matrix [14,16,17], which have obvious different strengthening effects. This would be discussed together with the evolution of the microstructure of the precipitates.

3.3. Microstructure of Precipitates

The morphology of the precipitates in the samples after different stages of artificial aging were investigated by TEM. Representative bright field TEM and HRTEM images taken along the <100>Al zone axis are shown in Figure 7. Precipitates were all found to grow along <100> direction of Al matrix. For naturally aged samples without artificial aging, no evidence of large precipitates was found, as shown in Figure 7a. For artificially aged samples under different aging conditions, three kinds of precipitates were observed: spherical GP zones, needle-like β″ phase, and rod-like β′ phase, as shown in Figure 7b–f. In the sample not artificially aged, very small clusters is believed to exist in the matrix since the raw materials have been stored for one month, during which the materials must have undergone natural aging [12,21,22,23,24]. But, their total morphology is hard to be observed by ordinary TEM images in samples with such low alloy composition, and also due to their small size (around 1–3 m) and highly coherence with the matrix [1,2,10,11]. They are identified by their white contrast in the HRTEM images, as shown in Figure 7f. GP zones were observed to have spherical morphology and size of 3–5 nm in short time artificially aged samples. They can be seen also only in the HRTEM images. But, it was much easier since they have a little larger size and number density. Examples were shown by Figure 7b,g for the sample which has been aged at 175 °C for 1 h. The β″ phase and β′ phase were distinguished by their needle-like and rod-like morphology, respectively, and different contrast surroundings in the matrix, as described in the literature [3,11]. This was further verified by their monoclinic and hexagonal crystal structure, respectively [11], identified by HRTEM images, as shown in Figure 7h, taken from the sample aged at 175 °C for 24 h.
The phase type, size and number density evolution of different precipitates with artificial aging time at different temperatures were clearly reflected by the TEM images. After very short time of artificial aging at each selected temperature, also described as stage 1 in Figure 4, the precipitation process starts with the formation of GP zones and the beginning of transformation from GP zones to β″ phase. A typical image is presented in Figure 7b for the sample aged at 175 °C for 1 h. A large amount of GP zones and a little trace of β″ phase with length of about 20 nm were observed. As aging proceeds, the GP zones totally transformed to β″ phase. When the aging time prolongs to the peak aging status, also in the time range described as stage 2 in Figure 4, the β″ phase gradually coarsened. The length of the β″ phase particles in peak aged samples increased to 40–120nm, as shown in Figure 7c, for the sample aged at 195 °C for 3 h. The total number density of the precipitates also increased with aging time. It was verified by comparing TEM images for samples aged at the same temperature but for different aging times, the number density of β″ phase is obviously increased as the aging time increases. After the peak aging time at 175 °C and 195 °C, described as stage 3 in Figure 4, the length of some precipitates abnormally reached several hundreds of nanometers, and the morphology of precipitates became inhomogeneous, as shown in Figure 7d, for the sample aged at 175 °C for 24 h. β′ phase also starts to form. However, it is interesting to find that when aging temperature is 150 °C, the length of β″ phase still stays at the level of 15–30 nm, even when the aging time reaches 36 h, as shown in Figure 7e. The small β″ phase is homogenously distributed, and no β′ phase is found. This indicates that aging at lower temperature, 150 °C for example, has much lower coarsening and β′ phase formation kinetics.
It can be summarized from the TEM results: (i) GP zones form quickly at the early stage of artificial aging process; (ii) for peak-aged samples, the β″ phase is the main precipitate; (iii) as the aging processes, the number density of precipitates increases obviously; (iv) raising the artificial temperature promotes growth of the precipitates and formation of β′ phase; and, (v) the transformation from β″ phase to β′ phase is harder to occur at low temperature (150 °C) than at higher temperature (175 °C or 195 °C).

4. Discussion

All of the experimental results in present study confirmed the same precipitation sequence of AlMgSi alloys, as reported in the literature [27], which was either indirectly reflected in the resistivity measurement results and mechanical properties, or directly observed during the TEM analysis. This sequence is obviously related to the precipitate phase type, particle size, and reaction kinetics, since different precipitates contribute to the electrical resistivity and strengthening effect in a markedly different manner [21,25]. Therefore, the evolution of these precipitates during the whole artificial aging process, and the consistency of the experimental results will be discussed.

4.1. Precipitation and Phase Transformation Process

The precipitation and phase transformation process was well revealed by the resistivity variation curves, mechanical strength, and microstructure evolution. The whole artificial aging process is clearly divided into three stages, as reflected by Figure 4. Precipitate type and morphology, size, density etc. evolve in sequence, with typical characters as shown in Figure 7.
Formation and transition of the precipitates accounts for the variation of electrical resistivity. At the quenched and naturally aged state, the solute atoms exist in the matrix or in the form of clusters (consisted of several atoms), which have different electronic surroundings to the Al atoms, act as serious scattering centers for electron conducting. But, when precipitation occurs, the solute atoms were accumulated to form much larger precipitates. In this way, their electron scattering effect was weakened. Larger precipitates also affect the electron conduction, but it is not so obvious as clusters or solute atoms. As the precipitates grow up, their nearby distance becomes larger. In this way, it provides more convenient pathway for electron conduction and further decreases the resistivity [21,22,23,24,25]. Therefore, the sample has the highest electrical resistivity in the original state. As artificial aging begins, GP zones form quickly from solute atoms or clusters (as shown in Figure 7b), which leads to obvious decline of the resistivity. Therefore, the first stage in Figure 4 is characterized by the formation of GP zones. As aging further proceeds, GP zones, which are also considered as the pre-phase of β″ [1,8,13,27], transforms to the needle-like β″ phase. Since the size of β″ phase (at least 20 nm in length) is much larger than that of GP zones (2–5 nm in diameter), the total number of the precipitates decreases. This process further reduces the electrical resistivity. This process continues to the peak aging status, since the main precipitate is β″ phase for peak aging samples, as shown in Figure 7c. Thus, the second stage in Figure 4 is assigned to transition from GP zones to β″ phase. As the aging time is prolonged to the third stage, the rod-like β′ phase starts to precipitate by consuming the β″ phase, and both of the β″ and β′ phase start to coarsen, as shown by Figure 7d. The distance between neighboring precipitates is further increased, which would facilitate the passage of conducting electrons [23,25]. In this way, the coarsening of the precipitates also contributes to decline of the resistivity. Therefore, the resistivity continuously decreased during the whole artificial aging process, either by formation or phase transformation and coarsening of the precipitates. But, it is worth mentioning that the formation of β″ phase contribute to most decrease of the resistivity, while other transitions have not so obvious influence.
The evolution of the mechanical properties of samples after artificial aging is also related to the formation and phase transition of the precipitates. In the first two stages, the base material is mainly strengthened by small GP zone and/or β″ phase. But, in last stage, the precipitates greatly coarsened. It weakens the dislocation-particle interaction, and thus reduces the effectiveness of their strengthening effect [29,30]. At the early aging status, the precipitate sizes remain very small. The movement of dislocations when encountering precipitate obstacles is mainly in the shearing mode, which has excellent strengthening effect. The larger the amount of fine β″ phase the sample contains, the higher its strength. It shown consistently by the mechanical strength curves and TEM images, as the amount of fine β″ phase increased (before reaching peak-aging), the strength gradually increases. This accounts for the fact that the samples aged at 150 °C, i.e., in a condition that results in large amount of fine β″ phase, exhibit the highest peak strength. If the precipitates size (namely the aspect ratio) reaches and exceeds the critical particle radius, the dislocation movement transforms from the shearing to the bypassing mode, which has not so strong strengthening effect. Although the total number of precipitates increases, coarsening of the precipitates makes the dislocation by-pass easier. Therefore, for samples at the plateau or over-aged status, their strength increases not so obviously, or even decreases.
The evolution of the resistivity, strength, precipitate type and size shows an extremely good consistence. The fast increase in the strength-time curves corresponds to stage 1 and 2 in resistivity variation curves, during which GP zones form and then transform to β″ phase. The plateau in strength curves implies the aging process is in stage 3, in which transition of β″ phase to β′ phase and coarsening of both phases take place.

4.2. Precipitation Kinetics

The precipitation and phase transformation in AlMgSi alloys are atomic diffusion-controlled reaction. The atom diffusion is largely assisted by the spare vacancies, either reserved from quenching or intentionally designed [1,6,12,13,14,15,17]. Thus it is obviously driven by vacancy diffusion [1,6,12,13,14,15,17]. Activity of the vacancies greatly influences their diffusion and precipitation reaction kinetics, which is also related to temperature and the particular reaction. The resistivity curves in the present study reflect the precipitation kinetics well. Since the stages in the electrical resistivity and mechanical strength curves correspond to precipitation types, their variation trends stand for different reaction kinetics. The reaction kinetics is discussed in two situations: (i) for different reaction types at the same aging temperature; and, (ii) for individual reaction type at different aging temperatures.
The measured resistivity can be expressed by the following equation: ρ = ρ + i ρ i C i + j P j f j , where the ρ is the resistivity of the Al matrix at the measuring temperature; ρ i and C i are the specific resistivity and concentration of the ith solution atoms; P and f j is the scattering power and concentration of the jth precipitate with an average size in the microstructure of pure host metal [26]. The relationship between C i and f j can be expressed by C i = C o i N i f j , where the C o i and N i are the initial concentration of the ith solute atom and its equivalent number in jth precipitate. The precipitation process during artificial aging is considered to follow the Johnson-Mehl, Avrami, Kolmogorov (JMAK) kinetics model [11,12,13]: f r = 1 exp ( k t n ) , where f r is the relative fraction of the precipitate; k is temperature dependent rate constant; t is the aging time; and, n a numerical exponent for JMAK relationship. For the solution treated and T4 temper AlMgSi alloys, n is always assigned to be 1 [31,32,33,34]. In the present study, the original materials were quenched and then stored in room temperature, which equaled to the T4 temper, therefore, n is also considered to be 1. The constant k represents the reaction kinetics, which follows the Arrhenius model: k = k o exp ( Q / R T ) , where k o , Q, R and T are the pre-exponential constant, apparent activation energy related to the precipitation process, the universal gas constant and temperature, respectively [25,26,31,32]. Therefore, by re-arranging the above relations, the measured resistivity of the sample is found to be in linear relationship to the logarithmic scale of the aging time for an individual reaction, and the linear fitting slope containing the origination of k reflects the reaction kinetics.
As shown in Figure 4, the linear decreasing relationship of the resistivity to aging time represents three types of reactions. The slope of each linear fitting thus reflects the reaction kinetics. It can be seen that the slope for the second stage, which is attributed to formation of β″ phase, is the largest slope for all the curves. This implies that the transformation from GP zones to β″ phase has higher kinetics than other reactions. In the early state, formation of GP zones is determined by the response of clusters that contain large amount of solution atoms. Distance between the small clusters is small, and diffusion of these atoms is rather active, with the assistance of quenched in vacancies. However, it can be either dissolved into the matrix or acts as the nucleation site for GP zones growth [9,18]. In other words, the competition between the dissolution and nucleation processes slows down the formation of GP zones. Once there exists GP zones with size large enough, formation of β″ phase occurs fast. Other studies by DSC have also reported such phenomenon [18]. Therefore, for the first stage, even though the concentration of the clusters at this moment is pretty high, kinetics for formation of GP zones is lower than formation of β″ phase in the second stage. As the reaction comes to the third stage, the solution atoms in the matrix may have been all diffused into the precipitates, phase transition from β″ to β′ and size growing of the precipitates all depends on the atom diffusion rate without the assistance of vacancies. Therefore, this speed of this process is lowered down when compared to the formation of β″ phase. It is also observed in Figure 5. The differential of the resistivity to aging time becomes to be much lower for the last stage. Therefore, the formation of β″ phase have the highest kinetics that is facilitated by both vacancies and existing nucleation sites.
For the same kind of stages aged at different temperatures, the higher the temperature is, the higher kinetics it has. This is seen by the higher slope of the linear fitting of resistivity in Figure 4 and sharper variation rate of the derivation of the resistivity in Figure 5. It is much easier to understand that the atoms or vacancies have higher diffusion capacity under elevated temperatures. Therefore, for each individual reaction stage, it finishes in much shorter time at higher temperature. As a example, it can be seen in Figure 4, the formation of GP zones under 195 °C only takes about 0.5 h, but it requires 5 h when the temperature is 150 °C.

4.3. Accuracy and Application of the In-Situ Resistivity Measuring Method

The accuracy of the in-situ resistivity measurement method is evaluated by its data error level. As shown in Figure 3, when testing distance is 110 nm, the R0 and Rc comprises 4.66%, 4.41%, and 7.44% of R for 195 °C, 175 °C, and 150 °C, respectively. The proportion Rc in R should be some lower than these values. The testing error is mainly caused by the fluctuation of the welded contact surface between the probe and the sample (Rc). It can be further controlled to be even lower by increasing the testing distance. The linear fitting error stays at extremely low level below 0.1% (with fitting level higher than 99.9%). Therefore, the final testing data are confirmed to be highly trustable. The results also showed better accuracy and stability than those reported in the literature [21,22,23,24,25,26], since the data were in-situ and continuously recorded.
Further applications of the in-situ resistivity measuring method can be both industrial or scientific. On the one hand, it can be employed as a monitoring technique for aluminum profiles manufacturing enterprises. Insufficient aging in partial products that are located in some blind corners in the big industrial aging furnace is often encountered during practical experience. It may be caused by inhomogeneous temperature field, uneven heating, fluctuation of power, or other unknown reasons. It is troublesome because it is unpredictable before ending the aging process and after testing. The usual approach for compensating this problem is by conducting supplementary aging or re-aging, which is time and energy consuming. The method presented in this study would be an effective solution. By calibration of the resistivity of aged samples for any given alloy composition, their target mechanical properties can be marked. Therefore, using the in-situ resistivity measuring method, the aging status, and properties of the products can be monitored in real time. This way, the insufficient aging problem is eliminated. On the other hand, the measured resistivity data may also be useful for further quantitative analysis of the precipitation behavior or modeling of mechanical strength. For example, the relative volume fraction of the precipitates can be simply calculated by its initial, real-time, and final resistivity values (ρ0, ρt, ρf) through the expression: fr = (ρ0 − ρt)/(ρ0 − ρf) [29,31]. It is similar to those using the data obtained by DSC and isothermal calorimetry experiments [19,20]. Moreover, it is suggested that this method would be also useful for analysis of the cluster and GP zones evolution, since the variation of resistivity is highly related to them [24]. Together with other characterization techniques, APT, for example, quantitative investigations would be feasible.
Based on the above discussion, advantages of the in-situ resistivity measurement method are: (i) simplicity, because the sample is easy to prepared; (ii) convenience, no professional skills or sophisticated equipment is required for conducting the measurements, with trustable results in low testing error level; (iii) effectiveness, variation of the obtained resistivity data well reveals the trend of mechanical and microstructure evolution under different aging conditions; and, (iv) high efficiency, for a specific aging situation, only one sample is sufficient for different aging times, while in the reported method, a serial of samples is desirable [21,25].

5. Conclusions

In summary, the present work illustrates a detailed study of the precipitation process of AlMgSi alloys during artificial aging by proposing a simple, convenient, and effective real-time resistivity characterization method. The precipitation processes of AlMgSi alloys during artificial aging, namely formation of GP zones, transition from GP zones to β″ phase, transformation from β″ phase to β′ phase, and coarsening of both phases, were clearly separated into three stages based on the variation of the resistivity. Feasibility of monitoring the phase transformation and reaction kinetics of the precipitates by this technique has been proved. It has been revealed that the formation of β″ phase has the highest reaction kinetics. Formation of fine needle-like β″ phase before coarsening and transition to larger β′ phase contributes most to the mechanical strength. The proposed method is also recommended for both industrial and scientific applications like real-time monitoring technique for checking the aging completion degree in industrial production, characterization of the cluster and GP zones, and quantitative analysis or modeling of the precipitation process.

Acknowledgments

This work was supported by the National Key Research and Development Program of China [grant number: 2016YFB0101700], the National Natural Science Foundation of China [grant numbers: U1664252, 51475156].

Author Contributions

H.H. and L.L. conceived and designed the experiments; H.H., L.Z. and S.L. performed the experiments; H.H. and S.L. analyzed the data; X.W. contributed to discussion of the data and paper writing; H.Z. and L.L. contributed reagents/materials/analysis tools; H.H. and L.L. wrote the paper together.

Conflicts of Interest

The authors declare no conflict of interest.

References

  1. Zandbergen, M.W.; Xu, Q.; Cerezo, A.; Smith, G.D.W. Study of precipitation in Al-Mg-Si alloys by Atom Probe Tomography, I. Microstructural changes as a function of ageing temperature. Acta Mater. 2015, 101, 136–148. [Google Scholar] [CrossRef]
  2. Chen, J.H.; Costan, E.; Van Huis, M.A.; Xu, Q.; Zandbergen, H.W. Atomic pillar-based nanoprecipitates strengthen AlMgSi alloys. Science 2006, 312, 416–419. [Google Scholar] [CrossRef] [PubMed]
  3. Pogatscher, S.; Antrekowitsch, H.; Leitner, H.; Ebner, T.; Uggowitzer, P.J. Mechanisms controlling the artificial aging of Al-Mg-Si Alloys. Acta Mater. 2011, 59, 3352–3363. [Google Scholar] [CrossRef]
  4. Esmaeili, S.; Lloyd, D.J. Modeling of precipitation hardening in pre-aged AlMgSi(Cu) alloys. Acta Mater. 2005, 53, 5257–5271. [Google Scholar] [CrossRef]
  5. Saito, T.; Ehlers, F.J.H.; Lefebvre, W.; Hernandez-Maldonado, D.; Bjørge, R.; Marioara, C.D.; Andersen, S.J.; Mørtsell, E.A.; Holmestad, R. Cu atoms suppress misfit dislocations at the β″ Al interface in Al-Mg-Si alloys. Scr. Mater. 2016, 110, 6–9. [Google Scholar] [CrossRef]
  6. Werinos, M.; Antrekowitsch, H.; Kozeschnik, E.; Ebner, T.; Moszner, F.; Löffler, J.F.; Uggowitzer, P.J.; Pogatscher, S. Ultrafast artificial aging of Al-Mg-Si alloys. Scr. Mater. 2016, 112, 148–151. [Google Scholar] [CrossRef]
  7. Li, K.; Idrissi, H.; Sha, G.; Song, M.; Lu, J.B.; Shi, H.; Wang, W.L.; Ringer, S.P.; Du, Y.; Schryvers, D. Quantitative measurement for the microstructural parameters of nano-precipitates in Al-Mg-Si-Cu alloys. Mater. Charact. 2016, 118, 352–362. [Google Scholar] [CrossRef]
  8. Buchanan, K.; Colas, K.; Ribis, J.; Lopez, A.; Garnier, J. Analysis of the metastable precipitates in peak-hardness aged Al-Mg-Si(-Cu) alloys with differing Si contents. Acta Mater. 2017, 132, 209–221. [Google Scholar] [CrossRef]
  9. Marioara, C.D.; Andersen, S.J.; Jansen, J.; Zandbergen, H.W. The influence of temperature and storage time at RT on nucleation of the β″ phase in a 6082 Al-Mg-Si alloy. Acta Mater. 2003, 51, 789–796. [Google Scholar] [CrossRef]
  10. Wenner, S.; Marioara, C.D.; Ramasse, Q.M.; Kepaptsoglou, D.M.; Hagec, F.S.; Holmestada, R. Atomic-resolution electron energy loss studies of precipitates in an Al-Mg-Si-Cu-Ag alloy. Scr. Mater. 2014, 74, 92–95. [Google Scholar] [CrossRef] [Green Version]
  11. Li, K.; Béché, A.; Song, M.; Sha, G.; Lu, X.; Zhang, K.; Du, Y.; Ringer, S.P.; Schryvers, D. Atomistic structure of Cu-containing β″ precipitates in an Al-Mg-Si-Cu alloy. Scr. Mater. 2014, 75, 86–89. [Google Scholar] [CrossRef]
  12. Valiev, R.Z.; Murashkina, M.Y.; Sabirov, I. A nanostructural design to produce high-strength Al alloys with enhanced electrical conductivity. Scr. Mater. 2014, 76, 13–16. [Google Scholar] [CrossRef]
  13. Liu, C.H.; Lai, Y.X.; Chen, J.H.; Tao, G.H.; Liu, L.M.; Ma, P.P.; Wu, C.L. Natural-aging-induced reversal of the precipitation pathways in an Al-Mg-Si alloy. Scr. Mater. 2016, 115, 150–154. [Google Scholar] [CrossRef]
  14. Pogatscher, S.; Kozeschnik, E.; Antrekowitsch, H.; Werinos, M.; Gerstl, S.S.A.; Löffler, J.F.; Uggowitzer, P.J. Process-controlled suppression of natural aging in an Al-Mg-Si alloy. Scr. Mater. 2014, 89, 53–56. [Google Scholar] [CrossRef]
  15. Aruga, Y.; Kozuka, M.; Takaki, Y.; Sato, T. Effects of natural aging after pre-aging on clustering and bake-hardening behavior in an Al-Mg-Si alloy. Scr. Mater. 2016, 116, 82–86. [Google Scholar] [CrossRef]
  16. Li, H.; Liu, W. Nanoprecipitates and Their Strengthening Behavior in Al-Mg-Si Alloy during the Aging Process. Metall. Mater. Trans. A 2017, 48, 1990–1998. [Google Scholar] [CrossRef]
  17. Guo, M.X.; Sha, G.; Cao, L.Y.; Liu, W.Q.; Zhang, J.S.; Zhuang, L.Z. Enhanced bake-hardening response of an Al-Mg-Si-Cu alloy with Zn addition. Mater. Chem. Phys. 2015, 162, 15–19. [Google Scholar] [CrossRef]
  18. Esmaeili, S.; Lloyd, D.J. Characterization of the evolution of the volume fraction of precipitates in aged AlMgSiCu alloys using DSC technique. Mater. Charact. 2005, 55, 307–319. [Google Scholar] [CrossRef]
  19. Aouabdia, Y.; Boubertakh, A.; Hamamda, S. Precipitation kinetics of the hardening phase in two 6061 aluminium alloys. Mater. Lett. 2010, 64, 353–356. [Google Scholar] [CrossRef]
  20. Giersberg, L.; Milkereit, B.; Schick, C.; Kessler, O. In Situ Isothermal Calorimetric Measurement of Precipitation Behaviour in Al-Mg-Si Alloys. Mater. Sci. Forum 2014, 794, 939–944. [Google Scholar] [CrossRef]
  21. Esmaeili, S.; Lloyd, D.J.; Poole, W.J. Effect of natural aging on the resistivity evolution during artificial aging of the aluminum alloy AA6111. Mater. Lett. 2005, 59, 575–577. [Google Scholar] [CrossRef]
  22. Raeisinia, B.; Poole, W.J.; Lloyd, D.J. Examination of precipitation in the aluminum alloy AA6111 using electrical resistivity measurements. Mater. Sci. Eng. A 2006, 420, 245–249. [Google Scholar] [CrossRef]
  23. Seyedrezai, H.; Grebennikov, D.; Mascher, P.; Zurob, H.S. Study of the early stages of clustering in Al-Mg-Si alloys using the electrical resistivity measurements. Mater. Sci. Eng. A 2009, 525, 186–191. [Google Scholar] [CrossRef]
  24. Fallah, V.; Langelier, B.; Ofori-Opoku, N.; Raeisinia, B.; Provatas, N.; Esmaeili, S. Cluster evolution mechanisms during aging in Al-Mg-Si alloys. Acta Mater. 2016, 103, 290–300. [Google Scholar] [CrossRef]
  25. Esmaeili, S.; Poole, W.J.; Lloyd, D.J. Electrical Resistivity Studies on the Precipitation Behaviour of AA6111. Mater. Sci. Forum 2000, 331–337, 995–1000. [Google Scholar] [CrossRef]
  26. Esmaeili, S.; Vaumousse, D.; Zandbergen, M.W.; Poole, W.J.; Cerezo, A.; Lloyd, D.J. A study on the early-stage decomposition in the Al-Mg-Si-Cu alloy AA6111 by electrical resistivity and three-dimensional atom probe. Philos. Mag. 2007, 87, 3797–3816. [Google Scholar] [CrossRef]
  27. Edwards, G.A.; Stiller, K.; Dunlop, G.L.; Couper, M.J. The precipitation sequence in Al-Mg-Si alloys. Acta Mater. 1998, 46, 3893–3904. [Google Scholar] [CrossRef]
  28. Siddiqui, A.R.; Abdullah, H.A.; Al-Belushi, K.R. Influence of aging parameters on the mechanical properties of 6063 aluminium alloy. J. Mater. Process. Technol. 2000, 102, 234–240. [Google Scholar] [CrossRef]
  29. Liu, G.; Zhang, G.J.; Ding, X.D.; Sun, J.; Chen, K.H. Modeling the strengthening response to aging process of heat-treatable aluminum alloys containing plate/disc- or rod/needle-shaped precipitates. Mater. Sci. Eng. A 2003, 344, 113–124. [Google Scholar] [CrossRef]
  30. Myhr, O.R.; Grong, Ø.; Andersen, S.J. Modelling of the age hardening behaviour of Al-Mg-Si alloys. Acta Mater. 2001, 49, 65–75. [Google Scholar] [CrossRef]
  31. Luo, A.; Lloyd, D.J.; Gupta, A.; Youdelis, W.V. Precipitation and dissolution kinetics in Al-Li-Cu-Mg alloy 8090. Acta Mater. 1993, 41, 769–776. [Google Scholar] [CrossRef]
  32. Esmaeili, S.; Lloyd, D.J.; Poole, W.J. Modeling of precipitation hardening for the naturally aged Al-Mg-Si-Cu alloy AA6111. Acta Mater. 2003, 51, 3467–3481. [Google Scholar] [CrossRef]
  33. Cluff, D.R.A.; Esmaeili, S. Prediction of the effect of artificial aging heat treatment on the yield strength of an open-cell aluminum foam. J. Mater. Sci. 2008, 43, 1121–1127. [Google Scholar] [CrossRef]
  34. Raeisinia, B. A Study of Precipitation in the Aluminum Alloy AA6111. Master’s Thesis, Tehran University, Tehran, Iran, 2000. [Google Scholar]
Figure 1. A sketch of the experimental set up for resistance measuring of the sample.
Metals 08 00039 g001
Figure 2. Resistance and sample temperature measurement results: (a) variation of the resistance during the whole aging process; and (b) sample temperatures during the whole aging process.
Metals 08 00039 g002
Figure 3. Resistance value of the samples R at the end of aging process measured on different distances and their linear fittings.
Metals 08 00039 g003
Figure 4. Variation of the resistivity of the samples with aging time under different temperature.
Metals 08 00039 g004
Figure 5. Differentiation of resistivity to aging time under different aging temperature. The inset figure is a magnified picture of the curve for samples aged at 150 °C.
Metals 08 00039 g005
Figure 6. Relationship between the mechanical properties of the samples, aging temperature and aging time (a) tensile strength; (b) yield strength; and, (c) elongation.
Metals 08 00039 g006
Figure 7. TEM images of the microstructures of selected samples aged at different temperatures and aging times: (a) naturally aged (NA) sample without artificial aging; (b) 175 °C for 1 h; (c) 195 °C for 3 h; (d) 175 °C for 24 h; (e) 150 °C for 36 h; and, (fh) HRTEM images taken from (a,b,d), respectively.
Metals 08 00039 g007