Article

On the Mn–C Short-Range Ordering in a High-Strength High-Ductility Steel: Small Angle Neutron Scattering and Ab Initio Investigation

by
Wenwen Song
1,*,
Dimitri Bogdanovski
2,
Ahmet Bahadir Yildiz
3,†,
Judith E. Houston
4,
Richard Dronskowski
2,5 and
Wolfgang Bleck
1
1
Steel Institute, RWTH Aachen University, Intzestraße 1, 52072 Aachen, Germany
2
Institute of Inorganic Chemistry, RWTH Aachen University, Landoltweg 1, 52074 Aachen, Germany
3
Department of Materials Science and Engineering, KTH Royal Institute of Technology, Brinellvägen 23, S-100 44 Stockholm, Sweden
4
Jülich Centre for Neutron Science (JCNS) at Heinz Maier-Leibnitz Zentrum (MLZ), Forschungszentrum Jülich GmbH, Lichtenbergstraße 1, 85748 Garching, Germany
5
Jülich-Aachen Research Alliance (JARA-HPC), RWTH Aachen University, 52056 Aachen, Germany
*
Author to whom correspondence should be addressed.
The author did the research work in the Steel Institute at RWTH Aachen University, Germany, and is currently working in the Department of Materials Science and Engineering at KTH Royal Institute of Technology, Sweden.
Metals 2018, 8(1), 44; https://doi.org/10.3390/met8010044
Submission received: 29 November 2017 / Revised: 3 January 2018 / Accepted: 5 January 2018 / Published: 10 January 2018
(This article belongs to the Special Issue First-Principles Approaches to Metals, Alloys, and Metallic Compounds)

Abstract

:
The formation of Mn–C short-range ordering (SRO) has a great influence on the mechanical properties of high-Mn steels. In the present work, the formation of Mn–C SRO during recrystallization of an X60Mn18 steel was investigated by means of a combined study employing small angle neutron scattering (SANS) and ab initio ground-state energy calculations based on density-functional theory. The SANS measurements prove the presence of Mn–C SRO in the recrystallization annealed X60Mn18 steel and indicate the evolution of the SRO during recrystallization. The results show that with the increase in annealing time, the mean size of the Mn–C SRO decreases, whereas the number density increases. The ab initio calculations well describe the energetically favored condition of Mn–C SRO and provide the theoretical explanation of the clustering formation and evolution in the X60Mn18 steel. The stress-strain curve of the X60Mn18 steel exhibits a high strain-hardening rate and the plastic deformation is characterized with a series of serrations during a uniaxial tensile test. In the end, the correlation between Mn–C SRO and the serrated flow of high-Mn steels is further discussed.

Graphical Abstract

1. Introduction

High-Mn (15–30 wt %) austenitic steels are well known for their high ultimate tensile strength over 1000 MPa and total elongation over 60% at room temperature [1,2,3,4]. Due to the excellent strain hardening of the high-Mn steels, the superior combination of high strength and ductility makes these steel grades a good choice for the automotive industry for the manufacture of complex body geometries, yielding improved crashworthiness and reduced weight at the same time [5,6,7]. A unique characteristic of high-Mn steels is the significant serration phenomenon (jerky flow) during deformation. These serrations strongly influence the mechanical properties of the materials, for example, they increase the flow stress, the tensile strength and the work hardening rate, etc.
The strain-hardening behavior of high-Mn steels, particularly of the X60Mn18 steel, is mainly explained by the dynamic Hall-Petch effect, dislocation evolution and dynamic strain aging (DSA) [2,4,8,9,10,11,12,13]. During the deformation of high-Mn steels, the formation of twins occurs with an increasing number of twin boundaries. As in the case of grain boundaries, the twin boundaries behave like obstacles against the movement of dislocations, decrease the dislocation mean free path and promote dislocation accumulation [4,14,15]. The serrated stress-strain curves are the main indicator of the DSA mechanism. It has been suggested that DSA in Fe–Mn–C steels involves the interaction of dislocations [4,16,17] and stacking fault regions [12,13] with point defect complexes that include interstitial C.
The formation and motion of DSA-caused Portevin-Le Chatelier (PLC) deformation bands result in a serrated flow and underline the deformation mechanism [13]. It is widely known that the serration flow is correlated with the presence of Mn–C agglomerations/short-range ordering (SRO) and their interactions with dislocations in steels. Although the serration phenomenon and DSA effect have been discussed for a long time, little experimental work on Mn–C SRO has been reported so far. In particular, the mechanism of formation of this type of SRO and its evolution during the annealing process, which is very important for the explanation of the serrated stress-strain behavior of high-Mn steels, is so far unknown. Due to the very fine scale of SRO at the atomic level and the consequent technical difficulties in performing experimental measurements, there is very limited information on the SRO in literature. The characterization of the Mn–C SRO using atom probe tomography (APT) requires complicated sample preparation procedures and comes with a significant statistical error due to the limited probe size [18,19]. Marceau et al. [18] stated the difficulties in analyzing the short-range ordered clusters in Fe–Mn–C steels, such as the correlated field evaporation of interstitial C, detection of C as a molecular ion species, and surface migration of C (directional walk). In contrast, small angle neutron scattering (SANS) makes it possible to characterize the nano-sized SRO/short-range clusters (SRC) in the mm3 volume range.
In the present work, the formation of Mn–C SRO during recrystallization of the X60Mn18 steel was investigated by means of a combined method of SANS and ab initio ground-state energy calculations. The Mn–C SRO was analyzed by SANS in terms of particle size, size distribution, and volume fraction. In order to investigate the local atomic environment of C and to identify the favorable arrangements on an atomistic level, density-functional theory (DFT) calculations were performed for a model system with a chemical composition close to the investigated steel. The present study validates the assumptions drawn from the generalized ab initio models of the Mn–C SRO in high-Mn steels and compares the local and atom-resolved ordering information extracted from the experiments. In the end, the correlation between Mn–C SRO and the serrated flow of the recrystallized X60Mn18 steel is further discussed.

2. Material and Methods

2.1. Material

The investigated X60Mn18 high-Mn steel was cast into an ingot. Hot forging was subsequently carried out at 1423 K (1150 °C). The forged ingot was then homogenized at 1423 K (1150 °C) for 5 h. Then the material was hot rolled, and cold rolled with a thickness reduction of ≈50%. Table 1 lists the chemical composition of the investigated material. The specimens used for the ex-situ SANS measurements and mechanical testing were cut from the 1.5 mm thick cold rolled sheets. In order to compare the impact of annealing duration on the Mn–C SRO formation, the specimens were recrystallization annealed in a salt bath at 800 °C for 2 min and 30 min, followed by quenching in water to room temperature. The tensile tests were carried out using a screw-driven ZWICK Z100 machine (Zwick GmbH & Co. KG, Ulm, Germany) with a strain rate of 0.001 s−1. A mechanical strain gauge with a 30 mm gauge length was used to measure the specimen strain.

2.2. Small Angle Neutron Scattering (SANS)

2.2.1. SANS Technique

SANS is a well-established, non-destructive method to obtain structural information about the arrangement of atoms and magnetic moments on a mesoscopic scale, from near atomic (nanometer) to near optical (micrometer) sizes, in condensed matter systems and materials from a wide range of applications. Such arrangements may be macromolecules [20], self-assembled polymeric systems [21], biomolecular aggregates [22], precipitates and SRO in metallurgical materials [23,24] or porosities in geological and construction materials [25]. Neutrons interact with matter via short-range nuclear interactions and, thus, detect the nuclei in a sample rather than the diffuse electron cloud observed by X-rays. Therefore, unlike X-rays, neutrons are able to “see” light atoms in the presence of heavier ones and distinguish neighboring elements more easily. In magnetic samples, neutrons are additionally scattered by magnetic moments associated with the unpaired electron spins (dipoles) and, thus, can observe magnetic structures and correlations when the samples are placed in a saturating magnetic field.
In SANS the “visibility” of a selected constituent in a complex system depends upon the contrast—the squared difference between its scattering length density (magnetic or nuclear) and that of the other components [26]. Thus, the visibility of the particles, P , embedded in a matrix, M , depends on the particles’ contrast, given by:
Δ ρ P 2 = ( ρ P ρ M ) 2 = ( i atoms   in   P b i P ν P i atoms   in   M b i M ν M ) 2
where b i M denotes the scattering length of different atoms in M , b i P represents those of the atoms in P , and ν M and ν P are the effective volumes occupied by the objects composed of the atoms in the respective sums.
The contrast in a multicomponent system can typically be estimated in a direct way based on the composition information obtained during sample preparation. On the other hand, the contrast in a complex material can be manipulated by isotopic substitution, without changing the macroscopic properties of the material. This means that matching and variation of contrast of different components of the material can be achieved to enable separate analysis of selected components or regions within complex morphologies.
Finally, SANS has the advantage of being non-destructive and of providing information with high statistical accuracy due to averaging over a macroscopic sample volume. In many cases, the small absorption of neutrons allows for the investigation of thick samples as well as the use of bulky ancillaries for studying the materials under special conditions, such as very low or very high temperature, magnetic field or high pressure.
The information in SANS experiments is contained in the neutron scattering intensity measured as a function of the momentum transfer, q , given by:
q = k i k f ; q = 4 π λ sin θ
where k i and k f are the incoming and the outgoing neutron wave vectors, λ is the neutron wavelength and θ is the half scattering angle.
Scattering experiments explore matter in reciprocal space: large q values relate to short distances, while small q values relate to larger structures. To observe the mesoscopic scale, SANS is optimized at small scattering angles using long wavelength (cold) neutrons. The contribution to the scattering intensity at angle θ from some scatterers is given by:
I ( θ ) = T I 0 d σ d Ω Δ Ω
where I ( θ ) is the intensity scattered into one detector element, Δ Ω the solid angle covered by that element, I 0 the incoming neutron flux, and T the sample transmission. The structural information on the sample is contained in the microscopic differential cross-section d σ / d Ω , which is the Fourier transform of the scattering length density distribution Δ ρ ( r ) .
The scattering data are obtained as a microscopic differential cross-section d σ / d Ω on an absolute scale, in cm−1, after normalization of the macroscopic differential cross-section by the sample volume and a comparison with scatterers of a known absolute cross-section (standard samples).

2.2.2. SANS Experiments

Ex-situ SANS experiments were carried out in the KWS-2 beamline of the Heinz Maier-Leibnitz Centre (MLZ) at the FRM II reactor in Garching, Munich [27]. The instrument is optimized for the exploration of the wide momentum transfer q range between 1 × 10⁻³ nm−1 and 5 nm−1 by combining classical pinhole, focusing (with lenses) and time-of-flight (with chopper) methods, while simultaneously providing high neutron intensities with an adjustable resolution [27]. A neutron beam with a wavelength λ of 0.5151 nm and a wavelength spread Δ λ / λ = 0.2 was used. The scattering vector q ( q = 4 π sin θ / λ , where θ is the half scattering angle) [28] range of 0.085 nm−1 to 4.2 nm−1 was achieved with two different sample-to-detector distances (2 m and 8 m) and 8 m collimation length. This q range allows the characterization of the scatterer size D ( D 2 π / q ) which ranges between approximately 1 nm and 70 nm. The total measurement durations were set as 30 min and 60 min at 2 m and 8 m sample-to-detector distances, respectively. These experiment durations enabled the achievement of a total number of scattering counts in excess of 1 million. The transmission values were measured at 20 m collimation and 8 m sample-to-detector distances for 60 s.

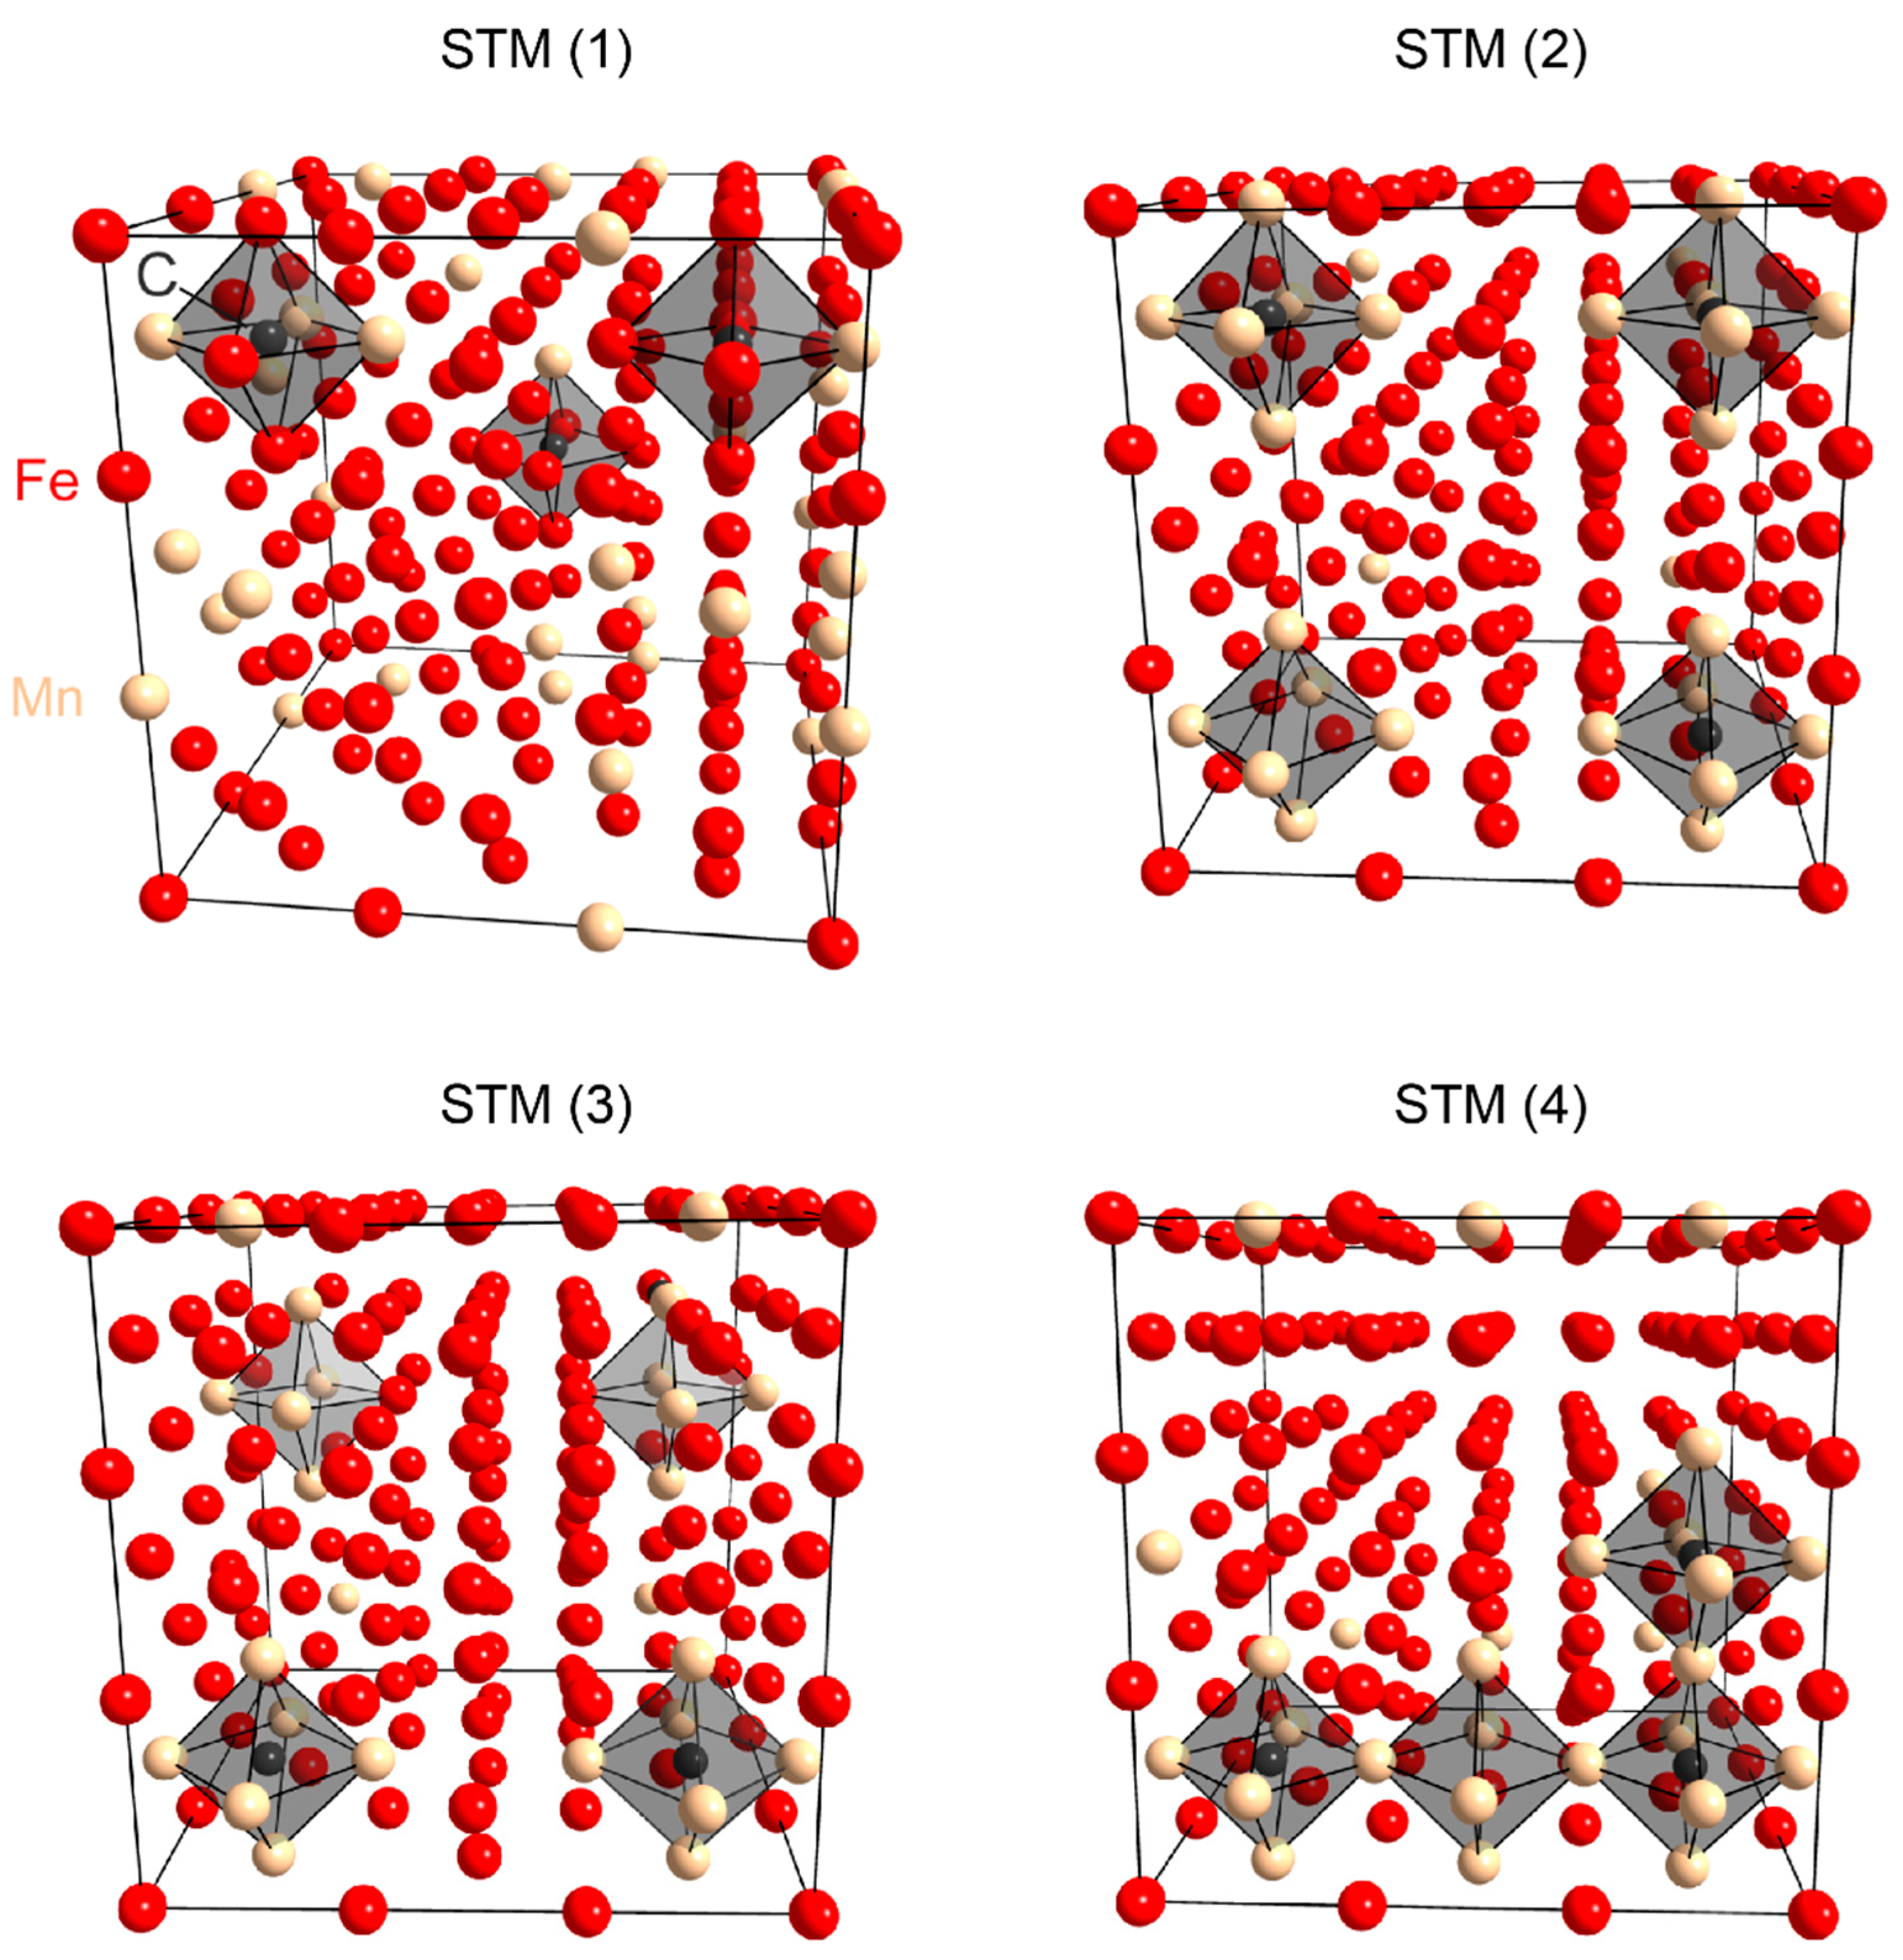
2.3. Structural Models and Ab Initio Computational Details

To approximate the experimental composition as closely as possible, Fe88Mn20C3 was chosen as the model system for the ab initio calculations. This structure was modeled as a 3 × 3 × 3 supercell of fcc (face-centered cubic)-Fe (space group F m 3 ¯ m ), resulting in an fcc-Fe matrix consisting of 108 atoms, with 20 of the Fe-atoms then replaced by Mn. The three C atoms occupy interstitial sites that correspond to the central octahedral void in the original fcc-Fe unit cell, thus increasing the total atomic count to 111. Employing this model, the composition of the system arrives at approximately 79.3 at % Fe, 18.0 at % Mn and 2.7 at % C, corresponding to respective values of approx. 81.2 wt %, 18.2 wt % and 0.6 wt %, reflecting sample composition reasonably well.
Four distinct structural models (further referred to as STM) were considered in respect to the Mn distribution, and they are shown in Figure 1: a “disordered” structure approximating a random Mn distribution (STM 1) and three different “ordered” structures. In the latter case, Mn6 octahedra coordinate the interstitial sites serving as potential carbon locations, the Mn6C element being an energetically favorable structural motif [29,30] corresponding to the aforementioned Mn–C SRO. This octahedral arrangement of Mn as the nearest neighbor to C, located in the 1st coordination shell (CS) of the latter, has been shown to be energetically favored in prior studies [30]. On the other hand, the cubic arrangement of Mn as a second-nearest neighbor to C, i.e., in the 2nd CS, is disfavored, while arrangements with Mn located in further shells have no energetic impact. Taking these considerations into account, the models for the three “ordered” STMs were restricted to the favored octahedral 1st CS arrangement. Said ordered STMs differ in the spatial arrangement of Mn atoms: in the first case, four Mn6 octahedra are located in one plane in the individual corners of the unit cell (STM 2). In the second case, two groups of two octahedral units each are diagonally opposed to each other, with one group comprising Mn6 octahedra and the other actually consisting of Mn5Fe octahedra due to stoichiometry constraints (STM 3). In the third case, three corner-sharing octahedra propagate along the [100] direction, with a fourth corner-sharing Mn6 octahedron located orthogonally to that axis, forming a rough “Γ” shape (STM 4). Considering translational symmetry, the ordered structures thus model closely packed groups of Mn6 octahedra (corner-sharing tetramers) with several “layers” of Fe between them (STM 2), more evenly distributed groups of chemically slightly distinct dimers (2 × Mn6 and 2 × Mn5Fe) (STM 3) and linear chains of Mn6 octahedra along one crystallographic direction with regular “branches” (STM 4), respectively. It should be noted that these models were selected under the constraint of computational feasibility, based on known data on attractive Mn–C and repulsive C–C interactions [30,31], in which inter-atom distance, and thus distribution, is a key factor. A full sampling of statistically possible configurations requires a multitude of different environments, larger cells and usage of mesoscopic methods, and this is presently outside the scope of an atomistic ab initio approach.
Full structural optimizations of all systems were performed via density-functional theory (DFT) calculations using the Vienna ab initio Simulation Package (VASP, version 5.4.1, Computational Materials Physics, University of Vienna, Vienna, Austria, 2015) [32,33], employing the projector-augmented wave (PAW) method [34,35] for basis set representation, with the energy cut-off set to Ecut = 500 eV. Exchange and correlation effects were accounted for using the generalized gradient approximation (GGA) within DFT as parametrized in the well-established functional by Perdew, Burke and Ernzerhof (PBE) [36]. The generation of the k-mesh for partitioning and integration of the Brillouin zone was performed with the Monkhorst-Pack scheme [37], employing a 4 × 4 × 4 grid. Partial occupancies were considered using the Methfessel-Paxton scheme [38] of order 2 with the smearing width set to σ = 0.15 eV. The disordered structural model was generated using the special quasirandom structure (SQS) method [39] as implemented in the Alloy Theoretic Automated Toolkit (ATAT, version 3.36, Axel van de Walle, 2017) package [40,41]. All simulations were performed for a non-spin-polarized case, which approximates a paramagnetic model under standard conditions reasonably well [42]; while approaches explicitly modeling paramagnetism such as the disordered local moment (DLM) model [43] are somewhat more accurate, they are typically much more demanding in terms of computation and thus were not employed here due to the system size involved. Both fcc-Fe and all allotropes of Mn are antiferromagnetic in the ground state, but their respective Néel temperatures lie well below room temperature [44,45]; thus, the non-spin-polarized case is a very good approximation for the purposes of this study. Nevertheless, it must be pointed out that magnetic effects, which may be relevant in the ground state, are, by necessity, neglected here. While their relevance is difficult to quantify, independent calculations on related Fe–Mn–Al–C κ carbides [46] suggest that the effect of magnetism on structural properties is limited, especially if qualitative trends are considered.

3. Results

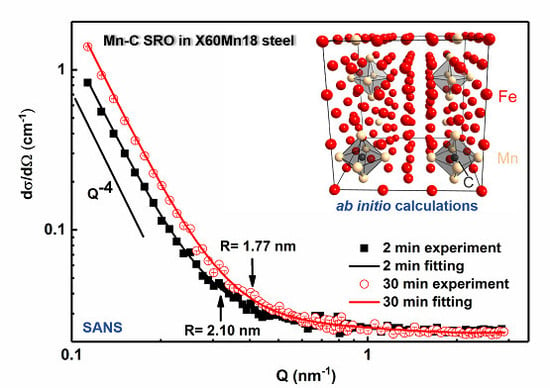
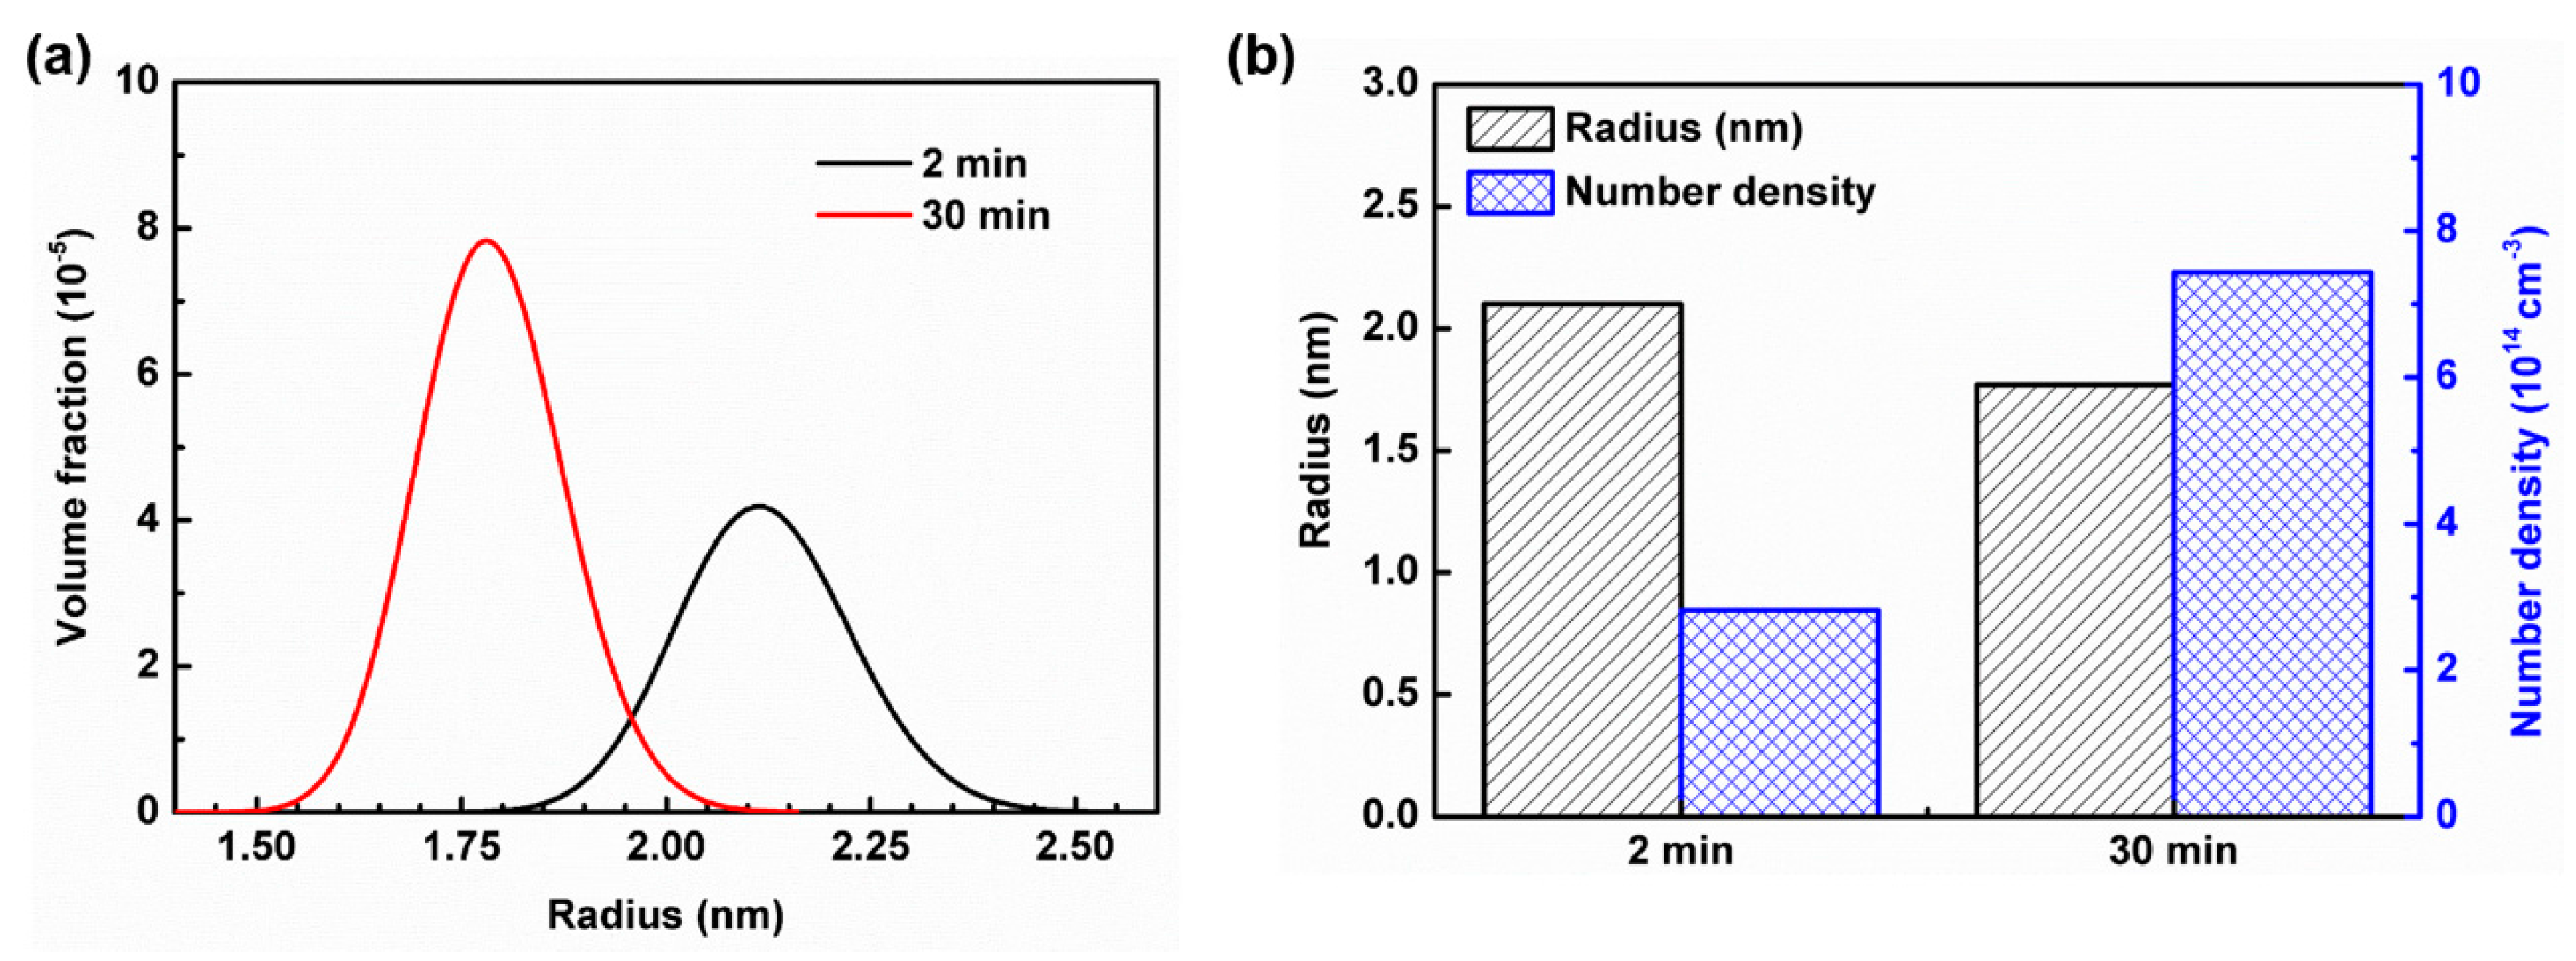
3.1. Small Angle Neutron Scattering (SANS)

The model-based analysis of the ex-situ SANS scattering patterns using SASfit [47] reveals the presence of Mn–C SRO a few nanometers in size. The evolution of the mean cluster radius and number density of clusters per cubic centimeter was analyzed. The results showed that with the increase in recrystallization annealing time from 2 min to 30 min, the size of the Mn–C SRO decreased, while the number density increased. Figure 2 shows the SANS scattering curves of the X60Mn18 steel recrystallization annealed at 800 °C for 2 min and 30 min. The average cluster radius decreased from 2.10 nm (2 min) to 1.77 nm at the end of 30 min recrystallization annealing.
The evolution of the Mn–C SRO volume fraction distributions for the 2 min and 30 min annealed samples is shown in Figure 3. An increment in the annealing duration of non-deformed samples caused: (i) a shift of the cluster volume distribution curves to areas with smaller cluster sizes and (ii) a rise in the volume distribution peak height. With 30 min annealing, the clusters coarser than ≈2.15 nm disappeared, and the cluster mean radius, i.e., a cluster radius where the volume fraction reached its maximum, decreased from ≈2.10 nm (2 min) to ≈1.77 nm (30 min). The cluster volume fraction increased with the increase in recrystallization annealing time from 2 min to 30 min. The longer annealing time, i.e., 30 min annealing, brought an increment in the number density of clusters from 2.82 × 1014 cm−3 (2 min) to 7.43 × 1014 cm−3 (30 min).
The annealing of an alloy system containing precipitations mostly resulted in a diffusion-controlled growth. However, in the present study, an increase in the duration during recrystallization annealing at 800 °C from 2 min to 30 min led to a decrease in mean particle size, and an increment in particle number density and volume fraction, which indicated new clustering formation and a finer distribution of the particles with smaller size. This new clustering response to the increasing annealing duration can be attributed to the recrystallization of the deformed microstructure, and enhanced diffusion. The deformed microstructure provided considerable defects in the material for the nucleation of the particles. The enhanced diffusion, i.e., longer diffusion duration, allowed atomic species to distribute within the solute solution approaching to equilibrium; in other words, it improved the elimination of segregations. Increasing recrystallization annealing duration gives rise to the observation of the microstructure closer to the equilibrium conditions, which was indicated by ab initio calculations in the present study.

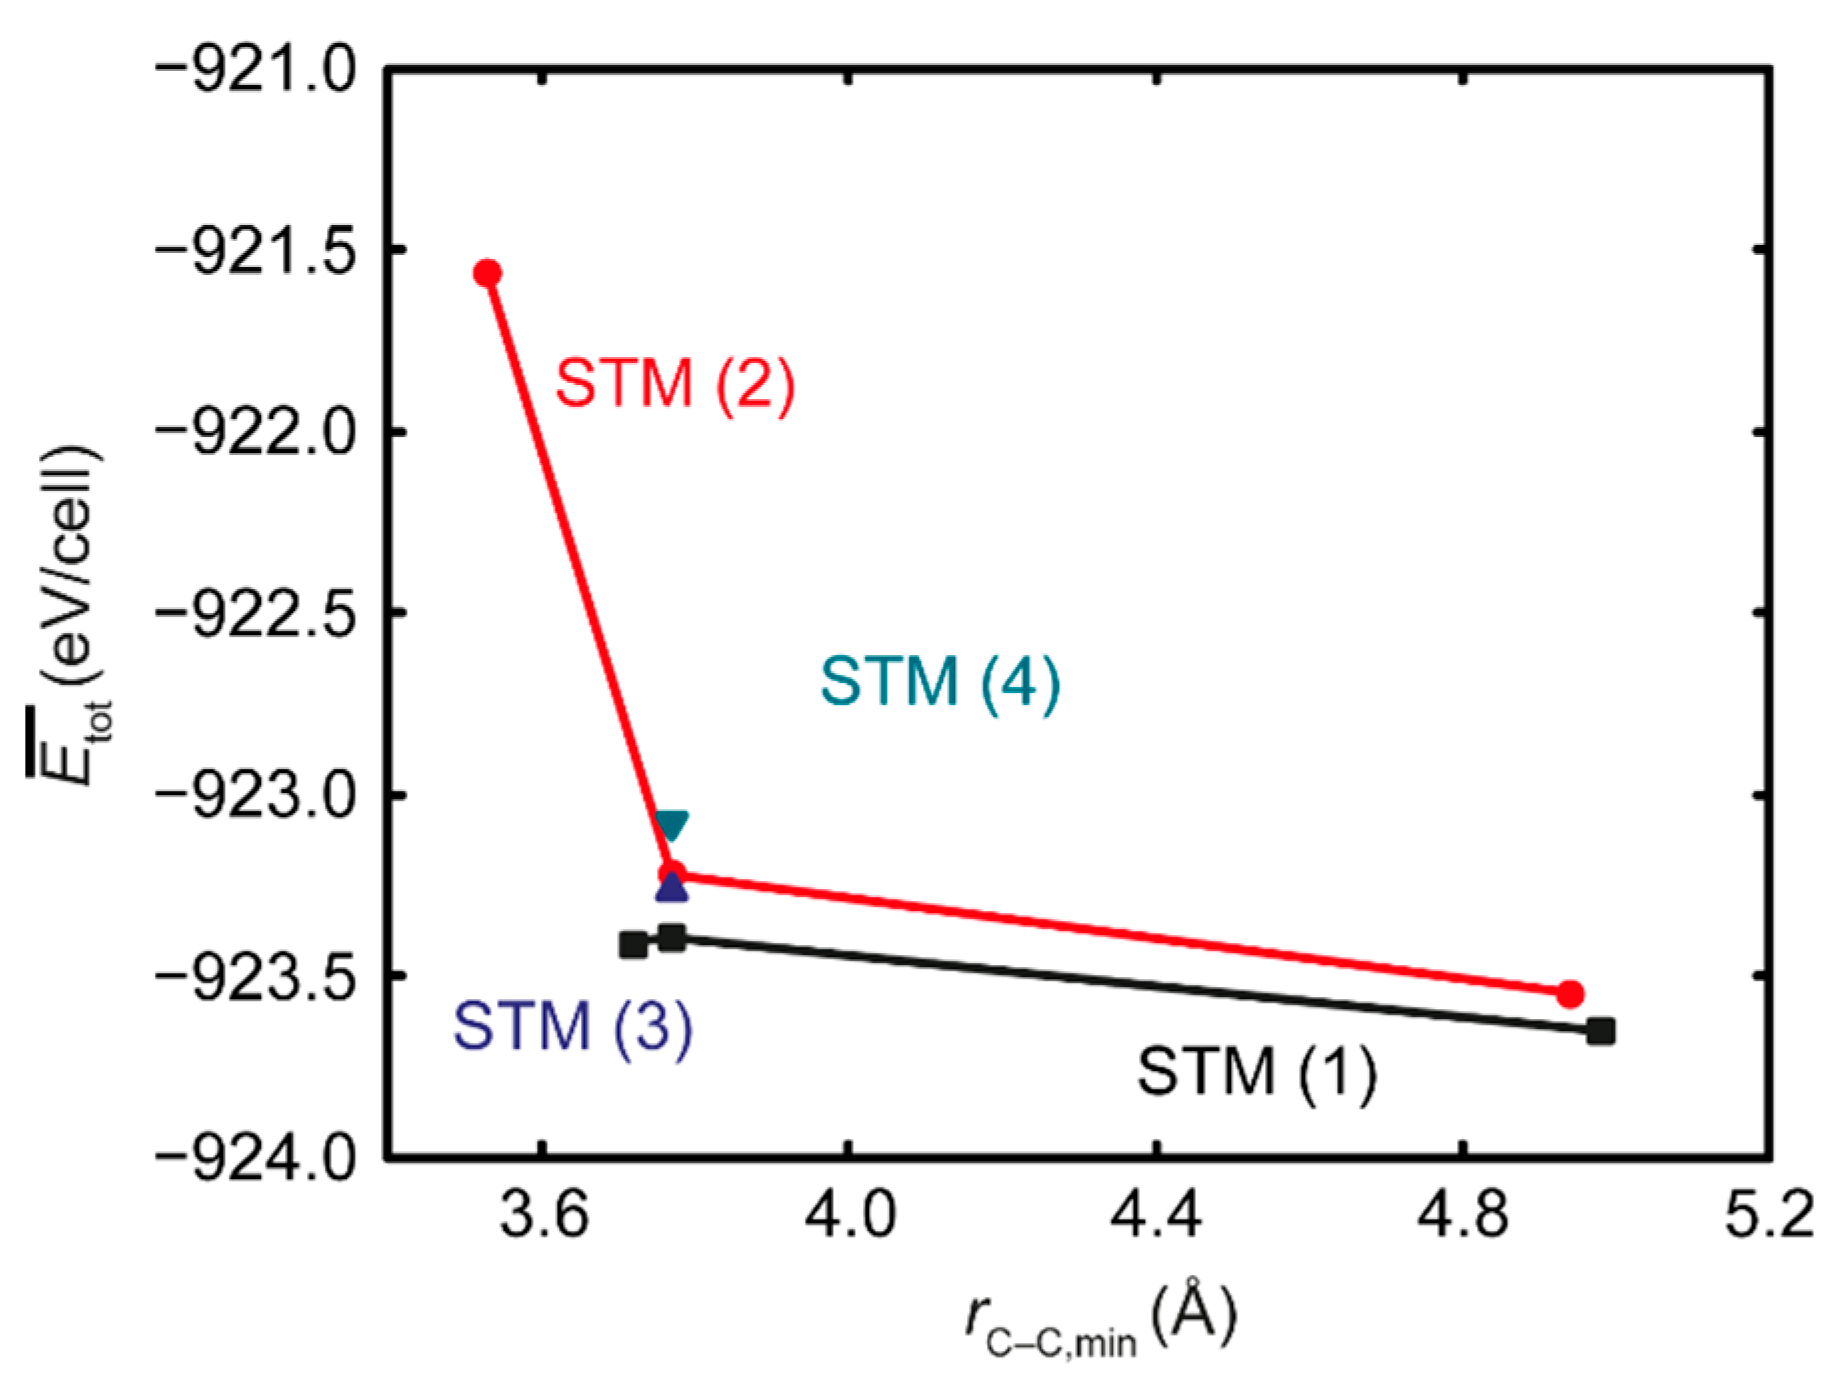
3.2. Ab Initio Calculations

As a full sampling of all possible distributions of three C atoms among the 27 interstitial sites of the supercell is extremely demanding in terms of sheer computation, even when considering symmetry, a constraint for selection of the probable C positions had to be introduced. This was done under the justified assumption that the immediate chemical environment of the surrounding metal matrix, including the 1st and 2nd CS, is the driving criterion for the selection of a site, with C–C interactions among neighboring interstitials playing only a secondary role. While this is an approximation, it was considered to be reasonable based on prior results [29,30] and known length scales for atomistic SRO phenomena. Furthermore, carbon-vacancy interactions were not considered, as the modeled metal lattice is defect-free, thus containing no vacancies, whereas for the interstitial sites, the carbon/empty site fraction is 3/27 = 1/9, so that empty voids are always present as 3rd CS neighbors for C in any case, rendering a distinction meaningless. Thus, in a first step, the 27 individual interstitial positions of each of the four structural models were occupied with only one C atom per cell to identify the energetically most favorable arrangement depending on local ordering in relation to the metal matrix, resulting in 4 × 27 distinct systems.
Figure 4 shows the total energies for each possible configuration averaged for configurations with similar ordering, E ¯ tot , in each STM as a function of the amount of Mn neighbors in the 1st CS, i.e., the surrounding octahedron, for the C atom, at a distance of roughly r ¯ C Mn , 1 CS 1.90 Å on average. This directly related to the choice of interstitial site as detailed above and was a sensible method of grouping the total energies, which are in general comparable for two systems with similar local ordering. However, for a random, disordered structure, a broader variation in energy could be expected due to the irregularity of the surrounding matrix, resulting in many different configurations if the occupation of the 2nd CS, with a distance of roughly r ¯ C Mn , 2 CS 3.05 Å on average, was also considered. While not shown in Figure 4a, which displays the averaged energies, a comparatively broad scattering of the individual energy values occurred, up to Δ E 0.1 eV for the same amount of Mn neighbors in both the 1st and 2nd CS. Because of that, identifying evident trends was difficult for the disordered case but, generally speaking, both the increasing amount of Mn neighbors in the 1st CS and, conversely, their decrease in number in the 2nd CS seem to be favorable energetically (a lower energy signifies a favored system per convention in chemistry). This agrees with results from previous studies on Mn in the 1st and 2nd CS of C in pure Fe matrices [30].
For the ordered STMs, these trends were more evident, as shown in Figure 4b. The decrease in E ¯ tot with increasing Mn content in the 1st CS was valid for all three ordered variants. In contrast to the disordered STM, the individual energies (not shown) are much more narrowly distributed, in most cases with Δ E 1 meV, with the highest difference being Δ E 0.04 eV. An outlier was prominent: in STM (3), a system containing two direct Mn–C contacts was disfavored, contrary to the general trend (as the only system with two Mn atoms as 1st CS neighbors and zero Mn atoms in the 2nd CS for STM (3), it was represented individually in the figure). In said system, C occupies a bridging position between two full Mn6 octahedra. Apart from this case, the entire dataset showed good agreement with the aforementioned results.
Due to the ordering constraint, there was limited data for higher Mn contents in the 2nd CS, with only eight systems, all in STM (3), out of the 81 distinct ordered cases (3 × 27, for all structures and individual C positions) containing one Mn in the 2nd CS. All of these eight systems contain two Mn atoms in the 1st CS, converging to a single data point in Figure 4b. Contrary to the disordered case, this led to a decrease in energy when compared to systems in STM (3) with zero Mn neighbors in the 2nd CS. However, due to the limited data mentioned above, this was not a statistically relevant observation and was likely caused by an interplay of other ordering effects for this particular arrangement.
In summary, the general trends (attractive Mn–C interactions for contacts in the 1st CS of C, repulsive interactions for those in the 2nd CS) were much less clearly present than in an ideally “diluted” system with an isolated Mn6C octahedron in a Fe matrix, but could still be identified. The larger scattering of energy values for STM (1) suggested that longer-range interactions beyond the first two CS, which are especially present in the disordered STM due to a more homogenous distribution of Mn atoms throughout the host matrix, play a role as well. While these results generally agreed with earlier findings, the evident differences did stress both the importance of a large statistical sampling of different configurations when “realistic” models are employed (which was not fully realized in this study) and the limitations of the prior idealized model.
After this general analysis, the most energetically favorable arrangements were used to construct the Fe88Mn20C3 structure approximating the real sample. While the total energy of the system was the primary selection criterion, the distance between C positions was also considered, resulting in the construction of several variants of Fe88Mn20C3 systems for each of the four main STMs: four each for (1) and (2), and three each for (3) and (4). In order to investigate the magnitude of the repulsive C–C interaction, in several of these variants an energetically less favored position was nonetheless selected as a C site if the C–C distance increased as a result. The total energy of these systems was then evaluated.
Figure 5 shows the averaged total energies E ¯ tot of the various Fe88Mn20C3 systems as a function of the smallest C–C distance r C C , min present in the respective structure. It is evident that a larger C–C distance is energetically favorable, which is shown clearly for STMs (1) and (2). The strong increase in energy for r C C , min 3.55 Å in structure (2) in particular confirmed this general trend. For structures (3) and (4), the smallest r C C , min is always approx. 3.77 Å, making a comparison difficult. However, the three variants for these structures each differ in C distribution, enabling an analysis of the C–C radial distribution functions (RDF) performed via the wxDragon package [48].
The respective RDF for the individual variant systems of structures (3) and (4) are shown in Figure 6. Two factors are evident: first, in the energetically favored structures, the number of Mn contacts in the 1st CS of C was higher than in the less favored ones, as expected due to Mn–C attraction. Second, the energetically favored arrangement in (3) exhibited a more homogenous distribution with C–C distances of approx. 3.77 Å, 4.89 Å, and 6.2 Å distributed roughly evenly (if differences in weight due to binning are considered), while the disfavored arrangement showed closer groupings of C atoms with r C C 3.77 Å and 4.89 Å. However, as this was observed in one structure only, it conceivably might be a statistical artifact, and is in any case difficult to separate from the effect of the Mn–C interactions as outlined.
These combined findings conclusively demonstrated that a larger C–C distance is favorable and, in comparison, may compete with and even outweigh the effect of increasing the amount of Mn–C contacts in the 1st CS. This was reinforced by the fact that none of the energetically most favored arrangements for the Fe88Mn20C3 variants corresponded to the selection of the respective three “best” single C positions obtained in the first step of the ab initio study. This suggests that, while Mn6C octahedra were energetically preferred, they would not be located adjacent to each other, but rather distributed evenly. Thus, in real samples at the macroscopic scale, C atoms will preferably agglomerate in Mn-rich regions, but keep a minimal C–C distance of >5 Å at least, with an even spatial distribution. It should be noted that for more detailed quantification of these effects, follow-up studies with larger models and a broader statistical sampling are necessary, which have a low tractability for atomistic ab initio methods and are outside the scope of this mainly qualitative work.

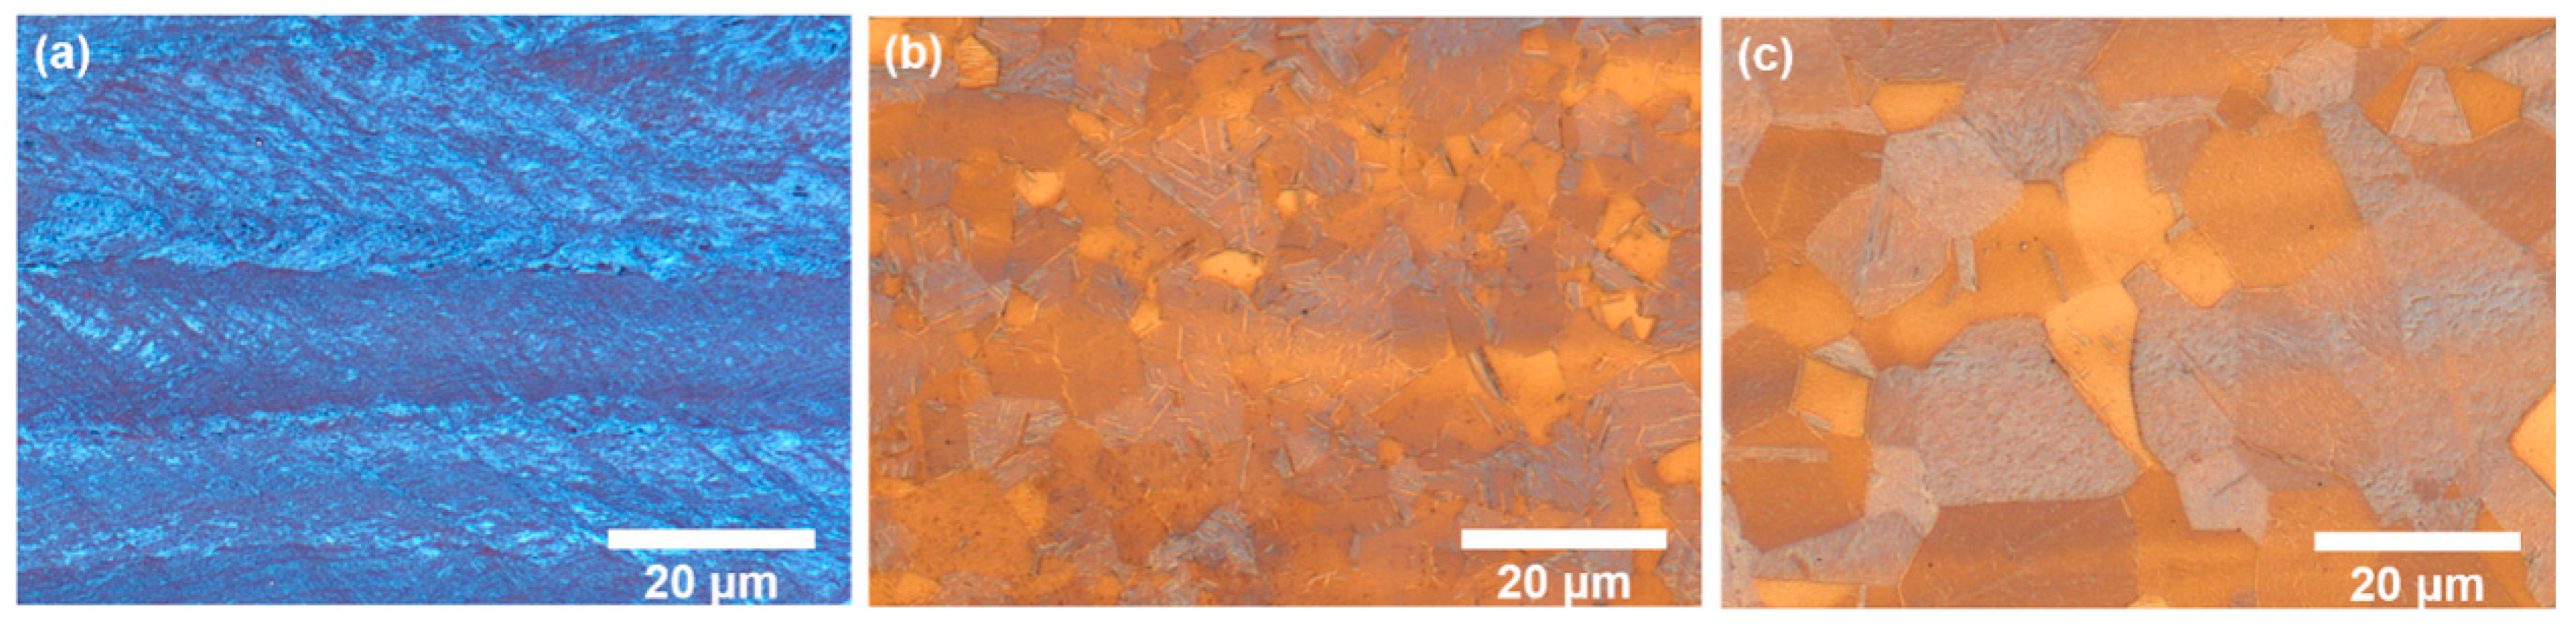
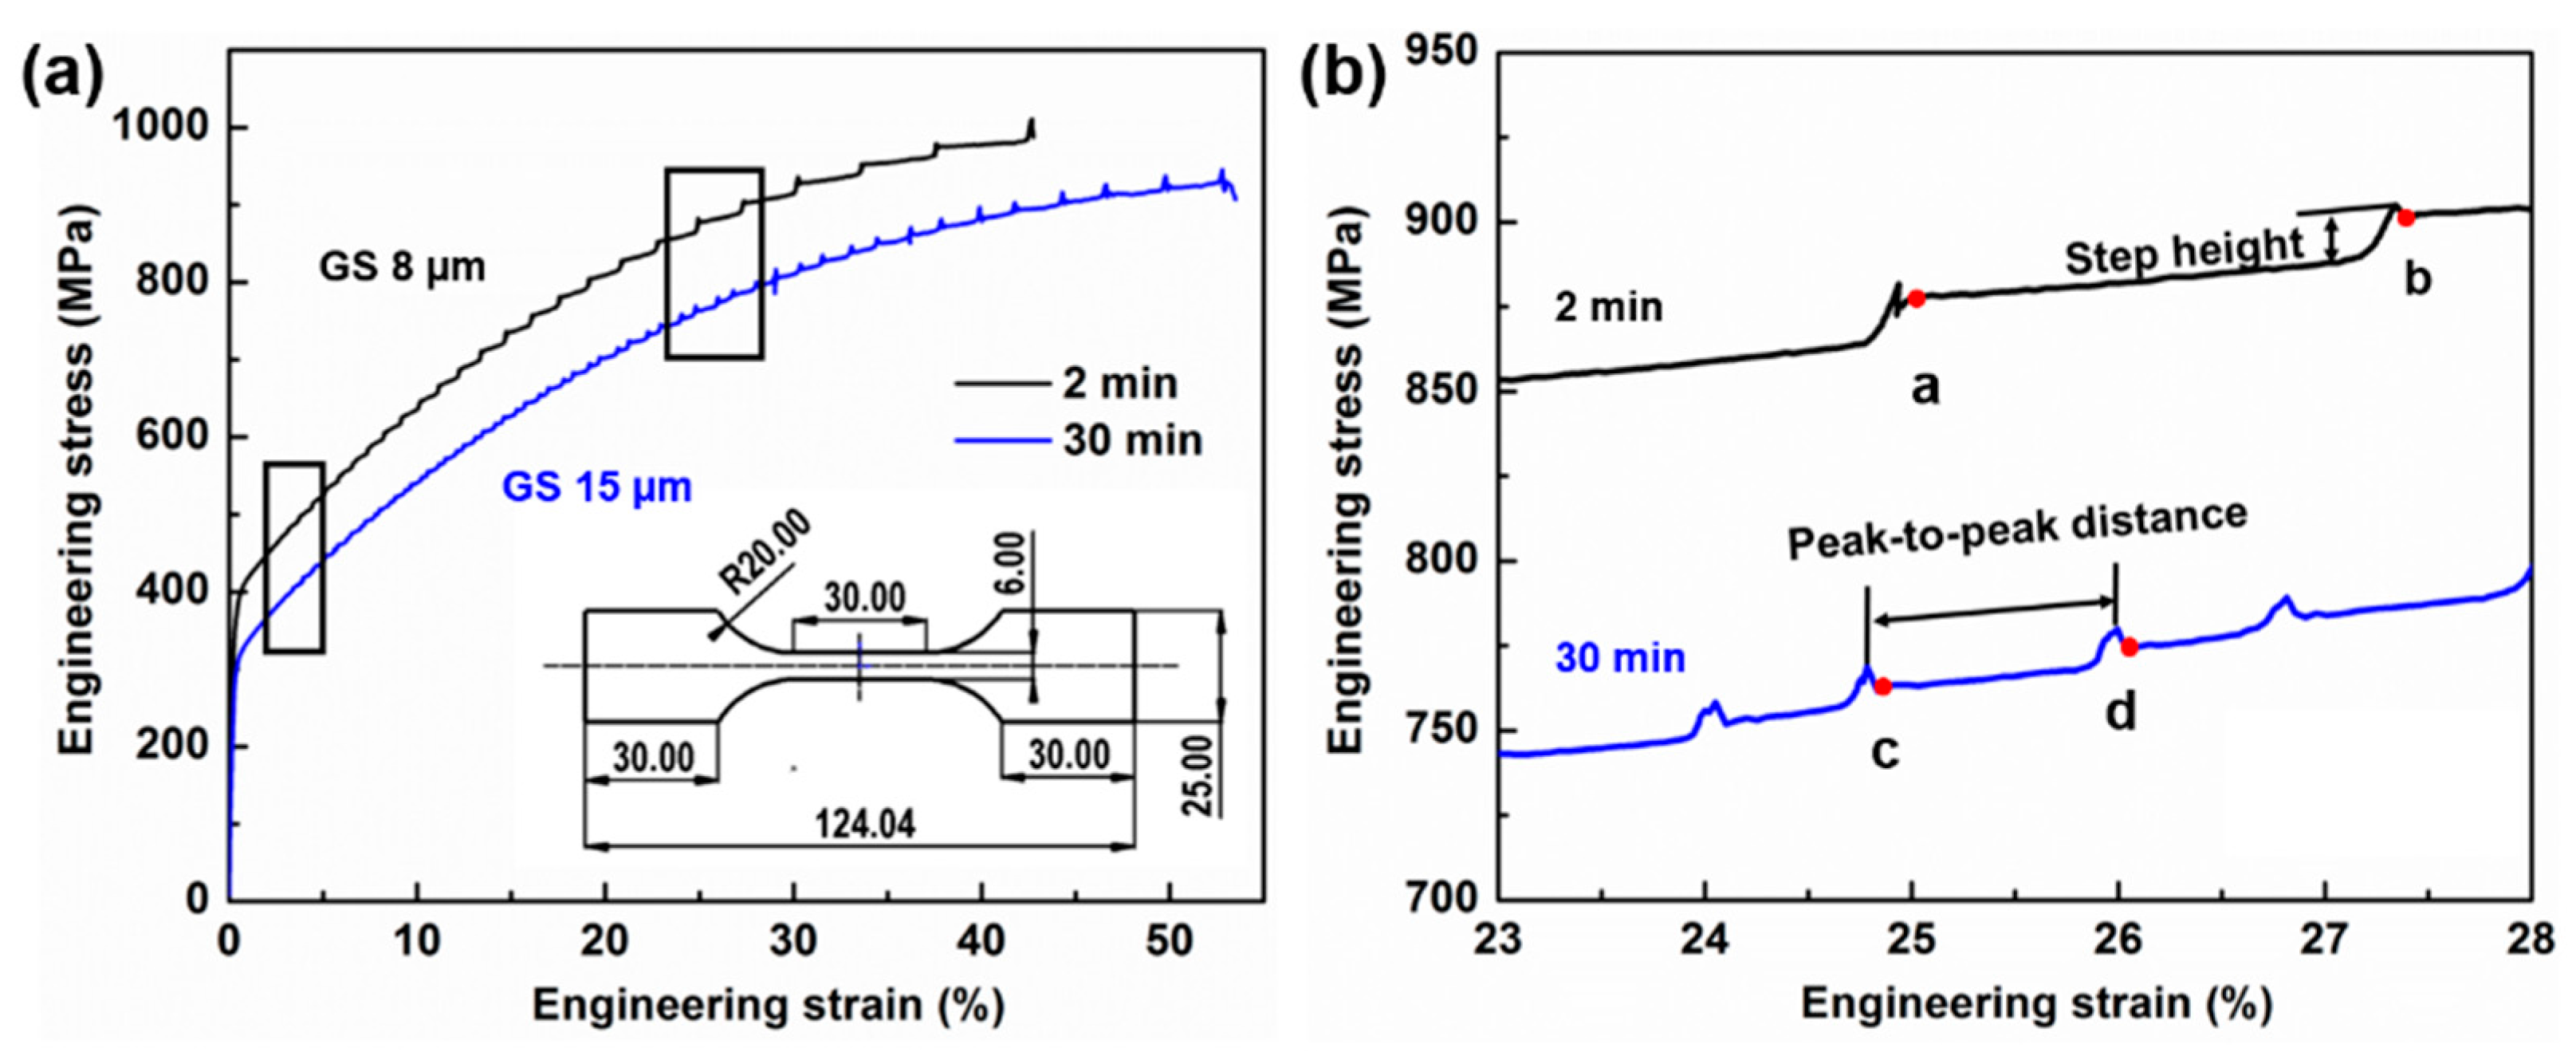
3.3. Microstructure and Mechanical Properties

The microstructure of the X60Mn18 steel at different states is shown in Figure 7. The heavily deformed austenitic microstructure after cold rolling is shown in Figure 7a. The steel was fully recrystallized at 800 °C, both for 2 min and 30 min, as shown in Figure 7b,c. The austenitic grain size in the 2 min and 30 min samples was 8 μm and 15 μm, respectively. The DSA effect as manifested by the serrations in the stress-strain curves is shown in Figure 8a. These type-A serrations, which are characterized by a steep rise in stress alternating with plateau-like features, were observed in the stress-strain curves in the X60Mn18 steel recrystallization annealed for 2 min and 30 min in Figure 8. The type-A serrations occur as a result of the generation and propagation of a PLC band [16]. As an indicator of the DSA effect, jerky flow is found as a distinct feature of the tensile curves. The observation of each serration peak in the stress-strain curve results from a new-born PLC band. The X60Mn18 steel recrystallization annealed for 2 min exhibited higher yield strength (368.92 MPa) and ultimate tensile strength (1010.38 MPa) than those in the 30 min annealed sample. The elongation of the X60Mn18 steel annealed for 2 min and 30 min at 800 °C was 42.13% and 52.02%, respectively.
The partial magnified engineering stress-strain curves in Figure 8b revealed the serration behaviors of the steel. Compared with the 2 min annealed sample, the engineering stress-strain curve of the 30 min annealed sample comprised a higher number of serration peaks, i.e., a shorter peak-to-peak distance, with lower step heights. Within the deformation strain range from 23% to 28%, the peak-to-peak distance of the 2 min annealed sample was approximately 2.4% with a serration step height of 16.75 MPa, whereas the average peak-to-peak distance of the 30 min annealed sample was about 0.9% and the average serration step height was 8.70 MPa.

4. Discussion

Both the SANS measurements and the ab initio calculations reveal that, with an increase in the duration of recrystallization annealing of the X60Mn18 steel, the Mn–C units exhibiting SRO tend to keep distance towards each other and are more evenly distributed throughout the material, while exhibiting smaller size. The SANS results show that an increase in the duration of recrystallization annealing at 800 °C from 2 min to 30 min leads to a decrease in mean particle size and an increment of both particle number density and volume fraction, which indicates new clustering formation and a finer distribution of the particles with smaller size. The ab initio calculations show that thermodynamically, individual Mn6C octahedra preferably keep minimum distances from each other (approximately 5 Å at least). The repulsive C–C interaction is an important effect, which can counteract the Mn–C attraction responsible for the formation of Mn6C units in the first place, resulting in the above-mentioned units being evenly distributed rather than closely grouped. The DFT calculations thus explain the interactions for nearest-neighbor and second-nearest-neighbor Mn–C pairs and illustrate their SRO, while also clarifying the role of the C–C interaction on the atomic level. However, in reality, Mn and C do not form isolated octahedra only, but may also form clusters on a larger (nanometer) scale, as the SRO and SRC measured by SANS reveal. This suggests that the particles tend to show a dispersed, even distribution over long time annealing, explaining why, during recrystallization annealing, the Mn–C SRO tend to be more homogenously distributed with smaller particle size, higher number density and higher volume fraction. All in all, the SANS measurements and ab initio calculations of the Mn–C ordering, while examining different size scales, show good agreement with each other and suggest a possible underlying atomistic cause for cluster dispersion.
As shown in Figure 8, the serration phenomenon of investigated high-Mn steel underlines the DSA effect during plastic deformation. It was reported that the DSA in C-enriched high-Mn steels is attributed to the formation of Mn–C SRO [17,49,50]. Dastur and Leslie [17] claimed that the Mn–C octahedral clusters may reorient themselves in the stress field near a dislocation core, which strongly pins the dislocations and causes them to pile up. However, the pinning force is not strong enough to lock the mobile dislocations solidly and the pinned dislocations are released from the Mn–C SRO at once and propagate. This clustering leads to a higher lattice resistance to the dislocation glide, as the passage of a partial dislocation will in general change the local position of both substitutional and interstitial atoms [4]. The 2D composition-dependent stacking fault energy (SFE) map in Figure 9a summarizes the reported steels in the Fe–Mn–C system that exhibit serration flow during deformation. One can see that serration flow occurs in the high-Mn TRIP/TWIP steels of the Fe–Mn–C system that cover a wide range of chemical compositions [3,8,50,51,52,53,54,55,56,57,58,59].
The occurrence of serration requires the deformation level of the materials to meet a critical strain and the critical strain (εc) must first be achieved before serrated flow is observed. The critical strain for triggering serrations is influenced by SFE, deformation temperature, strain rate and elemental content (i.e., Al). The critical strain for the onset of the serrations shows an increasing trend with increasing SFE. An increase in the temperature promotes the serrations in the early stages of the deformation [16], the same as a lowered strain rate. The critical strain increases with increasing Al content. Al addition shifts the occurrence of DSA-related serrations towards higher strains or eliminates the serrations [11,60,61]. The steels in the Fe–Mn–1.5Al–C system that show serration flow during deformation are summarized in the 2D composition-dependent SFE map (Figure 9b). In the Fe–Mn–1.5Al–C steel system, the serrations reported in the literature occur mainly in the steels with 0.6 wt % carbon content. In the compositional range for high-Mn steels in the Fe–Mn–Al–C system, the serrations take place at higher deformation levels, which yields the required activation energy for C reorientation [13]. On the one hand, it was reported that Al reduces the activity and diffusivity of C [62,63] and delays the occurrence of serrations during deformation. On the other hand, ab initio calculations suggest that Al has a strong impact on the Mn–C SRO formation [30]. Al is preferable as a second-nearest neighbor to carbon; however, the attractive interaction of Mn–C pairs is affected by the presence of Al [30]. Because of high Al content in the system, the formation of Mn–C pairs is not preferred any longer [30]. In other words, the addition of a certain amount of Al suppresses the Mn–C SRO formation in high-Mn steels. This might be the reason for the delay or absence of the serration phenomenon in Al-alloyed high-Mn steels.

5. Conclusions

The ex-situ small angle neutron scattering (SANS) investigations prove the presence of Mn–C SRO in the recrystallization annealed X60Mn18 steel.
(1)
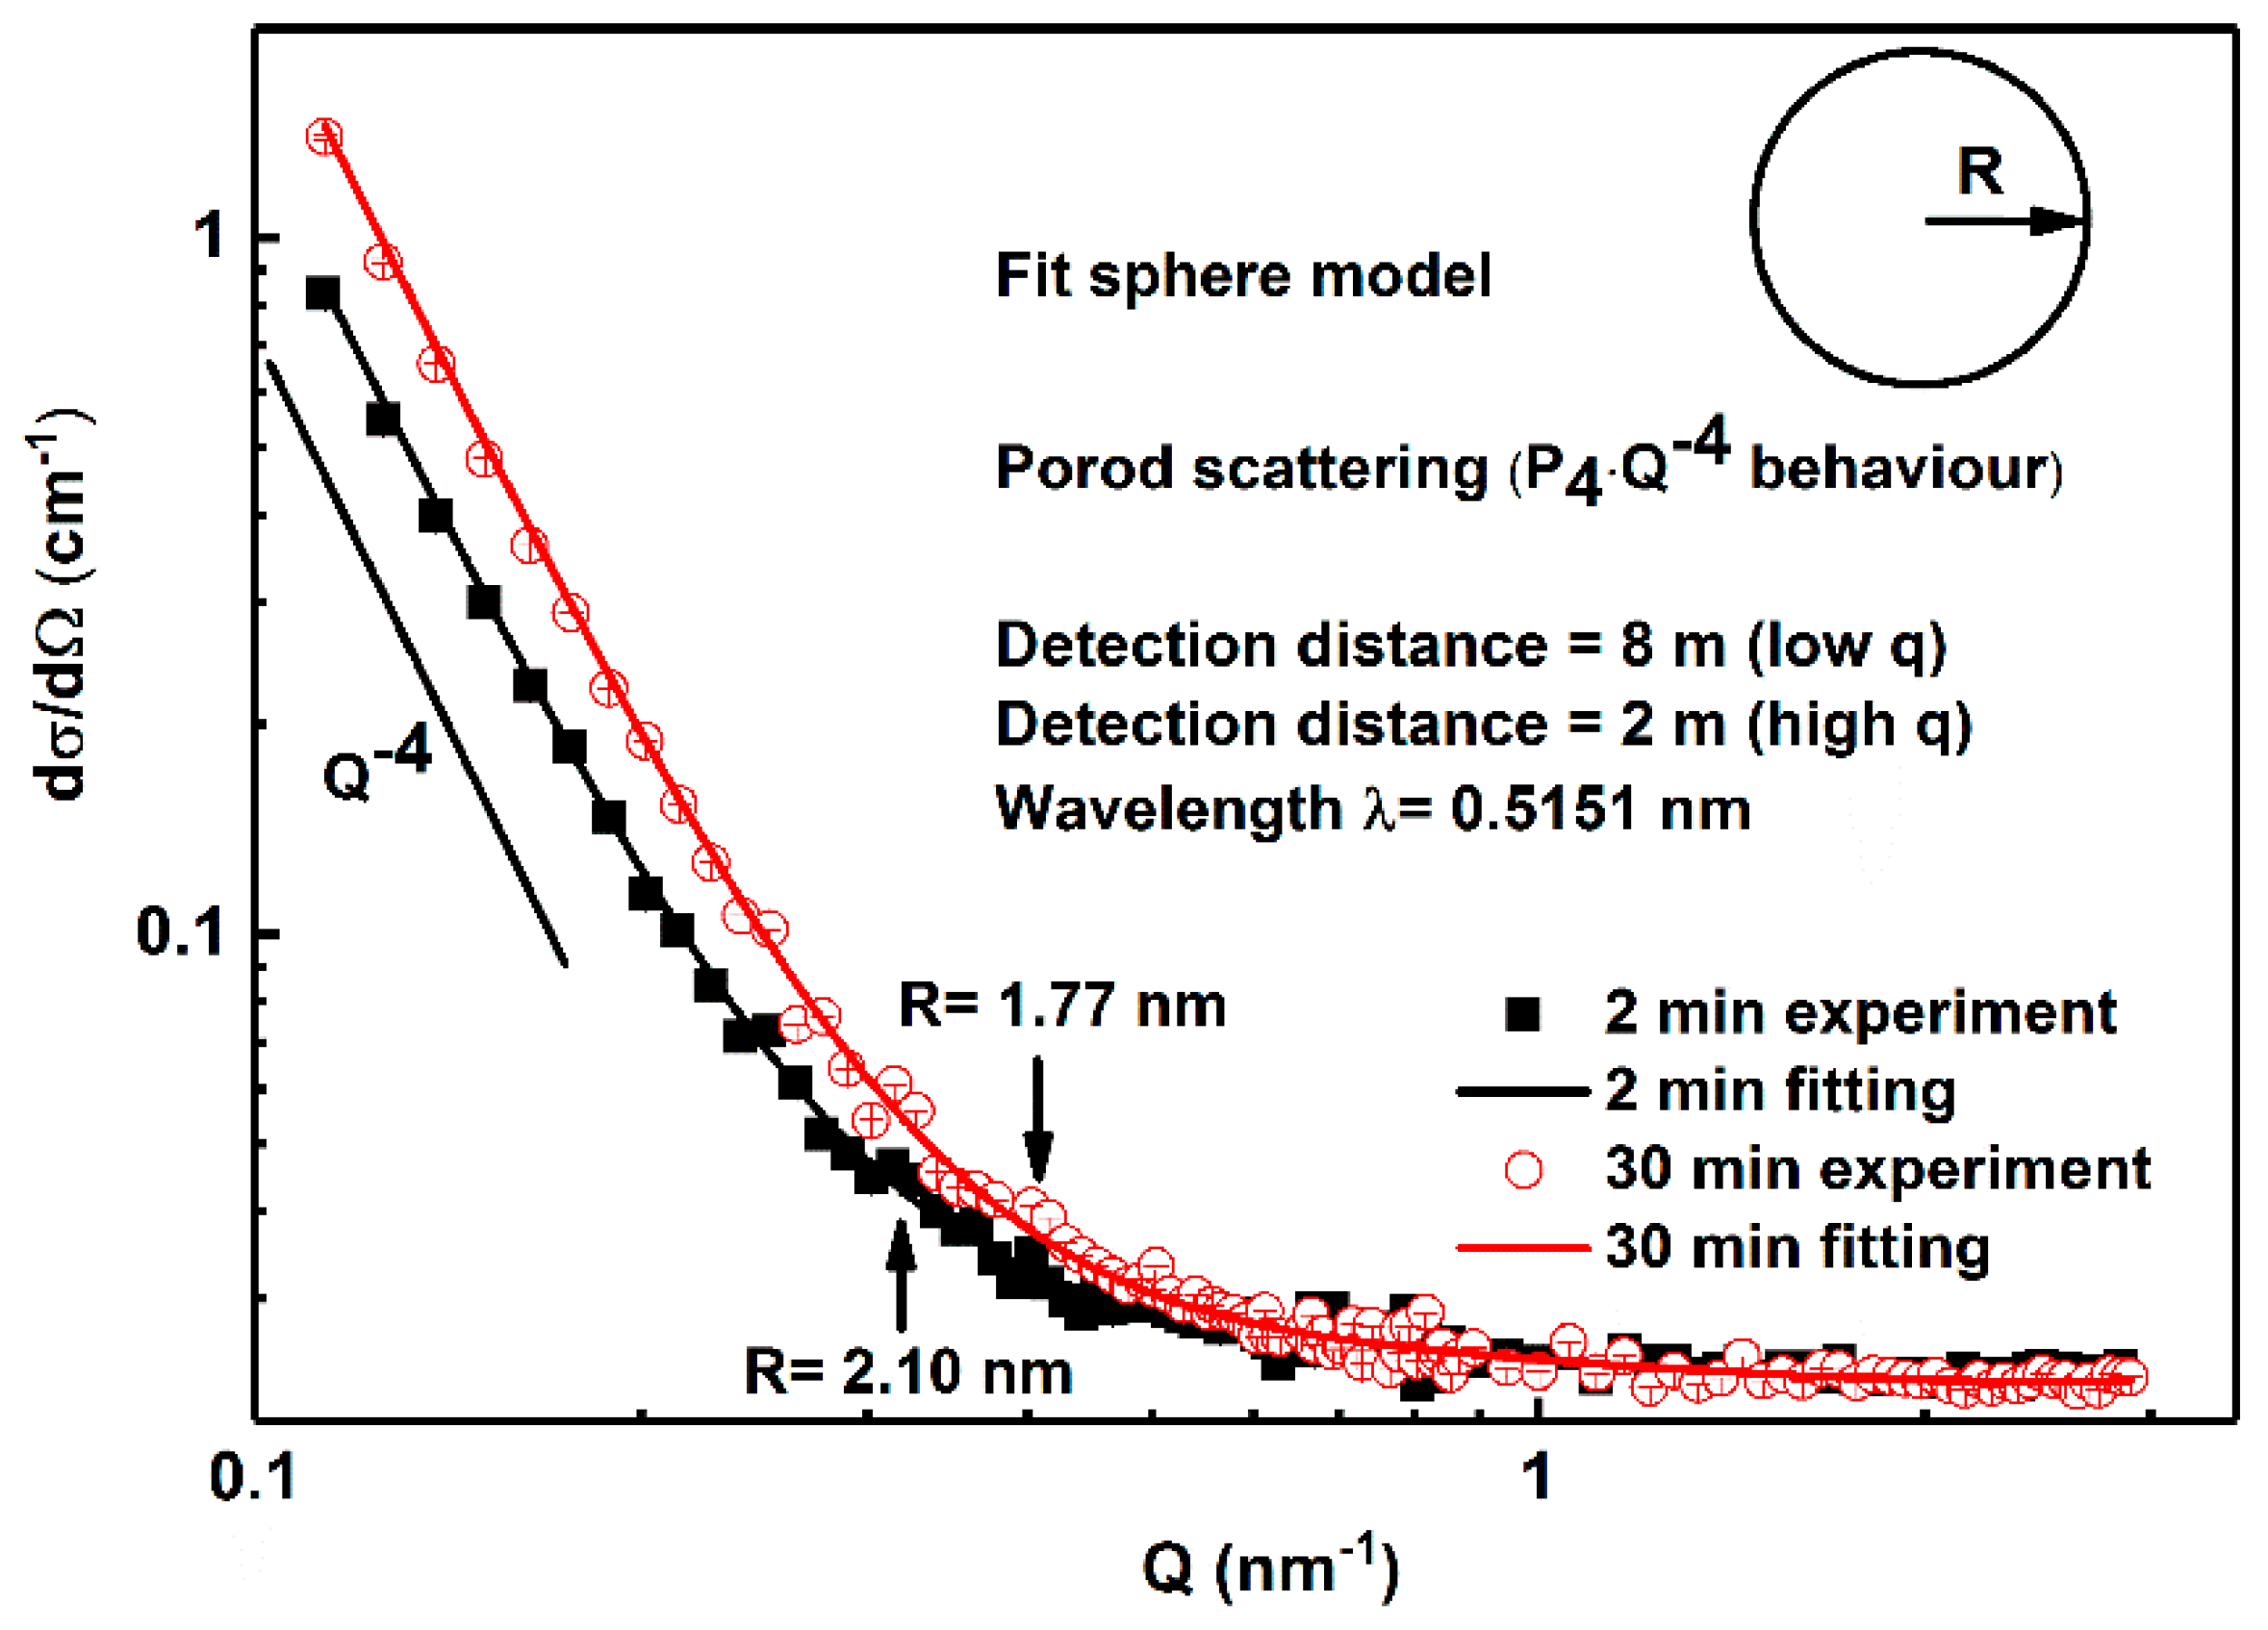
With an increase in annealing time from 2 min to 30 min, the size of the Mn–C SRO decreases, whereas their number density increases. The material exhibits a more evenly dispersed distribution of smaller clusters at longer annealing time during recrystallization.
(2)
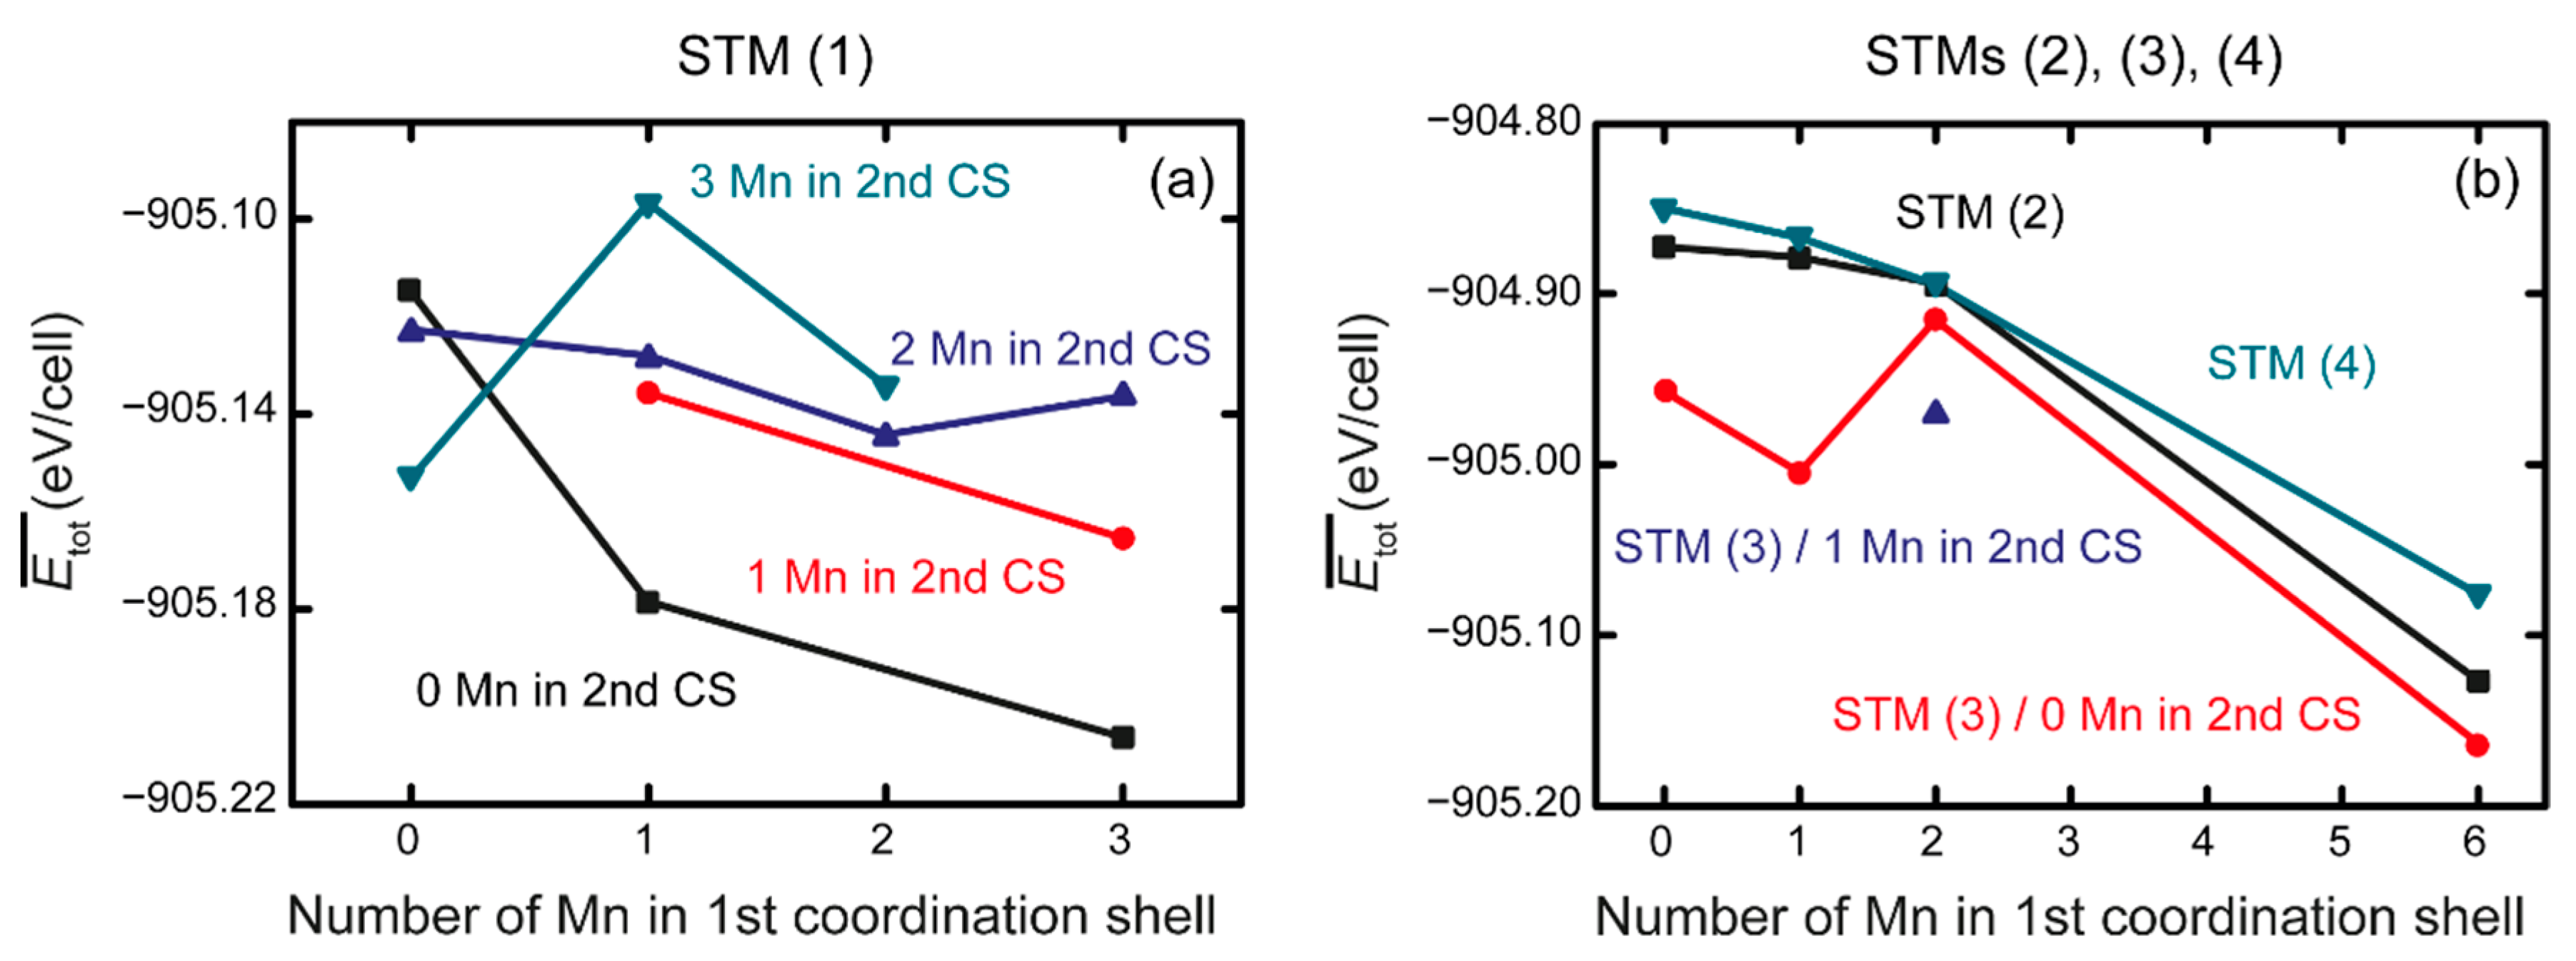
The ab initio calculations qualitatively demonstrate that an increase in Mn neighbors of C in the 1st coordination sphere, resulting in a Mn6C octahedron, is energetically favorable, confirming prior studies on the Mn–C interaction. However, in non-idealized, “realistic” models, these effects are far less pronounced and energetic scattering is higher.
(3)
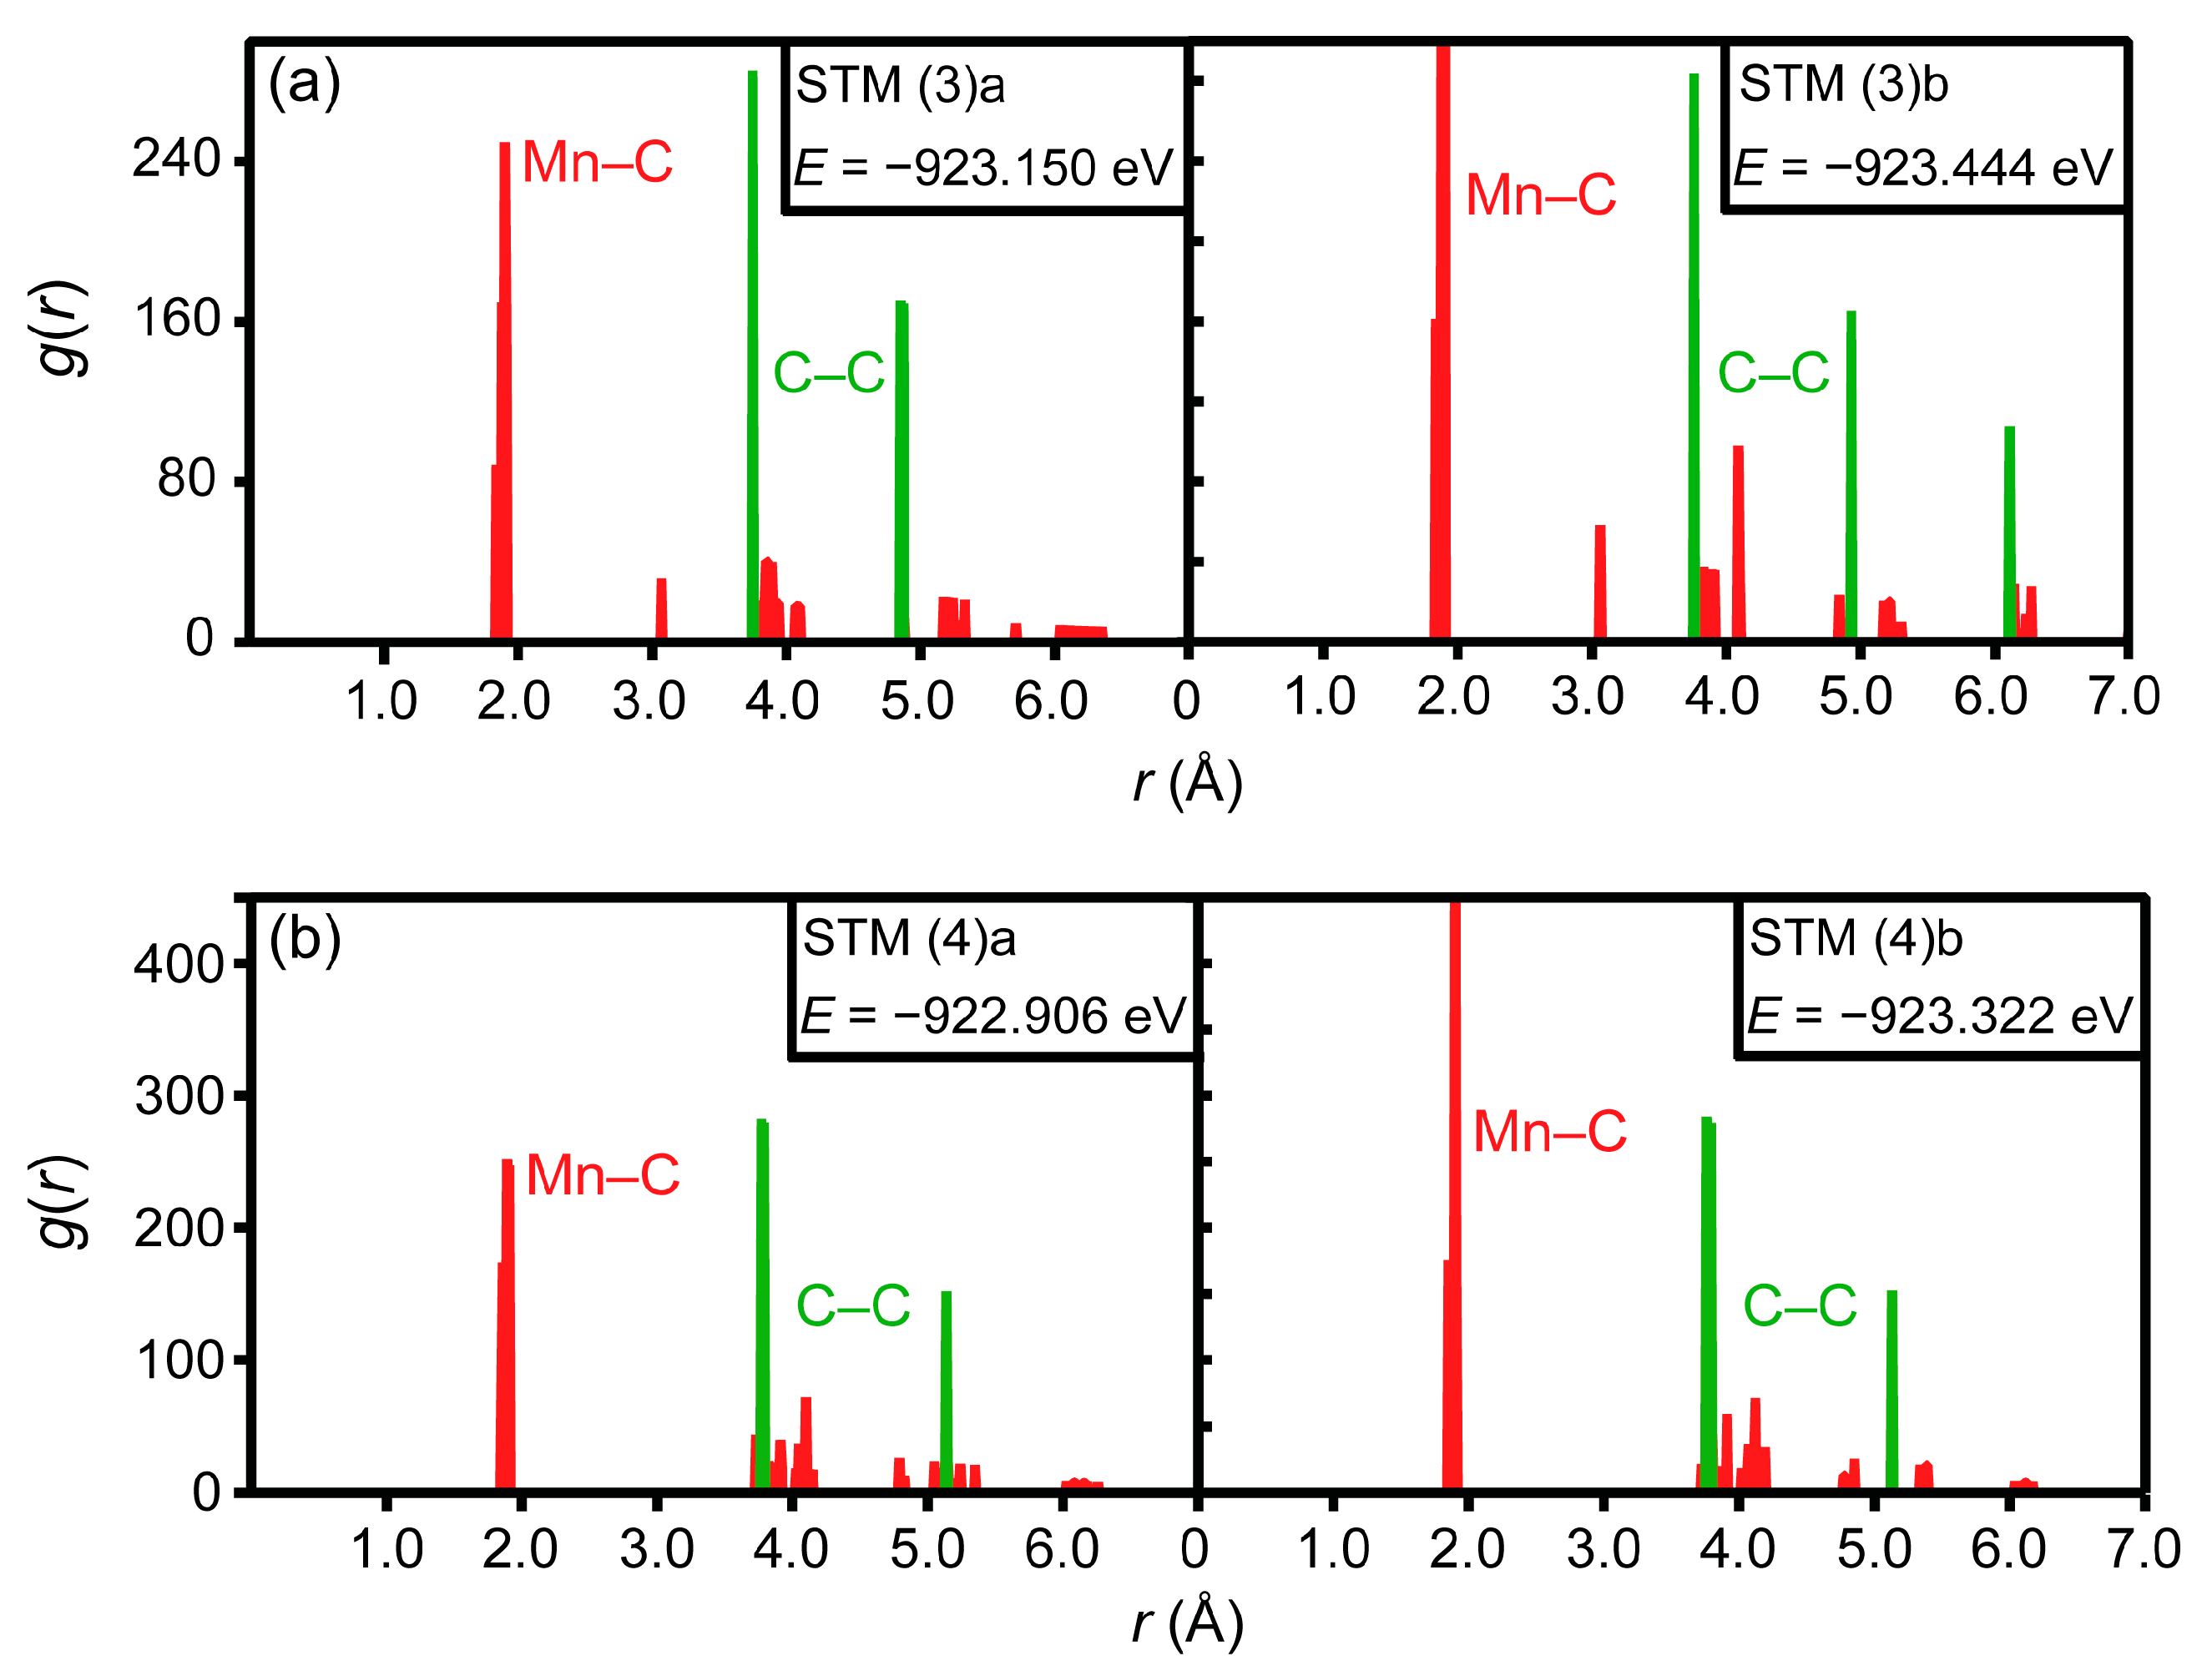
The repulsive C–C interaction is an equally important effect, which can counteract the Mn–C attraction, resulting in the formation of Mn6C units that are distributed evenly rather than being closely grouped, and they keep minimum distances from each other. This confirms and expands upon the results of prior studies, which were restricted to idealized model systems and did not investigate the competition between the two effects.
(4)
The ab initio calculations well describe the energetically favored condition of Mn–C clustering and provide a theoretical explanation on an atomistic scale of the clustering formation and evolution in the X60Mn18 steel.

Acknowledgments

This study was performed in the Collaborative Research Center (SFB) 761 “Steel ab initio” funded by the Deutsche Forschungsgemeinschaft (DFG), whose financial support is gratefully acknowledged. We thank the IT Centre of RWTH Aachen University and the Jülich-Aachen Research Alliance (JARA) HPC division for providing computational time and resources for the ab initio part of this work within the grant JARA0058. The experimental support from the KWS-2 beamline of Jülich Centre for Neutron Science (JCNS) at Heinz Maier-Leibnitz Zentrum (MLZ) is gratefully acknowledged.

Author Contributions

Wenwen Song designed the experiments and supervised the work. Wenwen Song, Ahmet Bahadir Yildiz and Judith E. Houston conducted the SANS experiments and analyzed the SANS data; Dimitri Bogdanovski conceived, performed and evaluated ab initio calculations; Richard Dronskowski and Wolfgang Bleck contributed with ideas and intensive discussions. All authors contributed to the interpretation of the results and the writing of the final version of the manuscript.

Conflicts of Interest

The authors declare no conflict of interest.

References

  1. De Cooman, B.C.; Estrin, Y.; Kim, S.K. Twinning-induced plasticity (TWIP) steels. Acta Mater. 2018, 142, 283–362. [Google Scholar] [CrossRef]
  2. Bouaziz, O.; Allain, S.; Scott, C.P.; Cugy, P.; Barbier, D. High manganese austenitic twinning induced plasticity steels: A review of the microstructure properties relationships. Curr. Opin. Solid State Mater. Sci. 2011, 15, 141–168. [Google Scholar] [CrossRef]
  3. Yang, H.K.; Zhang, Z.J.; Dong, F.Y.; Duan, Q.Q.; Zhang, Z.F. Strain rate effects on tensile deformation behaviors for Fe–22Mn–0.6C–(1.5Al) twinning-induced plasticity steel. Mater. Sci. Eng. A 2014, 607, 551–558. [Google Scholar] [CrossRef]
  4. Chen, L.; Kim, H.-S.; Kim, S.-K.; De Cooman, B.C. Localized deformation due to Portevin-LeChatelier effect in 18Mn–0.6C TWIP austenitic Steel. ISIJ Int. 2007, 47, 1804–1812. [Google Scholar] [CrossRef]
  5. Güvenç, O.; Roters, F.; Hickel, T.; Bambach, M. ICME for crashworthiness of TWIP Steels: From ab initio to the crash performance. JOM 2015, 67, 120–128. [Google Scholar] [CrossRef]
  6. Bouaziz, O.; Zurob, H.; Huang, M. Driving force and logic of development of advanced high strength steels for automotive applications. Steel Res. Int. 2013, 84, 937–947. [Google Scholar] [CrossRef]
  7. Bleck, W.; Guo, X.; Ma, Y. The TRIP effect and its application in cold formable sheet steels. Steel Res. Int. 2017, 88, 1700218. [Google Scholar] [CrossRef]
  8. Kim, J.-K.; De Cooman, B.C. Stacking fault energy and deformation mechanisms in Fe–xMn–0.6C–yAl TWIP steel. Mater. Sci. Eng. A 2016, 676, 216–231. [Google Scholar] [CrossRef]
  9. Kang, M.; Shin, E.; Woo, W.; Lee, Y.-K. Small-angle neutron scattering analysis of Mn–C clusters in high-manganese 18Mn–0.6C steel. Mater. Charact. 2014, 96, 40–45. [Google Scholar] [CrossRef]
  10. Kim, J.; Estrin, Y.; De Cooman, B.C. Application of a dislocation density-based constitutive model to Al-alloyed TWIP steel. Metall. Mater. Trans. A 2013, 44, 4168–4182. [Google Scholar] [CrossRef]
  11. Jin, J.-E.; Lee, Y.-K. Effects of Al on microstructure and tensile properties of C-bearing high Mn TWIP steel. Acta Mater. 2012, 60, 1680–1688. [Google Scholar] [CrossRef]
  12. Jung, I.-C.; De Cooman, B.C. Temperature dependence of the flow stress of Fe–18Mn–0.6C–xAl twinning-induced plasticity steel. Acta Mater. 2013, 61, 6724–6735. [Google Scholar] [CrossRef]
  13. Lee, S.-J.; Kim, J.; Kane, S.N.; De Cooman, B.C. On the origin of dynamic strain aging in twinning-induced plasticity steels. Acta Mater. 2011, 59, 6809–6819. [Google Scholar] [CrossRef]
  14. Scott, C.; Allain, S.; Faral, M.; Guelton, N. The development of a new Fe–Mn–C austenitic steel for automotive applications. Metall. Res. Technol. 2006, 103, 293–302. [Google Scholar] [CrossRef]
  15. Gutierrez-Urrutia, I.; Raabe, D. Grain size effect on strain hardening in twinning-induced plasticity steels. Scr. Mater. 2012, 66, 992–996. [Google Scholar] [CrossRef]
  16. Kim, J.-K.; Chen, L.; Kim, H.-S.; Kim, S.-K.; Estrin, Y.; De Cooman, B.C. On the tensile behavior of high-manganese twinning-induced plasticity steel. Metall. Mater. Trans. A 2009, 40, 3147–3158. [Google Scholar] [CrossRef]
  17. Dastur, Y.N.; Leslie, W.C. Mechanism of work hardening in Hadfield manganese steel. Metall. Trans. A 1981, 12, 749–759. [Google Scholar] [CrossRef]
  18. Marceau, R.K.W.; Choi, P.; Raabe, D. Understanding the detection of carbon in austenitic high-Mn steel using atom probe tomography. Ultramicroscopy 2013, 132, 239–247. [Google Scholar] [CrossRef] [PubMed]
  19. Hellman, O.C.; du Rivage, J.B.; Seidman, D.N. Efficient sampling for three-dimensional atom probe microscopy data. Ultramicroscopy 2003, 95, 199–205. [Google Scholar] [CrossRef]
  20. Svergun, D.I.; Koch, M.H.J. Small-angle scattering studies of biological macromolecules in solution. Rep. Prog. Phys. 2003, 66, 1735–1782. [Google Scholar] [CrossRef]
  21. Radulescu, A.; Mathers, R.T.; Coates, G.W.; Richter, D.; Fetters, L.J. A SANS study of the self-assembly in solution of syndiotactic polypropylene homopolymers, syndiotactic polypropylene-block-poly(ethylene-co-propylene) diblock copolymers, and an alternating atactic-isotactic multisegment polypropylene. Macromolecules 2004, 37, 6962–6971. [Google Scholar] [CrossRef] [Green Version]
  22. Liu, Y.; Fratini, E.; Baglioni, P.; Chen, W.-R.; Chen, S.-H. Effective long-range attraction between protein molecules in solutions studied by small angle neutron scattering. Phys. Rev. Lett. 2005, 95, 118102. [Google Scholar] [CrossRef] [PubMed]
  23. Bambach, M.D.; Bleck, W.; Kramer, H.S.; Klein, M.; Eifler, D.; Beck, T.; Surm, H.; Zoch, H.-W.; Hoffmann, F.; Radulescu, A. Tailoring the hardening behavior of 18CrNiMo7-6 via Cu alloying. Steel Res. Int. 2016, 87, 550–561. [Google Scholar] [CrossRef]
  24. Song, W.; Radulescu, A.; Liu, L.; Bleck, W. Study on a high entropy alloy by high energy synchrotron X-Ray diffraction and small angle neutron scattering. Steel Res. Int. 2017, 88, 1700079. [Google Scholar] [CrossRef]
  25. Radlinski, A.; Mastalerz, M.; Hinde, A.; Hainbuchner, M.; Rauch, H.; Baron, M.; Lin, J.; Fan, L.; Thiyagarajan, P. Application of SAXS and SANS in evaluation of porosity, pore size distribution and surface area of coal. Int. J. Coal Geol. 2004, 59, 245–271. [Google Scholar] [CrossRef]
  26. Feigin, L.A.; Svergun, D.I.; Taylor, G.W. Structure Analysis by Small-Angle X-Ray and Neutron Scattering; Plenum Press: New York, NY, USA, 1987; pp. 83–87. ISBN 9781475766264. [Google Scholar]
  27. Radulescu, A.; Szekely, N.K.; Appavou, M.-S. KWS-2: Small angle scattering diffractometer. J. Large-Scale Res. Facil. 2015, 1, 29. [Google Scholar] [CrossRef]
  28. Pedersen, J.S. Determination of size distribution from small-angle scattering data for systems with effective hard-sphere interactions. J. Appl. Crystallogr. 1994, 27, 595–608. [Google Scholar] [CrossRef]
  29. Von Appen, J.; Dronskowski, R. Carbon-induced ordering in manganese-rich austenite—A density-functional total-energy and chemical-bonding study. Steel Res. Int. 2011, 82, 101–107. [Google Scholar] [CrossRef]
  30. Timmerscheidt, T.A.; Dronskowski, R. An ab initio study of carbon-induced ordering in austenitic Fe–Mn–Al–C alloys. Steel Res. Int. 2017, 88, 1600292. [Google Scholar] [CrossRef]
  31. Bhadeshia, H.K.D.H. Carbon–carbon interactions in iron. J. Mater. Sci. 2004, 39, 3949–3955. [Google Scholar] [CrossRef]
  32. Kresse, G.; Hafner, J. Ab initio molecular dynamics for liquid metals. Phys. Rev. B 1993, 47, 558–561. [Google Scholar] [CrossRef]
  33. Kresse, G.; Furthmüller, J. Efficiency of ab-initio total energy calculations for metals and semiconductors using a plane-wave basis set. Comput. Mater. Sci. 1996, 6, 15–50. [Google Scholar] [CrossRef]
  34. Blöchl, P.E. Projector augmented-wave method. Phys. Rev. B 1994, 50, 17953–17979. [Google Scholar] [CrossRef]
  35. Kresse, G.; Joubert, D. From ultrasoft pseudopotentials to the projector augmented-wave method. Phys. Rev. B 1999, 59, 1758–1775. [Google Scholar] [CrossRef]
  36. Perdew, J.P.; Burke, K.; Ernzerhof, M. Generalized gradient approximation made simple. Phys. Rev. Lett. 1996, 77, 3865–3868. [Google Scholar] [CrossRef] [PubMed]
  37. Monkhorst, H.J.; Pack, J.D. Special points for Brillouin-zone integrations. Phys. Rev. B 1976, 13, 5188–5192. [Google Scholar] [CrossRef]
  38. Methfessel, M.; Paxton, A.T. High-precision sampling for Brillouin-zone integration in metals. Phys. Rev. B 1989, 40, 3616–3621. [Google Scholar] [CrossRef]
  39. Zunger, A.; Wie, S.-H.; Ferreira, L.G.; Bernard, J.E. Special quasirandom structures. Phys. Rev. Lett. 1990, 65, 353–356. [Google Scholar] [CrossRef] [PubMed]
  40. Van de Walle, A.; Asta, M.; Ceder, G. The alloy theoretic automated toolkit: A user guide. Calphad 2002, 26, 539–553. [Google Scholar] [CrossRef]
  41. Van de Walle, A.; Tiwary, P.; De Jong, M.; Olmsted, D.L.; Asta, M.; Dick, A.; Shin, D.; Wang, Y.; Chen, L.-Q.; Liu, Z.-K. Efficient stochastic generation of special quasirandom structures. Calphad 2013, 42, 13–18. [Google Scholar] [CrossRef]
  42. Hafner, J. Ab-initio simulations of materials using VASP: Density-functional theory and beyond. J. Comput. Chem. 2008, 29, 2044–2078. [Google Scholar] [CrossRef] [PubMed]
  43. Gyorffy, B.L.; Pindor, A.J.; Staunton, J.; Stocks, G.M.; Winter, H. A first-principles theory of ferromagnetic phase transitions in metals. J. Phys. F Met. Phys. 1985, 15, 1337–1386. [Google Scholar] [CrossRef]
  44. Gonser, U.; Meechan, C.J.; Muir, A.H.; Wiedersich, H. Determination of Néel temperatures in fcc iron. J. Appl. Phys. 1963, 34, 2373–2378. [Google Scholar] [CrossRef]
  45. Rankin, D.W. CRC handbook of chemistry and physics, 89th edition, edited by David R. Lide. Crystallogr. Rev. 2009, 15, 223–224. [Google Scholar] [CrossRef]
  46. Dey, P.; Nazarov, R.; Dutta, B.; Yao, M.J.; Herbig, M.; Friák, M.; Hickel, T.; Raabe, D.; Neugebauer, J. Ab initio explanation of disorder and off-stoichiometry in Fe–Mn–Al–C κ carbides. Phys. Rev. B 2017, 95, 104108. [Google Scholar] [CrossRef]
  47. Breßler, I.; Kohlbrecher, J.; Thünemann, A.F. SASfit: A tool for small-angle scattering data analysis using a library of analytical expressions. J. Appl. Crystallogr. 2015, 48, 1587–1598. [Google Scholar] [CrossRef] [PubMed]
  48. Eck, B. wxDragon Version 2.1.0; RWTH Aachen: Aachen, Germany, 2016. [Google Scholar]
  49. Owen, W.S.; Grujicic, M. Strain aging of austenitic hadfield manganese steel. Acta Mater. 1999, 47, 111–126. [Google Scholar] [CrossRef]
  50. Saeed-Akbari, A.; Mosecker, L.; Schwedt, A.; Bleck, W. Characterization and prediction of flow behavior in high-manganese twinning induced plasticity steels: Part I. Mechanism Maps and Work-Hardening Behavior. Metall. Mater. Trans. A 2012, 43, 1688–1704. [Google Scholar] [CrossRef]
  51. Koyama, M.; Sawaguchi, T.; Lee, T.; Lee, C.S.; Tsuzaki, K. Work hardening associated with ε-martensitic transformation, deformation twinning and dynamic strain aging in Fe–17Mn–0.6C and Fe–17Mn–0.8C TWIP steels. Mater. Sci. Eng. A 2011, 528, 7310–7316. [Google Scholar] [CrossRef]
  52. Koyama, M.; Sawaguchi, T.; Tsuzaki, K. Influence of dislocation separation on dynamic strain aging in a Fe–Mn–C austenitic steel. Mater. Trans. 2012, 53, 546–552. [Google Scholar] [CrossRef]
  53. Renard, K.; Ryelandt, S.; Jacques, P.J. Characterisation of the Portevin-Le Châtelier effect affecting an austenitic TWIP steel based on digital image correlation. Mater. Sci. Eng. A 2010, 527, 2969–2977. [Google Scholar] [CrossRef]
  54. Koyama, M.; Sawaguchi, T.; Tsuzaki, K. TWIP effect and plastic instability condition in an Fe–Mn–C austenitic steel. ISIJ Int. 2013, 53, 323–329. [Google Scholar] [CrossRef]
  55. Shen, Y.F.; Jia, N.; Misra, R.; Zuo, L. Softening behavior by excessive twinning and adiabatic heating at high strain rate in a Fe–20Mn–0.6C TWIP steel. Acta Mater. 2016, 103, 229–242. [Google Scholar] [CrossRef]
  56. Lai, H.J.; Wan, C.M. The study of work hardening in Fe–Mn–Al–C alloys. J. Mater. Sci. 1989, 24, 2449–2453. [Google Scholar] [CrossRef]
  57. Wang, X.; Zurob, H.S.; Embury, J.D.; Ren, X.; Yakubtsov, I. Microstructural features controlling the deformation and recrystallization behaviour Fe–30% Mn and Fe–30% Mn–0.5% C. Mater. Sci. Eng. A 2010, 527, 3785–3791. [Google Scholar] [CrossRef]
  58. Song, W.; Ingendahl, T.; Bleck, W. Control of strain hardening behavior in high-Mn austenitic steels. Acta Metall. Sin. (Engl. Lett.) 2014, 27, 546–556. [Google Scholar] [CrossRef]
  59. Song, W. Mn-C short-range ordering and local deformation in a high-manganese steels. Mater. Sci. Eng. A 2018. in submission. [Google Scholar]
  60. Daamen, M.; Nessen, W.; Pinard, P.T.; Richter, S.; Schwedt, A.; Hirt, G. Deformation behavior of high-manganese TWIP steels produced by twin-roll strip casting. Procedia Eng. 2014, 81, 1535–1540. [Google Scholar] [CrossRef]
  61. Ma, Y.; Song, W.; Bleck, W. Investigation of the microstructure evolution in a Fe–17Mn–1.5Al–0.3C Steel via in situ synchrotron X-ray diffraction during a tensile test. Materials 2017, 10. [Google Scholar] [CrossRef]
  62. Shun, T.; Wan, C.M.; Byrne, J.G. A study of work hardening in austenitic Fe–Mn–C and Fe–Mn–Al–C alloys. Acta Metall. Mater. 1992, 40, 3407–3412. [Google Scholar] [CrossRef]
  63. Zuidema, B.K.; Subramanyam, D.K.; Leslie, W.C. The effect of aluminum on the work hardening and wear resistance of hadfield manganese steel. Metall. Trans. A 1987, 18, 1629–1639. [Google Scholar] [CrossRef]
Figure 1. The four different structural models (STM) of the Fe88Mn20C3 system differing in Mn arrangement, each showing one exemplary configuration. Fe atoms are red, Mn atoms beige, C atoms black. Darker grey polyhedra are shown to identify the Mn6 units in the three ordered systems, with lighter grey polyhedra in structure (3) signifying Mn5Fe.
Metals 08 00044 g001
Figure 2. The small angle neutron scattering (SANS) curves of the X60Mn18 steel recrystallization annealed at 800 °C for 2 min and 30 min.
Metals 08 00044 g002
Figure 3. The evolution of Mn–C short-range ordering (SRO) volume fraction distribution of the X60Mn18 steel recrystallization annealed at 800 °C for 2 min and 30 min.
Metals 08 00044 g003
Figure 4. Averaged total energies E ¯ tot as a function of the amount of Mn in the 1st coordination sphere (CS) of a single C atom in Fe88Mn20C ( r ¯ C Mn , 1 CS 1.90 Å). Lines between symbols are shown for better readability and are color-coded. (a) E ¯ tot in the disordered structural model (STM) (1) with varying amounts of Mn atoms in the 2nd CS of C ( r ¯ C Mn , 2 CS 3.05 Å); (b) E ¯ tot in the ordered STMs (2), (3) and (4), with 0 and 1 Mn atoms in the 2nd CS for (3) and 0 for (2) and (4).
Metals 08 00044 g004
Figure 5. Averaged total energies E ¯ tot as a function of the smallest C–C distance r C C , min in the Fe88Mn20C3 systems for all four structural models (STM). Lines between symbols are shown for better readability and are color-coded.
Metals 08 00044 g005
Figure 6. Radial distribution functions (RDF) for Mn–C (red) and C–C (green) contacts in Fe88Mn20C3. (a) RDF for structural model (STM) (3), with a and b being the least and most energetically favored structures, respectively; (b) RDF for STM (4), likewise.
Metals 08 00044 g006
Figure 7. Microstructure of X60Mn18 steel (a) cold rolled; (b) recrystallization annealed at 800 °C for 2 min; (c) recrystallization annealed at 800 °C for 30 min.
Metals 08 00044 g007
Figure 8. (a) Engineering stress-strain curves of 2 min (black) and 30 min (blue) annealed specimens; (b) The enlargement of the boxed segment of the strain-stress curve exhibiting type-A serrations, showing the serration with a steep rise in stress alternating by plateau-like features.
Metals 08 00044 g008
Figure 9. Two-dimensional (2D) composition-dependent stacking fault energy (SFE) maps summarizing the chemical composition of high-Mn steels with serration flow: (a) Fe–Mn–C system (b) Fe–Mn–1.5Al–C system.
Metals 08 00044 g009
Table 1. Chemical composition of the investigated X60Mn18 steel.
ElementCSiMnPSCrNiAlFe
wt %0.5940.0518.400.0070.0090.020.040.005Rest

