Resistivity and Passivity Characterization of Ni-Base Glassy Alloys in NaOH Media

1
Chemistry Department, College of Science, Taibah University, Al-Madinah Al-Monawarah 41477, Saudi Arabia
2
Chemistry Department, College of Science, Taibah University, Yanbou 41912, Saudi Arabia
*
Author to whom correspondence should be addressed.
Metals 2018, 8(1), 64; https://doi.org/10.3390/met8010064
Submission received: 20 December 2017
/
Revised: 13 January 2018
/
Accepted: 14 January 2018
/
Published: 18 January 2018
(This article belongs to the Special Issue Metallic Glasses: Pathways to Viable Applications)
Abstract
:Resistivity and passivation behavior of two Ni-base bulk metallic glasses, with the nominal composition of Ni70Cr21Si0.5B0.5P8C ≤ 0.1Co ≤ 1Fe ≤ 1 (VZ1) and Ni72.65Cr7.3-Si6.7B2.15C ≤ 0.06Fe8.2Mo3 (VZ2), in various concentrations of NaOH solutions were studied. The investigations involved cyclic polarization (CP), electrochemical impedance spectroscopy (EIS), and electrochemical frequency modulation (EFM) methods. Cyclic polarization measurements showed spontaneous passivation for both Ni-base glassy alloys at all alkaline concentrations, due to the presence of chromium as an alloying element that formed an oxide film on the alloy surface. The EIS analysis showed that the passive layers grown on the two Ni-base glassy alloy surfaces are formed by a double oxide layer structure. Scanning electron microscope (SEM) examinations of the electrode surface showed Cr, Ni, Fe, and O rich corrosion products that reduced the extent of corrosion damage. Atomic force microscopy (AFM) imaging technique was used to evaluate the topographic and morphologic features of surface layers formed on the surface of the alloys.

1. Introduction
Bulk metallic glasses (BMGs) or glassy metals are considered to be the materials of the future [1]. This is attributed to their chemically and structurally homogeneous nature, providing a lack of local electrochemically active sites [2]. A good corrosion resistance is considered as one of the advantages of metallic glasses (MGs). It is thought that high corrosion resistance, combined with easy formability in the super cooled liquid region, leads to the outstanding application potentials in place of traditional crystalline metals [3]. Nickel, and its alloys, have traditionally been the materials of choice for anodes in the process of alkaline electrolysis of water, due to their relatively long-term stability and high corrosion resistance [4,5,6,7]. Ni-base BMG alloy was studied in a different type of aqueous, i.e., boiling of 6 M HNO3 and 6 M HNO3 + 5 g·L−1 Cr6+ solutions [5]. Additionally, they have been intensively studied, especially to further improve their corrosion resistivity property, e.g., the passive films formed on Ni82.3Cr7Fe3Si4.5B3.2 and Ni75.5Cr13Fe4.2Si4.5B2.8 in 1.0, 3.0, 6.0, 9.0, 12.0 M HCl, and in 1.0, 3.0, 6.0, 9.0, 12.0 M H3PO4 [6,7].
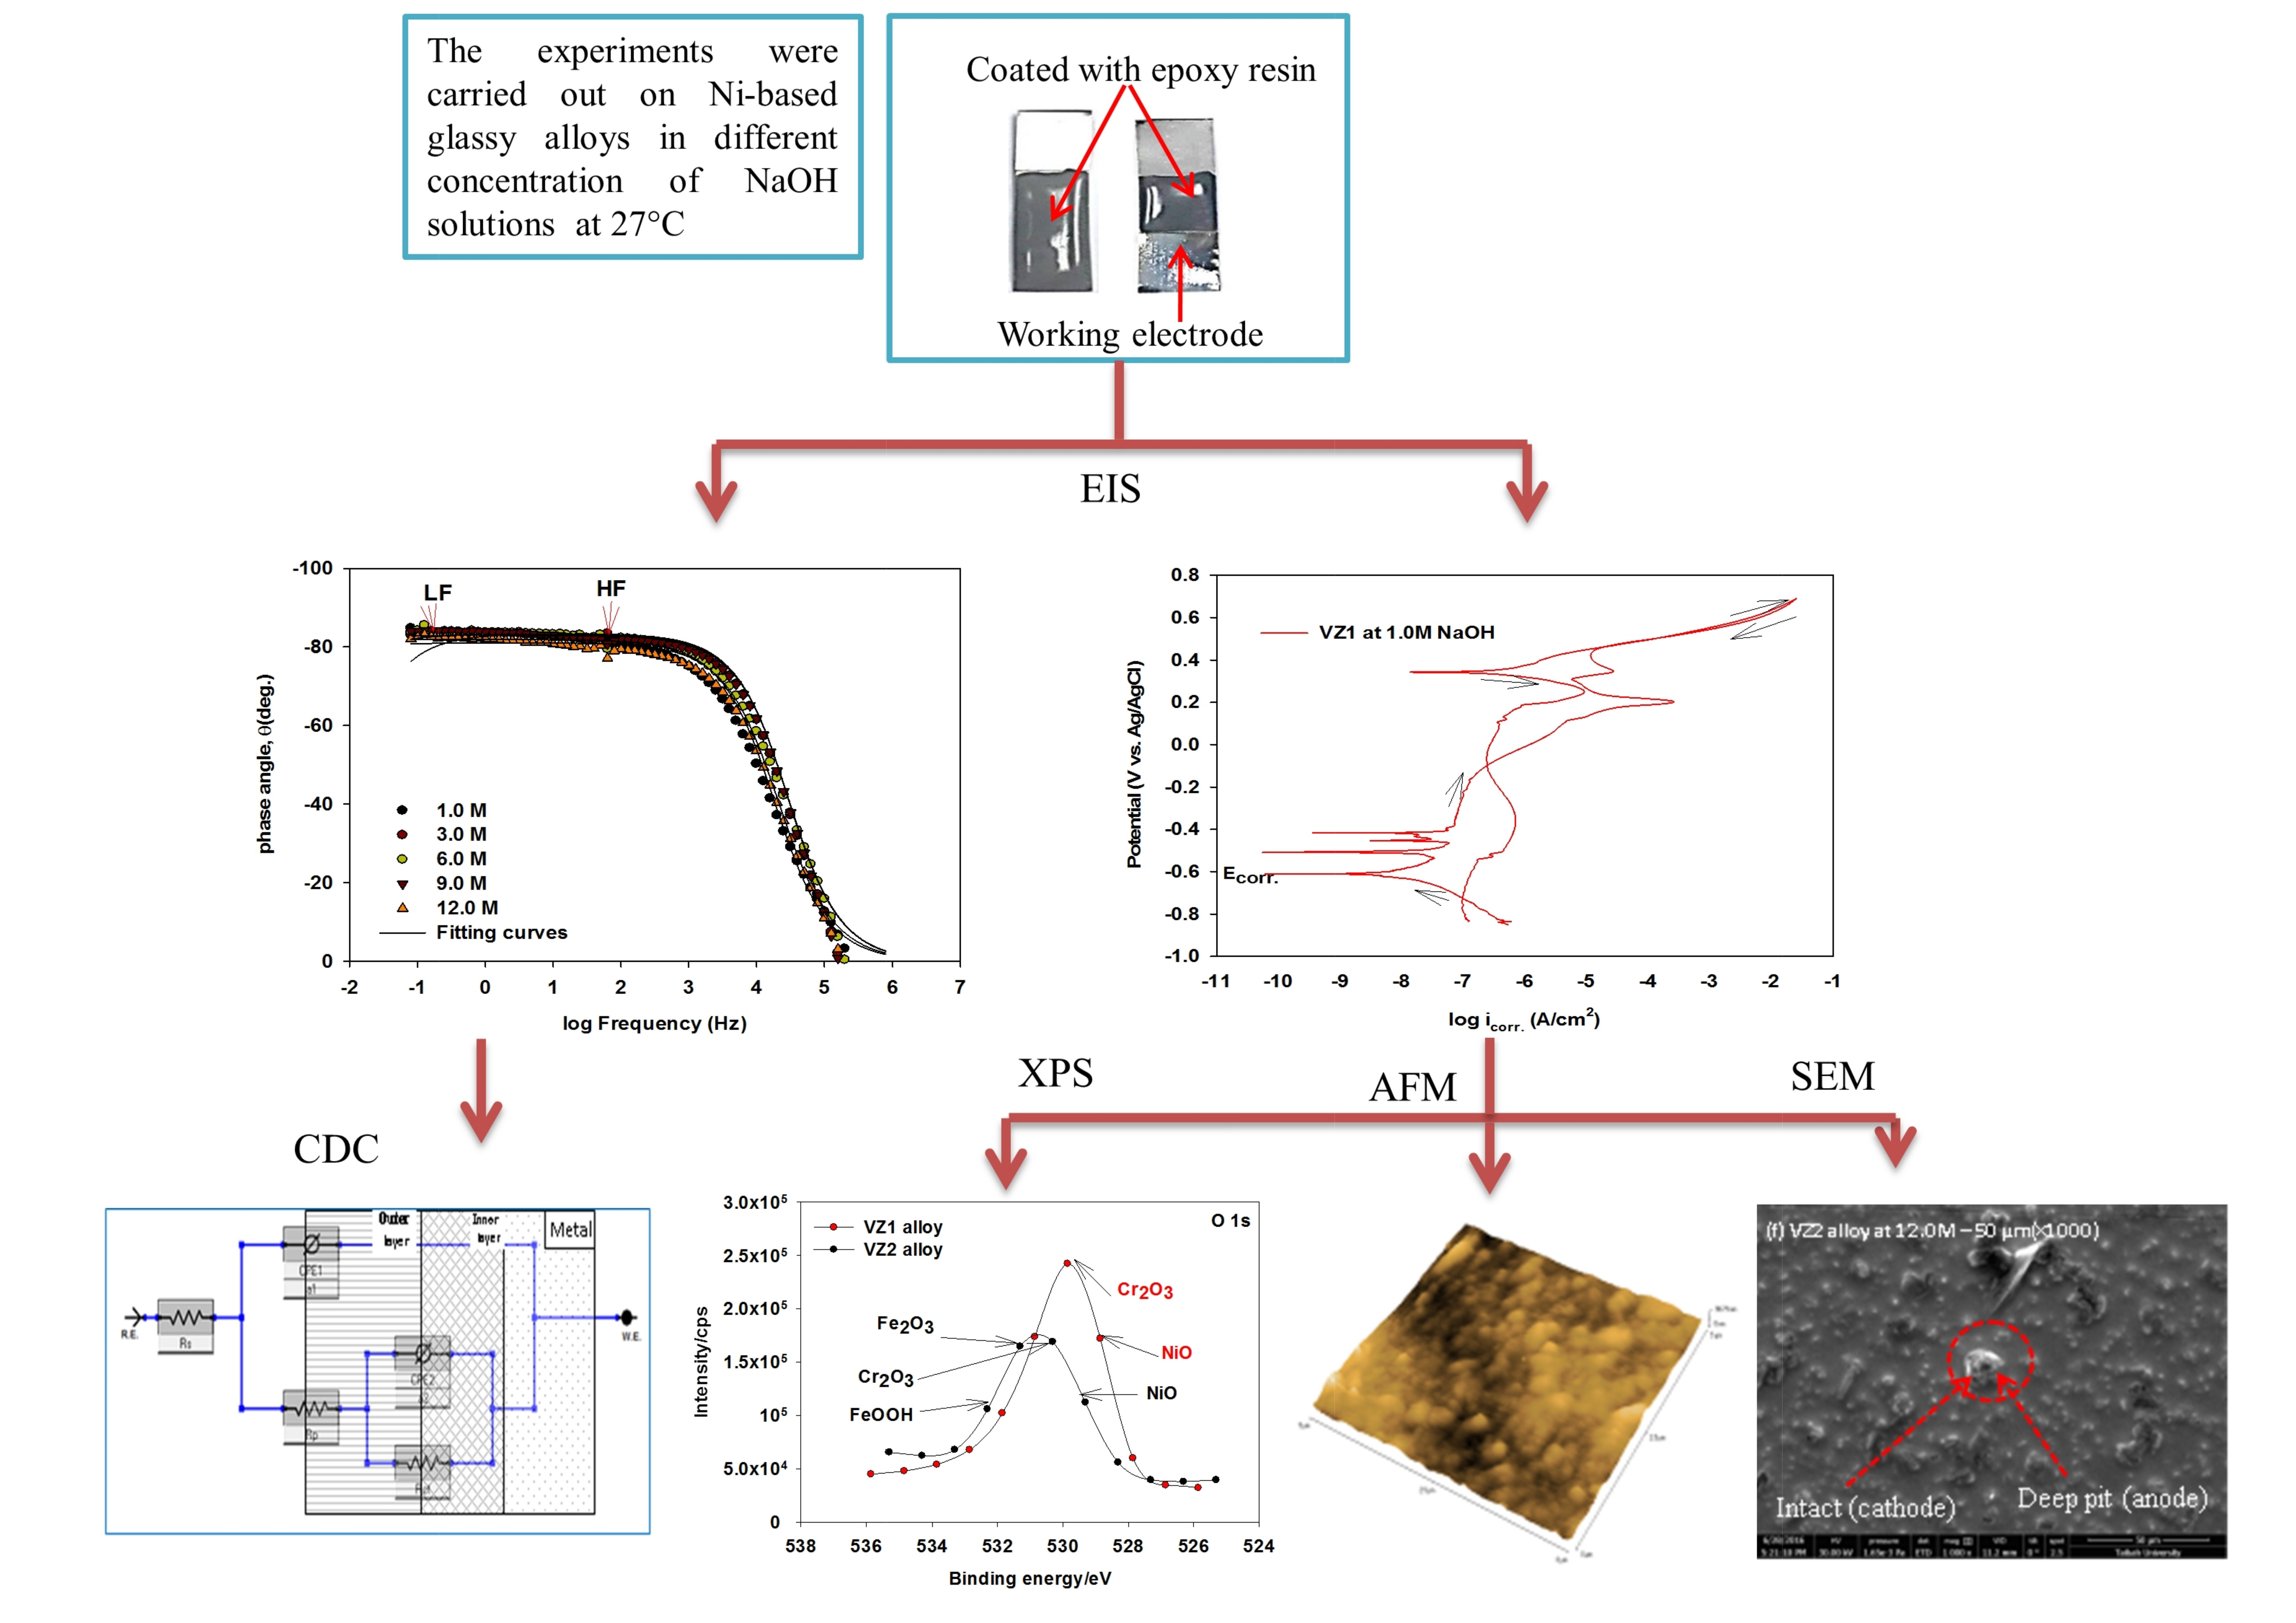
This work revealed the resistivity properties of Ni-base glassy alloys in NaOH solutions, and the passivation films created on the surface of the alloys. Experiments were performed at a different concentration and a temperature of 27 °C in order to understand the role of the concentration on the behavior of the passive film formation on the VZ1 and VZ2 alloys. The electrochemical behavior of the passive film was studied by EFM (electrochemical frequency modulation) measurements. Then, the corrosion resistance of the alloys was studied by EIS (electrochemical impedance spectroscopy) measurements, followed by cyclic polarization, in order to study the disruption of surface passivity and evolution of the corrosion parameters. The surface condition and chemical composition of the alloys surface after cyclic polarization were examined using XPS (X-ray photoelectron spectroscopy), SEM (scanning electron microscope), and AFM (atomic force microscopy). A comparison of the two alloys’ results under identical conditions, can yield additional information on the influence of Cr quantity (wt %) in Ni-base glassy alloys on the corrosion resistance.
2. Experiments
Two Ni-base BMG alloys supplied by Vacuum Schmelze Company (Essen, Germany), with nominal compositions (wt %) of Ni70Cr21Si0.5B0.5P8C ≤ 0.1Co ≤ 1Fe ≤ 1 (VZ1) and Ni72.65Cr7.3Si6.7B2.15C ≤ 0.06Fe8.2Mo3 (VZ2) were investigated. The alloys’ ingots were produced as ribbons of about 40–74.5 mm width and 25 μm thickness.
The test electrolytes used in the study were 1.0, 3.0, 6.0, 9.0, and 12.0 M NaOH solutions, which were prepared from reagent grade chemical and double distilled water. The sodium hydroxide was obtained from Aldrich Chemical Co. (Jeddah, Saudi Arabia).
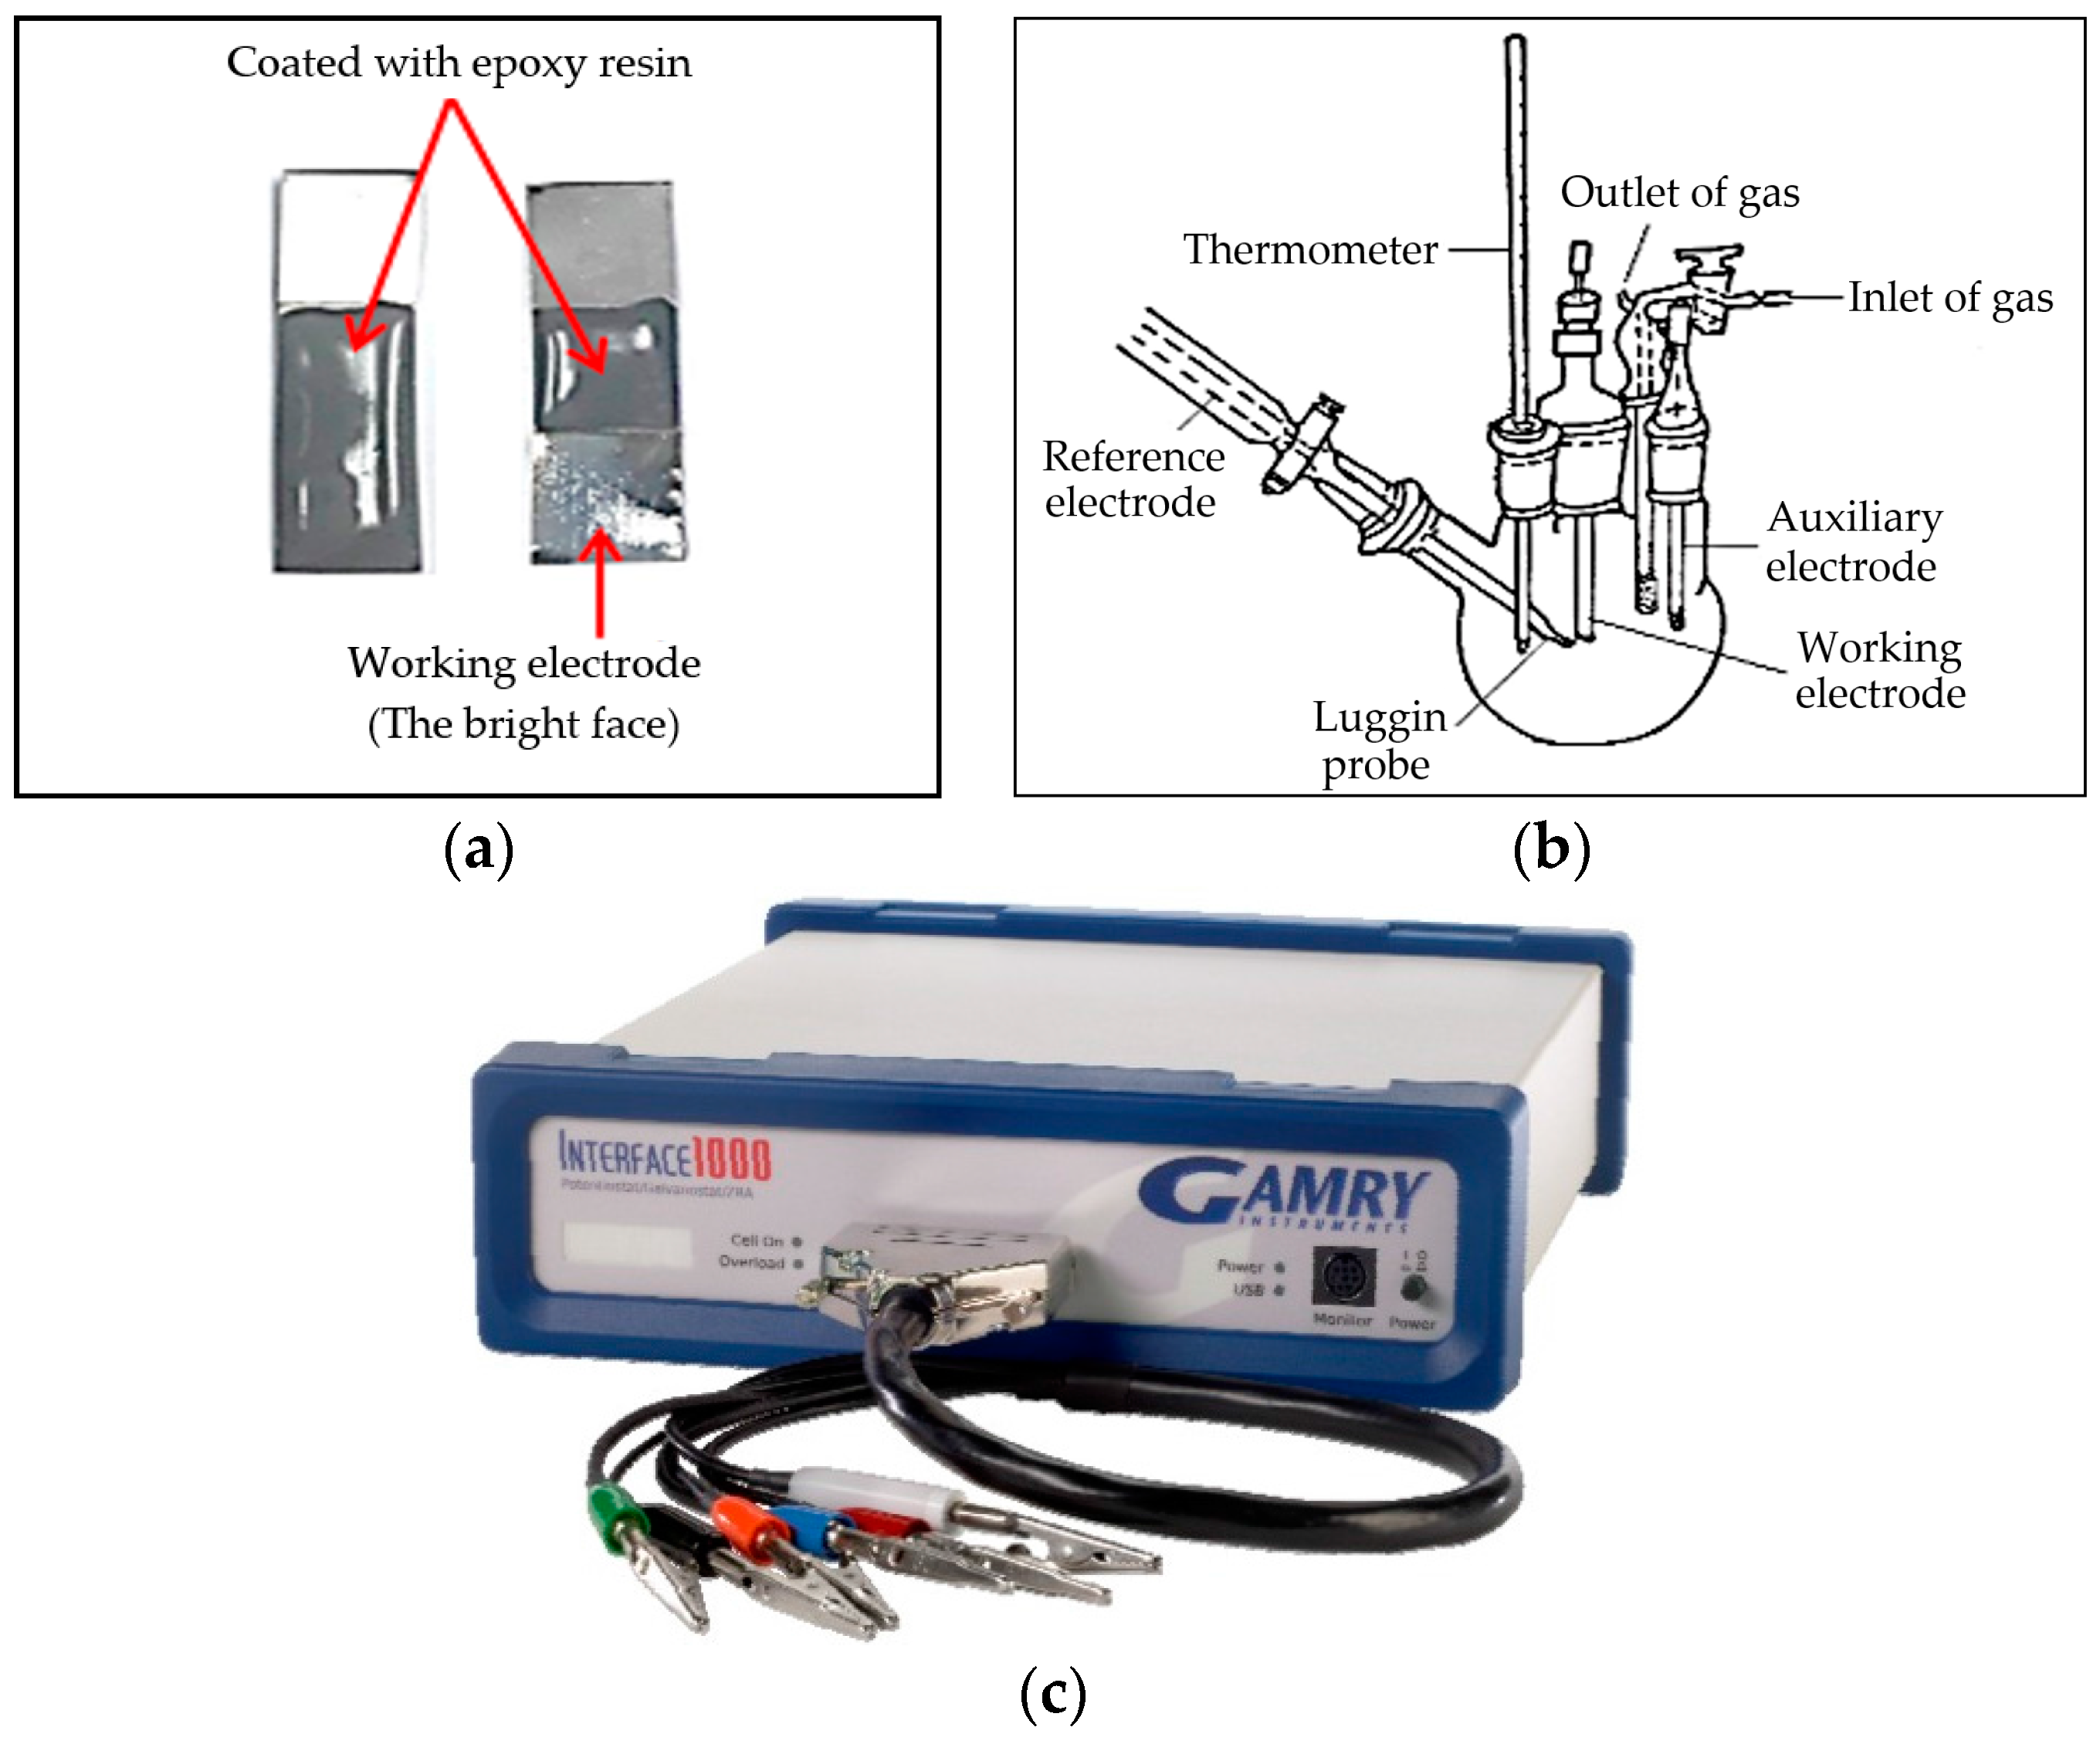
For electrochemical testing, the specimens of BMG alloys were evaluated under the same experimental conditions, all of which was carried out in a working area of (100 mm2). Just one side of the sample was exposed to the corrosive environment (the bright face) as the working electrode. The other side was coated with epoxy resin (Figure 1a). Before each measurement, this working electrode was degreased with acetone, rinsed several times with double distilled water, cleaned in an ultrasonic bath and finally connected to a copper specimen holder and immersed in the sodium hydroxide solution. The electrochemical measurements were performed in a typical three-compartment glass cells containing three electrodes; the working electrode (WE), which is the alloy under study, a platinum wire as counter electrode (CE) and the reference electrode (RE) is saturated by Ag/AgCl (Figure 1b). Electrochemical measurements were conducted by means of an Interface 1000TM, Gamry Potentiostat/Galvanostat/ZrA analyzer (Gamry Instruments Inc., Philadelphia, PA, USA). Echem Analyst 5.58 software (5.58, Gamry Instruments Inc., Philadelphia, PA, USA) was used for plotting, graphing and fitting data.
The potential of the examined alloys were recorded as a function of time: over 1 h until it became stable. The electrochemical frequency modulation (EFM) data analysis with baseline frequency (b.f.) 0.1 Hz, and input frequencies of 2 Hz and 5 Hz, were used and the corrosion process under investigation was passive. EFM can be completed in a short time, using a non-destructive technique, to determine the corrosion rate without prior knowledge of Tafel slopes. EFM also measures two causality factors 2 and 3 (CF-2, CF-3), and they are used to corroborate the reliability of the acquired data [8]. The EIS measurements were carried out with a sinusoidal voltage of 10 mV and 10 points per decade, with a frequency range from 800 kHz to 0.1 Hz. For passive metals, the most convenient method for studying the kinetics of passivation process is the construction and analysis of anodic polarization curves, that is, establishing the dependence between anodic current and electrode potential [9]. Cyclic polarization curves were obtained with a potential sweep rate of 1 mV·s−1. The potential sweep from cathodic to anodic directions after impedance, run in the range from −800 mV to 1200 mV. X-ray photoelectron spectroscopy (XPS) measurements were carried out using a monochromatic Al Kα X-ray source operating at 300 W (Kratos Analytical Ltd., Manchester, UK). The analyzed surface was about 5 mm × 5 mm. After cyclic polarization, the surface condition and chemical composition of the alloys’ surfaces were examined using a JEOL JSM-6000 scanning electron microscope (SEM; Superscan SS-550, Shimadzu, Kyoto, Japan). The acceleration voltage was 15 kV, and the working distance was 10 mm. AFM (Veeco Instruments, Fremont, CA, USA) measurements were carried out using contact mode, resulting in a constant scanning force adjusted to 225 nN, with scanned area of 5 μm × 5 μm and a resolution of 256 × 256 pixel. A digital instrument CP-II (Veeco Instruments), was used for the measurements of the VZ1 and VZ2 alloys.
3. Results and Discussion
3.1. Passivation and Resistance Characterization
The complex plane, and Bode phase plots for the VZ1 and VZ2 alloys were recorded at the open circuit potential (OCP) in 1.0, 3.0, 6.0, 9.0, and 12.0 M NaOH concentrations at 27 °C, in order to estimate the passivation and resistance of studied alloys.
The Nyquist spectra representation in Figure 2a,b for VZ1 and VZ2 alloys, respectively, are characterized by an open arc with two time constants. The first time constant was recorded at high frequencies (HF), where the properties of electrode/electrolyte interfaces were particularly reflected, and it was displayed as a depressed incomplete semi-circle. The second time constant was recorded at low frequencies (LF), which corresponds to the transport of ions. The Bode phase plot in Figure 2c,d for VZ1 and VZ2 alloys, respectively, and the Bode magnitude plot in Figure 2e,f for VZ1 and VZ2 alloys, respectively, shows the capacitive behavior at high frequencies (between 800 kHz and 400.5 kHz). It is related to the location of the reference electrode in the experimental setup and, thus, is not considered in the fitting of the spectra. Two time-constants can be observed in the frequency range from 400.5 kHz to 0.1 Hz. This suggests a double oxide layer structure on nickel-based alloy in alkaline solution. An inner protective oxide layer (rich in chromium) was formed on the metal itself by solid state oxidation [10]. An outer porous oxide layer (observed by SEM) formed by redeposition of extra nickel ions on the surface as nickel oxide, with a small amount of Cr oxides. This creates an outer porous layer that obscures the underlying barrier oxide layer.
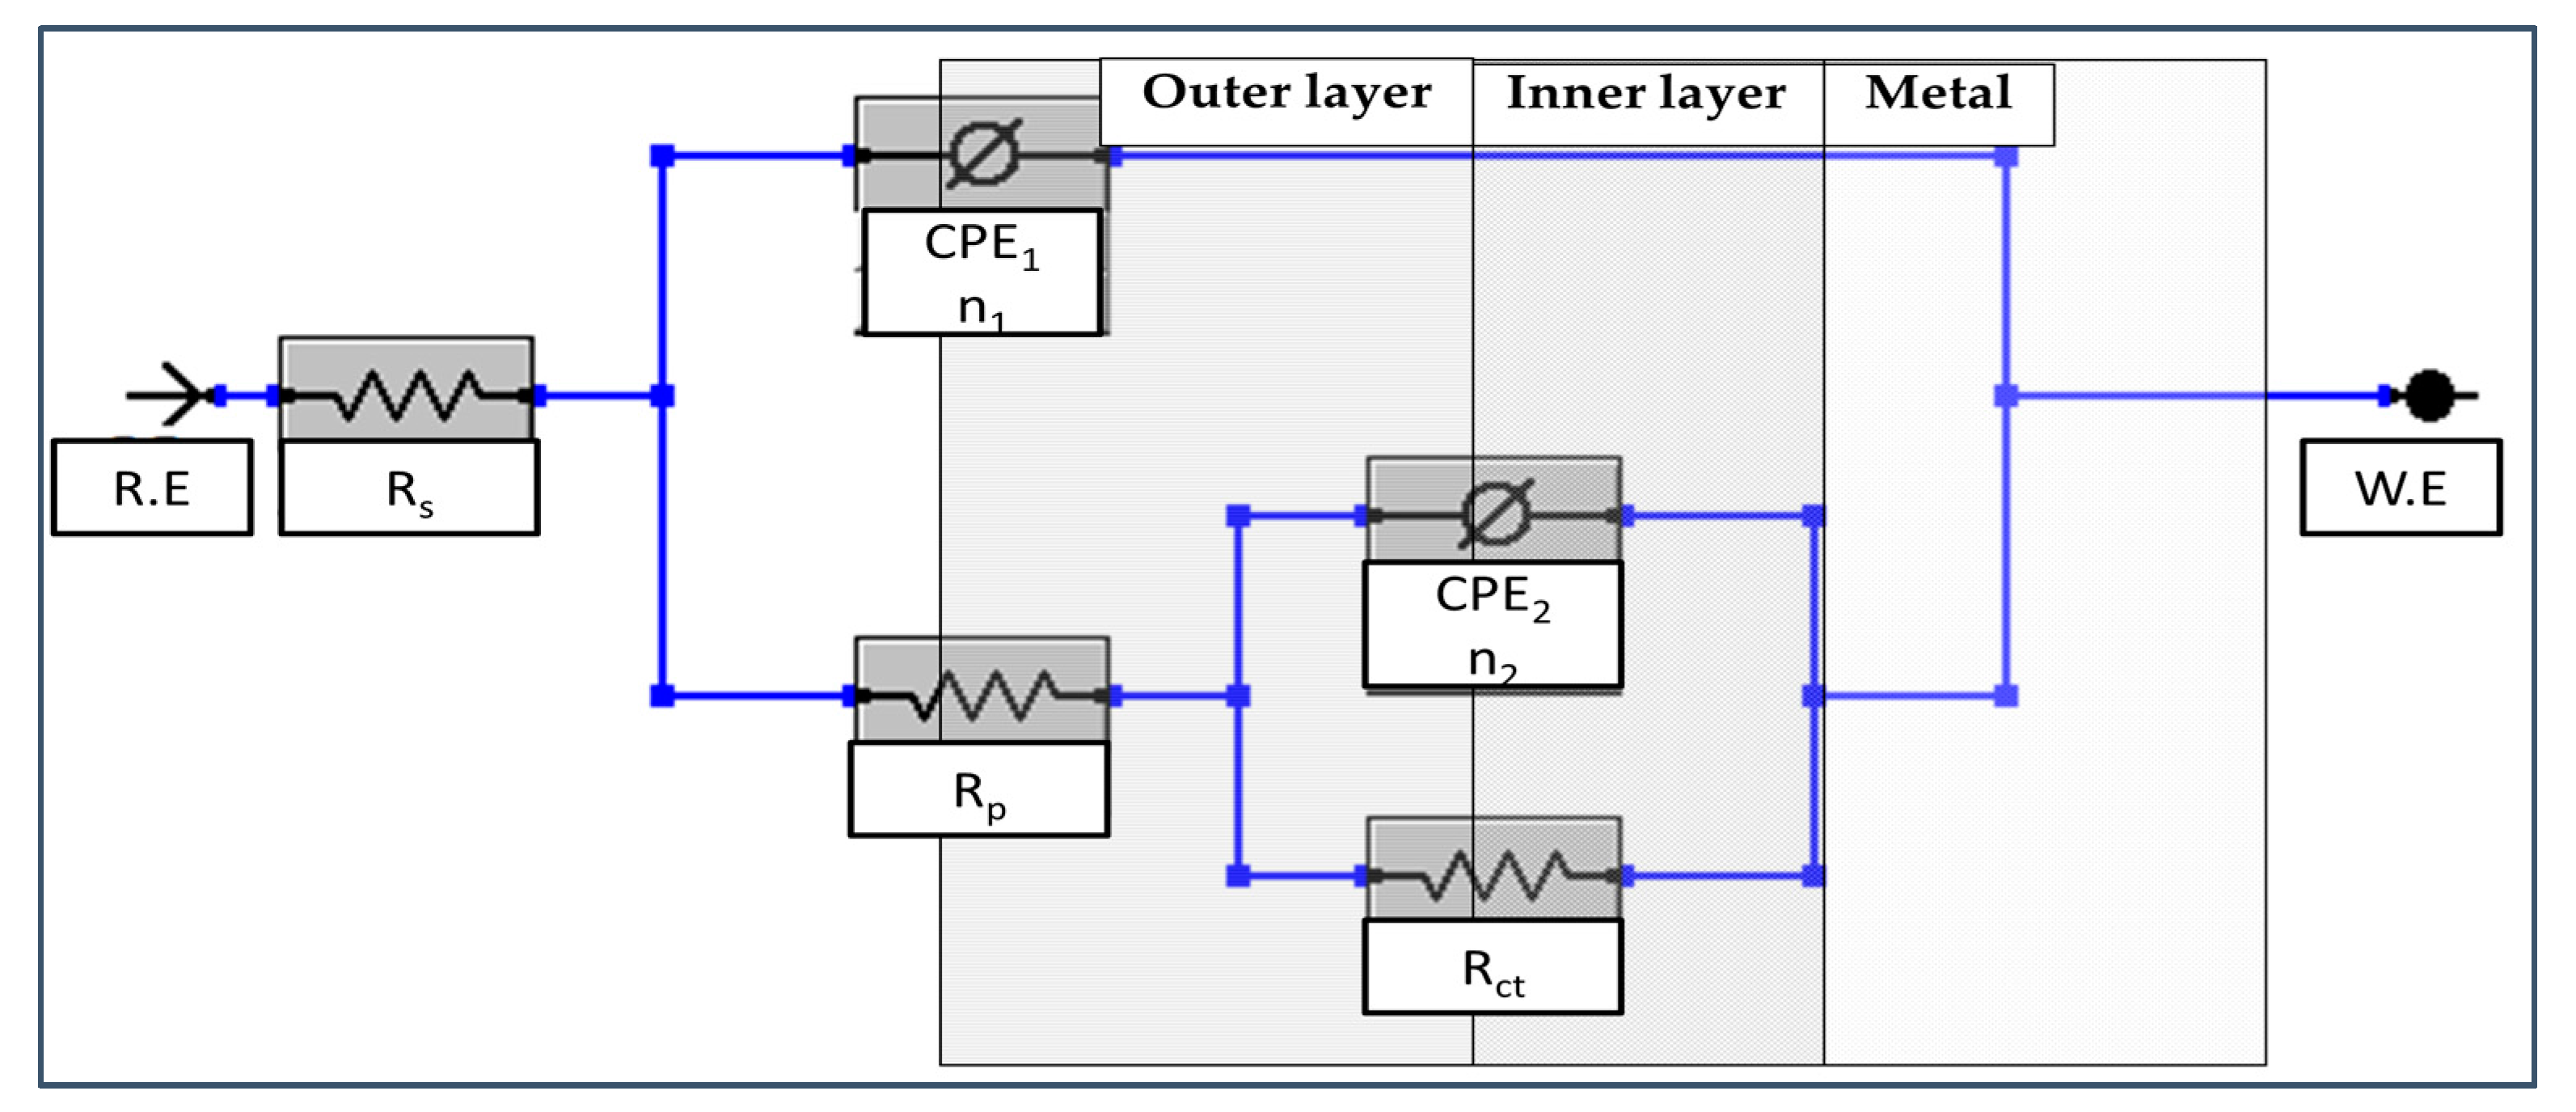
Electrical circuit with circuit description code (CDC) Rs(Q1[RP(Q2Rct)]), shown in Figure 3 was used in order to analyze spectra in Figure 2. The fitting curves with χ2 = 10−4 are plotted as a solid line and the values of the fitting parameters are presented in Table 1. The Rct value, inner barrier layer resistance, are significantly larger than the Rp, outer porous layer resistance. This result suggests that the corrosion protection is dominated by the barrier oxide layer.
The constant phase element (CPE) elements are commonly converted into a pure capacitance (C) by means of the following equation Equation (1) [11]:
where Ceff is the effective capacity (F·cm−2), R is the charge transfer resistance (Ω·cm2), Q is the constant phase element (Ω−1·cm−2·sn), and n is the surface roughness 1 ≥ n ≥ 0 [12].
Assuming a surface time-constant distribution, the effective capacity could be calculated by Equation (1), and the corresponding, oxide thickness formed on Ni-base glassy alloys can be calculated at different concentration of NaOH according to Equation (2) [12]:
where d is the average thickness of the protective layer, ε is the dielectric constant of the oxide film (dielectric constant of 12 was adopted for NiO as the outer passive layer and 30 for Cr2O3 as the inner passive film, as was later confirmed by XPS analysis), ε0 is the vacuum permittivity (ε0 = 8.854 × 10⁻¹⁴ F·cm−1), and A is the effective surface area of the electrode (1 cm2) [13].
From the above data in Table 1 for both alloys, it is evident that the increase of the Q1 parameter values with augmentation alkaline concentration is due to decrease of the outer oxide layer thickness (d1), due to the dissolution of the Ni oxide at high pH. According to the Pourbaix diagram, at relatively high pH, such as 9.0 M and 12.0 M NaOH, where the pH of about 13.9 and 14, respectively, the soluble product (HNiO2−) can be produced due to the hydrolysis of Ni oxide according to Equation (3) [14]:
The surface roughness caused by dissolution consequently increases the real surface area and double layer capacitance, Q1, while decreasing n1. For the inner barrier oxide layer capacitance values, CPE2, augmentation with increasing alkaline concentration is due to increase of the charge carriers density (defects points in the inner protective oxide layer/electrolyte interface region, or to the poorly ordered structure of the inner passive film [15]). This turn leads to the reduction of the film thickness (d2). The inner barrier oxide layer formed on Ni-Cr alloys at a low potential is an n-type semiconductor, which is a good catalyst for oxygen reduction reaction and the charge carriers are, thus, electrons that come from oxygen vacancies [16,17].
The switch from n-type to p-type can be attributed to the generation of cationic vacancies at the outer porous oxide layer/electrolyte interface according to Equations (4) and (5) [18]:
The transition from n-type to p-type is predicted to lead to a decrease in the barrier layer thickness as observed in this study. The increase of the charge carriers’ density is due to a high dissolution rate of the alloy elements, which induce a high generation rate of cationic vacancies at the film/solution interface above the point of cation vacancy condensation at the alloy/film interface in relation to the pitting initiation phenomena [19].
The reduction in the Rct at high pH, denoted by the high charge exchange rate at the interface inner oxide layer/electrolyte. A clear drop in Rp observed due to the increase in the solution conductivity, following the localized dissolution of the alloy [10].
In the analyses section of EIS, the comparison between the VZ1 alloy and the VZ2 alloy shows that the Nyquist and Bode plots of the VZ2 alloy have a similar tendency with that of the VZ1 alloy. The polarization resistance of the porous outer layer Rp values of the VZ2 alloy are lower by a factor of about 1 × 10³ times than that of the VZ1 alloy. The VZ2 alloy also exhibits lower polarization resistance of the inner barrier layer, Rct, values as compared with VZ1 alloy. Furthermore, the degree of inhomogeneity, n2, values of the VZ2 alloy seems to be stable and close to 0.86, whereas the n2 values of the VZ1 alloy are close to 0.9. That reveals the highly homogeneous oxide film formed on 21% Cr alloy.
The protective layer on VZ1 (pertaining to the corrosion morphology observed by SEM) is denser and more compact than that of the VZ2 alloy. This can be confirmed by a total passive layer thickness of values in Table 1 (2.35–0.890 nm for VZ1 and 2.00–0.588 nm for VZ2). The reason could be attributed to the presence of noble metals such as 21% Cr to Ni-base glassy alloy [20].
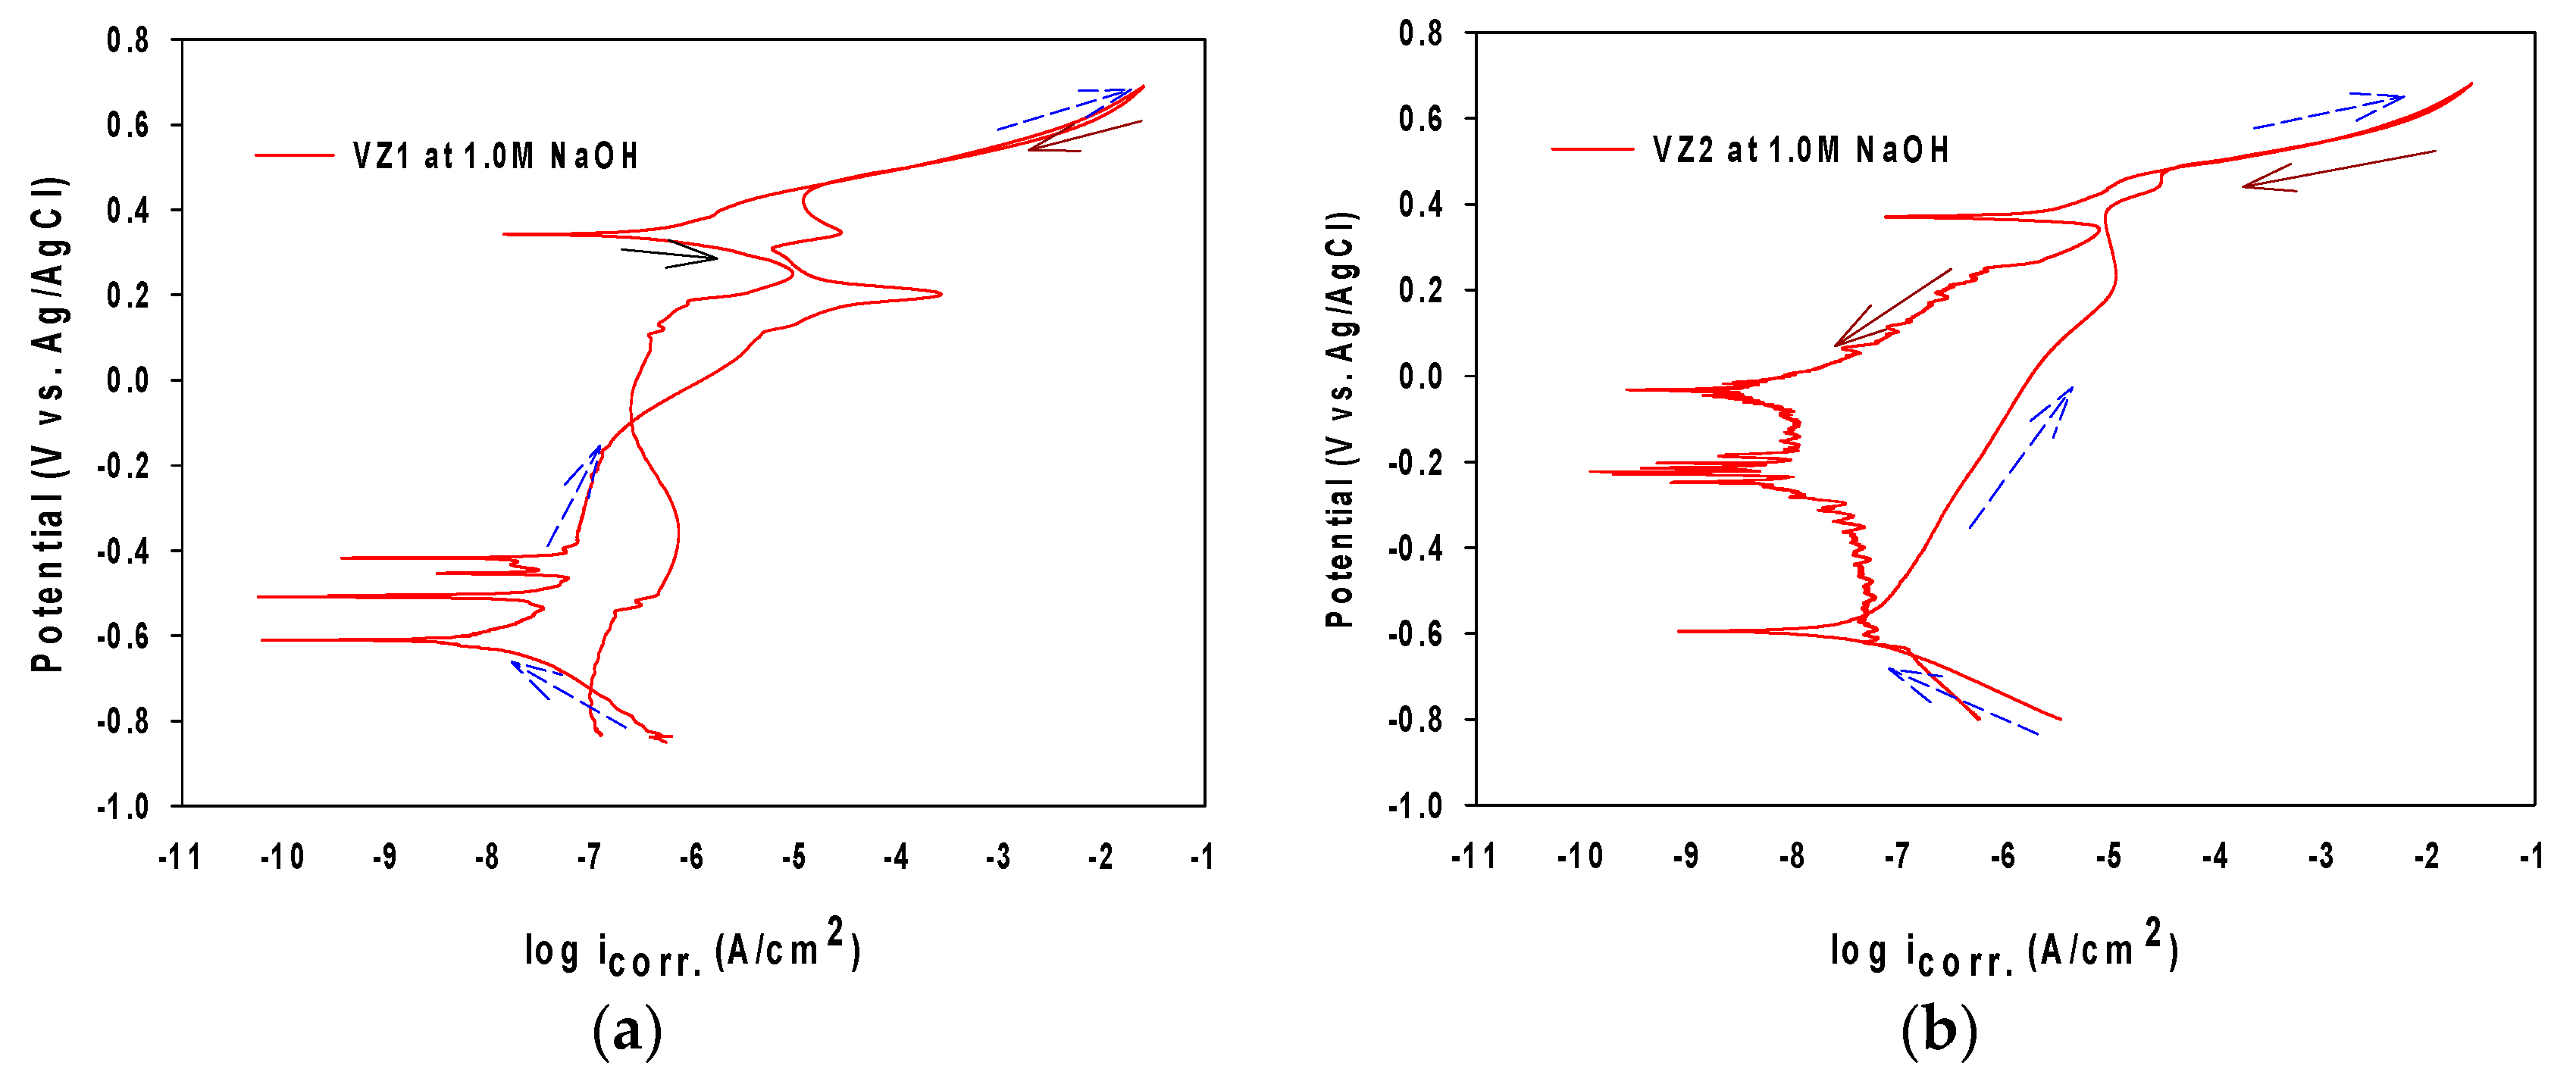
Spontaneous passivation with obvious passivation region, and a very low passivation current density in NaOH solutions was observed in the polarization curves of VZ1 and VZ2 in Figure 4a,b. The curves recorded for other concentrations were similar and have been omitted for better clarity of the figures. The reverse portions of the scan show much disturbance due to many fluctuations in the current density, as the potential is ramped downwards [21]. All polarization curves were quite similar, while the cathodic and anodic scans exhibit higher polarization currents with a gradual shift towards more negative potential values, as the alkaline concentration moved to the top, confirming the predominant cathodic effectiveness.
In the alkaline solutions, nickel and chromium were dissolved preferentially and the chromium element rapidly forms a chromium-rich thin passive film acting as a barrier oxide layer to prevent the anodic dissolution. Progressing pH, raised the corrosion current density (Table 2). Moreover, the corrosion rate (icorr) at 12.0 M NaOH is higher at about 67.8 and 1.5 times than at 1.0 M for VZ1 and VZ2, respectively. The potential needed to reach the passivity region (Ecorr − Epass), reduced with decreasing alkaline solution pH. As a result, the passivation tendency is increased by 53% and 72% from 1.0 M to 12.0 M for VZ1 and VZ2, respectively. This may be attributed to the incorporation of OH− on porous layer (as SEM analysis confirmed later).
In each curve, the anodic current increases rapidly after the knee point appearing at pitting potential (Epit), depending on the alkaline solution concentration, leads to film breakdown. In the first passivation region, this is due to the oxidation of chromium (III) to chromium (VI), which activates the surface and causes transpassive dissolution of the passive surface [18]. In the second passivation region, the formation of an unstable passive layer of higher oxides of nickel can be observed at all concentrations.
In both two alloys, the hysteresis loop area (Erep – Epit), was observed only at 9.0 M and 12.0 M NaOH, where Erep is the passivation or protection potential. It reached an increase of 81.65% and 99.22% from 9.0 M to 12.0 M for the VZ1 alloy and the VZ2 alloy, respectively. This suggests that a high concentration of alkaline solution can be aggressive for the VZ1 and VZ2 alloys, and is also an accelerator for localized attack on the oxide film.
To confirm the validation of the corrosion parameters measured by cyclic polarization and EIS methods, the EFM techniques were carried out in NaOH at 27 °C (obtained curves not shown here). The values of kinetic parameters, such as icorr, βc, and both causality factors (CF-2 and CF-3) are given in Table 3. The corrosion current density showed a clear tendency to increase, when NaOH concentration increases. Both alloys exhibited an outstanding corrosion resistance by having low corrosion rate in mm/year values (<0.02 mm/year) at all alkaline concentrations [22]. According to Table 3, the VZ1 alloy at all alkaline concentrations had a lower corrosion current density icorr, which, compared with VZ2 alloy, indicates a better corrosion resistance, confirming AC and DC techniques. The causality factors in Table 3 are very close to theoretical values, with some deviation due to the high resistivity of the studied alloy.
3.2. The Formation of Corrosion Film in Immersion Solution
For both alloys, the XPS surveyed spectra of passive film formed on VZ1 and VZ2 alloys in 1.0 M NaOH obtained in the passive region showed the presence of mainly nickel, chromium, iron, and oxygen signals (obtained curves not shown here). The obtained high-energy resolution spectra, collected for individual elements assigned in the spectra for Ni 2p3/2, Cr 2p3/2, Fe 2p3/2, and O 1s of the VZ1 and VZ2 alloys were then analyzed. The analysis of the Ni 2p3/2 spectrum after the treatment of Figure 5a, showed a broad peak, representing the metallic state Ni (metal Nimet 2p3/2), 852.3 eV, and Ni(II) oxide (Niox 2p3/2), at a binding energy of about 853.3 eV (Figure 5a). According to the analysis, the corrosion resistance and the limiting current shown in anodic polarization curves of Ni-base glassy alloys are attributable mainly to the formation of hydrated chromium oxyhydroxide film [CrOx(OH)3–2x·nH2O], which was formed in the of range 576.3–579.7 eV, according to the data from existing literature [12,23]. Therefore, the peak binding energy of Crox 2p3/2, was observed at 576.3 eV (Figure 5b), reflecting the presence of Crox in the trivalent state on the alloy surface as Cr2O3, which is a formation in the inner part of the passive film. In the case of the VZ2 alloy, Feox 2p3/2 peak is wide and asymmetrical, indicating the existence of an oxidation state of iron at different binding energy. The peaks showed in Figure 5c are related to the binding energy of Fe2O3 at 710.3 eV and FeOOH at 711.6 eV and the metastable iron oxide-hydroxide will transform to steady Fe3O4 as corrosion period conform to the date in the literature [24,25]. The spectra for Oox 1s (Figure 5d), can be fitted with the components corresponding to the oxide of nickel (529.9 eV), chromium oxide (530.3 eV), Fe2O3 (531.3 eV), and FeOOH (532.7 eV). According to analysis, the corrosion resistance of VZ2 alloy is attributable mainly to the formation of NiO, Cr2O3, Fe2O3, and FeOOH.
3.3. Morphological and Structural Characterizations
Figure 6a,b shows the as-received surface of the bulk glassy alloys. The SEM image revealed a smooth and uniform surface morphology. After the cyclic polarization tests in various NaOH concentrations at 27 °C, the surface morphologies of the Ni-base glassy alloys are shown in Figure 6c,f. A compact passive layer nearly covering most of the VZ1 alloy (Figure 6c). Very small intensities of pits are observed and the surface was evenly located and quite numerous islands of corrosion products (a porous layer) created, which are distributed in a random way on the whole surface of the passive film on the surface of the VZ1 alloy (Figure 6d). The surface morphology of the VZ2 alloy in Figure 6e shows small, but loosened, tendencies of pits, and larger intensities, followed by increased pit dissolution in 12.0 M NaOH (Figure 6f). Traces of extra nickel ions on the surface as nickel oxide with a small amount of Cr oxides as an outer porous (unprotective) layer. This result also supports the result obtained from polarization measurements, where the passivation tendency showed a clear tendency to increase when NaOH concentration increased.
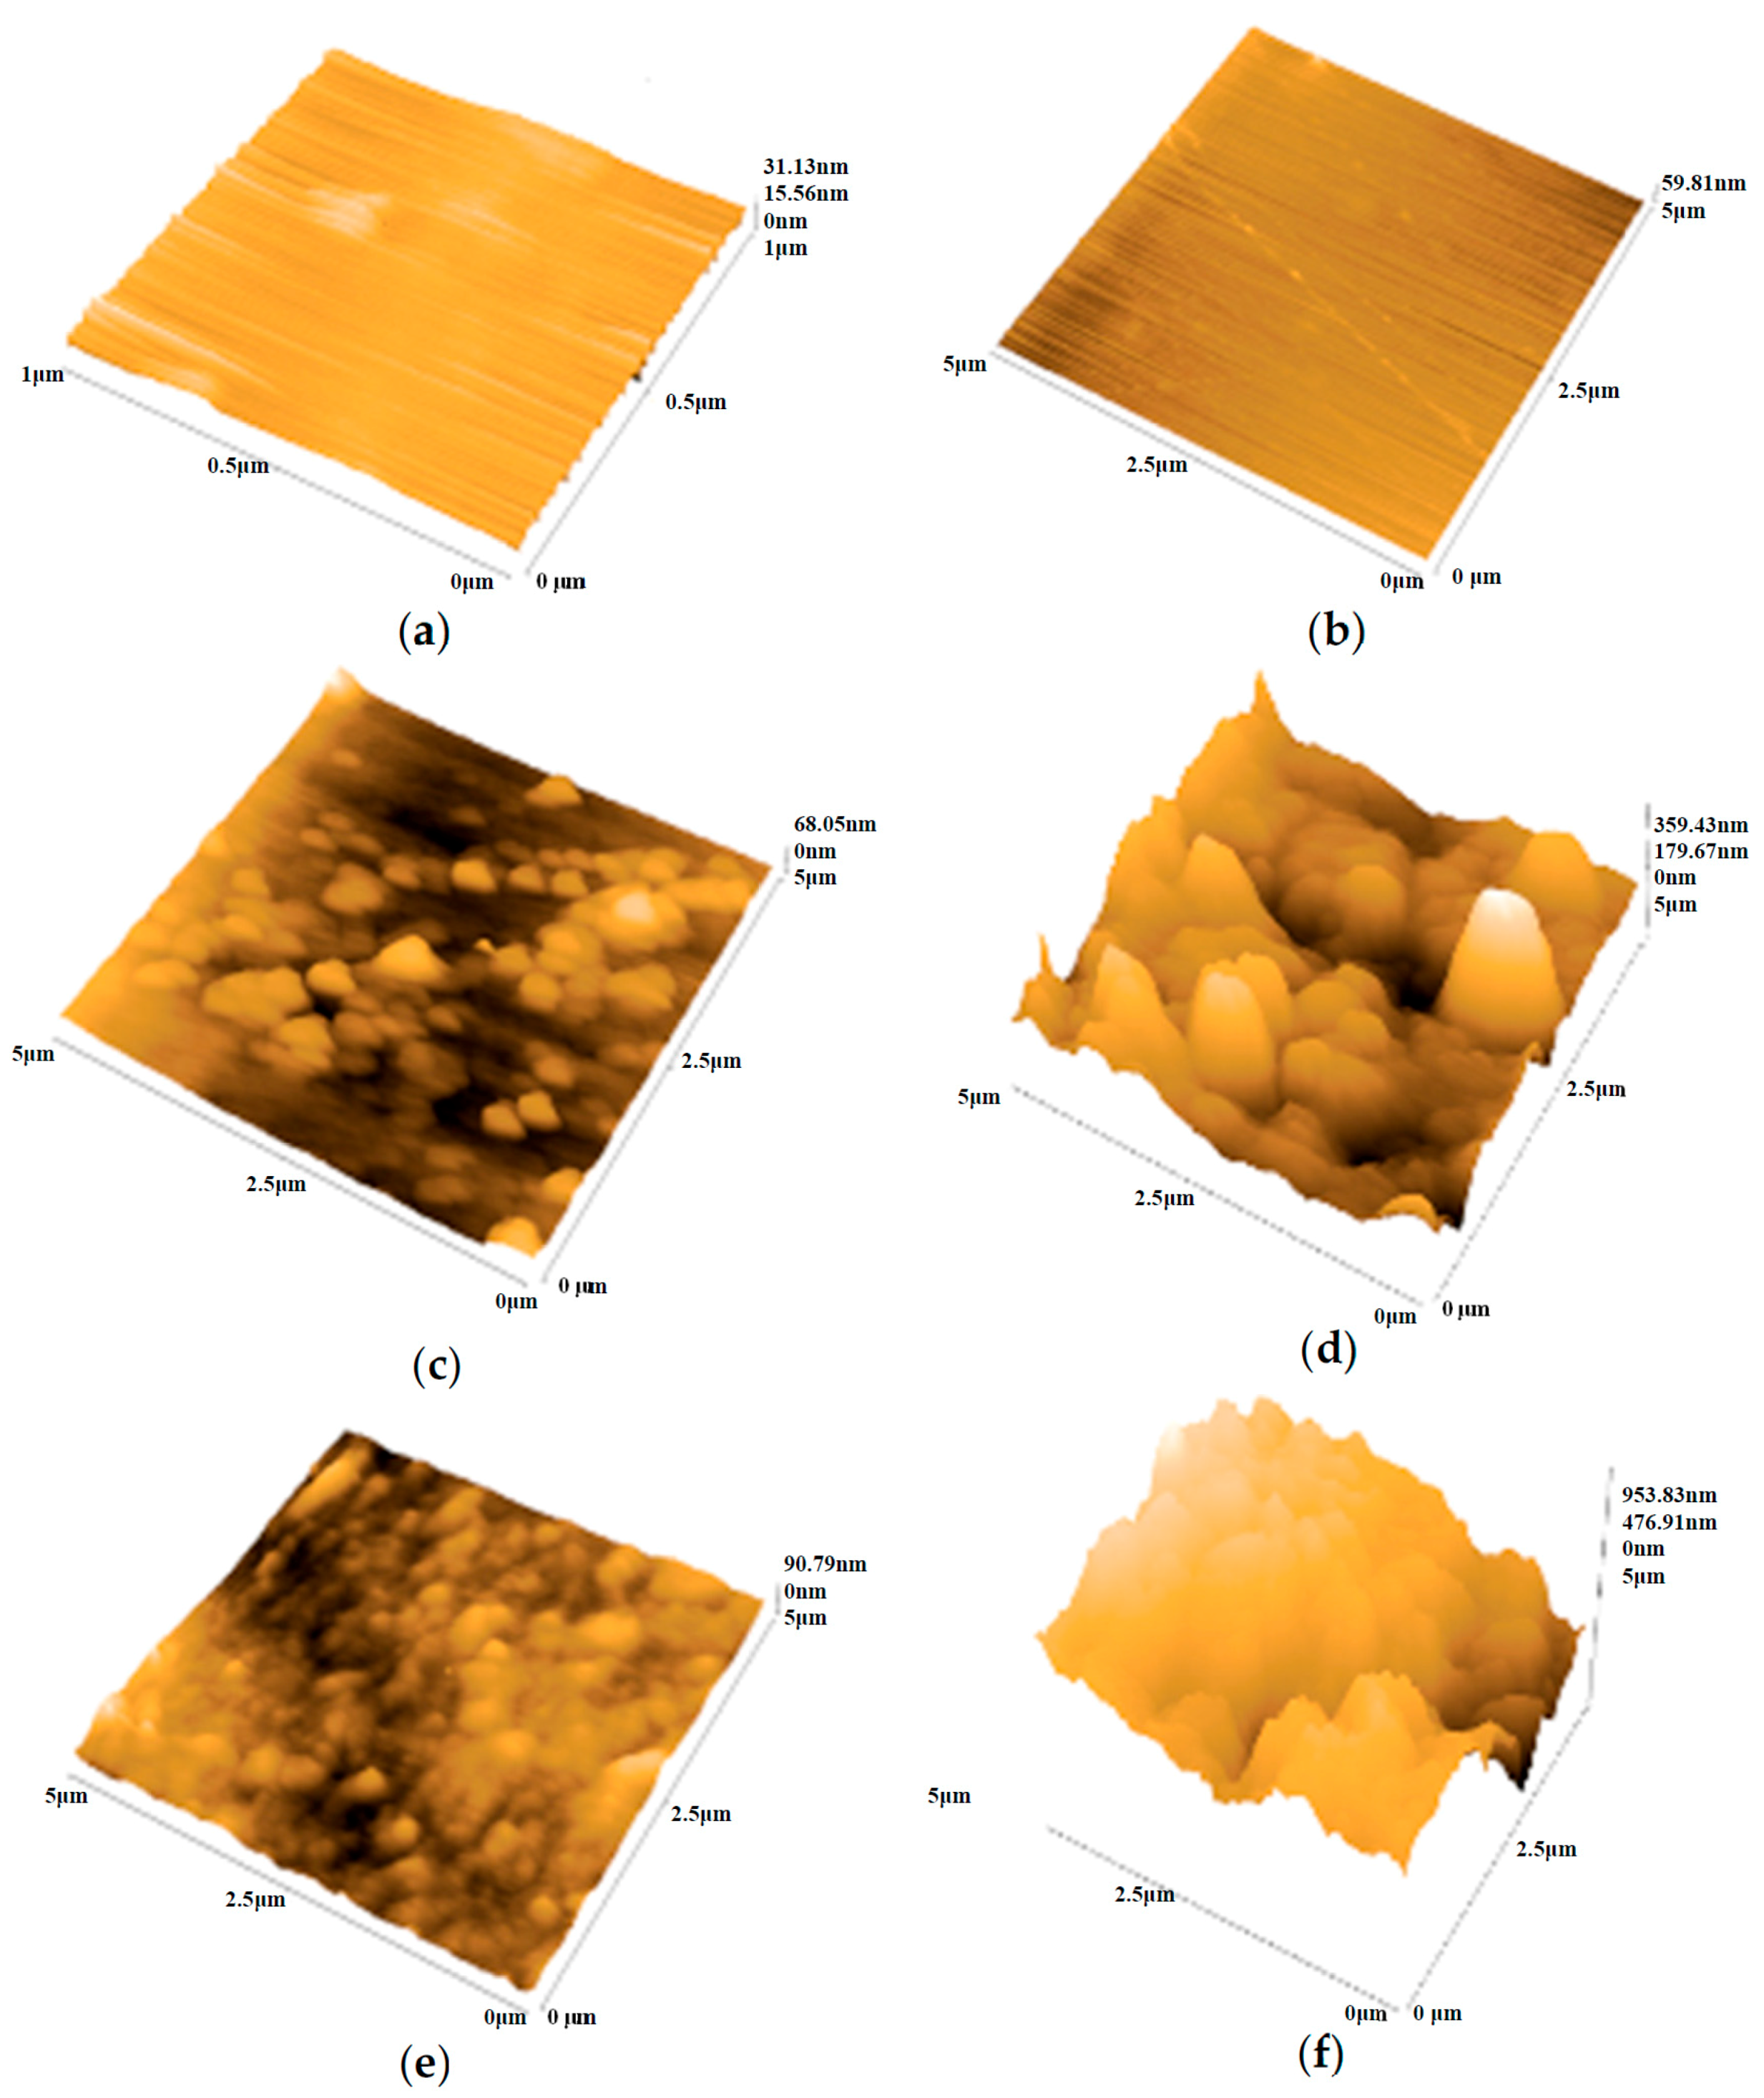
The atomic force microscopy (AFM) spectra recorded for Ni-base glassy alloys in three-dimensions (3D) are depicted in Figure 7. The observed highly homogeneous surfaces of VZ1 and VZ2 alloys before treatment (as-received), related to the higher chemical homogeneity (Figure 7a,b) with an average roughness value, Ra, of 0.501 nm for the VZ1 alloy and of 0.621 nm for the VZ2 alloy (Table 4). AFM spectra, recorded for Ni-base glassy alloy representations at 1.0 M and 12.0 M NaOH solutions are depicted in Figure 7c,f. It is very clear that the alloy surface disappears with corrosion, and its thickness increases with increasing alkaline concentration; therefore, the alloy surface has the shape of the hills and valleys. The roughness parameters such as average roughness (Ra), which gives the deviation in height, maximum profile peak height (Rp), maximum height of the profile (RT), which gives the vertical distance between the deepest valley and highest peak [26], and the average of these parameters, Rpm, and RTm were obtained with summaries in Table 4. The average roughness, Ra, increases with increasing alkaline concentration, where its value increases from 2.71 nm at 1.0 M NaOH Figure 7c to 74.02 nm at 12.0 M NaOH Figure 7d for VZ1 alloy and it is about 5.95 nm at 1.0 M NaOH for VZ2 alloy Figure 7e. The maximum Ra was observed in the case of VZ2 alloy at 12.0 M NaOH concentration of about 178.0 nm, indicating dissolution of the specimen’s surface with increasing alkaline concentrations Figure 7f. The greater average roughness due to the presence of more surface heterogeneities, the lesser its corrosion resistance, leading to a high icorr values. This trend was also found in EIS, cyclic polarization, and EFM in previous investigations, where the icorr is directly associated with an average roughness. The alloy surface however, disappeared with increasing NaOH concentration, and this result supports the result obtained from the SEM analysis above.
4. Conclusions
Two Ni-base bulk metallic glasses, with the nominal composition of Ni70Cr21Si0.5B0.5P8C ≤ 0.1Co ≤ 1Fe ≤ 1 (VZ1) and Ni72.65Cr7.3Si6.7B2.15C ≤ 0.06Fe8.2Mo3 (VZ2) were studied in solutions of 1.0, 3.0, 6.0, 9.0, and 12.0 M NaOH concentrations at 27 °C. Cyclic polarization analysis revealed that the passivation range in alkaline solution at all concentrations was divided into first passivation range at low potential (main passivation region), which was due to the formation of nickel hydroxide and chromium oxide. The second passivation range at high potential was due to the formation of unstable passive layer of higher oxides of nickel. At all alkaline concentrations, EFM studies showed that both alloys exhibited an outstanding corrosion resistance by having low corrosion rate in mm/year values (<0.02 mm/year). The EIS analysis showed that the passive layers grown on the Ni-base glassy alloys’ surface in alkaline solution may be formed by a double oxide layer structure. By comparing the EIS, CP, and EFM results of the two alloys under identical conditions, the resistance of the VZ1 alloy was much better than the VZ2 alloy in all studied media. The presence of Cr (21%) leads to increased corrosion resistance for the nickel-base glassy alloy. It accumulates in the passive layer as Cr2O3 or [CrOx(OH)3–2x·nH2O].
Acknowledgments
The authors would like to thank Hartmann Thomas from the Vacuum Schmelze Company for providing the specimens. Additionally, the authors would like to thank Abdallah Jaber of the physics department for conducting surface measurements of the study samples.
Author Contributions
Khadijah M. Emran and Hanaa Al-Refai conceived and designed the experiments; Hanaa Al-Refai performed the experiments; Khadijah M. Emran and Hanaa Al-Refai analyzed the data; Hanaa Al-Refai contributed reagents/materials/analysis tools; Khadijah M. Emran and Hanaa Al-Refai wrote the paper.
Conflicts of Interest
The authors declare no conflict of interest.
References
- Axinte, E. Metallic glasses from “alchemy” to pure science: Present and future of design, processing and applications of glassy metals. Mater. Des. 2012, 35, 518–556. [Google Scholar] [CrossRef]
- Gebert, A.; Buchholz, K.; Leonhard, A.; Mummert, K.; Eckert, J.; Schultz, L. Investigations on the electrochemical behaviour of Zr-based bulk metallic glasses. Mater. Sci. Eng. A 1999, 267, 294–300. [Google Scholar] [CrossRef]
- Li, D.; Zhu, Z.; Zhang, H.; Wang, A.; Hu, Z. The influence of Zr substitution for Nb on the corrosion behaviors of the Ni-Nb-Zr bulk metallic glasses. Sci. China Phys. Mech. Astron. 2012, 55, 2362–2366. [Google Scholar] [CrossRef]
- Zeng, Y.; Qin, C.; Nishiyama, N.; Inoue, A. New nickel-based bulk metallic glasses with extremely high nickel content. J. Alloys Compd. 2010, 489, 80–83. [Google Scholar] [CrossRef]
- Qin, C.; Asami, K.; Kimura, H.; Zhang, W.; Inoue, A. Electrochemical and XPS studies of Ni-based metallic glasses in boiling nitric acid solutions. Electrochim. Acta 2009, 54, 1612–1617. [Google Scholar] [CrossRef]
- Arab, S.; Emran, K. Influence of Cr addition on the electrochemical behavior of Ni-base metallic glasses in HCl. Phys. Chem. News 2009, 50, 130–138. [Google Scholar]
- Arab, S.T.; Emran, K.M.; Al-Turaif, H.A. Passivity characteristics on Ni(Cr)(Fe)SiB glassy alloys in phosphate solution. J. Saudi Chem. Soc. 2014, 18, 169–182. [Google Scholar] [CrossRef]
- Al-Mobarak, N.; Khaled, K.; Hamed, M.N.; Abdel-Azim, K. Employing electrochemical frequency modulation for studying corrosion and corrosion inhibition of copper in sodium chloride solutions. Arab. J. Chem. 2011, 4, 185–193. [Google Scholar] [CrossRef]
- Tomashov, N.D. Passivity and Protection of Metals against Corrosion; Springer Science & Business Media: Berlin, Germany, 2012. [Google Scholar]
- Lavigne, O.; Shoji, T.; Takeda, Y. EIS pitting temperature determination of A182 nickel based alloy in simulated BWR environment containing dilute seawater. Nucl. Eng. Des. 2014, 273, 435–439. [Google Scholar] [CrossRef]
- BenSalah, M.; Sabot, R.; Triki, E.; Dhouibi, L.; Refait, P.; Jeannin, M. Passivity of Sanicro28 (UNS N-08028) stainless steel in polluted phosphoric acid at different temperatures studied by electrochemical impedance spectroscopy and Mott-Schottky analysis. Corros. Sci. 2014, 86, 61–70. [Google Scholar] [CrossRef]
- Arab, S.T.; Emran, K.M.; Al-Turaif, H.A. The electrochemical behavior of Ni-base metallic glasses containing Cr in H2SO4 solutions. J. Korean Chem. Soc. 2012, 56, 448–458. [Google Scholar] [CrossRef]
- Ter-Ovanessian, B.; Alemany-Dumont, C.; Normand, B. Electronic and transport properties of passive films grown on different Ni-Cr binary alloys in relation to the pitting susceptibility. Electrochim. Acta 2014, 133, 373–381. [Google Scholar] [CrossRef]
- Pourbaix, M. Atlas of Electrochemical Equilibria in Aqueous Solutions; National Association of Corrosion Engineers: Houston, TX, USA, 1974. [Google Scholar]
- Lavigne, O.; Alemany-Dumont, C.; Normand, B.; Berger, M.-H.; Duhamel, C.; Delichére, P. The effect of nitrogen on the passivation mechanisms and electronic properties of chromium oxide layers. Corros. Sci. 2011, 53, 2087–2096. [Google Scholar] [CrossRef]
- Belo, M.D.C.; Hakiki, N.; Ferreira, M. Semiconducting properties of passive films formed on nickel-base alloys type Alloy 600: Influence of the alloying elements. Electrochim. Acta 1999, 44, 2473–2481. [Google Scholar] [CrossRef]
- Jakupi, P.; Zagidulin, D.; Noël, J.; Shoesmith, D. The impedance properties of the oxide film on the Ni–Cr–Mo Alloy-22 in neutral concentrated sodium chloride solution. Electrochim. Acta 2011, 56, 6251–6259. [Google Scholar] [CrossRef]
- Karimi, S.; Nickchi, T.; Alfantazi, A. Effects of bovine serum albumin on the corrosion behaviour of AISI 316L, Co–28Cr–6Mo, and Ti–6Al–4V alloys in phosphate buffered saline solutions. Corros. Sci. 2011, 53, 3262–3272. [Google Scholar] [CrossRef]
- Macdonald, D.D. Passivity—The key to our metals-based civilization. Pure Appl. Chem. 1999, 71, 951–978. [Google Scholar] [CrossRef]
- Rosalbino, F.; Delsante, S.; Borzone, G.; Scavino, G. Influence of noble metals alloying additions on the corrosion behaviour of titanium in a fluoride-containing environment. J. Mater. Sci. Mater. Med. 2012, 23, 1129–1137. [Google Scholar] [CrossRef] [PubMed]
- Rauf, A.; Mahdi, E. Evaluating corrosion inhibitors with the help of electrochemical measurements including electrochemical frequency modulation. Int. J. Electrochem. Sci. 2012, 7, 4673–4685. [Google Scholar]
- Fontana, M.G. Corrosion Engineering; Mcgraw-Hill Book Company: New York, NY, USA, 1986. [Google Scholar]
- Zhang, B.-P.; Habazaki, H.; Kawashima, A.; Asami, K.; Hashimoto, K. The corrosion behavior of amorphous Ni-Cr-19P alloys in concentrated hydrofluoric acid. Corros. Sci. 1992, 33, 1519–1528. [Google Scholar] [CrossRef]
- Singh, P.; Srivastava, V.; Quraishi, M. Novel quinoline derivatives as green corrosion inhibitors for mild steel in acidic medium: Electrochemical, SEM, AFM, and XPS studies. J. Mol. Liq. 2016, 216, 164–173. [Google Scholar] [CrossRef]
- Li, H.; Yu, H.; Zhou, T.; Yin, B.; Yin, S.; Zhang, Y. Effect of tin on the corrosion behavior of sea-water corrosion-resisting steel. Mater. Des. 2015, 84, 1–9. [Google Scholar] [CrossRef]
- De Oliveira, R.; Albuquerque, D.; Leite, F.; Yamaji, F.; Cruz, T. Measurement of the Nanoscale Roughness by Atomic Force Microscopy: Basic Principles and Applications; INTECH Open Access Publisher: Rijeka, Croatia, 2012. [Google Scholar]
Figure 1.
(a) Ni-base glassy alloy; (b) schematic diagram for the electrochemical cell; (c) the Gamry interface 1000TM.
Figure 1.
(a) Ni-base glassy alloy; (b) schematic diagram for the electrochemical cell; (c) the Gamry interface 1000TM.

Figure 2.
Impedance plots of Ni-base glassy alloys VZ1 (left) and VZ2 (right) in different concentrations of NaOH at 27 °C: (a,b) Nyquist spectra; (c,d) Bode phase plots; (e,f) Bode magnitude plots.
Figure 2.
Impedance plots of Ni-base glassy alloys VZ1 (left) and VZ2 (right) in different concentrations of NaOH at 27 °C: (a,b) Nyquist spectra; (c,d) Bode phase plots; (e,f) Bode magnitude plots.
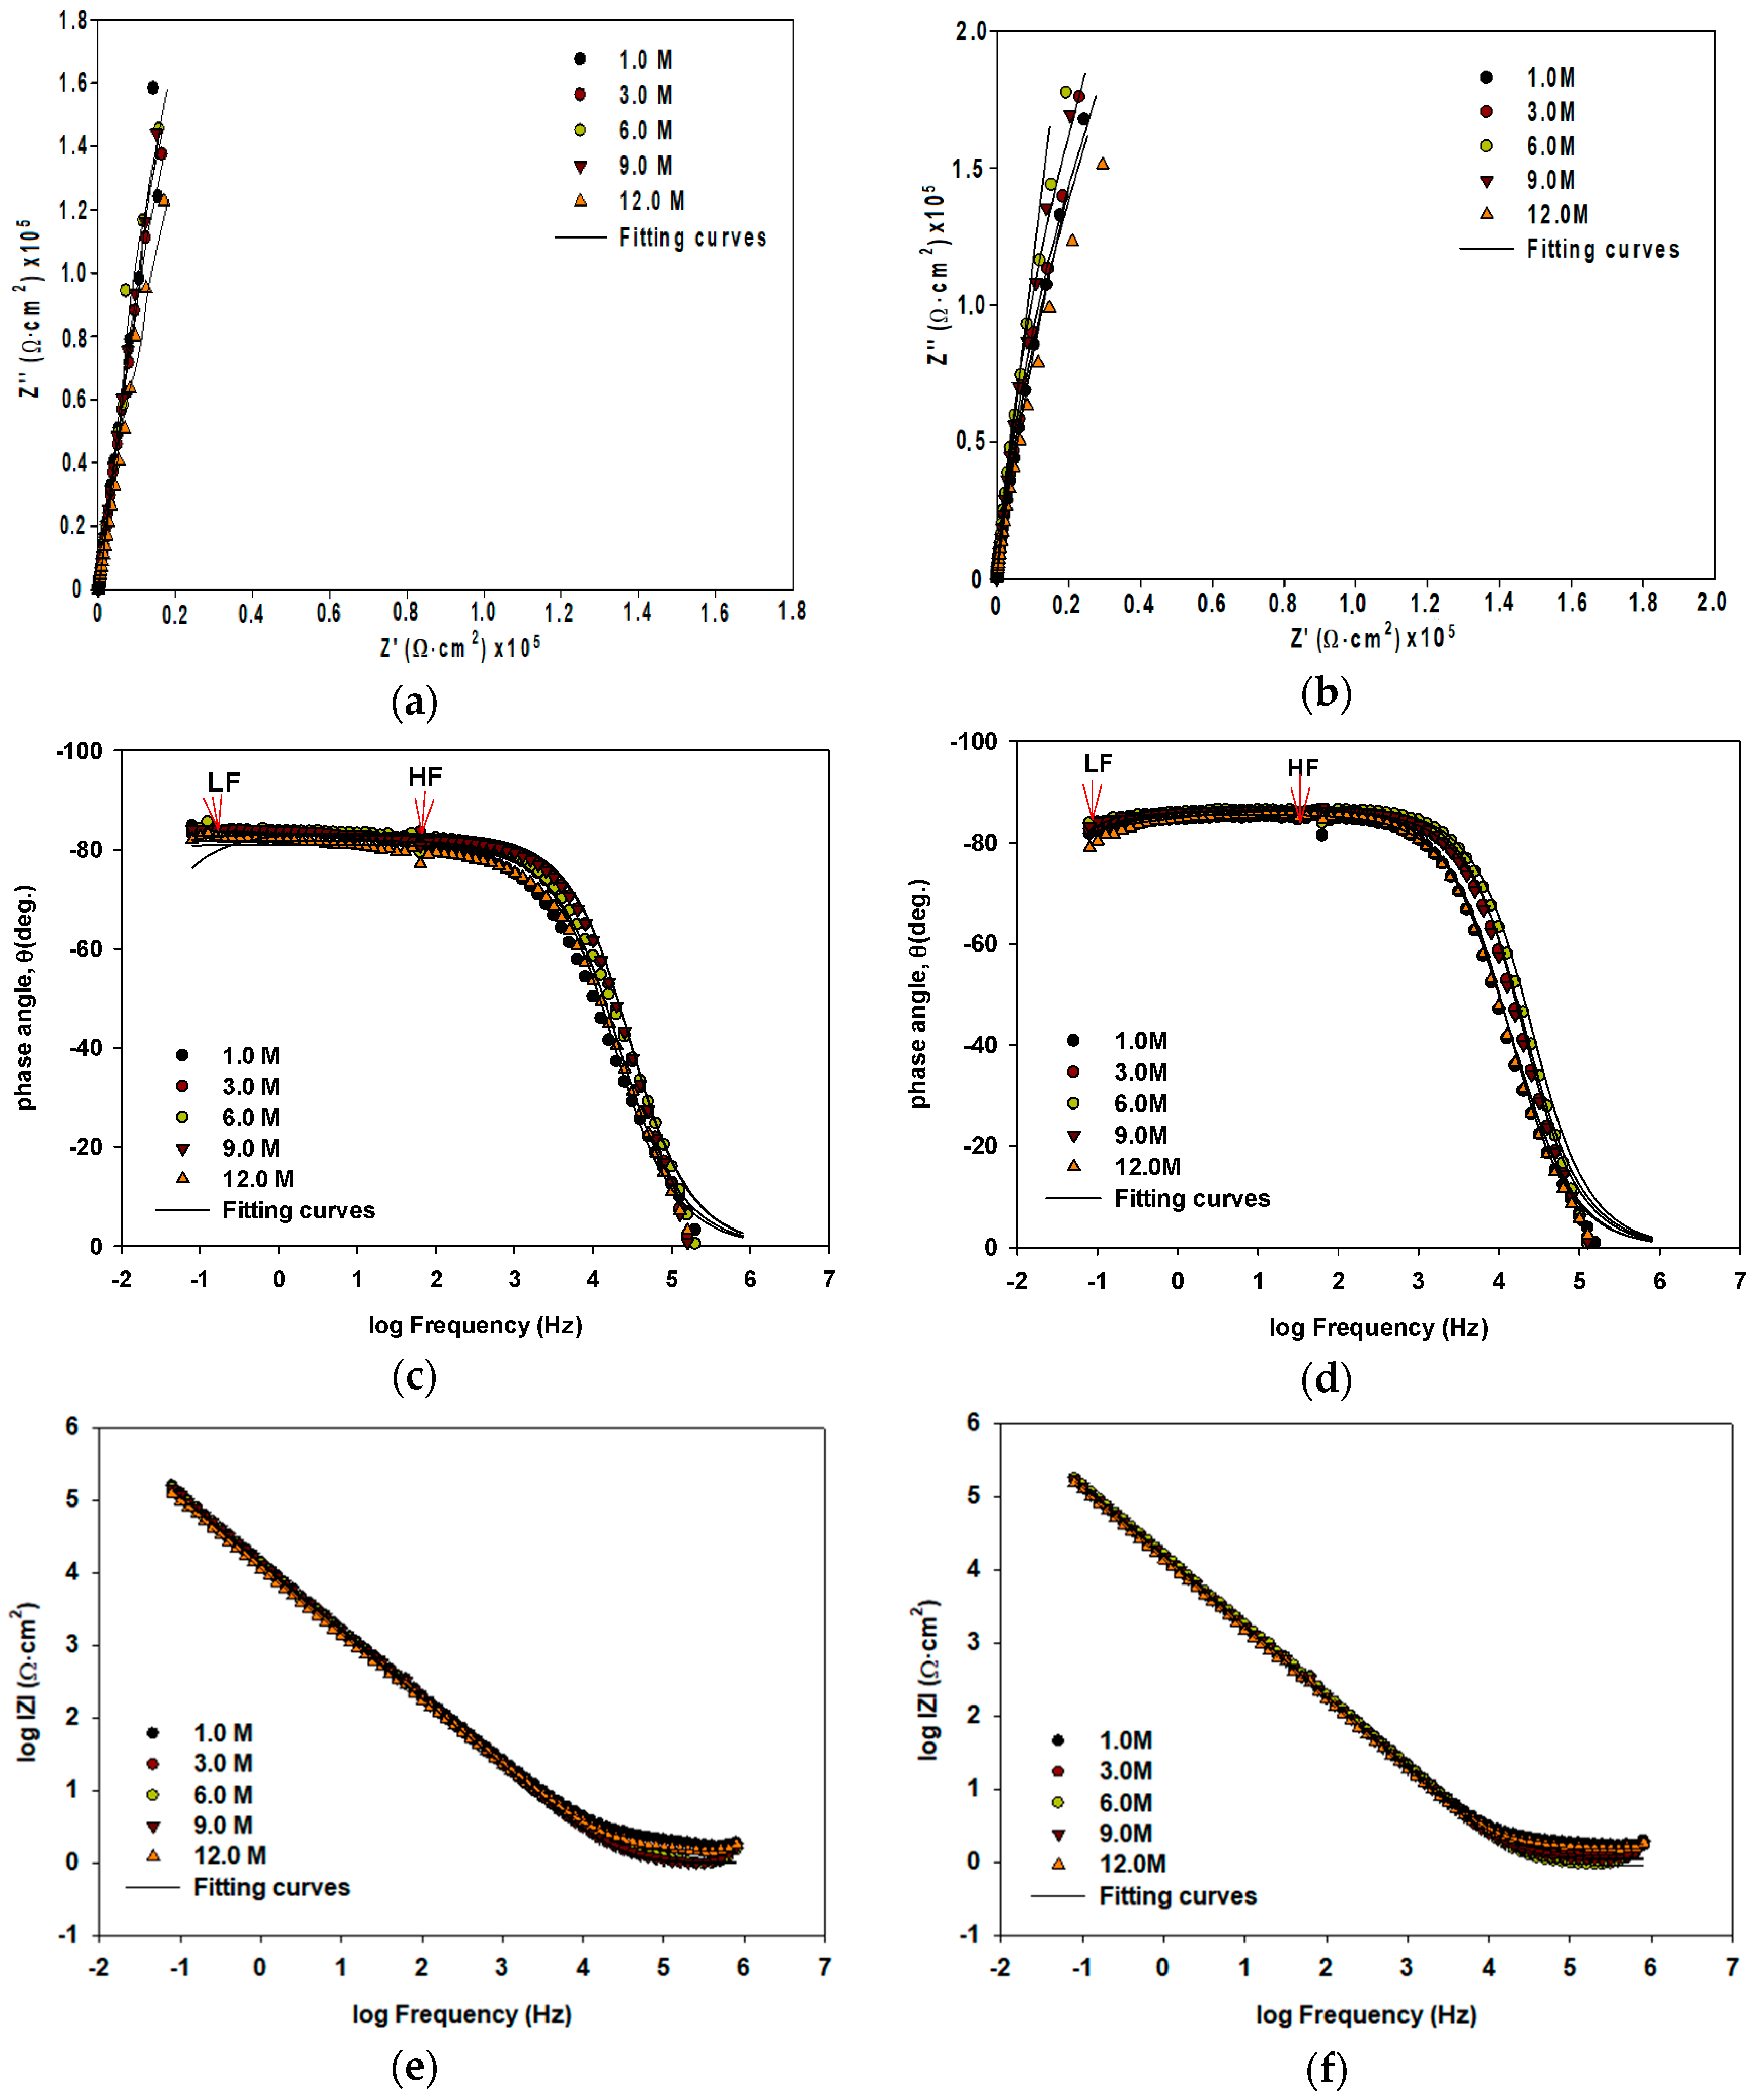
Figure 3.
Electrical equivalent circuit used to analyze the present experimental EIS (electrochemical impedance spectroscopy) data.
Figure 3.
Electrical equivalent circuit used to analyze the present experimental EIS (electrochemical impedance spectroscopy) data.

Figure 4.
Cyclic polarization curves of Ni-base glassy alloys at 1.0 M NaOH at 27 °C (Arrows with short dash and blue color is upwards and arrows with solid line and dark red color is downwards): (a) VZ1 alloy and (b) VZ2 alloy.
Figure 4.
Cyclic polarization curves of Ni-base glassy alloys at 1.0 M NaOH at 27 °C (Arrows with short dash and blue color is upwards and arrows with solid line and dark red color is downwards): (a) VZ1 alloy and (b) VZ2 alloy.

Figure 5.
XPS spectra detected for the passive film formed on Ni-base glassy alloys in 1.0 M NaOH solution at 27 °C: (a) Ni 2p3/2 spectrum of the VZ1 and VZ2 alloys; (b) Cr 2p3/2 spectrum of the VZ1 and VZ2 alloys; (c) Fe 2p3/2 spectrum of the VZ1 and VZ2 alloys; (d) O 1s spectrum of the VZ1 and VZ2 alloys.

Figure 6.
SEM morphology for Ni-base glassy alloys at as-received and different concentration of NaOH solutions at 27 °C: (a) as-received VZ1 alloy; (b) as-received VZ2 alloy; (c,d) VZ1 alloy at 1.0 M and 12.0 M NaOH; (e,f) VZ2 alloy at 1.0 M and 12.0 M NaOH.
Figure 6.
SEM morphology for Ni-base glassy alloys at as-received and different concentration of NaOH solutions at 27 °C: (a) as-received VZ1 alloy; (b) as-received VZ2 alloy; (c,d) VZ1 alloy at 1.0 M and 12.0 M NaOH; (e,f) VZ2 alloy at 1.0 M and 12.0 M NaOH.
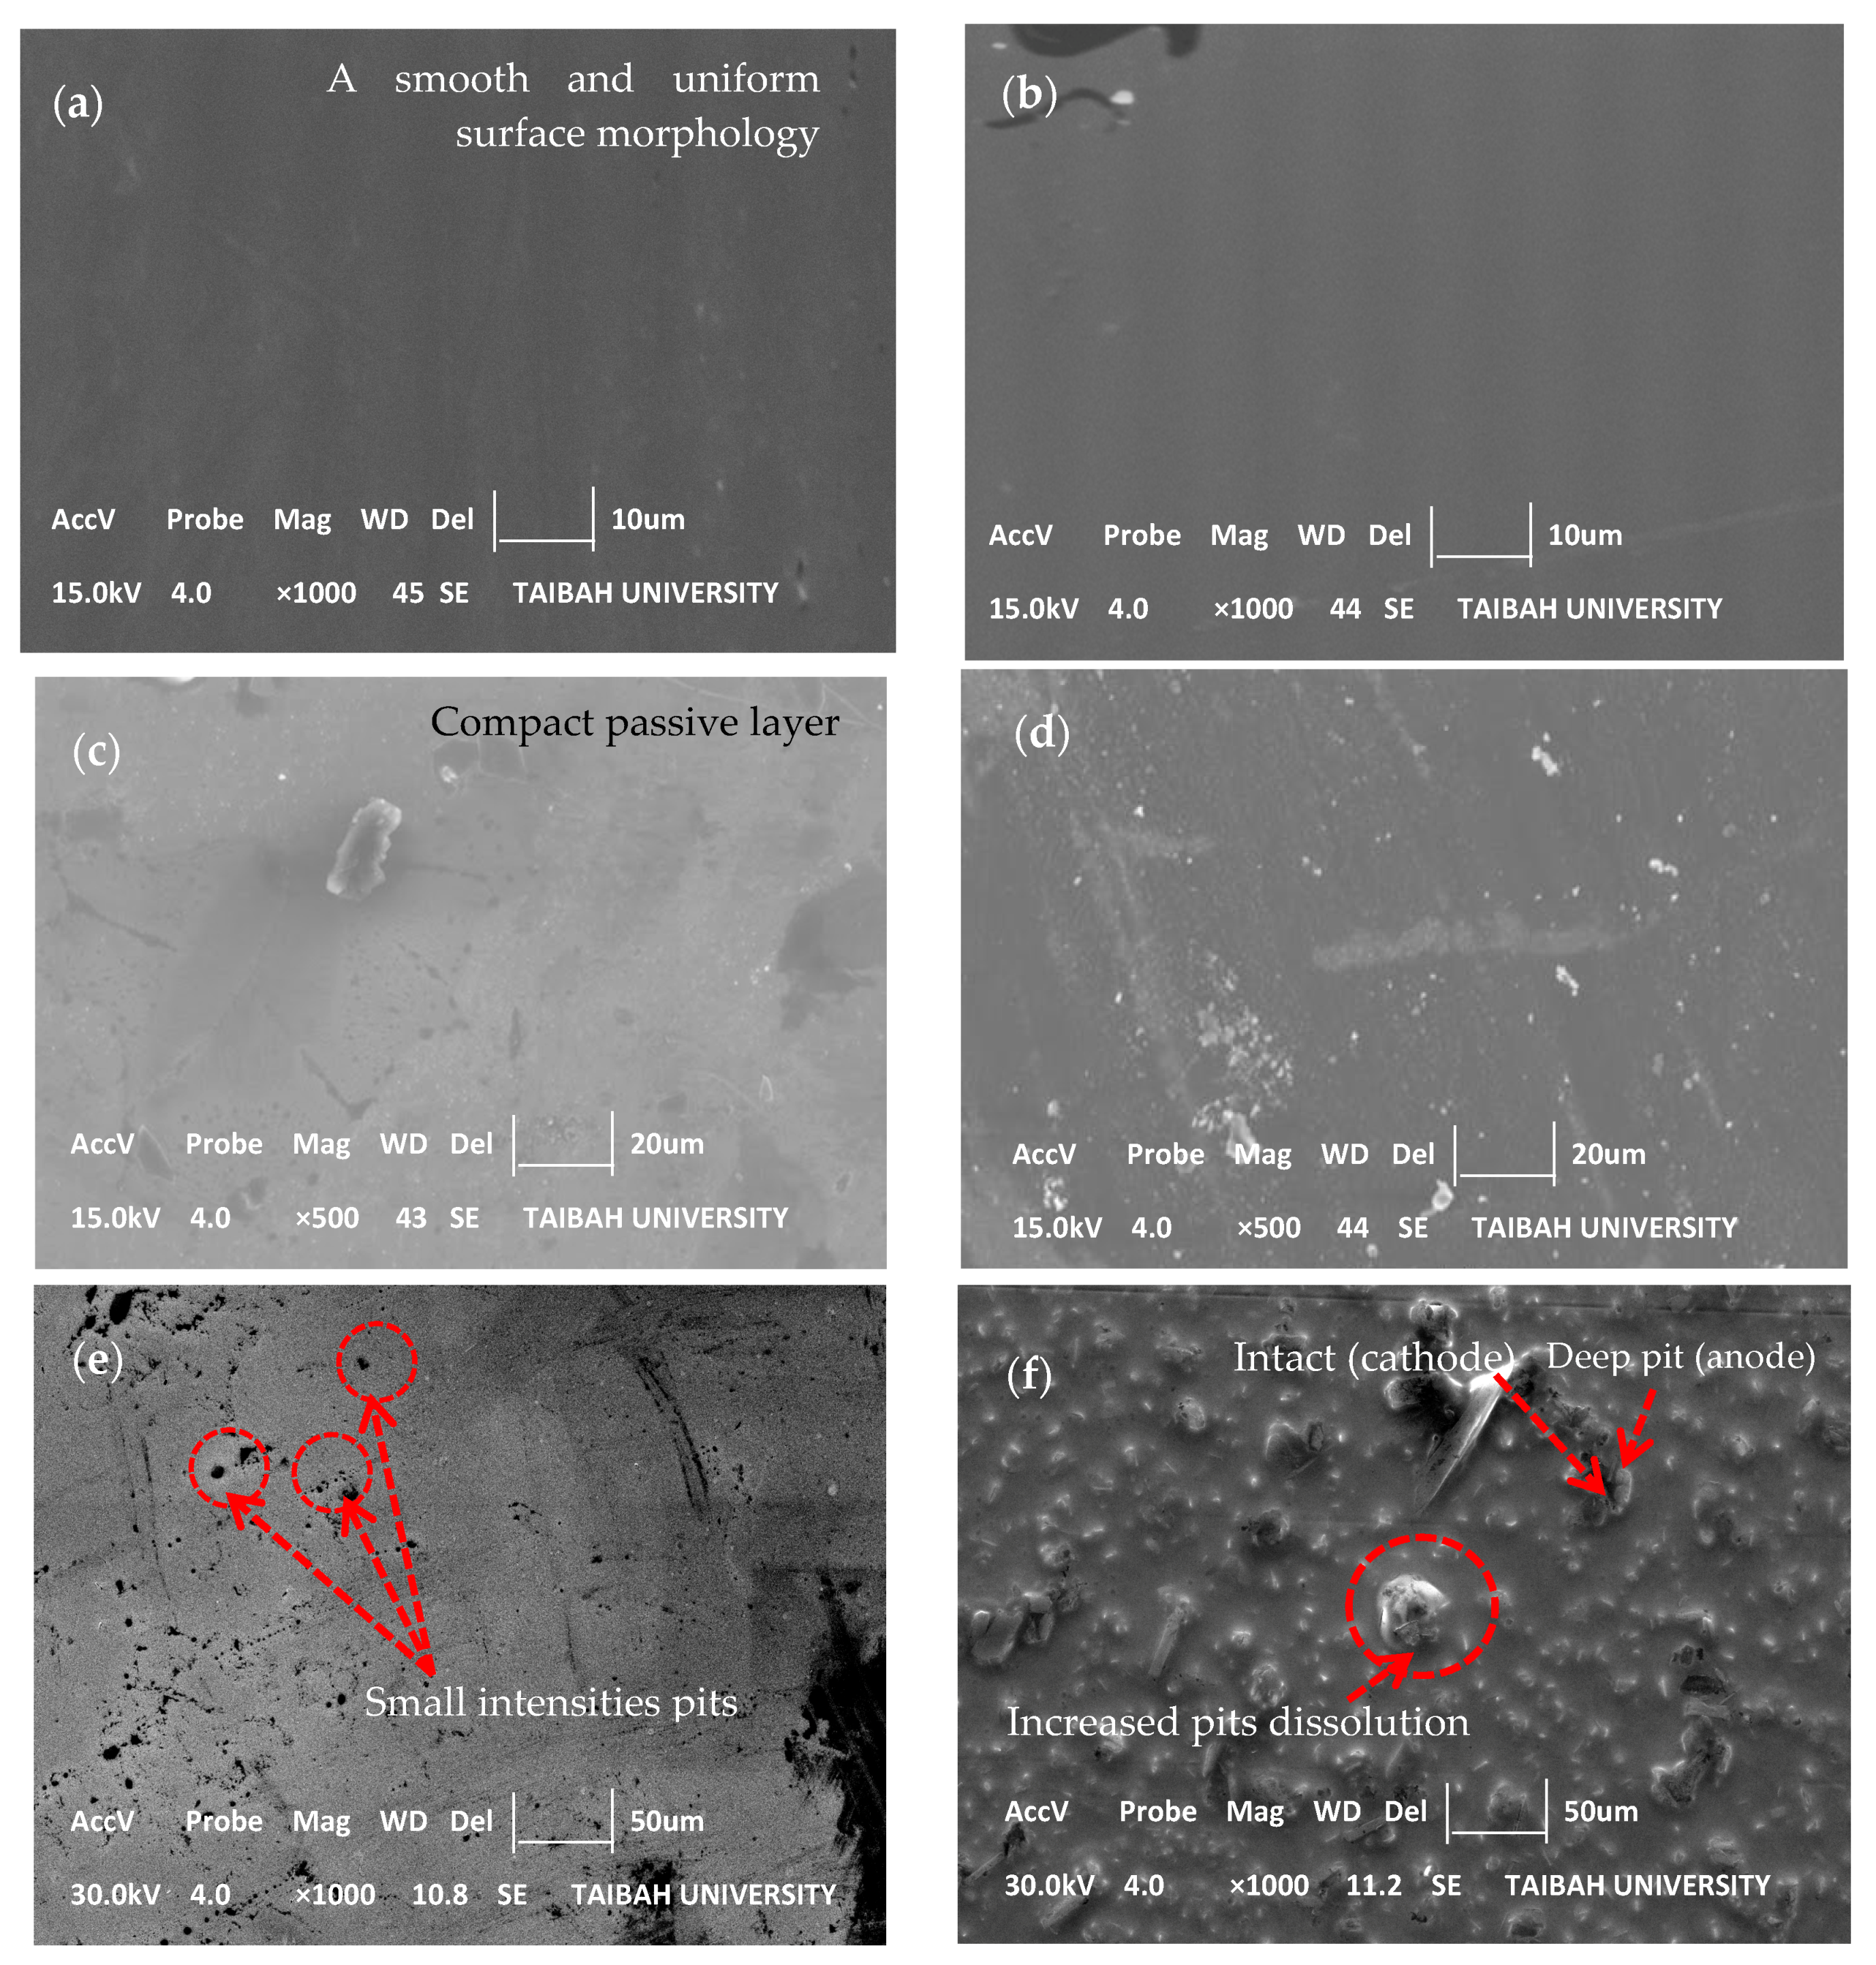
Figure 7.
AFM (atomic force microscopy) topography images of Ni-base glassy alloys as-received, at 1.0 M and 12.0 M NaOH solutions at 27 °C: (a,b) as-received VZ1 alloy and VZ2 alloy; (c,d) VZ1 alloy at 1.0 M and 12.0 M NaOH; (e,f) VZ2 alloy at 1.0 M and 12.0 M NaOH.
Figure 7.
AFM (atomic force microscopy) topography images of Ni-base glassy alloys as-received, at 1.0 M and 12.0 M NaOH solutions at 27 °C: (a,b) as-received VZ1 alloy and VZ2 alloy; (c,d) VZ1 alloy at 1.0 M and 12.0 M NaOH; (e,f) VZ2 alloy at 1.0 M and 12.0 M NaOH.

Table 1.
Equivalent circuit parameters for the spontaneously formed passive film on VZ1 and VZ2 alloys as a function of NaOH concentration at 27 °C.
Table 1.
Equivalent circuit parameters for the spontaneously formed passive film on VZ1 and VZ2 alloys as a function of NaOH concentration at 27 °C.
| Alloy | NaOH (M) | Rp (Ω·cm2) | CPE1, Q1 × 10−5 (Ω−1·cm−2·sn1) | n1 | Ceff1, ×10−5 (F·cm−2) | d1 (nm) | Rct, ×106 (Ω·cm2) | CPE2, Q2 × 10−5 (Ω−1·cm−2·sn2) | n2 | Ceff2, ×10−5 (F·cm−2) | d2 (nm) | Total Thickness (nm) |
|---|---|---|---|---|---|---|---|---|---|---|---|---|
| VZ1 | 1.0 | 5.361 × 10³ | 5.220 | 0.775 | 3.61 | 0.294 | 29.35 | 1.287 | 0.999 | 1.291 | 2.051 | 2.351 |
| 3.0 | 2.474 × 10³ | 8.322 | 0.863 | 6.47 | 0.164 | 29.31 | 1.418 | 0.955 | 1.881 | 1.411 | 1.581 | |
| 6.0 | 2.226 × 10³ | 8.602 | 0.849 | 6.42 | 0.165 | 19.21 | 1.662 | 0.933 | 2.511 | 1.061 | 1.221 | |
| 9.0 | 2.126 × 10³ | 10.60 | 0.773 | 6.85 | 0.155 | 17.71 | 1.766 | 0.925 | 2.812 | 0.947 | 1.101 | |
| 12.0 | 1.751 × 10³ | 35.78 | 0.743 | 30.4 | 0.035 | 17.48 | 1.787 | 0.912 | 3.111 | 0.855 | 0.890 | |
| VZ2 | 1.0 | 41.73 | 1.161 | 0.951 | 0.784 | 1.351 | 2.608 | 2.461 | 0.892 | 4.082 | 6.511 | 2.00 |
| 3.0 | 50.28 | 3.081 | 0.960 | 2.36 | 0.451 | 2.246 | 3.441 | 0.872 | 6.501 | 4.091 | 0.860 | |
| 6.0 | 19.73 | 3.461 | 0.968 | 2.72 | 0.391 | 2.090 | 4.651 | 0.892 | 8.071 | 3.292 | 0. 720 | |
| 9.0 | 10.12 | 4.511 | 0.933 | 2.59 | 0.410 | 0.278 | 7.481 | 0.868 | 11.91 | 2.241 | 0.634 | |
| 12.0 | 6.363 | 4.461 | 0.957 | 3.09 | 0.344 | 0.123 | 7.852 | 0.874 | 10.91 | 2.441 | 0.588 |
Table 2.
The corrosion kinetic parameters obtained from CP technique (cyclic polarization) for the VZ1 and VZ2 alloys as a function of NaOH concentration at 27 °C.
Table 2.
The corrosion kinetic parameters obtained from CP technique (cyclic polarization) for the VZ1 and VZ2 alloys as a function of NaOH concentration at 27 °C.
| Alloys | NaOH (M) | −Eocp (mV) | −Ecorr (mV) | icorr (μA·cm−2) | −βc (V/decade) | Epit (mV) | Erep (mV) | −Epass (mV) | ipass (μA·cm−2) | Erep − Epit (mV) | Ecorr − Epass (mV) |
|---|---|---|---|---|---|---|---|---|---|---|---|
| VZ1 | 1.0 | 623.8 | 613.1 | 0.011 | 96.81 | −66.07 | 601.9 | 474.7 | 0.082 | - | −138.4 |
| 3.0 | 700.8 | 696.4 | 0.015 | 99.08 | −149.5 | 534.2 | 560.9 | 0.086 | - | −135.5 | |
| 6.0 | 790.6 | 775.7 | 0.026 | 92.08 | −230.7 | 463.2 | 642.8 | 0.098 | - | −132.9 | |
| 9.0 | 820.6 | 809.3 | 0.069 | 92.08 | −247.8 | 456.4 | 681.8 | 0.241 | 704.2 | −127.5 | |
| 12.0 | 790.9 | 782.2 | 0.763 | 92.89 | −271.8 | 590.7 | 708.7 | 0.979 | 862.5 | −73.5 | |
| VZ2 | 1.0 | 600.5 | 599.1 | 0.026 | 93.16 | 101.2 | 577.1 | 362.3 | 0.475 | - | −236.8 |
| 3.0 | 613.8 | 600.6 | 0.028 | 98.24 | 51.16 | 551.5 | 410.7 | 0.300 | - | −189.9 | |
| 6.0 | 678.9 | 668.6 | 0.030 | 93.48 | −129.2 | 530.3 | 498.6 | 0.113 | - | −170 | |
| 9.0 | 770.8 | 763.3 | 0.034 | 94.02 | −229.3 | 448.9 | 597.3 | 0.120 | 678.2 | −166 | |
| 12.0 | 840.5 | 830.8 | 0.042 | 95.13 | −240.4 | 443.1 | 658.1 | 0.638 | 683.5 | −172.7 |
Table 3.
The corrosion kinetic parameters obtained from EFM (electrochemical frequency modulation) technique for the VZ1 and VZ2 alloys as a function of NaOH concentration at 27 °C.
Table 3.
The corrosion kinetic parameters obtained from EFM (electrochemical frequency modulation) technique for the VZ1 and VZ2 alloys as a function of NaOH concentration at 27 °C.
| Alloys | NaOH (M) | icorr (μA·cm−2) | −βc (mV/Decade) | Corrosion Rate × 10−3 (mm/year) | CF-2 | CF-3 |
|---|---|---|---|---|---|---|
| VZ1 | 1.0 | 0.034 | 59.31 | 1.214 | 2.180 | 1.239 |
| 3.0 | 0.057 | 59.22 | 1.442 | 1.395 | 1.429 | |
| 6.0 | 0.168 | 60.81 | 2.093 | 2.005 | 1.469 | |
| 9.0 | 0.171 | 60.49 | 2.136 | 2.124 | 1.277 | |
| 12.0 | 0.191 | 59.65 | 2.378 | 1.877 | 1.196 | |
| VZ2 | 1.0 | 0.530 | 59.45 | 2.132 | 1.781 | 2.891 |
| 3.0 | 0.793 | 63.12 | 2.175 | 2.395 | 2.479 | |
| 6.0 | 0.805 | 58.56 | 6.596 | 1.561 | 1.671 | |
| 9.0 | 0.877 | 59.56 | 7.363 | 1.761 | 1.231 | |
| 12.0 | 0.898 | 59.31 | 8.802 | 2.180 | 1.239 |
Table 4.
Roughness parameters derived from the AFM images for the VZ1 and VZ2 alloys in various concentrations of alkaline solution at 27 °C.
Table 4.
Roughness parameters derived from the AFM images for the VZ1 and VZ2 alloys in various concentrations of alkaline solution at 27 °C.
| Alloys | NaOH (M) | Ra (nm) | Rp (nm) | Rpm (nm) | RT (nm) | RTm (nm) |
|---|---|---|---|---|---|---|
| VZ1 | as-received | 0.501 | 1.861 | 0.882 | 3.051 | 1.531 |
| 1.0 | 2.713 | 19.58 | 7.253 | 27.16 | 11.41 | |
| 3.0 | 17.78 | 85.22 | 37.86 | 115.8 | 61.25 | |
| 6.0 | 23.52 | 73.33 | 34.72 | 120.4 | 71.65 | |
| 9.0 | 25.27 | 89.94 | 24.76 | 129.5 | 53.01 | |
| 12.0 | 74.02 | 209.3 | 66.07 | 365.4 | 137.1 | |
| VZ2 | as-received | 0.621 | 1.981 | 0.899 | 3.071 | 1.781 |
| 1.0 | 5.953 | 19.32 | 7.783 | 32.35 | 15.41 | |
| 3.0 | 12.723 | 31.28 | 14.40 | 52.95 | 22.92 | |
| 6.0 | 14.23 | 49.81 | 31.16 | 75.23 | 52.00 | |
| 9.0 | 19.04 | 51.71 | 35.99 | 97.20 | 66.01 | |
| 12.0 | 178.0 | 319.3 | 86.54 | 677.5 | 170.1 |
© 2018 by the authors. Licensee MDPI, Basel, Switzerland. This article is an open access article distributed under the terms and conditions of the Creative Commons Attribution (CC BY) license (http://creativecommons.org/licenses/by/4.0/).
Share and Cite
MDPI and ACS Style
Emran, K.M.; Al-Refai, H. Resistivity and Passivity Characterization of Ni-Base Glassy Alloys in NaOH Media. Metals 2018, 8, 64. https://doi.org/10.3390/met8010064
AMA Style
Emran KM, Al-Refai H. Resistivity and Passivity Characterization of Ni-Base Glassy Alloys in NaOH Media. Metals. 2018; 8(1):64. https://doi.org/10.3390/met8010064
Chicago/Turabian StyleEmran, Khadijah M., and Hanaa Al-Refai. 2018. "Resistivity and Passivity Characterization of Ni-Base Glassy Alloys in NaOH Media" Metals 8, no. 1: 64. https://doi.org/10.3390/met8010064
Note that from the first issue of 2016, this journal uses article numbers instead of page numbers. See further details here.