Thermophysical and Mechanical Analyses of UO2-36.4vol % BeO Fuel Pellets with Zircaloy, SiC, and FeCrAl Claddings

1
Department of Mechanical and Biomedical Engineering, City University of Hong Kong, Hong Kong 999077, China
2
Center for Advanced Nuclear Safety and Sustainable Development, City University of Hong Kong, Hong Kong 999077, China
*
Author to whom correspondence should be addressed.
Metals 2018, 8(1), 65; https://doi.org/10.3390/met8010065
Submission received: 31 October 2017
/
Revised: 14 January 2018
/
Accepted: 15 January 2018
/
Published: 18 January 2018
(This article belongs to the Special Issue Zirconium Alloys)
Abstract
:The thermophysical performance and solid mechanics behavior of UO2-36.4vol % BeO fuel pellets cladded with Zircaloy, SiC, and FeCrAl, and Zircaloy cladding materials coated with SiC and FeCrAl, are investigated based on simulation results obtained by the CAMPUS code. In addition, the effect of coating thickness (0.5, 1 and 1.5 mm) on fuel performance and mechanical interaction is discussed. The modeling results show that Zircaloy claddings are more effective in decreasing fuel centerline temperature and fission gas release than other kinds of cladding material because of the smaller gap between cladding and fuel at the same burnup. SiC claddings and SiC-coated Zircaloy claddings possess smaller plenum pressure than other kinds of cladding. SiC claddings contribute more to fuel radial displacement but less to fuel axial displacement. FeCrAl claddings exhibit very different radial and axial displacements in different axial positions. FeCrAl-coated Zircaloy claddings have a lower fuel centerline temperature than Zircaloy claddings at burnup below 850 MWh/kg U, but a higher fuel centerline temperature at higher burnup. The gap between FeCrAl-coated Zircaloy claddings and fuel pellets closes earlier than that of Zircaloy claddings. SiC-coated claddings increase fuel radial and axial displacements, and cladding axial displacements of inner and outer cladding surfaces.
1. Introduction
Accident tolerant fuel (ATF) systems have attracted significant attention regarding the safety margins of commercial light water reactors (LWRs) since the Fukushima Daiichi nuclear accident in 2011. The desired ATF needs to not only buffer against a loss of cooling for a considerably long period, but also improve fuel performance while enhancing fuel safety at normal operation. One way to meet these demands is to develop a UO2 composite fuel. The low thermal conductivity of UO2 fuel has become one of the major concerns limiting nuclear reactor performance and safety. Incorporation of UO2 with high thermal conductivity particles such as BeO or SiC could improve fuel thermal conductivity, one of the key criteria in balancing thermal energy and reactor safety demands [1,2]. Another way to mitigate against severe accidents is to develop enhanced strength and ductility ATF cladding, as this would alleviate the severity of reactivity-initiated accidents, and oxidation-resistant ATF cladding in the case of a loss-of-coolant accident (LOCA) [3]. Zr alloys, which have low neutron absorption cross-sections and a good neutron irradiation resistance, are currently used in nuclear fuel cladding for commercial LWRs [4]. However, in accident scenarios, Zr alloys react with hot steam, generating massive oxidation heat and hydrogen in a very short period. Additionally, the mechanical strength of Zr alloys undergoes significant recession and degradation during accidents. Therefore, it is important to develop new accident-tolerant fuel cladding materials [4]. SiC possesses an extremely low hydrogen liberation rate, excellent high temperature mechanical properties, a high melting point, and little irradiation creep compared with Zr alloys [5]. FeCrAl alloys present slower oxidation rates in high-temperature steam, which may help to preempt further damage resulting from an accident [6]. Surface-coated Zr alloy cladding is also a candidate for ATF owing to its improved corrosion performance compared with Zr alloy cladding and its high neutron economy compared with FeCrAl alloys [7].
The mechanical interactions between fuel and cladding are essential factors for ATF development. In this study, a fully coupled multiphysics fuel performance and solid mechanics analysis is performed with different cladding materials, namely, Zr, SiC, FeCrAl, SiC-coated Zr, and FeCrAl-coated Zr, to compare the mechanical interactions of fuel and cladding materials, using the CityU Advanced Multiphysics Nuclear Fuels Performance with User-defined Simulations (CAMPUS) code. The effects of coating thickness (0.5, 1 and 1.5 mm) on fuel performance and mechanical interaction are also discussed in this study. A fuel material of UO2-36.4vol % BeO is chosen as optimal due to its promising application in commercial LWRs to achieve better fuel performance. Temperature-dependent material properties, such as thermal conductivity, density, specific heat capacity, and thermal expansion, are incorporated into the CAMPUS code, and the fuel centerline temperature, gap size evolution, fission gas release, plenum pressure, and fuel and cladding axial and radial displacements are calculated and discussed in detail.
2. Materials and Methods
2.1. Thermal Conductivity
Based on previous research by Fink [8] and Lucuta et al. [9], the influences of dissolved fission products, precipitated fission products, porosity, deviation from stoichiometry, and radiation damage all must be considered in relation to the thermal conductivity of UO2-BeO fuel during irradiation. The irradiated fuel thermal conductivity k is calculated as follows:
- —Dissolved fission products correction;
- —Precipitated fission products correction;
- —Porosity correction;
- —Deviation from stoichiometry;
- —Radiation damage correction.
The as-fabricated thermal conductivity of UO2-BeO fuel is calculated from the Hasselman and Johnson model, as shown below [10]. Considering the fabrication process of UO2-BeO fuel, introduced by Ishimoto et al. [2] and Solomon et al. [11], UO2 is treated as a particle corresponding to subscript p in the Hasselman and Johnson model, and BeO is treated as a matrix, which corresponds to subscript m in the Hasselman and Johnson model.
—Thermal conductivity of the composite; —Volume fraction of particles; —Radius of particle; —Interfacial thermal conductance. Subscripts p and m are particle and matrix, respectively.
The interfacial thermal conductance is estimated by
—Density; —Specific heat capacity of matrix; —Phonon velocity. Subscripts p and m refer to particle and matrix.
where and are the longitudinal and transverse phonon velocities, respectively.
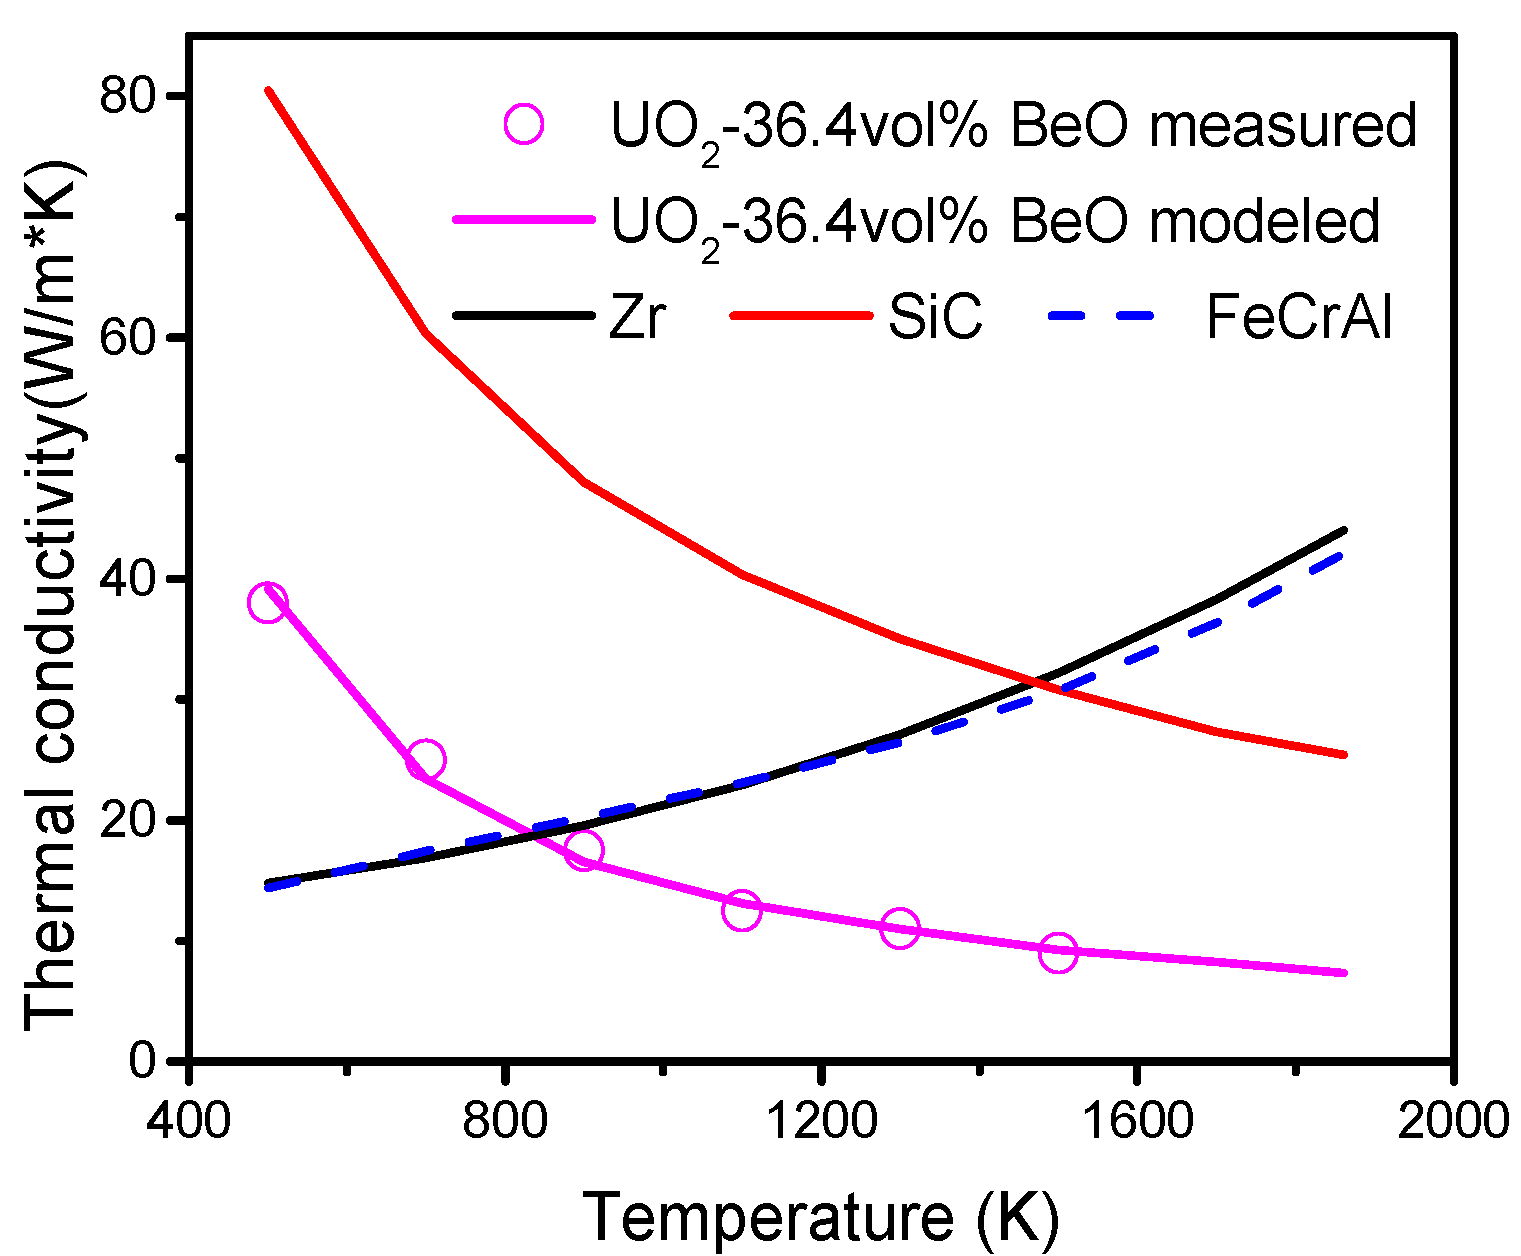
The thermal conductivity of BeO is obtained by interpolation, based on experiment data from Touloukian [12] as listed in Table 1.
2.2. Thermal Expansion
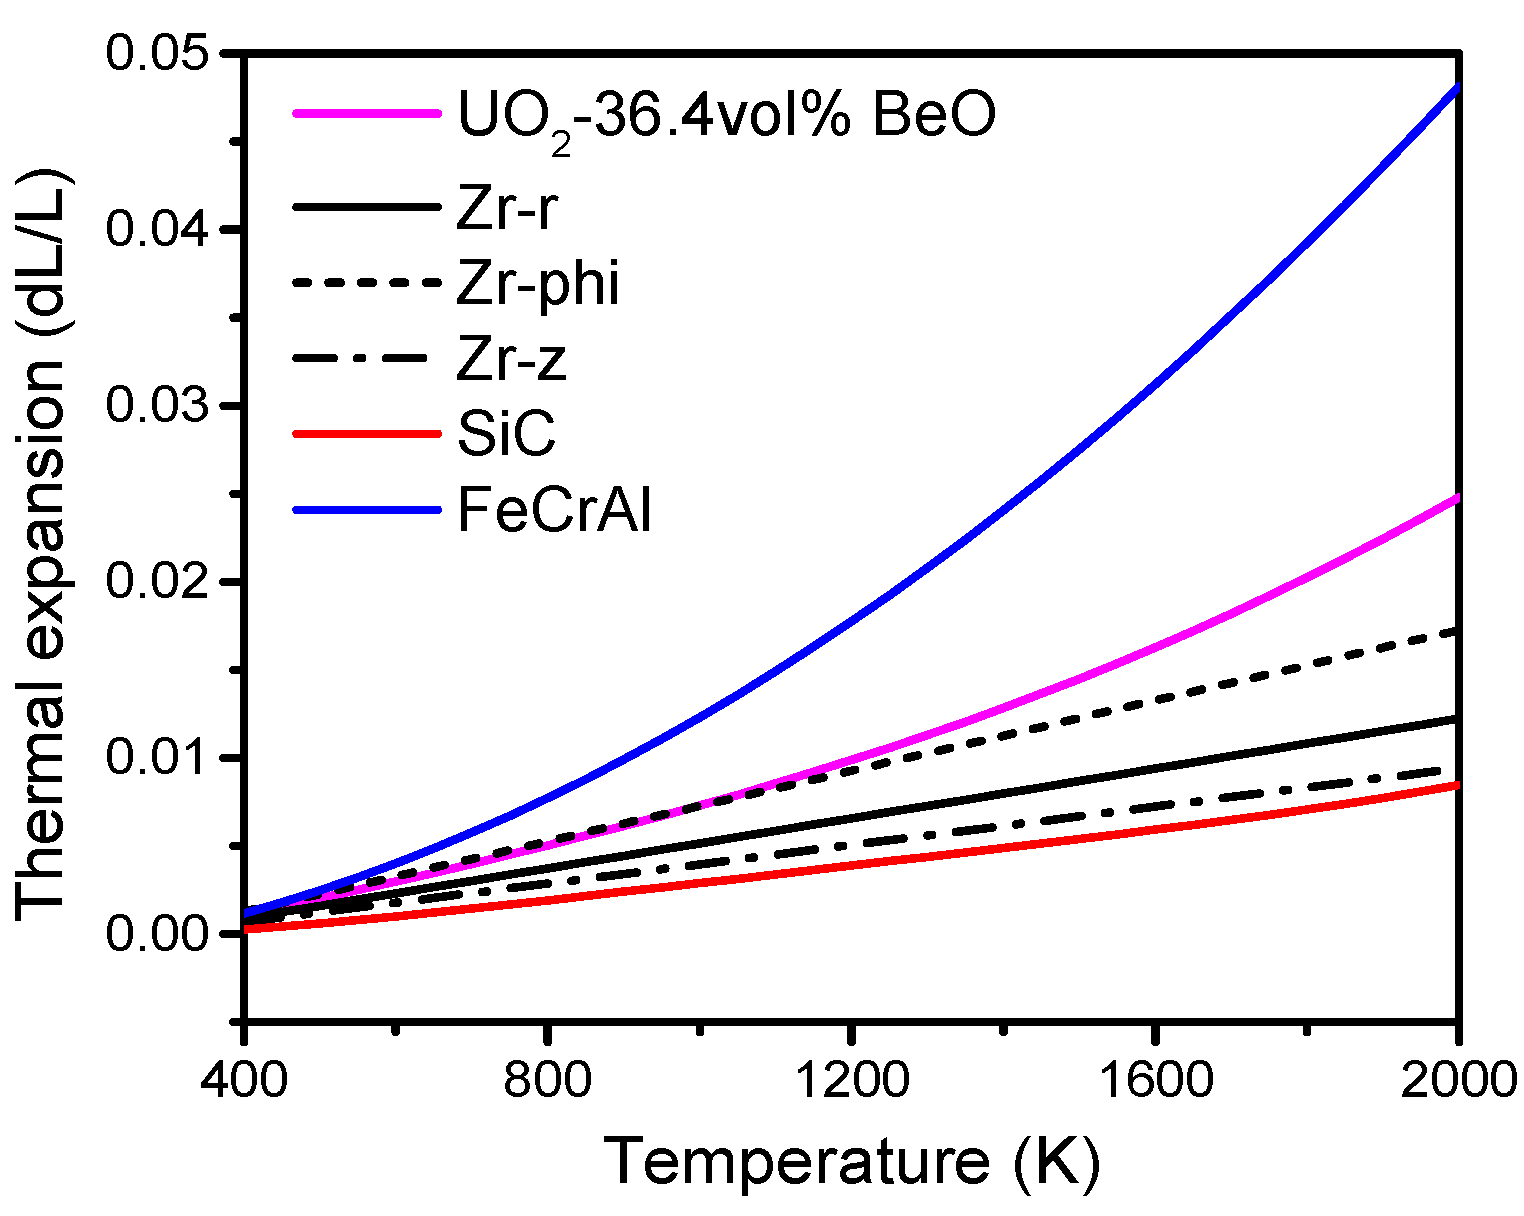
The thermal expansion coefficient for a fuel composite is obtained by considering the thermal expansion coefficient and volume fraction of UO2 and BeO.
The thermal expansion coefficient of UO2 and BeO are calculated as suggested by [16,17], respectively.
For T ≤ 923 K, .
For T > 923 K, .
Zircaloy cladding has different thermal expansion coefficients in radial, angular, and axial directions, as shown below [18]:
The thermal expansion of fuel composites and Zircaloy cladding are obtained from the difference between the thermal expansion coefficient and temperature.
The thermal expansion of UO2-BeO fuel, Zircaloy cladding (in r, phi, and z directions), SiC cladding, and FeCrAl cladding are plotted in Figure 2.
The other material properties, including heat capacity, density, Young’s modulus and Poisson ratio, can be found in Appendix A for UO2-BeO fuel, and Zr, SiC, and FeCrAl claddings.
2.3. Model Implementation
2.3.1. Heat Transfer
In the CAMPUS code, temperature is calculated by the heat transfer model. Based on a calculation of temperature evolution, fission product behaviors and fuel pin mechanics are also calculated.
where is the volumetric heat generation rate.
2.3.2. Deformation Mechanics
The mechanical analysis adopts Cauchy’s equation to describe fuel elements’ elastic deformation behavior.
where and are the Cauchy stress tensor and the body force per unit volume, respectively. Applied forces, thermal expansion, materials creep, fuel densification, and fission gas swelling are all considered in . Stress is calculated as
where is the material matrix and is the elastic strain vector. The elastic strain is calculated as the total strain, defined as (with as the displacement vector), minus any sources of inelastic strain. In the 2D axisymmetric case, as used in this paper, the strain components are given by:
In this study, thermal strain, isotropic strain, and creep are all considered in fuel mechanics analysis. Specifically, we consider the effect of thermal strain in relation to Zircaloy cladding creep, the thermal strain of SiC cladding, and the thermal strain and creep of FeCrAl cladding.
Only some important physical phenomena models are listed here. A more detailed set of physical phenomena models can be found in [19].
3. Results and Discussions
Figure 3a shows fuel centerline temperature of Zircaloy, SiC, and FeCrAl claddings. From Figure 3a, we can see that the fuel temperature tendencies of the Zircaloy and FeCrAl claddings are almost equivalent, while the SiC cladding is quite different. At the beginning of burnup, the SiC cladding has a lower fuel centerline temperature than the Zircaloy and FeCrAl claddings. After the initial power-up, the fuel centerline temperatures of the Zircaloy, SiC, and FeCrAl claddings all increase slightly and then decrease. At a burnup of around 400 MWh/kg U, the fuel centerline temperature of the SiC cladding increases dramatically, while the fuel centerline temperatures of the Zircaloy and FeCrAl claddings increase only slightly. The fuel centerline temperatures of the Zircaloy and FeCrAl claddings begin to decrease at a burnup of around 700 MWh/kg U, while the fuel centerline temperature of the SiC cladding continues to increase. At burnup of 750 MWh/kg U, the fuel centerline temperature of the SiC cladding begins to exceed the fuel centerline temperature of the FeCrAl cladding and finally reaches 1100 K. These differences in fuel center temperature are due mainly to the lack of creep in the SiC cladding during irradiation. This leads to a delayed gap closure, resulting in a poor performance of pellet cladding mechanical contact. As shown in Figure 3a, neither the SiC nor FeCrAl cladding can effectively decrease the fuel centerline temperature compared with the Zircaloy cladding at a high burnup.
The gap width is compared across the different cladding materials, and the tendencies of the Zircaloy, SiC, and FeCrAl claddings are shown in Figure 3b. The gap size evolution tendencies of the Zircaloy and FeCrAl claddings are almost equivalent, while the SiC cladding shows a gentle incline. From Figure 3b, the initial values of the Zircaloy, SiC, and FeCrAl claddings are different. The SiC cladding has the smallest gap size, around 60 µm, while the FeCrAl cladding has the largest gap size, around 85 µm, due to the different thermal expansions of Zircaloy, SiC, and FeCrAl. Then, due to fuel densification, the gap sizes of the Zircaloy, SiC, and FeCrAl claddings all show a slight increase during the short burnup range, after which the gap size decreases almost linearly with burnup increase. Finally, fuel and cladding contact is achieved, which leads to gap size becoming zero for the Zircaloy cladding at a burnup of 1050 MWh/kg U. At a burnup of 1350 MWh/kg U, the gaps of the SiC and FeCrAl claddings are not yet closed.
The fuel displacements against the axial positions of the Zircaloy, SiC, and FeCrAl claddings, at a burnup of 1200 MWh/kg U, are presented in Figure 4. Figure 4a shows that the fuel radial displacement of the Zircaloy cladding is the smallest, due to it having the lowest fuel centerline temperature, while the fuel radial displacement of the SiC cladding is the largest, due it having the highest fuel centerline temperature. From Figure 4b, we can see that the fuel axial displacements of different cladding materials show the same trend as fuel radial displacements. This demonstrates that both fuel radial and axial displacements depend significantly on fuel temperature. At a burnup of 1200 MWh/kg U, UO2-BeO fuel with SiC cladding possesses the highest fuel centerline temperature, leading to the largest fuel radial and axial displacements, while UO2-BeO fuel with Zircaloy cladding possesses the lowest fuel centerline temperature, which leads to the smallest radial and axial displacements.
The cladding displacements on both the inner and outer surfaces of Zircaloy, SiC, and FeCrAl claddings at a burnup of 1200 MWh/kg U are depicted in Figure 5 as a function of axial position. From Figure 5a we can see that for all cladding types, the radial displacements of the inner and outer surfaces change simultaneously at the same axial position. The radial displacements of the Zircaloy and FeCrAl claddings arch toward the fuel, while the radial displacement of the SiC cladding shifts toward the coolant. The different displacement directions illustrate that plenum pressure, thermal expansion, and creep all contribute to the radial displacement of cladding. For the Zircaloy and FeCrAl claddings, the inner surface experiences larger radial displacements than the outer surface, which may be due to larger temperature-driven thermal expansions of the inner surface. For the SiC cladding, the outer and inner surfaces experience almost the same radial displacement. The inner and outer surfaces of the FeCrAl cladding show the largest differences at the same axial position, while the inner and outer surfaces of the SiC cladding show the least differences at the same axial position. This means that the FeCrAl cladding endures more deformation inside the cladding material. There are no significant changes in the axial displacement of the SiC cladding on either the inner or outer surfaces in any of the axial positions shown in Figure 5b, perhaps due to the effects of plenum pressure and the thermal expansion of the SiC cladding. For the Zircaloy cladding, the axial displacements of both inner and outer surfaces slightly increase as axial position changes from −6 to 4.5 mm, and then decrease again. The axial displacements of the inner and outer surfaces of the FeCrAl cladding show dramatic changes as the axial position changes; these become increasingly disparate at the same axial position, which may indicate that the effect of plenum pressure suppresses the effect of thermal expansion of the FeCrAl cladding.
Figure 6 shows the burnup-dependent fuel centerline temperatures of Zircaloy, Zircaloy coated with 0.5, 1 and 1.5 mm SiC claddings, and Zircaloy coated with 0.5, 1 and 1.5 mm FeCrAl claddings, respectively. From Figure 6a, we can see that the fuel centerline temperature tendencies of the SiC-coated claddings are quite different from that of the Zircaloy cladding. For the SiC-coated claddings, the fuel centerline temperatures are lower than those of the Zircaloy cladding at the beginning of a burnup and then show a slight decrease as the burnup increases. However, as the burnup reaches 400 MWh/kg U, the fuel centerline temperature tendencies of the SiC-coated claddings increase rapidly, while the fuel centerline temperature of the Zircaloy cladding continues to decrease. The lower fuel centerline temperature of the SiC-coated claddings at the early burnup stage is due mainly to the smaller gap size (shown in Figure 7a), which causes better gap conductance. There is no big difference in the fuel centerline temperature of Zircaloy coated with 1 and 1.5 mm SiC claddings. Zircaloy coated with 0.5 mm SiC cladding shows lower fuel centerline temperatures than the 1 and 1.5 mm coated claddings; this is due to better gap conductance resulting from a smaller gap width. From Figure 6b, we can see that the initial fuel centerline temperature of coated claddings is higher than that of the Zircaloy cladding at power-up, due to its relatively poor gap conductance. The fuel centerline temperature of Zircaloy coated with FeCrAl claddings then decreases rapidly as gap size decreases, and finally shows a slight increase as the gap closes. The fuel centerline temperature of Zircaloy coated with FeCrAl claddings increases as coating thickness increases at the same burnup, a result of the gap size increasing as the thickness increases at the same burnup rates, as shown in Figure 7b.
Figure 7 shows the gap size evolutions of Zircaloy, Zircaloy coated with 0.5, 1 and 1.5 mm SiC claddings, and Zircaloy coated with 0.5, 1 and 1.5 mm FeCrAl claddings, respectively. For the SiC-coated Zircaloy claddings, the gap size is smaller than pure Zircaloy claddings before the burnup reaches 250 MWh/kg U, but then tends to be larger than Zircaloy claddings as the burnup rates increase. The gap sizes of Zircaloy coated with 1 and 1.5 mm SiC claddings have almost the same gap size evolution, while Zircaloy coated with 0.5 mm SiC cladding shows a smaller gap size at the same burnup rates. For the FeCrAl-coated Zircaloy claddings, all of the gap sizes are smaller than for the pure Zircaloy cladding and are closed before the burnup reaches 650 MWh/kg U. As the coating thickness of FeCrAl increases, the gap size increases at the same burnup rate. The gap size is affected by plenum pressure, fission gas release, and other factors, as demonstrated in our previous work [19].
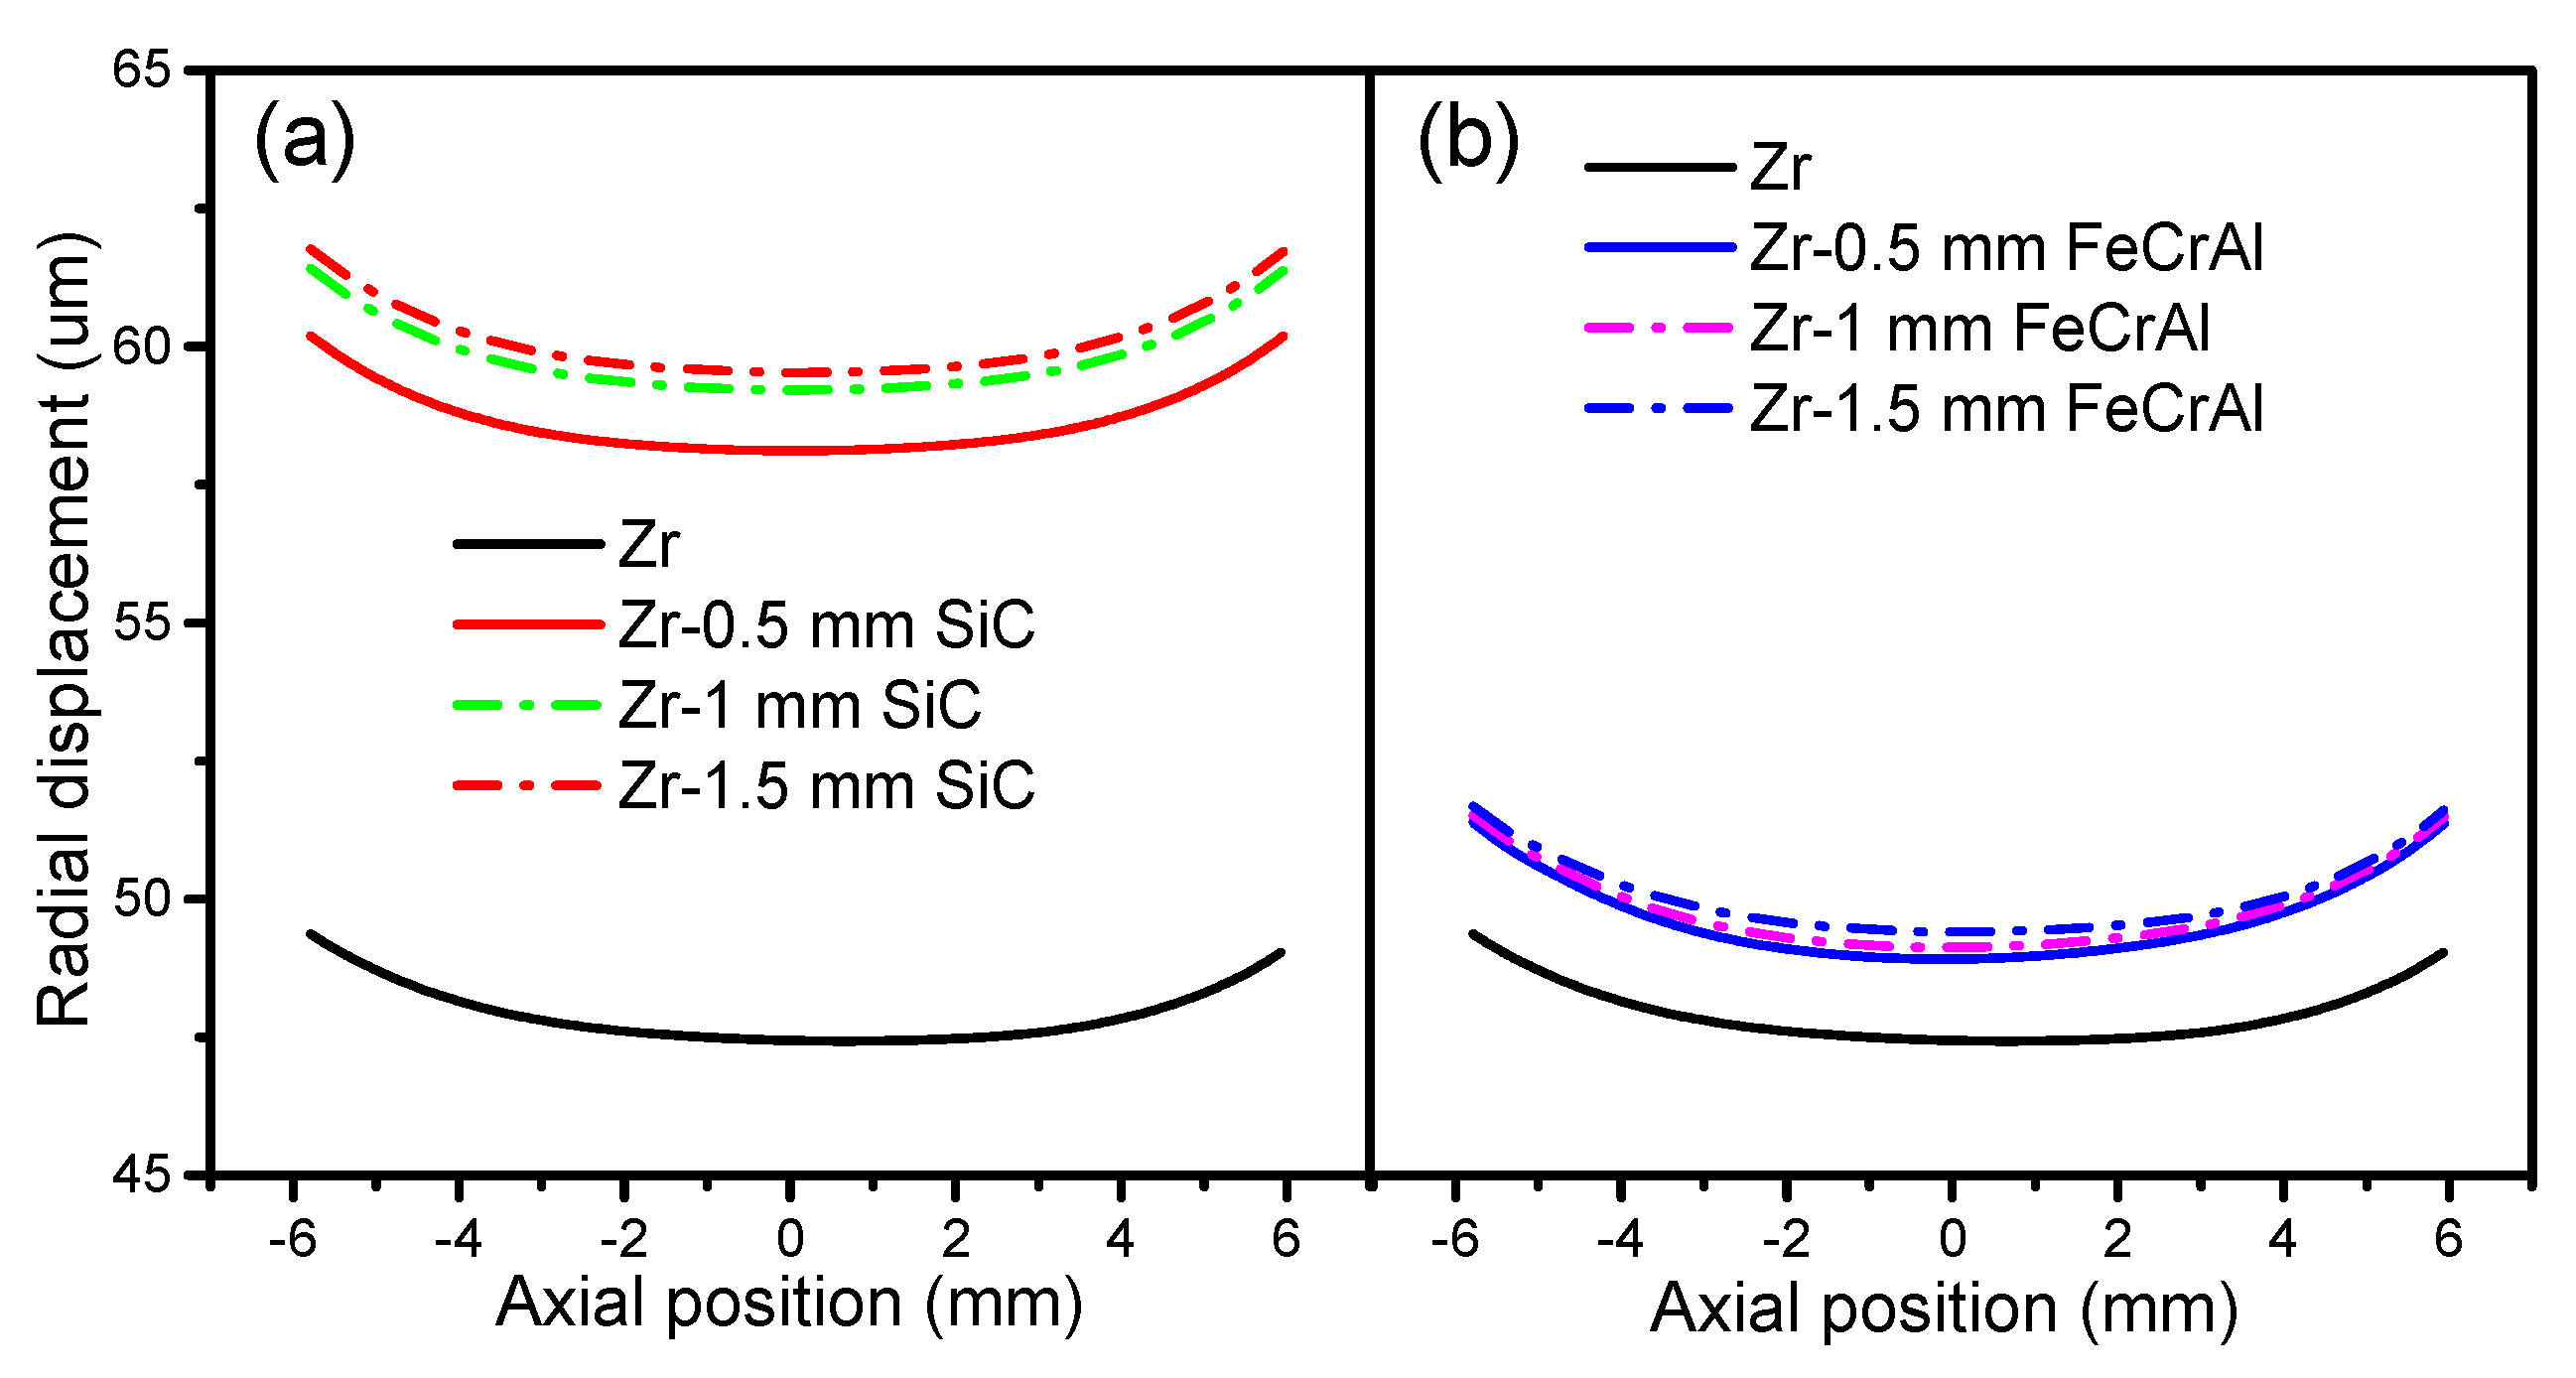
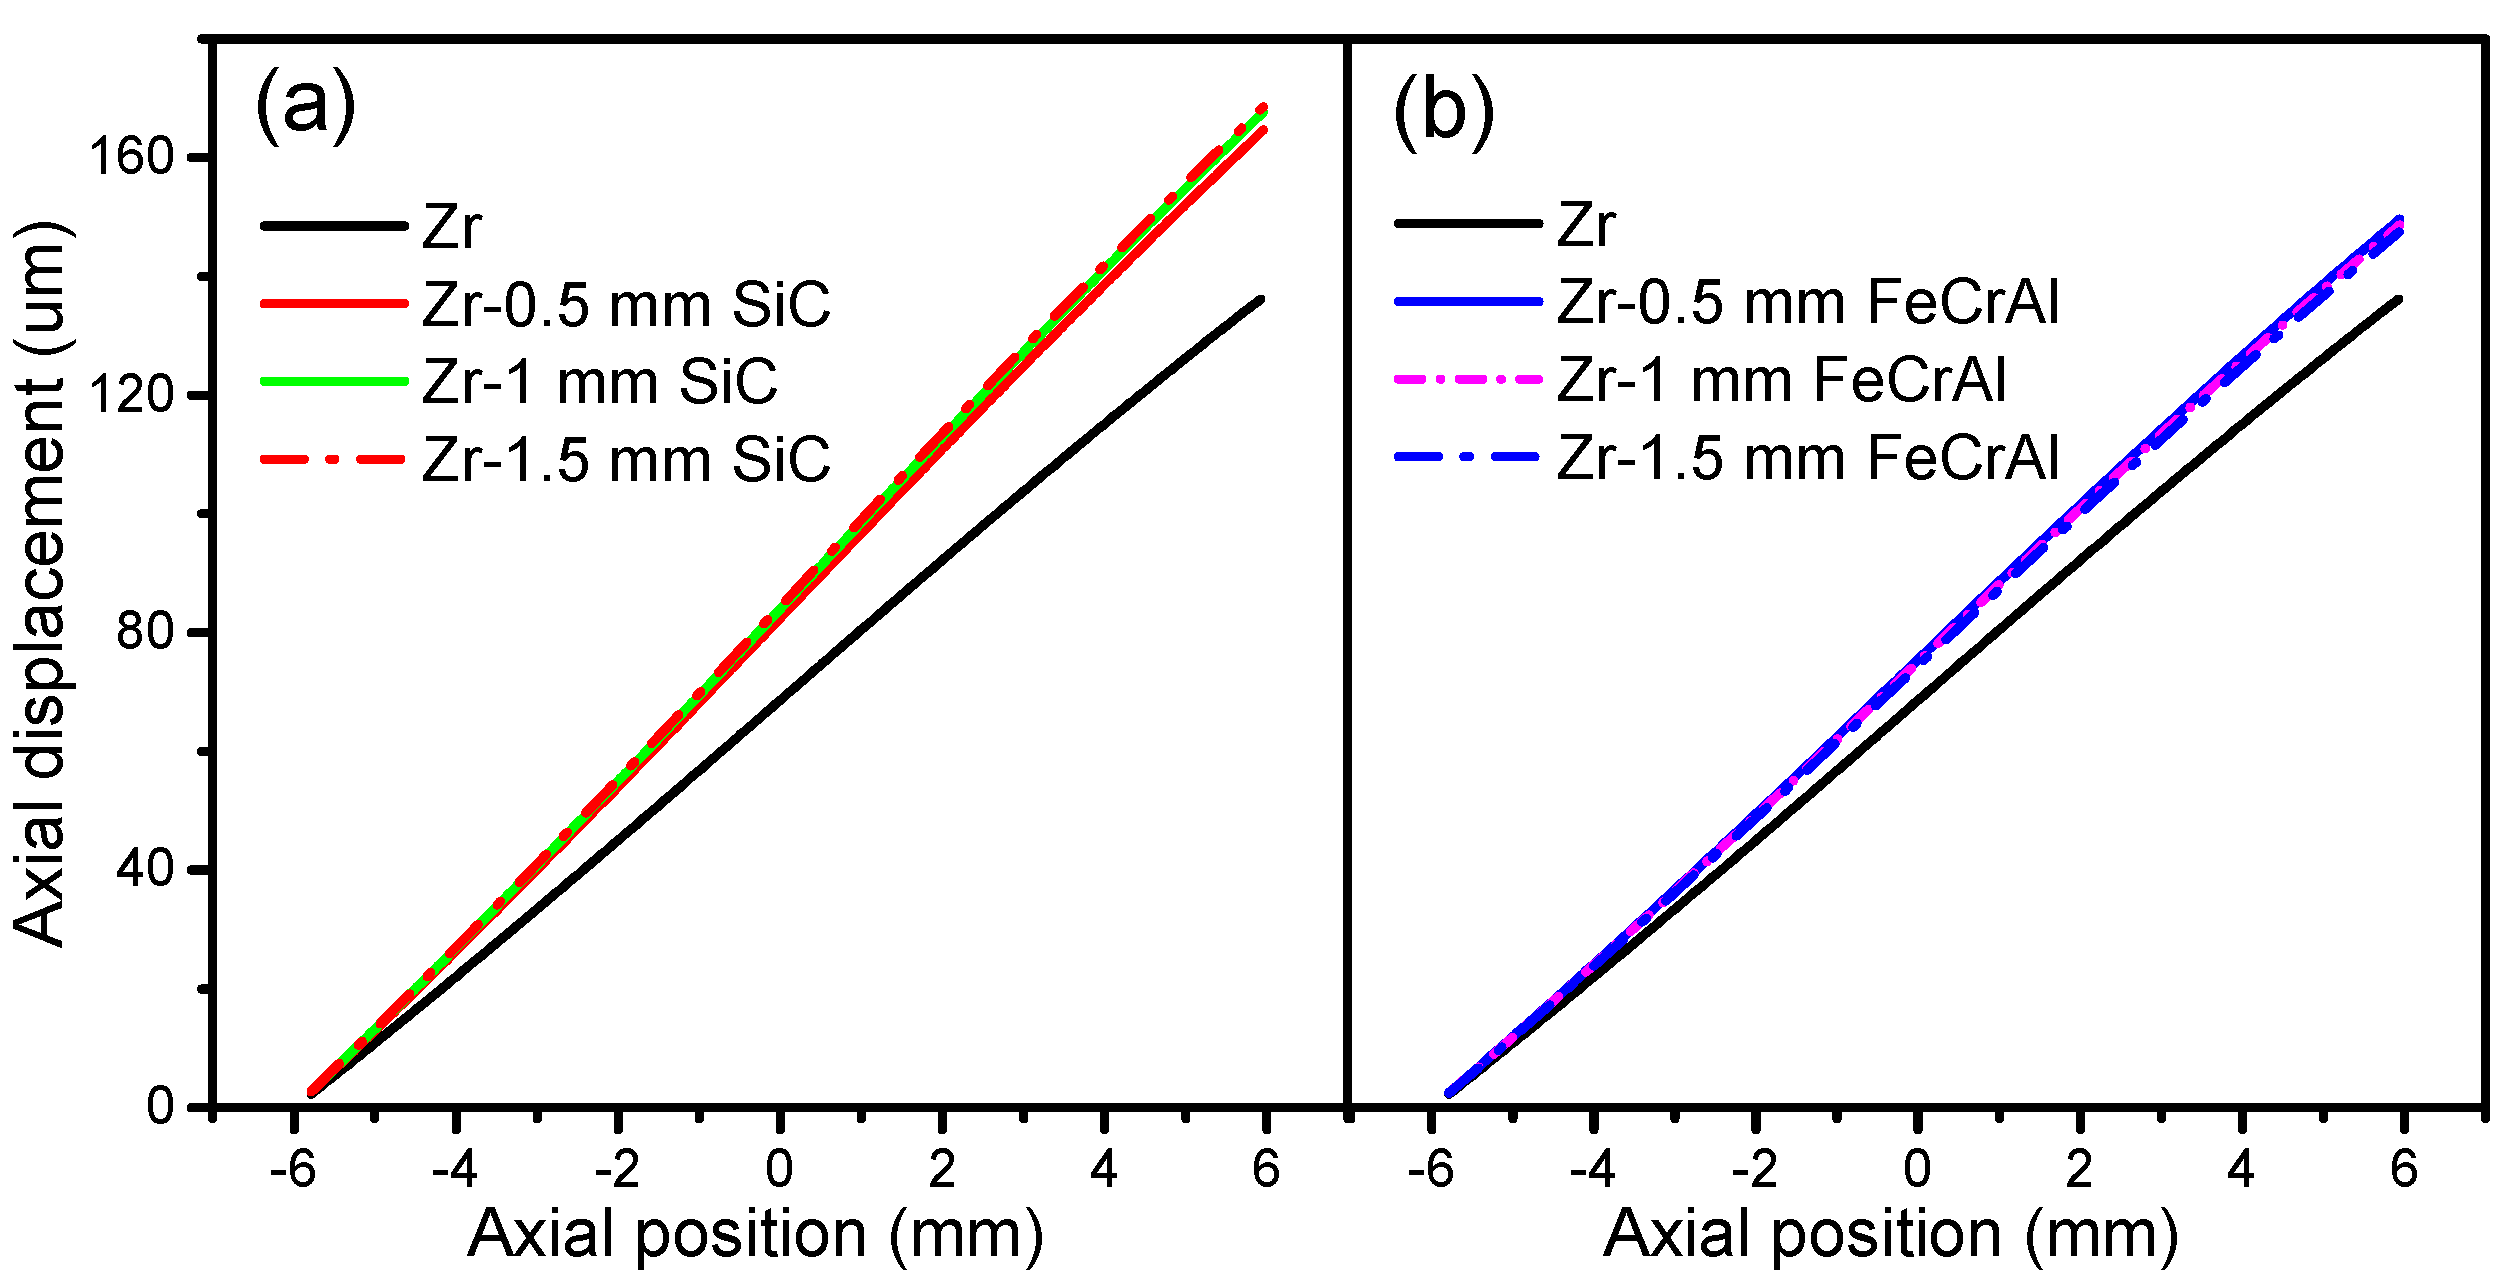
Figure 8 presents the fuel radial displacement evolutions of Zircaloy, Zircaloy coated with 0.5, 1 and 1.5 mm SiC claddings, and Zircaloy coated with 0.5, 1 and 1.5 mm FeCrAl claddings at a burnup of 1200 MWh/kg U. For both the SiC- and FeCrAl-coated claddings, the fuel radial displacement increases as the thickness increases. However, the SiC-coated claddings show more obvious differences in fuel radial displacement at a burnup of 1200 MWh/kg U. The coating causes larger fuel radial displacements than pure Zircaloy when examined at the same axial position as SiC- and FeCrAl-coated claddings, which have higher fuel centerline temperatures than pure Zircaloy. The SiC-coated claddings have more influence on fuel radial displacement than the FeCrAl-coated claddings, as the SiC-coated claddings have higher fuel centerline temperatures. Figure 9 plots the fuel axial displacement evolutions of Zircaloy, Zircaloy coated with 0.5, 1 and 1.5 mm SiC claddings, and Zircaloy coated with 0.5, 1 and 1.5 mm FeCrAl claddings, at a burnup of 1200 MWh/kg U. This shows that the coatings result in more fuel axial displacement overall than the pure Zircaloy cladding when considered at the same burnup rate, and that the SiC-coated Zircaloy claddings experience more axial displacement than the FeCrAl-coated Zircaloy due to its higher fuel centerline temperature. However, no significant difference in fuel axial displacement can be observed with different coating thicknesses.
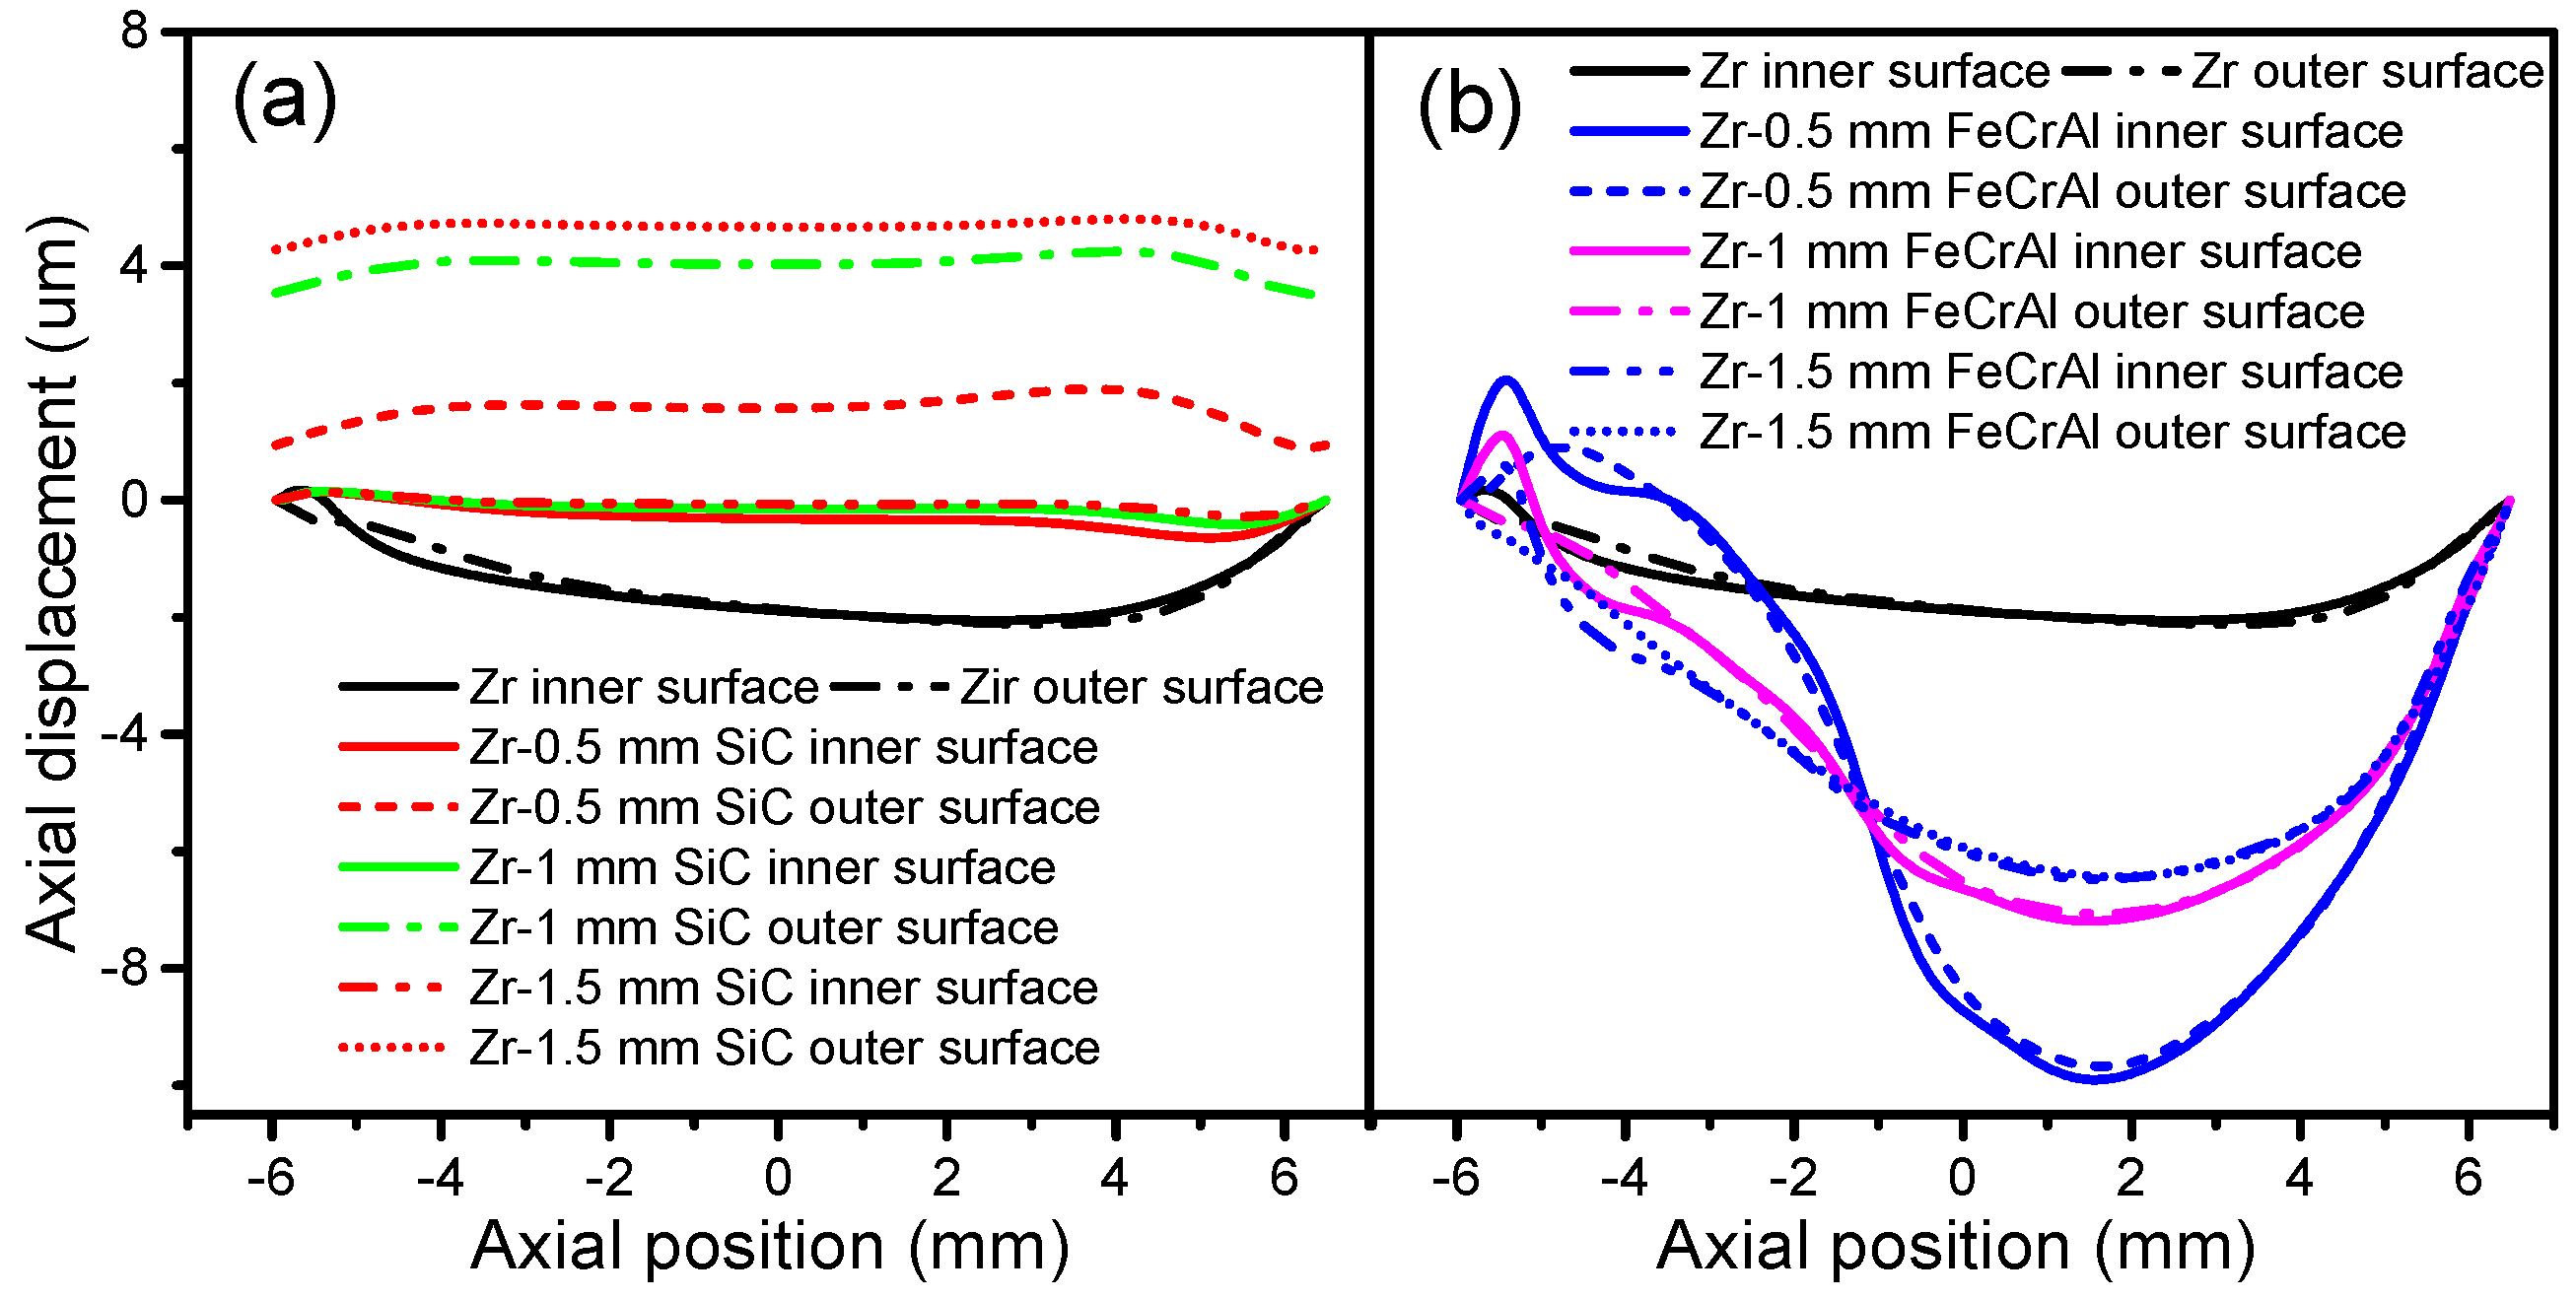
Figure 10 depicts the cladding radial displacement evolutions of the inner and outer surfaces of Zircaloy, Zircaloy coated with 0.5, 1 and 1.5 mm SiC claddings, and Zircaloy coated with 0.5, 1 and 1.5 mm FeCrAl claddings, at a burnup of 1200 MWh/kg U. The SiC-coated claddings show little radial displacement, while the FeCrAl-coated claddings show large displacements toward the fuel direction. The difference between the displacements of the FeCrAl-coated cladding on the inner and outer surfaces is more obvious than those of the pure Zircaloy cladding. More radial displacements occur at the extremities for the FeCrAl-coated claddings. Figure 11 shows the cladding axial displacement evolutions of Zircaloy, Zircaloy coated with 0.5, 1 and 1.5 mm SiC claddings and Zircaloy coated with 0.5, 1 and 1.5 mm FeCrAl claddings, at a burnup of 1200 MWh/kg U. The SiC-coated claddings swell in the axial direction, while the Zircaloy and FeCrAl-coated claddings shrink axially. The axial expansions of the SiC-coated claddings increase as the coating thickness increases. For the FeCrAl-coated claddings, the axial displacement changes dramatically as the axial position changes. At axial point 0.015 m, the largest displacement occurs for 0.5, 1 and 1.5 mm FeCrAl-coated claddings. From 0 to −6 mm, Zircaloy coated with 0.5 mm FeCrAl cladding has more displacement than the thicker 1 and 1.5 mm FeCrAl claddings.
4. Conclusions
In this study, the fuel performance and solid mechanics of UO2-36.4vol % BeO fuel with Zircaloy, SiC, FeCrAl, and surface-coated Zircaloy cladding materials are investigated based on simulation results obtained using the CAMPUS code. The modeling results show that Zircaloy cladding is more effective in decreasing fuel centerline temperatures and fission gas release rates because of its smaller gap size compared with other cladding materials at the same burnup rates. SiC and SiC-coated Zircaloy claddings possess smaller plenum pressures than other claddings but have larger fuel radial displacements and smaller contributions to fuel axial displacement. FeCrAl cladding exhibits very different radial and axial displacements depending on the axial position. SiC-coated Zircaloy claddings still show higher fuel centerline temperatures and more fission gas release, due to their larger gap size compared with pure Zircaloy at the same burnup rate. FeCrAl-coated claddings have lower fuel centerline temperatures than Zircaloy cladding until the burnup exceeds 850 MWh/kg U, after which point they become higher. The gaps of FeCrAl-coated claddings are closed earlier than those of Zircaloy cladding. SiC-coated claddings increase the fuel radial, fuel axial, and cladding axial displacements. For cladding inner and outer surfaces, FeCrAl-coated claddings have wide variation, depending on the axial position.
Acknowledgments
The authors gratefully acknowledge the support of Hong Kong General Research Fund (No. CityU 11276616), Hong Kong Early Career Scheme Grant (No. CityU 21202114), CityU Start-up (No. 7200343) and Equipment Grants (No. 9610289).
Author Contributions
Wenzhong Zhou conceived and designed the research work; Wei Zhou performed the modeling and simulations, and analyzed the data; and Wei Zhou and Wenzhong Zhou wrote the manuscript. All of the authors contributed to the scientific discussion of the results and reviewed the manuscript.
Conflicts of Interest
The authors declare no conflict of interest.
Appendix A
The heat capacity of fuel composite is defined as
The heat capacity of UO2 is given by [20] and the heat capacity of BeO is derived from [21].
where is the oxygen-to-metal ratio and is initially assumed to be 2 [22], but is then considered to be dynamic (oxygen to metal ratio deviation) due to oxygen diffusion; T is the temperature; K1 = 296.7 J/kg K; K2 = 0.0243 J/kg K2; K3 = 8.75 × J/kg; R = 8.315 J/mole K; = 535.285 K; and ED = 1.577 × J/mole.
The density of UO2-BeO composite fuel is calculated based on
Fink proposed a simulation to calculate the density of solid UO2 [8]:
For T ≤ 923 K, .
For T > 923 K, .
The density of BeO is illustrated below [23]:
Young’s modulus and the Poisson ratio of the composite are yielded from
Young’s modulus and the Poisson ratio of UO2 were obtained from the formulas suggested by Martin [16].
—Oxygen to metal ratio deviation.
For T ≤ 923 K, .
For T > 923 K, .
The Young’s modulus and Poisson ratio values of BeO were 350 (GPa) and 0.229, respectively [24].
The thermal conductivity , heat capacity , density , Poisson ratio , and Young’s modulus are calculated based on [14].
The thermal conductivity , heat capacity , density , Poisson ratio , and Young’s modulus are calculated based on [14].
The Poisson ratios of Zircaloy and FeCrAl are 0.32 and 0.3, respectively.
References
- Yeo, S.; McKenna, E.; Baney, R.; Subhash, G.; Tulenko, J. Enhanced thermal conductivity of uranium dioxide–silicon carbide composite fuel pellets prepared by Spark Plasma Sintering (SPS). J. Nucl. Mater. 2013, 433, 66–73. [Google Scholar] [CrossRef]
- Ishimoto, S.; Hirai, M.; Ito, K.; Korei, Y. Thermal conductivity of UO2-BeO pellet. J. Nucl. Sci. Technol. 1996, 33, 134–140. [Google Scholar] [CrossRef]
- Zinkle, S.J.; Terrani, K.A.; Gehin, J.C.; Ott, L.J.; Snead, L.L. Accident tolerant fuels for LWRs: A perspective. J. Nucl. Mater. 2014, 448, 374–379. [Google Scholar] [CrossRef]
- Markham, G.; Hall, R.; Feinroth, H. Recession of silicon carbide in steam under nuclear plant loca conditions up to 1400 °C. In Ceramic Materials for Energy Applications II; Fox, K.M., Katoh, Y., Lin, H.-T., Belharouak, I., Eds.; John Wiley & Sons: Hoboken, NJ, USA, 2012; pp. 111–120. [Google Scholar]
- Kim, D.; Lee, H.-G.; Park, J.Y.; Kim, W.-J. Fabrication and measurement of hoop strength of sic triplex tube for nuclear fuel cladding applications. J. Nucl. Mater. 2015, 458, 29–36. [Google Scholar] [CrossRef]
- Terrani, K.A.; Zinkle, S.J.; Snead, L.L. Advanced oxidation-resistant iron-based alloys for LWR fuel cladding. J. Nucl. Mater. 2014, 448, 420–435. [Google Scholar] [CrossRef]
- Kim, H.-G.; Kim, I.-H.; Jung, Y.-I.; Park, D.-J.; Park, J.-Y.; Koo, Y.-H. Adhesion property and high-temperature oxidation behavior of Cr-coated Zircaloy-4 cladding tube prepared by 3D laser coating. J. Nucl. Mater. 2015, 465, 531–539. [Google Scholar] [CrossRef]
- Fink, J.K. Thermophysical properties of uranium dioxide. J. Nucl. Mater. 2000, 279, 1–18. [Google Scholar] [CrossRef]
- Lucuta, P.G.; Matzke, H.; Hastings, I.J. A pragmatic approach to modelling thermal conductivity of irradiated UO2 fuel: Review and recommendations. J. Nucl. Mater. 1996, 232, 166–180. [Google Scholar] [CrossRef]
- Hasselman, D.P.H.; Johnson, L.F. Effective thermal conductivity of composites with interfacial thermal barrier resistance. J. Compos. Mater. 1987, 21, 508–515. [Google Scholar] [CrossRef]
- Solomon, A.A.; Revankar, S.; McCoy, J.K. Enhanced Thermal Conductivity Oxide Fuels, Final Report; PU 2002-180-1.2, NERI Contract OER-32; School of Nuclear Engineering, Purdue University: West Lafayette, IN, USA, 2005. [Google Scholar]
- Touloukian, Y.S. Thermophysical Properties of Matter: The Tprc Data Series; A Comprehensive Compilation of Data; Ifi/Plenum: Wilmington, NC, USA, 1970; Volume 1. [Google Scholar]
- International Atomic Energy Agency. Thermophysical Properties Database of Materials for Light Water Reactors and Heavy Water Reactors; IAEA-TECDOC-1496; International Atomic Energy Agency: Vienna, Austria, 2006. [Google Scholar]
- Wu, X.; Kozlowski, T.; Hales, J.D. Neutronics and fuel performance evaluation of accident tolerant fecral cladding under normal operation conditions. Ann. Nucl. Energy 2015, 85, 763–775. [Google Scholar] [CrossRef]
- Latta, R.; Revankar, S.T.; Solomon, A.A. Modeling and measurement of thermal properties of ceramic composite fuel for light water reactors. Heat Transf. Eng. 2008, 29, 357–365. [Google Scholar] [CrossRef]
- Martin, D.G. The thermal expansion of solid UO2 and (U, Pu) mixed oxides—A review and recommendations. J. Nucl. Mater. 1988, 152, 94–101. [Google Scholar] [CrossRef]
- Gomes, D.S.; Abe, A.Y.; Muniz, R.O.R.; Giovedi, C. Analysis of UO2-BeO fuel under transient using fuel performance code. In Proceedings of the 2017 International Nuclear Atlantic Conference—INAC 2017, Belo Horizente, MG, Brazil, 22–27 October 2017. [Google Scholar]
- MacDonald, P.E.; Thompson, L.B. Matpro: Version 09. A Handbook of Materials Properties for Use in the Analysis of Light Water Reactor Fuel Rod Behavior; TREE-NUREG-1005; SEE CODE-9502158 Aerojet Nuclear Co.: Idaho Falls, ID, USA; Idaho National Engineering Lab.: Idaho Falls, ID, USA, 1976. [Google Scholar]
- Liu, R.; Prudil, A.; Zhou, W.; Chan, P.K. Multiphysics coupled modeling of light water reactor fuel performance. Prog. Nucl. Energy 2016, 91, 38–48. [Google Scholar] [CrossRef]
- Carbajo, J.J.; Yoder, G.L.; Popov, S.G.; Ivanov, V.K. A review of the thermophysical properties of mox and UO2 fuels. J. Nucl. Mater. 2001, 299, 181–198. [Google Scholar] [CrossRef]
- Chandramouli, D.; Revankar, S.T. Development of thermal models and analysis of UO2-BeO fuel during a loss of coolant accident. Int. J. Nucl. Energy 2014, 2014, 751070. [Google Scholar] [CrossRef]
- Lucuta, P.G.; Matzke, H.; Verrall, R.A. Thermal conductivity of hyperstoichiometric simfuel. J. Nucl. Mater. 1995, 223, 51–60. [Google Scholar] [CrossRef]
- Liu, R.; Zhou, W.; Shen, P.; Prudil, A.; Chan, P.K. Fully coupled multiphysics modeling of enhanced thermal conductivity UO2-BeO fuel performance in a light water reactor. Nucl. Eng. Des. 2015, 295, 511–523. [Google Scholar] [CrossRef]
- Soga, N. Elastic constants of polycrystalline BeO as a function of pressure and temperature. J. Am. Ceram. Soc. 1969, 52, 246–249. [Google Scholar] [CrossRef]
Figure 1.
Thermal conductivity of UO2-36.4vol % BeO with measured and modeled results, and Zr, SiC, and FeCrAl cladding materials.
Figure 1.
Thermal conductivity of UO2-36.4vol % BeO with measured and modeled results, and Zr, SiC, and FeCrAl cladding materials.

Figure 2.
Thermal expansion of UO2-36.4vol % BeO, Zr (in r, phi, and z directions), SiC, and FeCrAl.
Figure 2.
Thermal expansion of UO2-36.4vol % BeO, Zr (in r, phi, and z directions), SiC, and FeCrAl.

Figure 3.
(a) Comparison of fuel centerline temperature vs. burnup, with various cladding materials; (b) Gap size evolutions with Zircaloy, SiC, and FeCrAl claddings.
Figure 3.
(a) Comparison of fuel centerline temperature vs. burnup, with various cladding materials; (b) Gap size evolutions with Zircaloy, SiC, and FeCrAl claddings.
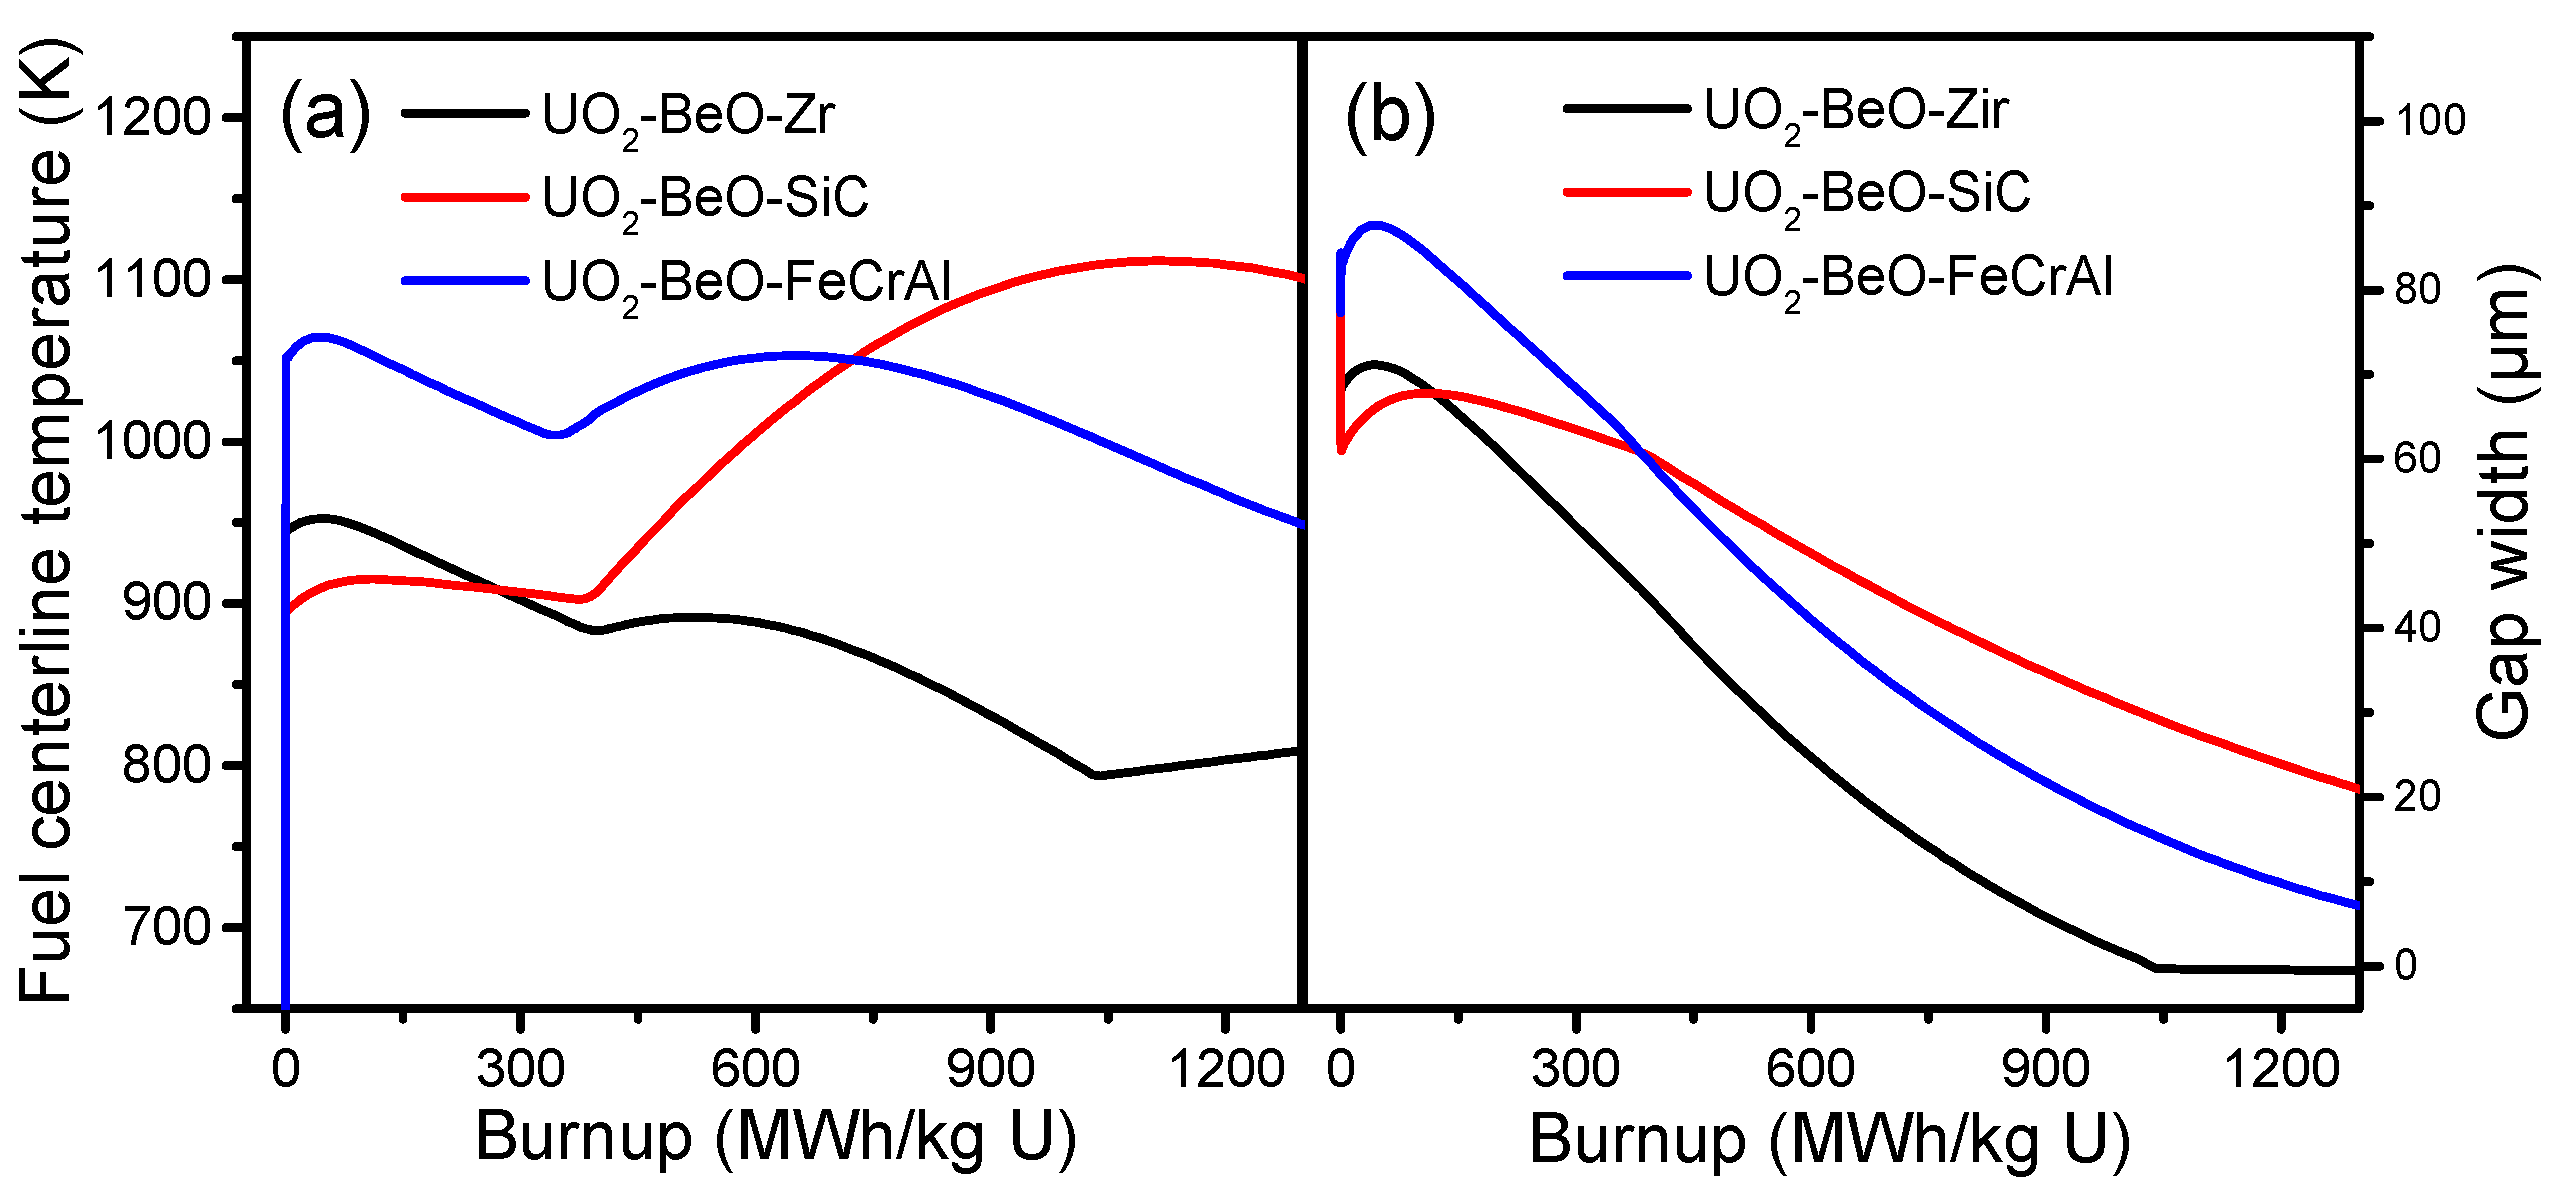
Figure 4.
Fuel displacement evolution against the axial positions of Zircaloy, SiC, and FeCrAl claddings, at a burnup of 1200 MWh/kg U. (a) Fuel radial displacement and (b) fuel axial displacement.
Figure 4.
Fuel displacement evolution against the axial positions of Zircaloy, SiC, and FeCrAl claddings, at a burnup of 1200 MWh/kg U. (a) Fuel radial displacement and (b) fuel axial displacement.

Figure 5.
Cladding displacement of inner and outer surfaces of Zircaloy, SiC, and FeCrAl claddings at a burnup of 1200 MWh/kg U. (a) Cladding radial displacement and (b) cladding axial displacement.
Figure 5.
Cladding displacement of inner and outer surfaces of Zircaloy, SiC, and FeCrAl claddings at a burnup of 1200 MWh/kg U. (a) Cladding radial displacement and (b) cladding axial displacement.
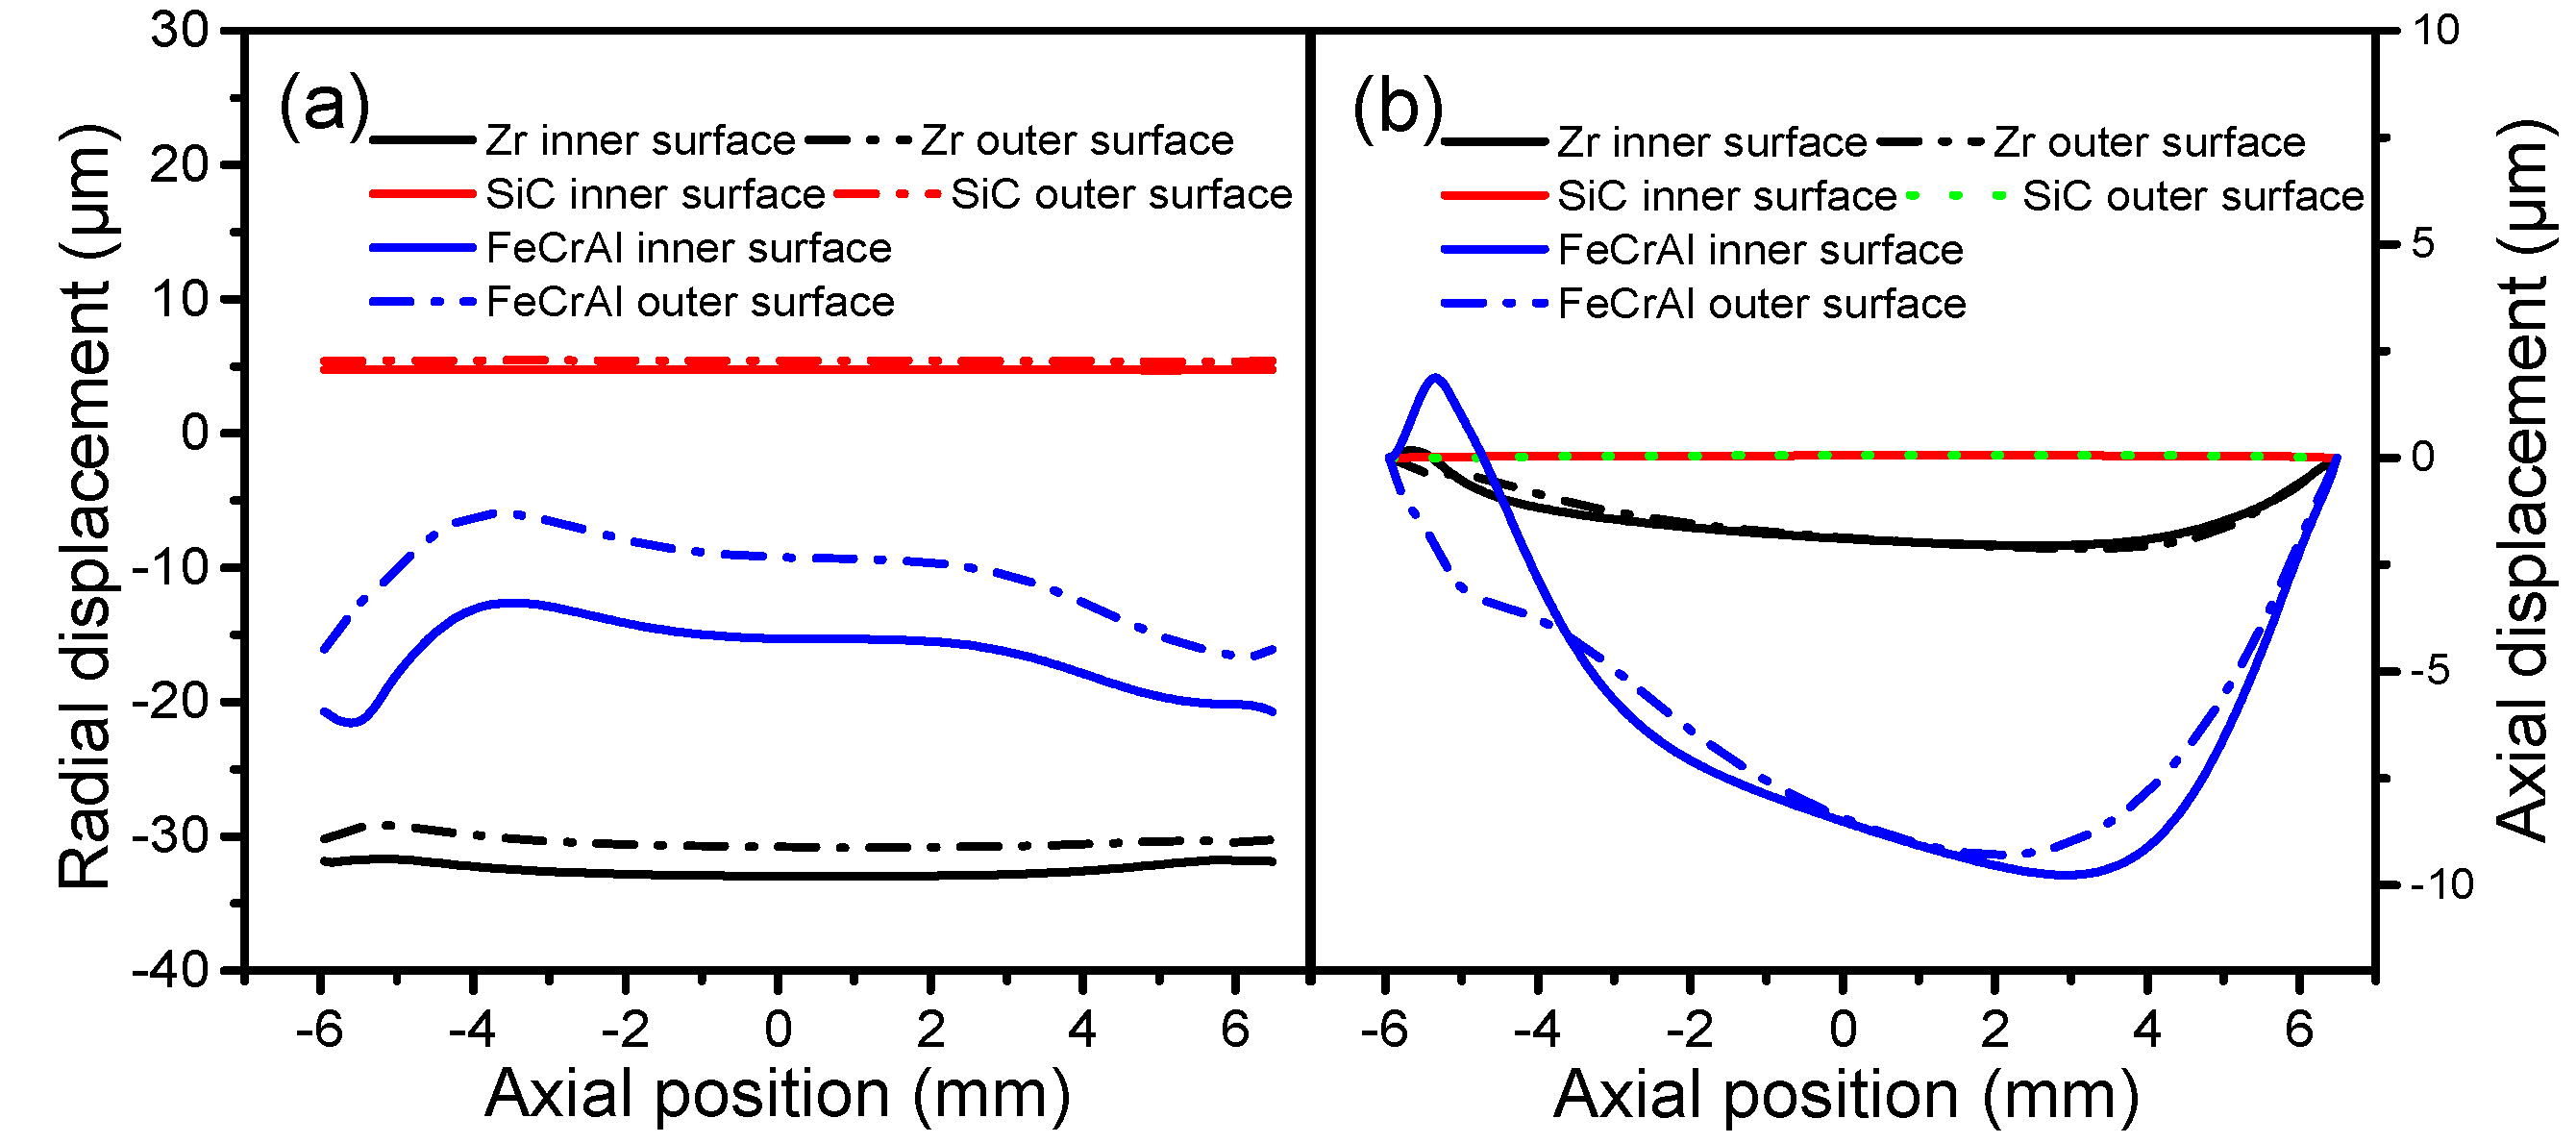
Figure 6.
Fuel centerline temperature of (a) Zircaloy, Zircaloy coated with 0.5, 1 and 1.5 mm SiC claddings; (b) Zircaloy, Zircaloy coated with 0.5, 1 and 1.5 mm FeCrAl claddings.
Figure 6.
Fuel centerline temperature of (a) Zircaloy, Zircaloy coated with 0.5, 1 and 1.5 mm SiC claddings; (b) Zircaloy, Zircaloy coated with 0.5, 1 and 1.5 mm FeCrAl claddings.
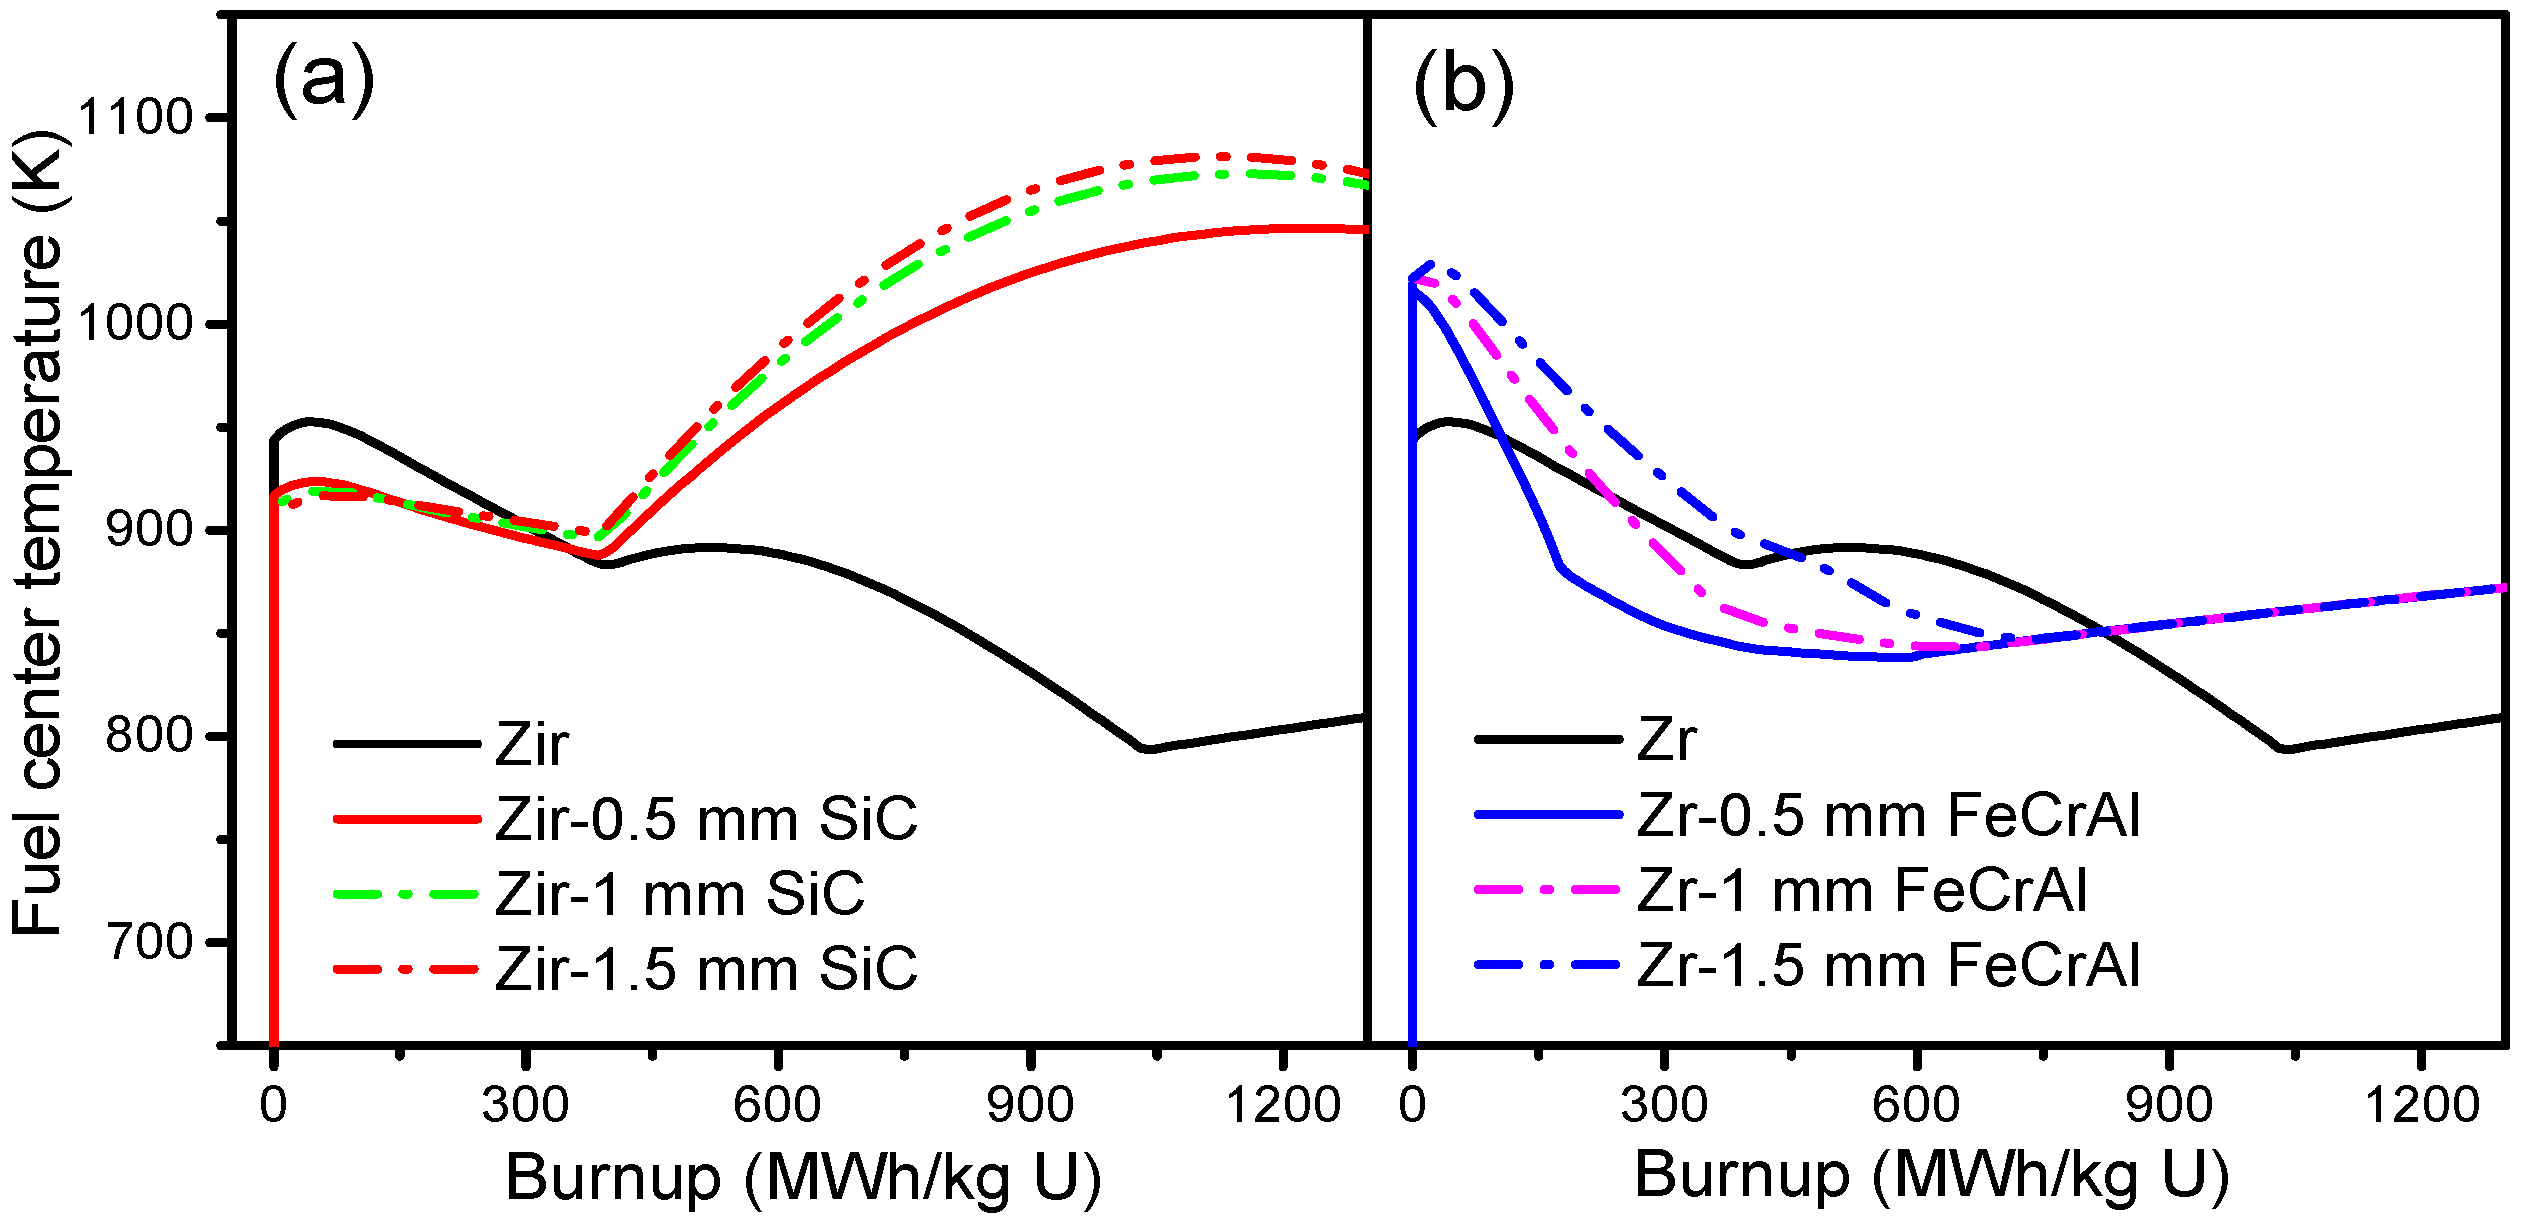
Figure 7.
Gap size evolutions of (a) Zircaloy, Zircaloy coated with 0.5, 1 and 1.5 mm SiC claddings; (b) Zircaloy, Zircaloy coated with 0.5, 1 and 1.5 mm FeCrAl claddings.
Figure 7.
Gap size evolutions of (a) Zircaloy, Zircaloy coated with 0.5, 1 and 1.5 mm SiC claddings; (b) Zircaloy, Zircaloy coated with 0.5, 1 and 1.5 mm FeCrAl claddings.
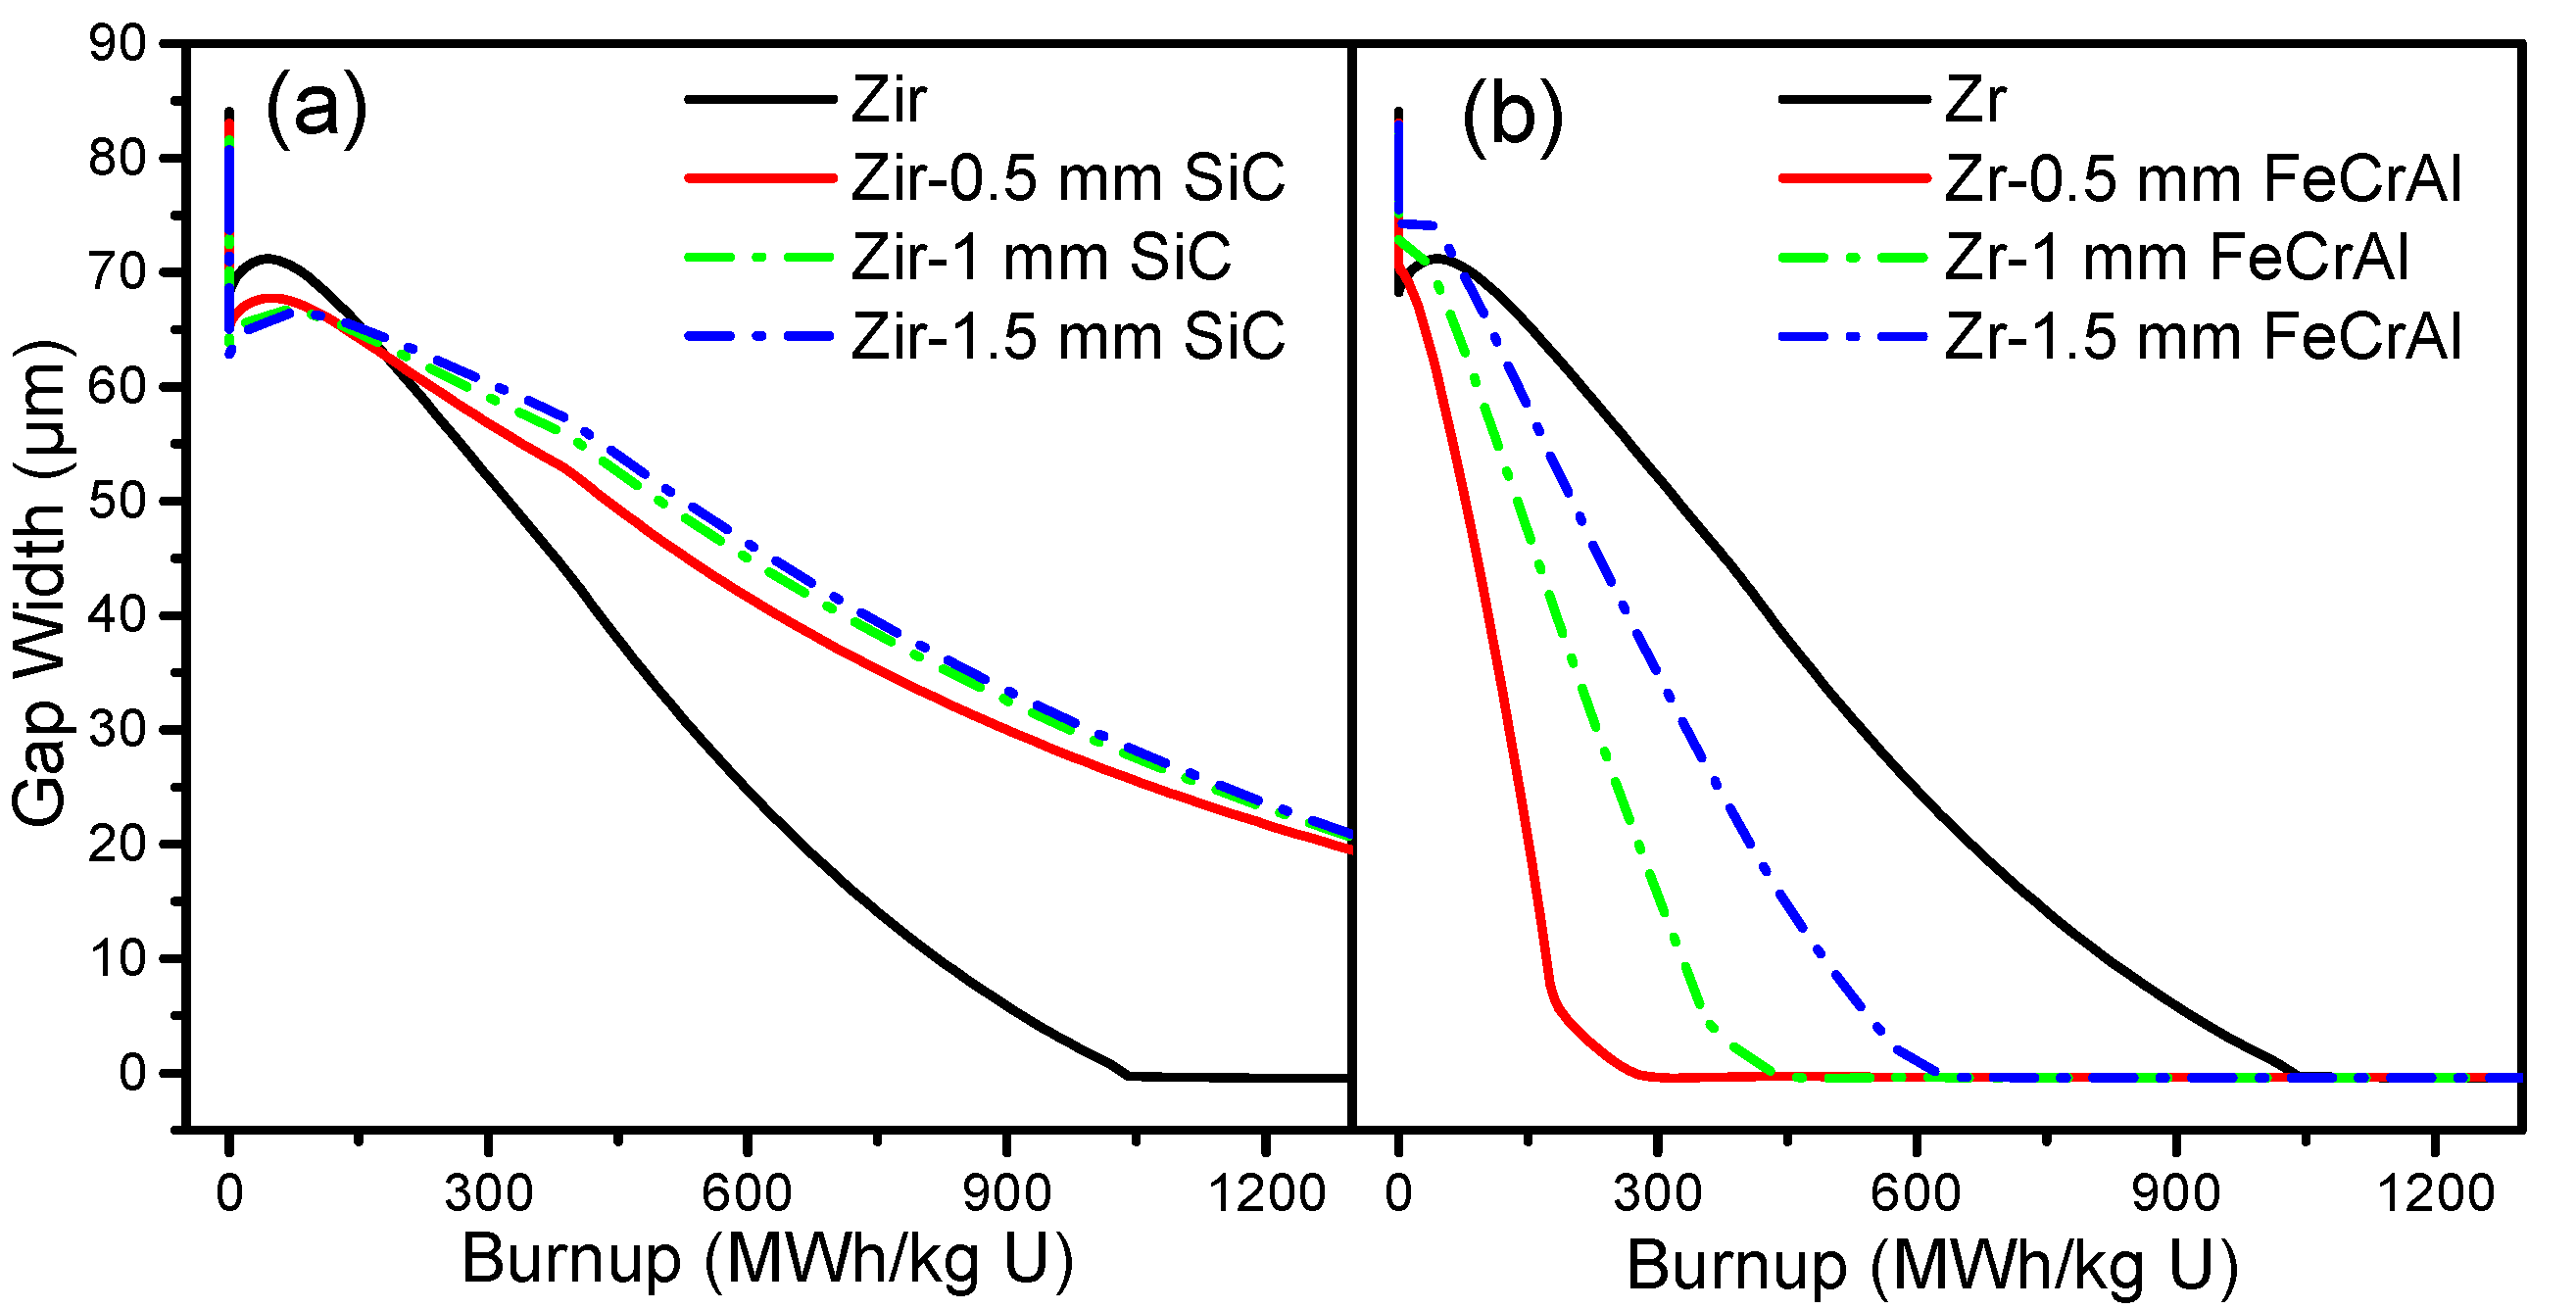
Figure 8.
Fuel radial displacement evolutions of (a) Zircaloy, Zircaloy coated with 0.5, 1 and 1.5 mm SiC claddings; (b) Zircaloy, Zircaloy coated with 0.5, 1 and 1.5 mm FeCrAl claddings, at a burnup of 1200 MWh/kg U.
Figure 8.
Fuel radial displacement evolutions of (a) Zircaloy, Zircaloy coated with 0.5, 1 and 1.5 mm SiC claddings; (b) Zircaloy, Zircaloy coated with 0.5, 1 and 1.5 mm FeCrAl claddings, at a burnup of 1200 MWh/kg U.

Figure 9.
Fuel axial displacement evolutions of (a) Zircaloy, Zircaloy coated with 0.5, 1 and 1.5 mm SiC claddings; (b) Zircaloy, Zircaloy coated with 0.5, 1 and 1.5 mm FeCrAl claddings, at a burnup of 1200 MWh/kg U.
Figure 9.
Fuel axial displacement evolutions of (a) Zircaloy, Zircaloy coated with 0.5, 1 and 1.5 mm SiC claddings; (b) Zircaloy, Zircaloy coated with 0.5, 1 and 1.5 mm FeCrAl claddings, at a burnup of 1200 MWh/kg U.

Figure 10.
Cladding radial displacements of inner and outer surfaces of (a) Zircaloy, Zircaloy coated with 0.5, 1 and 1.5 mm SiC claddings; (b) Zircaloy, Zircaloy coated with 0.5, 1 and 1.5 mm FeCrAl claddings, at a burnup of 1200 MWh/kg U.
Figure 10.
Cladding radial displacements of inner and outer surfaces of (a) Zircaloy, Zircaloy coated with 0.5, 1 and 1.5 mm SiC claddings; (b) Zircaloy, Zircaloy coated with 0.5, 1 and 1.5 mm FeCrAl claddings, at a burnup of 1200 MWh/kg U.
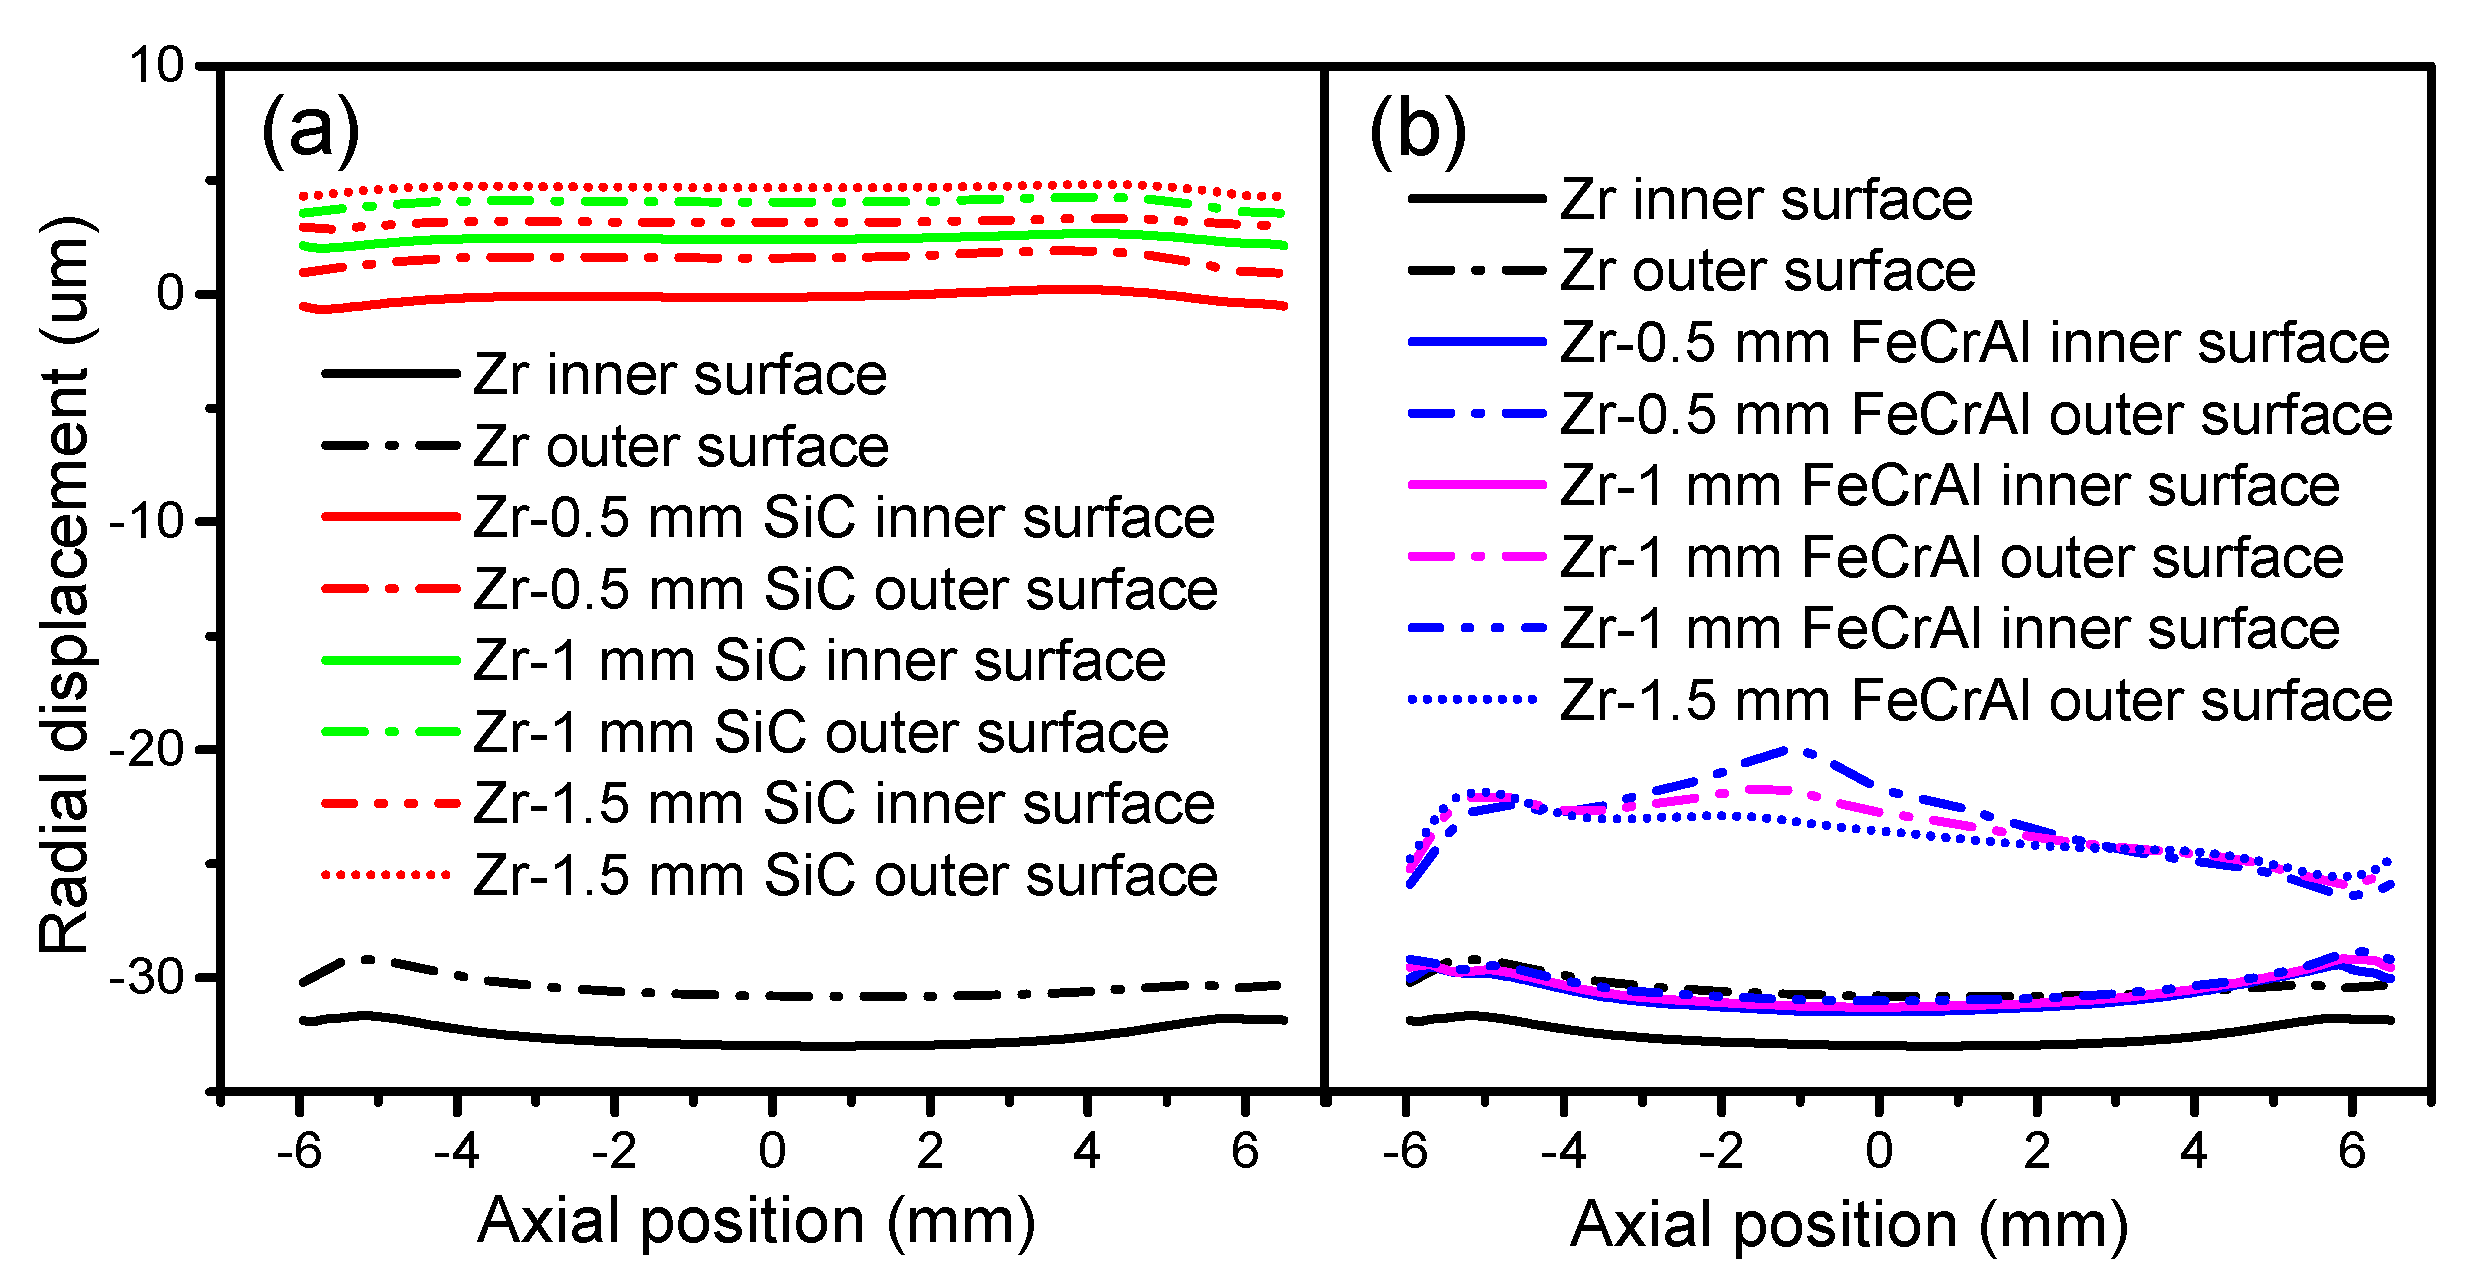
Figure 11.
Cladding radial displacements of inner and outer surfaces of (a) Zircaloy, Zircaloy coated with 0.5, 1 and 1.5 mm SiC claddings; (b) Zircaloy, Zircaloy coated with 0.5, 1 and 1.5 mm FeCrAl claddings, at a burnup of 1200 MWh/kg U.
Figure 11.
Cladding radial displacements of inner and outer surfaces of (a) Zircaloy, Zircaloy coated with 0.5, 1 and 1.5 mm SiC claddings; (b) Zircaloy, Zircaloy coated with 0.5, 1 and 1.5 mm FeCrAl claddings, at a burnup of 1200 MWh/kg U.


Table 1.
BeO thermal conductivity experiment data.
| T (K) | 301.4 | 319.4 | 325.8 | 332.9 | 359 | 367.6 | 397 | 426.2 | 475.2 | 514.7 | 524.6 |
| k(BeO) | 219 | 204 | 194 | 187.9 | 167.4 | 164.7 | 145.4 | 131.6 | 113.1 | 99.5 | 94.2 |
| T (K) | 560.5 | 652.7 | 712.4 | 850 | 905 | 1080 | 1182 | 1270 | 1360 | 1405 | 1490 |
| k(BeO) | 87.2 | 70.4 | 61.4 | 58.3 | 57.1 | 39.1 | 34.3 | 26.1 | 22.3 | 21.2 | 20.5 |
© 2018 by the authors. Licensee MDPI, Basel, Switzerland. This article is an open access article distributed under the terms and conditions of the Creative Commons Attribution (CC BY) license (http://creativecommons.org/licenses/by/4.0/).
Share and Cite
MDPI and ACS Style
Zhou, W.; Zhou, W. Thermophysical and Mechanical Analyses of UO2-36.4vol % BeO Fuel Pellets with Zircaloy, SiC, and FeCrAl Claddings. Metals 2018, 8, 65. https://doi.org/10.3390/met8010065
AMA Style
Zhou W, Zhou W. Thermophysical and Mechanical Analyses of UO2-36.4vol % BeO Fuel Pellets with Zircaloy, SiC, and FeCrAl Claddings. Metals. 2018; 8(1):65. https://doi.org/10.3390/met8010065
Chicago/Turabian StyleZhou, Wei, and Wenzhong Zhou. 2018. "Thermophysical and Mechanical Analyses of UO2-36.4vol % BeO Fuel Pellets with Zircaloy, SiC, and FeCrAl Claddings" Metals 8, no. 1: 65. https://doi.org/10.3390/met8010065
Note that from the first issue of 2016, this journal uses article numbers instead of page numbers. See further details here.