Article

Optimization of Processing Parameters for a Reverse Drawing–Flanging Combined Process for a B550CL High-Strength Steel Spoke Based on Grey Relational Analysis

State Key Laboratory of Solidification Processing, School of Materials Science and Engineering, Northwestern Polytechnical University, Xi’an 710072, China
*
Author to whom correspondence should be addressed.
Metals 2018, 8(1), 7; https://doi.org/10.3390/met8010007
Submission received: 13 November 2017 / Revised: 20 December 2017 / Accepted: 21 December 2017 / Published: 26 December 2017

Abstract

:
Undesired wall thickness distribution and flanging cracking easily occur in reverse drawing–flanging combined processes of steel spokes when improper process parameters are used. Thus, based on GRA (grey relational analysis) and FEM (finite element method), a GRA model for a reverse drawing–flanging combined process for high strength steel B550CL spoke was established and validated. The results show that: (1) the most significant factors affecting uneven wall thickness distribution and excessive thinning in the mounting zone and center hole cracking are the friction coefficient and the shape of punch, respectively; (2) the non-uniformity of wall thickness U increases with the increase of the friction coefficient. The conical punch has a lower thinning ratio T, the spherical punch has a lower value of damage D; (3) considering synthetically the indexes of uneven wall thickness distribution, the excessive thinning in the mounting zone and center hole cracking, optimal results for the process parameters are obtained.

1. Introduction

Due to the advantages of weight reduction, product performance improvement and lower cost, high-strength steel spokes have been widely used in the automobile industry [
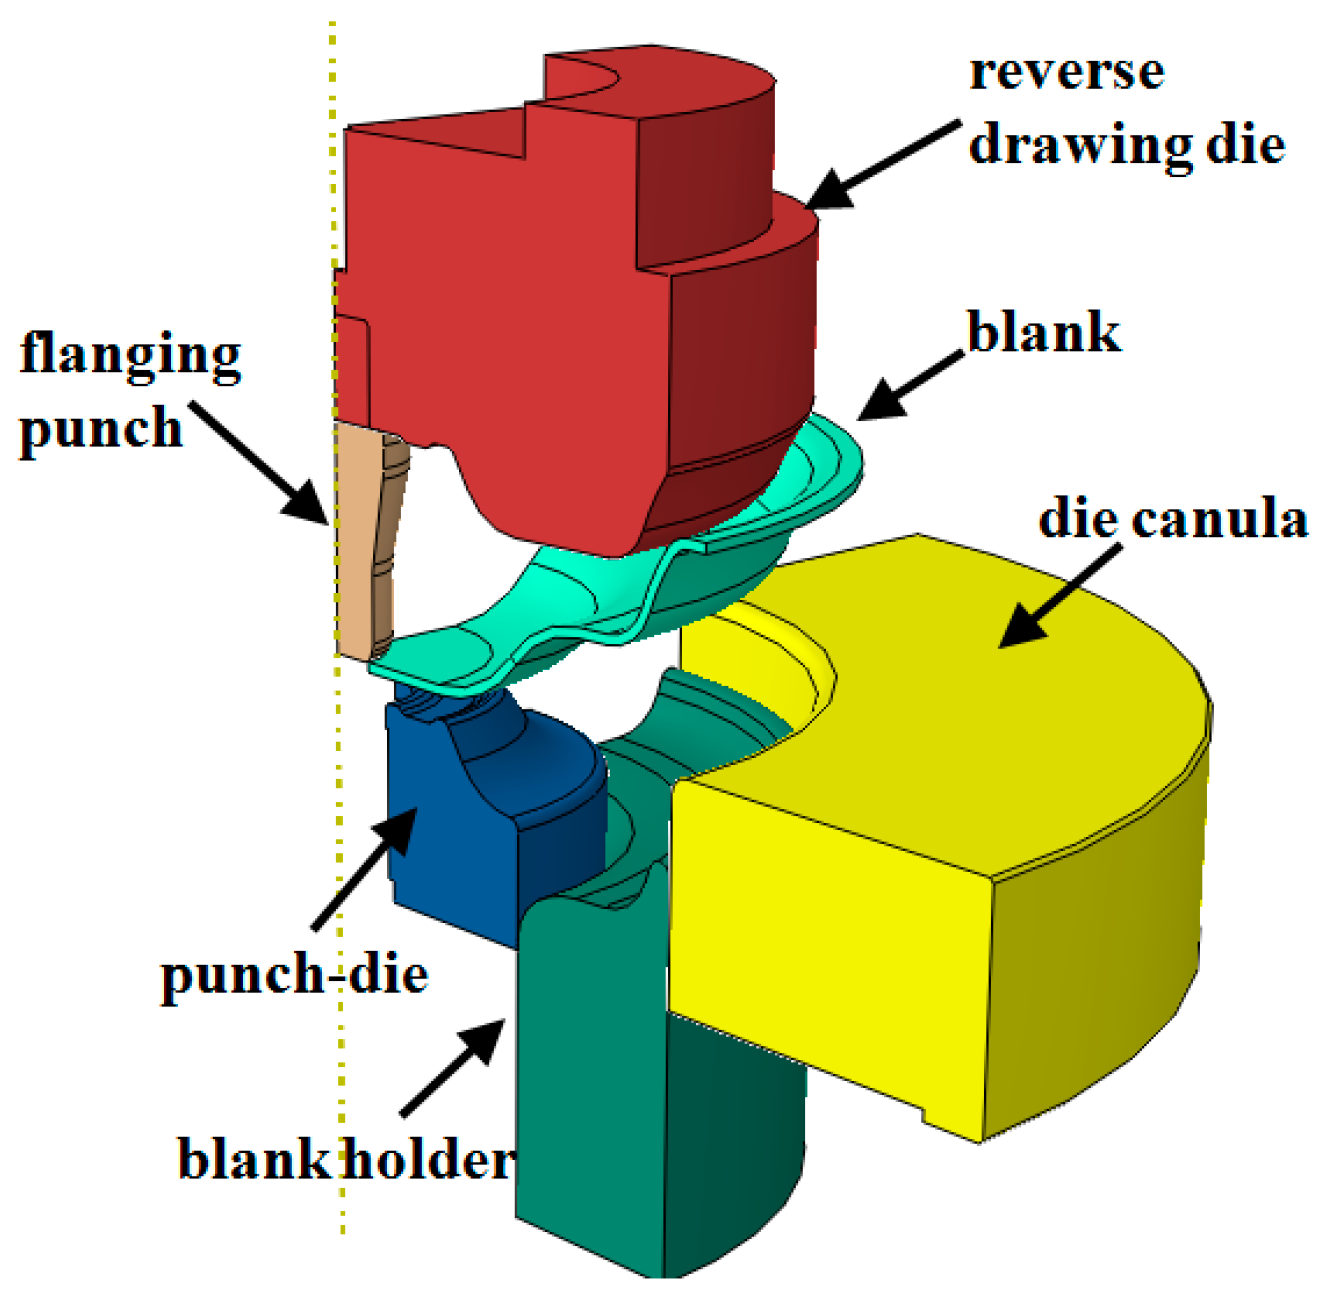
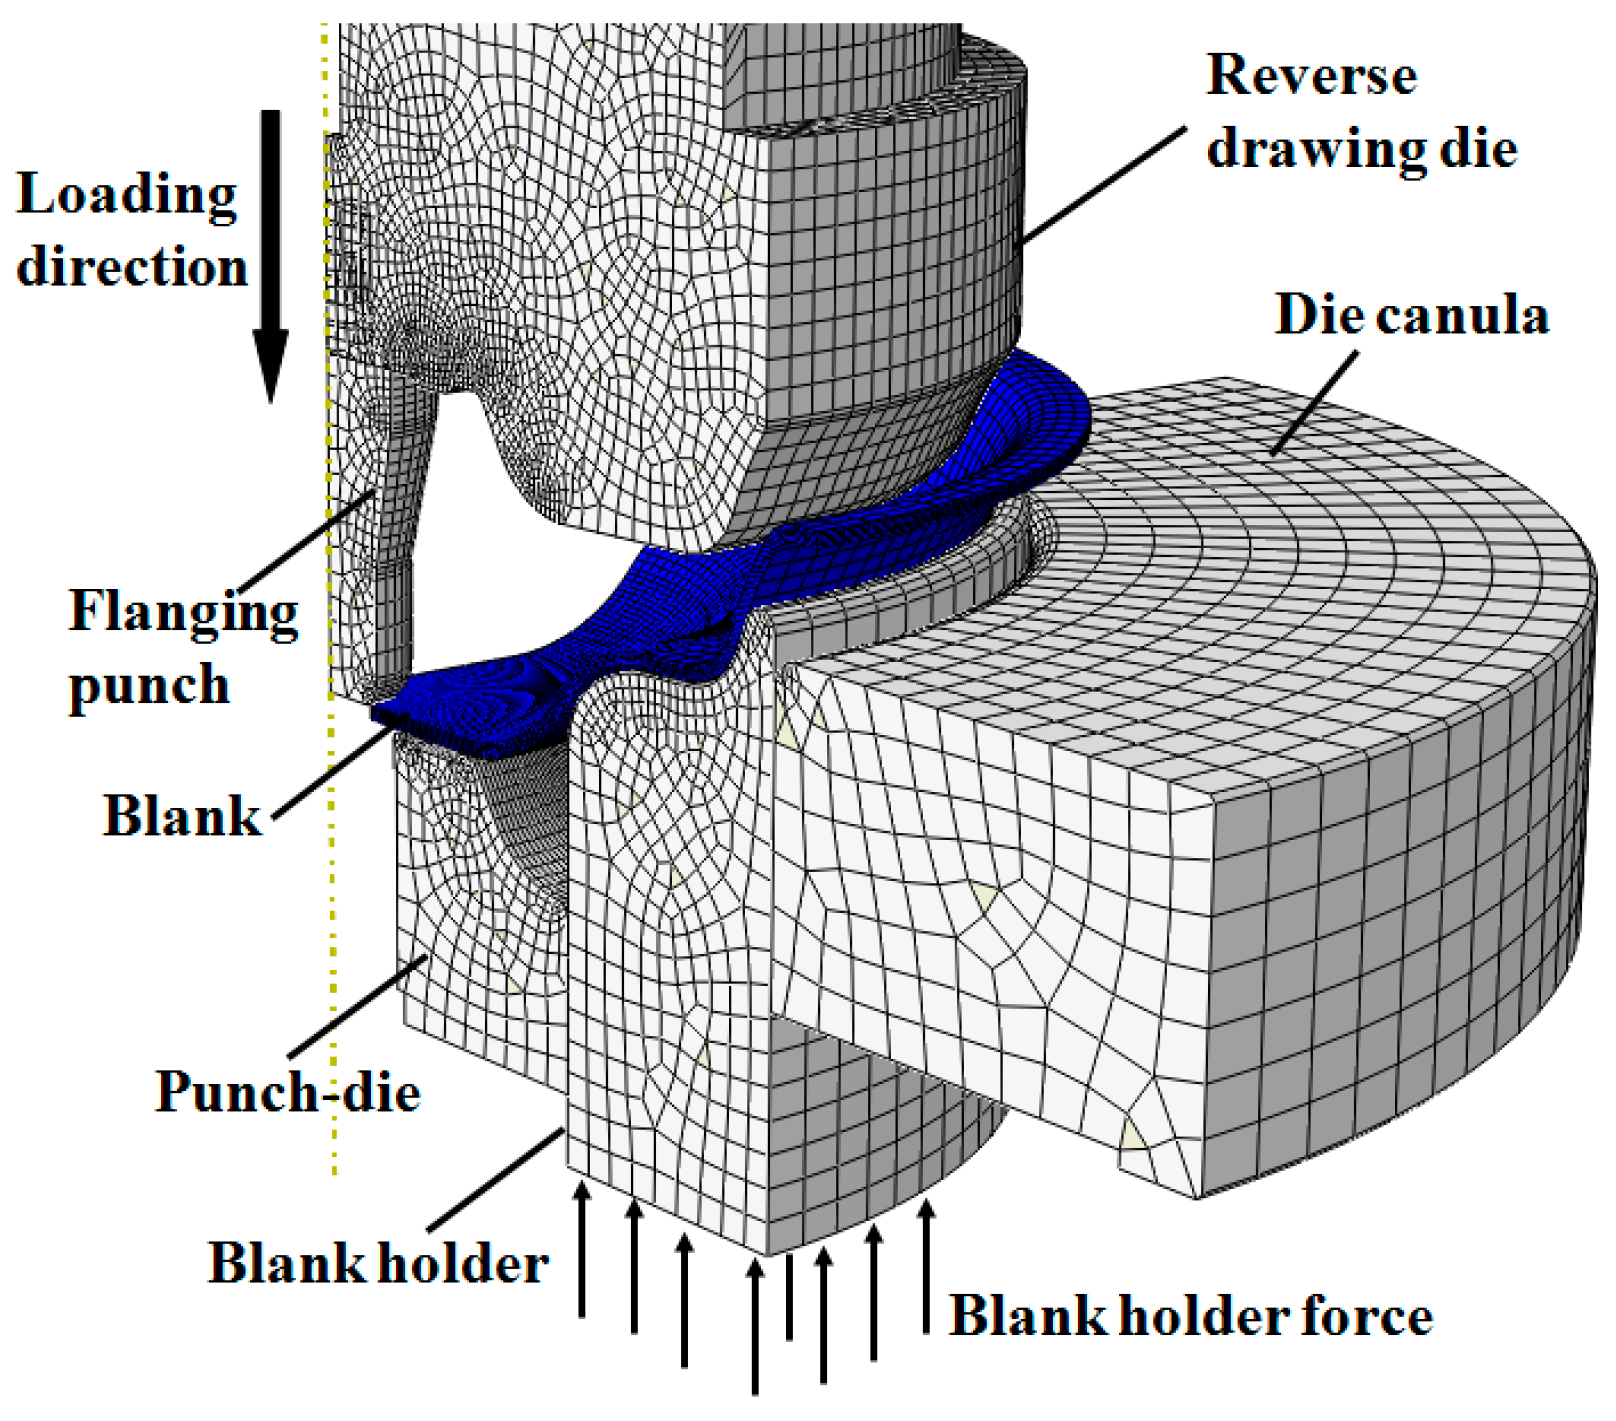
1]. Forming processes of steel spokes include stamping and spinning. The stamping forming process is composed of punching, drawing, reverse drawing, hole-flanging, wind hole punching, trimming and printing [2]. To improve production efficiency, a reverse drawing–flanging combined process for high-strength steel spokes has been employed in factories. However, due to the worse plasticity of high-strength steel and the complex shape of the formed spoke [
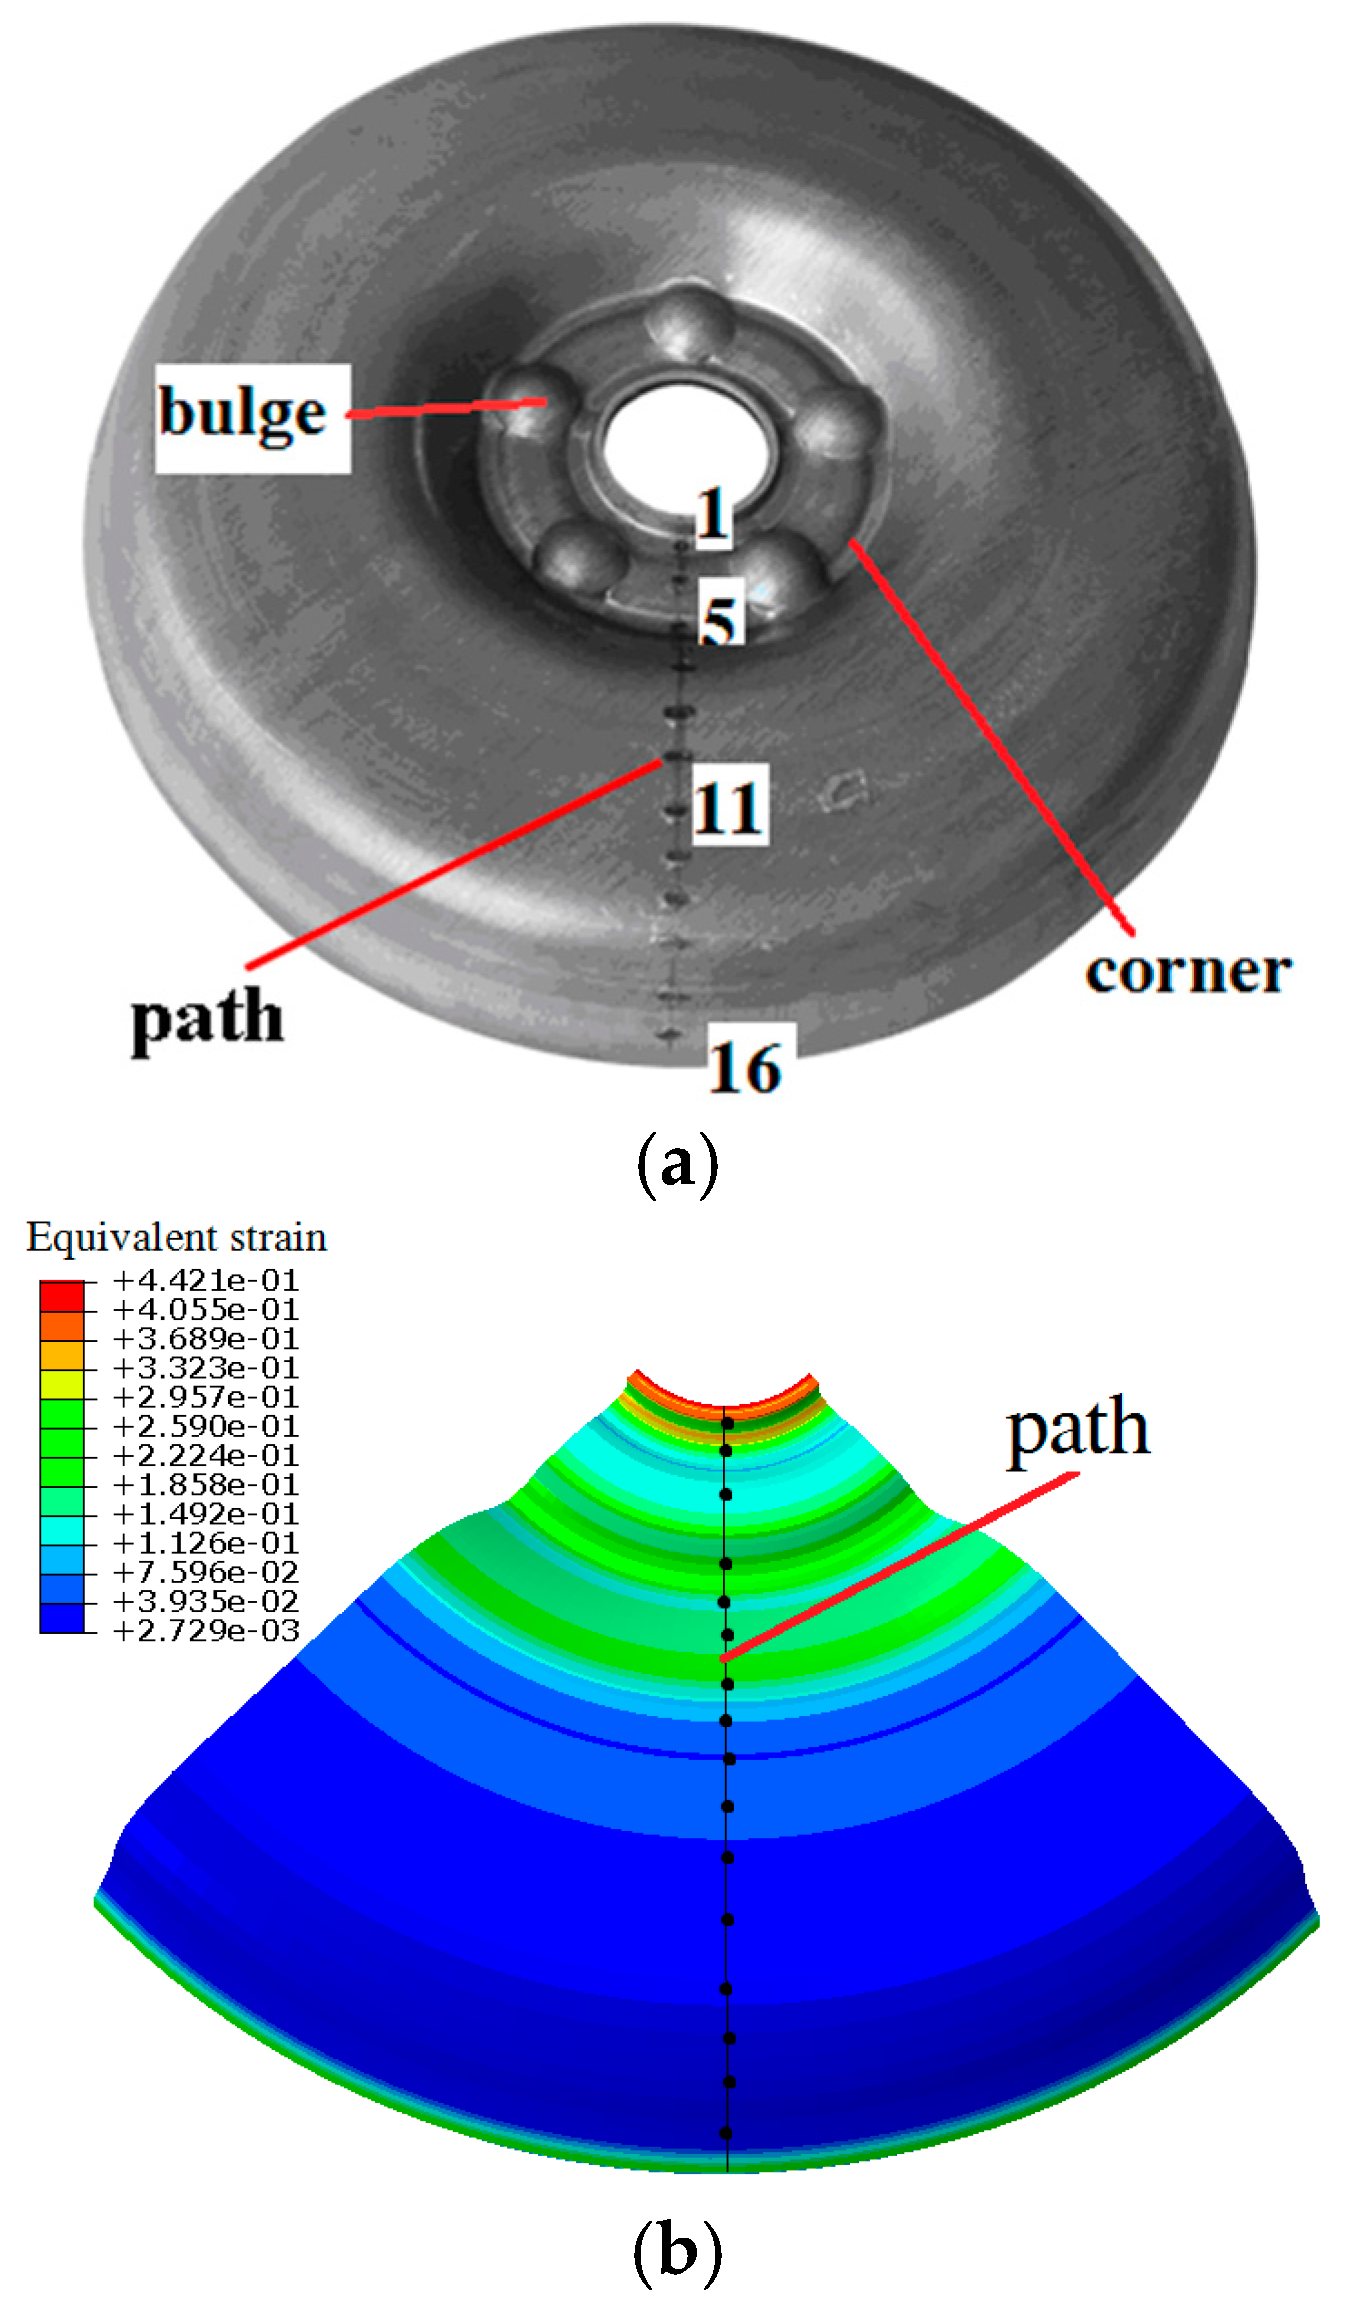
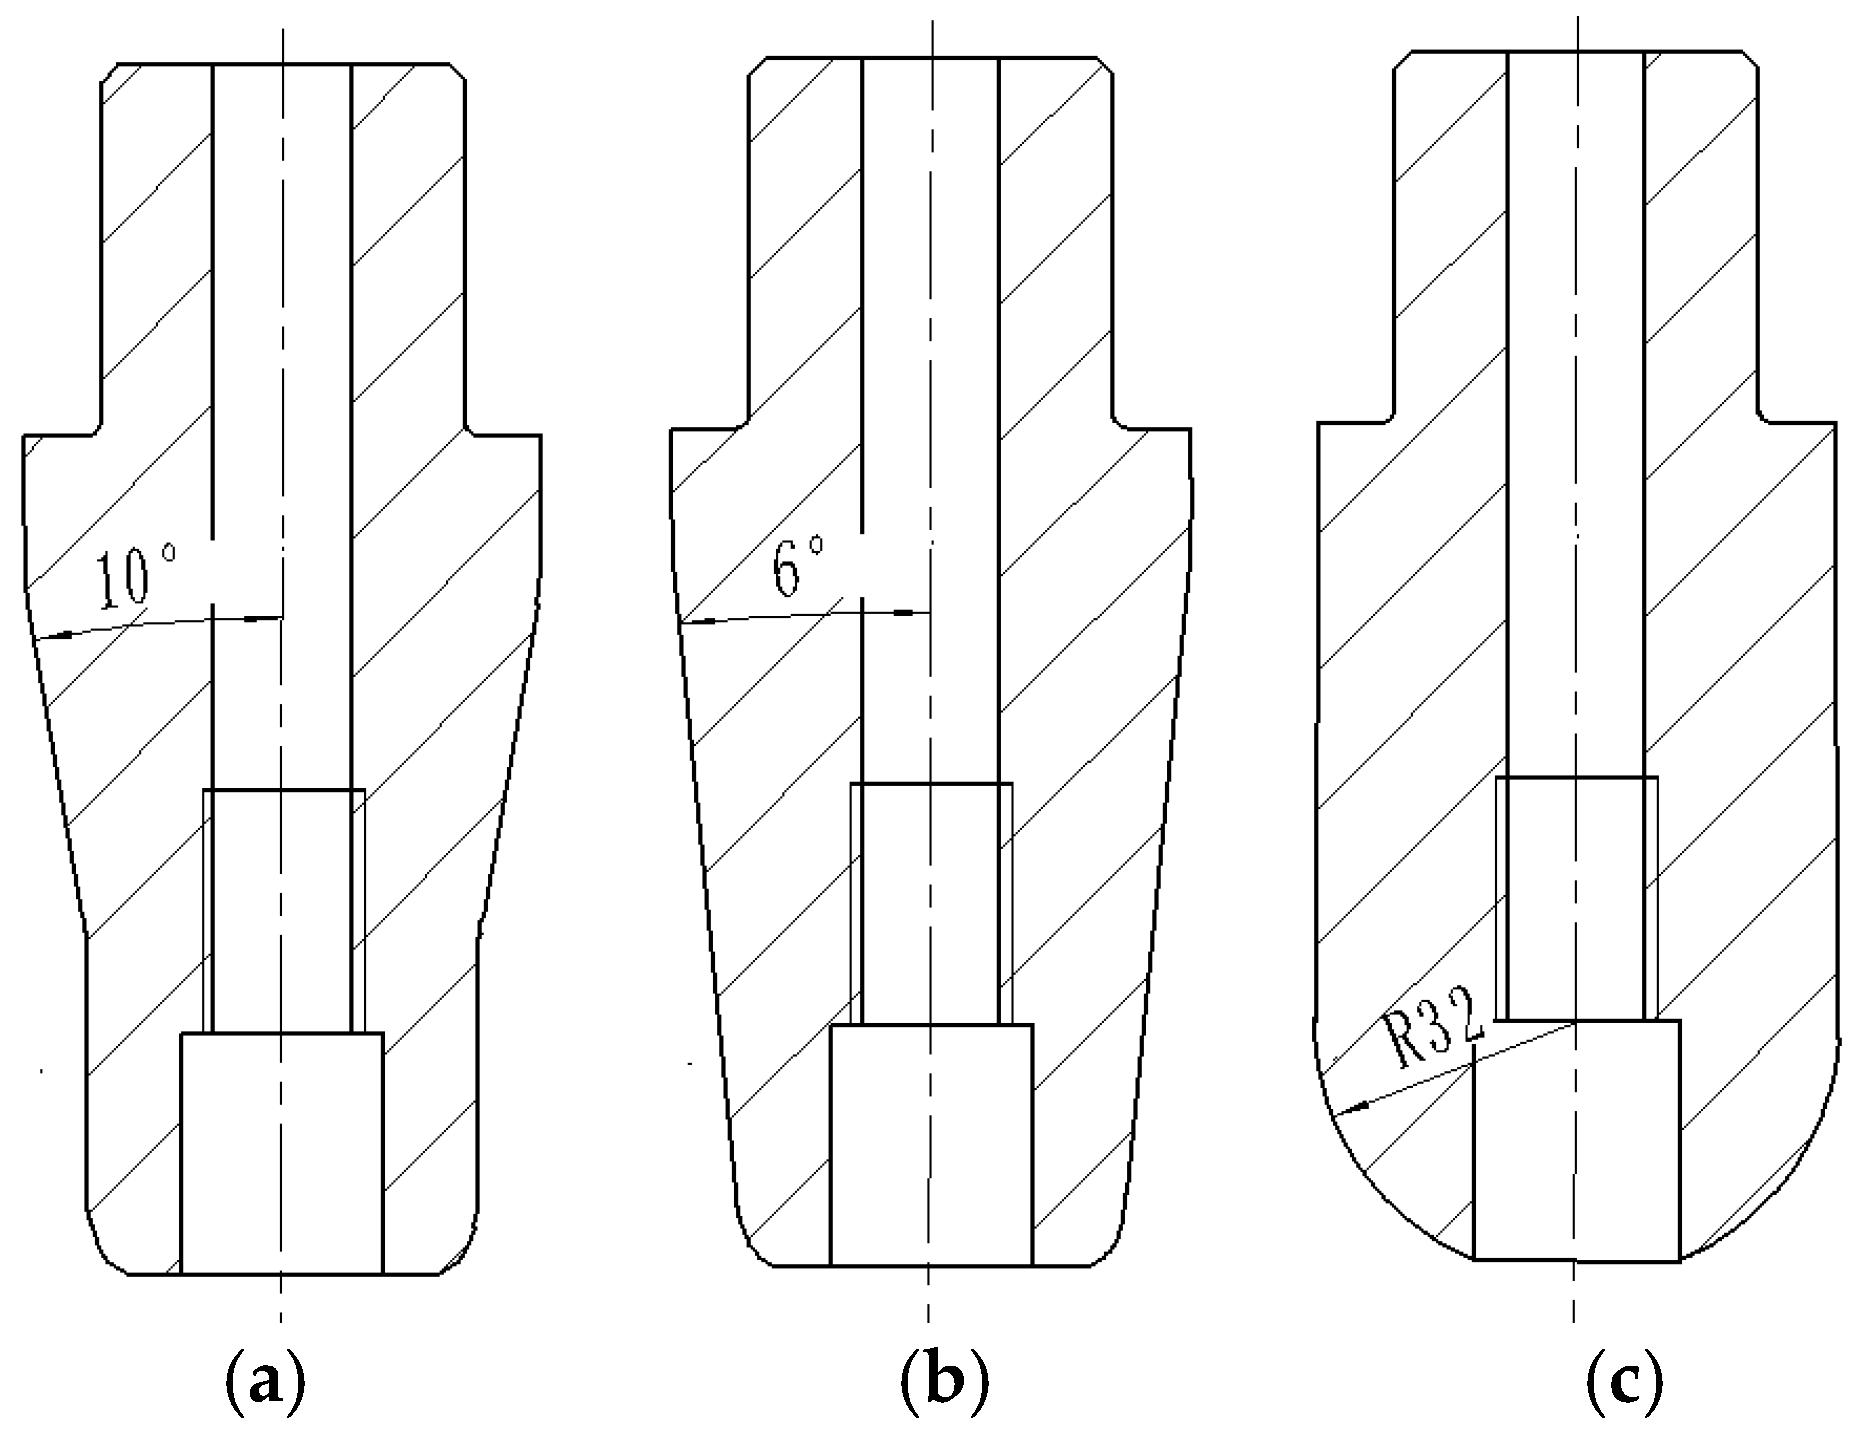
3], many defects may occur during the process, such as uneven wall thickness distribution, excessive thinning in the mounting zone and center hole cracking, which may affect the fatigue performance of the spoke, or require the spoke to be scrapped. Processing parameters such as the friction condition between the die and the blank, the blank holder force, the flanging punch shape and the die fillet radius are the main factors affecting the forming procedure. When the processing parameters are selected inappropriately, the above defects may occur easily. In addition, there also exists a coupling effect between the wall thickness variation and the center hole cracking. B550CL is a new high-strength steel developed by Baosteel Company Co., Ltd. (Shanghai, China), whose chemical composition, content and microstructure are shown in Table 1 and Figure 1. As shown in Figure 1, the microstructure of B550CL is a mixture of ferritic and pearlitic. When B550CL is used in wheel forming, flanging cracking and thickness thinning often appear in the reverse drawing–flanging combined process of B550CL spokes. Therefore, the optimization of processing parameters considering the multiple defects and the interactive effect among them is of great importance to improving the forming quality of B550CL high-strength steel spokes in the reverse drawing–flanging combined process.
The research on the optimization of processing parameters in high-strength steel spoke forming is not extensive, so a study of relevant parameter optimization is used for reference. To get the required wall thickness distribution in the multistage forming of a steel wheel spoke, Abe et al. [4] adopted a rigid plastic finite element model to study the effects of the drawing ratio and punch corner radius on the wall thickness of a formed spoke. Tan et al. [5] developed a two-stage forming process of a tailor blank and studied the effects of processing parameters such as the punch stroke, the punch width and the clearance between the punch and die on the local thickening. Chen et al. [6] simulated the plate part stamping process and optimized processing parameters, such as stamping speed, friction conditions and die fillet radius, with the optimal results proven by the experiment. Based on the experiment and a numerical simulation method, Mori et al. [7] optimized parameters to prevent the shock line in multi-stage sheet metal forming. Chen et al. [8] proposed four kinds of forming schemes for automobile-pieces and gained the corresponding FLD (forming limit diagram). Qiu et al. [9] studied the effects of the die parameters and forming scheme on the forming process to avoid the cracking of spoke center hole flanging. To get the spoke structure with a small stress concentration and light weight, Schafer and Finke [10] redesigned the structure and shape of a spoke, and proved that a simulation combined with the experimental design is a quick and effective method to realize parameter optimization. Among the research, the optimization of parameters is solely carried out through making comparisons among different parameters combinations and does not carry out a comprehensive test. In addition, the aforementioned work only aims at a single forming index and does not consider the effects of multiple defects or the coupling effects among them. To achieve multi target optimization, the grey relational analysis (GRA) method is often adopted. Gao et al. [11] made the optimization of the processing parameters in the thin-walled circular tube bending process by using the grey relational analysis (GRA) method combined with an orthogonal experimental design, and the optimal results were verified by the experiment. Prasad et al. [12] presented the optimization of the pulsed current MPAW (micro plasma arc welded) process by using grey relational analysis, considering multiple quality characteristics to get the proper geometry of weld bead. Xiao et al. [13] established a grey relational analysis model of rotary draw bending of double-ridged rectangular tubes to optimize the clearances and friction coefficients between the tube and the various dies with consideration of interactive effects of different defects. It can be seen that the GRA method shows better performance in dealing with multi-objective decision-making problems [14]. Taking into account the uncertainty problems related to little data and poor information on the research object, the GRA method can gain helpful information from the limited given data and has been applied to solve the problem of multi-target optimization [15]. Thus, the GRA method was chosen to deal with the parameter optimization of the reverse drawing–flanging combined process of high-strength steel spokes.
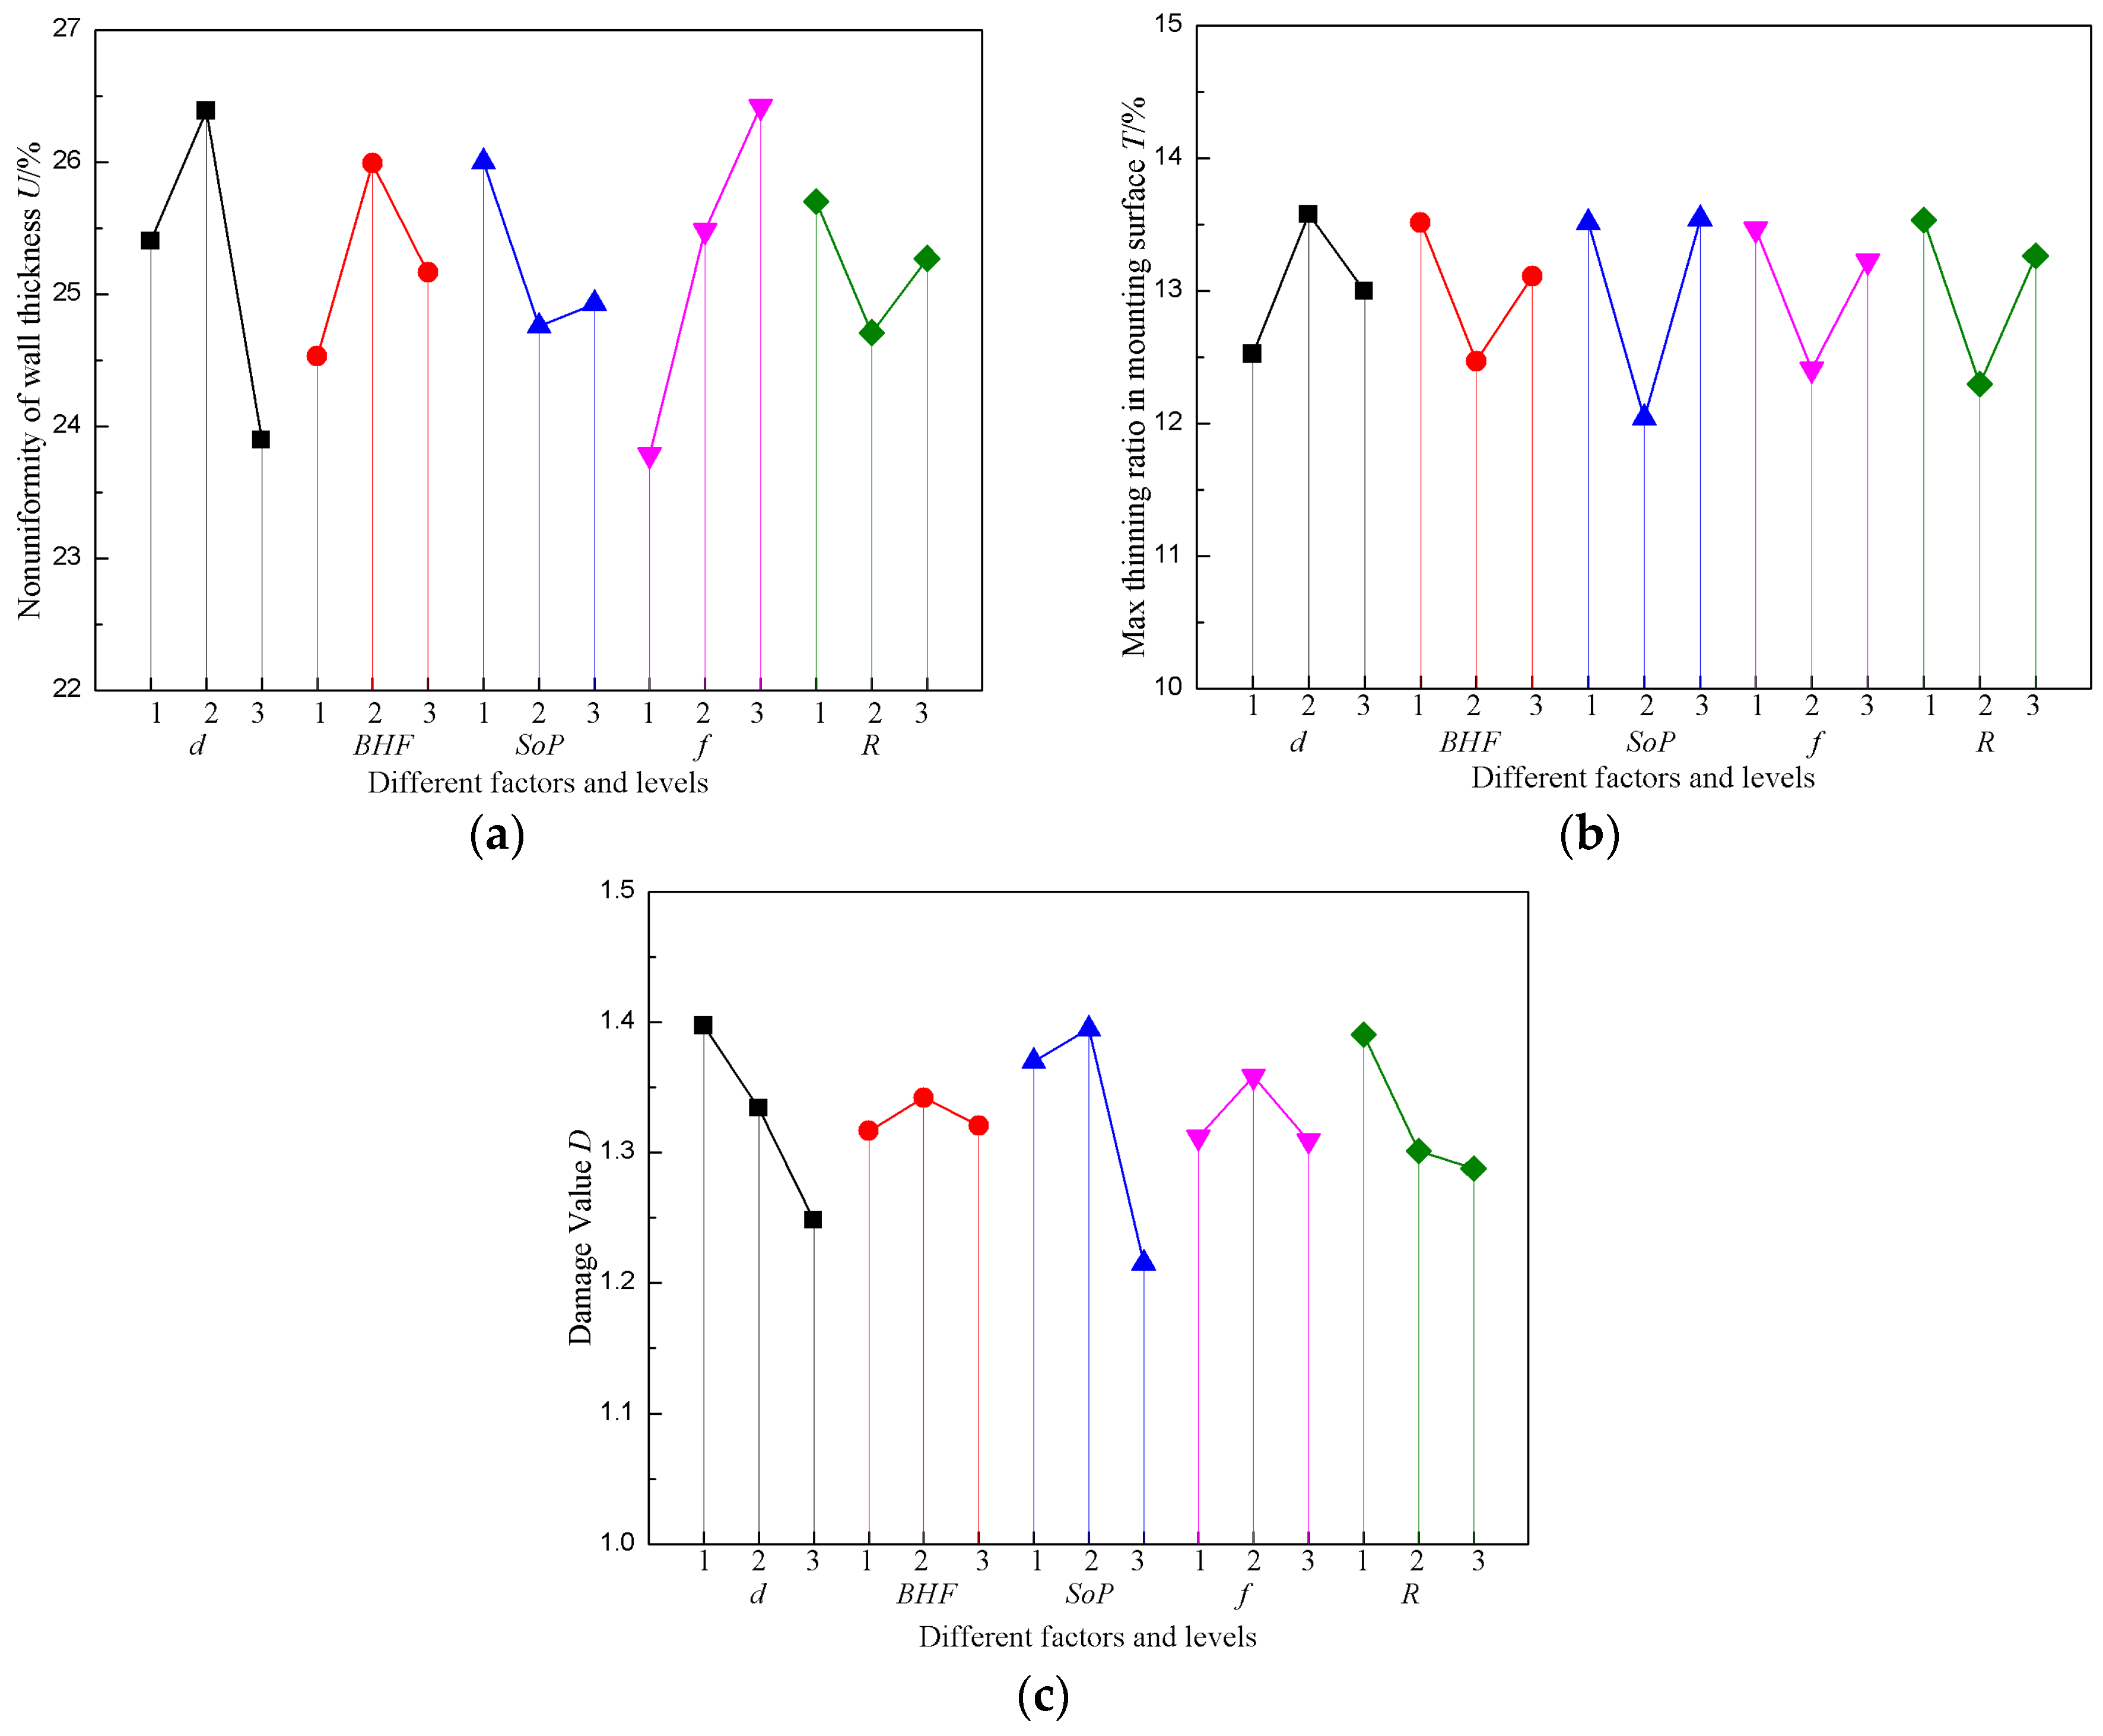
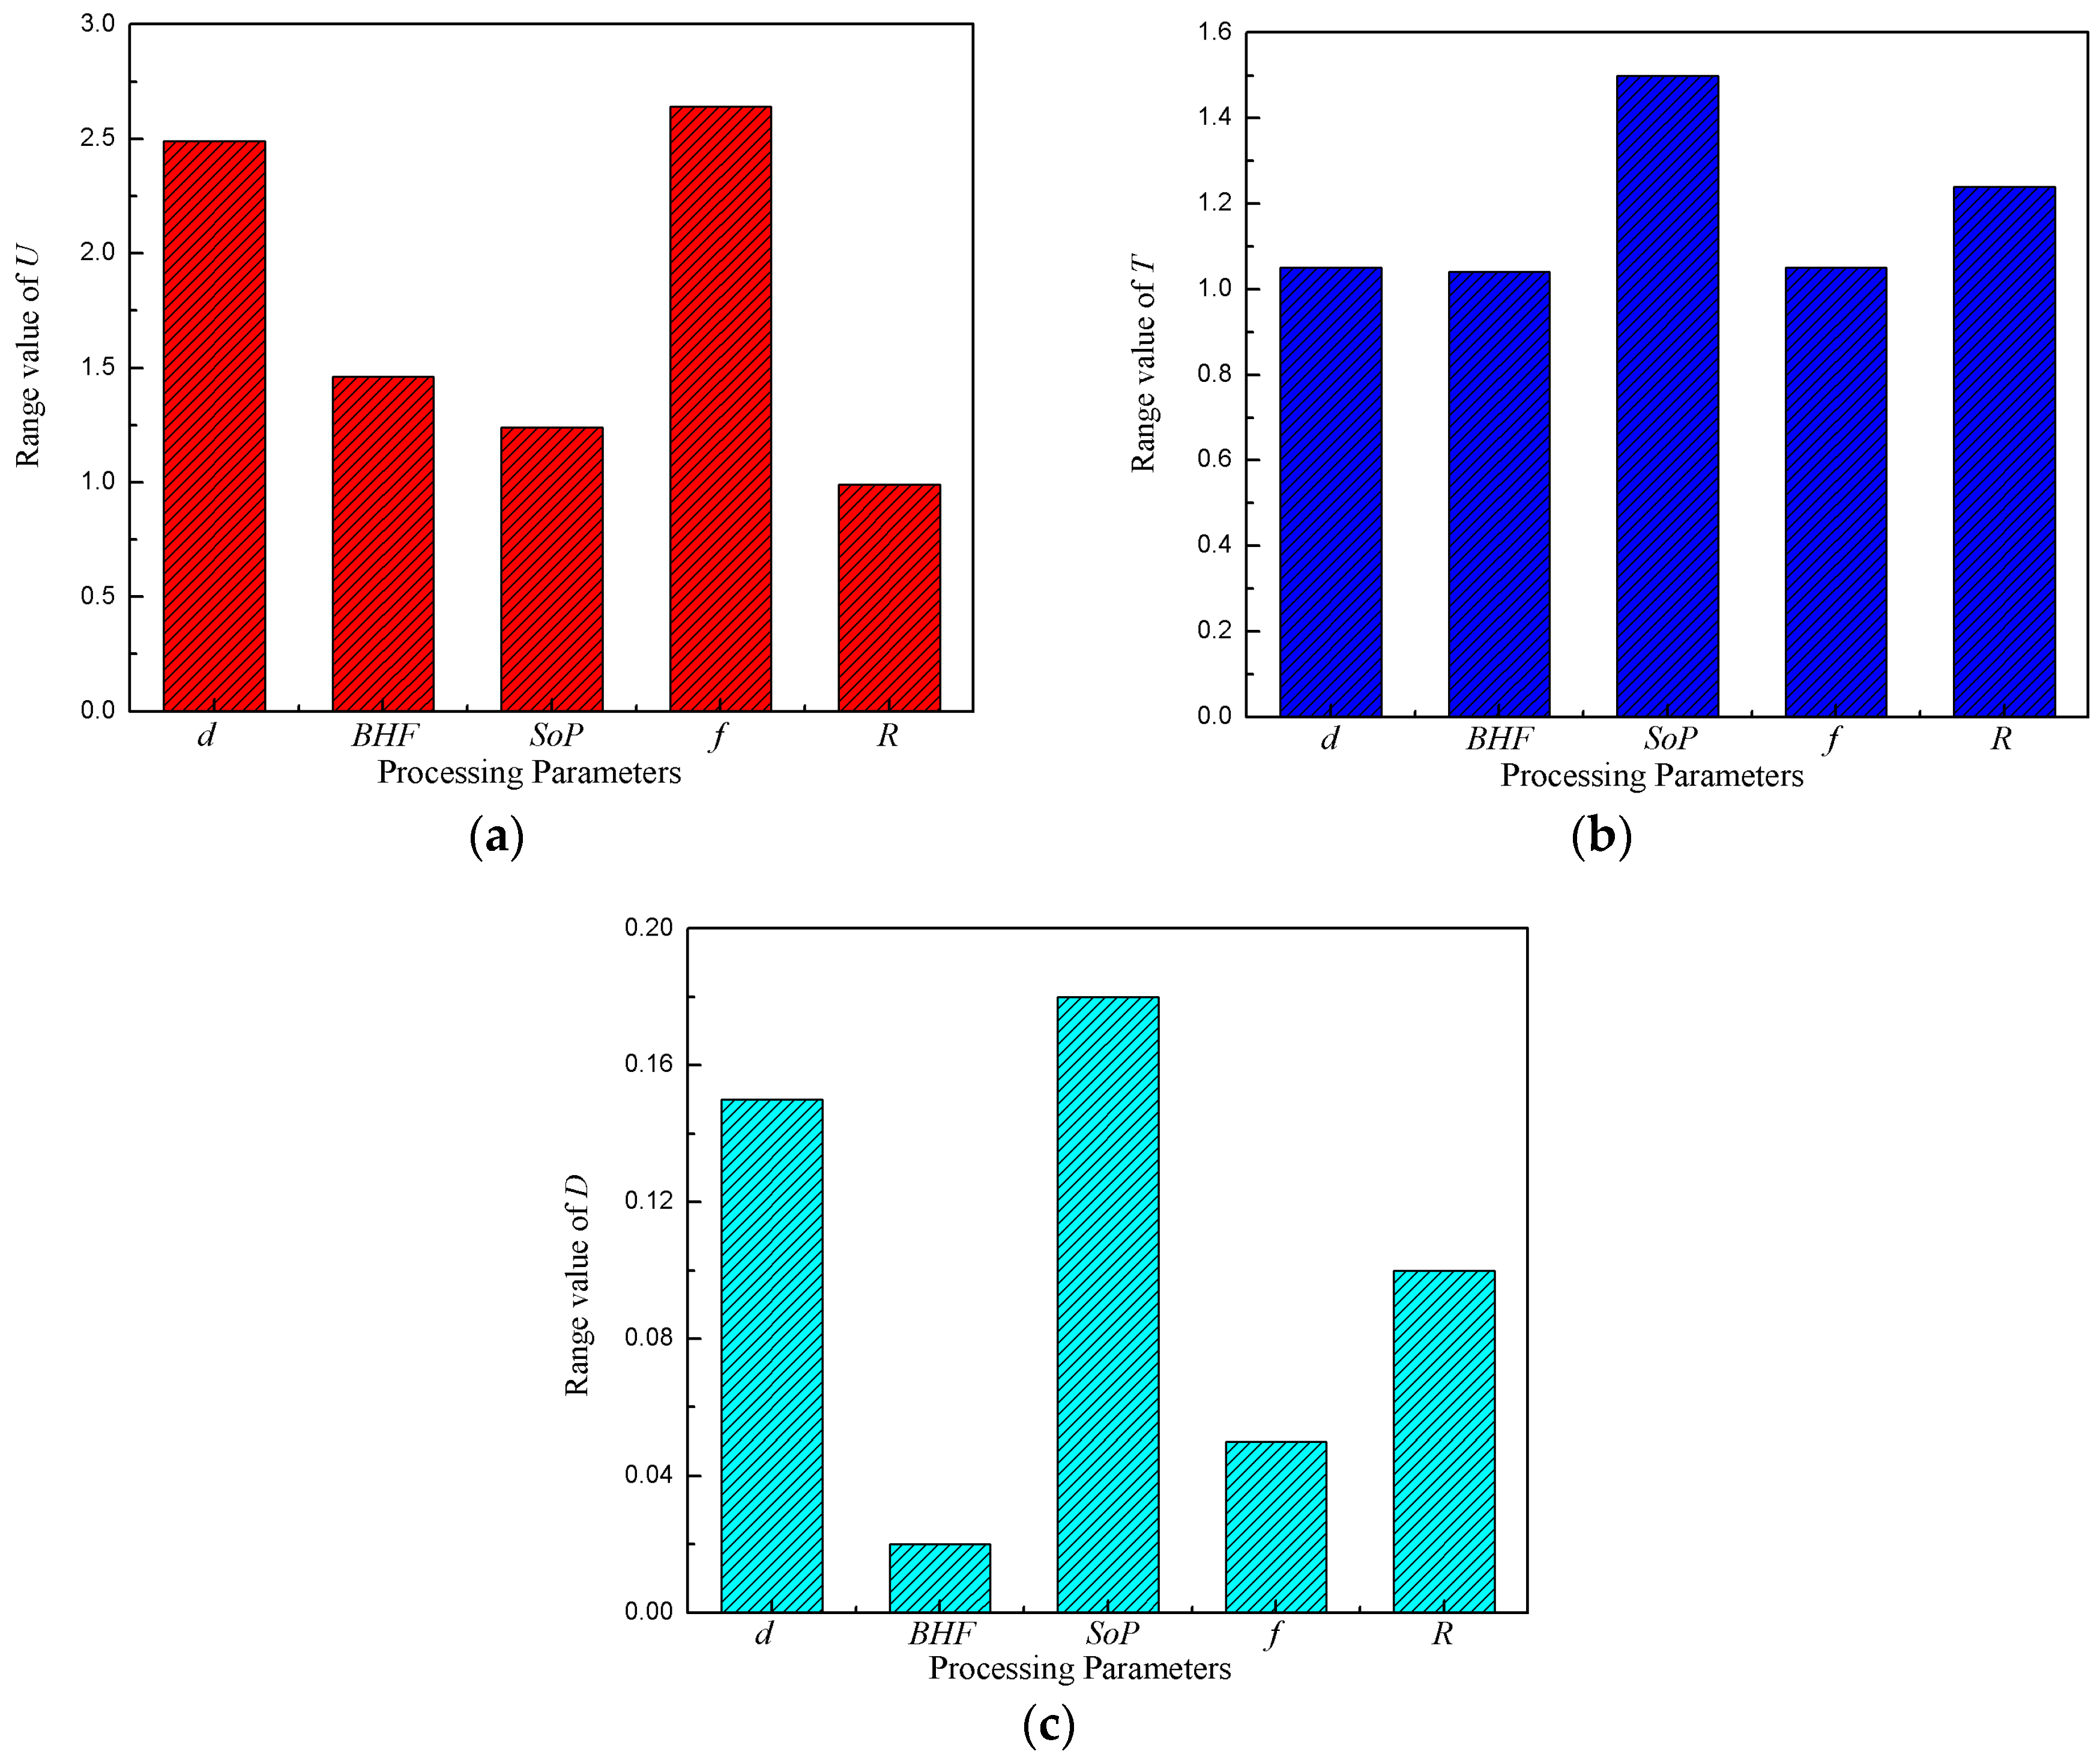
Therefore, in this paper, based on the GRA method combined with an orthogonal experimental design and FE (finite element) simulation, the optimization of parameters for the reverse drawing–flanging combined process of the B550CL steel spoke was performed with consideration of uneven wall thickness distribution, excessive thinning in the mounting zone, center hole cracking and the interactive effects among them, which will supply an important technique guide to the effective quick-die design on the combined forming process.

2. Establishment of the GRA Model for the High-Strength Steel B550CL Spoke Reverse Drawing–Flanging Combined Process

2.1. Description of GRA Method

In the GRA method, the grey relational coefficient represents the similarity degree of a certain index from the objective sequence and the same index from the referential sequence, and a grey relational grade is employed to describe the relational degree of the two sequences. It is easy to see that the larger the grey relational grade, the more similar the objective sequence is to the referential sequence. In this way, the objective sequence which is closest to the referential sequence can be distinguished. The procedures are as follows:
Step 1: Generate the objective sequence of Xi = {Xi (j), j = 1, 2,…, n}, i = 1, 2, …m, where m is the number of the objective sequence, and n is the number of the investigated indexes in a sequence. The objective sequence Xi can be represented by a matrix, which is shown in Equation (1).
X = [ x 1 ( 1 ) x 1 ( 2 ) x 1 ( n ) x 2 ( 1 ) x 2 ( 2 ) x 2 ( n ) x m ( 1 ) x m ( 2 ) x m ( n ) ]
Step 2: Generate the referential sequence of X0 = {X0 (j), j = 1, 2,…, n}; x0(j) is the optimal result in the j row of the matrix X.
Step 3: Compute grey relational coefficient γ0i(j) for each index in the matrix X, as shown in Equation (2).
γ 0 i ( j ) = Δ min + ρ Δ max Δ 0 i ( j ) + ρ Δ max
where Δ min = min i min j Δ 0 i ( j ) , Δ max = max i max j Δ 0 i ( j ) , Δ 0 i ( j ) = | x 0 ( j ) x i ( j ) | and ρ [ 0 , 1 ] which value is often taken as 0.5.
Step 4: Calculate the grey relational grade Γ0i of each objective sequence. The value of Γ0i can be calculated by taking the weighted average of different indexes in an objective sequence, which is shown in Equation (3).
Γ 0 i = 1 n j = 1 n [ ω i ( j ) γ 0 i ( j ) ]
where ωi(j) is the weight coefficient, which value can be determined based on the actual situation.
According to the description above, in this research, each term of the objective sequence Xi refers to the index for the uneven wall thickness distribution, the excessive thinning in the mounting zone and the center hole cracking, respectively. Each term of the referential sequence X0 refers to an index value which indicates a better forming quality. The required data can be obtained from the results of the FE simulation. Furthermore, the interactive effects among different defects can be defined as the “grey part”, which cannot be calculated directly. A GRA model of the spoke reverse drawing–flanging forming process is comprised of the calculation process described above and an FEM model to obtain the data.

2.2. Calculation of the Indexes of Different Forming Defects

The forming quality of the spoke is affected by many factors, i.e., uneven wall thickness distribution, excessive thinning in the mounting zone and center hole cracking. Thus, three indexes are proposed to describe the different defects. To predict the uneven wall thickness distribution, the nonuniformity of wall thickness, U which can be expressed by Equation (4), is proposed. In the wheel assembling process, the wheel is fixed through the screw hole in the mounting zone of the spoke. It is easy to see that the mounting zone usually works under the service condition of grave stress concentration, so excessive thinning in this area needs to be avoided to get better fatigue performance. Therefore, the maximum thinning ratio in the mounting zone, T, is employed to describe the probability of the local thinning, as shown in Equation (5). To predict the flanging crack, a subroutine coupling with a ductile fracture criterion is used, which is qualitatively expressed as the value of damage D (this will be discussed in the later description). The lower the values of the above indexes are, the higher the forming quality is.
U = t max t min t 0 × 100 %
T = t 0 t m t 0 × 100 %
where tmax and tmin are the maximum and minimum wall thickness of the formed spoke, respectively. t0 is the initial wall thickness, which is 4.6 mm, tm is the minimum wall thickness in the mounting zone. The value of tm is different from that of tmin, because the maximum thinning of the high strength steel spoke in the reverse drawing–flanging combined forming process often appears in the area of the center hole, which does not belong to the mounting zone.

2.3. Establishment and Validation of FE Model for the Reverse Drawing–Flanging Combined Forming Process of B550CL High-Strength Steel Spokes

2.3.1. Key Technologies of FE Modeling

Geometry Modeling

The formed part of the high-strength steel spoke is shown in Figure 2a. The blank used in the process is shown in Figure 2b. According to the shapes of the blank and formed part, the combined forming process, which concludes the center hole flanging, the whole part reverse drawing and the local forming in the part of bulge in the mounting zone, can be taken. Thus, a combined mold of the reverse drawing–flanging process is designed, the mold is composed of the flanging punch, punch-die (as the punch of the reverse drawing process and the die of the flanging process), the reverse drawing die, blank holder and die canula. In the forming, the punch-die and die canula are fixed, others are movable. The shape of the flanging punch is a cylinder combined with a conical shape. The flanging punch and the reverse drawing die are assembled as one part. With the synchronous downward motion of the flanging punch and the reverse drawing die, center hole flanging and reverse drawing are carried out simultaneously, while the bulge for manufacturing the bolt hole (Figure 2a) is locally formed at the end of the flanging and reverse drawing. The deformation of the bulge has a slight influence on the center hole cracking. Thus, the forming tool of the bulge is neglected in the modeling. After simplification, the model is considered as axisymmetric. Thus the quarter models of blank and dies are employed to improve calculation efficiency, as shown in Figure 3.

Material Modeling

The material of the spoke is a new high-strength steel, B550CL. To get the material properties, a uniaxial tensile test was conducted by Instron 5582 tensile test machine. Figure 4a shows the shape of the tensile specimen used in the tensile test, and Figure 4b illustrates the fractured specimens. A power exponent hardening model σ = K(ε0 + ε)n is used to express the material hardening behavior; the property parameters of high-strength steel B550CL are shown in Table 2. To predict the probability of center hole cracking, a new ductile fracture criterion is proposed in reference [16], which employed Equation (6). Through developing a subroutine coupling with the ductile fracture criterion and the constructive equation, the damage value of each incremental step can be calculated.
D = 0 ε f ¯ σ max σ ¯ ( 1 + 3 σ m e a n σ ¯ ) d ε ¯
where σmax, σmean and σ ¯ denote the maximum principal stress, the mean stress and the effective stress, respectively, and ε ¯ f and d ε ¯ represent the fracture strain and the effective strain increment, D is the damage value. The larger the value of D, the easier hole cracking occurs.

Other Key Technologies of FE Modeling

In this model, the blank is defined as the deformable body; an eight-node linear brick element with reduced integration (C3D8R) is employed to discretize the blank to improve the computational efficiency and avoid the locking phenomenon. The dies are defined as the rigid body; four-node 3D bilinear rigid quadrilateral discrete rigid elements (R3D4) are selected to describe these discrete rigid dies. As for the contact definition, the “surface-to-surface” contact model is employed to define the contact between blank and dies. For the friction definition, the Coulomb friction model is selected. The load model of “pressure” is applied to the blank holder to express the effect of blank holder force (BHF). Moreover, the velocity boundary condition is used to describe the synchronous motion of the flanging punch and the reverse drawing die. The value of the velocity is set as 17 mm/s, and the stroke is 85 mm.
Synthetically considering the technologies mentioned above, based on the ABAQUS/Explicit FE platform, a 3D FE model of the reverse drawing–flanging combined process for B550CL high-strength steel spokes was established, as shown in Figure 5.

2.3.2. Reliability Validation of FE Model

To verify the reliability of the established model, the experiment and simulation of the reverse drawing–flanging combined process of B550CL high-strength steel spokes was performed under the forming conditions given in Table 3. The spoke-forming experiment was performed in Shanghai BAOSTEEL Wheels Co., Ltd. (Shanghai, China).
Figure 6 shows the experimental and simulative results of the formed spokes. It was found that except for the bulges (as shown in Figure 6a), which were neglected to simplify the model, there are no obvious defects in the two parts. To get a quantitative validation of the reliability of the model, the experimental and simulative results of several characteristic dimensions of the spokes, i.e., flanging height H, spoke height L and spoke diameter Φ, were obtained, as shown in Table 4. It can be seen that the simulative values of the characteristic dimensions and the experimental values are very close to each other, and both are in the range of the technical target value. Furthermore, the actual measured thickness of each node on the selected path (as shown in Figure 6) of the experimental and simulative results are shown in Table 5, and the thickness thinning ratio T* (as shown in Equation (7)) of the corresponding nodes is calculated. The distributions of T* from experimental and simulative parts are illustrated in Figure 7. It can be seen that the tendency of the thickness–thinning ratio distribution of simulation is in good agreement with the experimental results, and the maximum relative error (occurs in node 1) is less than 5%, which provides further validation of the model reliability. Thus, the established FE model can be used to simulate the reverse drawing–flanging combined process of B550CL high-strength steel spokes.
T * = t t 0 t 0 × 100 %
where t is the wall thickness of each node of the simulative or experimental spoke, and t0 is the initial wall thickness.

3. Results and Discussion

3.1. Orthogonal Experimental Design and Intuitive Analysis

3.1.1. Orthogonal Experimental Design

To make a comprehensive test and decrease the test number, an orthogonal experimental design was employed to arrange the simulation schemes. In actual production, blank holder force BHF, friction coefficient f, flanging die corner radius on the punch-die (flanging corner radius for short) R, the diameter of the initial hole d and the shape of the flanging punch SoP are the main parameters which affects the forming quality, so these parameters were chosen to be the test factors. For each parameter, the number of levels was set at three to decrease the test number, as shown in Table 6. For the shape of the flanging punch, three different shapes were used, i.e., a cylinder combined with conical shape, a conical shape and a spherical shape, sectional views of which are illustrated in Figure 8a–c, respectively. According to the number of factors and levels, the L18(37) orthogonal layout was chosen, as shown in Table 7.

3.1.2. Intuitive Analysis

Through FE simulation, the results of different indexes (U, T, D) of the orthogonal test were obtained and are provided in Table 8. To intuitively analyze the effect laws of the chosen factors on the indexes, U, T, D, the average value of each index at a certain level in Table 8 was calculated by Equation (8), thus the K ¯ s of different levels for the chosen parameters were obtained, the results are as shown in Table 9. Through calculating the range value of each index, the significant factors affecting the nonuniformity of wall thickness U, the maximum thinning ratio in mounting zone T and the value of damage D can be distinguished. Thus, the range value Rj (expressed by Equation (9)) is also shown in Table 9. The larger the value, the more significant the factor.
K i ¯ = K 1 + K 2 + + K n n
where K ¯ i is the average value of U, T or D in level i, i = 1, 2, 3, n is the total number of the tests of the same level for a certain factor, Kn is the value of U, T, or D of the same level in the nth test. In this research, there were six tests for each level, so n was taken as six.
R j = K max ¯ K min ¯
where K max ¯ , K min ¯ are the largest, smallest of K ¯ i for a certain process parameter, respectively. Rj denotes the range value of the jth process parameter, j = 1, 2, … 5.
To intuitively analyze the results in Table 9, the curves are plotted and shown in Figure 9 and Figure 10 according to the data in Table 9. Figure 9 shows the influence of different factors on the indexes. From Figure 9a, it can be seen that the nonuniformity of wall thickness U initially increases and then decreases with the increase of d, and BHF initially decreases and then increases with the increase of R, increases with the increase of f, and the conical punch has a lower value of U compared with the other two. From Figure 9b, it can be found that the maximum thinning ratio in the mounting zone T initially increases and then decreases with the increase of d, and while it initially decreases and then increases with the increase of other factors, the conical punch has the lowest value of T. From Figure 9c it can be seen that the damage value D initially increases and then decreases with the increase of BHF, and f decreases with the increase of d and R. The spherical punch has the lowest damage value.
To get the most significant factor, a range value analysis of different indexes was performed and is shown in Figure 10. From Figure 10a, it can be seen that the most significant factor affecting U is f. This is because the friction between blank and tools has an important effect on the material flow, and the material flow will determine the thinning and thickening directly and then influence the value of U. Thus, U is affected greatly by f. When the friction is larger, the material finds it hard to flow, so the thinning area cannot get material from other areas and the thickening area cannot transfer the redundant material to other areas. This situation causes the thinning area to become thinner and the thickening area to become thicker. As a consequence, U increases with the increase of f. It can be seen in Figure 10b that the most significant factor affecting T is SoP. Due to the fact that different punch shapes may change the stamping force, this will cause a different amount of thinning in the corner of the mounting zone. Thus, SoP has a great effect on T. The stamping forces of spherical and combined shapes are all higher than the force of conical shapes, so the conical punch has a lower T. From Figure 10c, it can be seen that the most significant factor affecting D is also SoP. The flanging circumferential stress will change greatly with the change of the shape of the punch. Since the material flowing of the spherical shape is smooth, the circumferential stress is lower, this shape shows better performance in avoiding cracks. Thus SoP greatly affects D. Furthermore, Figure 10 indicates that the factor d has a significant influence on the indexes U and D. A large center hole size will decrease the amount of deformation and weaken the constraint effects on the flow material, so a larger diameter of hole will lower the thickness nonuniformity and the risk of cracking significantly.
It can be seen from the results of the intuitive analysis that all the investigated factors influence the indexes, but their trends are different. Thus, it is necessary to propose an index considering U, T and D synthetically to describe the forming quality of the spoke. The grey relational grade is taken as a synthetic index considering multiple indexes and will be discussed later.

3.2. Optimization of Process Parameters Based on GRA

To take all indexes and the interactive effects among them into account, the grey relational analysis was employed for the parameter optimization of the reverse drawing–flanging combined process. The grey relational grade Γ0i can be taken as a measurement of the forming quality of the spoke. When U, T or D go down, Γ0i becomes larger, which means higher quality. Any defects such as center hole cracking, excessive thinning in the mounting zone and uneven wall thickness distribution may make the spoke scraped or unqualified. Thus, the values of ωU, ωT, ωD are set as 0.33 due to the equal importance of their influence on the forming quality. According to the Equations (1)~(3) in Section 2.1 and the test results in Table 8, the grey relational grade Γ0i for each objective sequence (xi(1), xi(2), xi(3) in Table 8) is calculated and shown in Table 10. Among the 18 tests, test 7 had a better quality, with Γ0i is 0.799.
According to Table 10, the effect of different process parameters on Γ0i is shown in Figure 11. It can be found that Γ0i initially decreases and then increases with the increase of d and BHF, initially increases and then decreases with the increase of R, increases with the increase of f, and the spherical punch has a larger value of Γ0i.
The results of range value Rj of Γ0i under different factors are also shown in Figure 11. The significant factor affecting Γ0i is distinguished by the value of Rj, that is, d (R1 = 0.14). From the above conclusions in Section 3.1.2, although d is not the most significant factor affecting U, T or D, it also plays a secondary role. Thus, Γ0i as a synthetical index is greatly affected by d. When d increases from 42 mm to 44 mm, the risk of cracking goes down, yet the maximum thinning in the mounting zone and uneven wall thickness distribution go up, so the value of Γ0i decreases, which means that the quality of spoke becomes poor. However, when d increases sequentially from 44 mm to 46 mm, the values of U, T and D all go down, so Γ0i gets larger. Moreover, it can be determined from the range value results that SoP (R3 = 0.1) and R (R5 = 0.09) also play an important role in controlling defects. As mentioned above in Section 3.1.2, SoP and R have an important impact on T and D, so SoP and R will obviously affect Γ0i. Since U and D are lower with the sphercial punch, the quality is high for this punch. With the increase of R, U and T initially go down and then go up, while D decreases. Thus, an increase of R causes Γ0i to go up obviously and then to go down slightly.
According to Figure 11, the process parameter combination corresponding to larger Γ0is is level 3 for d, level 1 for BHF, level 3 for SoP, level 1 for f and level 2 for R, so the optimal process parameters for d, BHF, SoP, f and R are 46 mm, 3 MPa, spherical punch, 0.1 and 3.5 mm, respectively.
Since the optimal process parameters considering the indexes of multiple defects and the coupling effects among them are not included in the process parameter combinations in Table 7, a verification needs to be performed to confirm the result. Using the optimal process parameter combination—d = 46 mm, BHF = 3 MPa, SoP = spherical punch, f = 0.1 and R = 3.5 mm—the FE simulation of the combined process was carried out. The simulation result of Γ0i is 0.817, as shown in Table 11. It was found that adopting the optimal process parameter combination, the value of Γ0i (0.817) is larger than any value of Γ0i in Table 10, which indicates that the forming quality using the optimal condition is better than others in Table 10.

4. Conclusions

1. Based on the GRA method combined with the orthogonal experimental design and FE simulation, a GRA model for the reverse drawing–flanging combined process of B550CL spoke was established, the reliability of which was validated by comparing the values of the main characteristic parameters of the simulation with the experimental ones.
2. The most significant factor which affects the uneven wall thickness distribution U is f, and the nonuniformity of wall thickness U increases with the increase of f. The most significant factor which affects the excessive thinning in the mounting zone and center hole cracking is SoP; the conical punch has a lower maximum thinning ratio T; the spherical punch has a lower value of damage D.
3. The most significant factor which affects the grey relational grade Γ0i considering synthetically uneven wall thickness distribution, excessive thinning in the mounting zone and center hole cracking, as well as the interactive effects among them, is the initial hole diameter d. The optimal process parameter combination for d, BHF, SoP, f and R is 46 mm, 3 MPa, spherical punch, 0.1 and 3.5 mm, respectively. With the optimal results, the risk of cracking and thickness changing is reduced and the forming quality of the spoke becomes higher.

Acknowledgments

The authors would like to thank the 111 Talents Project (No. B08040), the Shanghai Meishan steel CO., LTD Technology Department and Shanghai Baosteel Wheel CO., LTD for the support given to this research.

Author Contributions

Under the guidance of Yuli liu, Zhiyuan Jiang established the GRA model of reverse drawing–flanging combined process for high strength steel B550CL spoke with the grey relational analysis and FEM, and Chunmei Liu assisted in analyzing the experimental and simulation results.

Conflicts of Interest

There is no conflicts of interest.

References

  1. Ling, Y.C.; Yan, Z. Study on fatigue property of wheel steel under different processing methods. In Advanced High Strength Steel and Press Hardening; World Scientific: Singapore, 2017; pp. 519–523. [Google Scholar]
  2. Meng, J.; Zhu, P.; Liu, Z.; Ji, Q. Integration of multi-step stamping effects in the bending fatigue analysis of a steel wheel. Fatigue Fract. Eng. Mater. Struct. 2013, 36, 795–808. [Google Scholar] [CrossRef]
  3. Kang, Y.L.; Chen, G.J.; Zhu, G.M.; Song, R.B. Forming technology and application of new generation advanced high strength steel for automobile. Iron Steel. 2010, 45, 1–6. (In Chinese) [Google Scholar]
  4. Abe, Y.; Mori, K.; Ebihara, O. Optimisation of the distribution of wall thickness in the multistage sheet metal forming of wheel disks. J. Mater. Process. Technol. 2002, 125–126, 792–797. [Google Scholar] [CrossRef]
  5. Tan, C.J.; Mori, K.; Abe, Y. Forming of tailor blanks for increase in wall thickness at corner of stamped high strength steel products. J. Mater. Process. Technol. 2008, 202, 443–449. [Google Scholar] [CrossRef]
  6. Chen, L.; Guo, F.L.; Wang, J.; Xue, K.M.; Fei, W.Z. Investigation on stamping process of medium plate part based on numerical simulation. Die Mould Technol. 2012, 5, 6–10. (In Chinese) [Google Scholar]
  7. Mori, K.; Abe, Y.; Ebihara, O. Prevention of shock lines in multi-stage sheet metal forming. Int. J. Mach. Tool. Manu. 2003, 43, 1279–1285. [Google Scholar] [CrossRef]
  8. Chen, W.; Liu, Z.J.; Hou, B.; Du, R.X. Study on multi-stage sheet metal forming for automobile structure-pieces. J. Mater. Process. Technol. 2007, 187–188, 113–117. [Google Scholar] [CrossRef]
  9. Qiu, X.G.; Wu, X.X.; Zeng, Q.J.; Zhong, M. Process improvement of flanging formation for mini car spoke components. Forg. Stamp. Technol. 2011, 36, 39–42. (In Chinese) [Google Scholar]
  10. Schafer, C.; Finke, E. Shape optimisation by design of experiments and finite element methods—An application of steel wheels. Struct. Multidiscip. Optim. 2008, 36, 477–491. [Google Scholar] [CrossRef]
  11. Gao, Z.D.; Tang, C.T.; Jia, M.H. Technological parameters optimization for thin-walled stainless steel tube bending based on grey theory. Trans. Beijing Inst. Technol. 2011, 31, 1032–1035. (In Chinese) [Google Scholar]
  12. Prosad, K.S.; Chalamalasetti, S.R.; Damera, N.R. Application of grey relational analysis for optimizing weld bead geometry parameters of pulsed current micro plasma arc welded inconel 625 sheets. Int. J. Adv. Manuf. Technol. 2015, 78, 625–632. [Google Scholar] [CrossRef]
  13. Xiao, Y.H.; Liu, Y.L.; Yang, H.; Ren, J.H. Optimization of processing parameters in double-ridged rectangular tube rotary draw bending based on grey relational analysis. Int. J. Adv. Manuf. Technol. 2014, 70, 2003–2011. [Google Scholar] [CrossRef]
  14. Deng, J.L. Introduction to grey system. J. Grey Syst. 2005, 1, 1–24. [Google Scholar]
  15. Hsu, Y.T.; Yeh, J.; Chang, H. Grey relational analysis for image compression. J. Grey Syst. 2000, 12, 131–138. [Google Scholar]
  16. Ko, Y.K.; Lee, J.S.; Huh, H.; Kim, H.K.; Park, S.H. Prediction of fracture in hub-hole expanding process using a new ductile fracture criterion. J. Mater. Process. Technol. 2007, 187–188, 358–362. [Google Scholar] [CrossRef]
Figure 1. Microstructure of high strength steel B550CL.
Metals 08 00007 g001
Figure 2. Formed part and blank in a reverse drawing–flanging combined spoke process: (a) Formed part of reverse drawing–flanging combined process; (b) Blank of the reverse drawing–flanging combined process.
Metals 08 00007 g002
Figure 3. Geometry models of blank and dies of the reverse drawing–flanging process of B550CL spoke.
Metals 08 00007 g003
Figure 4. Shape and dimensions of the tensile specimen and the fractured specimens: (a) Shape and dimensions of the tensile specimen; (b) fractured specimens.
Metals 08 00007 g004
Figure 5. 3D FE model of B550CL spoke reverse drawing–flanging combined process.
Metals 08 00007 g005
Figure 6. Experimental and simulative spokes: (a) experimental spoke; (b) simulative spoke.
Metals 08 00007 g006
Figure 7. Distributions of experimental and simulative T* along the selected path.
Metals 08 00007 g007
Figure 8. Illustrations of different shapes of flanging punch: (a) cylinder combined with conical; (b) conical; (c) spherical.
Metals 08 00007 g008
Figure 9. Influences of different factors on U, T, D: (a) on nonuniformity of wall thickness U; (b) on the maximum thinning ratio in mounting zone T; (c) on the value of damage D.
Metals 08 00007 g009
Figure 10. Range value of U, T, D under different factors: (a) range value of U; (b) range value of T; (c) range value of D.
Metals 08 00007 g010
Figure 11. Influence of different factors on the grey relational grade Γ0i.
Metals 08 00007 g011
Table 1. Chemical composition and content of high strength steel B550CL.
Chemical CompositionCSiMnPSNbTiAlt
Content (wt %)0.080.101.40≤0.015≤0.0060.0180.0200.035
Table 2. Property parameters of high-strength steel B550CL.
ParametersValues
Yield stress σ0.2 (MPa)349
Tensile strength σb (MPa)616
Elongation ratio δ (%)27
Elastic modulus E (GPa)172
Poisson ratio υ0.3
Hardening exponent n0.2
Strength coefficient K (MPa)1049
Material constant ε02.3 × 10⁻³
Table 3. Experiment and simulation conditions in reverse drawing–flanging combined process of B550CL spokes.
ParametersSimulativeExperimental
Blank holder force BHF (MPa)55
Friction coefficient f0.15Press oil
Flanging corner radius R (mm)2.52.5
Diameter of initial hole d (mm)4242
Table 4. Simulative and experimental results of the characteristic dimensions.
Characteristic DimensionFlanging Height H/mmSpoke Height L/mmSpoke Diameter Φ/mm
Technical target values11 + 336.7 ± 0.5419.5 ± 1
Simulative values12.4536.98419.86
Experimental values12.4236.80419.54
Table 5. Experimental and simulative results of the thickness of each node on the selected path.
Nodes Number12345678910111213141516
Experimental values t (mm)4.194.444.434.534.224.524.764.634.584.554.524.574.314.574.554.28
Simulative values t (mm)3.964.344.414.364.064.504.814.654.614.624.594.594.394.574.544.33
Table 6. Factors and levels for the orthogonal experimental design.
No.FactorsLevel 1Level 2Level 3
1Diameter of initial hole d (mm)424446
2Blank holder force BHF (MPa)357
3Shape of flanging punch SoPCylinder combined with conicalConicalSpherical
4Friction coefficient f0.10.150.2
5Flanging corner radius R (mm)2.53.54.5
Table 7. L18(37) orthogonal array scheme of the optimization.
Test12345 Test12345
Number Factor dBHFSoPfRNumber Factor dBHFSoPfR
1111111011332
2122221112113
3133331213221
4211221321231
5222331422312
6233111523123
7312331631323
8323111732131
9331221833212
Table 8. Simulative results of the orthogonal test of the combined progress.
IndexU/(xi(1))T/(xi(2))D/(xi(3)) IndexU/(xi(1))T/(xi(2))D/(xi(3))
Test Number Test Number
125.76114.2171.5151024.41313.3911.222
226.06511.3911.4521125.08714.0431.406
326.26113.1301.2081224.82613.3041.580
425.43513.8911.3631327.19613.5871.437
528.41313.3481.4021424.87013.9351.217
624.93513.6301.2351527.47813.0651.349
720.19612.1961.2101624.19613.8041.151
824.89113.3481.2551726.60913.1091.320
925.63012.7611.2651821.84812.7611.287
Table 9. Results of the intuitive analysis of the orthogonal experimental design of the combined process.
NumberFactorsUTD
K ¯ 1 K ¯ 2 K ¯ 3 R j K ¯ 1 K ¯ 2 K ¯ 3 R j K ¯ 1 K ¯ 2 K ¯ 3 R j
1d25.4026.3923.892.4912.5213.5813.001.051.401.331.250.15
2BHF24.5325.9925.161.4613.5112.4713.111.041.321.341.320.02
3SoP26.0024.7624.931.2413.5112.0413.541.501.371.391.210.18
4f23.7825.4826.422.6413.4612.4113.221.051.311.361.310.05
5Rs25.7024.7125.270.9913.5312.3013.261.241.391.301.290.10
Table 10. The grey relational grade Γ0i for each objective sequence (xi(1), xi(2), xi(3)) in Table 8.
Test Number123456789
Γ0i0.3730.6030.5420.430.40.5180.7990.5150.525
Test number101112131415161718
Γ0i0.5470.4160.4050.3930.5250.4420.6190.4620.605
Table 11. Calculation results of different indexes using the optimal parameters.
IndexesU/(xi(1))T/(xi(2))D/(xi(3))Γ0i
Value20.31812.1781.1850.817

