Thermodynamic Alloy Design of High Strength and Toughness in 300 mm Thick Pressure Vessel Wall of 1.25Cr-0.5Mo Steel

1
Department of Materials Science and Engineering, Pusan National University, San 30 Jangjeon-dong, Geumjeong-gu, Busan 609-735, Korea
2
Corporate R&D Institute, Doosan Heavy Industries & Construction, 555 Gwigok-Dong, Changwon, Gyeongnam 641-792, Korea
3
Industrial Technology Support Division, Korea Institute of Materials Science, 797 Changwondaero, Changwon 641-831, Korea
*
Author to whom correspondence should be addressed.
Metals 2018, 8(1), 70; https://doi.org/10.3390/met8010070
Submission received: 20 October 2017
/
Revised: 2 January 2018
/
Accepted: 2 January 2018
/
Published: 19 January 2018
(This article belongs to the Special Issue Microstructure based Modeling of Metallic Materials)
Abstract
:In the 21st century, there is an increasing need for high-capacity, high-efficiency, and environmentally friendly power generation systems. The environmentally friendly integrated gasification combined-cycle (IGCC) technology has received particular attention. IGCC pressure vessels require a high-temperature strength and creep strength exceeding those of existing pressure vessels because the operating temperature of the reactor is increased for improved capacity and efficiency. Therefore, high-pressure vessels with thicker walls than those in existing pressure vessels (≤200 mm) must be designed. The primary focus of this research is the development of an IGCC pressure vessel with a fully bainitic structure in the middle portion of the 300 mm thick Cr-Mo steel walls. For this purpose, the effects of the alloy content and cooling rates on the ferrite precipitation and phase transformation behaviors were investigated using JMatPro modeling and thermodynamic calculation; the results were then optimized. Candidate alloys from the simulated results were tested experimentally.
1. Introduction
In power generation of the 21st century, high-capacity, high-efficiency, and environmentally friendly power generation systems are in demand. The integrated gasification combined cycle (IGCC) plant construction technology, used to construct environmentally friendly power generation systems, is gaining popularity [1,2,3,4]. IGCC plants require high-pressure and -temperature operation in order to increase capacity and improve efficiency [5]. Therefore, pressure reactor vessels require high tensile strengths (>530 MPa), high-temperature strengths (>240 MPa at 380 °C), impact energy absorption (55 J at −20 °C), and creep strengths. During the production of the nozzle joint, used to send steam to each pipe from the pressure container, a welding process is required [6]. The welded area is inevitably subjected to residual stresses from welding and is modified. Cracking during welding due to the shape of the nozzle has been reported frequently [7,8,9]. Manufacturers therefore use thicker materials in order to produce the nozzle by cutting, without welding. In such conditions, it is more advantageous to produce pressure containers that are thicker than conventional pressure containers (≤200 mm) instead of changing materials. IGCC pressure-container temperatures are approximately 300–600 °C, and 1.25Cr-0.5Mo bainitic steel is typically used; this has a high tensile strength at high temperatures and pressures [10,11].
Quenching and tempering processes are used to produce the bainitic structure in 1.25Cr-0.5Mo steel. However, pressure containers produced with thick materials subjected to water cooling processes after heating for several hours at the austenite temperature (900–1000 °C) develop external martensite or martensite + bainite structures under the rapid surface cooling speed but also develop internal ferrite because of the slow cooling speed in the centers of the vessel walls [12]. In Cr-Mo steel, the formation of ferrite reduces both the tensile strength and toughness. To resolve this issue, physical control of the cooling speed at the center is necessary.
As an alternative to physically controlling the cooling speed, we propose a chemical alloy design route that prevents ferrite formation [13,14]. The factor with the most impact on the mechanical characteristics is the microstructure, which is determined by the thermodynamic stability. The evaluation and improvement of mechanical characteristics are closely related to microstructural adjustment, particularly the thermodynamic stability analysis, evaluation, and adjustment capabilities of each structure. In order to adjust the structures of metals, various alloys in various amounts are added. The alloy design process has advanced on the basis of empirical data obtained through trial and error. However, because of unpredicted variable errors, time consumption, and an increased cost related to trial and error, more efficient alloy design methods are in development [15,16]. In order to prevent the center of the pressure vessel wall from decreasing in strength, we aim to increase the tensile strength by improving the hardenability and to reduce the austenite grain size through thermodynamic methods [17,18]. We hope to prove the possibility of designing alloys thermodynamically in this way.
2. Experimental Procedure
In this study, the alloy design was performed by thermodynamic simulation programs (JMatPro5.1 and Thermo-Calc. TCW5. database: TCFE6, Stockholm, Sweden, where Mats Hillert was a professor) and the candidate alloys designed by the simulation were manufactured [19,20]. The candidate alloys were subjected to tensile testing, high-temperature strength and impact testing, and measurements of the continuous cooling transformation (CCT) curve by a dilatometer test for comparison with the mechanical properties of existing alloys. The dilatometer specimen size was round bar with 3 pi, and the length was 10 mm. Thermodynamic simulation by JMatPro was used to design alloys with good hardenability, while strengthening by methods including grain refinement and hardening were simulated by Thermo-Calc. In the alloy design model, the most basic alloying elements were selected, and certain amounts of alloying elements were then added to the basic alloy. The effects of the added alloying elements on the ferrite CCT curves were evaluated. The element addition range was selected within the range of chemical requirements of ASTM F11. In addition, Nb and Ti microalloyed steel were selected for the study on whether hardness and toughness were improved when the content of certain elements was added [21,22]. The basic alloys and element addition ranges are shown in Table 1. In the strengthening design, the behavior of carbide precipitates to refine the austenite grain size was determined by Thermo-Calc. We selected the final alloy expected to improve the mechanical properties on the basis of the thermodynamic simulation; 100 kg of this alloy was cast experimentally through vacuum induction melting. The chemical composition of the candidate alloy is presented in Table 2. The cast alloy was heat-treated (normalized, quenched, and tempered) at the true processing temperature and characterized via room-temperature tensile strength testing, high-temperature tensile strength testing at 380 °C, and impact testing at −20 °C. In order to confirm the existence of the ferrite phase in the center of the specimen, the normalized specimen was tested to confirm the CCT curve using a dilatometer. Dilatometer tests were performed under a heating rate of 2 °C, a holding temperature of 930 °C, and a holding time of 10 min. The specimen was quenched at the rate of 10–300 °C until reaching room temperature. The microstructures were examined using optical microscopy (OM, Olympus BX-51M, Tokyo, Japan) and the austenite grain size was measured using ASTM standard E112. The precipitates were analyzed by transmission electron microscopy (TEM, JEOL JEM-2010, Tokyo, Japan) after performing carbon extraction replication.
3. Results and Discussion
3.1. Problems from the External and Central Cooling Rates
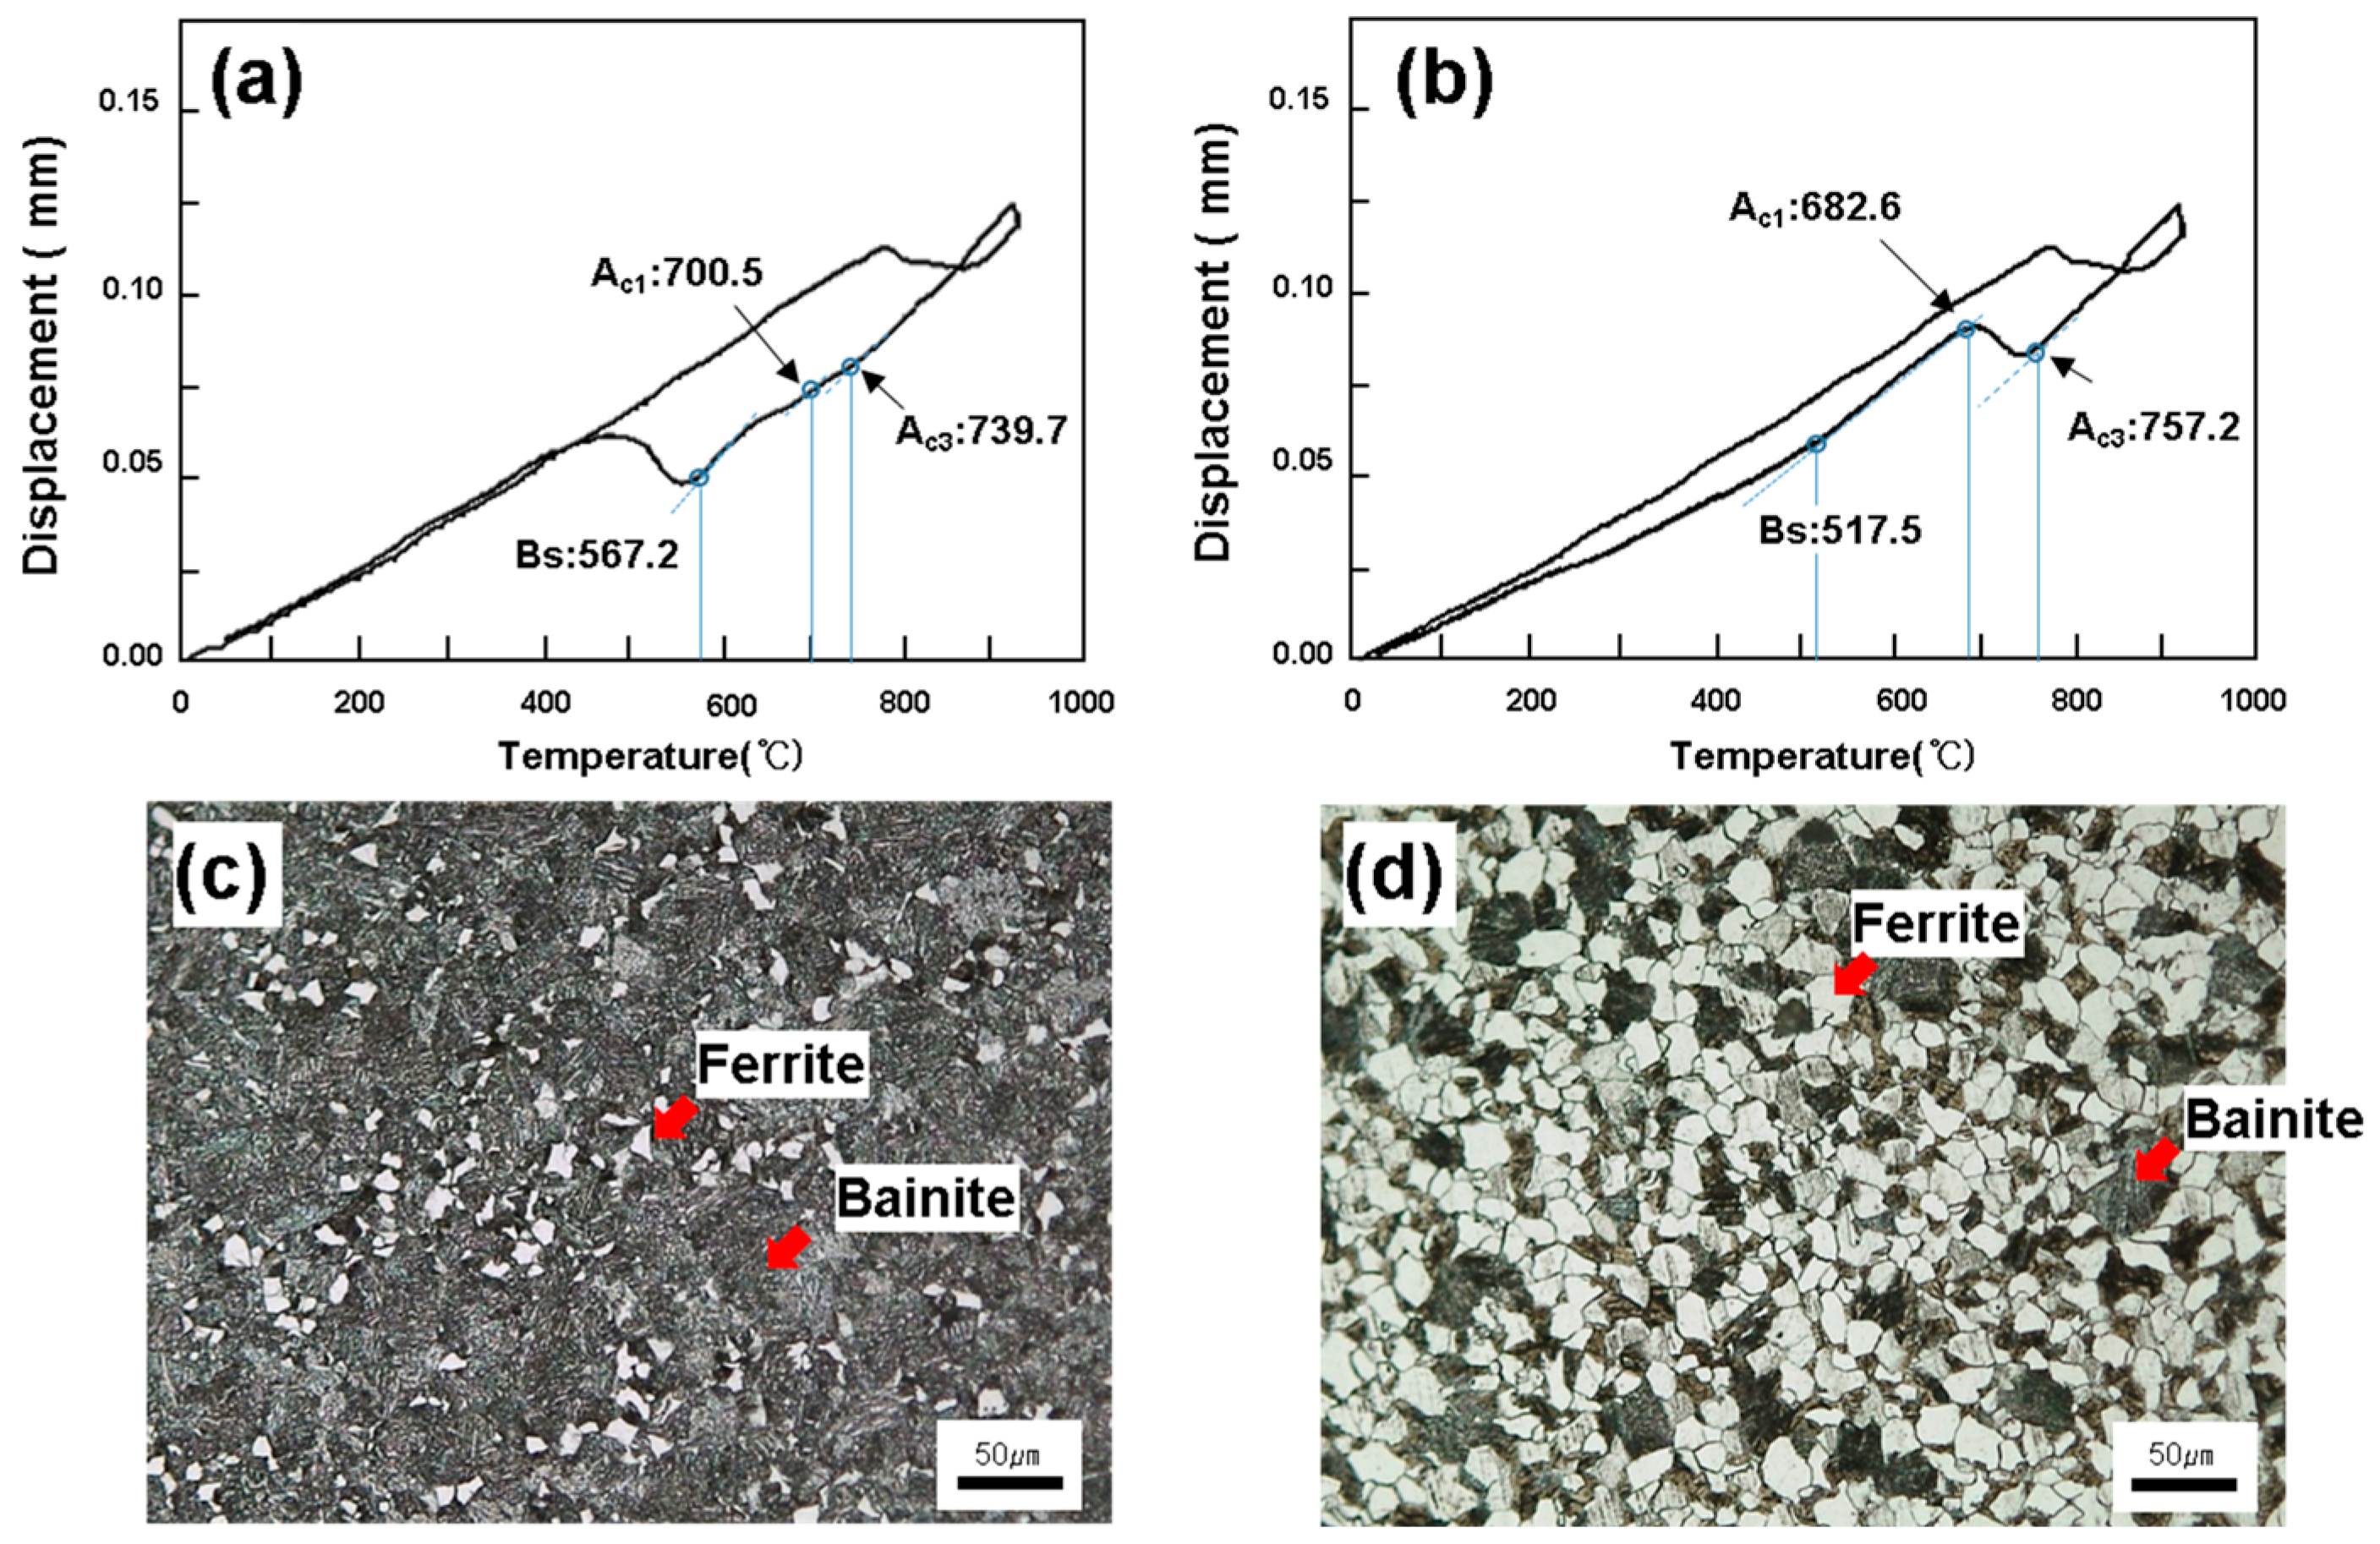
Figure 1 shows the dilatometer curve and microstructure obtained when the alloy was cooled at 200 °C/min on the surface and at 30 °C/min inside. The external and internal cooling rates of 200 and 30 °C/min were checked with a thermocouple during the water-cooling of the 350 mm thick steel; the results in [23] are similar. When examining the dilatometer at the external cooling speed of 200 °C/min in Figure 1a, ferrite was observed to form at Ac3 (739.7 °C) and ceased formation at Ac1 (700.5 °C). Bainite was produced at Bs (567.2 °C). The optical micrograph in Figure 1c shows the presence of ferrite generated during the polygonal phase, as well as bainite. The dilatometer results obtained at the central cooling speed of 20 °C/min, shown in Figure 1b, indicate that ferrite was produced at Ac3 (757.2 °C) and at Ac1 (682.6 °C), while bainite was produced at Bs (517.5 °C). The bainite formation temperature was low, despite the cooling rate being lower than that at the surface, because increases in the volume fraction of ferrite caused the undissolved C in the ferrite (solubility at 723 °C: 0.02%C) to re-dissolve in the matrix, thereby increasing the matrix C content [24]. The matrix lowered the bainite formation temperature by the influence of C. The optical micrograph in Figure 1d shows ferrite generated during the polygonal phase, as well as bainite. The external region maintained the Ac3–Ac1 temperature range (∆T = 50.2 °C) for 15.6 s, while the central region maintained the Ac3–Ac1 region (ΔT = 74.3 °C) for 178.32 s. The amount of ferrite was significantly greater in the central area than in the external area because the steel remained in the A1 temperature range for much longer. In comparing the tensile strengths of the exterior and central areas, the amount of ferrite was expected to be substantially more in the central area than in the external area.
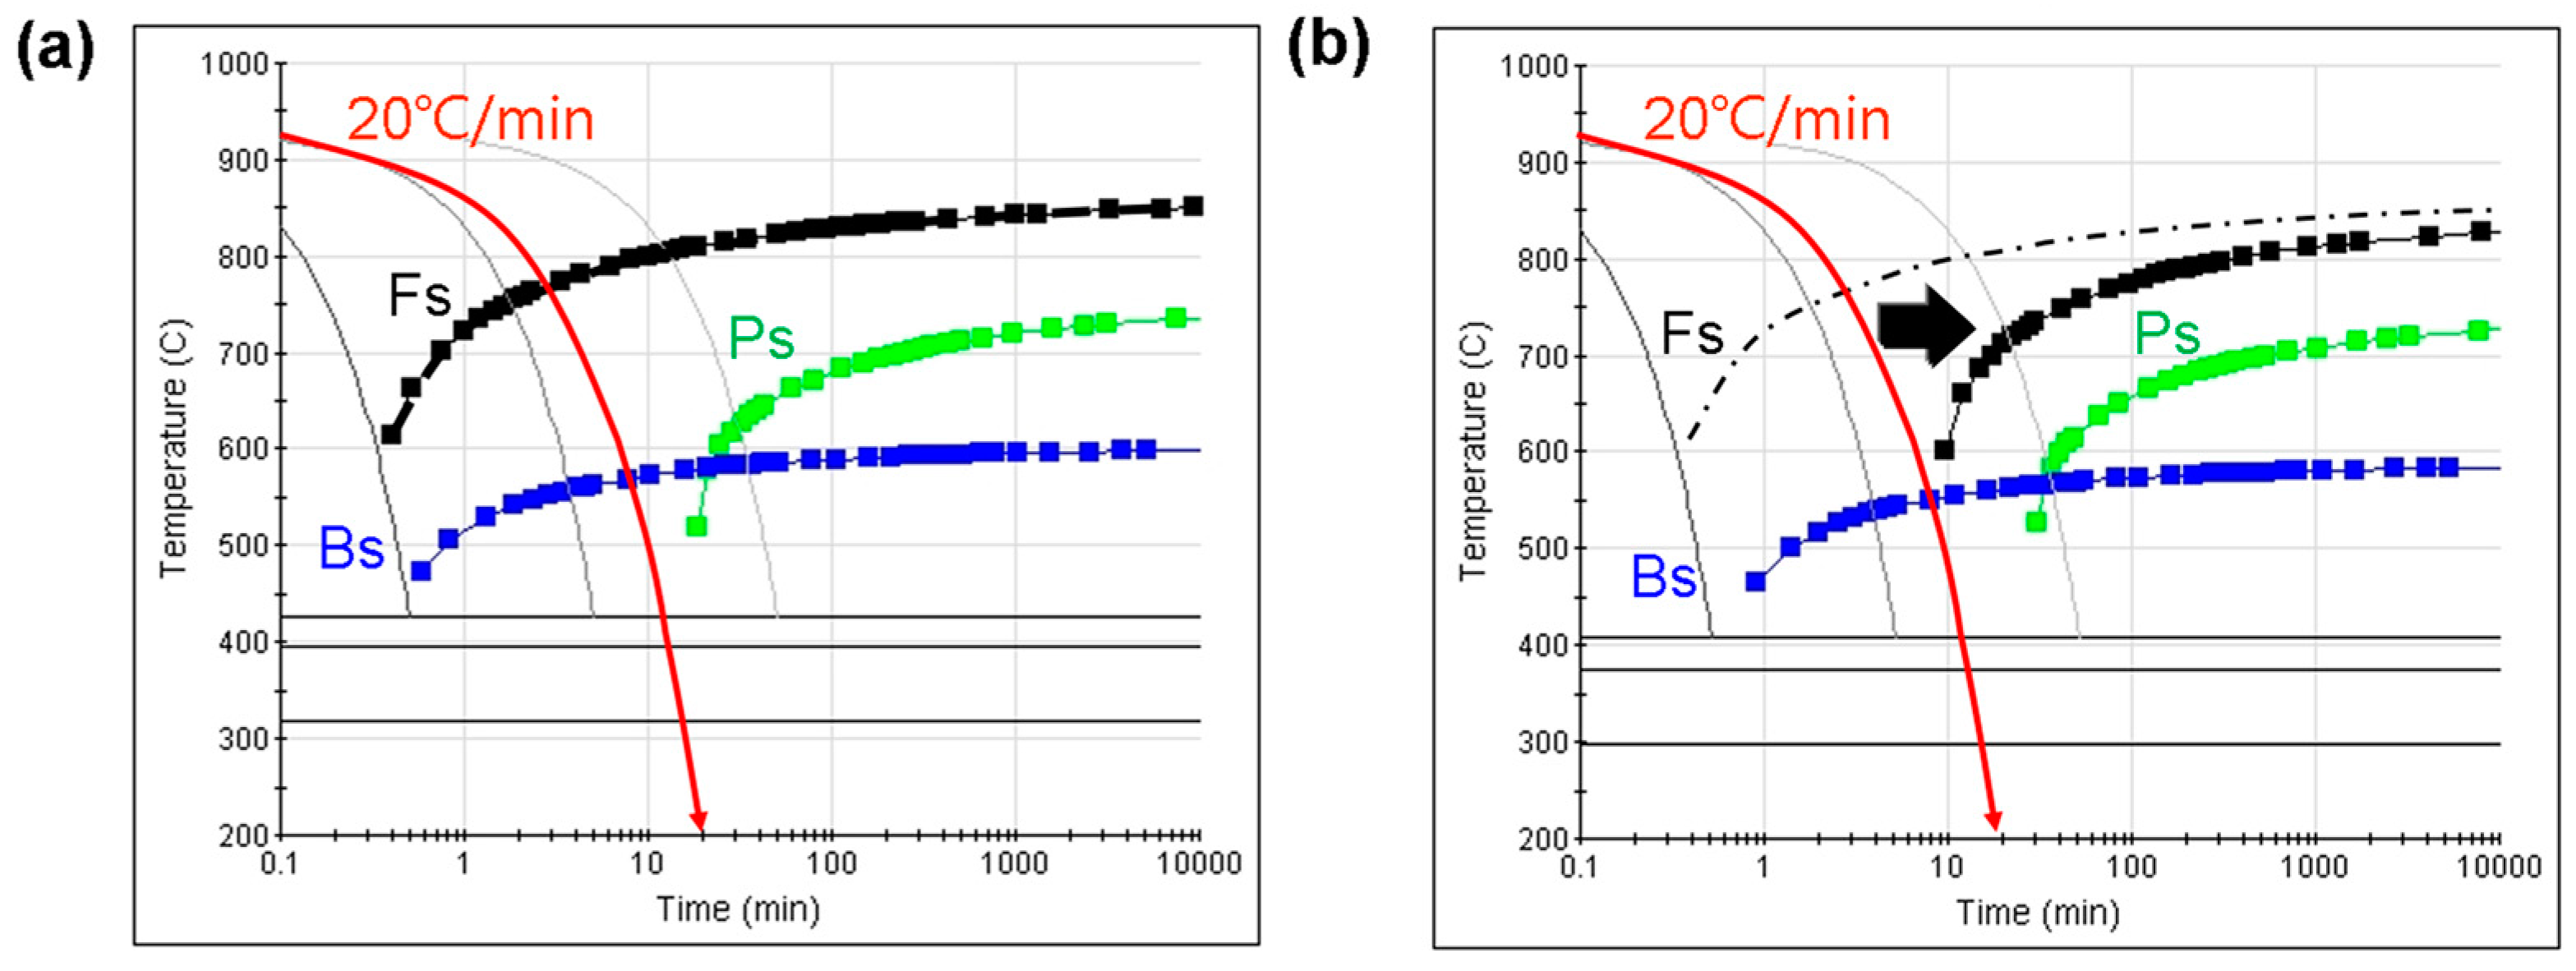
Figure 2 illustrates the CCT diagram at the central cooling speed of 20 °C/min for model A, calculated using JMatProsimulation [25]. Figure 2b shows the CCT diagram of the target designed advanced steel. For the model A alloy, ferrite was formed as the steel conditions passed through the ferrite CCT curve during cooling at the central cooling speed of 20 °C/min. As the conditions passed the bainite curve, the final bainite + ferrite phase was formed. Ferrite is softer than bainite, and the bainite + ferrite phase should have a lower strength than that of full bainite. In order to prevent strength deterioration, the ferrite CCT curve should not be passed during cooling at the central cooling speed of 20 °C/min. For this, it was necessary to design alloy processing such that the ferrite CCT curve of the advanced alloy is moved to the long-duration side. In order to achieve this, the factors affecting the ferrite CCT curve were calculated using JMatPro simulation and are shown in Figure 3.
3.2. Hardenability Design Using Thermodynamic Calculation (JMatPro)
Figure 3a shows the changes in the ferrite CCT curve according to the C content. Between 0.1% and 0.15%C was added to model A, and the ferrite CCT curve was calculated with JMatPro simulation for each content. As the volume of C was increased from 0.1% to 0.15%, the ferrite curve was moved to the long-duration side. In addition, the temperature of Fs decreased. Figure 3b shows the correlation of the change in the length of the ferrite nose time with the concentration of C. Here, ferrite nose means the time to reach the ferrite nose.
The relationship between the C content and ferrite nose time was determined by the least-squares method. The ferrite nose time was increased by approximately 10.814 s as the amount of C was increased by 0.01%.
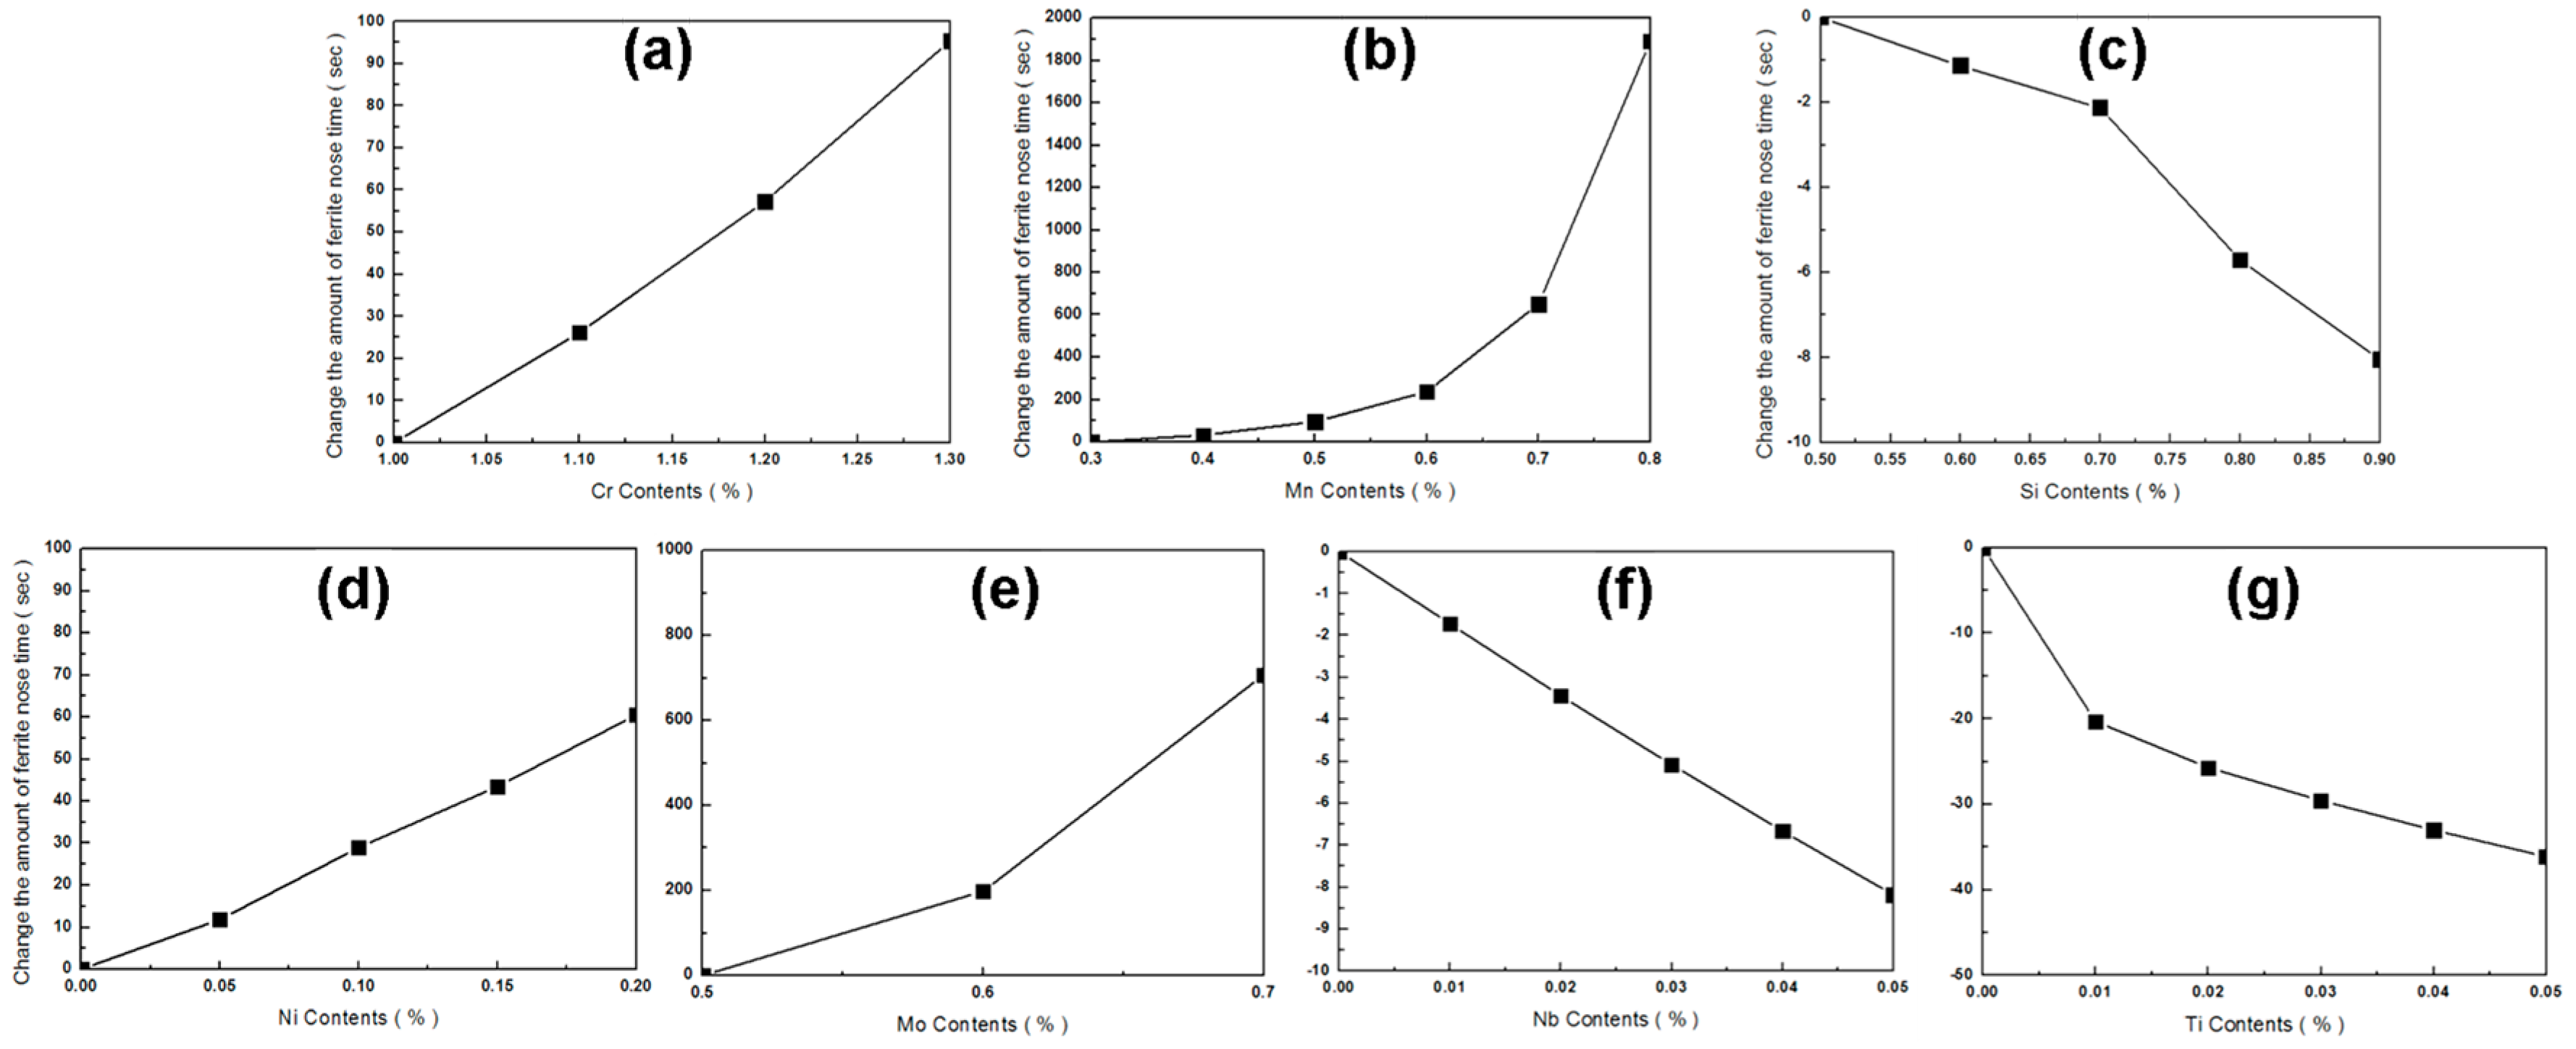
Figure 4a–g illustrates the changes in the ferrite CCT curve with varying contents of Cr, Mn, Si, Ni, Mo, Nb, and Ti, respectively. Figure 4a shows, as the amount of Cr added (between 1.0% and 1.3%) was increased, that the ferrite curve was moved to the long-duration side. Figure 4b shows, as the Mn content (between 0.3% and 0.8%) was increased, that the ferrite curve was moved substantially to the long-duration side. Figure 4c shows that increasing the Si content caused the ferrite curve to move slightly towards the short-duration side. Figure 4d shows that increasing Ni caused the ferrite curve to move to the long-duration side. Figure 4e shows, as the amount of Mo increased, that the ferrite curve moved to the long-duration side. Figure 4f shows that increased amounts of Nb moved the ferrite curve slightly towards the short-duration side. Finally, Figure 4g shows that increasing Ti caused the ferrite curve to move slightly towards the short-duration side. In summary, as the C, Cr, Mo, Mn, and Ni contents are increased, the ferrite curve occurs at longer durations, while increases in the contents of Si, Nb, and Ti shift the ferrite curve to shorter durations.
Figure 5 shows the correlations for changes in the length of the ferrite nose time with changes in the amount of each alloying element. In the case of C, Cr, Mo, Mn, and Ni, the slope of the graph is positive, whereas those for Si, Nb, and Ti are negative. When the slope is positive, the ferrite formation curve moves to longer durations, and when it is negative, it moves to shorter durations. In particular, Mn and Ti have the most positive and most negative slopes, respectively. The correlation between each alloy and the ferrite nose time, formulized using the least-squares method, is shown in Table 2.
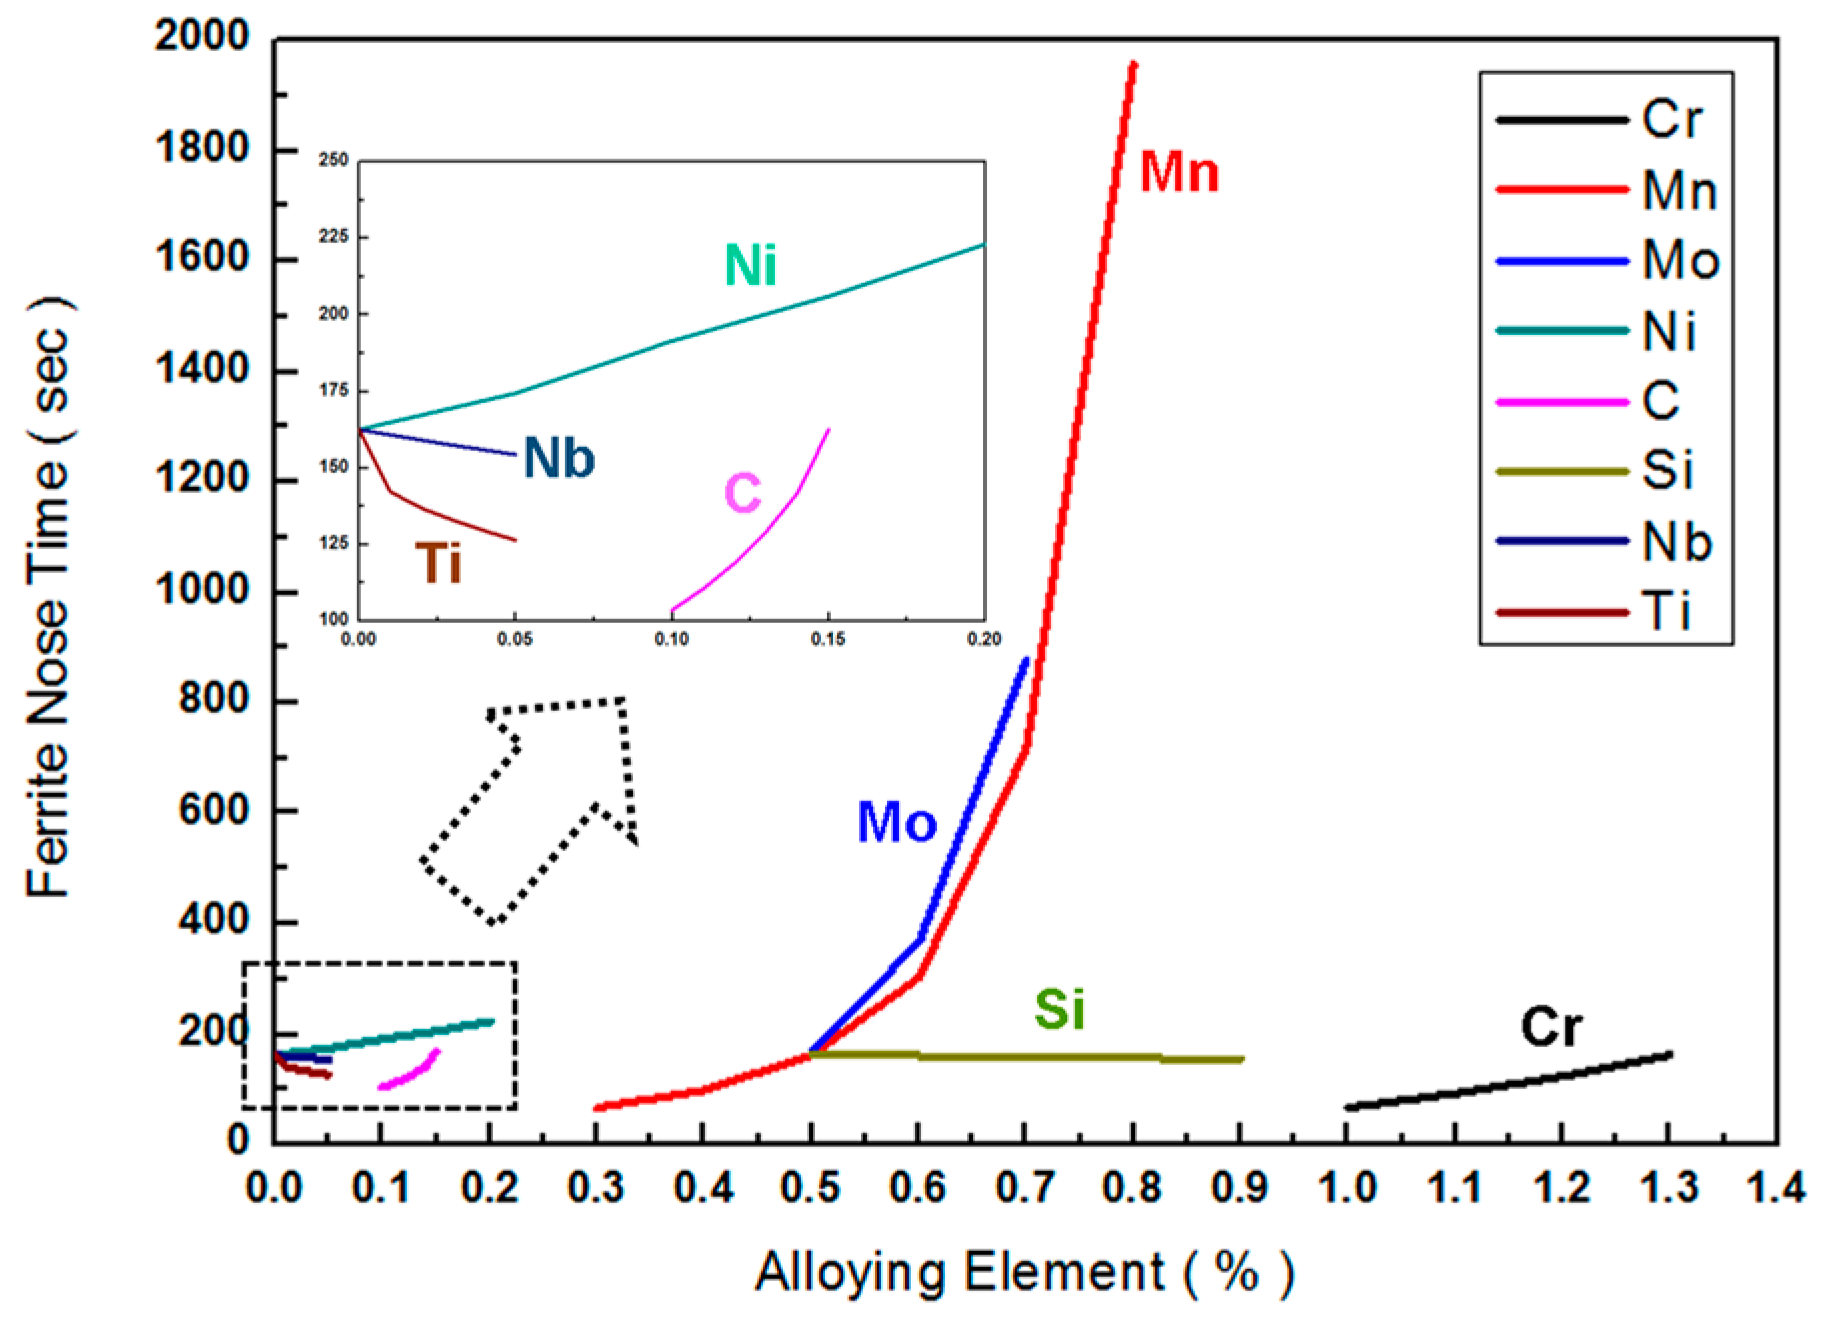
In order to easily compare and analyze the effects of each alloying element on the ferrite nose time, these are shown in Figure 6 for easy comparison. The ferrite nose time and temperature have different values depending on addition of alloying elements. In order to compare the fraction of ferrite according to each alloying element, the time is compared with the ferrite nose time, because time is the more important factor for the ferrite fraction.
As shown in Figure 6, the ferrite nose time was slowly increased from 0.3% to 0.5% for Mn and rapidly for Mn of ≥0.5%. Mo had the largest effect in delaying the ferrite nose time delay, next to Mn. Mn and Mo generally became segregated in the austenite grain boundaries and suppressed the generation of ferrite [26,27]. The inhibitive effects of Mn and Mo on ferrite formation were greater than those of C alloying. Nb and Ti had less effects on the ferrite nose time delay [28,29]. Therefore, carbides were likely formed by reactions of Nb and Ti with C; this carbide formation caused C deficiencies. Within the addition range of each element, the CCT curve was calculated with unit changes of 0.1% for Mn and 0.01% unit changes for Nb. For a simple comparison, the effect of C has been designated as 1.0 to determine the effects of alloys on the ferrite curve via the C equivalent equation:
Ferrite nose time = C + 0.282 Cr + 2.985 Mo + 8.198 Mn + 0.273 Ni − 0.017 Si − 0.154 Nb − 0.795 Ti
Si, Nb, and Ti had negative slopes, indicating that they promote the transformation of ferrite. Ferrite generation is promoted by Ti > Nb > Si; the promoting effects of Ti and Nb are larger than those of Si because they are carbide formers. The effect of Ti is larger than that of Nb because Ti is more likely to form carbides than Nb and the amount of TiC is larger than that of NbC; thus Ti additions induce relatively higher C deficiencies. Cr, Mo, Mn, and Ni showed positive slopes and therefore suppress the formation of ferrite. In reviewing these results, the addition of Mn and Mo, which had relatively greater slopes, can suppress the generation of ferrite most effectively.
3.3. Strengthening Design by Grain Refinement and Hardening Using Thermodynamic Calculations (Thermo-Calc)
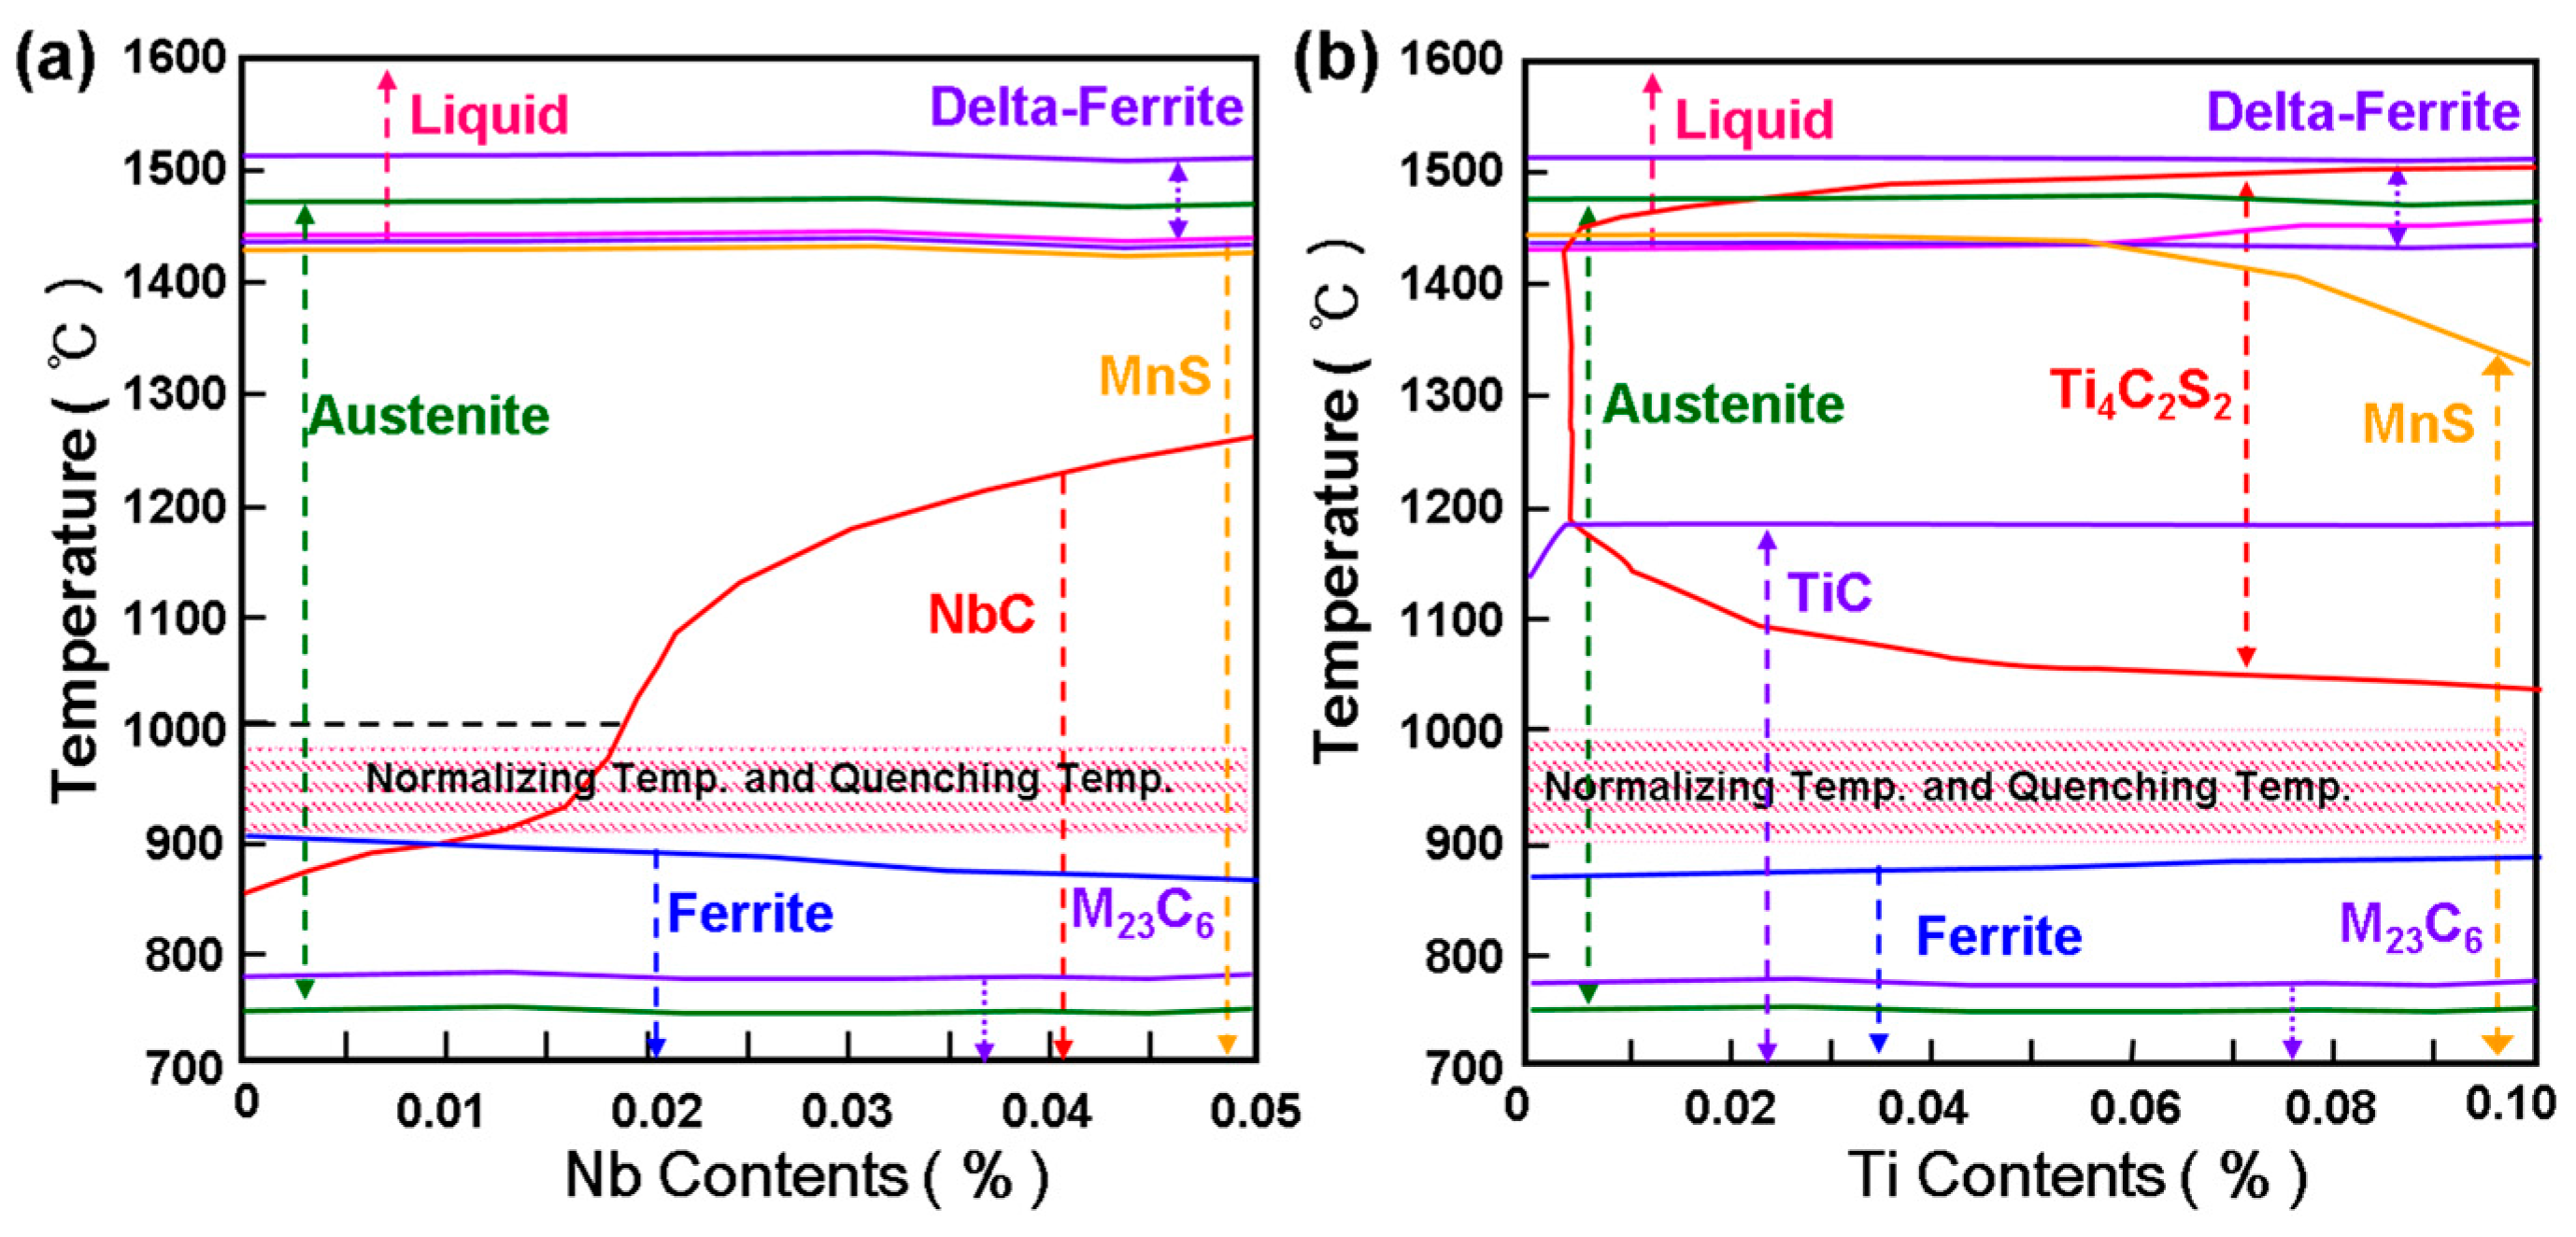
In order to satisfy the mechanical property requirements, such as a tensile strength of >530 MPa, a high-temperature strength of >240 MPa at 380 °C, and an impact energy absorption of 55 J at −20 °C, reducing ferrite formation in the central part is important, but solid solution strengthening and crystal grain refining through precipitation strengthening are also effective. We studied Nb and Ti, which are known to refine the crystal grains of Cr-Mo steel. Figure 7 shows the amounts of solution and precipitation phases calculated by Thermo-Calc in the Nb-and Ti-added model A alloys. The solution was about the solution of alloying elements (Nb and Ti), and the meaning of precipitation phases refers to precipitates such as NbC or TiC. Figure 7a shows that NbC carbide was formed when the amount of the alloy element of Nb was about 0.01% or more at the normalizing temperature and quenching temperature (900–1000 °C). Because more than 0.01% of Nb was present, the amount of NbC could be expected to increase. TiC was formed when Ti was added at the normalizing and quenching temperatures. For ≥0.005% Ti added at 1200 °C, the Ti4C2S2 complex carbide, which could reduce grain refinement, and MnS inclusions were precipitated. As shown in Figure 7, the Nb and Ti contents were ≥0.01% and ≥0.005%, respectively; the NbC and TiC precipitates were considered effects of the refined austenite grain size. References [22,23] are referred to in the reliability and quantitative measurement of NbC and TiC.
In the mechanical properties of IGCC plant vessels, the creep strength is another important mechanical property, in addition to the tensile strength, high-temperature strength, and impact resistance. In Cr-Mo steel, the presence of M7C3, known as the Cr-Fe rich phase, promotes the onset of acceleration creep [29]. It takes a large amount of time to perform the creep test. Thus, reference is made to the fact that M7C3 precipitates have an adverse effect on creep properties. Thus, an alloy design was conducted to prevent the formation of M7C3 precipitates. In order to suppress the formation of M7C3 precipitates, the alloy design was performed using Thermo-Calc. The phase diagram of the alloy components of model A, as well as the composition and Gibbs energy of the formation for the M23C6 and M7C3 phases, were calculated by Thermo-Calc. In Figure 8a, cubic M23C6 contained Fe, Cr, C, Mo, and Mn. The Fe and Cr contents increased and decreased, respectively, with increases in the temperature from 500 to 750 °C. The tempering temperature range of Cr-Mo steel is known as 650–750 °C. The matrix contains Fe51-Cr21.4-Mo6-Mn0.8-C20.7 (at %) at the temperature of 740 °C. In Figure 8b, hexagonal M7C3 comprised Fe, Cr, C, Mo, and Mn, as for M23C6, but the Cr and C contents were higher than in M23C6. The Gibbs energy in Figure 8 indicates the stability of M23C7 at 500–750 °C, while M7C3 was stable in the narrow region of 720–740 °C. In order to suppress the formation of M7C3, it is considered preferable to temper the steel by avoiding the temperature range of 720–740 °C in which the M7C3 precipitate is stable. Figure 9 shows the phase diagrams calculated using Thermo-Calc in order to confirm whether M7C3 precipitates are formed when the hardenability-affecting elements of C and Mn and the grain-refining elements of Nb and Ti are added to the model A alloy.
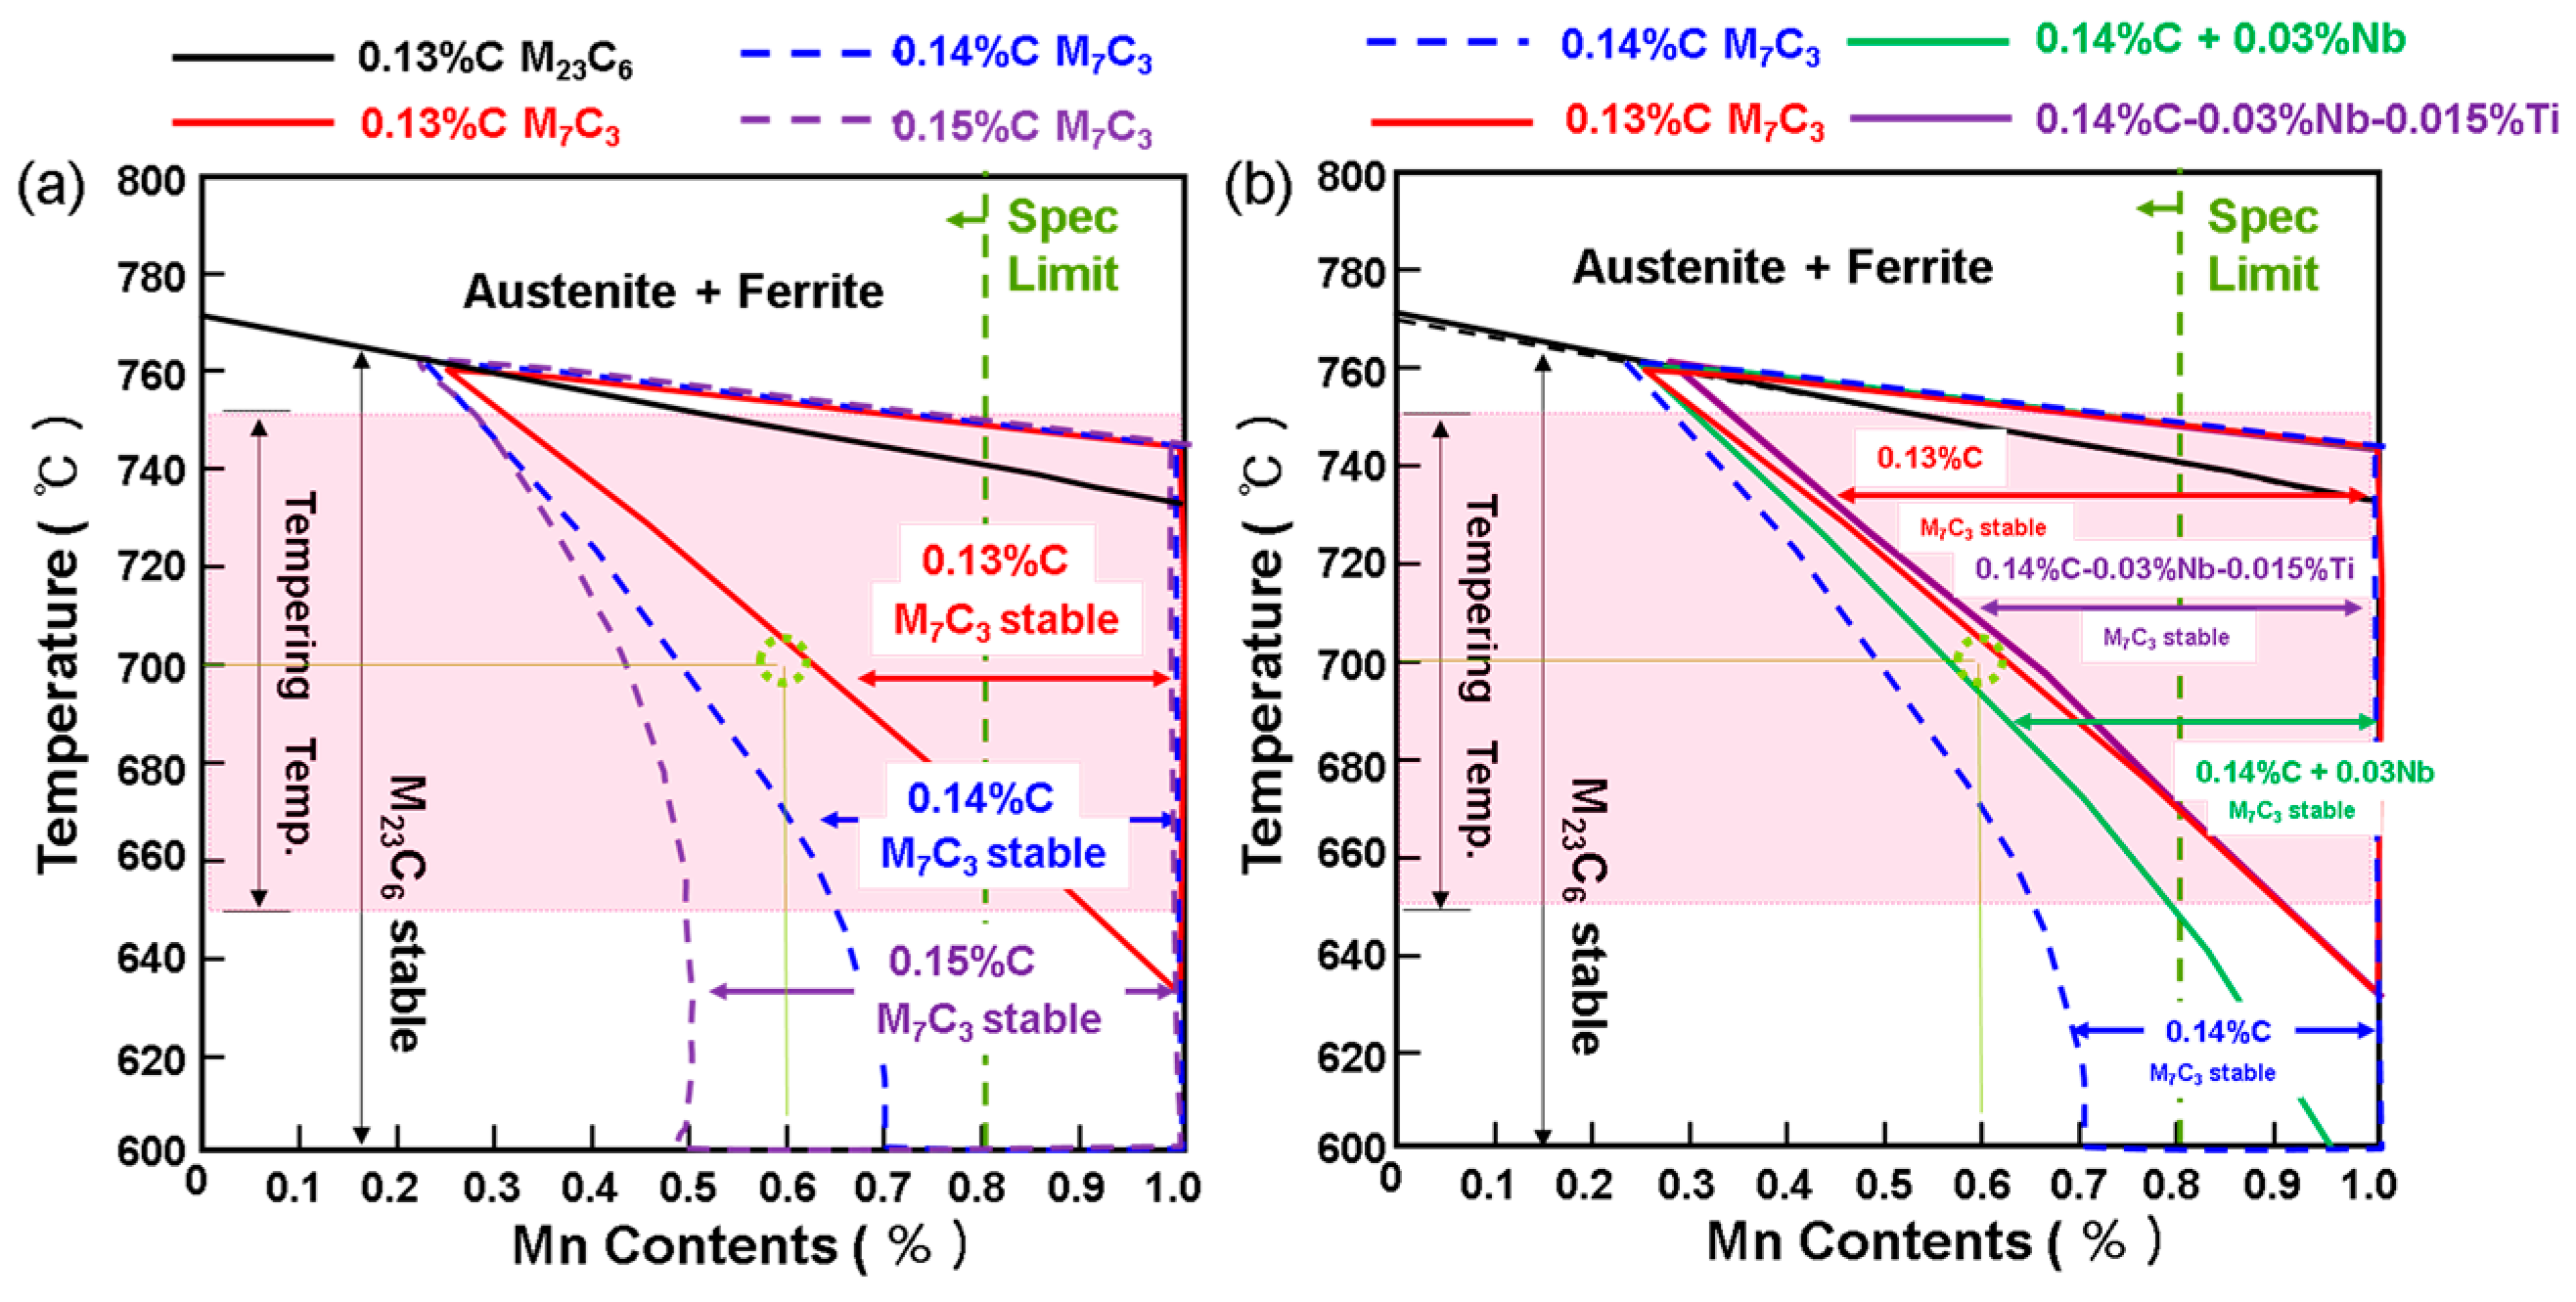
Figure 9 shows the phase formation of M23C6 and M7C3 according to the contents of C (0.13–0.15%) and Mn (0–1.0%) in model A with the addition of 0.03% Nb to 0.14% C steel and with the addition of 0.015% Ti to 0.14% C–0.03% Nb steel, as determined by Thermo-Calc. In Figure 9a, 0.13% C yielded stable M23C6 phases. When the Mn content was ≤0.6%, the M23C6 phase was stable; for Mn contents of ≥0.6%, the M7C3 phase was stable. M23C6 and M7C3 both contain Mn; when Mn was increased above a certain amount, the formation of M7C3 was promoted. For these reasons, the Mn solubility of M7C3 was higher than that of M23C6. In Figure 9b, 0.14% C added with 0.03% Nb decreased the area of M7C3 stability decreases in the tempering temperature range of 630–770 °C. Nb decreased the region of M7C3 stability, despite not being included in either M23C6 or M7C3. This was because Nb is a strong carbide-forming element, thought to decrease the C content of the matrix; it was considered that the area of M7C3 decreased as the content of C decreased. The decreased M7C3 area in 0.14% C–0.03% Nb steel containing 0.015% Ti was caused by the decrease in the C content from the formation of TiC. The addition of 0.03% Nb + 0.015% Ti to 0.14% C steel on the formation of M7C3 caused behavior similar to that of 0.13% C steel without the addition of Nb and Ti. That is, the addition of 0.03% Nb and 0.015% Ti appeared to suppress M7C3 with a 0.1% reduction in C addition.
3.4. Hardenability and Mechanical Properties of Advanced Alloy
Table 3 shows the chemical composition of the selected alloys on the basis of the results of the simulated alloy designs detailed in Section 3.1, Section 3.2 and Section 3.3. The selected advanced alloy was cast using high-frequency vacuum induction melting. The mechanical properties of the alloy were characterized after heat treatment by quenching and tempering. The tensile strength, high-temperature yield strength, and impact energy absorption of the advanced alloy all satisfied the reference specifications. This example of alloy design through simulation demonstrated that alloys could be designed according to the desired mechanical properties. Each experiment was performed to verify the results from the simulation from a metallurgical perspective. Figure 10 shows the CCT curve to confirm the hardenability of the model A and advanced alloys. The nose of the ferrite curve of model A was generated at approximately 760–680 °C at a cooling rate of 200 °C/min, but that of the advanced alloy appeared at approximately 750–720 °C at a cooling rate of 15 °C/min.
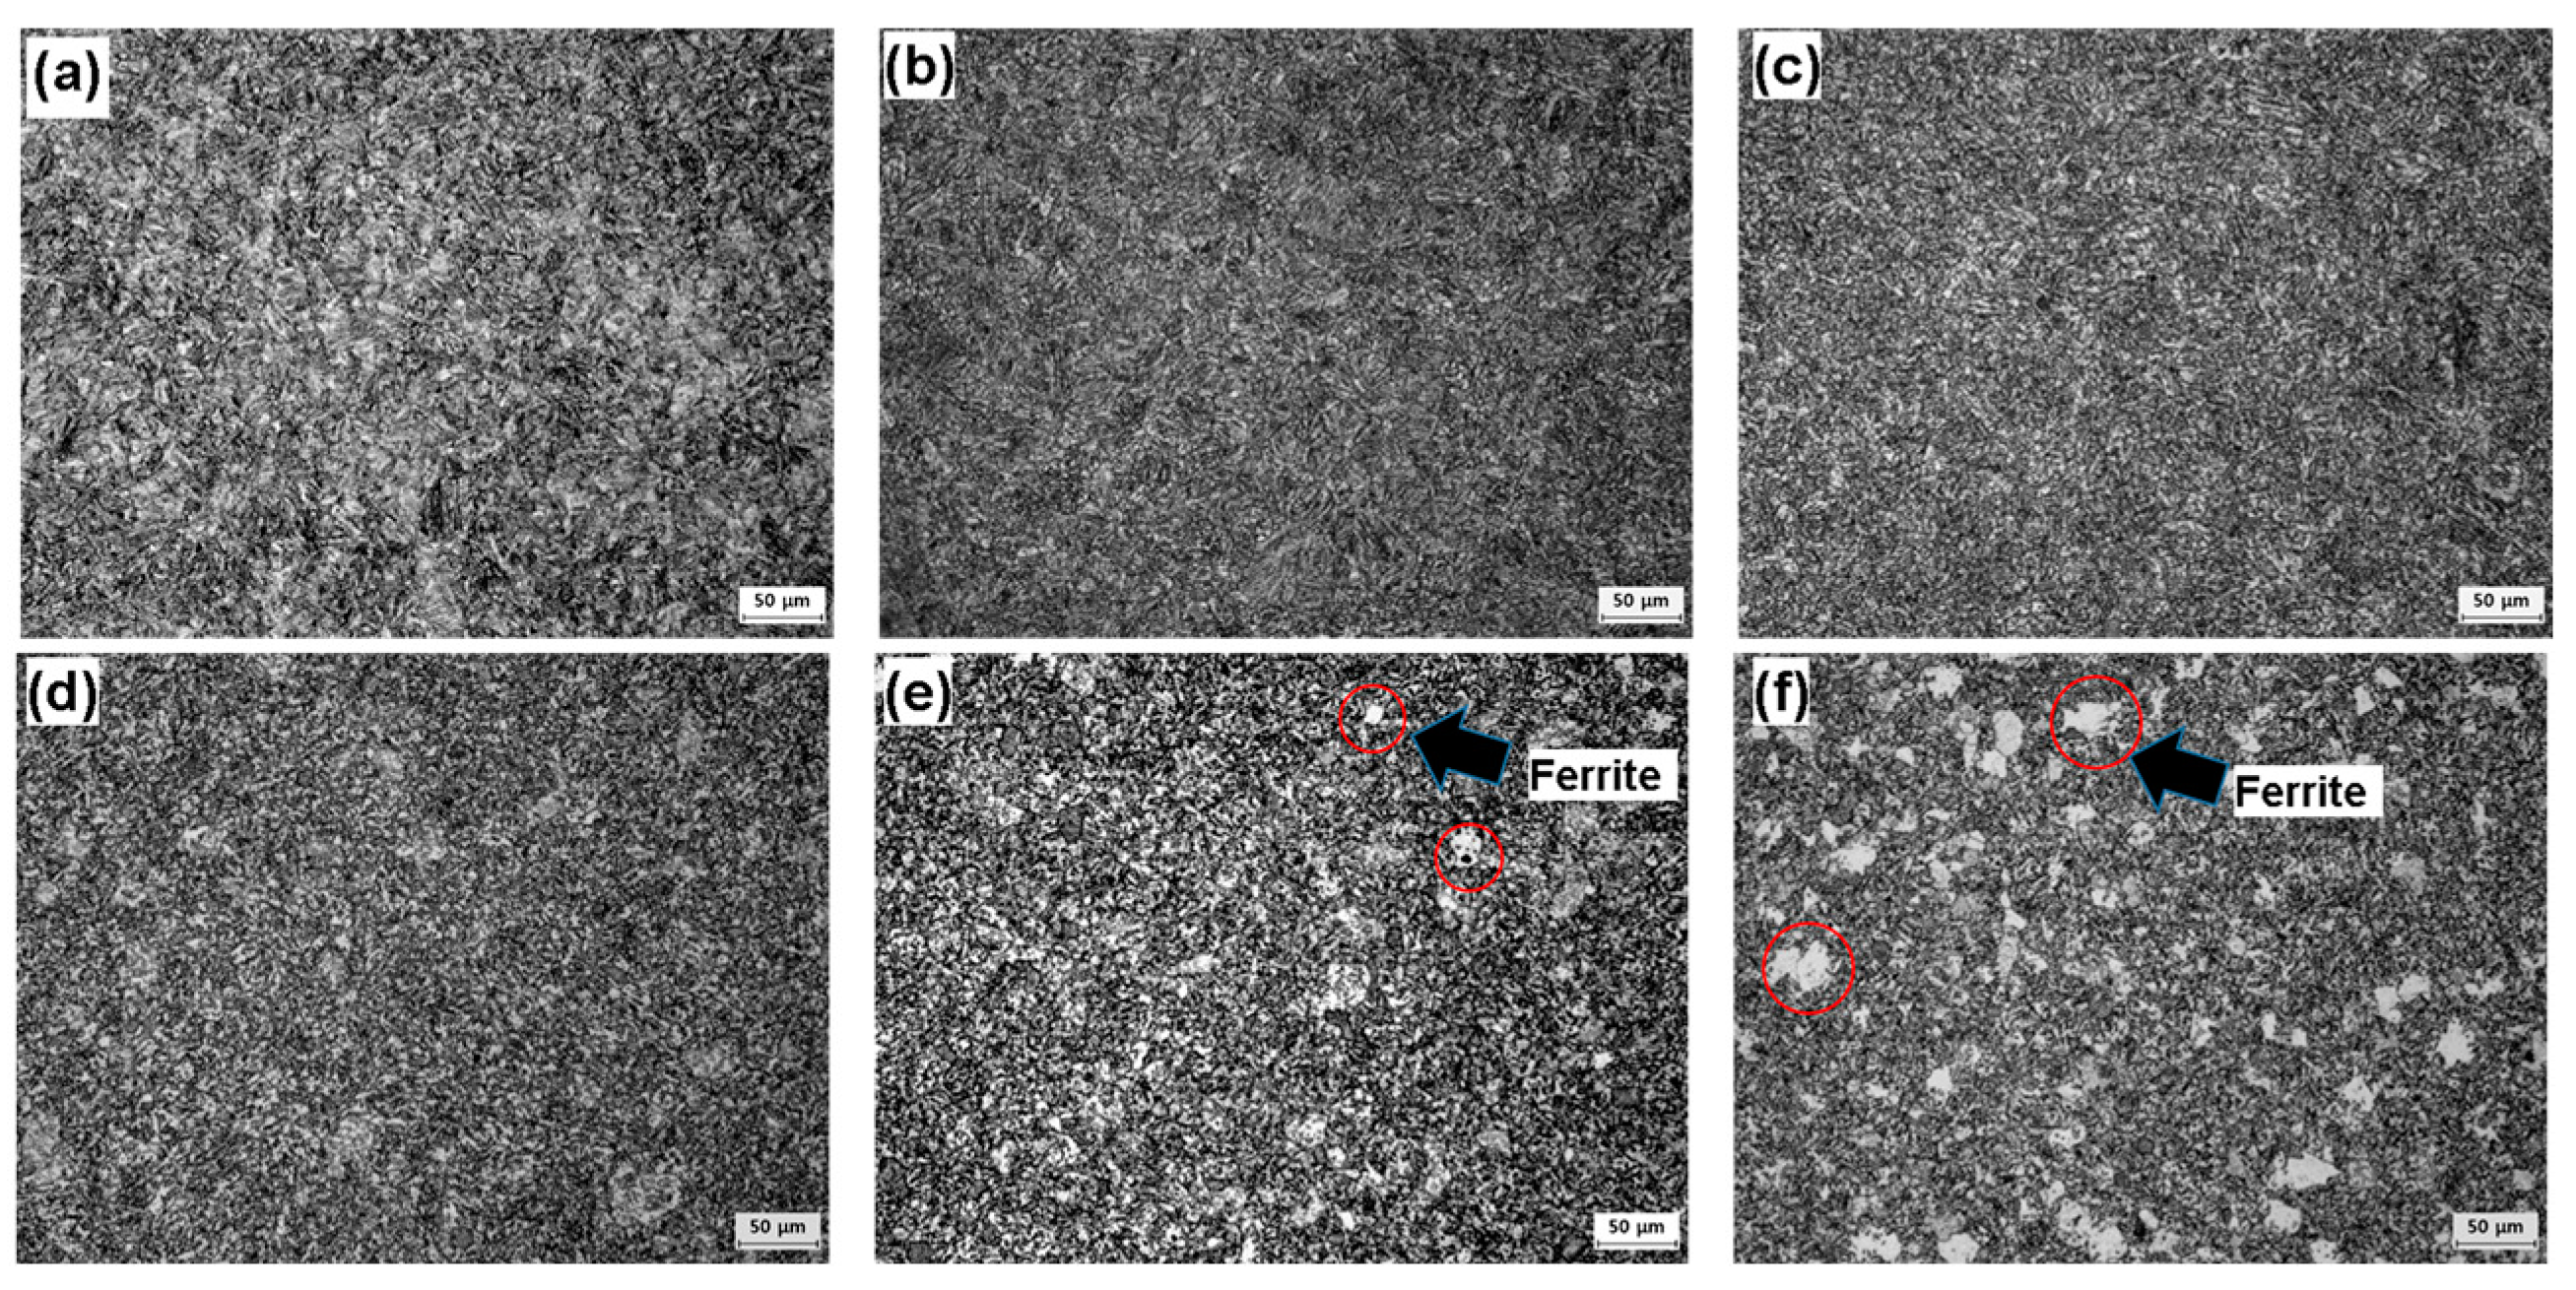
In Figure 11, in order to confirm the formation of ferrite at varied cooling rates of 300, 100, 50, 20, 15, and 10 °C/min, the microstructures were observed via microscopy. At the cooling rates of 20–300 °C/min, only full bainite appeared. At 15 °C/min, some ferrite was formed, while at 10 °C/min, ferrite was formed rapidly. Therefore, the advanced alloy showed better hardenability than the existing model A alloy.
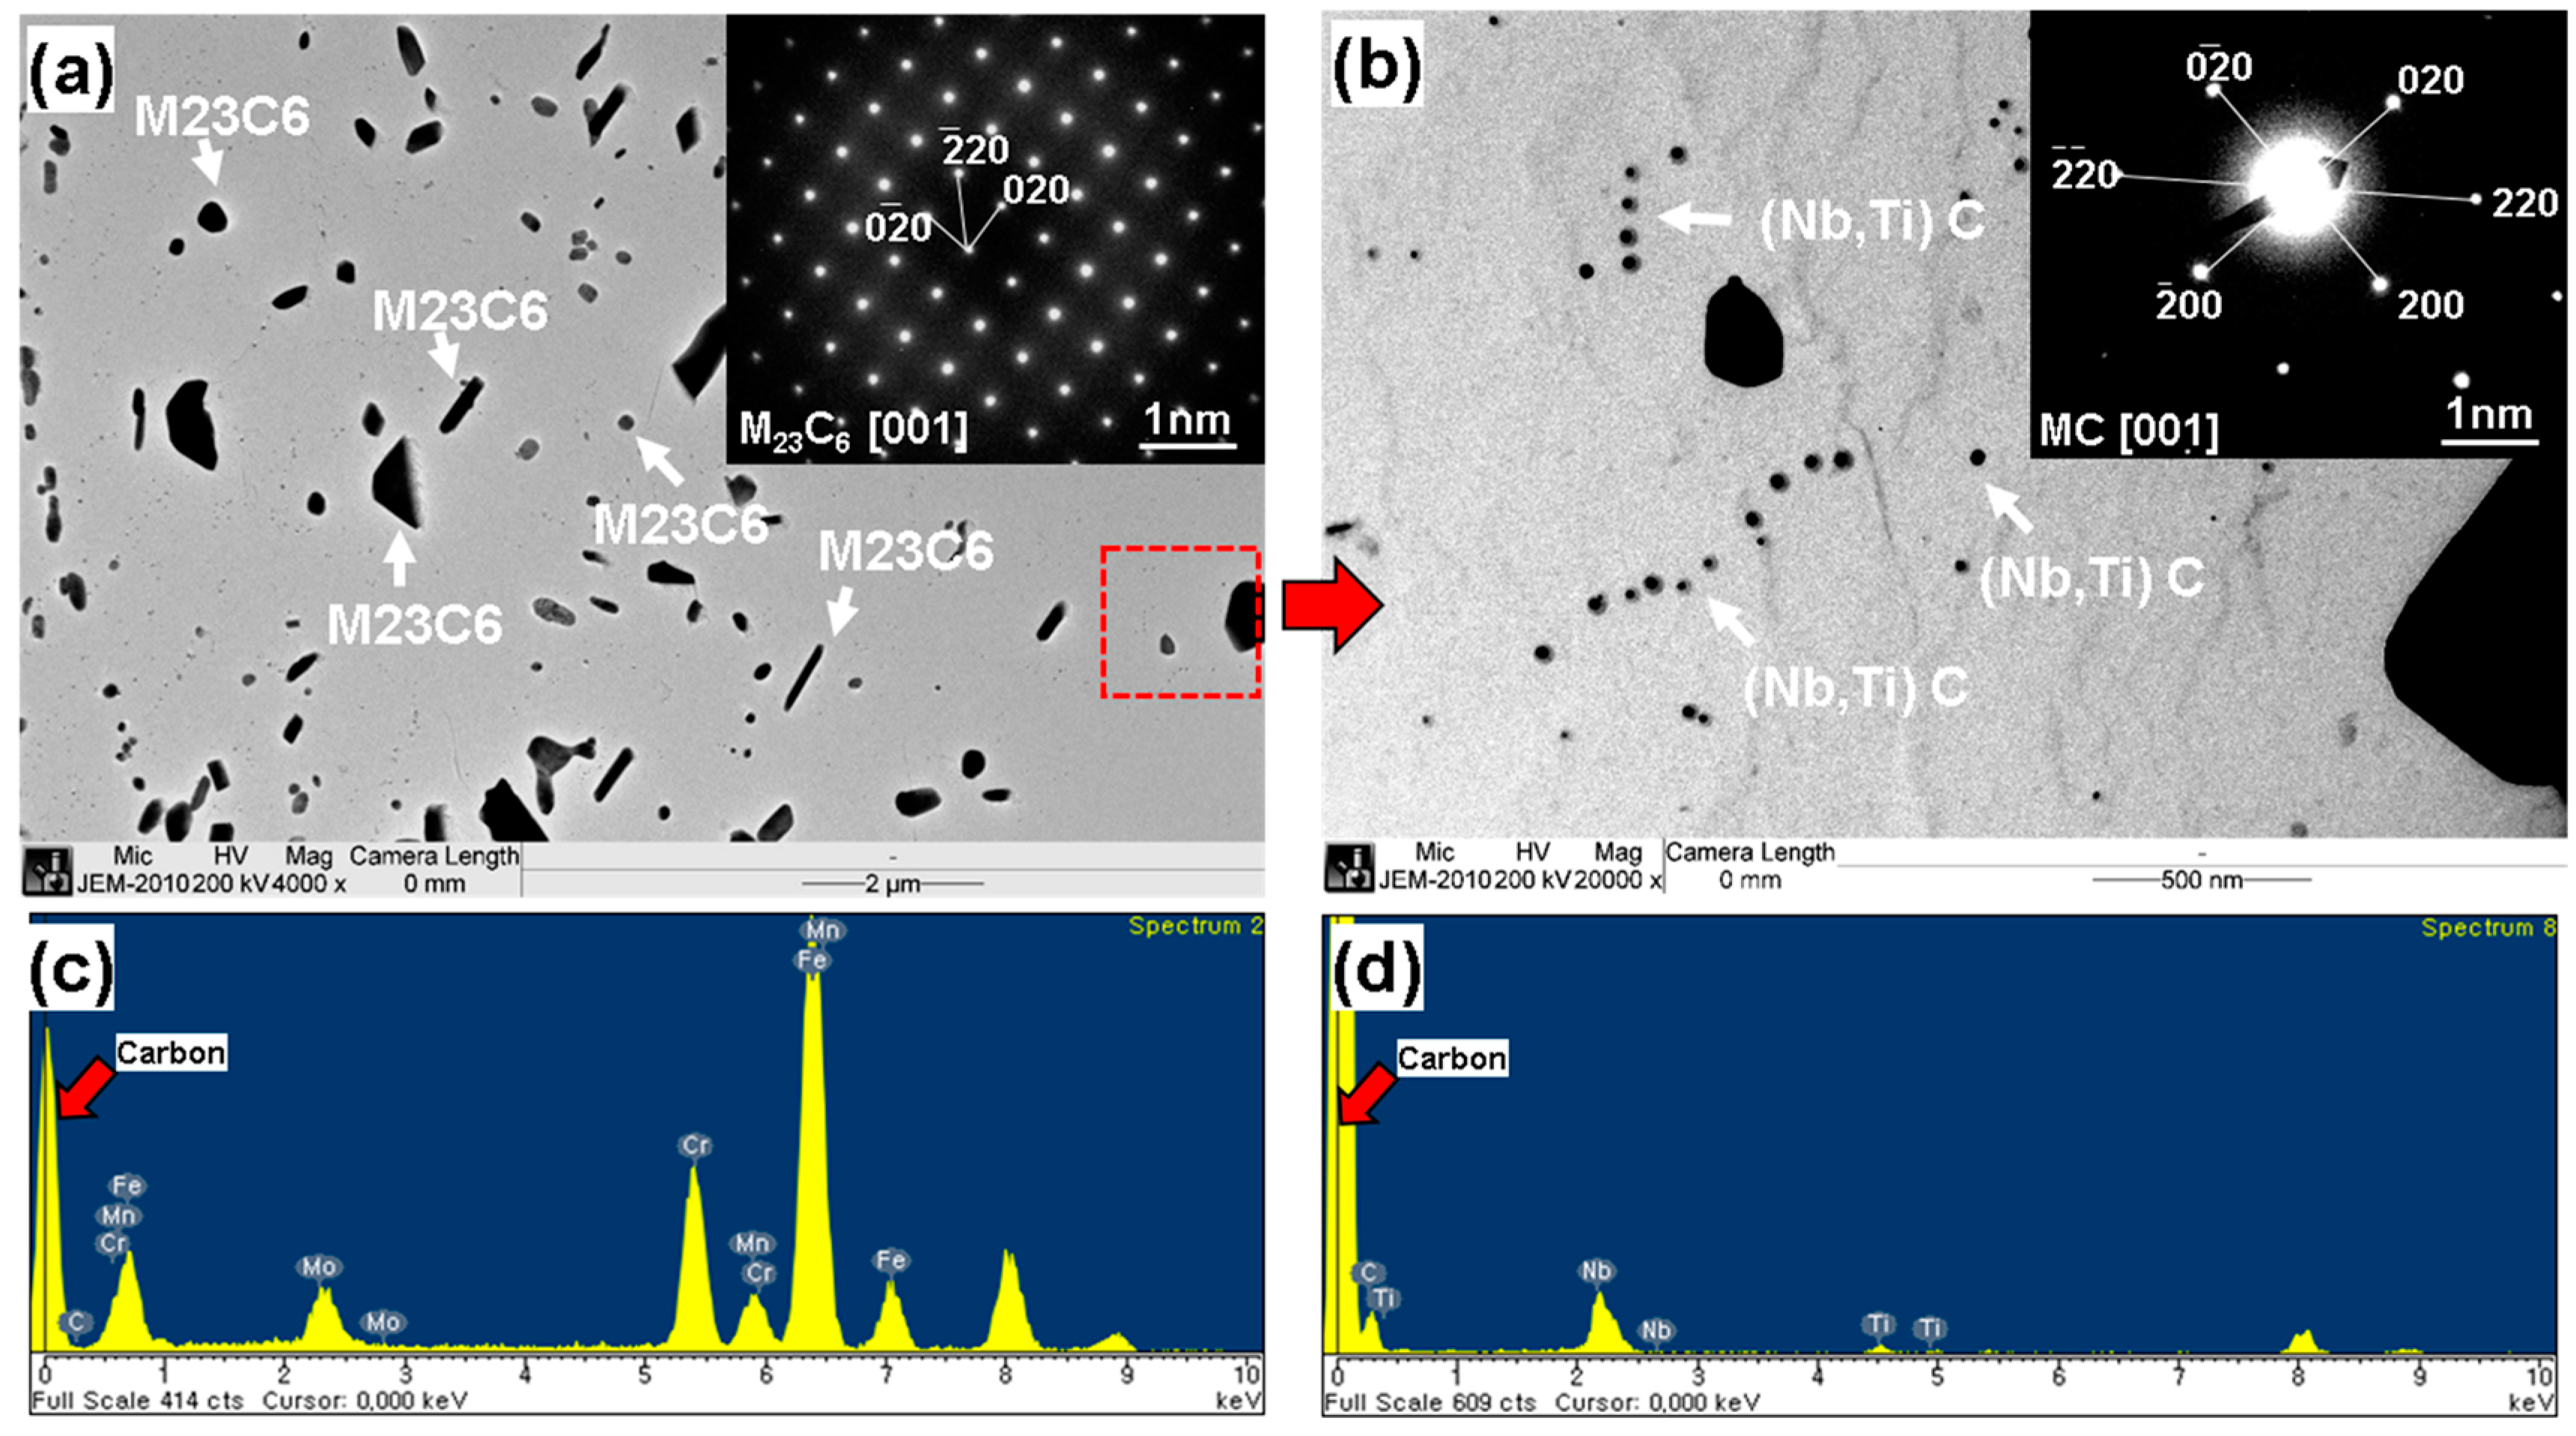
Figure 12 shows the results of carbon extraction replica experiments for the identification of carbides in the advanced alloy after the final heat treatment (normalizing, quenching and tempering). TEM observation of the precipitates confirmed the formation of M23C6, M7C3 and MC, which adversely affect creep strength and grain refining. In Figure 12a, several precipitates are distributed. The pattern analysis of the coarse precipitates indicated by arrows shows the composition of M23C6 (FCC). The chemical composition of the M23C6 phase was 59.12%Fe-23.25%Cr-6.76%Mo-4.48%Mn-6.4%C as measured by energy-dispersive X-ray (EDX) spectral analysis. Because the matrix is a carbon film, the ratio of the remaining alloying elements aside from carbon was similar to the results predicted by Thermo-Calc in Figure 8. From the EDX point analysis of the remaining coarse precipitates, the Cr content did not exceed 24%. This suggests that precipitates of M7C3 with higher Cr contents than M23C6 were not formed. Figure 12b shows high-magnification TEM observations performed to analyze precipitates finer than the M23C6 precipitates. A fine circular precipitate was observed and identified as FCC MC by pattern analysis; EDX analysis shows the composition of MC (M = Nb, Ti). These MC precipitates were considered to positively affect the strength and impact properties by refining the grains.
4. Conclusions
For the design of 1.25 Cr-0.5 Mo steel with excellent tensile strength, high-temperature yield strength, good creep strength, and high impact resistance, a complete bainite structure even at the center of a 300 mm thick wall can be obtained. After simulations via JMatPro and Thermo-Calc, the simulated alloy design was verified through experimental specimen production. JMatPro software was used to calculate the start time of ferrite production via CCT curve analysis. An alloy with excellent hardenability was designed by using the correlation formulas for changes in the CCT curves with each alloying component. The advanced alloy designed by simulation showed a complete bainite structure without ferrite phases at a cooling rate of 20 °C/min and good mechanical properties with a strength of 585 MPa and an impact energy absorption of 170 J at −20 °C. The alloy design through Thermo-Calc simulation allowed the suppression of M7C3 formation, which negatively affects creep strength and improved the mechanical properties by promoting MC precipitation for fine grain refinement. This method of simulated alloy design can reduce the error of unexpected variables encountered in trial-and-error designs, reduce the time and cost of design, and enable custom alloy designs to accommodate the required mechanical properties.
Acknowledgments
This work was supported by the National Research Foundation of Korea (NRF) grant funded by the Korea government (MSIP) (No. 2012R1A5A1048294).
Author Contributions
Byung-hoon Kim and Sang-hoon Lee and Chung-yun Kang conceived and designed the experiments. Hye-Sung Na performed the experiments and analyzed the data.
Conflicts of Interest
The authors declare no conflict of interest. The funding sponsors had no role in the design of the study; in the collection, analyses, or interpretation of data; in the writing of the manuscript, and in the decision to publish the results.
References
- McMullan, J.T.; Williams, B.C.; Sloan, E.P. Clean coal technologies. Proc. Inst. Mech. Eng. Part A J. Power Energy 1997, 211, 95–107. [Google Scholar] [CrossRef]
- Guillermo, O.-G.; Douglas, P.; Croiset, E.; Zheng, L. Technoeconomic evaluation of IGCC power plants for CO2 avoidance. Energy Convers. Manag. 2006, 47, 2250–2259. [Google Scholar]
- Descamps, C.; Bouallou, C.; Kanniche, M. Efficiency of an integrated gasification combined cycle (IGCC) power plant including CO2 removal. Energy 2008, 33, 874–881. [Google Scholar] [CrossRef]
- Wang, T. An overview of IGCC systems. Integr. Gasif. Comb. Cycle Technol. 2017, 1–80. [Google Scholar] [CrossRef]
- Barnes, I. Recent Operating Experience and Improvement of Commercial IGCC; IEA Clean Coal Center: London, UK, 2013; pp. 8–11. [Google Scholar]
- Brust, F.W.; Dong, P. Welding residual stresses and effects on fracture in pressure vessel and piping components: A millennium review and beyond. J. Press. Vessel Technol. 2000, 122, 329–338. [Google Scholar]
- Bouchard, P.J.; Withers, P.J.; McDonald, S.A.; Heenan, R.K. Quantification of creep cavitation damage around a crack in a stainless steel pressure vessel. Acta Mater. 2004, 52, 23–34. [Google Scholar] [CrossRef]
- Brust, F.W.; Paul, M.S. Weld residual stresses and primary water stress corrosion cracking in bimetal nuclear pipe welds. In Proceedings of the ASME 2007 Pressure Vessels and Piping Conference, San Antonio, TX, USA, 22–26 July 2007. [Google Scholar]
- Davis, J.R. (Ed.) ASM Specialty Handbook: Heat-Resistant Materials; ASM International: Geauga, OH, USA, 1997; pp. 89–122. [Google Scholar]
- Das, S.K.; Joarder, A.; Mitra, A. Magnetic Barkhausen emissions and microstructural degradation study in 1.25 Cr-0.50 Mo steel during high temperature exposure. NDT E Int. 2004, 37, 243–248. [Google Scholar] [CrossRef]
- Mitchell, D.R.G.; Moss, C.J.; Griffiths, R.R. Optimisation of post-weld heat treatment of a 1.25 Cr-0.5 Mo pressure vessel for high temperature hydrogen service. Int. J. Press. Vessels Pip. 1999, 76, 259–266. [Google Scholar] [CrossRef]
- Pickering, F.B. Physical Metallurgy and the Design of Steels; Applied Science Publishers: Rotherham, UK, 1978. [Google Scholar]
- Caballero, F.G.; Bhadeshia, H.K.D.H.; Mawella, K.J.A.; Jones, D.G.; Brown, P. Design of novel high strength bainitic steels: Part 2. Mater. Sci. Technol. 2001, 17, 517–522. [Google Scholar] [CrossRef] [Green Version]
- Grajcar, A.; Zalecki, W.; Burian, W.; Kozłowska, A. Phase Equilibrium and Austenite Decomposition in Advanced High-Strength Medium-MnBainitic Steels. Metals 2016, 6, 248. [Google Scholar] [CrossRef]
- Wang, H.-S.; Hsieh, P.-J. Establishment of Heat Treatment Process for Modified 440A Martensitic Stainless Steel Using Differential Scanning Calorimetry and Thermo-Calc Calculation. Metals 2016, 6, 4. [Google Scholar] [CrossRef]
- Knežević, V.; Balun, J.; Sauthoff, G.; Inden, G.; Schneider, A. Design of martensitic/ferritic heat-resistant steels for application at 650 C with supporting thermodynamic modelling. Mater. Sci. Eng. A 2008, 477, 334–343. [Google Scholar] [CrossRef]
- Haidemenopoulos, G.N.; Grujicic, M.; Olson, G.B.; Cohen, M. Thermodynamics-based alloy design criteria for austenite stabilization and transformation toughening in the Fe Ni Co system. J. Alloys Compd. 1995, 220, 142–147. [Google Scholar] [CrossRef]
- Saunders, N.; Guo, U.K.Z.; Li, X.; Miodownik, A.P.; Schillé, J.P. Using JMatPro to model materials properties and behavior. JOM 2003, 55, 60–65. [Google Scholar] [CrossRef]
- Andersson, J.-O.; Helander, T.; Höglund, L.; Shi, P.; Sundman, B. Thermo-Calc & DICTRA, computational tools for materials science. Calphad 2002, 26, 273–312. [Google Scholar]
- Saunders, N.; Guo, Z.; Li, X.; Miodownik, A.P.; Schillé, J.P. The Calculation of TTT and CCT Diagrams for General Steels. JMatPro Software Literature, 2004. Available online: https://www.sentesoftware.co.uk/ (accessed on 5 January 2018).
- Lee, S.; Na, H.; Kim, B.; Kim, D.; Kang, C. Effect of Niobium on the Ferrite Continuous-Cooling-Transformation (CCT) Curve of Ultrahigh-Thickness Cr-Mo Steel. Metall. Mater. Trans. A 2013, 44, 2523–2532. [Google Scholar] [CrossRef]
- Lee, S.-H.; Na, H.S.; Park, G.D.; Kim, B.H.; Song, S.W.; Kang, C.Y. Effects of titanium on ferrite continuous cooling transformation curves of high-thickness Cr-Mo steels. Met. Mater. Int. 2013, 19, 907. [Google Scholar] [CrossRef]
- Shinozaki, T.; Komura, T.; Fujitsuna, N.; Nakashima, H.; Yamada, M.; Nakanishi, T. Fabrication and Properties of Forged Rings MADE of Modified 9Cr-1Mo-V Steel for High-Temperature and High-Pressure Reactor. Kobelco Technol. Rev. 2015, 33, 39–43. [Google Scholar]
- Chipman, J. Thermodynamics and phase diagram of the Fe-C system. Metall. Mater. Trans. B 1972, 3, 55–64. [Google Scholar] [CrossRef]
- Trzaska, J.; Jagiełło, A.; Dobrzański, L.A. The calculation of CCT diagrams for engineering steels. Arch. Sci. Eng. 2009, 39, 13–20. [Google Scholar]
- Naudin, C.; Frund, J.M.; Pineau, A. Intergranular fracture stress and phosphorus grain boundary segregation of a Mn-Ni-Mo steel. Scr. Mater. 1999, 40, 1013–1019. [Google Scholar] [CrossRef]
- Enomoto, M.; Aaronson, H.I. Nucleation kinetics of proeutectoid ferrite at austenite grain boundaries in Fe-CX alloys. Metall. Mater. Trans. A 1986, 17, 1385–1397. [Google Scholar] [CrossRef]
- Kowalski, M.; Spencer, P.J.; Granat, K.; Drzeniek, H.; Lugscheider, E. Phase relations in the C-Cr-Fe system in the vicinity of the/liquid + bcc + M23C6 + M7C3/invariant equilibrium: Experimental determinations and thermodynamic modelling. Z. Metall. 1994, 85, 359–364. [Google Scholar]
- Zhang, Y.; Miao, L.; Wang, X.; Zhang, H.; Li, J. Evolution behavior of carbides in 2.25Cr-1Mo-0.25V steel. Mater. Trans. 2009, 50, 2507–2511. [Google Scholar]
Figure 1.
Micrographs showing the morphology of model A steel: (a) experimental dilatometer curve of simulated surface cooling rate (200 °C/min at 930 °C) in the 300 mm thick wall steel; (b) experimental dilatometer curve of simulated center cooling rate (20 °C/min at 930 °C) in the 300 mm thick wall steel; (c) optical microscopy (OM) image of specimen cooled at 200 °C/min at 930 °C; (d) OM image of specimen cooled at 20 °C/min at 930 °C.

Figure 2.
Schematic of continuous cooling transformation (CCT) diagrams for steel calculated from the JMatPro software: (a) composition of model A; (b) prediction composition of advanced steel.
Figure 2.
Schematic of continuous cooling transformation (CCT) diagrams for steel calculated from the JMatPro software: (a) composition of model A; (b) prediction composition of advanced steel.

Figure 3.
The effect of C addition (0.1–0.15%) on the ferrite continuous cooling transformation (CCT) curve of the model A alloy using material data from JMatPro software: (a) CCT curves with varied C additions; (b) change in the amount of ferrite nose time for varied C additions.
Figure 3.
The effect of C addition (0.1–0.15%) on the ferrite continuous cooling transformation (CCT) curve of the model A alloy using material data from JMatPro software: (a) CCT curves with varied C additions; (b) change in the amount of ferrite nose time for varied C additions.
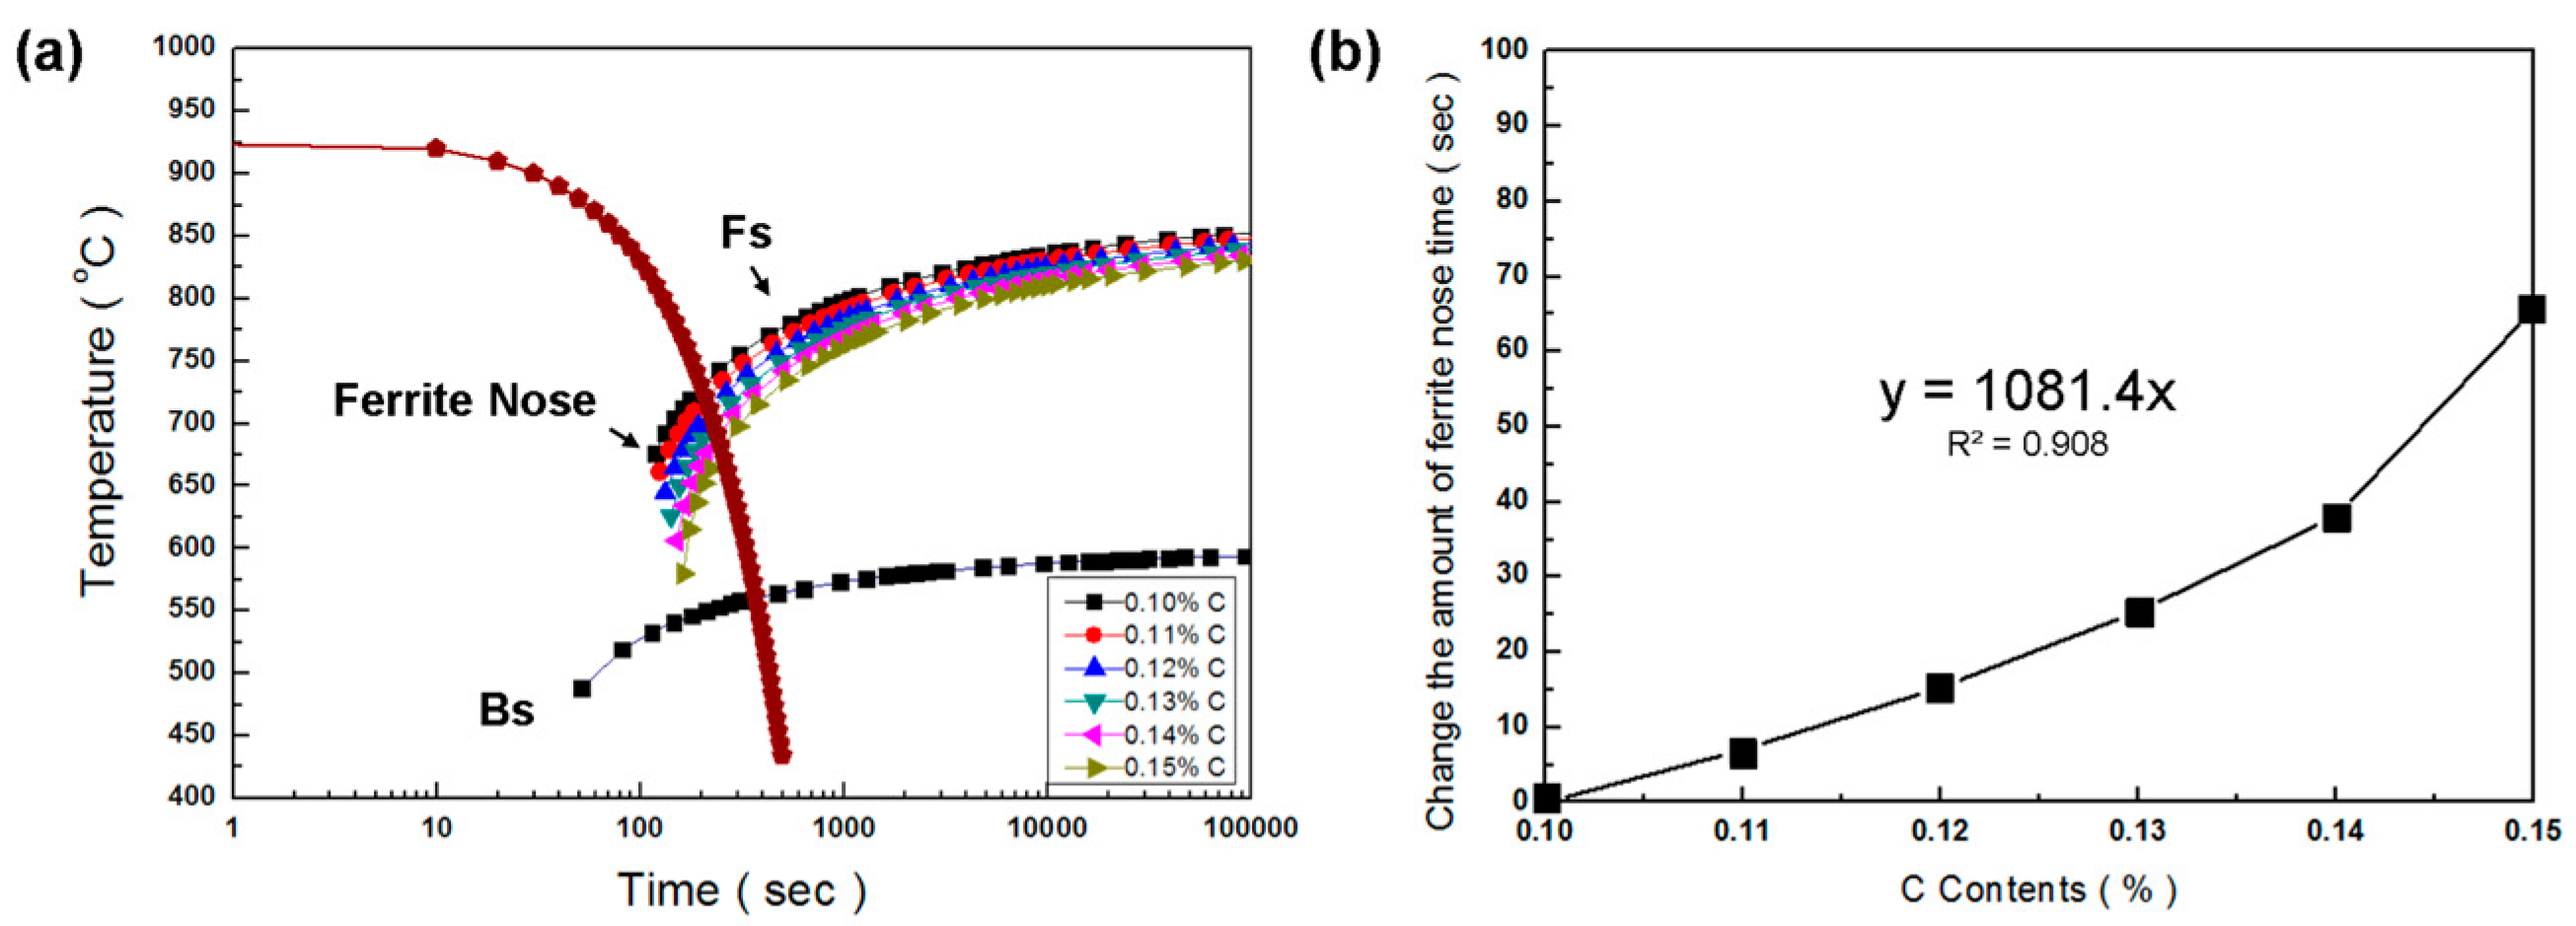
Figure 4.
The effects of elemental additions on the ferrite continuous cooling transformation (CCT) curve of the model A alloy using material data from JMatPro software: (a) added Cr between 1.0% and 1.3%; (b) added Mn between 0.3% and 0.8%; (c) added Si between 0.5% and 0.9%; (d) added Ni between 0% and 0.2%; (e) added Mo between 0.5% and 0.7%; (f) added Nb between 0% and 0.05%; (g) added Ti between 0% and 0.05%.
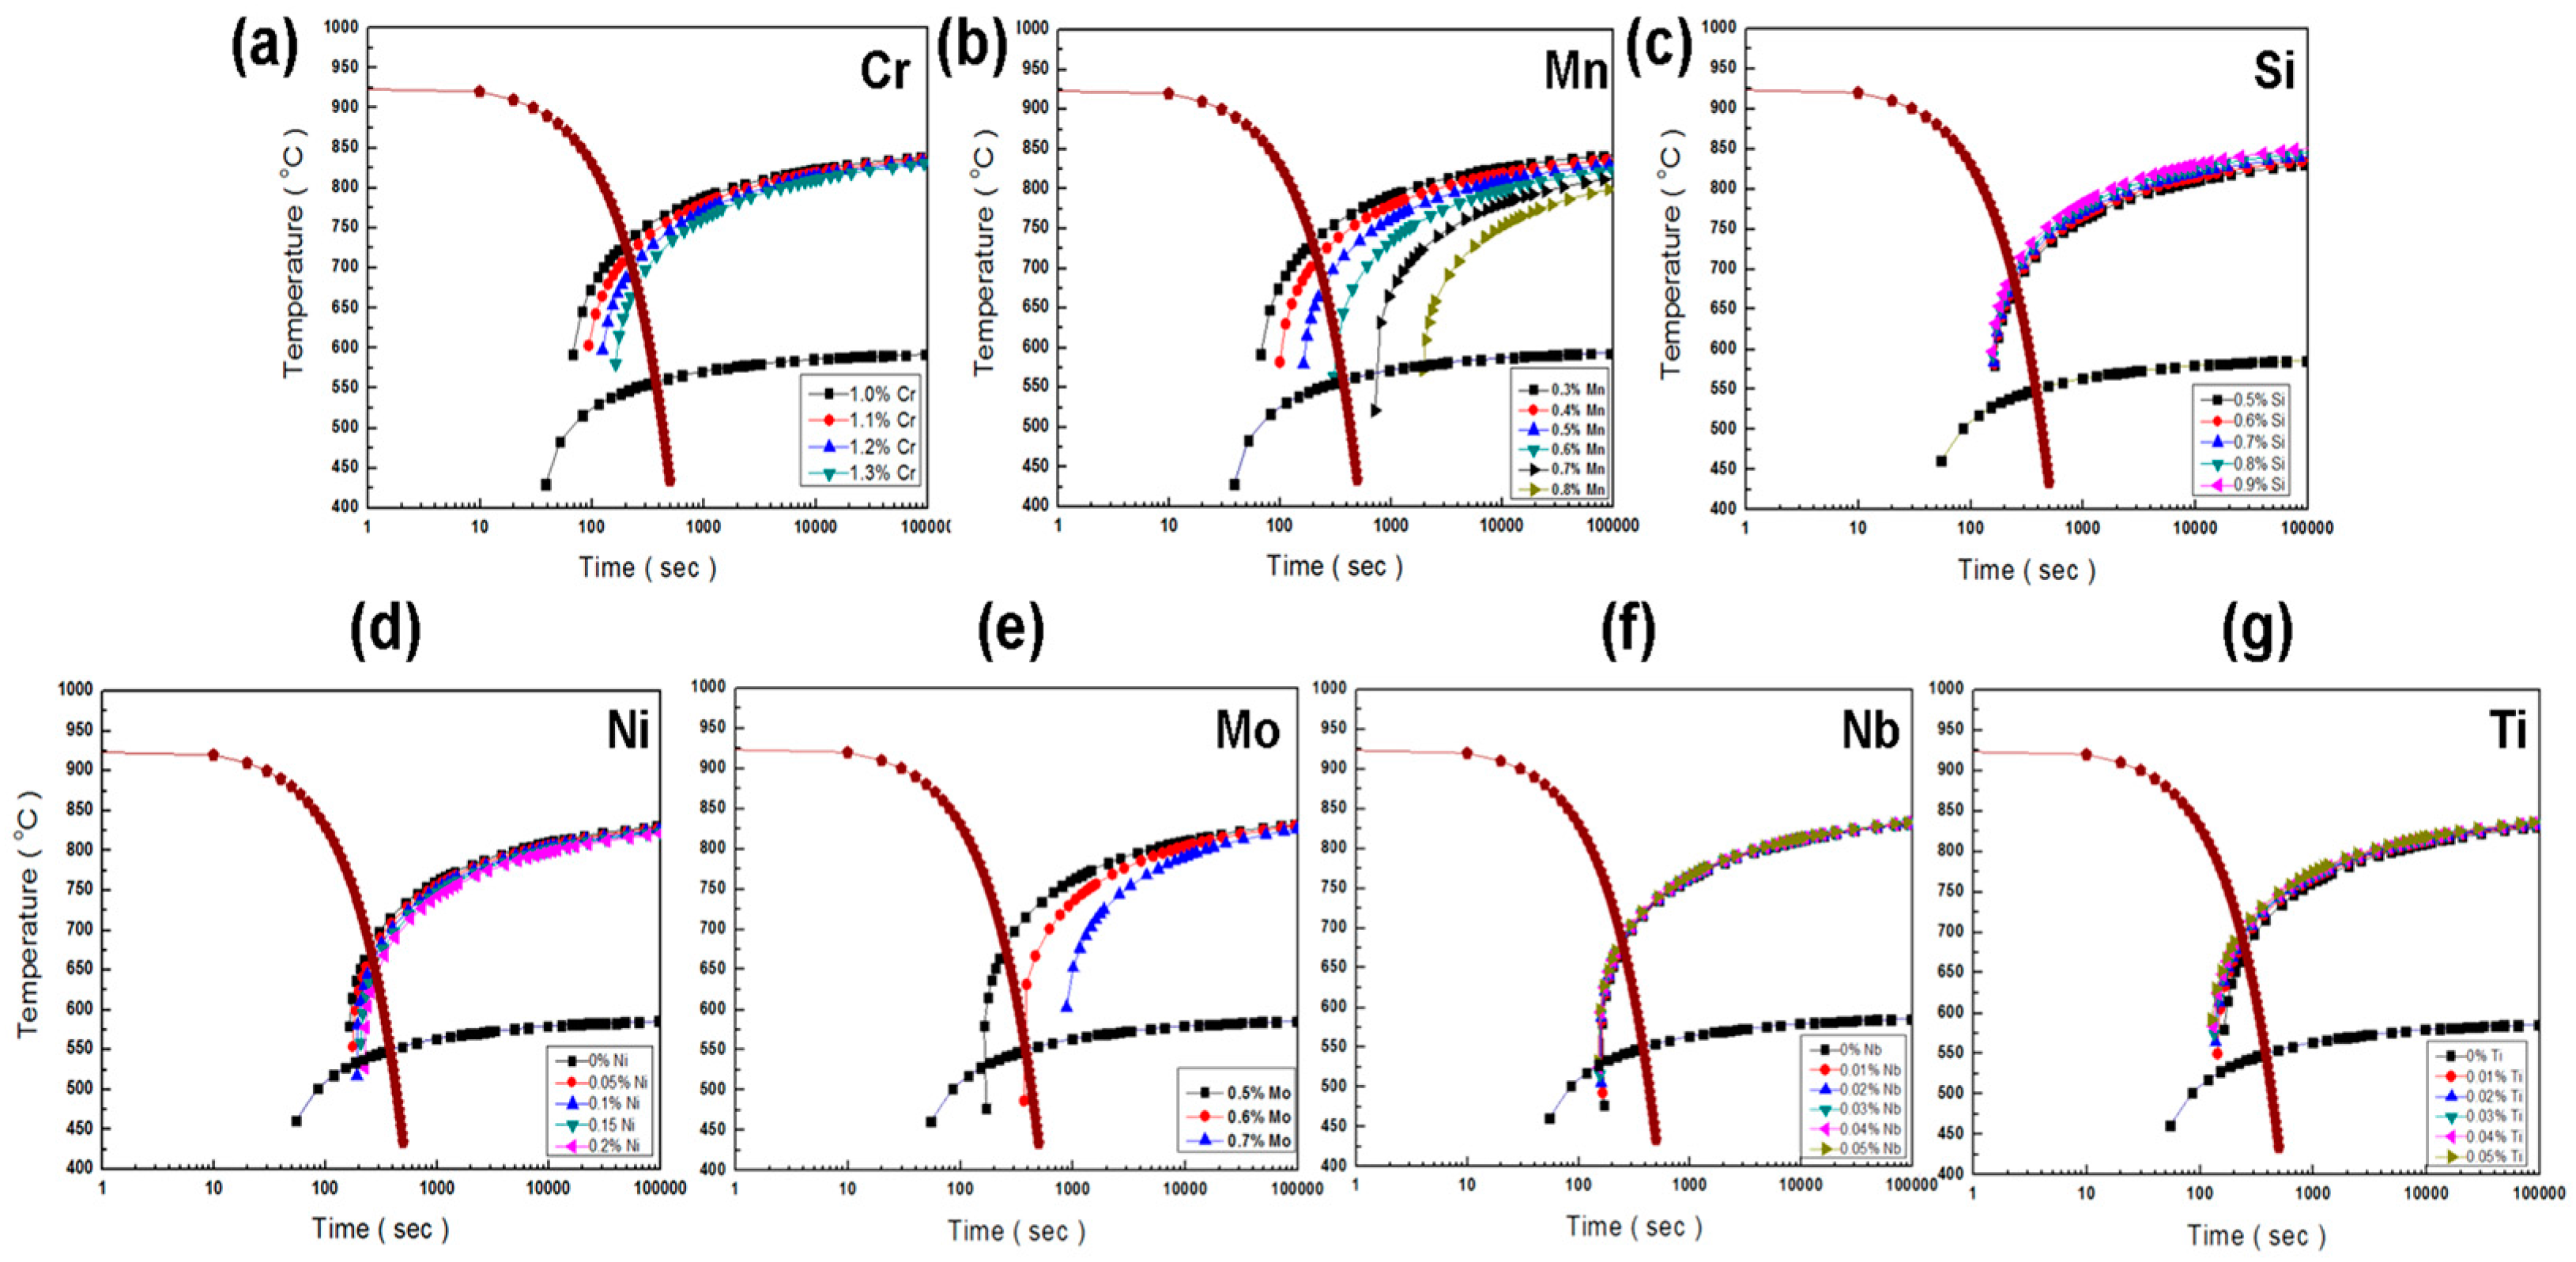
Figure 5.
Effects of alloying element additions on the ferrite nose time of the alloys, simulated using JMatPro: (a) added Cr between 1.0% and 1.3%; (b) added Mn between 0.3% and 0.8%; (c) added Si between 0.5% and 0.9%; (d) added Ni between 0% and 0.2%; (e) added Mo between 0.5% and 0.7%; (f) added Nb between 0% and 0.05%; (g) added Ti between 0% and 0.05%.

Figure 6.
Effects of alloying elements on the ferrite nose time for the model A alloy.

Figure 7.
(a) Effect of Nb addition between 0% and 0.05%; (b) effect of Ti addition between 0% and 0.1% on the transformation lines of model A + (element) phase diagrams.
Figure 7.
(a) Effect of Nb addition between 0% and 0.05%; (b) effect of Ti addition between 0% and 0.1% on the transformation lines of model A + (element) phase diagrams.

Figure 8.
Calculated phase composition and Gibbs energy of model A: (a) M23C6 on the model A phase diagram; (b) M7C3 on the model A phase diagram.
Figure 8.
Calculated phase composition and Gibbs energy of model A: (a) M23C6 on the model A phase diagram; (b) M7C3 on the model A phase diagram.
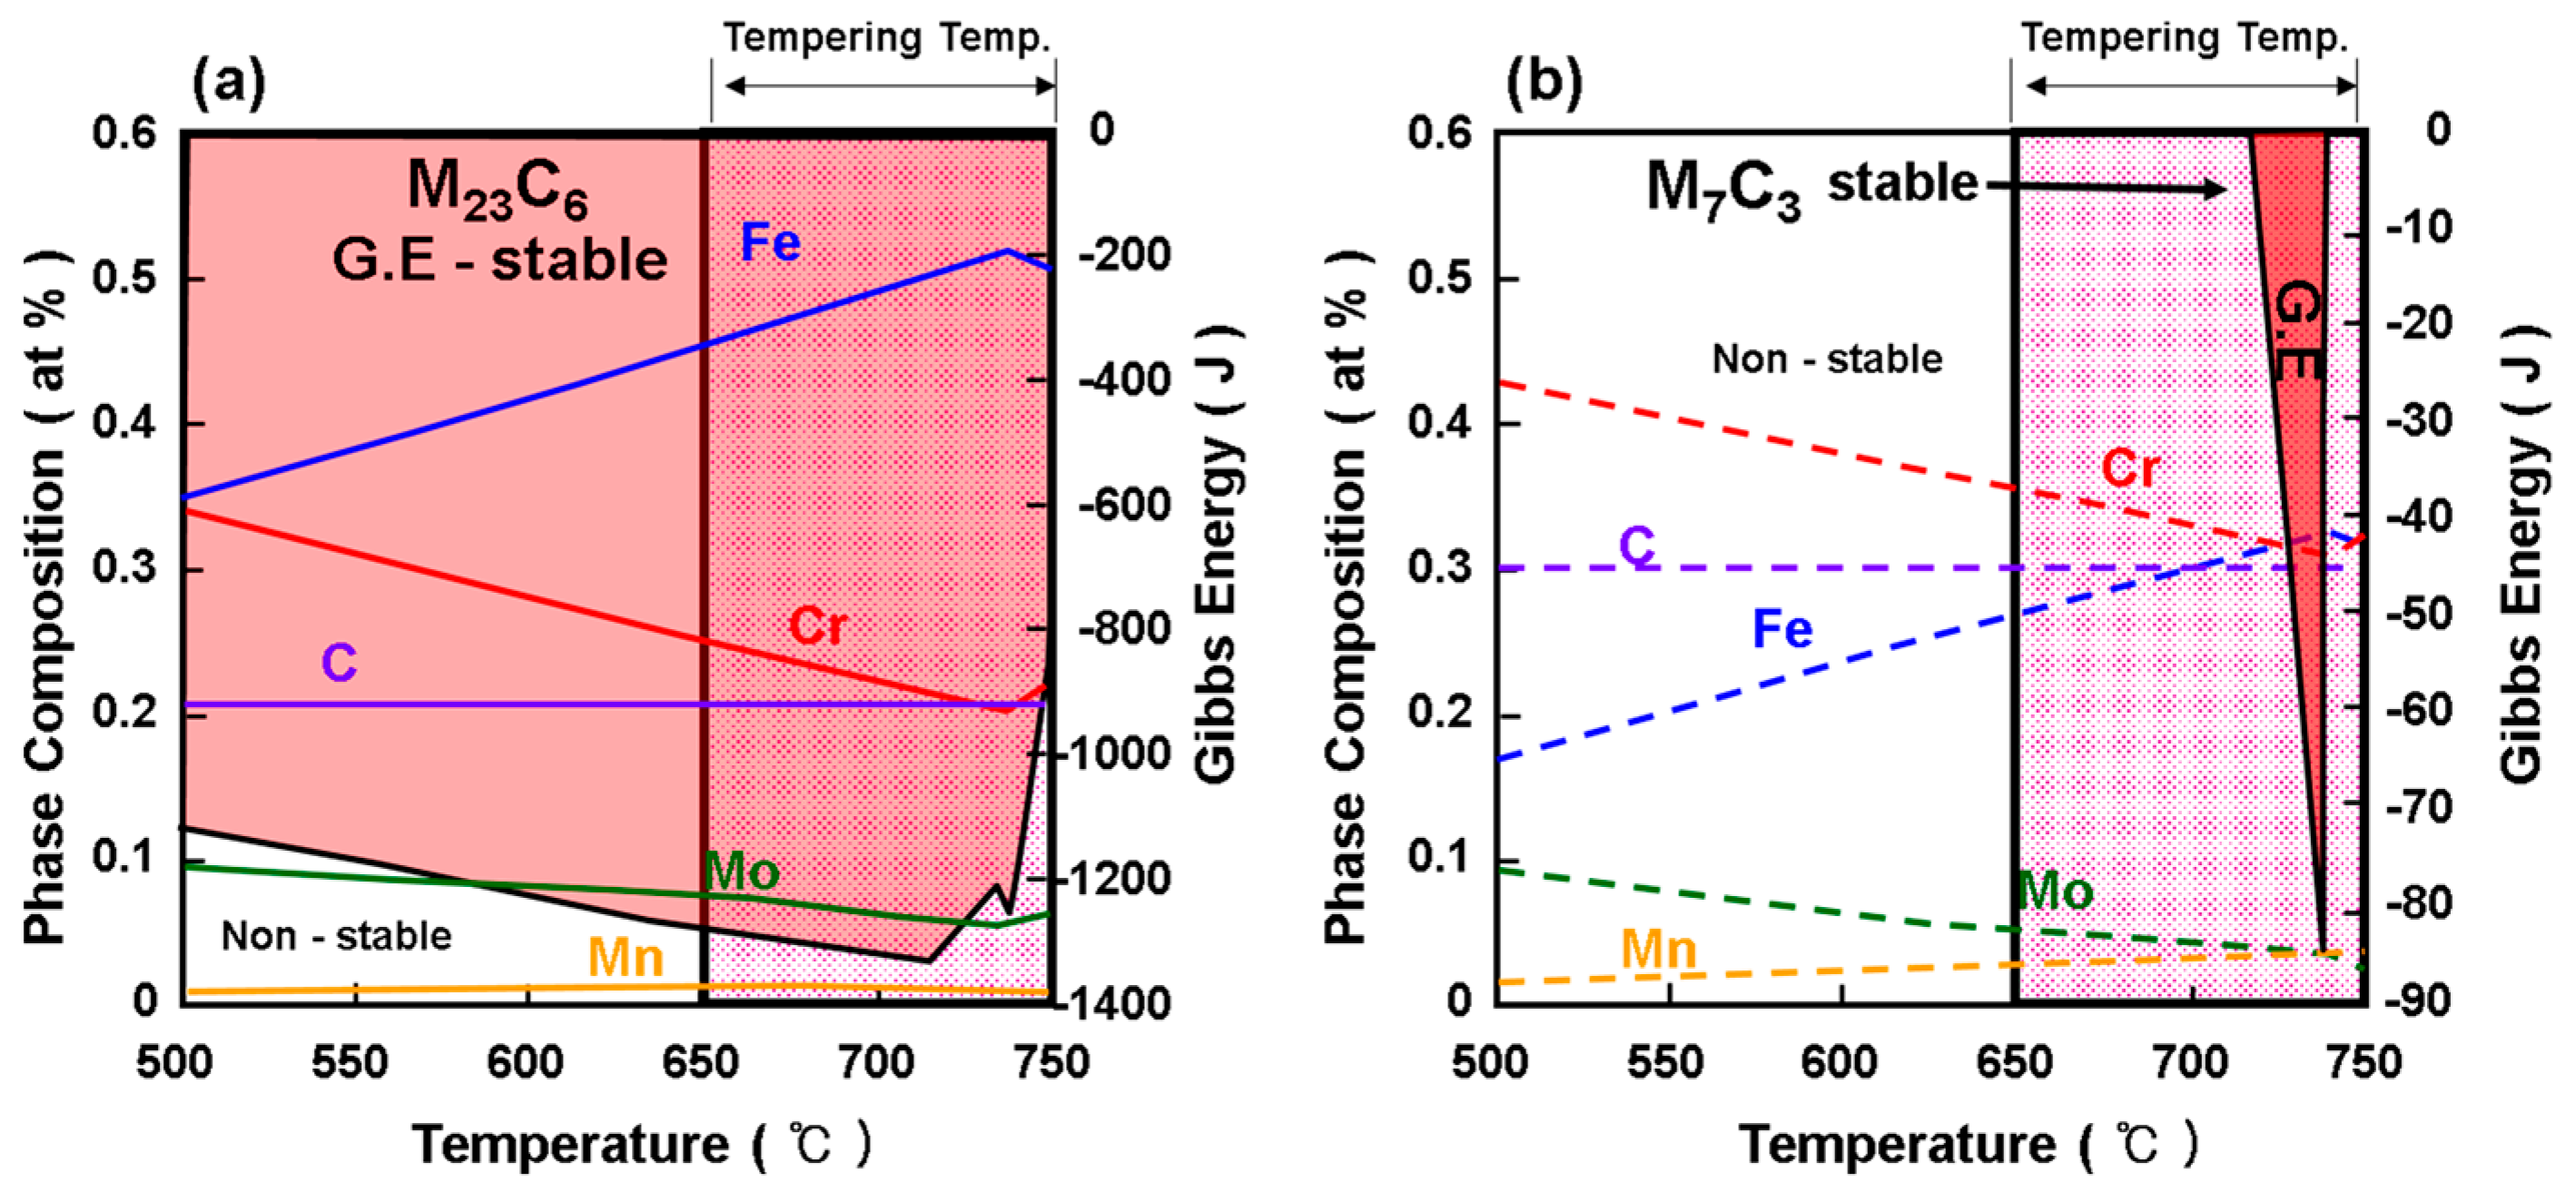
Figure 9.
Phase diagrams calculated by Thermo-Calc: (a) comparison of the effects of the addition of 0.15–0.13% C and 0–1.0% Mn; (b) comparison of the effects of the addition of 0.14–0.13% C, 0–1.0% Mn, 0.03% Nb, and 0.015% Ti.
Figure 9.
Phase diagrams calculated by Thermo-Calc: (a) comparison of the effects of the addition of 0.15–0.13% C and 0–1.0% Mn; (b) comparison of the effects of the addition of 0.14–0.13% C, 0–1.0% Mn, 0.03% Nb, and 0.015% Ti.

Figure 10.
Continuous cooling transformation (CCT) curve of model A alloy and advanced alloy.
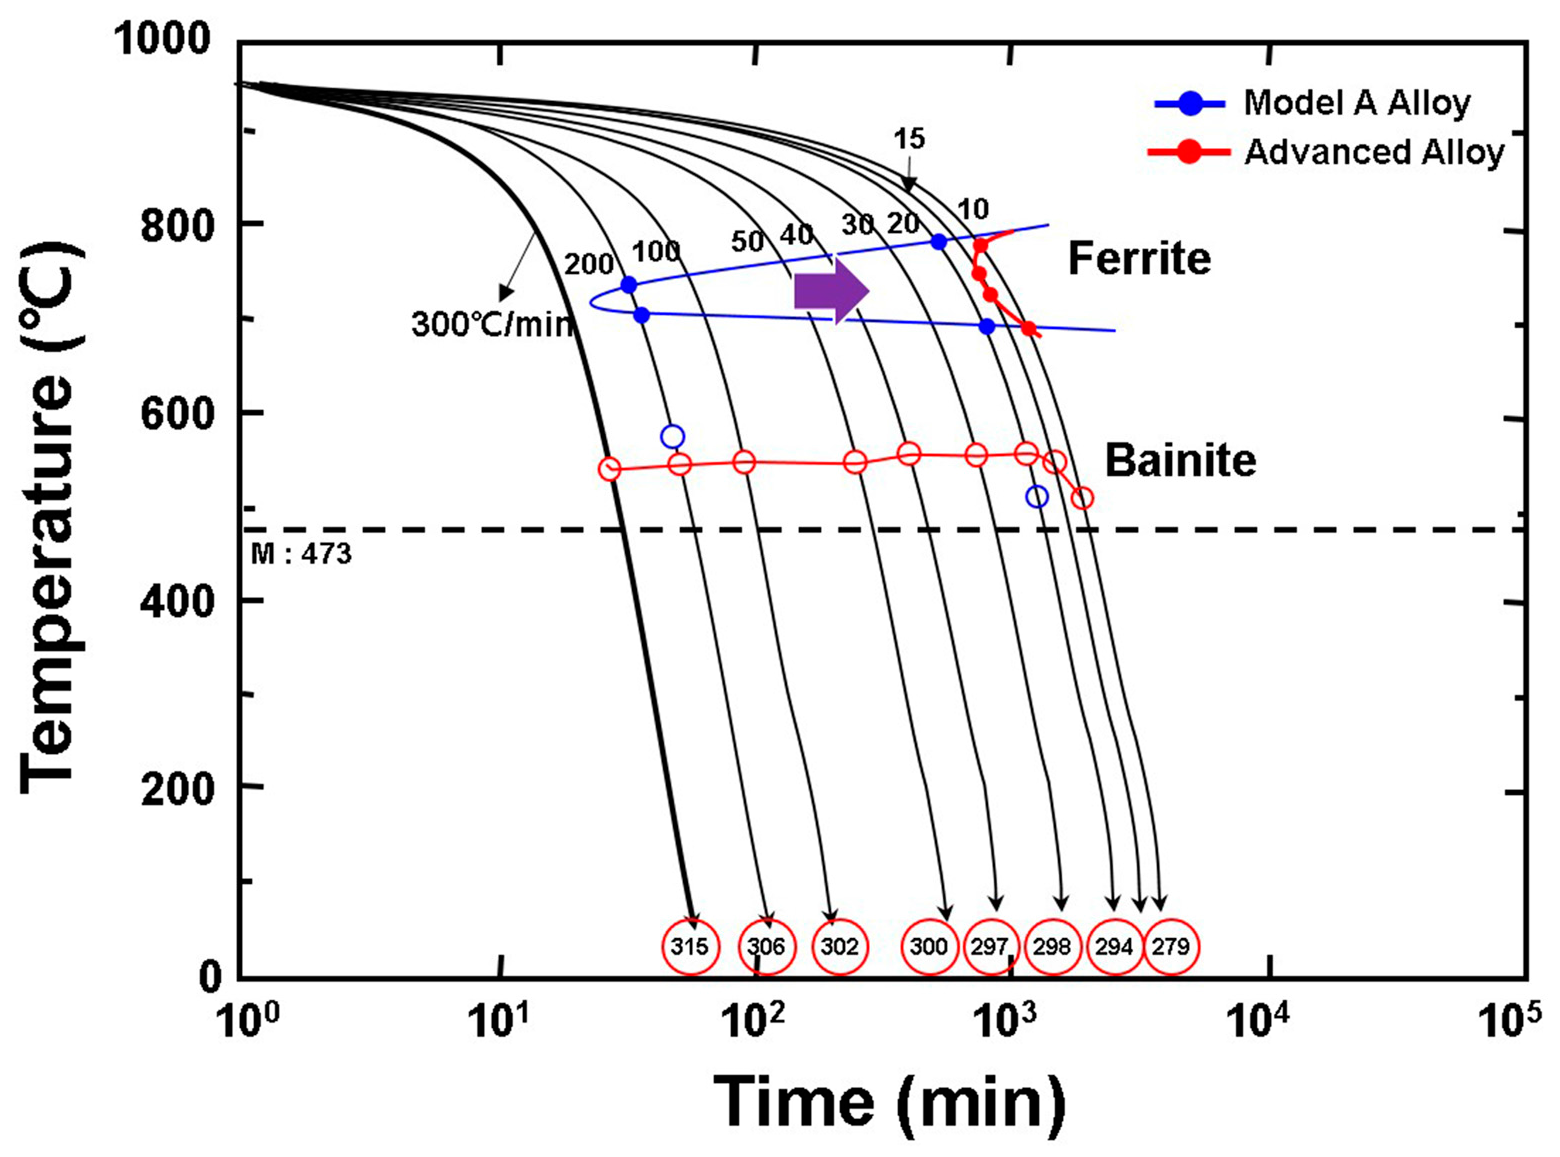
Figure 11.
Optical microscopy (OM) images showing the morphology of advanced alloy at cooling rates of (a) 300 °C/min, (b) 100 °C/min, (c) 50 °C/min, (d) 20 °C/min, (e) 15 °C/min, and (f) 10 °C/min.
Figure 11.
Optical microscopy (OM) images showing the morphology of advanced alloy at cooling rates of (a) 300 °C/min, (b) 100 °C/min, (c) 50 °C/min, (d) 20 °C/min, (e) 15 °C/min, and (f) 10 °C/min.

Figure 12.
Transmission electron microscopy (TEM) micrographs of C-containing phases in advanced alloy. (a) Image of M23C6 (FCC; zone axis of [001]); (b) image of MC (FCC; zone axis of [001]); (c,d) energy-dispersive X-ray (EDX) spectra from precipitates (a,b).
Figure 12.
Transmission electron microscopy (TEM) micrographs of C-containing phases in advanced alloy. (a) Image of M23C6 (FCC; zone axis of [001]); (b) image of MC (FCC; zone axis of [001]); (c,d) energy-dispersive X-ray (EDX) spectra from precipitates (a,b).


Table 1.
Chemical composition of Fe-C-Cr-Mo-Mn-Si model alloy used to study the effect of elements by JMatPro-Thermo-Calc simulation.
Table 1.
Chemical composition of Fe-C-Cr-Mo-Mn-Si model alloy used to study the effect of elements by JMatPro-Thermo-Calc simulation.
| Chemical Composition (wt %) | C | Cr | Mo | Mn | Si | Ni | Nb | Ti | Etc. |
|---|---|---|---|---|---|---|---|---|---|
| Model A | 0.15 | 1.3 | 0.5 | 0.5 | 0.5 | 0 | 0 | 0 | P: 0.004 S: 0.004 N: 0.005 |
| Addition range | 0.1–0.15 | 1.0–1.3 | 0.5–0.7 | 0.3–0.8 | 0.5–0.9 | 0–0.2 | 0–0.05 | 0–0.05 |
Table 2.
The effects of alloying element additions on the ferrite nose time of the alloys, simulated using JMatPro software.
Table 2.
The effects of alloying element additions on the ferrite nose time of the alloys, simulated using JMatPro software.
| Alloying | Range | Equation | R2 |
|---|---|---|---|
| C | (0.1–0.15) | y = 1081.4x | 0.908 |
| Cr | (1.0–1.3) | y = 304.88x | 0.9904 |
| Mo | (0.5–0.7) | y = 3228.3x | 0.9274 |
| Mn | (0.3–0.5) | y = 446.32x | 0.9589 |
| (0.6–0.8) | y = 8864.9x | 0.9153 | |
| Si | (0.5–0.9) | y = −18.283x | 0.9244 |
| Ni | (0–0.2) | y = 294.99x | 0.9951 |
| Nb | (0–0.05) | y = −166.15x | 0.9991 |
| Ti | (0–0.05) | y = −860.02x | 0.6789 |
Table 3.
Chemical composition and mechanical properties of selected alloys on the basis of the analysis performed.
Table 3.
Chemical composition and mechanical properties of selected alloys on the basis of the analysis performed.
| Chemical Composition | C | Mn | Si | Cr | Mo | Ni | Nb | Ti | |
|---|---|---|---|---|---|---|---|---|---|
| ASME Spec.* | 0.10–0.20 | 0.30–0.80 | 0.50–1.00 | 1.00–1.50 | 0.45–0.65 | <0.20 | <0.07 | <0.05 | |
| Advanced Alloy | 0.15 | 0.6 | 0.5 | 1.3 | 0.5 | 0.18 | 0.03 | 0.015 | |
Specification
| Advanced alloy
| ||||||||
* ASME Spec. (Specifications of the American Society of Mechanical Engineers).
© 2018 by the authors. Licensee MDPI, Basel, Switzerland. This article is an open access article distributed under the terms and conditions of the Creative Commons Attribution (CC BY) license (http://creativecommons.org/licenses/by/4.0/).
Share and Cite
MDPI and ACS Style
Na, H.-s.; Kim, B.-h.; Lee, S.-h.; Kang, C.-y. Thermodynamic Alloy Design of High Strength and Toughness in 300 mm Thick Pressure Vessel Wall of 1.25Cr-0.5Mo Steel. Metals 2018, 8, 70. https://doi.org/10.3390/met8010070
AMA Style
Na H-s, Kim B-h, Lee S-h, Kang C-y. Thermodynamic Alloy Design of High Strength and Toughness in 300 mm Thick Pressure Vessel Wall of 1.25Cr-0.5Mo Steel. Metals. 2018; 8(1):70. https://doi.org/10.3390/met8010070
Chicago/Turabian StyleNa, Hye-sung, Byung-hoon Kim, Sang-hoon Lee, and Chung-yun Kang. 2018. "Thermodynamic Alloy Design of High Strength and Toughness in 300 mm Thick Pressure Vessel Wall of 1.25Cr-0.5Mo Steel" Metals 8, no. 1: 70. https://doi.org/10.3390/met8010070
Note that from the first issue of 2016, this journal uses article numbers instead of page numbers. See further details here.