Generation of a Layer of Severe Plastic Deformation near Friction Surfaces in Upsetting of Steel Specimens


1
School of Mechanical Engineering and Automation, Beihang University, No. 37 Xueyuan Road, Beijing 100191, China
2
Institute for Problems in Mechanics, Russian Academy of Sciences, 101-1 Prospect Vernadskogo, Moscow 119526, Russia
3
University of Novi Sad Faculty of Technical Sciences Trg Dositeja Obradovica 6, 21000 Novi Sad, Serbia
*
Author to whom correspondence should be addressed.
Metals 2018, 8(1), 71; https://doi.org/10.3390/met8010071
Submission received: 30 November 2017
/
Revised: 1 January 2018
/
Accepted: 11 January 2018
/
Published: 19 January 2018
(This article belongs to the Special Issue Advances in Plastic Forming of Metals)
Abstract
:Narrow layers of severe plastic deformation are often generated near frictional interfaces in deformation processes as a result of shear deformation caused by friction. This results in material behavior that is very different from that encountered in conventional tests. To develop models capable of predicting the behavior of material near frictional surfaces, it is necessary to design and carry out tests that account for typical features of deformation processes in a narrow sub-surface layer. In the present paper, upsetting of steel specimens between conical and flat dies is used as such a test. The objective of the paper is to correlate the thickness of the layer of severe plastic deformation generated near the friction surface and the die angle using a new criterion for determining the boundary between the layer of severe plastic deformation and the bulk.
1. Introduction
The interface between tool and workpiece in metal forming processes is crucial to both friction and heat transfer [1]. As a result, this interface controls the evolution of microstructure during the process of deformation. In particular, narrow layers of severe plastic deformation are often generated in the vicinity of frictional interfaces in metal forming processes. A complete review of results related to the generation of such layers and published before 1987 has been presented in [2]. In recent years there has been considerable interest in studying material behavior in the vicinity of frictional interfaces in deformation processes [3,4,5,6,7,8,9]. One reason for that is that the narrow sub-surface layers affect the performance of structures and machine parts under service conditions [10,11,12,13]. Physical properties of these layers can be improved by appropriate heat treatment [14]. To this end, however, a method of predicting these properties after metal forming processes is required. The conditions under which the material is being deformed within the sub-surface layer are completely different from that encountered in conventional material tests. Therefore, the latter cannot be used to determine the flow stress and other constitutive equations within the layer [15]. As a consequence, numerical methods cannot be used for studying metal forming processes in which a layer of severe plastic deformation is generated near frictional interfaces. For example, attempts to model actual high strain gradients in the vicinity of friction surfaces with traditional finite elements have had difficulty representing such gradients [16]. A possible way to overcome this difficulty is to develop a theory that takes into account that the thickness of the layer of severe plastic deformation is very small as compared with other dimensions that classify the workpiece. The conceptual approach here might be somehow similar to that used in the mechanics of cracks (see, for example, [17]). In the latter, linear elastic solutions are supposed to be valid everywhere including the vicinity of crack tips where stresses found from these solutions approach infinity. Then, the stress intensity factor is used instead of stresses to describe physical processes in a small region near crack tips. If a conceptually similar approach were developed for predicting the evolution of material properties near frictional interfaces in metal forming processes then a rigid perfectly plastic solid would play the role of linear elasticity in the mechanics of cracks [18]. In particular, in the case of rigid perfectly plastic solids the equivalent strain rate approaches infinity in the vicinity of maximum friction surfaces and its magnitude in a narrow region near the surface is controlled by the strain rate intensity factor [19]. It is therefore reasonable to assume that the strain rate intensity factor controls the evolution of material properties in the sub-surface layer. Such theories have been proposed in [8,20,21]. For a further development of these theories it is necessary to collect more data from independent experiments to correlate the strain rate intensity factor and properties of the sub-surface layer. Such experiments should be designed rather than chosen according to common practice. In the present paper, upsetting of hollow cylinders between conical and flat dies is used to generate a layer of severe plastic deformation in the vicinity of the frictional interface.
2. Upsetting Test
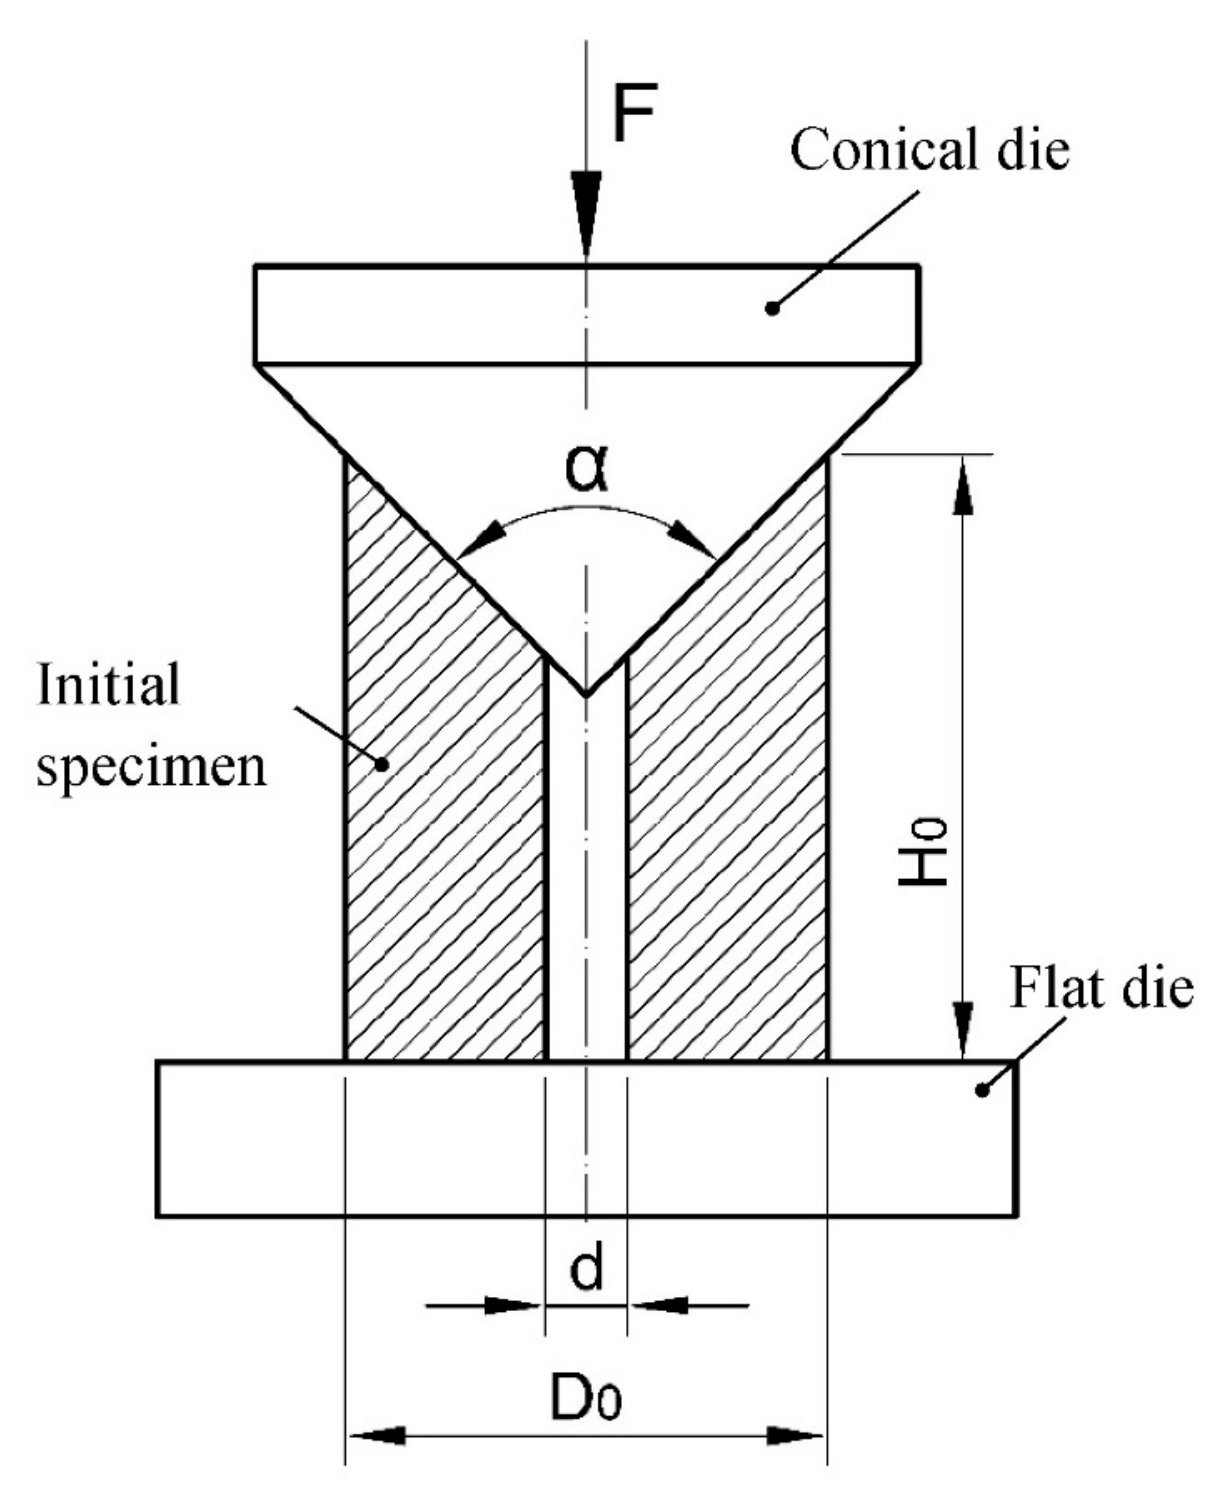
Upsetting between flat and conical dies is used to generate a layer of severe plastic deformation in the vicinity of the frictional interface between the conical die and workpiece. No lubricant is used on the surface of the conical die to increase friction and, as a result, to get a more pronounced layer of severe plastic deformation. On the other hand, the surface of the flat die is treated to minimize friction. In particular, this surface is lubricated by mineral oil for cold forging. A schematic diagram of the experimental setup is shown in Figure 1.
It is seen from this figure that one end of the specimen exactly fits the conical die at the initial instant. Because of this design of specimens, the layer of severe plastic deformation starts to generate over the entire friction surface at the initial instant. The only design parameter adopted in the present study is the die angle α (Figure 1). In particular, three dies with α = 60 deg, α = 90 deg, and α = 120 deg are used. Parameters H0, D0 and d are fixed. In particular, H0 = 35 mm, D0 = 32 mm and d = 5 mm. The specimens are made of normalized C45E steel. Its nominal chemical composition is shown in Table 1. The initial microstructure is uniform over the volume of specimens. The initial microstructure is illustrated in Figure 2. Three nominally identical specimens are tested using each type of the conical die. Upsetting is conducted on a hydraulic press. As an illustration, the α = 60 deg die, an initial specimen and the specimen after upsetting are shown in Figure 3.
3. Metallographic Observations near the Friction Surface
A standard technique (mechanical grinding and polishing, followed by etching with 3% nital) is used to prepare samples for metallographic studies. The surface of samples is examined with a scanning electron microscope (SEM) JSM 6440LV, produced by JEOL (Tokyo, Japan), operated at 25 KV. The initial microstructure (Figure 2) is classified by the average equivalent circular diameters of pearlite colonies and ferrite grains. Those are 20 μm and 13.5 μm, respectively. Each of these average values is found based on 100 measurements with the use of an ImageJ image analyzer. The microstructure of specimens after upsetting is studied in the vicinity of the friction surface between the conical die and workpiece. It will be seen later that the distribution of microstructure is highly non-uniform in the direction normal to the friction surface. In particular, a narrow layer of severe plastic deformation is generated near the friction surface. The present study focuses on the variation of the thickness of this layer along the intersection of the friction surface and a generic meridian plane and on the dependence of this variation on the angle α. In order to determine the thickness of the layer of severe plastic deformation, it is necessary to have a criterion that identifies severe plastic deformation. It is evident that it is impossible to introduce such a criterion in an unambiguous way. This situation is similar to that in the mechanics of fluids where a criterion for the boundary layer thickness is required [22]. In the case under consideration, an appropriate criterion can be based on metallographic observations. As the deformation proceeds the shape of each ferrite grain in the vicinity of the friction surface changes such that lateral dimensions (the dimensions that are approximately parallel to the friction surface) quickly become large compared to the third dimension (the thickness of ferrite grains). The shape of ferrite grains at the end of upsetting with the α = 60 deg die is illustrated in Figure 4. The layer of severe plastic deformation is clearly seen in this figure. The suggested criterion for the thickness of this layer is that the thickness of ferrite grains in the layer is less or equal to 2 μm. The thickness of the layer determined according to this criterion is shown at 5 points. This method is used to determine the variation of the thickness of the layer of severe plastic deformation along the friction surface in all specimens after upsetting. In what follows, δ denotes the thickness of the layer of severe plastic deformation, S denotes the distance along the friction surface in a generic meridian plane and S = 0 corresponds to the outer surface of specimens (Figure 5).
It has been found that fracture occurs at S = Sf. The value of Sf depends on α. In particular, Sf = 40 mm (or about 75% of the total length) for α = 60 deg, Sf = 20 mm (or about 53% of the total length) for α = 90 deg and Sf = 25 mm (or about 80% of the total length) for α = 120 deg. The microstructure of the material in the vicinity of the point S = Sf is shown in Figure 6. The microstructure of the material within the layer of severe plastic deformation is illustrated at several values of S in the range 5 mm ≤ S < Sf in Figure 7 after upsetting with the α = 60 deg die, in Figure 8 after upsetting with the α =90 deg die and in Figure 9 after upsetting with the α = 120 deg die. The thickness of the layer of severe plastic deformation at these values of S has been determined as illustrated in Figure 4 for the α = 60 deg die. The measured values of δ and its average value for one specimen of each series are summarized in Table 2. In this table, R2 is defined as [23]
where R2 is coefficient of determination, SSr regression sum of squares, SSto total sum of squares and SSe error sum of square.
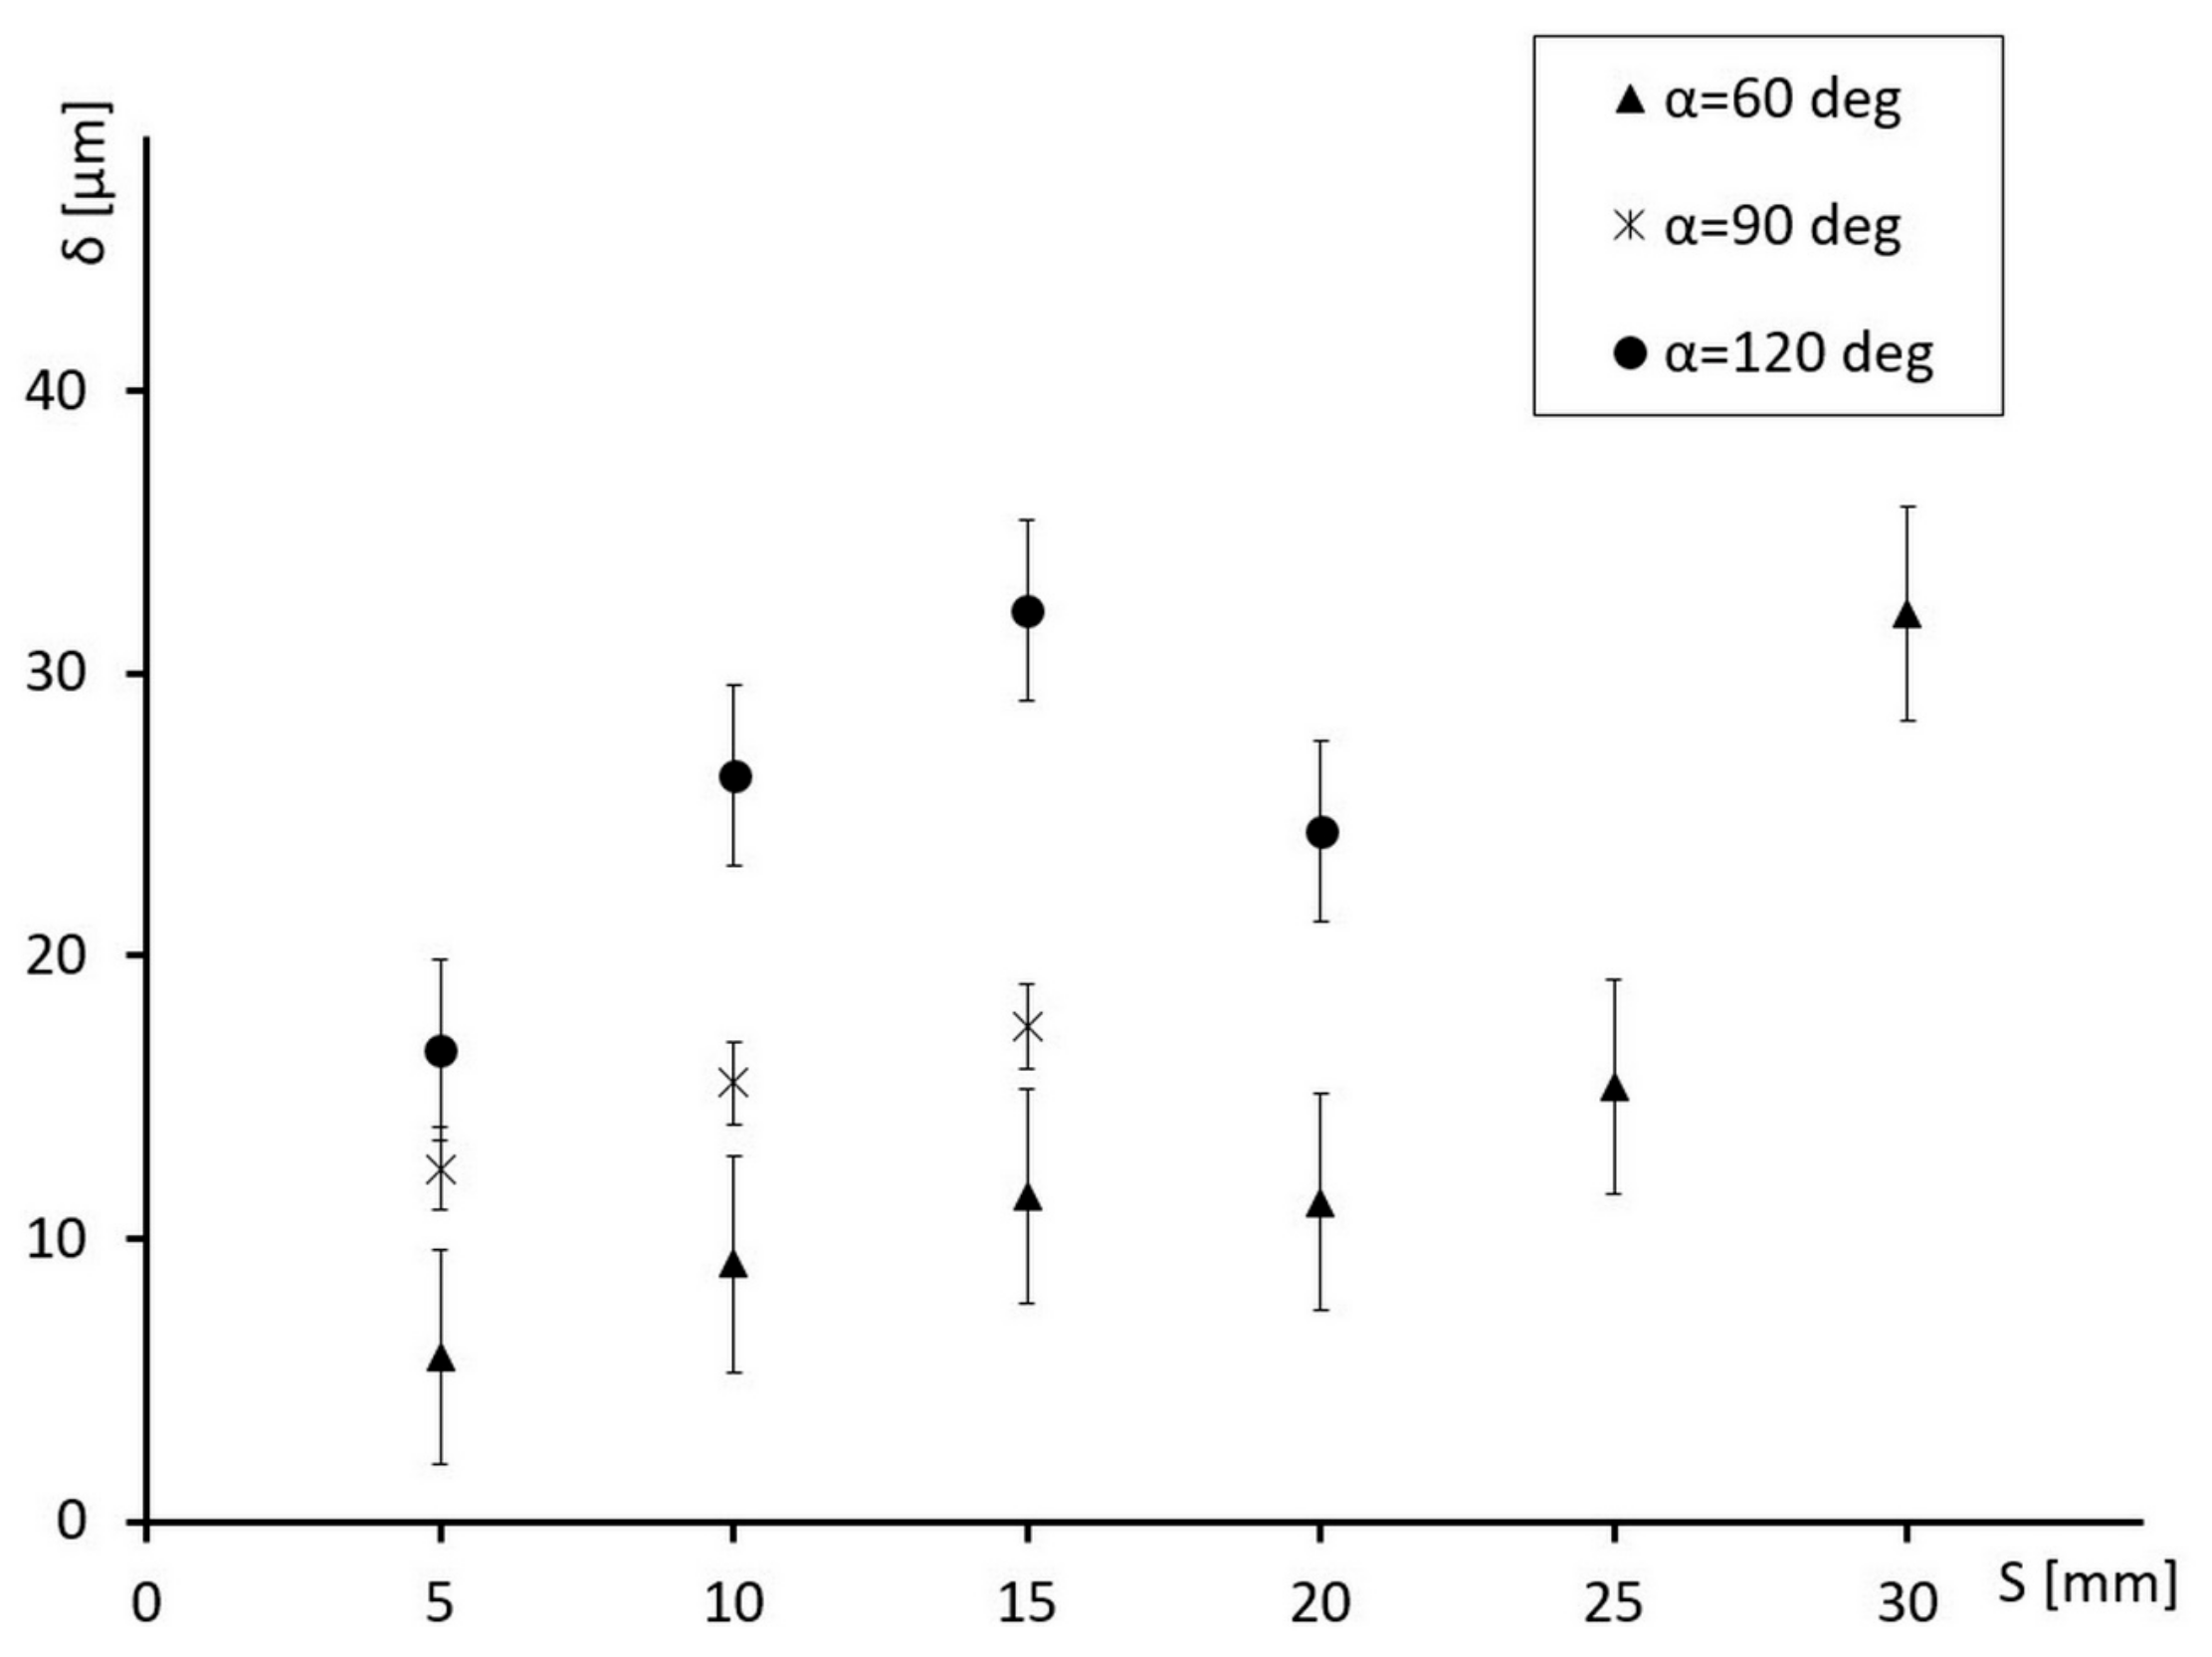
The variation of δ with S for all three series of specimens is depicted in Figure 10. The values of δ shown in this figure have been averaged over three specimens of each series.
4. Conclusions and Discussion
Upsetting of hollow cylinders between conical and flat dies has been conducted to generate a layer of severe plastic deformation in the vicinity of the friction interface between the conical die and workpiece. It is seen from Figure 7, Figure 8 and Figure 9 that the thickness of this layer depends on both α and S. Therefore, the test proposed can be used to reveal a possible correlation between this thickness and the strain rate intensity factor. This correlation is required for the development of the theories proposed in [8,20,21].
The tendencies in the behavior of the curves shown in Figure 10 are that the thickness of the layer of severe plastic deformation increases as both α and S increase. An exception is the thickness of this layer measured at S = 20 mm after upsetting with the α = 120 deg die. This deviation from the general trend can be explained by the existence of a dead region of the workpiece that sticks to the die. Upsetting between α = 120 deg and flat dies is rather similar to upsetting between two flat (i.e., α = 180 deg) dies. If friction is high enough, the radial velocity at the friction surfaces changes its sense between the outer and inner traction free surfaces in upsetting of disks between two flat dies [24]. Therefore, dead regions inevitably appear in upsetting of disks between two flat dies.
In addition to experimental data, the theories [8,20,21] require the theoretical value of the strain intensity factor. This factor is defined as [19]
as . Here is the equivalent strain rate (quadratic invariant of the strain ate tensor), D is the strain rate intensity factor, z is the normal distance to the maximum friction surface. It is seen from (1) that the gradient of the equivalent strain rate is very high in the vicinity of frictional interfaces and that the strain rate intensity factor controls the magnitude of the equivalent strain rate in a narrow layer near frictional interfaces. Since the equivalent strain rate is responsible for the evolution of material properties, this theoretical result is in qualitative agreement with the experimental results shown in Figure 4 and Figure 7, Figure 8 and Figure 9. However, it is also seen from (2) that the strain rate intensity factor is the coefficient of the singular term. Therefore, conventional finite element methods are not capable of determining the strain rate intensity factor [25]. In particular, using the commercial package ABAQUS an upsetting process has been analyzed in [26]. All the finite element analyses presented in this paper failed to converge in the case of the maximum friction law. Probably, the extended finite element method [27] can be used for this purpose. However, to the best of authors’ knowledge, no attempts have been made to determine the strain rate intensity factor by means of this method. To date the only accurate method for calculating the strain rate intensity factor is based on the method of characteristics [28]. However, its validity is restricted to plane strain problems. Therefore, there is an urgent need for the development of a numerical method for calculating the strain rate intensity factor in axisymmetric flow. Solutions found by this method might be used in conjunction with the experimental results shown in Figure 10 to provide necessary input for the theories proposed in [8,20,21].
Author Contributions
Sergei Alexandrov is responsible for the development of the general concept, Leposava Šidjanin is responsible for metallographic observation, Dragiša Vilotić is responsible for upsetting test, Dejan Movrin is responsible for conducting experimental research, and Lihui Lang is responsible for the interpretation of experimental results.
Conflicts of Interest
The authors declare no conflict of interests.
References
- Beynon, J.H. Tribology of hot metal forming. Tribol. Int. 1998, 31, 73–77. [Google Scholar] [CrossRef]
- Griffiths, B.J. Mechanisms of White Layer Generation with Reference to Machining and Deformation Processes. J. Tribol. 1987, 109, 525–530. [Google Scholar] [CrossRef]
- Kim, Y.-T.; Ikeda, K. Flow behavior of the billet surface layer in porthole die extrusion of aluminum. Metal. Mater. Trans. A 2000, 31, 1635–1643. [Google Scholar] [CrossRef]
- Hosoda, K.; Asakawa, M.; Kajino, S.; Maeda, Y. Effect of die semi-angle and multi-pass drawing on additional shear strain layer. Wire J. Int. 2008, 41, 68–73. [Google Scholar]
- Wideroe, F.; Welo, T. Conditions for Sticking Friction between Aluminium Alloy AA6060 and Tool Steel in Hot Forming. Key Eng. Mater. 2011, 491, 121–128. [Google Scholar] [CrossRef]
- Sanabria, V.; Müller, S.; Gall, S.; Reimers, W. Investigation of Friction Boundary Conditions during Extrusion of Aluminium and Magnesium Alloys. Key Eng. Mater. 2014, 611–612, 997–1004. [Google Scholar] [CrossRef]
- Sanabria, V.; Mueller, S.; Reimers, W. Microstructure Evolution of Friction Boundary Layer during Extrusion of AA 6060. Procedia Eng. 2014, 81, 586–591. [Google Scholar] [CrossRef]
- Alexandrov, S.; Jeng, Y.-R.; Hwang, Y.-M. Generation of a Fine Grain Layer in the Vicinity of Frictional Interfaces in Direct Extrusion of AZ31 Alloy. J. Manuf. Sci. Eng. 2015, 137. [Google Scholar] [CrossRef]
- Hwang, Y.-M.; Huang, T.-H.; Alexandrov, S. Manufacture of Gradient Microstructures of Magnesium Alloys Using Two-Stage Extrusion Dies. Steel Res. Int. 2015, 86, 956–961. [Google Scholar] [CrossRef]
- Griffiths, B.J.; Furze, D.C. Tribological Advantages of White Layers Produced by Machining. J. Tribol. 1987, 109, 338–342. [Google Scholar] [CrossRef]
- Warren, A.W.; Guo, Y.B. Numerical Investigation on the Effects of Machining-Induced White Layer during Rolling Contact. Tribol. Trans. 2005, 48, 436–441. [Google Scholar] [CrossRef]
- Kajino, S.; Asakawa, M. Effect of “additional shear strain layer” on tensile strength and microstructure of fine drawn wire. J. Mater. Process. Technol. 2006, 177, 704–708. [Google Scholar] [CrossRef]
- Choi, Y. Influence of a white layer on the performance of hard machined surfaces in rolling contact. J. Eng. Manuf. 2010, 224, 1207–1215. [Google Scholar] [CrossRef]
- Wu, X.; Yang, M.; Yuan, F.; Wu, G.; Wei, Y.; Huang, X.; Zhu, Y. Heterogeneous lamella structure unites ultrafine-grain strength with coarse-grain ductility. Proc. Natl. Acad. Sci. USA 2015, 112, 14501–14505. [Google Scholar] [CrossRef] [PubMed]
- Jaspers, S.P.F.C.; Dautzenberg, J.H. Material behaviour in metal cutting: Strains, strain rates and temperatures in chip formation. J. Mater. Process. Technol. 2002, 121, 123–135. [Google Scholar] [CrossRef]
- Appleby, E.J.; Lu, C.Y.; Rao, R.S.; Devenpeck, M.L.; Wright, P.K.; Richmond, O. Strip drawing: A theoretical-experimental comparison. Int. J. Mech. Sci. 1984, 26, 351–362. [Google Scholar] [CrossRef]
- Kanninen, M.F.; Popelar, C.H. Advanced Fracture Mechanics, 1st ed.; Oxford University Press: New York, NY, USA, 1985; ISBN 978-0195035322. [Google Scholar]
- Alexandrov, S. Interrelation between Constitutive Laws and Fracture in the Vicinity of Friction Surfaces. In Physical Aspects of Fracture; Bouchaud, E., Jeulin, D., Prioul, C., Roux, S., Eds.; Springer: Dordrecht, The Netherlands, 2001; pp. 179–190. ISBN 978-0-7923-7147-2. [Google Scholar]
- Alexandrov, S.; Richmond, O. Singular plastic flow fields near surfaces of maximum friction stress. Int. J. Non-Linear Mech. 2001, 36, 1–11. [Google Scholar] [CrossRef]
- Alexandrov, S.E.; Goldstein, R.V. On Constructing Constitutive Equations in Material Thin Layer Near Friction Surfaces in Material Forming Processes. Dokl. Phys. 2015, 60, 39–41. [Google Scholar] [CrossRef]
- Goldstein, R.V.; Alexandrov, S.E. An approach to prediction of microstructure formation near friction surfaces at large plastic strains. Phys. Mesomech. 2015, 18, 223–227. [Google Scholar] [CrossRef]
- Batchelor, G.K. An Introduction to Fluid Dynamics; Cambridge University Press: New York, NY, USA, 1999; ISBN 0-521-66396-2. [Google Scholar]
- Vining, G.G.; Kowalski, S. Statistical Method for Engineers; Cengage Learning: Boston, MA, USA, 2011; ISBN 978-0-S38-73S18-6. [Google Scholar]
- Male, A.T.; Cockcroft, M.G. A method for the determination of the coefficient of friction of metals under conditions of bulk plastic deformation. J. Inst. Met. 1964, 93, 38–46. [Google Scholar] [CrossRef]
- Facchinetti, M.; Miszuris, W. Analysis of the maximum friction condition for green body forming in an ANSYS environment. J. Eur. Ceram. Soc. 2016, 36, 2295–2302. [Google Scholar] [CrossRef]
- Chen, J.-S.; Pan, C.; Roque, C.M.O.L.; Wang, H.-P. A Lagrangian reproducing kernel particle method for metal forming analysis. Comput. Mech. 1998, 22, 289–307. [Google Scholar] [CrossRef]
- Fries, T.-P.; Belytschko, T. The extended/generalized finite element method: An overview of the method and its applications. Int. J. Numer. Methods Eng. 2010, 84, 253–304. [Google Scholar] [CrossRef]
- Alexandrov, S.; Kuo, C.-Y.; Jeng, Y.-R. A numerical method for determining the strain rate intensity factor under plane strain conditions. Contin. Mech. Thermodyn. 2016, 28, 977–992. [Google Scholar] [CrossRef]
Figure 1.
Experimental setup.

Figure 2.
Illustration of the initial microstructure of samples (the average equivalent diameters of pearlite colonies and ferrite grains are 20 µm and 13.5 µm respectively).
Figure 2.
Illustration of the initial microstructure of samples (the average equivalent diameters of pearlite colonies and ferrite grains are 20 µm and 13.5 µm respectively).
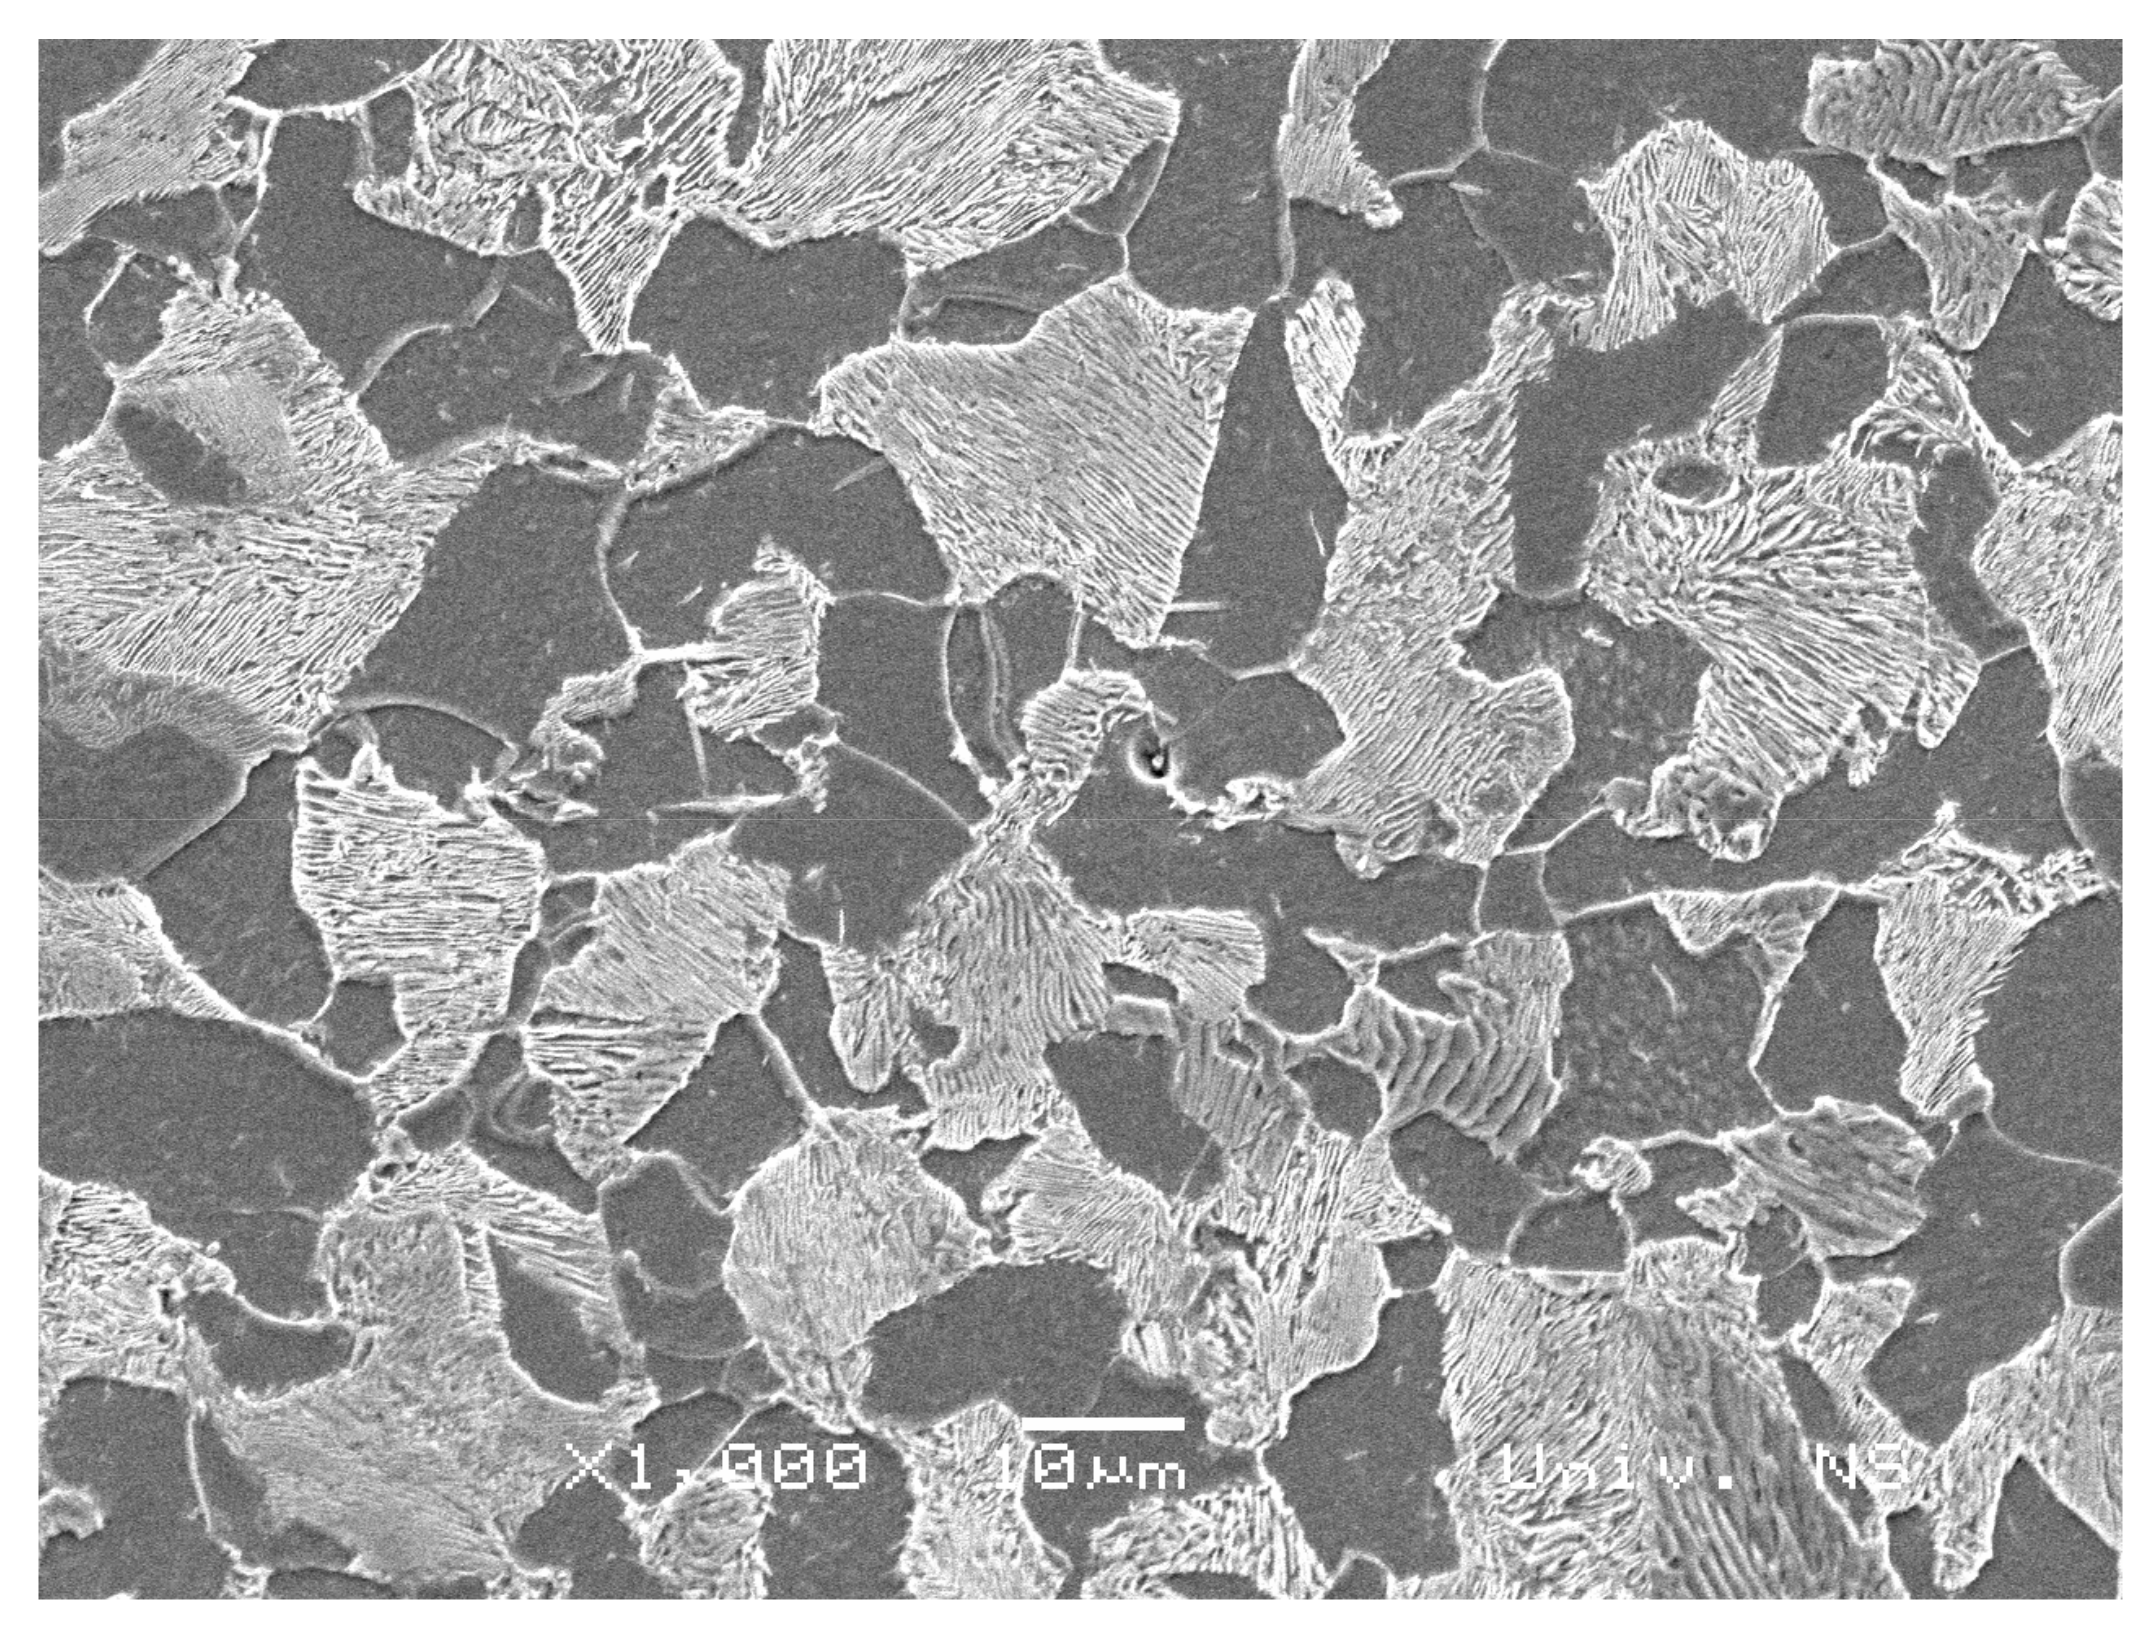
Figure 3.
Illustration of (a) α = 60 deg die, (b) initial specimen and (c) specimen after upsetting.
Figure 3.
Illustration of (a) α = 60 deg die, (b) initial specimen and (c) specimen after upsetting.
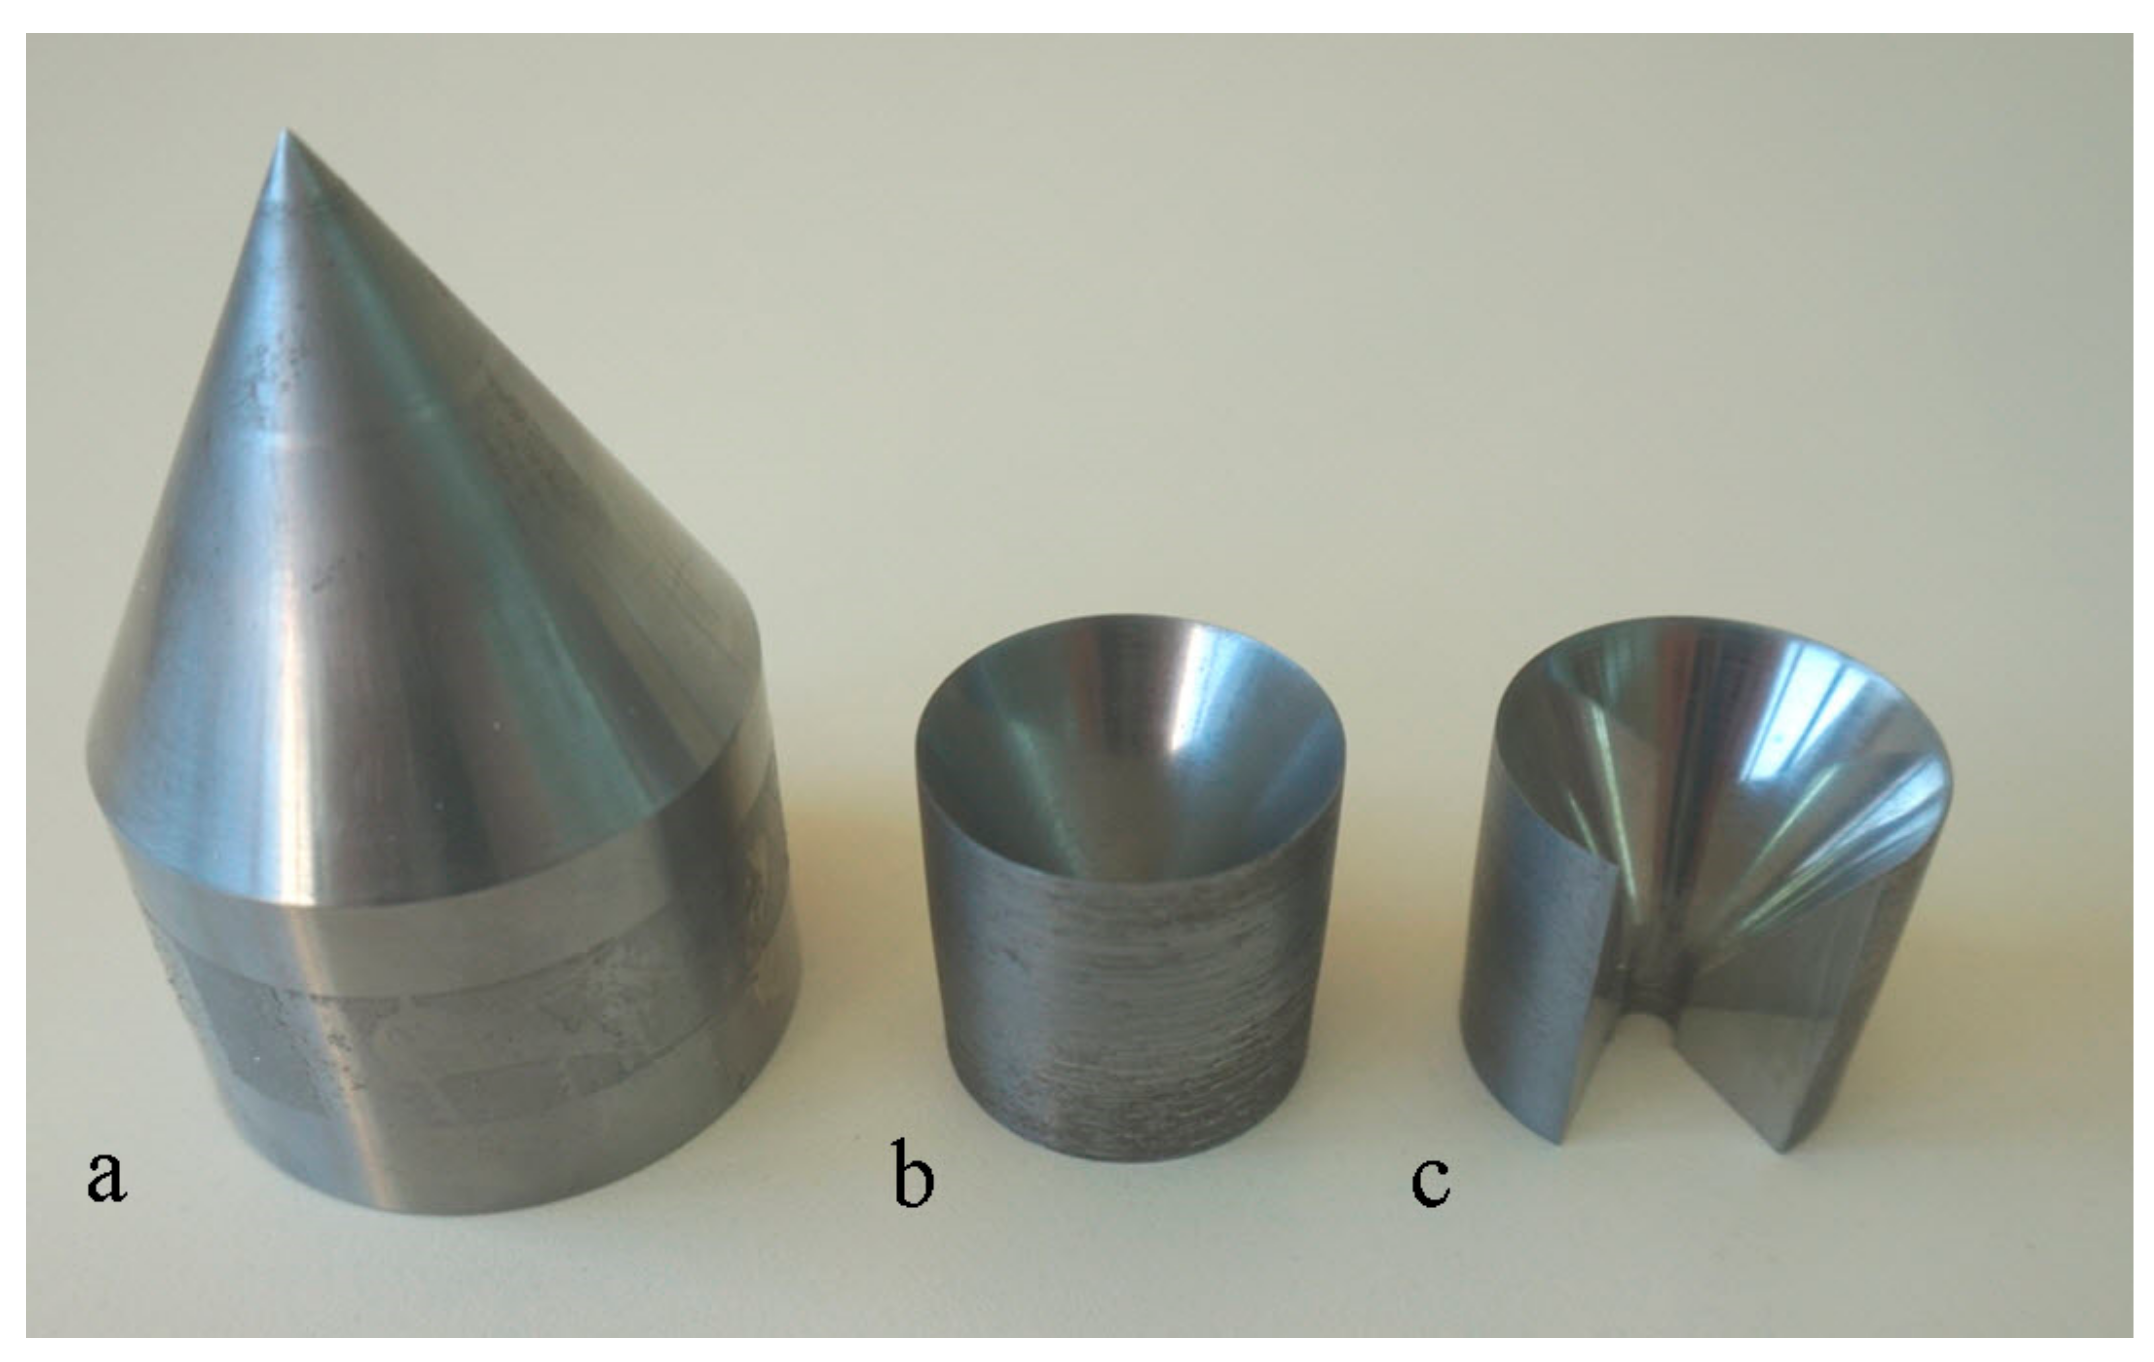
Figure 4.
Illustration of the method used to determine the thickness of the layer of severe plastic deformation near friction surfaces.
Figure 4.
Illustration of the method used to determine the thickness of the layer of severe plastic deformation near friction surfaces.
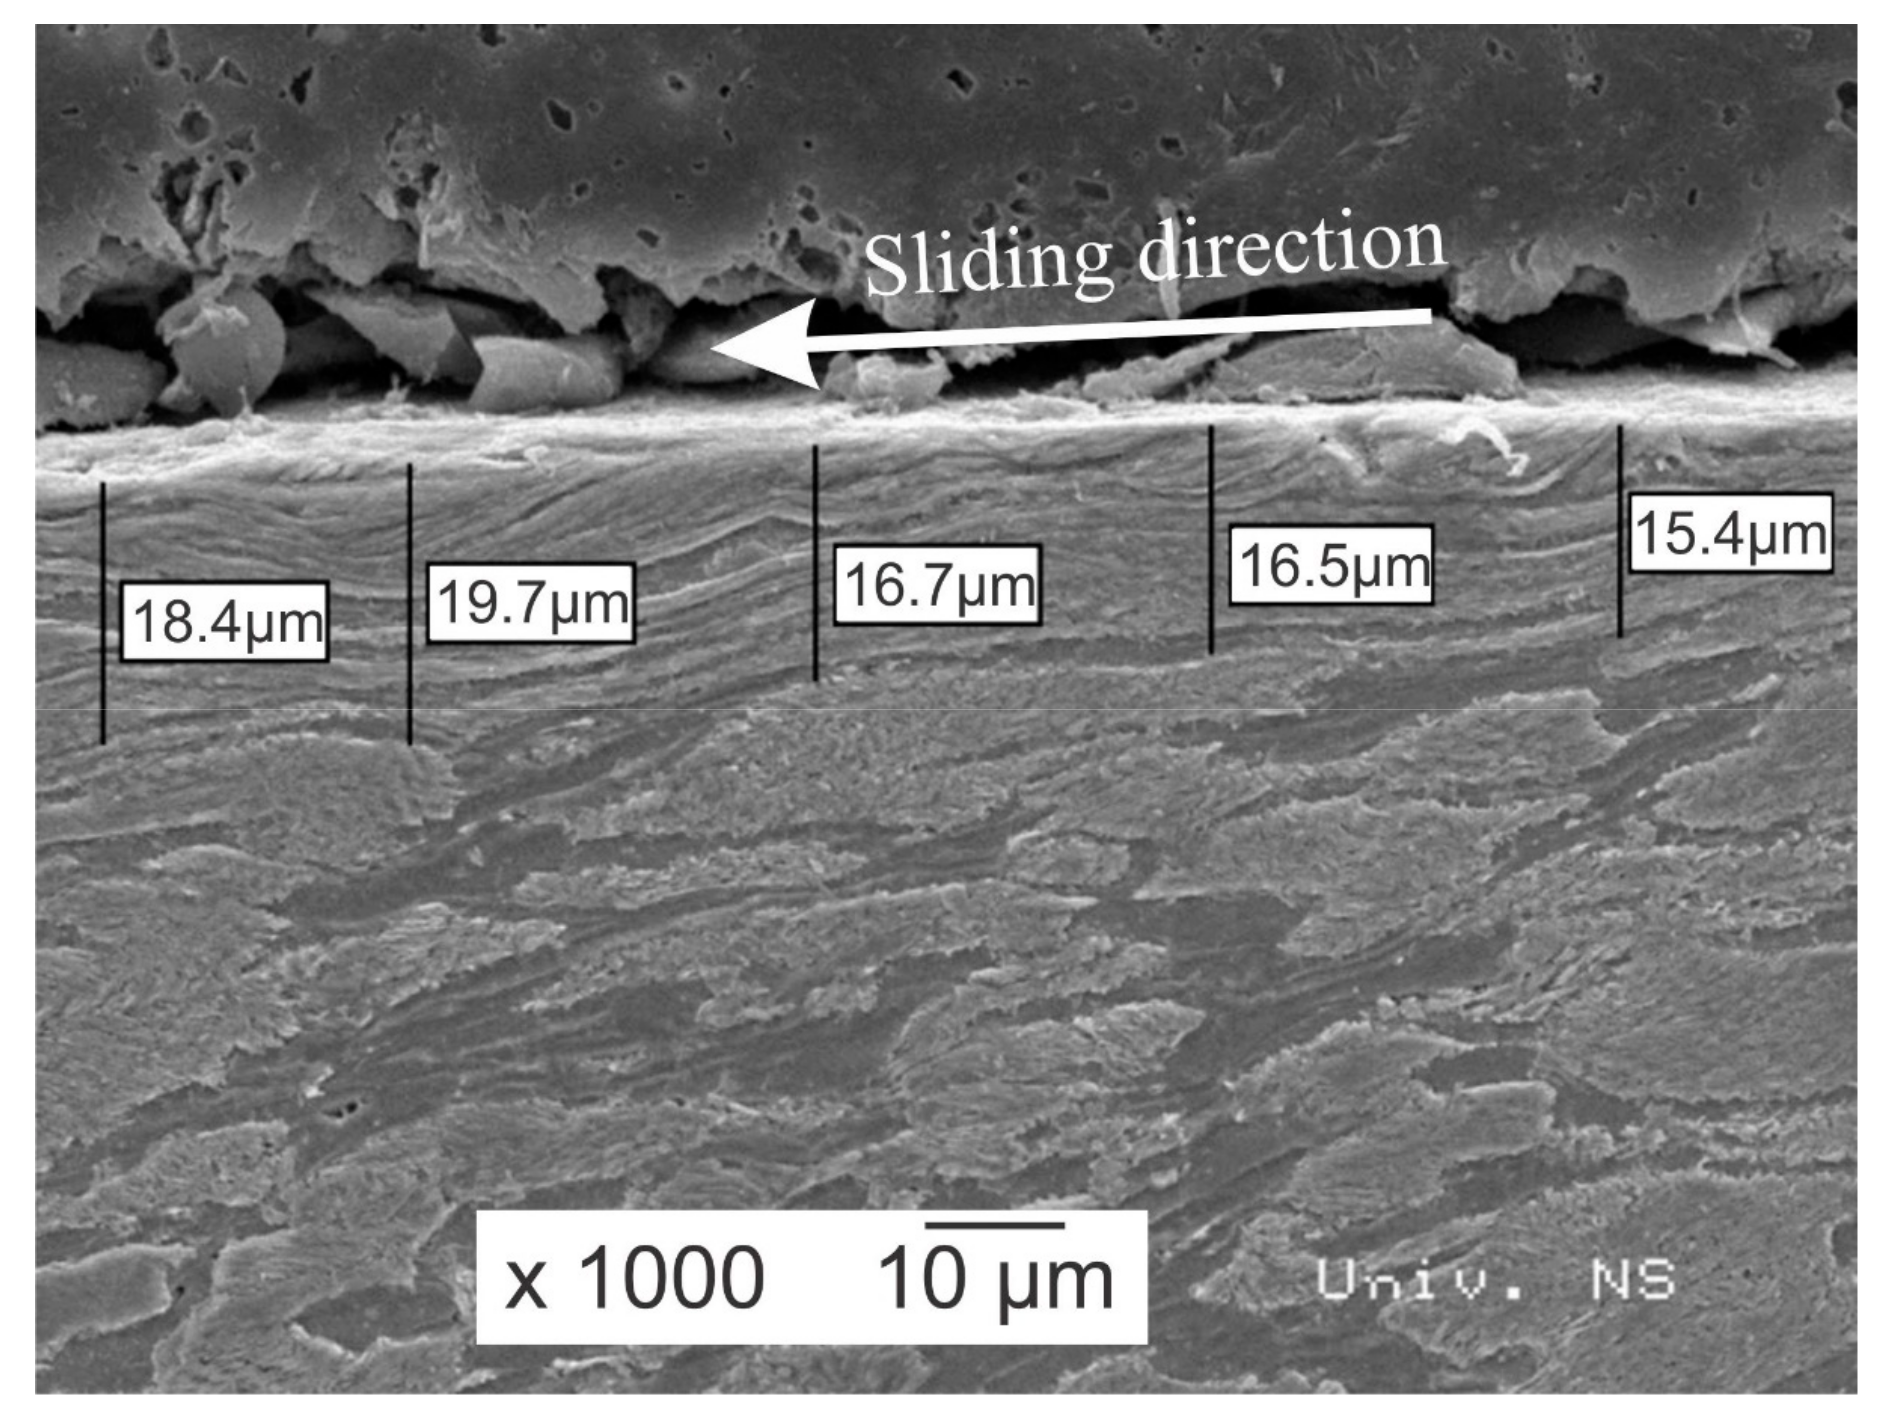
Figure 5.
Definition for “S”.
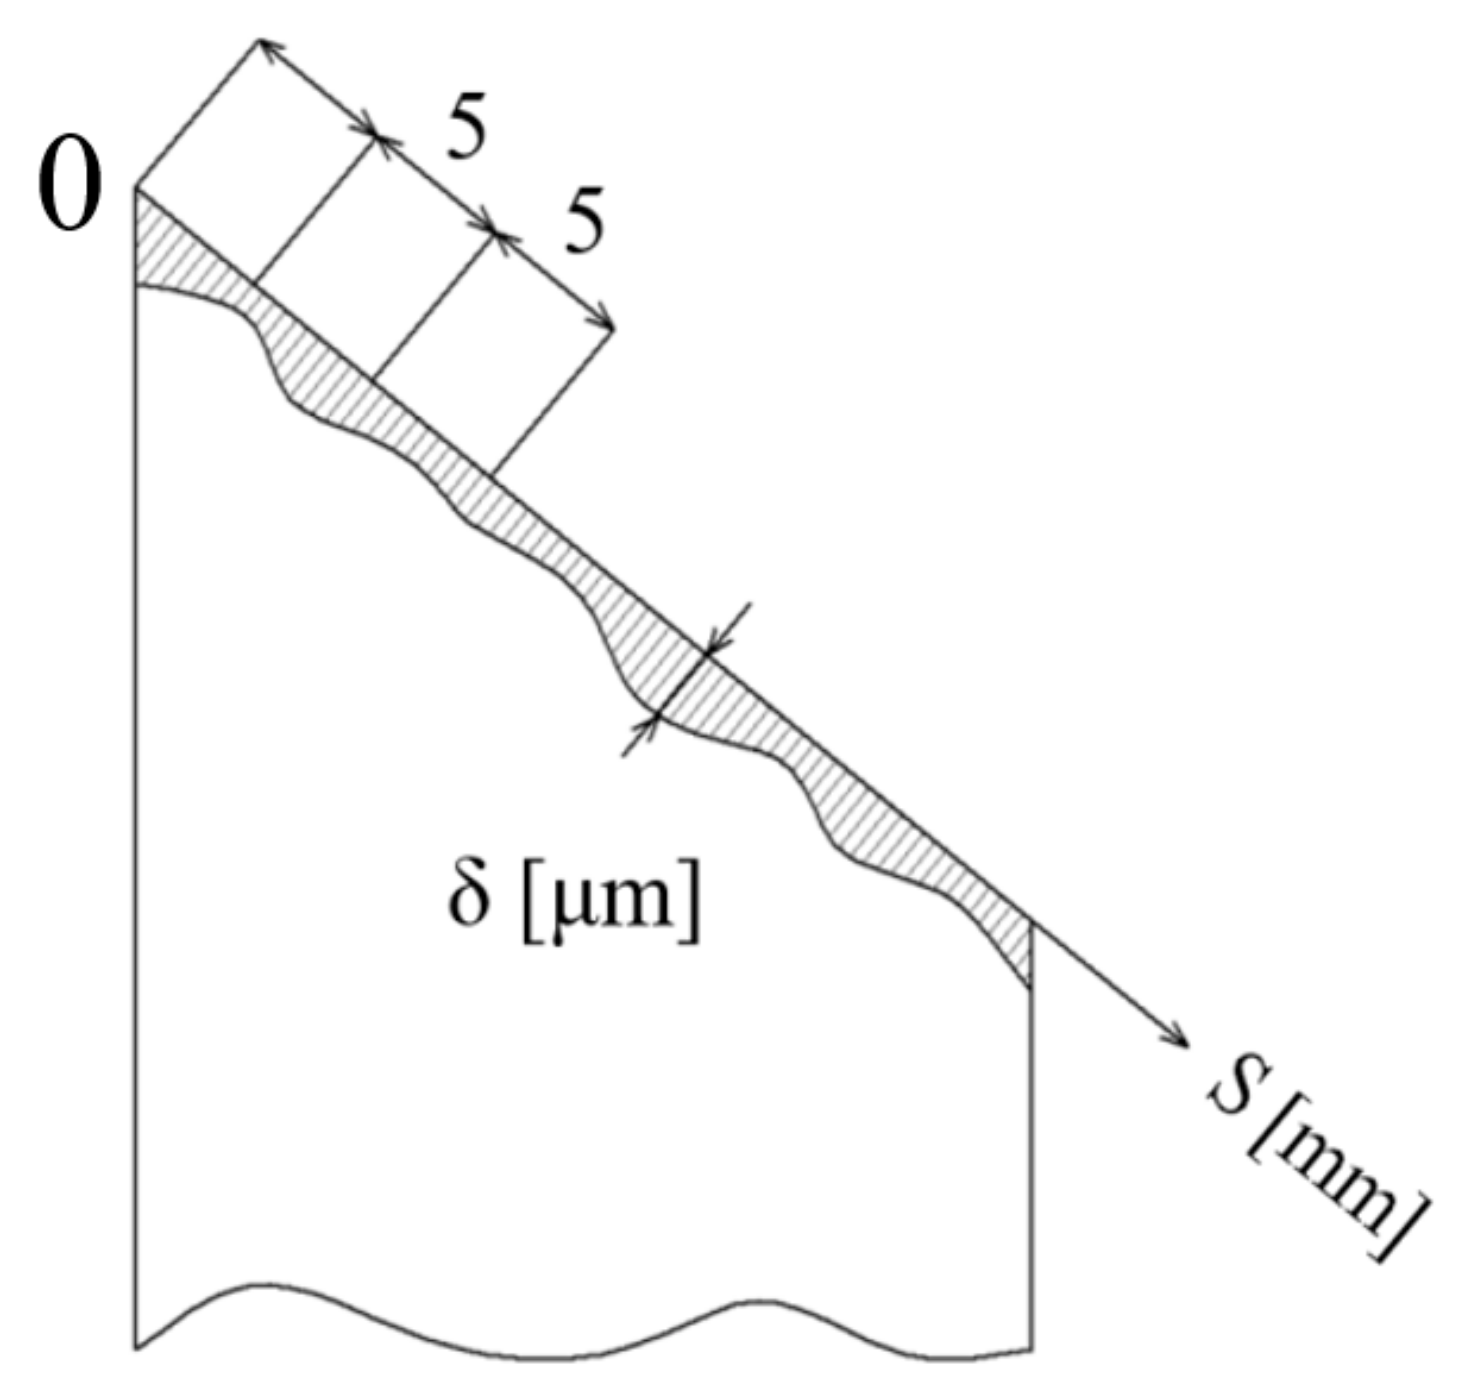
Figure 6.
Appearance of cracks in upsetting with (a) the α = 60 deg die at S = 40 mm, (b) the α = 90 deg die at S = 20 mm and (c) the α = 120 deg die at S = 25 mm.
Figure 6.
Appearance of cracks in upsetting with (a) the α = 60 deg die at S = 40 mm, (b) the α = 90 deg die at S = 20 mm and (c) the α = 120 deg die at S = 25 mm.
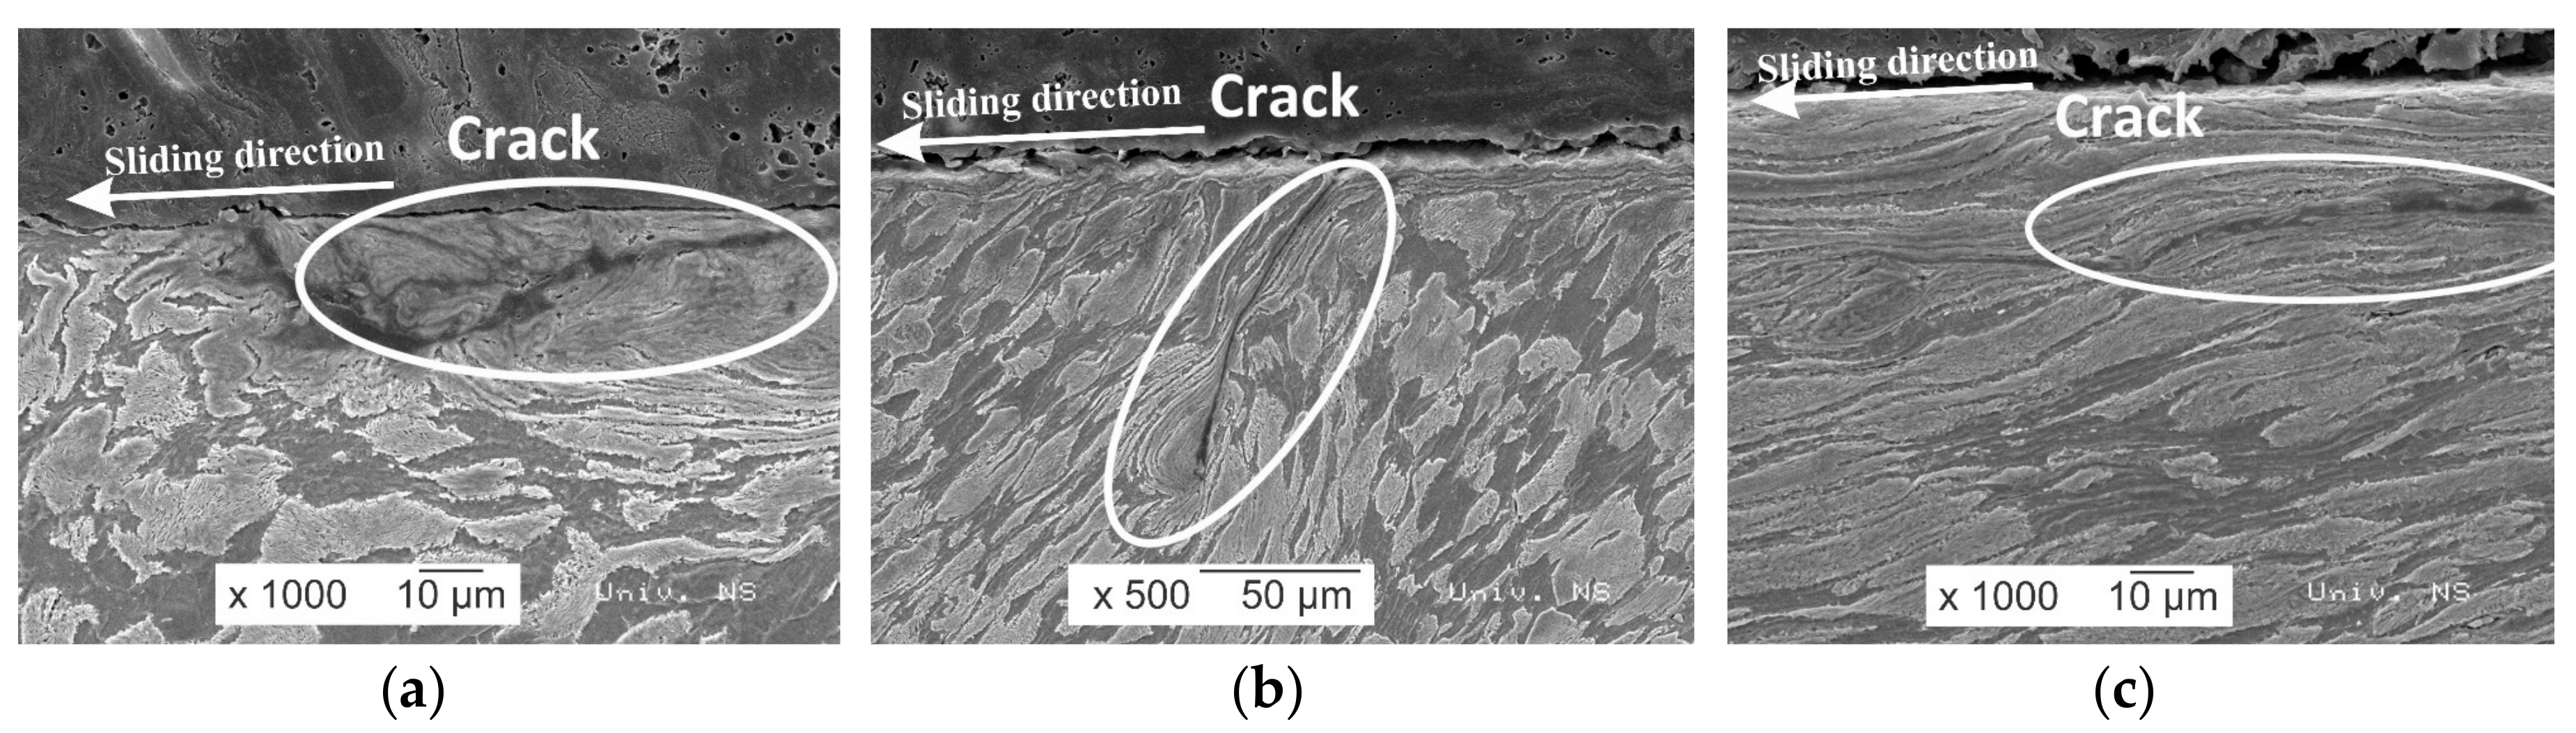
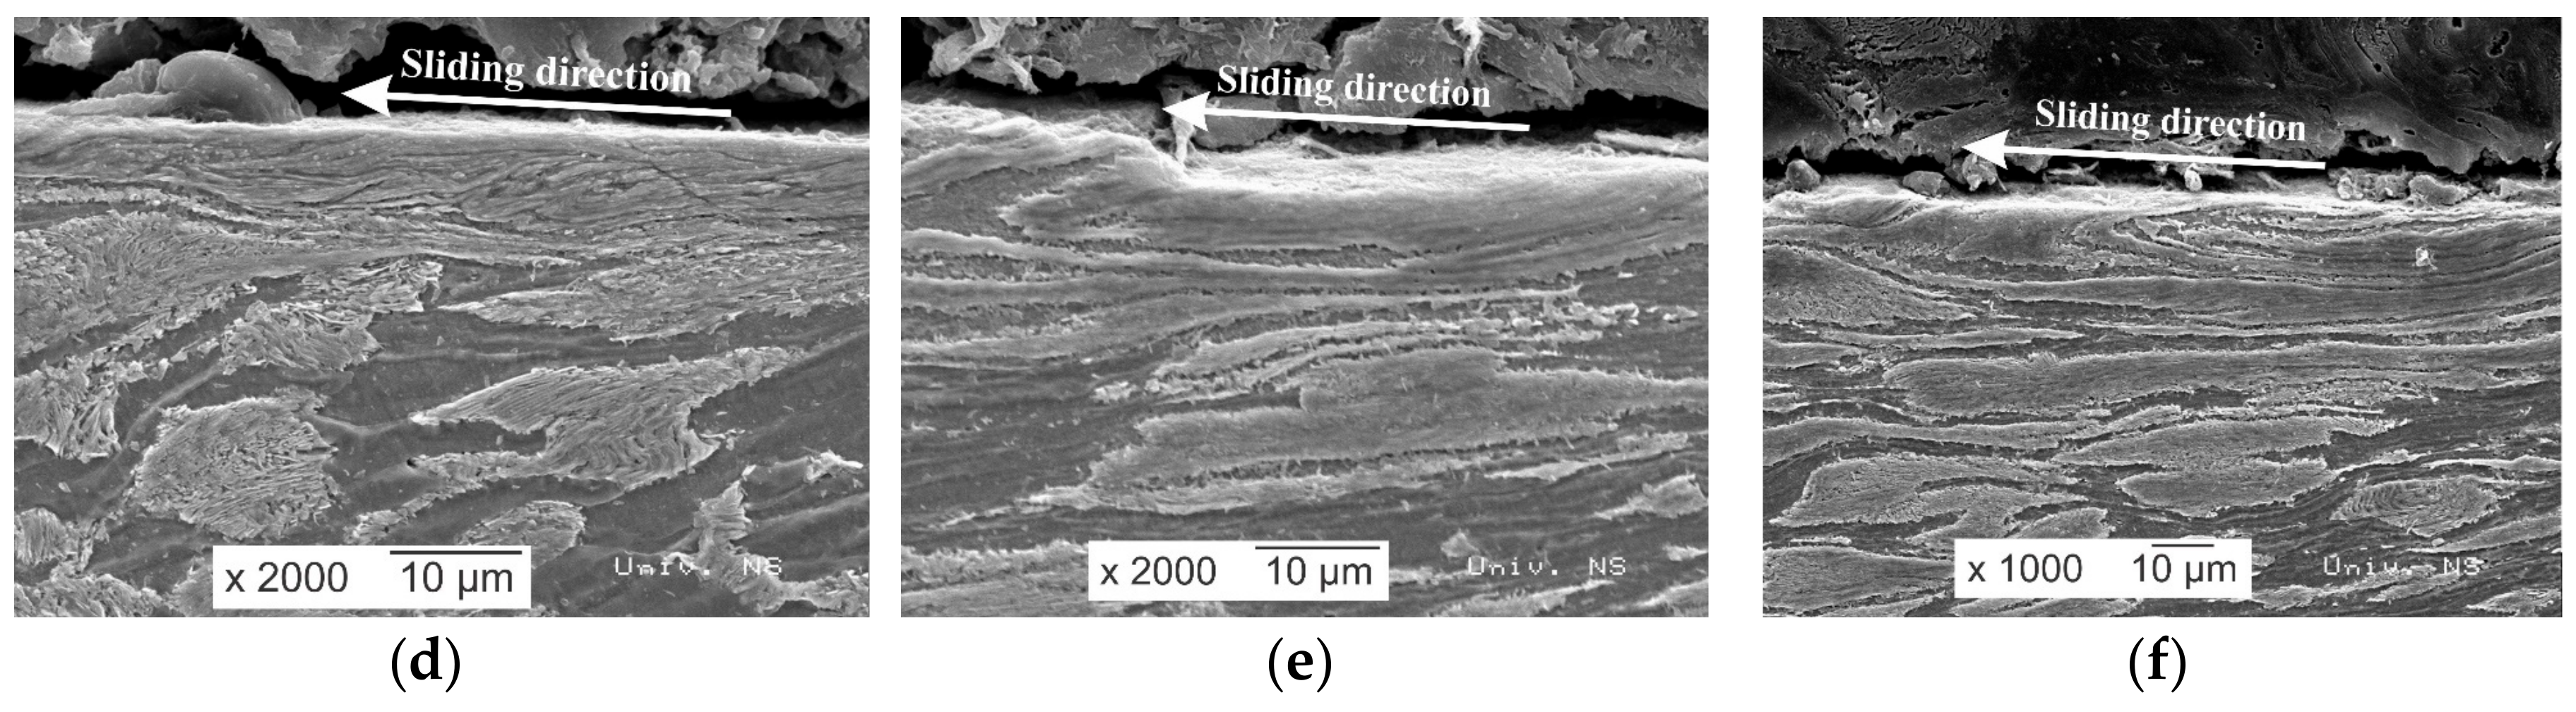
Figure 7.
The thickness of the layer of severe plastic deformation after upsetting with the α = 60 deg die at (a) S = 5 mm, (b) S = 10 mm, (c) S = 15 mm, (d) S = 20 mm, (e) S = 25 mm, and (f) S = 30 mm.
Figure 7.
The thickness of the layer of severe plastic deformation after upsetting with the α = 60 deg die at (a) S = 5 mm, (b) S = 10 mm, (c) S = 15 mm, (d) S = 20 mm, (e) S = 25 mm, and (f) S = 30 mm.


Figure 8.
The thickness of the layer of severe plastic deformation after upsetting with the α = 90 deg die at (a) S = 5 mm, (b) S = 10 mm and (c) S = 15 mm.
Figure 8.
The thickness of the layer of severe plastic deformation after upsetting with the α = 90 deg die at (a) S = 5 mm, (b) S = 10 mm and (c) S = 15 mm.

Figure 9.
The thickness of the layer of severe plastic deformation after upsetting with the α = 120 deg die at (a) S = 5 mm, (b) S = 10 mm, (c) S = 15 mm and (d) S = 20 mm.
Figure 9.
The thickness of the layer of severe plastic deformation after upsetting with the α = 120 deg die at (a) S = 5 mm, (b) S = 10 mm, (c) S = 15 mm and (d) S = 20 mm.
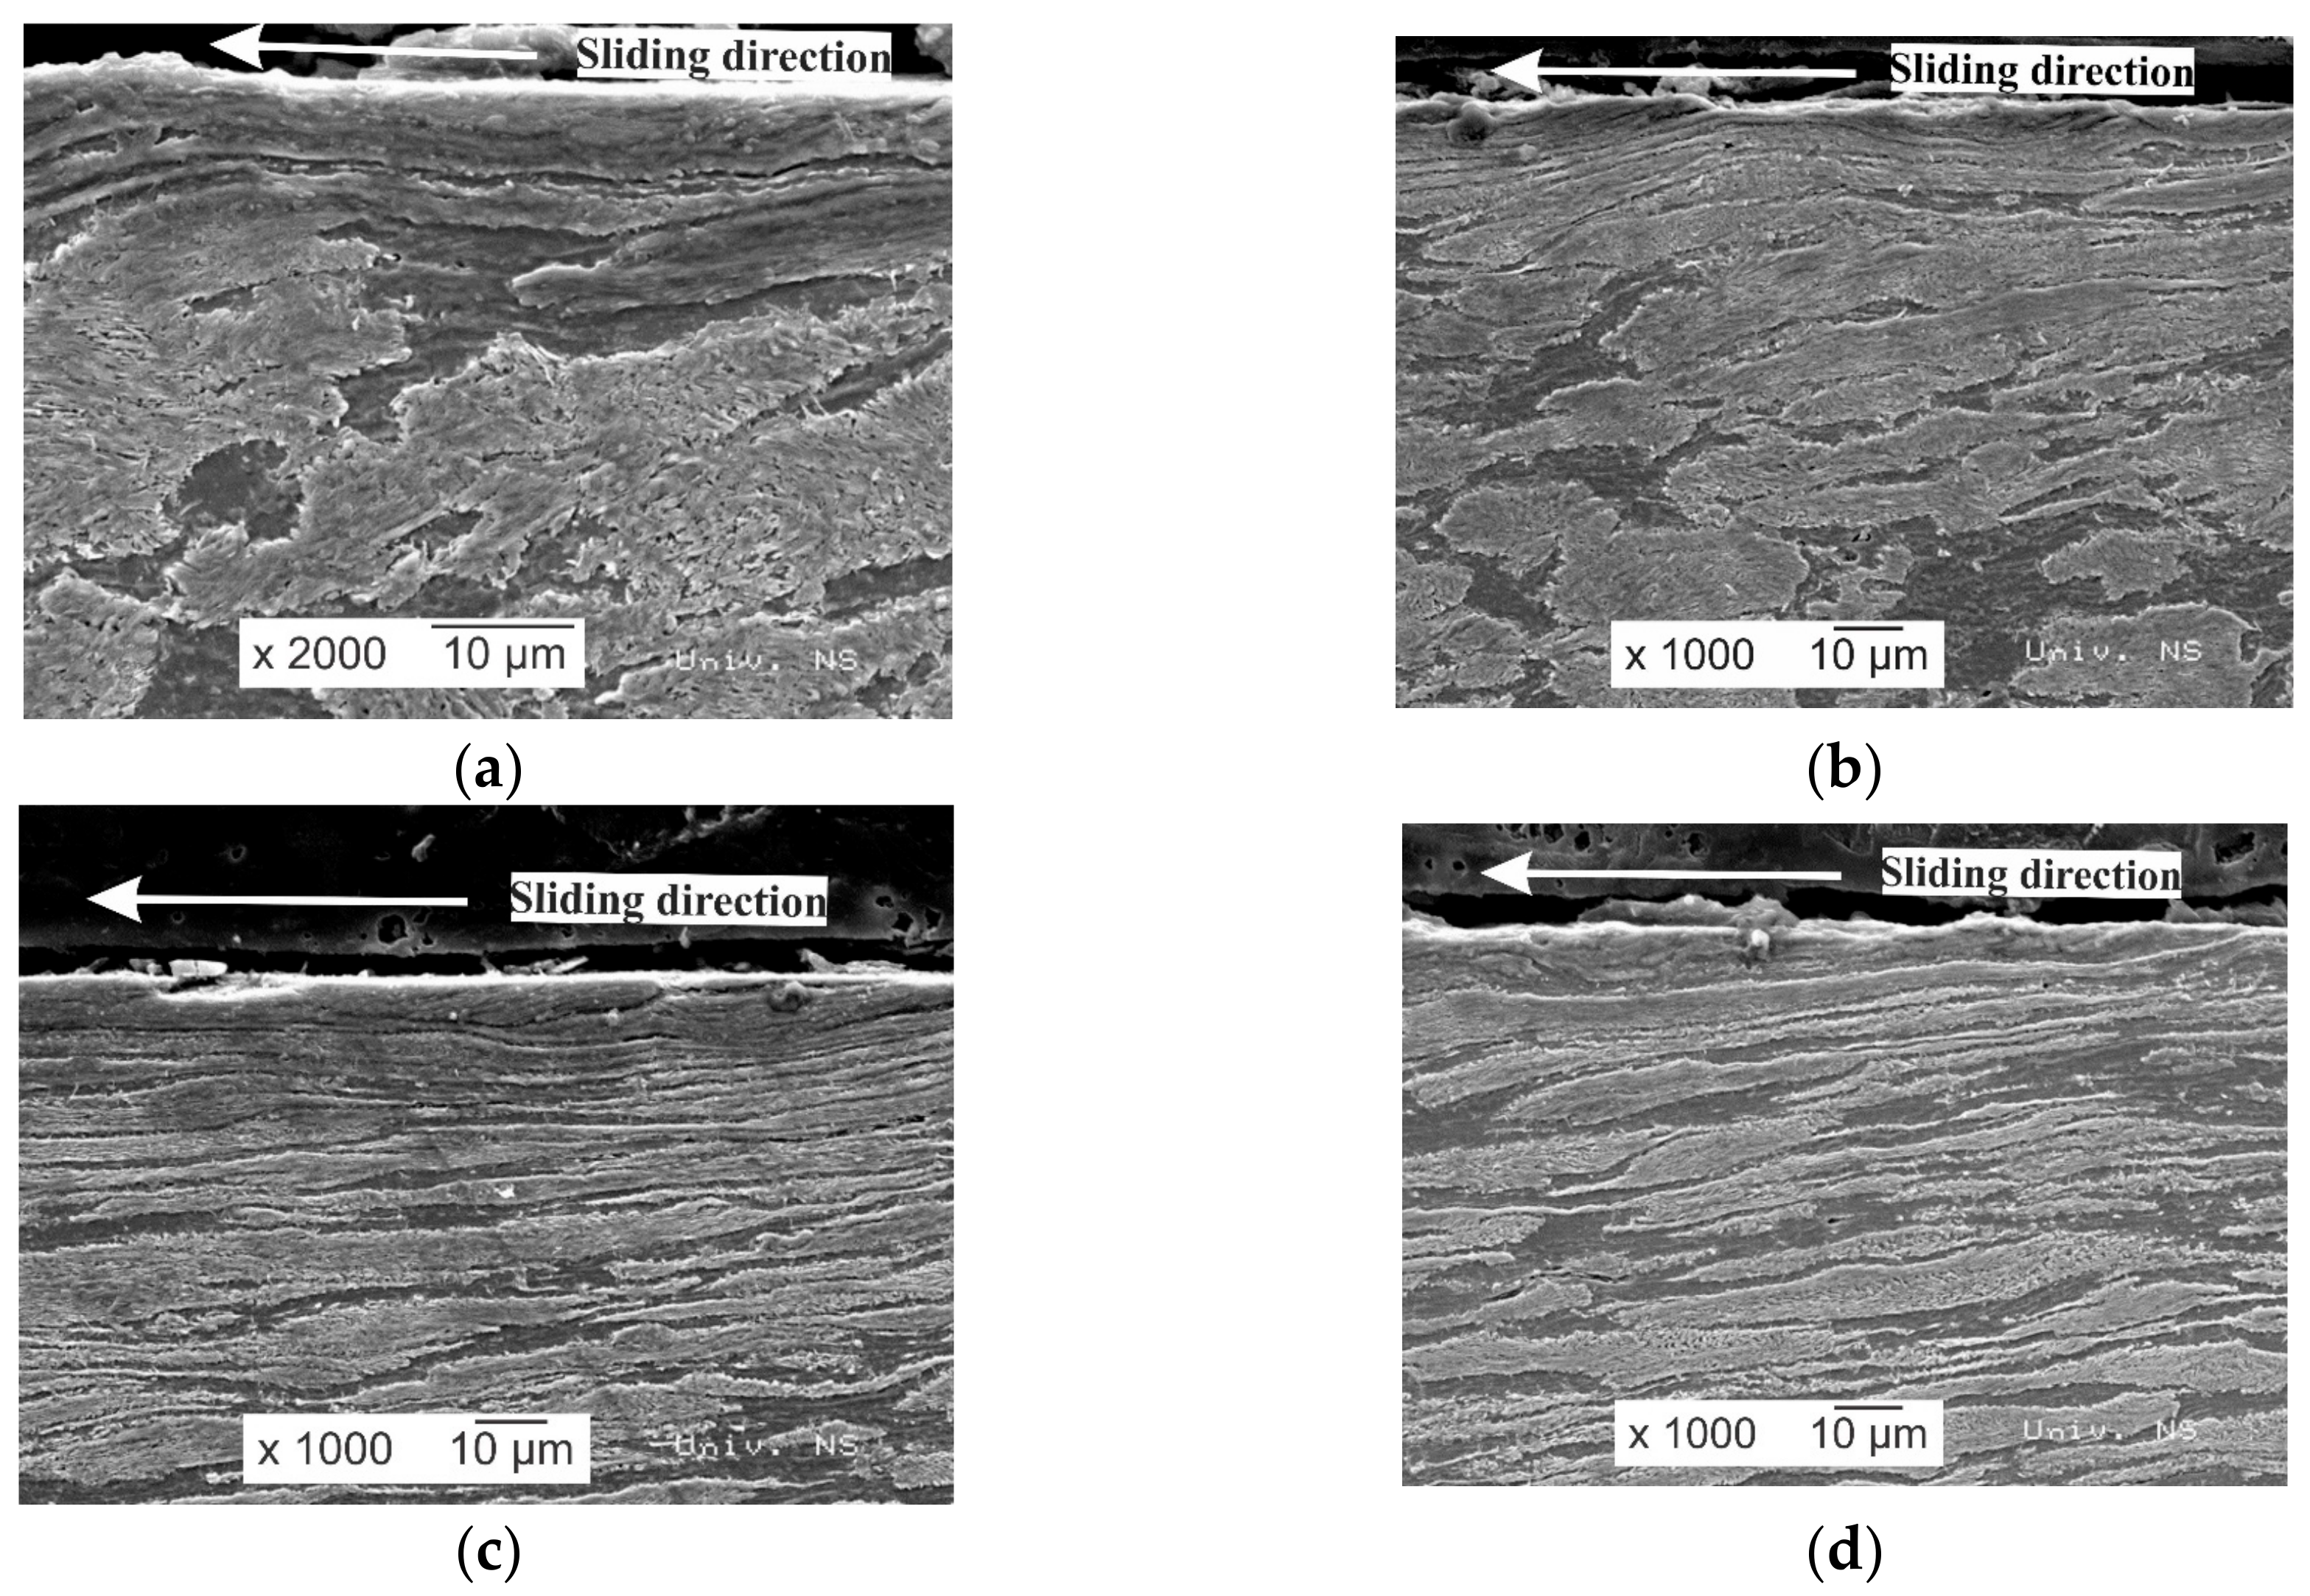
Figure 10.
Variation of the thickness of the layer of severe plastic deformation with S and α.


Table 1.
Nominal chemical composition of C45E steel (mass fraction, %).
| C | Mn | Si | S | P | Cr | Ni | Cu | Mo | V | Al |
|---|---|---|---|---|---|---|---|---|---|---|
| 0.44 | 0.42 | 0.23 | 0.010 | 0.018 | 0.006 | 0.042 | 0.066 | 0.008 | 0.001 | 0.022 |
Table 2.
Measured values of δ for one specimen of each series.
| α = 60 Deg | α = 90 Deg | α = 120 Deg | ||||
|---|---|---|---|---|---|---|
| S | δ and its value averaged over 5 measurements | R2 | δ and its value averaged over 5 measurements | R2 | δ and its value averaged over 5 measurements | R2 |
| 0 | - | 0.932 | - | 1 | - | 0.677 |
| 5 | (6.6; 6.2; 6.6; 4.7; 5) 5.8 | (11.1; 25; 13.5; 12.7; 12.9) 12.5 | (10.1; 17.7; 26; 18.8; 10.9) 16.7 | |||
| 10 | (8.5; 9; 9.5; 9.5; 9) 9.1 | (14.5; 15; 15; 17.5; 15.5) 15.5 | (28; 25; 24; 25; 30) 26.4 | |||
| 15 | (11; 10.5; 10.5; 12; 13.5) 11.5 | (18.4; 19.7; 16.5; 16.2; 16.7) 17.5 | (38; 30; 30; 31; 32) 32.2 | |||
| 20 | (12.5; 10.5; 12; 11.5; 10) 11.3 | Crack appears | (20.6; 21.4; 29.8; 25.4; 25) 24.44 | |||
| 25 | (15.5; 17.3; 13; 15.5; 15) 15.4 | - | Crack appears | |||
| 30 | ( 28; 29; 33; 35; 35.5) 32.1 | - | - | |||
| 40 | Crack appears | - | - | |||
© 2018 by the authors. Licensee MDPI, Basel, Switzerland. This article is an open access article distributed under the terms and conditions of the Creative Commons Attribution (CC BY) license (http://creativecommons.org/licenses/by/4.0/).
Share and Cite
MDPI and ACS Style
Alexandrov, S.; Šidjanin, L.; Vilotić, D.; Movrin, D.; Lang, L. Generation of a Layer of Severe Plastic Deformation near Friction Surfaces in Upsetting of Steel Specimens. Metals 2018, 8, 71. https://doi.org/10.3390/met8010071
AMA Style
Alexandrov S, Šidjanin L, Vilotić D, Movrin D, Lang L. Generation of a Layer of Severe Plastic Deformation near Friction Surfaces in Upsetting of Steel Specimens. Metals. 2018; 8(1):71. https://doi.org/10.3390/met8010071
Chicago/Turabian StyleAlexandrov, Sergei, Leposava Šidjanin, Dragiša Vilotić, Dejan Movrin, and Lihui Lang. 2018. "Generation of a Layer of Severe Plastic Deformation near Friction Surfaces in Upsetting of Steel Specimens" Metals 8, no. 1: 71. https://doi.org/10.3390/met8010071
Note that from the first issue of 2016, this journal uses article numbers instead of page numbers. See further details here.