Article

Comparing the Structure and Mechanical Properties of Welds on Ductile Cast Iron (700 MPa) under Different Heat Treatment Conditions

by
Ronny M. Gouveia
1,
Francisco J. G. Silva
1,*,
Olga C. Paiva
1,
Maria De Fátima Andrade
1,
Lucas Augusto Pereira
1,2,
Paulo Cezar Moselli
2 and
Konrad J. M. Papis
3
1
ISEP—School of Engineering, Polytechnic of Porto, 4200-465 Porto, Portugal
2
Campus de Cornélio Procópio, UTFPR—Universidade Tecnológica Federal do Paraná, Cornélio Procópio—PR 86300-000, Brazil
3
Georg Fischer Automotive A.G., 8200 Schaffhausen, Switzerland
*
Author to whom correspondence should be addressed.
Metals 2018, 8(1), 72; https://doi.org/10.3390/met8010072
Submission received: 26 December 2017 / Revised: 16 January 2018 / Accepted: 17 January 2018 / Published: 19 January 2018

Abstract

:
The weldability of ductile iron, as widely known, is relatively poor, essentially due to its typical carbon equivalent value. The present study was developed surrounding the heat treatability of welded joints made with a high strength ductile cast iron detaining an ultimate tensile strength of 700 MPa, and aims to determine which heat treatment procedures promote the best results, in terms of microstructure and mechanical properties. These types of alloys are suitable for the automotive industry, as they allow engineers to reduce the thickness of parts while maintaining mechanical strength, decreasing the global weight of vehicles and providing a path for more sustainable development. The results allow us to conclude that heat treatment methodology has a large impact on the mechanical properties of welded joints created from the study material. However, the thermal cycles suffered during welding promote the formation of ledeburite areas near the weld joint. This situation could possibly be dealt through the implementation of post-welding heat treatments (PWHT) with specific parameters. In contrast to a ductile cast iron tested in a previous work, the bull-eye ductile cast iron with 700 MPa ultimate tensile strength presented better results during the post-welding heat treatment than during preheating.

1. Introduction

Due to properties such as good mechanical strength, interesting fatigue resistance, adequate wear resistance, excellent machinability, low cost, good fluidity and castability, ductile cast irons (DCIs), also known as spheroidal graphite irons (SGIs), are widely used in several applications, such as machine tool beds, heavy-duty engine blocks, crankshafts, camshafts, pistons, cylinders, heavy section wind turbine components, railway brake disks, wheels, pipes, valves, pumps and gears, among others [1,2]. Moreover, DCIs and other cast irons, as well as castable special steels, allow us to obtain complex shapes through a single manufacturing operation: the casting process. Nevertheless, in this set of materials, DCIs present lower specific weights, enabling the casting of thinner-walled parts, while maintaining very attractive mechanical properties, namely the ductility and the fracture toughness, whose properties are significantly better than those presented by gray cast irons or white cast irons, in general. Indeed, it can be stated as well that DCIs present the highest mechanical strength and the best ductility among cast irons, combining the main advantages of gray cast irons (such as excellent machinability), with the properties of common steels (e.g., high mechanical strength, toughness, hardenability, ductility and hot workability) [3,4]. Further information regarding the mechanical properties of DCIs, as well as cast irons in general, can be found in [5,6]. The mechanical properties of DCIs arise from their microstructure (which is dependent on chemical composition), graphite nodule size, type of inoculation method that was carried out and balance between ferrite and the other phases in the matrix, among others [7,8]. In fact, DCIs are produced by inoculating the molten metal immediately before casting, through the addition of a small amount of Mg or Ce [9], giving rise to the nodularization of the graphite previously dispersed in the matrix. Moreover, it can be stated as well that DCIs’ properties also depend on the process parameters used during their production [10]. Usually, DCIs have carbon contents between 3.0% and 4.0%, also including Si, in the range of 1.8 to 2.8%, and Mn, between 0.1% and 1.0%, and small amounts of P and S [6,9]. These elements are responsible for some of the problems encountered during production and processing of DCIs, as they affect the material’s mechanical properties by promoting the appearance of harmful structures, such as carbides, chunky graphite, graphite flotation, irregular graphite, shrinkage, nodules alignment and gas holes, among others [11,12,13,14]. Regarding the demand for high strength materials with very good castability, new treatments of ductile irons [15] or new compositions [16] have been developed, widening the properties and application of these materials; however, problems related to their weldability remain similar (being better in the case of austempered ductile irons (ADIs)) [15]. Nowadays, it is possible to find DCIs with ultimate tensile strengths of 700 MPa and greater, allowing castability parameters similar to what is seen on conventional DCI alloys, allowing a reduction of the overall dimension of products. This ability is very useful for the transportation industry (railways, trucks and cars), as weight reduction directly leads to a decrease in emissions and improves sustainability [17].
The welding of DCIs is not performed routinely in the metalworking industry, due to the problems related to its composition [18]. Effectively, DCI welding requires careful preparation; it is difficult to achieve similar mechanical properties after welding relative to the ones presented by the parent metal. The main problems related to the weldability of DCIs arise from the excessive content of carbon and related materials that promote martensite formation in the heat affected zone (HAZ) as well as iron carbides between the bead and the parent metal (interface). However, there are many situations where welding processes can help us to overcome some difficulties related to casting defects, machining mistakes, small cracks resulting from the cooling process, or cyclical workloads [19]. Indeed, repairs via welding represent the most performed operation regarding DCIs [20]. Thus, several processes have been tested with success in terms of joining DCIs, such as Manual Shielded Metal Arc Welding (SMAW), Oxyacetylene Welding (OAW), Gas Metal Arc Welding (GMAW), Gas Tungsten Arc Welding (GTAW), Flux Cored Arc Welding (FCAW) and Laser Welding (LW), among others [19,21,22], while others were discarded. For instance, when using Friction Welding (FW) in DCIs, due to the lubricant effect of graphite, the necessary localized high temperature cannot be achieved in order to promote DCI fusion [21]. Hence, there are studies on how to repair big components like heavy-duty engine blocks [9].
Regarding the need to use welding processes in a reliable way, some studies have been carried out in an effort to determine how to achieve the best results in terms of mechanical strength, fatigue resistance and wear behavior [22,23,24,25,26]. Furthermore, other studies have been performed in order to evaluate how to improve surface wear resistance using filler metal (FM) as a thick surface layer [1]. The use of heat treatments is a common way to overcome the traditional four difficulties encountered when welding DCI [23,24]. Usually, when a preheating stage is performed, the UTS (Ultimate Tensile Stress) is not severely affected by the cooling process [19], due to the hardness associated with the phases (martensite, bainite, pearlite and ledeburite) formed in each zone (fusion zone (FZ), HAZ (heat affected zone) and partially melted zone (PMZ)). Therefore, the main goal of a pre-heating procedure is to reduce residual stresses and distortions, preventing, as well, a rapid cooling rate and consequent cracking risk, providing the HAZ with higher ductility [
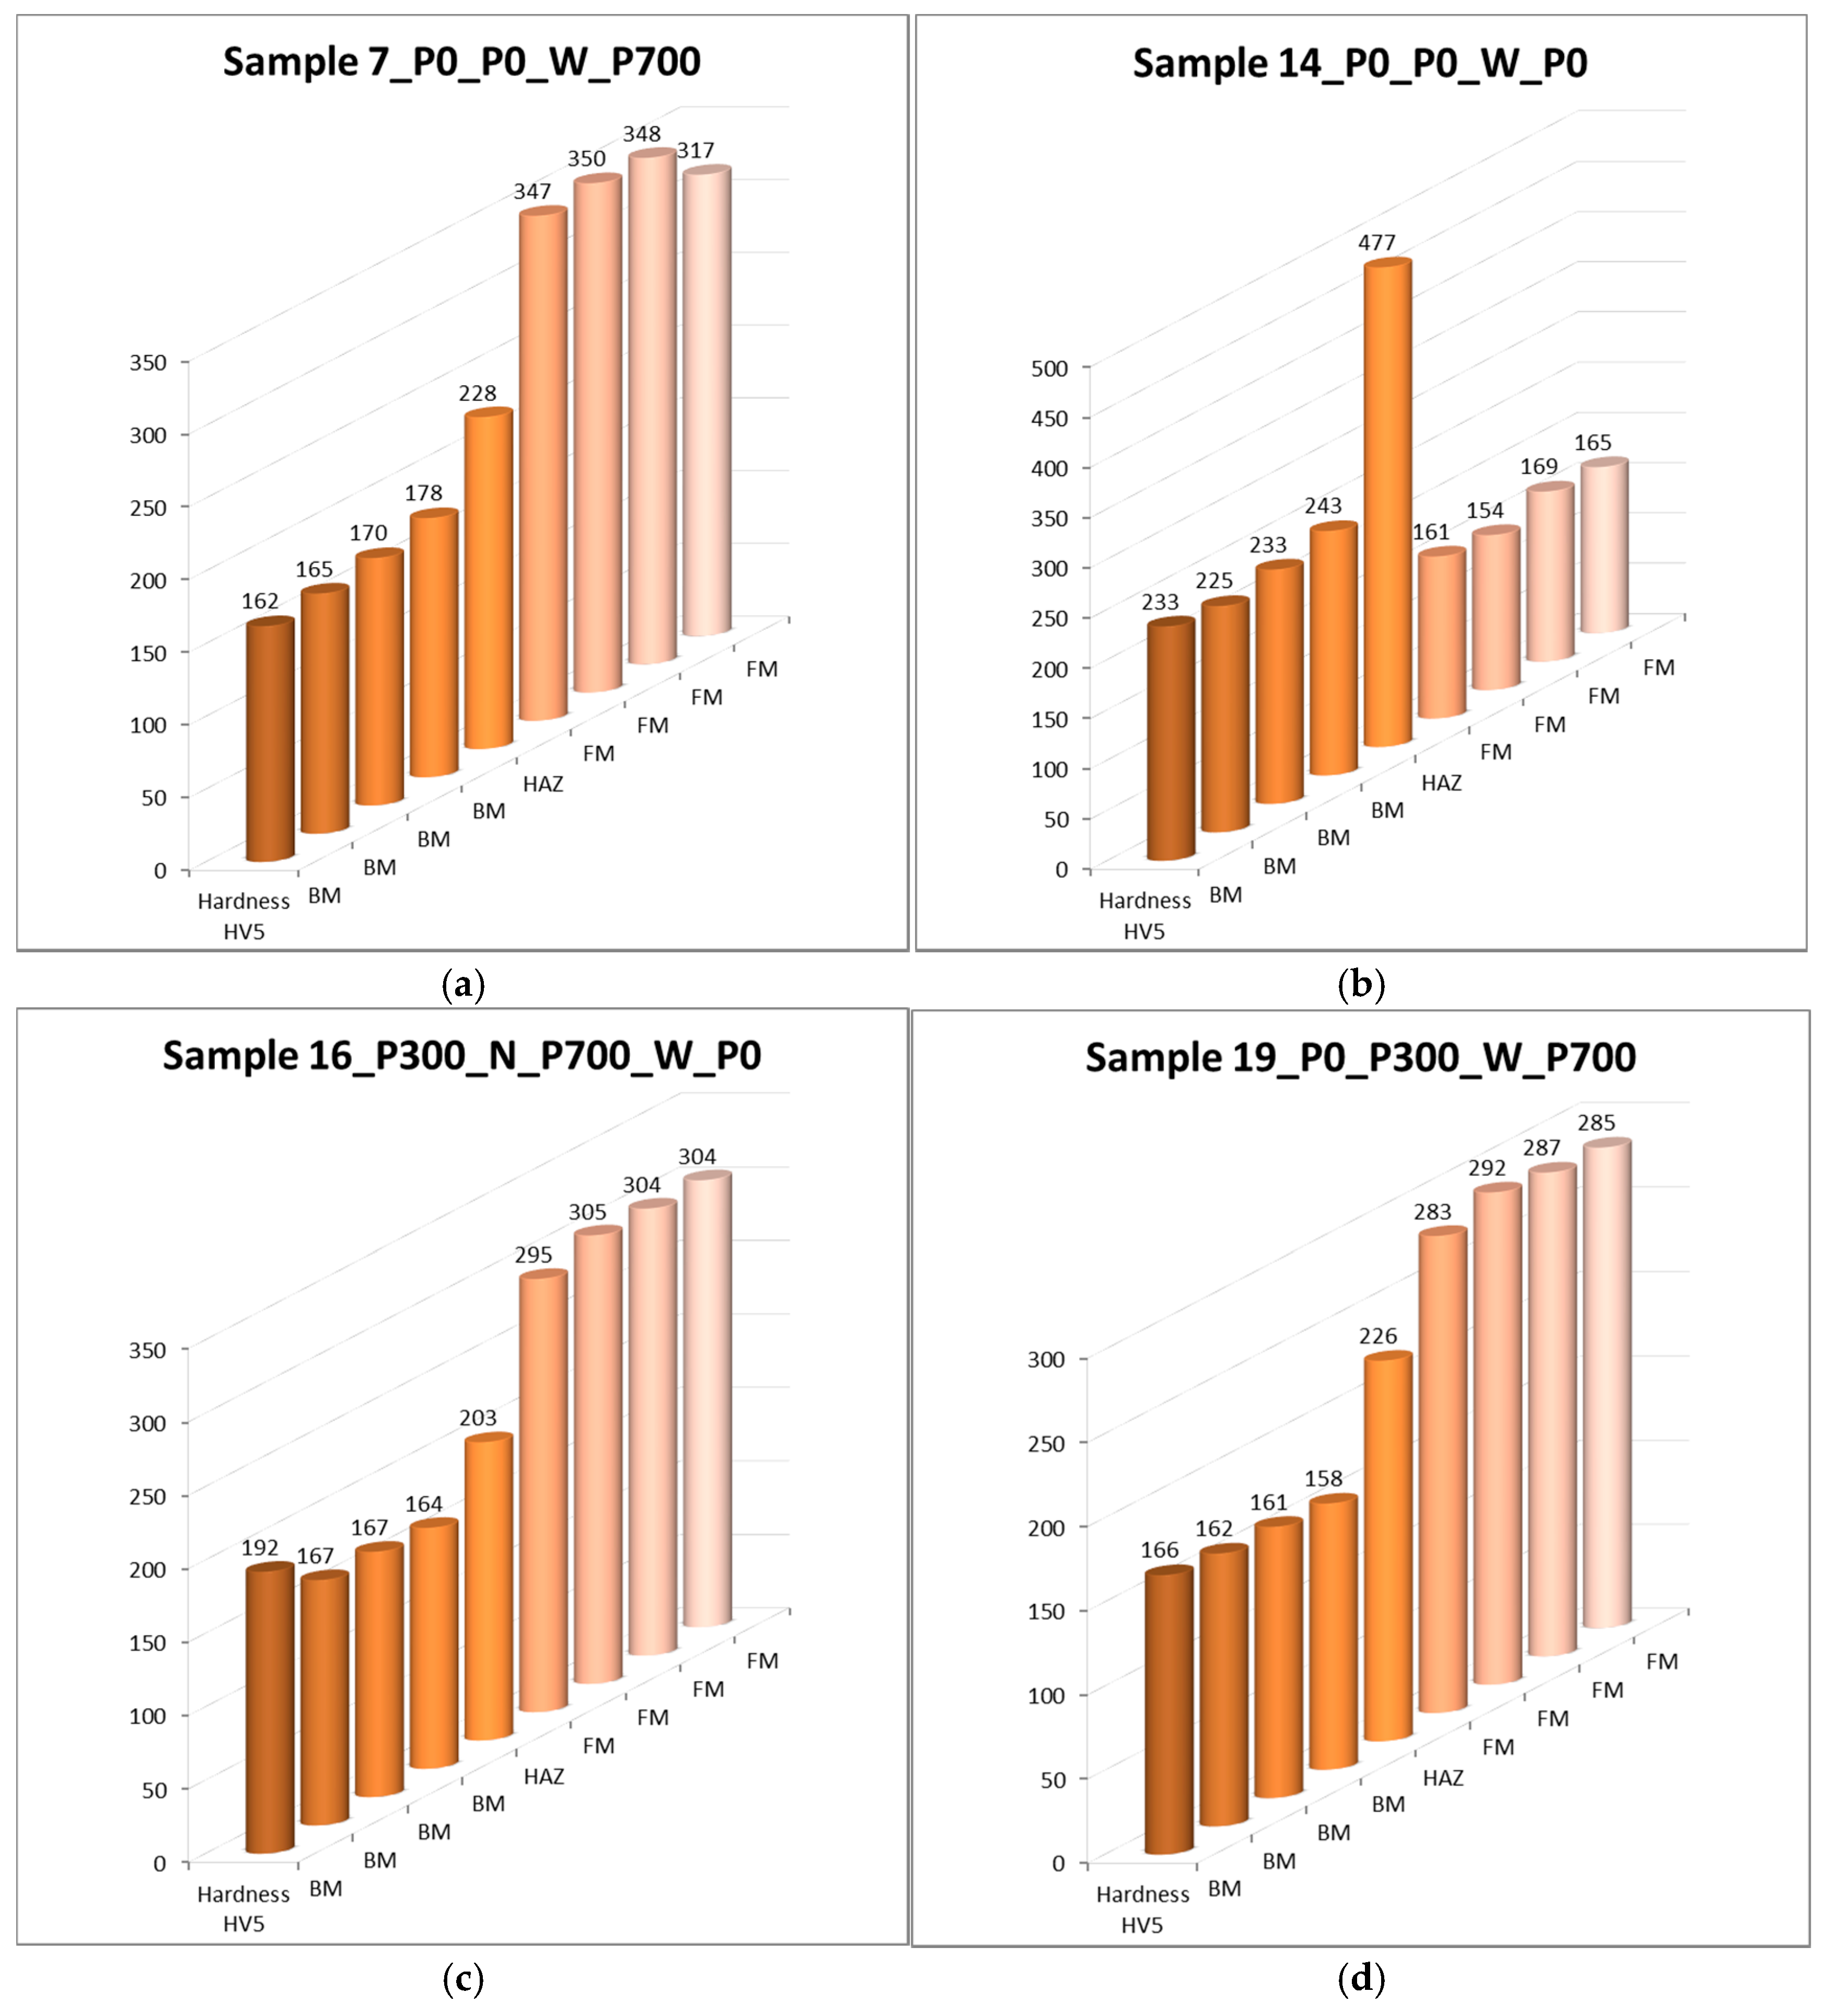
23]. A temperature of 300 °C is referred to in the literature as the most convenient to achieve good results in terms of mechanical properties of DCI welded joints [20], conferring a bainitic HAZ and a discontinuous presence of carbides. PWHT is referred to as useful for slightly reducing the HAZ hardness, improving the ductility in this area and reducing the residual stresses imposed by the welding thermal cycle. A similar effect is produced when performing further welding passes relative to the former ones. In a recent study, authors found that when welding a similar high strength DCI to the one discussed in this work, a pre-heating stage of 300 °C for 2 h along with multi-pass welds promoted the best outcome in terms of mechanical properties [24]. Buttering was used successfully in the preparation of the SMAW process, conferring a higher ductility to the weldment [19]. Pouranvari [25] carried out experiments, using 870 °C with a 1 h holding time and furnace cooling, with PWHT in gray cast irons joined with Ni based FM, promoting martensite dissolution and graphitization in the HAZ, reducing, as well, the hardness in the PMZ and conferring a smooth hardness profile through the welded area.
FM has been one of the most interesting topics discussed in the last two decades regarding DCI welding [15]. Indeed, studies have been carried out allowing us to state that Ni, as a FM, allows better mechanical properties than nodular cast iron electrodes [18,26]. In fact, nickel is able to dissolve graphite contained in the DCI parent metal, germinating as low average size spherulites, preventing the formation of martensite or fragile carbides and promoting a more uniform weldment structure with the ability to deform without cracking. Welds performed with FM based on Ni alloys have given an advantage in the last decade [27,28], due to the microstructure achieved, mainly composed of Ni-rich solid solution dendrites together with some M23C6 carbides interdendritic eutectics [1]. Studies carried out by Pascual et al. [18] allowed us to observe that ductility is improved when stainless steel or Ni–Fe alloys are used as FM in DCI welding relative to gray iron FM, which presents the worse results in terms of mechanical properties. Moreover, the same authors concluded that Ni alloys provide the best results in terms of mechanical properties, with stainless steel being a cheaper alternative as FM, ensuring, as well, satisfactory results. Effectively, using Ni alloys as FM when welding DCIs avoids carbide formation, contributing in this way to an increase in ductility in the joint, mainly when used together with a preheating treatment [24]. However, many years ago, Kelly et al. [29] studied the suitability of Ni–Fe–Mn alloys as FM for DCI welding, concluding that these alloys may be able to be used without the necessity of preheating or PWHT processes, maintaining the properties of the parent metal in the joint, stating that the presence of some martensite and carbides in the HAZ can help tensile properties on welded DCI, concluding in this way that the microstructure of the HAZ is not enough by itself to characterize the performance of a joint.
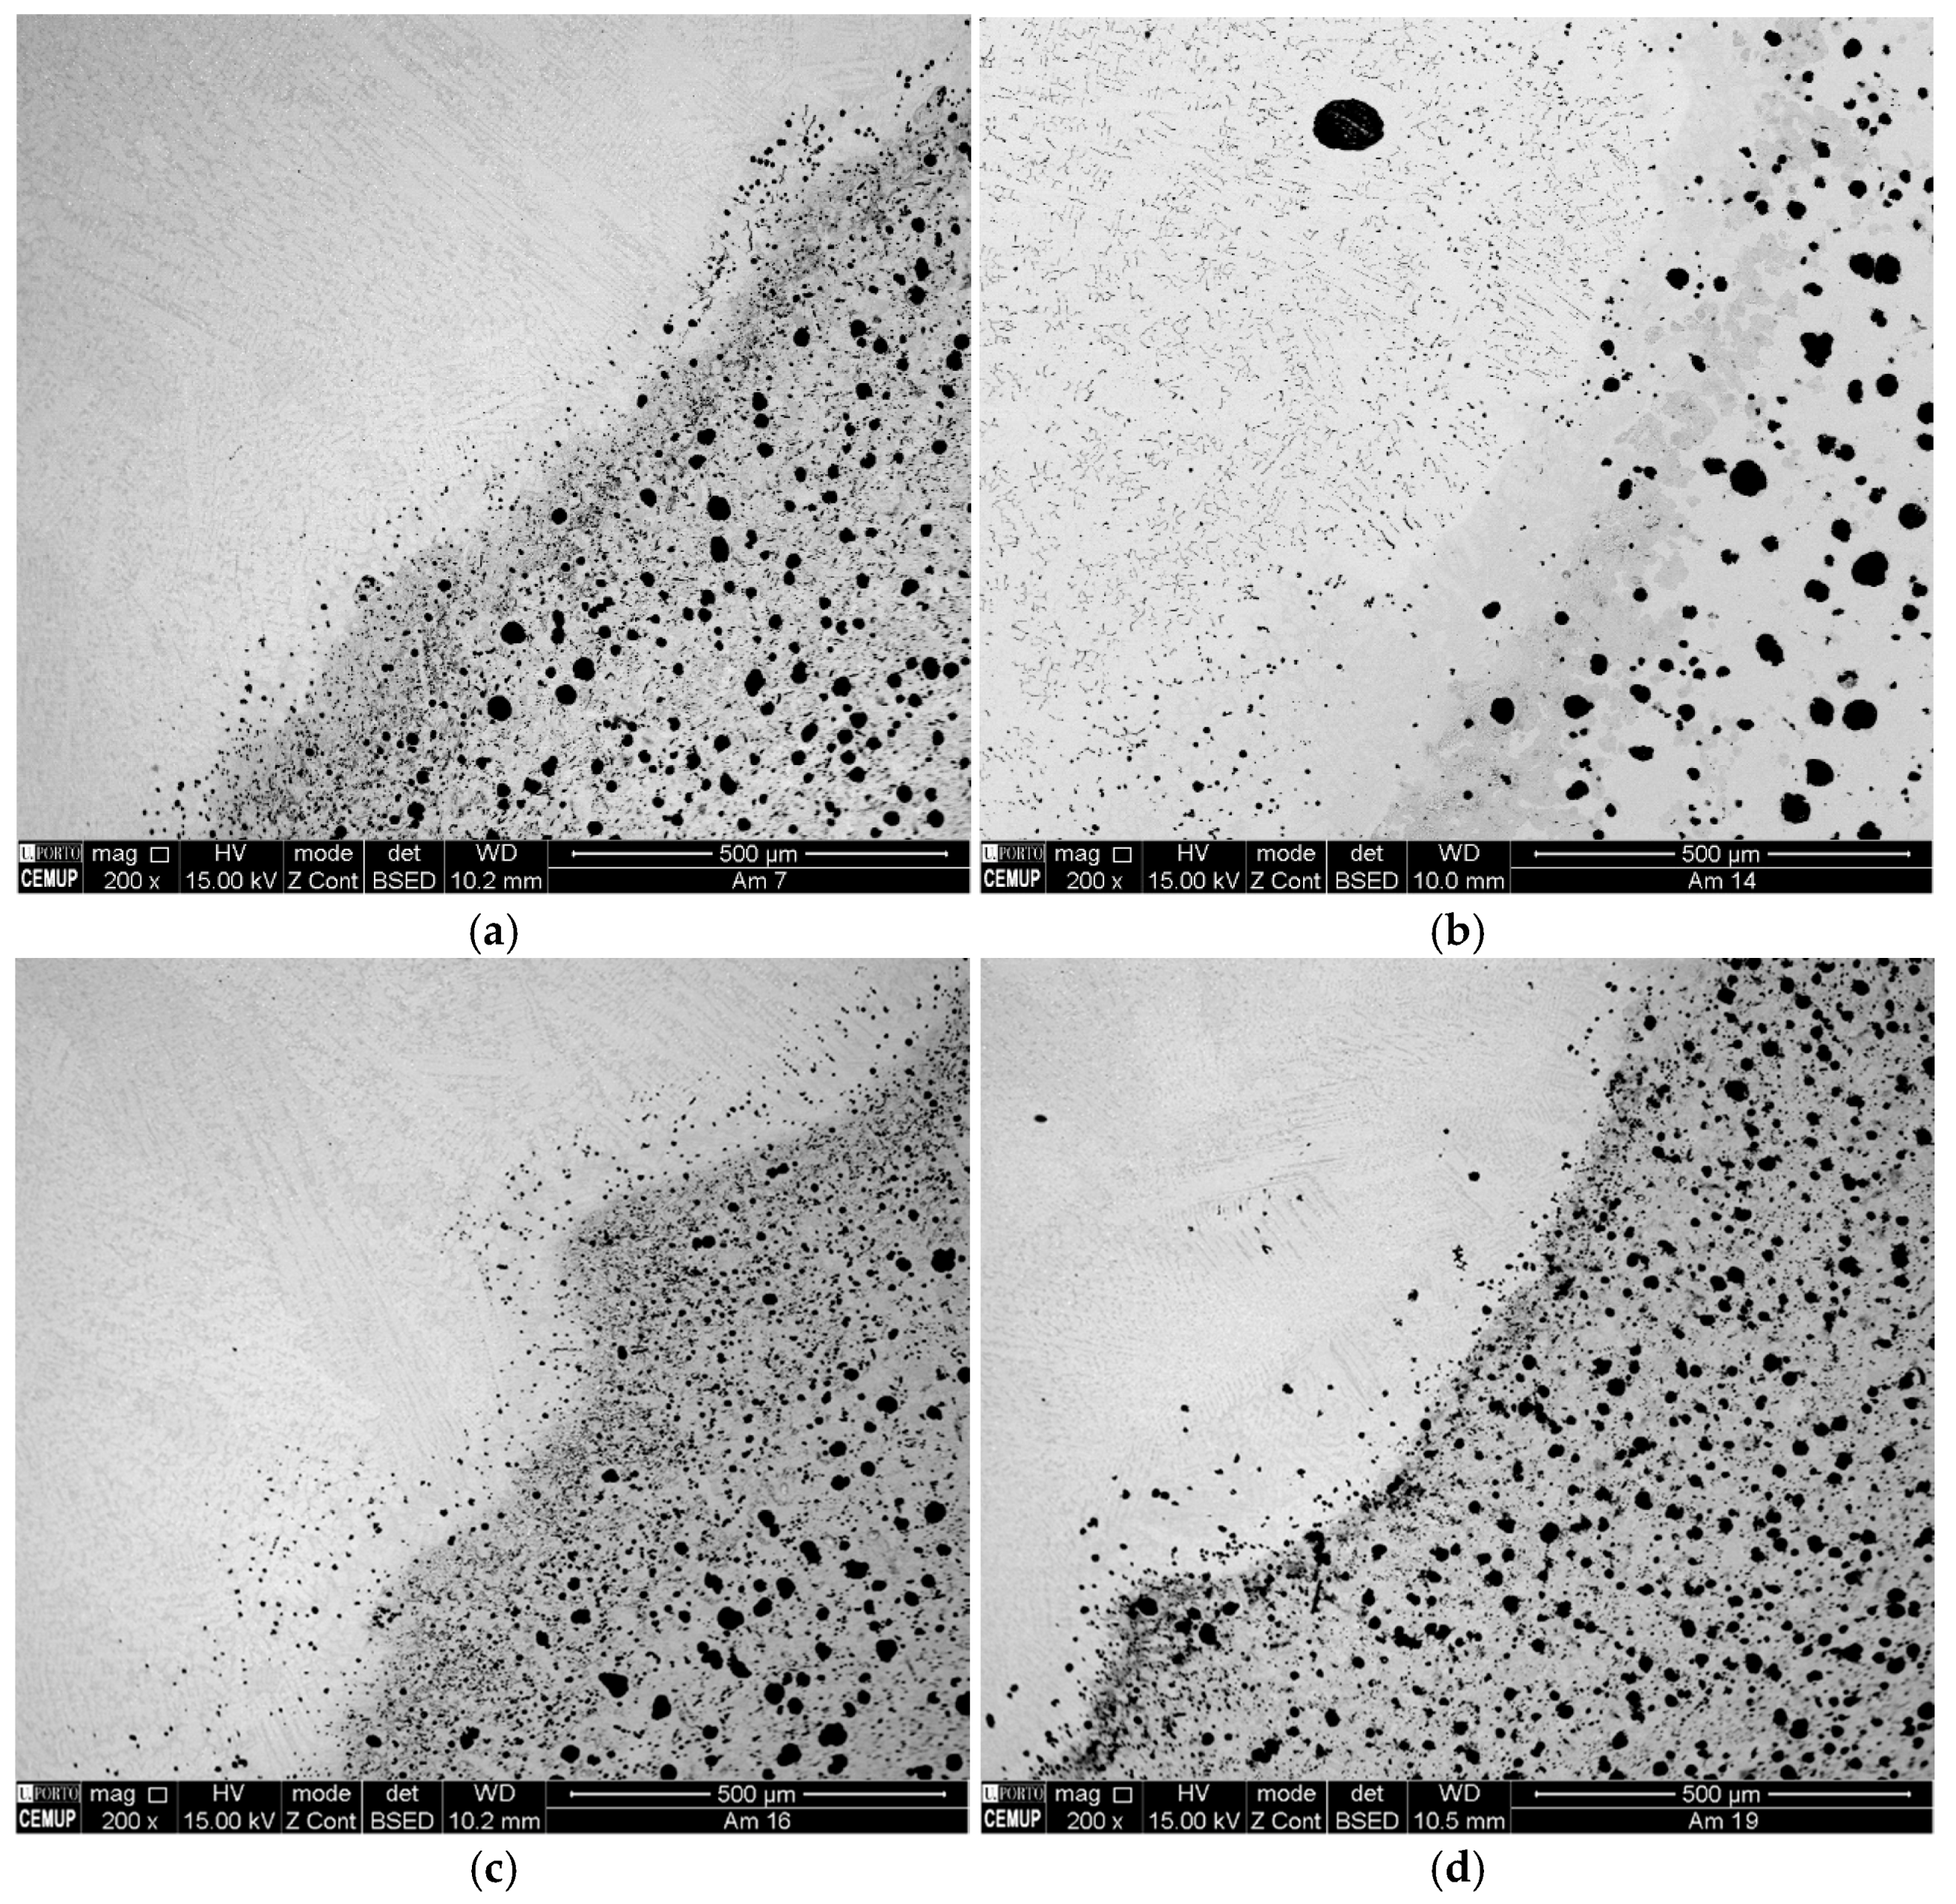
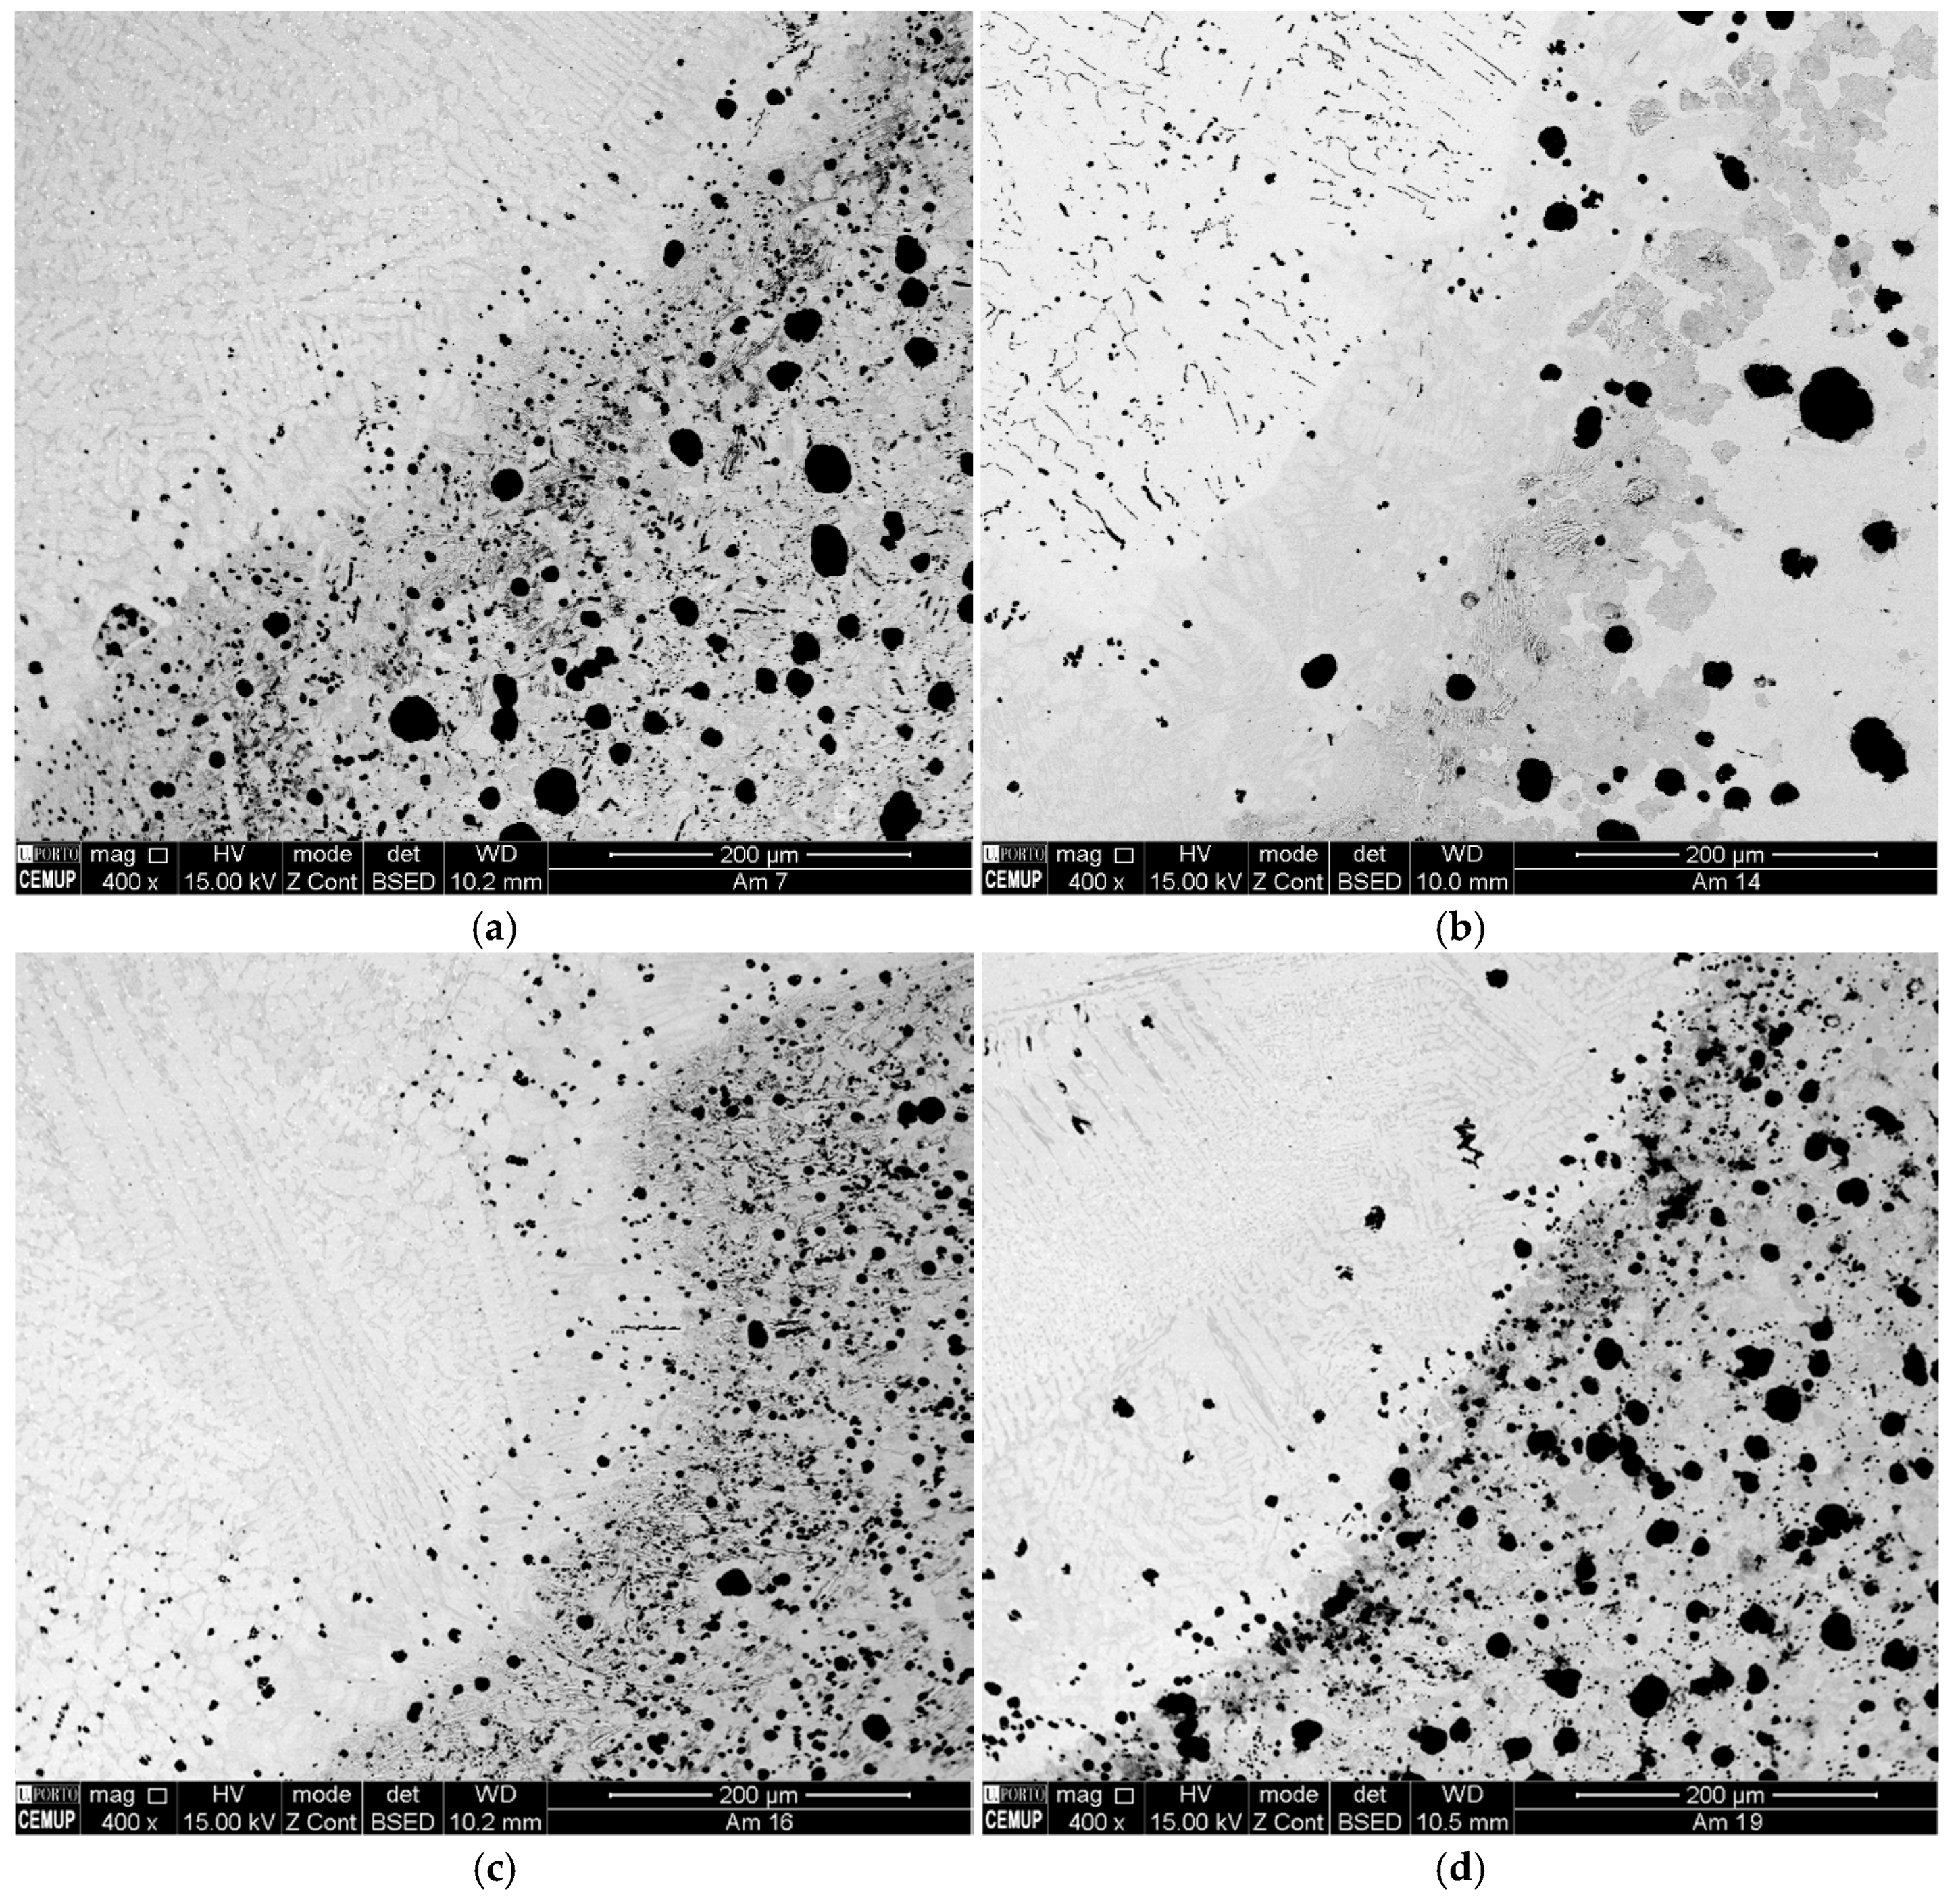
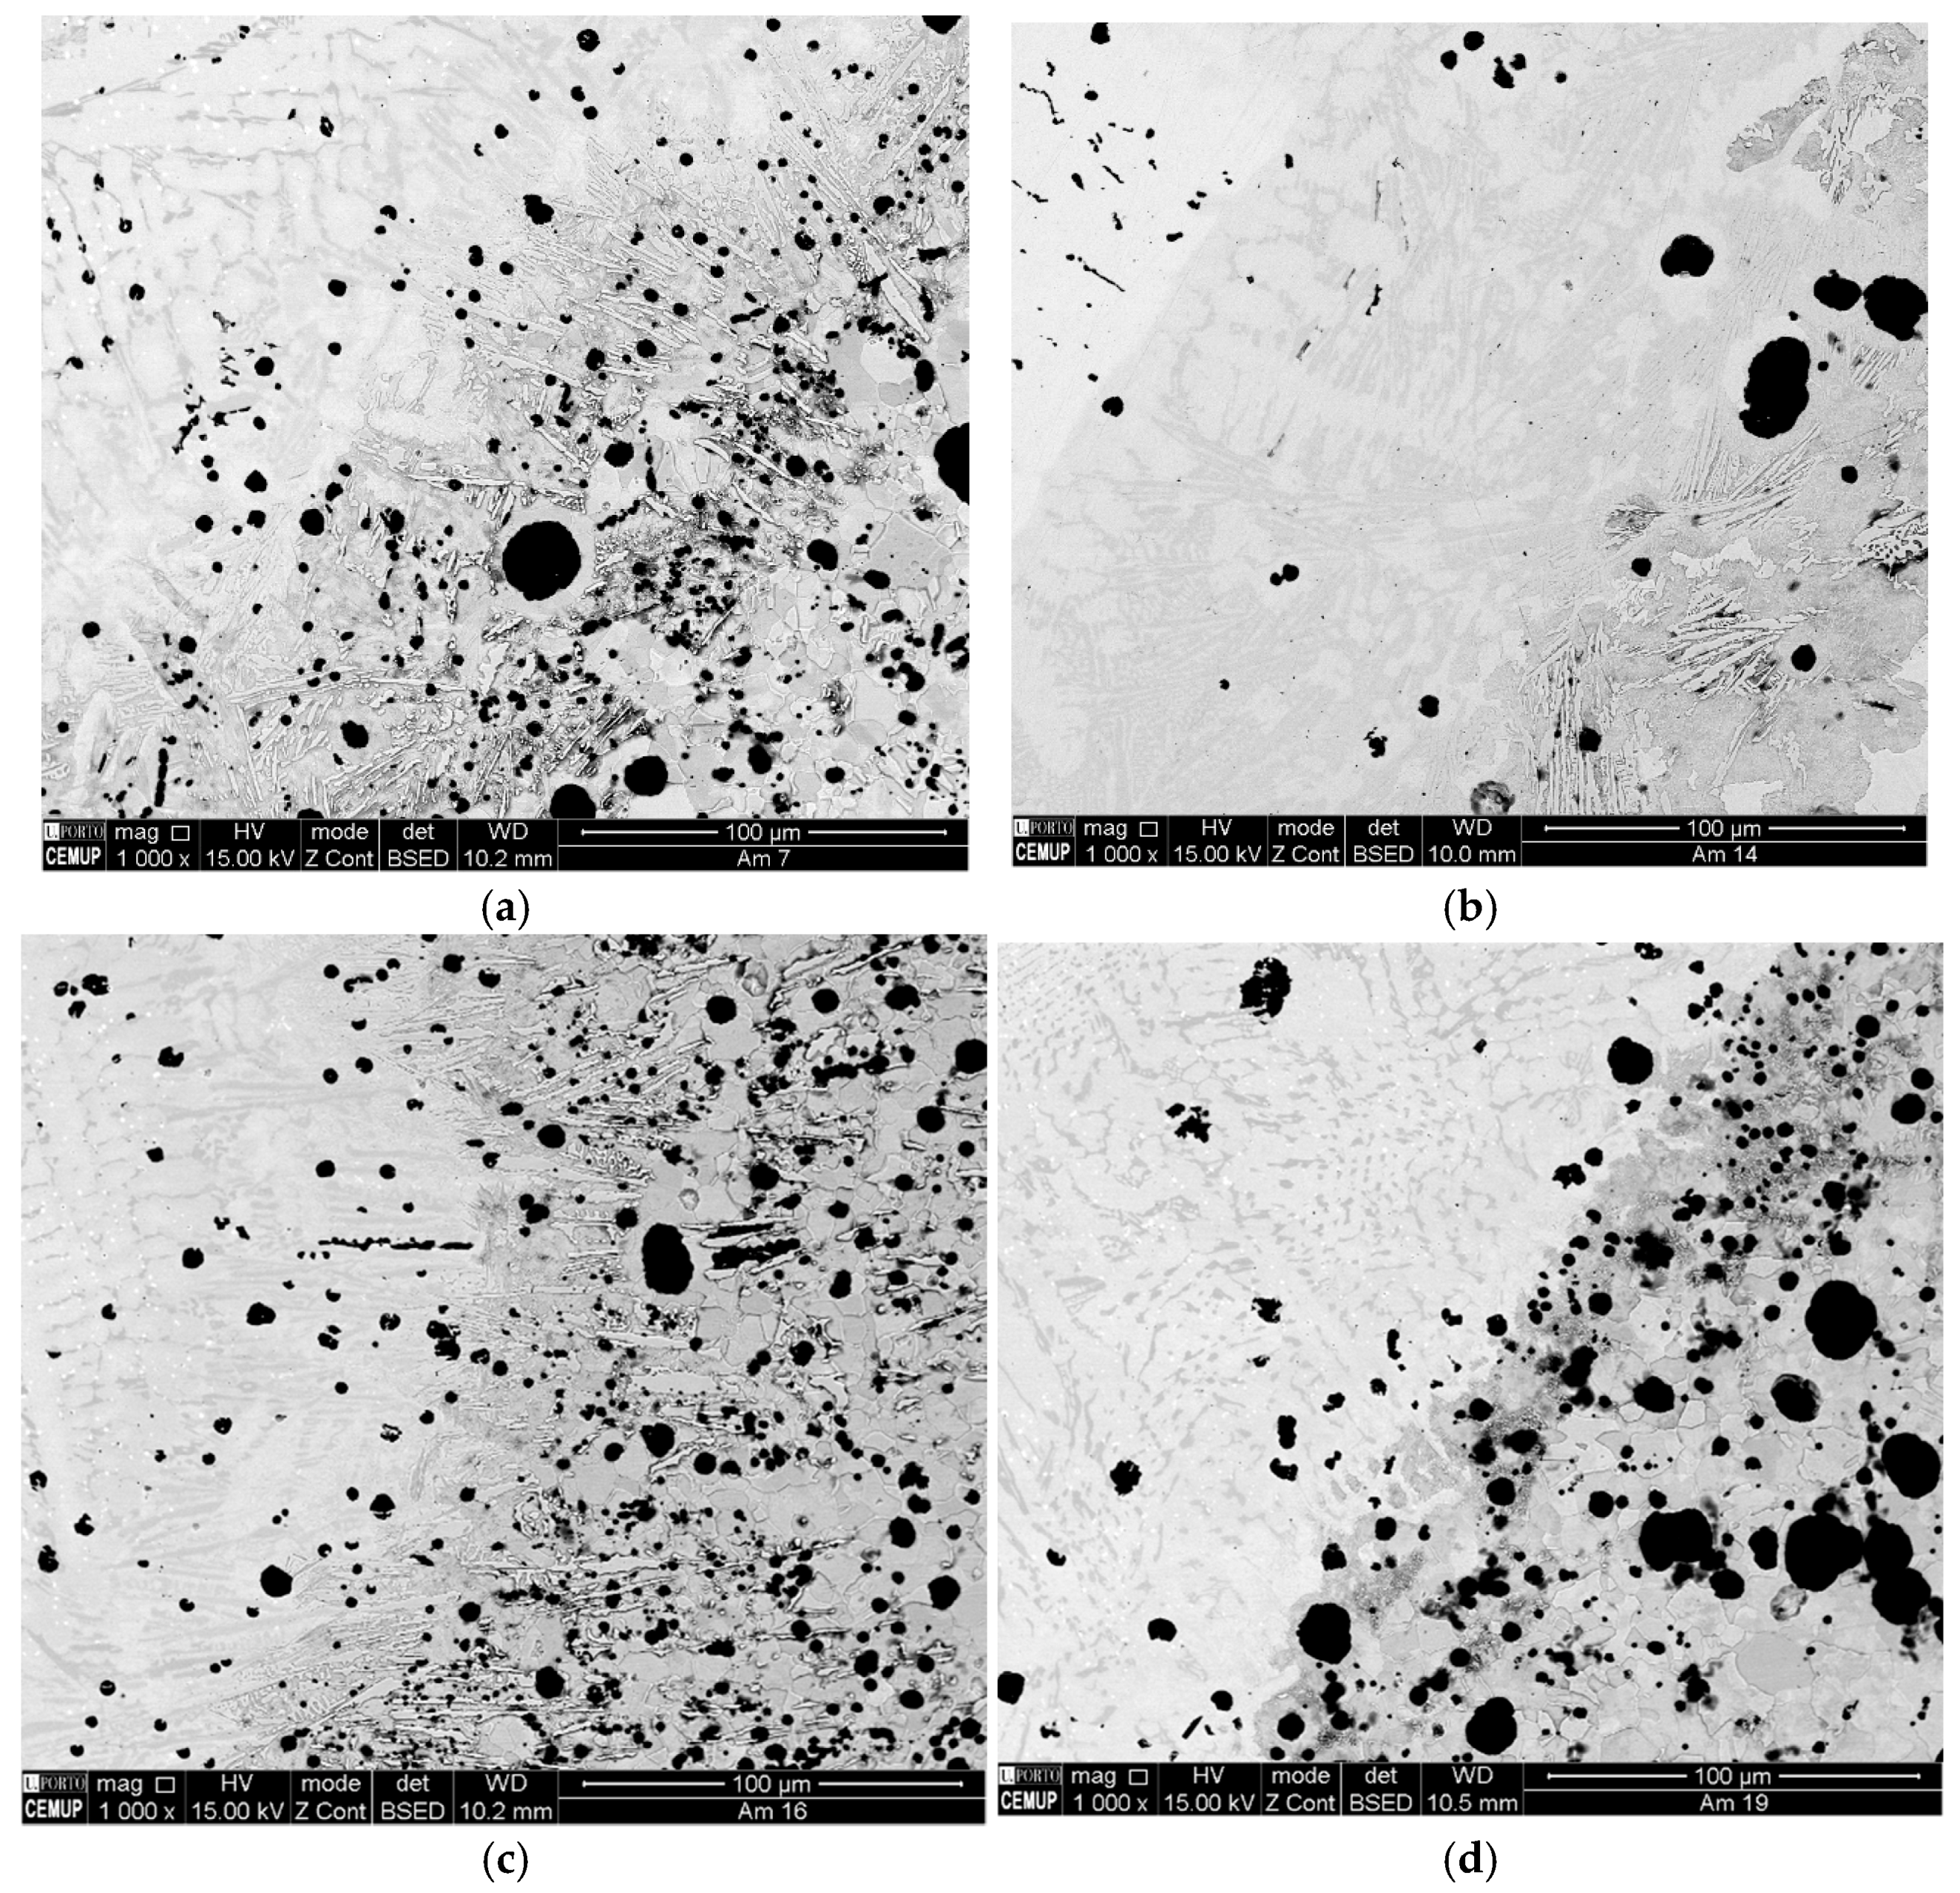
This work aimed to investigate the weldability of a high strength ductile cast iron with 700 MPa tensile strength. Its microstructure was composed mainly of graphite nodules surrounded by ferrite rings in a structure typically designated by “bull’s eye”. Different preheating and PWHT were carried out in order to determine the conditions that allow attainment of the highest value in terms of tensile strength, studying, as well, the hardness profile in the welded area as well as potential material phase transformations.

2. Materials and Methods

2.1. Sibodur® 700-10

The material chosen for this study was a high strength DCI, patented and distributed by Georg Fischer (GF), which was developed mainly for the automotive industry. This DCI has a very impressive set of mechanical properties when compared to other cast irons. As hinted by its commercial name, SiboDur® 700-10, it has a minimum UTS of approximately 700 MPa and an average strain of 6–12% in the as-cast state and therefore, is commonly utilized to create chassis and drivetrain-related components for automobiles, such as wheel hubs, suspension arms and chassis bracings. According to the supplied data sheet, the main chemical composition of the tested material was (wt %) C% 3.35–3.65, Si% 2.8–3.3, Mn% 0.15–1.0 and Cu% 0.5–1.1. Microstructurally, this DCI has a pearlitic matrix with a typical bull-eye look (between 60% and 90%). These, and other material properties, can be seen in Table 1.

2.2. Sample Preparation

Raw material was provided by the manufacturer and received in the format of cylindrical bars with 190 mm of length and 3 different diameters (Ø1 = 46 mm, Ø2 = 38 mm and Ø3 = 36 mm). Based on this geometry, a test specimen was devised with dimensions of 61 × 31 × 4 mm3 and a chamfered 45° edge. This geometry enabled us to extract the highest amount of test specimens per raw material bar. Test specimen creation involved several machining (turning and milling) and saw cutting operations in order to obtain the final geometry. A total of 42 test specimens were created, which were then welded together at their chamfered edge, forming a test sample. A total of 21 test samples were created.

2.3. Sample Reference Coding

Seven different preparation parameters/thermal treatment conditions were tested, in an effort to determine the most successful method to heat treat the selected material. A total of 21 test samples were created (three samples for each condition). Therefore, to aid data processing, a codification sequence was created, to help keep track of the conditions that originated each test specimen. Shown below is the generic example of the created coding sequence:
CP_Px_N_Px_Wz_Py
where:
  • CP—Sample number;
  • x—Pre-heating cycle temperature (°C);
  • y—Post-welding heat treatment cycle temperature (°C);
  • 1st P—First pre-weld heat cycle, at temperature x (x is equal to zero if no heat cycle is used);
  • N—Pre-addition of nickel to chamfered edge (N only appears when nickel is used);
  • 2nd P—Second pre-weld heat cycle, at temperature x (x is equal to zero if no heat cycle is used);
  • W—Welding, with Inconel as FM;
  • z—Number of weld passes;
  • 3rd P—Post-weld heat cycle, at temperature y (y is equal to zero if no heat cycle is used).

2.4. Heating Cycle Parameters

Heat cycles were tested in order to evaluate which sequence promoted the strongest joint, be it either pre-welding, post-welding or a combination of both heat treatments. The temperatures profiles were chosen based on the work developed in [20,24], consisting of either 300 °C or 700 °C heat cycles for pre-heating treatments and either 700 °C or 800 °C for PWHT. A map of the sequence/parameters used for each group of samples can be seen in Table 2. The utilized equipment was a Nabertherm N 11/H (Nabertherm GmbH, Lilienthal, Germany) muffle furnace.
Samples which received a nickel surface enrichment treatment were subjected to two pre-heating cycles before joint welding. The procedure for these samples was as follows: execution of a pre-heating cycle before the nickel surface enrichment, deposition of nickel on the chamfered edge of the sample with aid of a nickel welding electrode, removal of excess material to restore the initial chamfer geometry, followed by a second pre-heating cycle, performed before joint welding. Samples were transported inside a refractory material box to the welding station in order to minimize temperature drops.

2.5. Welding Parameters

The welding process selected to join the test specimens was shielded metal arc welding (SMAW). This process was selected following the same line of thought discussed in [24]. The equipment utilized was an OERLIKON welder, model SAXOTIG 1600 (OERLIKON, Pfäffikon, Switzerland).
To perform the nickel surface enrichment on the chamfered edge of the test samples, an FN 10 electrode (ref. AWS SFA 5.15: E Ni Cl with a nickel content above 98%) with a diameter of 2.5 mm was chosen. As recommended by the electrode manufacturer, a positive pole connection was used in conjunction with a 60 A setting. To join the test samples, an Inconel LR 82 (ref. AWS SFA 5.11: E Ni Cr Fe-3) electrode was chosen with a chemical composition of (wt %) Ni% 67 minimum; Cr% 16; Fe% 7; C% 0.04; Si% 0.4; Mn% 7.5; and Nb% 2 and a diameter of 2.5 mm. An 80 A setting was used with an arc voltage of 25 V (82 V of empty voltage). Two weld passes were executed at a travel speed of 90 mm per minute.

2.6. Sample Parameters

Table 2 shows the conditions by which each sample group was created. For a better understanding of the reference coding used, please refer to Section 2.3.

2.7. Weld Joint Analysis

The quality, internal soundness and properties of the welded joints were evaluated based on several non-destructive tests. Besides assessing the quality of the weld joint, these tests also allowed us to evaluate how neighboring microstructures of the weld area were affected during welding (e.g., the HAZ).
Nondestructive tests consisted of visual inspection, penetrating dye testing, magnetic particle testing and X-ray inspection.
Executed destructive tests were tensile testing, hardness testing and metallographic analysis, allowing us to determine several mechanical properties of the welded joints, such as ultimate tensile strength, strain, hardness profile throughout the welded joint, and changes in the material’s microstructure.
All previously-mentioned tests followed the same methodology, equipment and standards discussed in [24]. In particular, Table 3 shows the different international standards used for each test method.

3. Results

3.1. Tensile Test Results

Tensile test results are of great importance, as they give a direct indication of the mechanical capabilities of a welded joint by measuring its UTS and strain. They also allow for a quick assessment regarding the viability of a given heat treatment methodology, as the closer the results are to those of base material (BM) the better. As can be seen in Table 4, the returned test results of welded samples are all noticeably lower than those shown by the stock material.
The average UTS dropped significantly in all welded samples, as can be seen in Table 5. The sample which achieved the highest UTS and strain results was from the P0_P0_W_P700 group, a group which also achieved the highest average UTS of 399.1 MPa. However, this value corresponds roughly to 59.8% of the initial strength registered by the stock cast iron. A large decrease in strain is also noticeable in all samples; the P0_P0_W_P700 group of samples achieved the best average outcome (approximately 50% of the initial capability of the non-welded material).
During testing, all samples achieved failure due to rupture initiating in the HAZ region of the welded joint, with cracks propagating throughout the border region between the FM and BM.

3.2. Metallography Inspection

Due to the low UTS results achieved during testing, only four samples were chosen to be viewed using SEM microscopy. Each selected sample represents the one that achieved the highest UTS of a given group. Four groups were chosen: the top three ranking groups in terms of average UTS (samples 7_P0_P0_W_P700, 16_P300_N_P700_W_P0 and 19_P0_P300_W_P700) as well as the highest scoring sample of the group that did not receive any type of heat treatment after welding (sample 14_P0_P0_W_P0).
The microstructure of the BM was also analyzed under a microscope (seen in Figure 1), showing graphite nodules surrounded by ferrite (typical bull-eye structure), distributed uniformly in a pearlite matrix. This structure is in accordance with what is specified by the manufacturer.
Figure 2, Figure 3 and Figure 4 show the results from the SEM analysis for samples 7_P0_P0_W_P700, 14_P0_P0_W_P0, 16_P300_N_P700_W_P0 and 19_P0_P300_W_P700 at 200×, 400× and 1000× magnification, respectively. The BM can be seen on the lower right-hand side of the images, while the FM can be seen in the upper left-hand side of the images. The HAZ and weld interface region can be seen along the upward left to right diagonal section of the image.
When viewing the retrieved images, it is possible to differentiate specific features between each sample, such as the width of the HAZ, the dimension of the graphite nodules and the metallographic structures that are present.
When viewing Figure 2 at 200× magnification, it is possible to observe that each sample has a distinct HAZ width—Figure 2d shows the narrowest while Figure 2c shows the widest. Variation in graphite nodule dimensions is also seen from sample to sample. In Figure 2a,c,d, there is a reduction of nodule size in the BM, while in Figure 2b, nodule dimensions are relatively unaltered. In Figure 2a,d, nodule size is consistent up until the HAZ region where a decrease in size occurs near the weld interface. Carbon diffusion from the BM to FM can be seen in all samples (seen by the narrow band of scattered small graphite nodules on the FM side of the weld); however, the degree at which it occurs varies depends on the sample. Figure 2a,b shows lower amounts of diffused carbon nodules with shallow penetration into the FM, while Figure 2c,d denotes a higher concentration and penetration of diffused carbon into the FM. It is noteworthy that Figure 2c (the only observed sample that received a nickel surface enrichment treatment before welding) demonstrates smaller sized diffused carbon nodules than all other samples.
Figure 3 allows a closer view at 400× magnification. It is possible to notice that some graphite nodules in Figure 3a are surrounded by a lighter-colored circular structure. This type of structure usually signifies carbon impoverishment of the graphite nodules. It is also possible to observe a small presence of needle typed structures near the weld interface which are consistent with the microstructure of ledeburite. As commented previously, graphite nodule size remains relatively similar up until the joint interface, showing only a small decrease near the FM area. When viewing Figure 3b it is possible to observe that the BM has retained its initial pearlitic structure with large graphite nodules, while all other samples show a more ferritic structure with smaller nodules. Some presence of ledeburite can also be seen in this sample. When analyzing Figure 3c, a large decrease in nodule size is observable in the HAZ region as well as a presence of some diffused carbon into the FM area, showing that the presence of nickel was not able to completely avoid the carbon diffusion phenomenon. Nevertheless, the dimensions of these nodules are among the smallest seen in all samples. This sample also shows the highest concentration of ledeburite (throughout the HAZ area) of all viewed samples. Figure 3d shows graphite nodules of a consistent size, up until the weld interface, as well as deeper diffusion in the FM.
When viewing at 1000× magnification (Figure 4), different concentrations of ledeburite plus ferrite can easily be distinguished between the microstructures of all samples, being more predominant in Figure 4a,c. This ledeburite results from the rapid cooling after the welding process, which is not totally repaired by the further post-welding heat treatment. The same was noticed by El-Banna [23] in his work, when the samples were not subjected to pre-heating or even when subjected to pre-heating at a low temperature (200 °C). However, this author reports the formation of martensite in the HAZ, a situation not observed in this work. The different chemical compositions between materials and the further post-welding heat treatment were certainly the basis of these different behaviors. Nevertheless, the structures found by El-Banna [23] with pre-heating of 400 °C are very similar to the ones achieved in this work using just a post-welding heat treatment of 700 °C (as depicted in Figure 4), comprising a mix between ferrite and pearlite.
Sample 7_P0_P0_W_P700, which achieved the highest UTS of all tested samples, was subjected to surface element mapping, in order to assess the concentrations of different elements and their interactions throughout the joint after welding. The chemical composition of the BM was (wt %) C% 3.35–3.65, Si% 2.8–3.3, Mn% 0.15–1.0 and Cu% 0.5–1.1, while the FM (Inconel LR 82 electrode) had a chemical composition of (wt %) Ni% 67 minimum; Cr% 16; Fe% 7; C% 0.04; Si% 0.4; Mn% 7.5; and Nb% 2.
When viewing Figure 5b, it is possible to view the carbon element map, showing a very low concentration of carbon in the FM region near the HAZ region, making the shallow penetration of the diffused carbon into the FM easily observable. When compared with the findings of Pascual et al. [18], this low intensity of carbon diffusion generated a lower probability of forming brittle microstructures, such as martensite, ledeburite and hard carbides, which hinder mechanical properties due to their increased hardness.
Taking into account that the FM has high concentrations of nickel and chromium, the presence of these elements is more intense in the FM than the BM (as would be expected) shown in Figure 5c,e. Iron shows a higher presence in the BM; however, it is also present in the FM. Silicon was present in both areas of the sample (Figure 5f), being justified by silicon contamination during the sample preparation procedure (wet sanding and polishing with abrasive discs).
Figure 5 also illustrates the absence of metallic carbides of other elements, e.g., chromium carbides and nickel carbides, among others.

3.3. Hardness Test Results

A row of indentations was performed on the samples to determine the hardness profile of the welded joint. Figure 6 illustrates the hardness of different areas on the tested samples (BM, HAZ and FM) and allows us observe how it changes from region to region.
The hardness specification given by the manufacturer was 247–292 HV (240–290 HBW). Compared with the values shown in Figure 6, when measuring the hardness in the BM region of the welded joints, it is possible to observe that sample 14_P0_P0_W_P0 (non-heat-treated sample; Figure 6b) retained a similar hardness to what was specified, while the remaining samples saw a drop in this region. Conversely, the remaining samples demonstrated a higher hardness in the FM region than when compared to the non-heat-treated sample 14_P0_P0_W_P0. The hardness of the HAZ region in sample 14_P0_P0_W_P0 was the highest value recorded during testing in this area. Heat-treated samples followed a similar hardness profile trend. Moreover, these results are in line with the ones obtained by El-Banna [23], where the BM presented a moderate hardness, the HAZ showed average values and the FM represented the highest hardness values, due to the effect of the filler metal composition and the rapid cooling of the material in this area, where the highest temperature values are achieved during the welding process.

4. Discussion

Considering all the data collected, it is possible to state that a large decrease in UTS and strain is seen in all samples, independently of the methodology chosen for heat treating. The same effect has been shown by Pascual et al. [18] regarding the manual shielded metal arc welding of ductile iron with a ferritic-pearlitic-matrix and the following composition: C 3.7%, Ni 0.6%, Si 2.9% and Mn 0.7%. However, different methods promoted various results, allowing the establishment of a ranking that can be seen in Table 6.
When observing Table 6, it is possible to perceive that the two groups which achieved the highest UTS averages (P0_P0_W_P700 and P0_P300_W_P700) are closely matched in terms of UTS (vary 11.5 MPa from each other) and heat treatment methodology. These groups have in common the absence of Ni on the surface before welding and PWHT at 700 °C, thus indicating that performing a PWHT on its own has a better impact on mechanical properties than executing any other sequence of treatments tested.
The sample groups, P300_N_P700_W_P0 and P700_N_P700_W_P0, were subjected to pre-heating stages at 700 °C for 2 h and showed a UTS behavior similar to the samples discussed previously, having achieved average UTS of 361.4 MPa and 350.9 MPa, respectively. This behavior can be justified by the fact that high pre-heating temperatures lead to a lower cooling rates after welding. As discussed in [24,30], lower cooling rates avoid the formation of brittle and hard structures, such as martensite, which hinder mechanical strength, enabling a favorable microstructure to be maintained/created. Moreover, when the initial temperature of the material is high, the peak temperature that is reached during welding is higher than would be achieved when welding the sample at room temperature. This elevated peak temperature simulates a PWHT, as the material is maintained at a higher temperature for a longer period of time, being further prolonged by the deposition of each additional weld pass. Therefore, when lower pre-heating temperatures were implemented, this phenomenon did not take place, giving way to the appearance of fragile microstructures (as can be interpreted by the poor results given by samples created in these conditions). When contemplating the microstructural images retrieved during SEM analysis, the presence of ledeburite was encountered; however, harder microstructures, such as martensite or carbides (of any element), were not found. These results can be compared with the ones achieved by Pascual et al. [18], who did not detected the presence of carbides in the interface, which enhanced the ductility of the joint, improving the UTS registered in the tensile tests.
On the other hand, samples that were subjected to heat treatments at elevated temperatures suffered permanent microstructural changes to the BM, rearranging the initial pearlitic matrix configuration and lowering the overall hardness of the BM. This change did not occur in the non-heat-treated sample that was observed (sample 14_P0_P0_W_P0). However, due to this the lack of heat treatment, a very high hardness was found in the HAZ region of this sample, justifying the poor UTS returned by this group (seen in Figure 6).
Performing heat treatments at 800 °C generated the poorest results in terms of UTS and strain. This is due to the fact that the temperature of this stage is above the eutectoid temperature of Fe–C alloys (723 °C) and enabled major microstructural changes to occur, which altered mechanical properties of the material. These results can be compared with the ones found by El-Banna [23], who tested a similar ductile cast iron with bull-eye structure, with and without pre-heating processes carried out at 200 °C, 300 °C and 400 °C, stating that ledeburite carbides were formed in the fusion zone without pre-heating. However, when the cast iron was pre-heated at 400 °C, a mixed matrix of ferrite plus pearlite around the spheroidal graphite was detected in the fusion and heat affected zones.
In summary, it is possible to observe that DCIs with different UTS values (450 MPa and 700 MPa) present dissimilar structures and behaviors. The DCI with 700 MPA of UTS presents a ferritic bull-eye structure which is more sensitive to PWHT than pre-heating treatments. In this case, the temperatures developed in the welding process annul the effect produced by the pre-heating treatment and, due to the higher peak temperatures achieved, a longer conservation of heat is seen, which induces a lower cooling rate. This phenomenon is responsible for the formation of soft structures which promote a decrease in the joint’s UTS, a situation that cannot be contradicted by performing PWHT. When no heat treatments were performed, the hardness of the BM remained close to the original value, but increased significantly in the HAZ. Thus, this work allows us to observe that the best situation for this kind of DCI is to produce the joint without any pre-treatment and after welding, perform a PWHT in order to reduce the hardness and stresses accumulated in the HAZ region without disturbing the mechanical strength achieved in the joint. The diffusion of C into the FM was almost null and the structure in the HAZ and surroundings was changed both by pre-heat treatments and PWHT, missing the typical bull-eye aspect. Regarding the hardness values registered in the FM, a change in FM must be studied in order to keep hardness values closer to those of the BM.

5. Conclusions

Considering the data collected during this research, it is possible to affirm that, when welding samples of the chosen high strength ductile cast iron (SiboDur® 700-10) with a SMAW technique, the tested heat treatment parameters and sequences were unable to preserve/restore the cast iron’s initial mechanical properties. The methodology that achieved the highest results consisted of simply performing a PWHT at 700 °C for 2 h, allowing us, on average, to preserve roughly 60% of the cast iron’s initial UTS and 51% of its initial strain percentage. This treatment promotes stress relief (internal stress created during welding) allowing us to improve the mechanical behavior of the joint. However, it was observed that this PWHT altered the initial pearlitic microstructure of the BM, which led to a decrease in hardness of approximately 63% in this area. Therefore, lower PWHT temperatures should be tested as well as shorter cycle times in an attempt to minimize this phenomenon. Taking into account that the main application for welding DCI is to perform repairs on non-functional areas or areas under compressive loads of components, the UTS values achieved can be considered successful. The appearance of brittle microstructures, such as martensite and high hardness carbides were successfully avoided, and only the presence of ledeburite in different concentrations was observed. The chosen FM minimized the amount of carbon diffusion but promoted relatively high hardness values in the bead, suggesting that this option should be reconsidered in the future, opting perhaps for the use of an electrode with a different Inconel composition that is capable of keeping hardness values closer to the BM ones.
Several pre-heating treatments were tested with returned poor results, indicative once more that PWHT was more effective when treating this type of material. Nevertheless, PWHT temperatures were found to have a direct impact on mechanical strength. In fact, samples subjected to a PWHT at 800 °C for 2 h returned the lowest results, in terms of UTS and strain, of all executed trials.
Untreated, cold welds were also tested, and although the BM maintained its initial pearlitic structure, these samples exhibited poor results due to high hardness values encountered in the HAZ region of the weld. Even though the presence of martensite was not identified, this localized high hardness led to premature fracturing in the HAZ area during tensile testing. However, hardness measurements of the BM areas of these samples showed values within the manufacturer’s specifications.

Acknowledgments

The authors gratefully acknowledge Konrad Papis from Georg Fischer Automotive, A.G. for his crucial support, providing the raw material needed for this work. Authors also thank Rui Rocha from CEMUP for his strong commitment to the Authors’ needs, providing a critical analysis in SEM and EDS analyses.

Author Contributions

Ronny M. Gouveia carried out some analyses and wrote the paper; Francisco J. G. Silva conceived and designed the experiments, supervised the experimental work, carried out some analyses and helped in writing the paper; Olga C. Paiva conceived and designed the experiments, supervised the experimental work and provided critical analyses about metallurgical phenomena; Maria de Fátima Andrade prepared all samples and carried out some experimental work; Lucas Augusto Pereira carried out some experimental work; Paulo Cezar Moselli supervised Lucas Augusto Pereira; and Konrad J. M. Papis provided the raw material to carry out this work.

Conflicts of Interest

The authors declare no conflict of interest.

References

  1. Arabi-Jeshvaghani, R.; Shamanian, M.; Jaberzadeh, M. Enhancement of wear resistance of ductile iron surface alloyed by stellite 6. Mater. Des. 2011, 32, 2028–2033. [Google Scholar] [CrossRef]
  2. Iacoviello, F.; Di Cocco, V. Influence of the graphite elements morphology on the fatigue crack propagation mechanisms in a ferritic ductile cast iron. Eng. Fract. Mech. 2016, 167, 248–258. [Google Scholar] [CrossRef]
  3. Hütter, G.; Zybell, L.; Kuna, M. Micromechanisms of fracture in nodular cast iron: From experimental findings towards modeling strategies—A review. Eng. Frac. Mech. 2015, 144, 118–141. [Google Scholar] [CrossRef]
  4. Kolukisa, S. The effect of the welding temperature on the weldability in diffusion welding of martensitic (AISI 420) stainless steel with ductile (spheroidal graphite-nodular) cast iron. J. Mater. Process. Technol. 2007, 186, 33–36. [Google Scholar] [CrossRef]
  5. Blackmore, P.; Morton, K. Structure-property relationships in graphitic cast irons. Int. J. Fatigue 1982, 4, 149–155. [Google Scholar] [CrossRef]
  6. Davis, J. ASM Specialty Handbook: Cast Iron; ASM International: Geauga County, OH, USA, 1996; ISBN 978-0-87170-564-8. [Google Scholar]
  7. Cavallini, M.; Di Bartolomeo, O.; Iacoviello, F. Fatigue crack propagation damaging micromechanisms in ductile cast irons. Eng. Fract. Mech. 2008, 75, 694–704. [Google Scholar] [CrossRef]
  8. Konecna, R.; Nicoletto, G.; Bubenko, L.; Fintová, S. A comparative study of the fatigue behavior of two heat-treated nodular cast irons. Eng. Fract. Mech. 2013, 108, 251–262. [Google Scholar] [CrossRef]
  9. Mirhedayatian, S.; Vahdat, S.; Jelodar, M.; Saen, R. Welding process selection for repairing nodular cast iron engine block by integrated fuzzy data envelopment analysis and TOPSIS approaches. Mater. Des. 2013, 43, 272–282. [Google Scholar] [CrossRef]
  10. Chaengkham, P.; Srichandr, P. Continuously cast ductile iron: Processing, structures, and properties. J. Mater. Process. Technol. 2011, 211, 1372–1378. [Google Scholar] [CrossRef]
  11. Collini, L.; Pirondi, A.; Bianchi, R.; Cova, M.; Milella, P. Influence of casting defects on fatigue crack initiation and fatigue limit of ductile cast iron. Procedia Eng. 2011, 10, 2898–2903. [Google Scholar] [CrossRef]
  12. Ferro, P.; Lazzarin, P.; Berto, F. Fatigue properties of ductile cast iron containing chunky graphite. Mater. Sci. Eng. A 2012, 554, 122–128. [Google Scholar] [CrossRef]
  13. Collini, L.; Pirondi, A. Fatigue crack growth analysis in porous ductile cast iron microstructure. Int. J. Fatigue 2014, 62, 258–265. [Google Scholar] [CrossRef]
  14. Iacoviello, F.; Di Cocco, V. Degenerated graphite nodules influence on fatigue crack paths in a ferritic ductile cast iron. Frat. Integritá Strutt. 2015, 9, 406–414. [Google Scholar]
  15. Sun, D.; Gu, X.; Liu, W.; Xuan, Z. Welding consumable research for austempered ductile iron (ADI). Mater. Sci. Eng. A 2005, 402, 9–15. [Google Scholar] [CrossRef]
  16. Automotive, G.F. Ductile Iron: SiboDur® and GJS Family. Material Data Sheets, Research and Development; Georg Fischer Automotive: Schaffhausen, Switzerland, 2015. [Google Scholar]
  17. Santos, J.; Gouveia, R.; Silva, F. Designing a new sustainable approach to the change for lightweight materials in structural components used in truck industry. J. Clean. Prod. 2017, 164, 115–123. [Google Scholar] [CrossRef]
  18. Pascual, M.; Cembrero, J.; Salas, F.; Pascual-Martínez, M. Analysis of the weldability of ductile iron. Mater. Lett. 2008, 62, 1359–1362. [Google Scholar] [CrossRef]
  19. Askary-Paykani, M.; Shayan, M.; Shamanian, M. Weldability of Ferritic Ductile Cast Iron Using Full Factorial Design of Experiment. J. Iron Steel Res. Int. 2014, 21, 252–263. [Google Scholar] [CrossRef]
  20. El-Banna, E.; Nageda, M.; El-Saadat, M. Study of restoration by welding of pearlitic ductile cast iron. Mater. Lett. 2000, 42, 311–320. [Google Scholar] [CrossRef]
  21. Winiczenko, R.; Salat, R.; Awtoniuk, M. Estimation of tensile strength of ductile iron friction welded joints using hybrid intelligent methods. Trans. Nonferr. Met. Soc. China 2013, 23, 385–391. [Google Scholar] [CrossRef]
  22. Ebrahimnia, M.; Ghaini, F.; Gholizade, S.; Salari, M. Effect of cooling rate and powder characteristic on the soundness of heat affected zone in powder welding of ductile cast iron. Mater. Des. 2012, 33, 551–556. [Google Scholar] [CrossRef]
  23. El-Banna, E. Effect of preheat on welding of ductile cast iron. Mater. Lett. 1999, 41, 20–26. [Google Scholar] [CrossRef]
  24. Gouveia, R.; Silva, F.; Paiva, O.; Andrade, M.; Silva, L.; Moselli, P.; Papis, K. Study of the Heat-Treatments Effect on High Strength Ductile Cast Iron Welded Joints. Metals 2017, 7, 382. [Google Scholar] [CrossRef]
  25. Pouranvari, M. On the weldability of grey cast iron using nickel based filler metal. Mater. Des. 2010, 31, 3253–3258. [Google Scholar] [CrossRef]
  26. Pascual, M.; Ferrer, C.; Rayón, E. Weldability of spheroidal graphite ductile cast iron using Ni/Ni-Fe electrodes. In Revista de Metalurgia; Departmento de Publicaciones del CSIC: Madrid, Spain, 2009; Volume 45, pp. 334–338. [Google Scholar]
  27. Xu, G.; Kutsuna, M.; Liu, Z.; Zhang, H. Characteristics of Ni-based coating layer formed by laser and plasma cladding processes. Mater. Sci. Eng. A. 2006, 417, 63–72. [Google Scholar] [CrossRef]
  28. Kesavan, D.; Kamaraj, M. The microstructure and high temperature wear performance of a nickel base hardfaced coating. Surf. Coat. Technol. 2010, 204, 4034–4043. [Google Scholar] [CrossRef]
  29. Kelly, J.; Bishel, R.; Wilson, R. Welding of Ductile Iron with Ni-Fe-Mn Filler Metal. Weld. Res. Suppl. 1985, 1, 79s–85s. [Google Scholar]
  30. Connor, L.P. Welding technology. In Welding Hand Book, 8th ed.; American Welding Society: Miami, FL, USA, 1987; Volume 1, pp. 169–178. ISBN 978-0871712813. [Google Scholar]
Figure 1. BM microstructure (magnification 200×).
Metals 08 00072 g001
Figure 2. SEM microscopic analysis at 200× magnification with a 4% Nital etching; (a) sample 7_P0_P0_W_P700 (UTS = 434.7 MPa); (b) sample 14_P0_P0_W_P0 (UTS = 344.7 MPa); (c) sample 16_P300_N_P700_W_P0 (UTS = 401.8 MPa); (d) sample 19_P0_P300_W_P700 (UTS = 405.7 MPa).
Metals 08 00072 g002
Figure 3. SEM microscopic analysis at 400× magnification with a 4% Nital etching; (a) sample 7_P0_P0_W_P700 (UTS = 434.7 MPa); (b) sample 14_P0_P0_W_P0 (UTS = 344.7 MPa); (c) sample 16_P300_N_P700_W_P0 (UTS = 401.8 MPa); (d) sample 19_P0_P300_W_P700 (UTS = 405.7 MPa).
Metals 08 00072 g003
Figure 4. SEM microscopic analysis at 1000× magnification with a 4% Nital etching; (a) sample 7_P0_P0_W_P700 (UTS = 434.7 MPa); (b) sample 14_P0_P0_W_P0 (UTS = 344.7 MPa); (c) sample 16_P300_N_P700_W_P0 (UTS = 401.8 MPa); (d) sample 19_P0_P300_W_P700 (UTS = 405.7 MPa).
Metals 08 00072 g004
Figure 5. Element surface mapping at 200× magnification of sample 7_P0_P0_W_P700 (UTS = 434.7 MPa); (a) overview of mapped area; (b) carbon map; (c) chromium map; (d) iron map; (e) nickel map; (f) silicon map.
Metals 08 00072 g005
Figure 6. Hardness inspection results; (a) hardness profile for sample 7_P0_P0_W_P700 (UTS = 434.7 MPa); (b) hardness profile for sample 14_P0_P0_W_P0 (UTS = 344.7 MPa); (c) hardness profile for sample 16_P300_N_P700_W_P0 (UTS = 401.8 MPa); (d) hardness profile for sample 19_P0_P300_W_P700 (UTS = 405.7 MPa).
Metals 08 00072 g006
Table 1. Base material main properties [16].
Base Material Mechanical Properties
Ultimate Yield Strength (rm)≥700 n/mm2Hardness (hb)240–290 HBW
Offset Yield Strength (rp0.2)≥440 n/mm2Density (ρ)6.9 (600 °C) g/cm3
Strain (a)≥6–12%Iso-v Notch Impact (ak)2 (−40 °C) 5 (RT 1) J/cm2
Offset Compressive Strength (σd0.2)≥370 n/mm2Thermal Expansion Coefficient11.8 (20–10 °C) 13.7 (20–60°C) 10−6/K
Shear Stress (tab)≥545 n/mm2Specific Thermal Capacity0.52 (100 °C) 0.73 (600 °C) J/(g·K)
Young’s Modulus (e)176 (RT1) 154 (400 °C) kn/mm2Specific Electrical Resistivity0.62 (RT 1) 0.77 (600 °C) µΩ·m
Shear Modulus (g)68 kn/mm2Thermal Conductivity 28.8 (100 °C) 26.5 (600 °C) W/(K·m)
1 Room Temperature.
Table 2. Specific parameters used for each sample group during the creation of test specimens.
Sample ReferenceParameters/Sequence
1st Pre-Weld Heat CycleNi Edge Weld Deposition2nd Pre-Weld Heat CycleInconel Joint WeldingPost-Weld Heat Cycle
1_P300_N_P300_W_P0300 °C/2 h60 A/2 passes300 °C/2 h80 A/2 passes-
2_P300_N_P300_W_P0
3_P300_N_P300_W_P0
4_P700_N_P700_W_P0700 °C/2 h60 A/2 passes700 °C/2 h80 A/2 passes-
5_P700_N_P700_W_P0
6_P700_N_P700_W_P0
7_P0_P0_W_P700---80 A/2 passes700 °C/2 h *
8_P0_P0_W_P700
9_P0_P0_W_P700
10_P0_P0_W_P800---80 A/2 passes800 °C/2 h *
11_P0_P0_W_P800
12_P0_P0_W_P800
13_P0_P0_W_P0---80 A/2 passes-
14_P0_P0_W_P0
15_P0_P0_W_P0
16_P300_N_P700_W_P0300 °C/2 h60 A/2 passes700 °C/2 h80 A/2 passes-
17_P300_N_P700_W_P0
18_P300_N_P700_W_P0
19_P0_P300_W_P700--300 °C/2 h80 A/2 passes700 °C/2 h *
20_P0_P300_W_P700
21_P0_P300_W_P700
* Samples slowly cooled to room temperature inside muffle furnace.
Table 3. Test procedures and standards.
Test ProcedureStandard
Visual inspectionISO 17633 (2003)
Penetrating dyeISO 23277 (2015)
Magnetic particleISO 23278 (2009)
Tensile testingISO 4136 (2012)
Hardness testingISO 9015-1 (2001)
Metallographic analysisISO 17639 (2003)
Table 4. Tensile test results for created samples.
Sample ReferenceTensile Test Results
UTS (MPa)Average UTS (MPa)Strain (%)Average Strain (%)
BM_1687.0667.3 ± 17.6219.517.7 ± 2.62
BM_2644.214.0
BM_3670.719.7
1_P300_N_P300_W_P0270.6256.4 ± 10.555.015.3 ± 1.00
2_P300_N_P300_W_P0245.44.43
3_P300_N_P300_W_P0253.16.44
4_P700_N_P700_W_P0377.1350.9 ± 26.219.318.2 ± 1.16
5_P700_N_P700_W_P0321.67.03
6_P700_N_P700_W_P0353.88.31
7_P0_P0_W_P700434.7399.1 ± 35.5711.19.0 ± 2.14
8_P0_P0_W_P700360.56.82
9_P0_P0_W_P700402.18.91
10_P0_P0_W_P800174.0210.5 ± 34.513.243.8 ±0.62
11_P0_P0_W_P800245.54.43
12_P0_P0_W_P800212.03.71
13_P0_P0_W_P0335.6334.2 ± 11.214.324.3 ± 0.40
14_P0_P0_W_P0344.74.72
15_P0_P0_W_P0322.43.94
16_P300_N_P700_W_P0401.8361.4 ± 28.6710.28.6 ± 1.09
17_P300_N_P700_W_P0338.57.70
18_P300_N_P700_W_P0343.97.92
19_P0_P300_W_P700405.7387.6 ± 18.129.618.4 ± 1.22
20_P0_P300_W_P700371.57.23
21_P0_P300_W_P700385.58.30
Table 5. Percentage of average UTS and strain in comparison with tested reference values of BM.
Sample GroupsUTS% UTS * (%)Strain (%)% Strain (%) *
BM667.3-17.7-
P0_P0_W_P700399.159.89.0250.8
P0_P300_W_P700387.658.18.4147.5
P300_N_P700_W_P0361.454.28.6048.6
P700_N_P700_W_P0350.952.68.2346.3
P0_P0_W_P0334.250.14.7226.6
P300_N_P300_W_P0256.438.45.3029.9
P0_P0_W_P800210.531.53.8121.5
* Percentage retained of a given property in comparison to BM (reference value).
Table 6. Comparison between test results and heat treatment methodologies.
Group of ParametersAverage UTS (MPa)Average Strain (%)1st Pre-Weld Heat CycleNi Edge Weld Deposition2nd Pre-Weld Heat CycleInconel Joint WeldingPost-Welding Heat Treatment (PWHT)
BM667.317.7-----
P0_P0_W_P700399.19.03---80 A/2 passes700 °C/2 h
P0_P300_W_P700387.68.41--300 °C/2 h80 A/2 passes700 °C/2 h
P300_N_P700_W_P0361.48.60300 °C/2 h60 A700 °C/2 h80 A/2 passes-
P700_N_P700_W_P0350.98.22700 °C/2 h60 A700 °C/2 h80 A/2 passes-
P0_P0_W_P0334.24.71---80 A/2 passes-
P300_N_P300_W_P0256.45.32300 °C/2 h60 A300 °C/2 h80 A/2 passes-
P0_P0_W_P800210.53.84---80 A/2 passes800 °C/2 h

