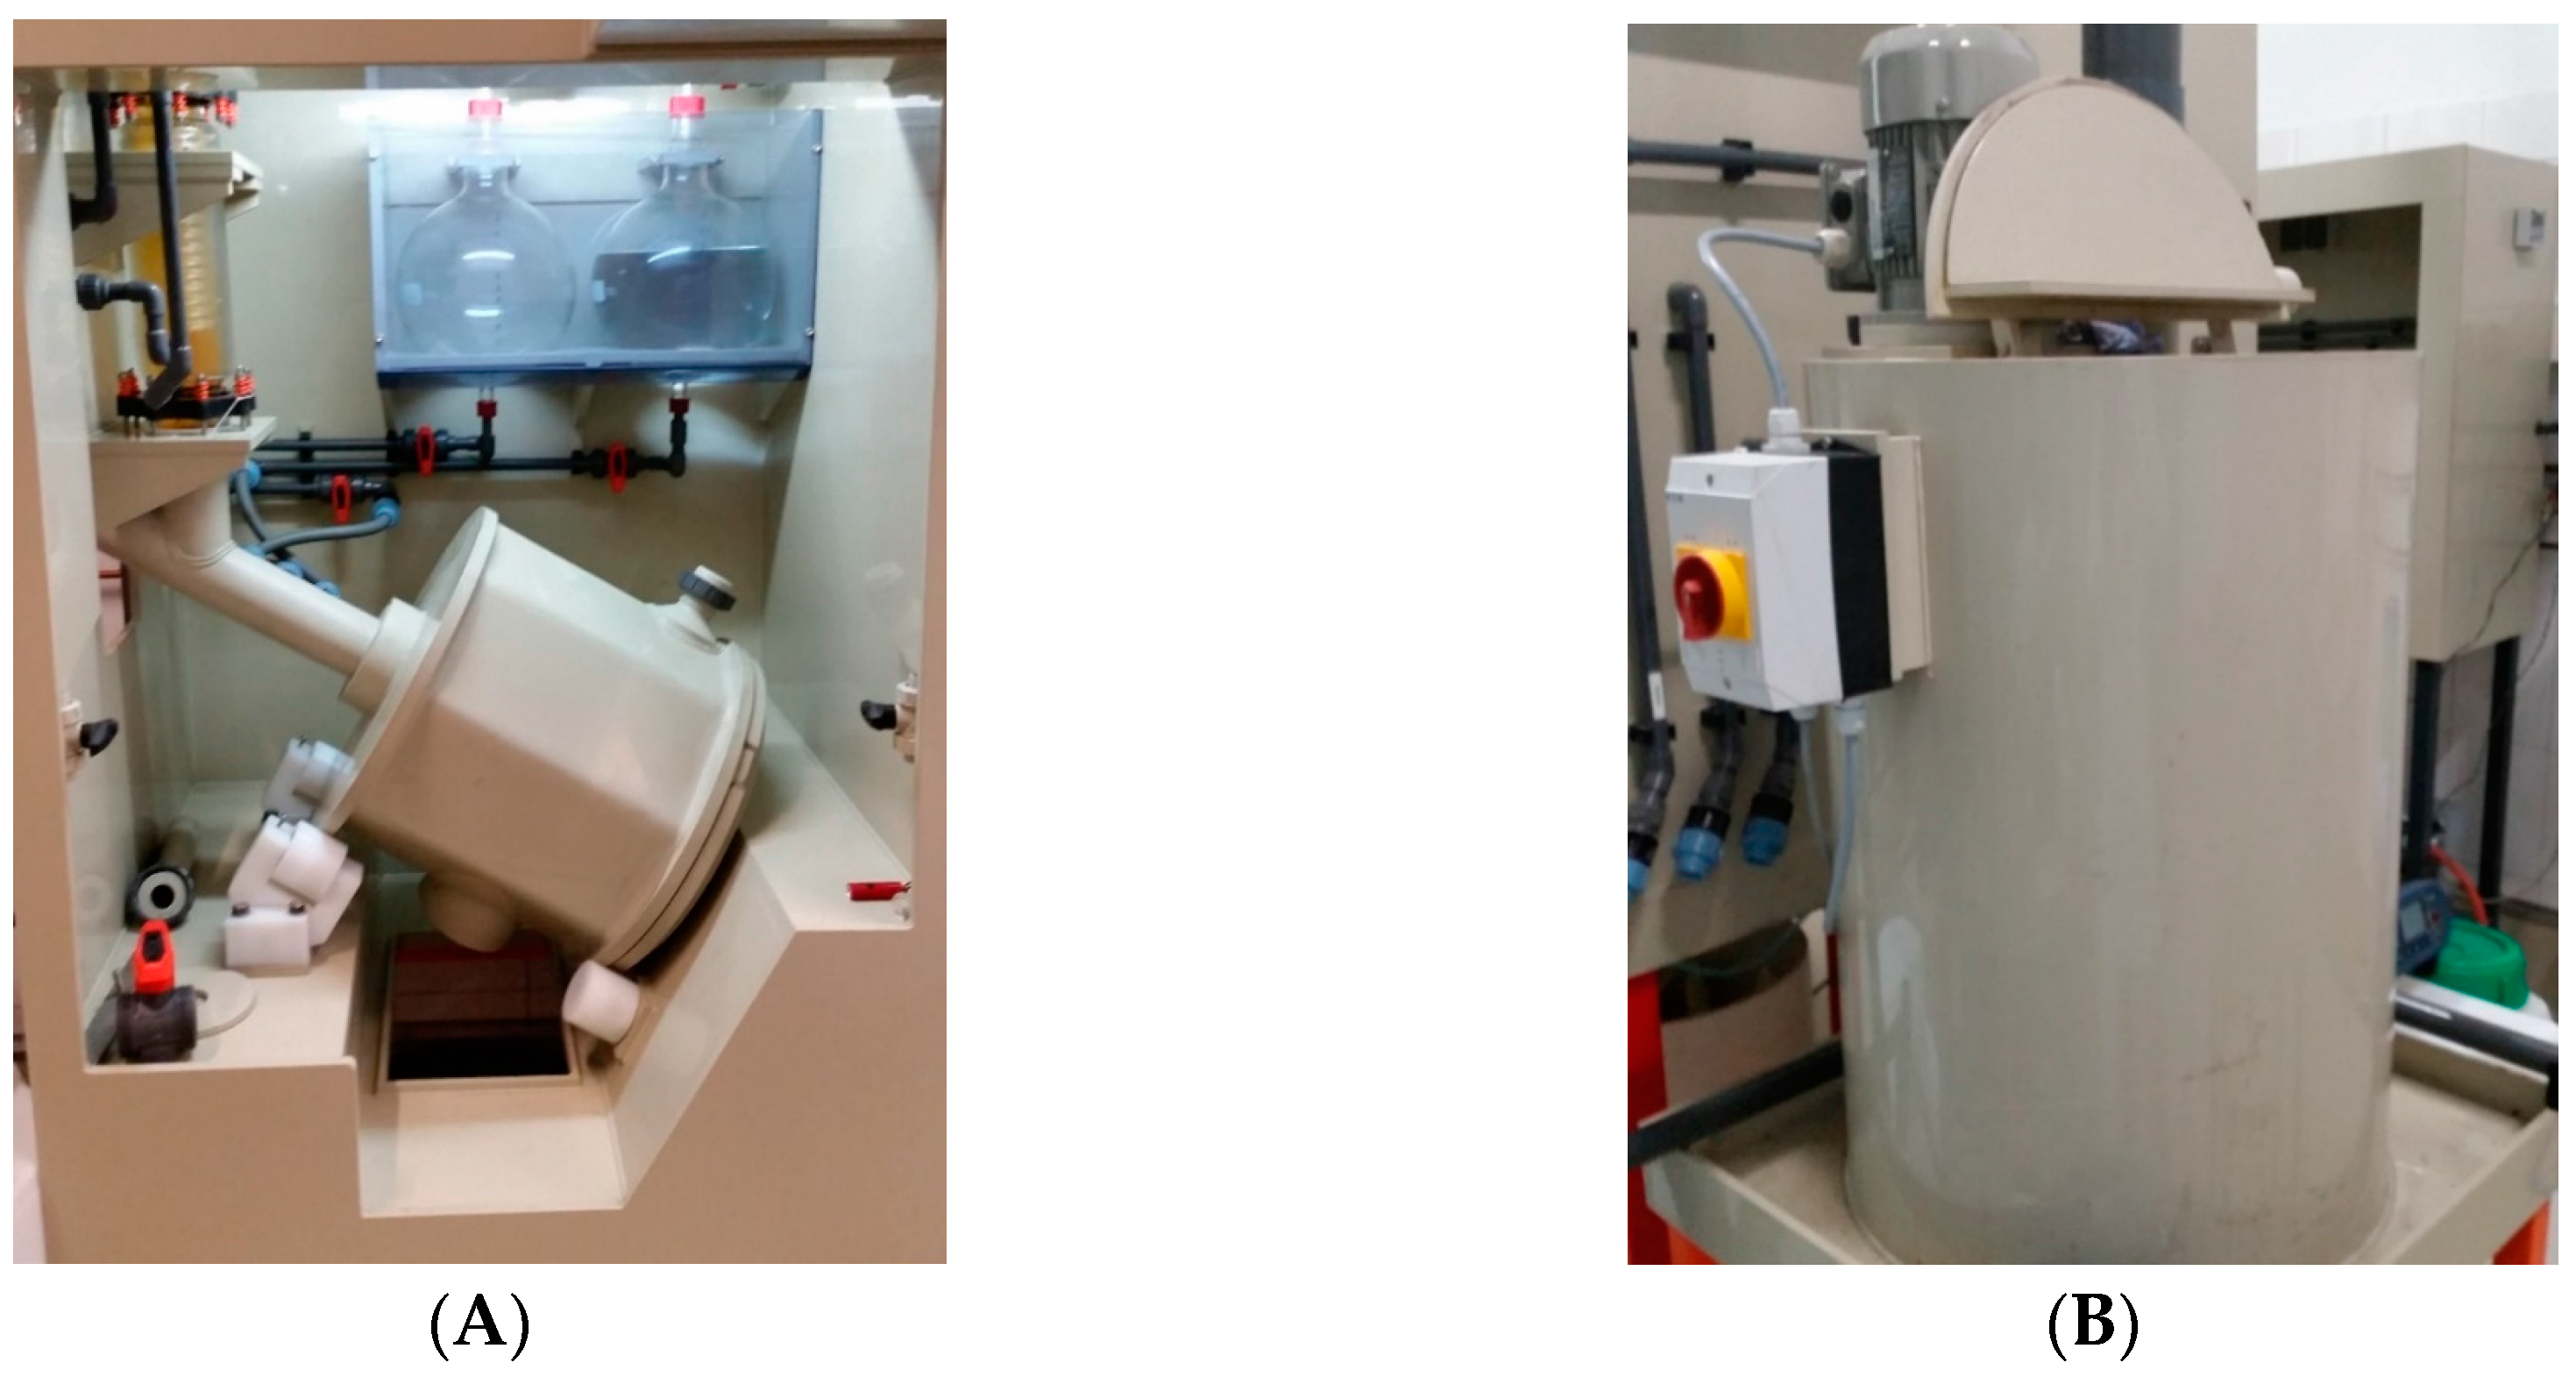
Article

Alternative Silver Production by Environmental Sound Processing of a Sulfo Salt Silver Mineral Found in Bolivia

1
Institute of Process Metallurgy and Metal Recycling, RWTH-Aachen University, Intzestr. 3, 52056 Aachen, Germany
2
Institute of Applied Mineralogy and Economic Geology, RWTH-Aachen University, Wüllnerstr. 2, D-52062 Aachen, Germany
3
Unit of Mineral Processing, RWTH Aachen University, Lochnerstr. 4-20, D-52064 Aachen, Germany
*
Author to whom correspondence should be addressed.
Metals 2018, 8(2), 114; https://doi.org/10.3390/met8020114
Submission received: 27 October 2017 / Revised: 29 January 2018 / Accepted: 2 February 2018 / Published: 7 February 2018

Abstract

:
Very often, the production of silver causes devastating environmental issues, because of the use of toxic reagents like cyanide and mercury. Due to severe environmental damage caused by humans in the last decades, the social awareness regarding the sustainable production processes is on the rise. Terms like “sustainable” and “green” in product descriptions are becoming more and more popular and producers are forced to satisfy the rising environmental awareness of their customers. Within this work, an alternative environmental sound silver recovery process was developed for a vein type silver ore from Mina Porka, Bolivia. A foregoing characterization of the input material reveals its mineral composition. In the following mineral processing, around 92.9% silver was concentrated by separating 59.5 wt. % of non-silver minerals. Nitric acid leaching of the generated concentrate enabled a silver recovery of up to 98%. The dissolved silver was then separated via copper cementation to generate a metallic silver product of >99% purity. Summarizing all process steps, a silver yield of 87% was achieved in lab scale. A final upscaling trial was conducted to prove the process’ robustness. Within this trial, almost 4 kg of metallic silver with a purity of higher than 99.5 wt. % was produced.

Graphical Abstract

1. Introduction

Silver usually occurs in lead, zinc and copper ores due to its chalcophile properties, and it is also the most common by-element in primary gold ores. Because of these characteristics, the bulk of produced silver (i.e., 70%) originates from the production of above mentioned matrix metals. Sulfidic lead, zinc and copper ores are processed in pyrometallurgical routes and generate high amounts of sulphur dioxide. Arising process residues often contain arsenic and lead. The most important gold recovery processes are based on leaching with cyanide or thiosulfate, but also using amalgamation. The cyanide process consists of a leaching step and separation via precipitation. Inadequate treatment or disposal of used solutions and solid residues can cause long term environmental damage. The amalgamation process consists of the dissolution in mercury. The generated mixture is characterized by low melting and boiling temperatures, so it is heated to separate the mercury via evaporization [1,2,3]. In artisanal mining operations, mercury vapors are produced from open reactors, thus polluting the atmosphere. Both techniques are extremely toxic and hazardous to the environment and human beings. In less developed countries, it is very common that unskilled, low-paid staff works with these dangerous gold winning processes [1,2,3,4,5].
The international large-scale industries produce silver as a by-product from copper or lead winning routes. These industries rarely face environmental problems, as they use the best available technology with full control over its waste streams. However, especially for smaller scale and decentralized processing of silver, it is necessary to establish a simple and sustainable method which forgoes the usage of conventional hazardous reagents like cyanide or mercury. A process like this could offer a high added value for natives at artisanal mining sites.
Just around 30% of silver production originates from primary silver routes. Industrially relevant processes are leaching with cyanide or thiosulfate and amalgamation, similar to gold. Traditionally, silver ores are enriched after comminution via flotation. Depending on the treated ore type, a wide range of reagents can be used as flotation agents. Suitable reagent regime for the direct flotation of silver minerals from low-grade silver ores is based on sulfhydryl collectors (xanthates (ethyl, amyl), dithiophosphates, dithiocarbamates, mercaptobenzothiazole, phosphinate and their mixtures), frothers (pine oil, cresylic acid, MIBC, polypropylene glycol) in a neutral or weakly alkaline solution [6,7,8,9]. The flotation concentrate is leached afterwards to extract silver. Cyanide is the most common leaching reagent for silver recovery due to its low cost, high efficiency and capability to dissolve metallic silver as well as silver compounds, like sulfides and chlorides. The leaching reaction usually takes place in open reactors to enable oxygen transmission into the leaching solution, which facilitates the silver dissolution. Afterwards, the dissolved silver is recovered via cementation with Zinc. The generated silver precipitate undergoes several refining steps to achieve a purity of 99.99%. Gold is the most important impurity and by-product in this process [1,2,7].
The bulk of the above described silver production techniques is problematic to a certain extent in terms of environmental and social issues. Nevertheless, the world experiences a continuously rising demand for silver, due to its unique properties and wide field of application. In the past few years, the demand on silver exceeded the production capacities by far. In 2015 the market deficit already reached 129.8 million troy ounce (4038 t). Hence, the need for new environmentally friendly and socially approved silver winning methods is becoming more crucial [5].
As previously mentioned, the rising ecological awareness and a new consumer behavior, are putting pressure on industries such as the jewelry industry and others to produce sustainable or “green” products. Terms like “Fairtrade”, “Green”, “Bio” or “Eco” are becoming a significant product attribute. This trend could be observed especially for gold jewelry, where the clients are willing to pay higher charges to satisfy their conscience and to distance themselves from others who are not willing to sacrifice. There are already several suppliers of “green gold”, which is not the case for “green” or “fair” silver, although most gold alloys have significant silver concentrations [10,11,12,13]. Besides jewelry, the electronics industry and especially mobile phones producers are also aware of the upcoming trend. Mobile phones manufacturers like Apple and Samsung conduct their own work on ethical sourcing of gold and other smartphone materials. Companies like the Dutch Fairphone even go one step further and try to completely abstain from metals with an environmentally or socially questionable background [14,15].
This study aims to show an alternative way for silver production, feasible to implement at artisanal mining sites around the world. The presented methodologies intend to show a process based on simple steps and equipment.

2. Materials and Methods

This chapter describes the performed investigations including the ore characterization, different mineral processing methods, the metallurgical treatment and an upscaling trial.

2.1. Ore Characterization

The study focused on vein type Zn-Ag deposits of Mina Porka, Bolivia. The ore formation took place in a vein system during different stages of mineralization and progressive fluid rock interaction, which leads to precipitation of different silver minerals. Eight rock samples, three mineral processing samples and one residue sample from hydrometallurgical treatment were analyzed via QEMSCAN© (FEI corporate headquarters, North America Nanoport, Hillsboro, OR, USA) to assess the process efficiency. The overall ore and gangue petrography was obtained from rock sample thin-sections to gather information on grain size distribution, mineralogical composition of ore/gangue, as well as grade and type of intergrowth. All these parameters are critical in forecasting mineral processing parameters like liberation size, hardness and hydrometallurgical accessibility.
QEMSCAN© data was recorded by a scanning electron microscope (SEM) Quanta 650 F platform (FEI corporate headquarters, North America Nanoport, Hillsboro, OR, USA) at the Department of Applied Mineralogy and Economic Geology, RWTH-Aachen Germany. Before analysis, the sample sections were carbon coated to avoid surface charges (Reed 2005). The QEMSCAN© system is mounted with DualX-Flash (Bruker, Billerica, MA, USA) detectors for recording EDX spectra and a four quadrant BSE detector recording BSE intensity data simultaneously. The measurements were performed using 25 kV of acceleration voltage and a fixed sample current of 10 nA. EDX spectral information and BSE intensity were computed by iDiscover Software suite (FEI, Version 5.3, corporate headquarters, North America Nanoport, Hillsboro, OR, USA) for mineralogical interpretation. Phase maps and particle analyses, instead, were performed using iExplorer (FEI) as a spatial resolution of 5 µm was chosen. The rock sample thin-sections were analyzed in field scan mode with a field size of 1500 µm × 1500 µm. Sample sections from mineral and hydrometallurgical processing were analyzed in particle analyze mode. For each pixel 2000 EDX counts were gathered before the SEM moved to the next spot.

2.2. Mineral Processing

For the liberation of silver containing minerals from other accompanying minerals, the ore had to be grinded and separated based on mineral properties via different separation methods [16]. For the laboratory test work, about 40 kg of silver ore sample was used. The sample was crushed by laboratory jaw crusher to a grain size <10 mm and comminuted by roller mill in a dry grinding-screening-circuit to <500 µm (a grain size within the liberation range). The comminuted sample was split into three samples. One sample was wet screened in the four size fractions 250–500 µm, 100–250 µm, 40–100 µm and <40 µm. The first three fractions were used for pre-concentration tests by magnetic and electrostatic separation; the fraction <40 µm was not taken into consideration. The second sample was comminuted by a roller mill in a dry grinding and screening circuit to a grain size of <100 µm and split in 1 kg samples for flotation test work. A representative ore sample was used for a grain size analysis and an elemental analysis by X-ray fluorescence analysis (NITON TM XL3; Thermo Fischer Scientific, Waltham, MA, USA). The trial evaluation for all mineral processing methods is based on the analysis of generated samples via XRF, which shows similar results to the QEMSCAN© analysis.

2.2.1. Magnetic and Electrostatic Separation

For the dry magnetic separation tests, a High-Intensity-Induced-Roll-Magnetic-Separator, manufactured by Carpco (Tonbridge, UK) (model MIH-(13)111-5), was used. To identify the optimal magnetic field intensity, the prepared grain size fractions were tested at different magnetic field intensities at a roll velocity of 45 rpm. The magnetic separation test series consisted of seven separation stages. In the initial separation stage, the feed sample was separated in a non-magnetic and magnetic fraction, starting at a field intensity of 300 mT. The non-magnetic fraction was cleaned in six stages at increasing magnetic field intensities (500 mT, 700 mT, 800 mT, 900 mT, 1000 mT and 1100 mT). The magnetic fractions from each stage left the process as waste material.
The electrostatic separation tests were carried out on a laboratory-scale Corona electrostatic separator, manufactured by Krupp (model ESTS 1 w × 0.1/40) operating with an electric tension of 12–12.5 kV and a roll velocity of 140 rpm. The prepared grain size fractions were separated in one separation stage into three fractions; non-conductor, semi-conductor and conductor.
Based on the results of the initial experiments from magnetic and electrostatic separation, the products of each grainsize fraction were collected with the intent to enable a recovery of 90% in pre-concentration product. Both products were combined with the fine material (<40 µm) as pre-concentration product.

2.2.2. Froth Flotation

Alternatively, the silver minerals were separated from other sulfide and gangue minerals by using froth flotation. The selective separation of silver minerals proved to be a challenging task, due to the presence of various silver minerals with different floatability properties, a high content of sphalerite (30.0 wt. %) and the high flotation sensitivity of silver minerals at high concentrations (16.3–16.6 wt. % in the present ore). A further challenge is the activation of sphalerite and others sulfide minerals by silver (Ag+), copper (Cu2+) and lead (Pb2+) cations, which reduce the selectivity between sphalerite and silver minerals. Lime (CaO), cyanide (NaCN) and sodium sulfide (Na2S) are depressors of silver minerals. Zinc sulfate (ZnSO4∙7H2O) in the presence of hydroxyl ions (soda ash (Na2CO3) or sodium hydroxide (NaOH) for the pH adjustment was used as a depressant for sphalerite, which did not show a negative effect on floatability of silver sulfide minerals [6].
All flotation tests were conducted in a laboratory flotation machine (model D12, Denver Equipment Company, Denver, CO, USA) with a cell size of 5 L and the rotational speed of impeller at 1300 rpm. For each test 1 kg of sample material at grain size <100 µm and tap water were used. The reagent regime with and without a depressor of sphalerite (zinc sulfate and sodium hydroxide) was applied. As collectors, Hostaflot PEB (a mixture based on dialkyldithiophosphate supplied by Clariant International Ltd., Ahrensburg, Germany) and OrePrep F-549 (a mixture of polyglycol supplied by Cytec Industries Inc., Woodland Park, NJ, USA) were selected. Furthermore, collectors like Hostaflot LSB (a mixture based on the dialkyldithiophosphate supplied by Clariant International Ltd.), Ekofol ANT33 (a mixture of aliphatic alcohols, esters, ethers supplied by EKOF Mining & Water Solution GmbH, Bochum, Germany) and potassium amyl xanthate PAX were tested.

2.3. Metallurgical Silver Recovery

Through metallurgical investigations, the aim was to develop a process which enables winning of silver from flotation concentrate with regards to environmental regulations and process efficiency. A social aspect is the process transferability to rural regions, for example near to the Bolivian mining area, where the ore originates. For this purpose, a series of different small scale experiments were conducted to identify appropriate process parameters. Different pyro- and hydrometallurgical methods were investigated. The metallurgical investigations were concluded by large scale trials to prove the process robustness and upscaling suitability.

2.3.1. Pyrometallurgical Silver Recovery

Pyrometallurgical methods were tested to recover silver from the concentrate. Several experiments took place in a resistance heated furnace at 1250 °C, with oxidizing conditions to reduce silver sulfides and oxidize the sulfur content. The generated metal and slag phases were analyzed via XRF. For this analysis, the slag phase was grinded to a particle size <64 µm to enable a representative measurement.

2.3.2. Hydrometallurgical Silver Recovery

Due to the noble character of silver, a highly corrosive leaching reagent is required. Cyanide was not considered for this role, due to its hazardous properties. Instead, nitric acid was used, which is a less toxic reagent and has the capacity to dissolve silver. Nitric acid enables fast extraction rates, has the potential of circulating arising NO2 gas and does not cause long term damage to the environment, which is of course a major advantage over cyanide [17]. The simplified dissolution reaction of silver by nitric acid can be described by Equation (1). It should be noted that the bulk of silver is bound to different sulfur compounds in mineral phases, which results in a significantly higher reagent consumption. Exemplary Equations (2)–(4) show the reaction of acanthite, Zn and S [17,18,19].
3 Ag +   4 HNO 3 = 3 AgNO 3 + NO +   2 H 2 O
3 Ag 2 S   +   8 HNO 3 = 3 Ag 2 SO 4 +   8 NO   +   4 H 2 O
3 ZnS   +   8 HNO 3 =   3 Zn ( NO 3 ) 2   +   3 S + 2 NO   +   4 H 2 O
S   +   2 HNO 3   =   H 2 SO 4   +   2 NO
A series of screening tests (proof of principle, no repetition) was conducted with nitric acid to identify suitable process parameters. Investigated parameters were acid concentration, solid liquid ratio (s/l), leaching time and multiple-step leaching. The screening test experiments were conducted in a 600 mL beaker with a magnetic stirrer. A preliminary concentrate was used for the small scale trials, which slightly differs from the concentrate used in the scale up experiment. Table 1 shows the composition of the preliminary concentrate.
Based on the conducted literature research, the following parameters were chosen for a reference trial [17,18,19]: nitric acid concentration of 30 vol. % (5.6 mol/L), s/l ratio of 1 g/20 mL, leaching time of 1 h and a temperature of 65 °C. A stirring speed of 500 rpm was chosen to enable sufficient mixing in all experiments. The reference experiment was repeated once (Tests 1 and 2). Nitric acid was added in excess to enable complete silver dissolution, which may be hindered due to high acid consumption by metallic impurities and sulfur compounds. This preliminary parameter investigation targeted a rough estimation of optimum process parameters. The trials 3–16 were not repeated. Table 2 gives an overview on the conducted leaching experiments.
Cementation is a simple method to recover metals in metallic state from a pregnant leaching solution. Dissolved silver ions can be precipitated in one step as fine metallic powder with acceptable purity by using a metallic reducing agent. For this purpose, a less noble metal is used as an electron donor. Suggested metals for such purposes are shown in Table 3. A small difference in electrochemical potential minimizes the co-precipitation of impurities [20,21,22]. In this study, a copper wire (>99.99% Cu, 0.1 mm thickness) was used as a reducing agent, since it is nonhazardous and abundant. The cementation took place in a 600 mL beaker at room temperature and a stirring speed of 300 rpm.
The precipitation of silver with chlorine could also be an alternative method to separate silver and reuse the leaching solution. Chlorine precipitation was not tested due to the co-precipitation of lead and the need for further separation steps.

2.3.3. Metallurgical Upscaling

As a proof of process robustness, an upscaling trial was conducted. For this endeavor, 36.7 kg of milled ore was pre-treated via physical and mechanical methods to generate a homogenized sample of 13.34 kg. Starting with 40 kg of ore, around 3.7 kg losses were incurred during grinding, sorting and milling as well as by sampling for elemental analysis and preparation of thin sections for mineralogical investigations.
The upscaling experiments took place in a 30-L rotary leaching reactor. A 100-L tank was used for the cementation reaction (Figure 1). All solid samples like the input material and the leaching/precipitation residues were analyzed via XRF (Panalytical Axios 2005, Malvern PANanalytical GmbH, Kassel, Germany), while the composition of liquid samples was determined via inductively coupled plasma optical emission spectroscopy (ICP-OES, Spectro Arcos 2013, SPECTRO Analytical Instruments GmbH, Kleven, Germany).
Due to a limited leaching capacity of 30 L, the s/l ratio was reduced to 1/9, i.e., 3.34 kg flotation concentrate were leached with 30 L nitric acid respectively. Silver dissolution took place in two leaching steps, first with the concentrate and afterwards with the mixed leaching residues. The leaching duration was 2.5 h each. Other parameters like temperature and acid concentration were based on the aforementioned reference trial (65 °C, 30% HNO3). The pH level of the 180 L pregnant leaching solution (PLS) was adjusted by adding approximately 65 kg of sodium hydroxide. Solid copper plates (20 × 8 × 1 cm³) were used for cementation. Moreover, all solid process residues were filtered in a vacuum aided filter system. Figure 2 gives an overview of the large scale process steps.

3. Results and Discussion

3.1. Ore Characterization

The characterization revealed important information about the mineral composition, with the results shown in (Figure 3). Petrographicaly, the major silver ore minerals are stephanite (Ag5SbS4), pyrargyrite (Ag3SbS3), miargyrite (AgSbS2), freieslebenite (AgPbSbS3) and acanthite (Ag2S). Low amounts of andorite (AgPbSb3S6) also contributes to the silver content. The major ore minerals are accompanied by other sulfides and arsenides like sphalerite (ZnS), pyrite (FeS2) and different kinds of the löllingite-rammelsbergite-safflorite group. Quartz (SiO2) and potassic-feldspar (KAlSi3O8) are the only silicate gangue minerals which could be identified. On sample thin-sections, the grain size of silver ore minerals was obtained by QEMSCAN©. The mineral composition is dominated by app. 30 vol. % of sphalerite followed by 18 vol. % of quartz which are the major gangue minerals. The ore consists of approximately 27 vol. % Ag sulfo-salt phases. Other minerals are sulfo-salt/arsenide minerals, galena (PbS), pyrite and cassiterite (SnO2).
The target grain size to maximize the liberation of silver minerals was obtained by the grain size of the silver mineral aggregates, see Figure 4. More than 70% of the silver aggregates and sphalerite have a grain sizes of 200–630 µm, while quartz occurs mainly at grain sizes between 630 and 2000 µm.

3.2. Mineral Processing

Based on the magnetic and electrostatic properties of the included minerals as well as the liberation size range of 200–630 µm, the enrichment of silver minerals at larger grain sizes up to 500 µm was investigated. Information about the liberation size range were obtained by QEMSCAN© analysis (Figure 4). The aim of the magnetic separation was the concentration of silver minerals in the non-magnetic product and the separation of paramagnetic minerals, like pyrite and iron bearing sphalerite [23]. Electrostatic separation was tested to enrich silver minerals in conductive products, while non-conductive minerals like Quartz and semi-conductive minerals like sphalerite were rejected [23]. Dry separation processes lost their efficiency for fine material, that is why over the course of this study the selective froth flotation of silver minerals using environmental-friendly reagents was tested at grain sizes <100 µm.
The grain size distribution (Figure 5) of the sample <500 µm showed that 56.0% were <250 µm and 16.6% < 40 µm. Grain size distribution of the flotation sample (<100 µm) showed that 74.3% were <63 µm and 22.4% < 20 µm. Elemental analysis of a representative ore sample showed a silver concentration of 16.5%. The silver content in the size fractions varied between 16.3% and 16.6% Ag. A significant enrichment of silver could not be achieved in any size fraction.

3.2.1. Results of Magnetic Separation

Figure 6 shows the cumulative silver recovery (ratio of extracted Ag) and Ag-content (Ag-concentration in sample) of different non-magnetic products (three grain size fractions). As viewed from the top left to the bottom right in Figure 6, the first data point of each data series represents the feed. The second point represents the results of non-magnetic product after the first separation stage (300 mT). The third point represents the cumulative results of the non-magnetic product of the first and second separation stage (300 mT + 500 mT) and etc.
The test series show the same course in all three grain classes. The silver content increases with each cleaning stage at higher magnetic field intensity while recovery decreased. For the coarsest size fraction (250–500 µm), the highest silver content (21.4%) in the non-magnetic product was achieved after seven cleaning stages, which enabled an Ag-recovery of 94.8%. The separation of the 100–250 µm sample resulted in a non-magnetic product with a silver-content of 26.9 wt. % and a recovery of 82.9%. The separation of the 40–100 µm fraction reached the highest silver content of 31.5 wt. % in non-magnetic product at a low recovery of just 47.3%. In the first separation step of fines (40–100 µm) at a magnetic field intensity 300 mT, 16% of silver was lost in magnetic waste fraction. In the second cleaning step, the loss increased to 27% and in the seventh step the loss increased to 53% in total.

3.2.2. Results of Electrostatic Separation

Figure 7 shows the cumulative recovery and silver content of products separated by electrostatic separation. Viewed from the top left to the bottom right the first data point of each data series represents the feed, the second data point shows the cumulative results for conductor and semi-conductor combined to product and the third point represents the conductor as product.
The separation of the coarsest sample (250–500 µm) achieved a conductive product with a silver content of 24.5 wt. % at a recovery of 95.7%. A grain size range of 100–250 µm enabled a conductive product containing 26.6 wt. % silver at a recovery of 90.1%. In the finest fraction (40–100 µm) a silver content of 29.2 wt. % at a recovery of 75.1% was reached in conductive product. Combining conductive and semi-conductive products to one product resulted in higher recovery while silver content decreased.

3.2.3. Results of Flotation Trials

Table 4 shows the beneficiation results from the selective froth flotation as a function of pH value and the type of collector. The separation efficiency (S.E.) was determined by the Hancock and Luyken method [6].
S . E . = 100 ( R c R m ) ( 100 c ) , S . E . =   Separation   efficiency ,   % ; R c   =   Recovery   in   product ,   % ;   R m   =   Yield   in   product ,   % ; c =   Ag - content   ( Feed ) ,   wt .   % .
The following findings were drawn from the laboratory test works:
  • The alkaline pH level, with and without zinc sulfate, shows a depressing effect on the flotation of silver sulfide minerals;
  • High silver recovery can be achieved at natural pH values (7–7.5);
  • The short conditioning time of 1 min with collector and depressor is optimal;
  • The optimal dosage of collector is at 100 g/t and frother at 25 g/t;
  • The stepwise addition of collector and stepwise flotation does not have a positive effect in terms of Ag-recovery;
  • The flotation takes 12 min;
  • The collector with a lower selectivity towards sphalerite is preferred
Using Hostaflot PEB (100 g/t) as a collector, OrePrep F-549 (25 g/t) as a frother with a pH of 7–7.5, a dosage of zinc sulfate of 5 kg/t, it was possible to achieve a flotation product with a silver content of 37.6 wt. % and silver recovery of 92.4%. Considering the ecological aspects of the beneficiation process, flotation can be performed without adding zinc sulfate that acts as depressor. This regime results in a product with a silver content of 35.1 wt. % and a silver recovery of 90.6%.

3.2.4. Comparison of Mineral Processing Methods

The results of magnetic and electrostatic separation of different grain size fractions show that with the smaller the grain size of the processed material the higher the silver content in the product, while recovery decreased. This can be attributed to the fact that a decreasing grain size allows more silver minerals to be liberated, therefore it is possible to achieve a higher silver content. On the other hand, the recovery decreases with decreasing grain size due to the adhesive forces between particles. In electrostatic separation, the silver mineral particles remain attached to the roll and rejected in non-conductor product. Using magnetic separation, the silver mineral particles were rejected in non-magnetic product.
All three beneficiation techniques achieved a recovery of more than 90% of silver. The highest separation efficiency of 62.1% was achieved using selective froth flotation, followed by 32.4% by electrostatic separation. Magnetic separation achieved a low separation efficiency of 16.7%, hence not suggested for the beneficiation of the Bolivian silver ore. To reduce higher amounts of waste without losing significant amounts of valuable material, selective froth flotation shows the most promising results. It was possible to separate a mass fraction of about 59.5% at grain size <100 µm. Electrostatic separation at grain size 40–500 µm resulted in a rejected mass of 30.3%. The results are shown in Figure 8.
One suggestion for the beneficiation of the Bolivian silver ore is crushing and milling the material to grain size <500 µm and then pre-concentration after classification at 100 µm using electrostatic separation. In that way, less input material has to be comminuted and energy consumption will be reduced [24]. Additionally, electrostatic separation is a dry separation process, so water can be saved and the process does not generate wet waste materials. Flotation is performed on an electrostatic product after milling to grain size <100 µm with fines resulted from previous classification.

3.3. Results of Metallurgical Treatment

3.3.1. Pyrometallurgical Trials

Initial pyrometallurgical experiments showed an insufficient silver recovery. The main Reasons for the silver loss were the entrainment of concentrate in the gas flow and the silver in the slag phase. Besides this, the analysis of the metallic silver phase showed a high concentration of impurities like antimony and lead (Table 5). Another disadvantage of this treatment method is the formation of a significant amount of sulfur dioxide.

3.3.2. Leaching Trials

The effect of the solid-liquid ratios tested (s/l = 1/10 and 1/50) was investigated in tests 3 and 4. Tests 5 and 6 compared the acid concentration with the reference parameters: 20 (3.7 mol/L), 30 (5.6 mol/L) and 65 vol. % (12.1 mol/L). As can be seen in the diagram below (Figure 9A), a solid-liquid ratio of 1/20 or higher enabled a nearly complete silver recovery. On the other hand, a s/l ratio of 1/10 (17.5-x stoich. amount of nitric acid) lead to an incomplete dissolution. Furthermore, Figure 9 shows that the dissolution of silver is also strongly dependent on acid concentration. Similar to the s/l experiments, a stoichiometric acid dosage below 35-x leads to an incomplete silver dissolution (58.3%). The decreased recovery with concentrated nitric acid (65 vol. %, 12.1 mol/L) is due to the lower solubility of silver nitrate in high concentrated nitric acid solutions. At 10 mol/L HNO3 or higher, the solubility of silver nitrate decreases continuously [19]. Besides the lower recovery, the leaching reaction was much more powerful, difficult to control and showed a strong acid evaporization.
The leaching of the silver concentrate was observed for 25, 45 and 65 °C over a period of 24 h. The results given in Figure 10 reveal a strong effect of the leaching temperature on silver recovery. Already after half an hour at 65 °C, the contained silver was almost completely dissolved (96.2%). On the other hand, it took 24 h to dissolve a similar amount of silver at 45 °C. These results suggest, that the silver dissolution is temperature activated and reaction controlled. Higher temperatures were not investigated as significant vaporization and loss of NO2 already occurred at 65 °C.
To determine if the remaining silver can be recovered from the leaching residue, two experiments (tests 14 and 15) were conducted at identical parameters to the reference trial. Figure 11 shows the results of the second and third leaching steps. Although silver was almost completely dissolved after the first leaching step, a further extraction to 99.3% in total could be obtained by a second step. The third leaching step just showed a negligible effect. On the other hand, all three leaching steps caused a significant mass reduction. Besides the small increase in silver recovery, the dissolution of elements like antimony and sulfur oxidation caused the mass reduction. Despite the three step leaching, a small fraction of an insoluble silver compound remained.

3.3.3. Cementation Trials

To avoid re-dissolution of precipitated silver, the corrosive solution was neutralized with sodium hydroxide before cementation took place. Suitable conditions were determined to be at pH 4–5. At pH < 4 the precipitation of impurities like iron and zinc was incomplete, which leads to a contamination of the silver cementate. Although silver hydroxide formation theoretically starts at pH 8 [20,21,22], already at pH 5 a co-precipitation could be observed, which caused an average Ag-loss of 5%. Thanks to the high copper-solution contact surface, cementation took less than 15 min for a 400 mL solution. In average 12 of 12.1 g/L silver could be recovered from the PLS via cementation. Figure 12 shows the cementation process.
The composition of the cementation products from pH 4 and 5 solutions is presented in Table 6. The silver precipitate contains low concentrations of Zn, Pb and Cu, which may be due to remaining leaching solution adhering to the solid precipitate. Since the silver concentrate almost did not contain any copper, this impurity results from spalling of small metal flakes or wires, which arise by inhomogeneous surface decomposition of the copper wire. Particles of copper were found via microscopic observations (see Figure 13). To selectively separate the impurities, the precipitate was washed with a 2 mol/L sulfuric acid, due to its ability to dissolve other less noble impurities but not silver [22]. The remaining impurities of less than 0.6 wt. % in total consist of copper and organic materials or water (in Table 6).

3.3.4. Summary of Small Scale Experiment Results

Summarizing the results of all bench-scale tests, the optimum values for silver recovery were determined for following parameters: nitric acid concentration of 30 vol. %, solid liquid ratio of 1/20 and leaching time of one hour at 65 °C. By using these parameters, 98.2% of silver was successfully dissolved from the preliminary silver concentrate. The PLS contained around 12.7 g/L (9.5 × 10⁻² mol/L) of silver. Furthermore, the leaching experiments exhibited high chemical consumption due to the dissolution of existing metallic impurities like antimony, lead, arsenic, zinc among others (see Table 7). Elemental sulfur or sulfur compounds remained in the leaching residue. Moreover, the experiments revealed that the leaching reaction is temperature activated. The multiple-step leaching trials showed the presence of insoluble silver compounds, which hinder complete silver dissolution, even at highly aggressive conditions. Cementation with copper wires enabled a nearly complete silver recovery with high purity. The generated silver powder shows a purity of more than 99.4 wt. %.
A total silver recovery of more than 92% could be achieved in the lab scale trials by using a simple two-step process consisting of leaching and cementation, which enables a high added value without the use of a harmful reagent like cyanide. The leaching and precipitation residues can be recirculated into the leaching process for an enhanced silver recovery.

3.4. Scale-Up Trials

The flotation concentrate used in the upscaling trials shows a significantly higher silver concentration compared to the initial ore, although it does not correspond to the best flotation experiments. The mineral composition of this sample and the corresponding tailings is shown in Figure 14. The concentrate provided for the upscaling trails constituted approximately of 50 vol. % silver minerals. The main contaminants were sphalerite (28 vol. %) quartz (7 vol. %), pyrite (2.2 vol. %), and galena (1.85 vol. %). The tailings produced in flotation test work were composed approximately of 45 vol. % sphalerite, 28 vol. % quartz and 5 vol. % pyrite as well as 6 vol. % silver minerals. The silver minerals lost in tailings are mostly liberated (see Figure 14) and can be recovered by further treatment using scavenger flotation. A further milling to smaller grain size is not necessary.
As can be seen in Table 8, the metallurgical upscaling enabled a total silver recovery of just 81%, compared to the 94% in the lab scale experiments. Especially noticeable is the fact that in all process steps, the upscaling showed significantly higher silver losses. Most probably this was due to the lower s/l-ratio of 1/9, which could not be compensated by higher leaching duration and a second leaching step. Another reason for the weaker results is the partly incomplete filtration, which occurred due to clogged filters (filtration took several hours). The separated residues still exhibited a high part of PLS. Unlike the smaller lab-scale experiments, the cementation of 180 L PLS took several days and was stopped after 3 days. The incomplete cementation can be attributed to the smaller contact surface between the copper plates and the PLS.
The chemical analysis given in Table 9 shows that, like the small scale experiments, most of the silver, lead, iron and zinc were dissolved. On the other hand, a significant enrichment of antimony and arsenic occurred. Most of the lead andiron, along with a large amount of arsenic precipitated at pH 5 and was separated via filtration. The final metallic silver powder shows a purity of more than 99.6 wt. %.
The QEMSCAN analysis reveals that Ag-sulfosalt minerals were leached out to a concentration of 0.43 vol. % in total (see Figure 15). New phases created by the nitric acid treatment were oxide/sulfide complexes containing high amounts of Sb. Their high impact on the modal compositions is accounted by 70 vol. %.
A strong intergrowth of fine-grained precipitate hinders an accurate mineralogy interpretation. Therefore, the phases are named by their chemical character. The combination of XRD and high resolution QEMSCAN investigations made it possible to clarify the mineralogical nature of those materials. The silver content of those phases varies between 2 and 10 wt. % and does not show any systematic distribution. The Ag and Sb contents lead to an interpretation that those phases originate from primary Ag-sulfosalt phases which are almost absent in this sample. However, phases like quartz, cassiterite and acanthite survived the hydrometallurgical treatment and are still present as discreet particles inside the Sb oxide/sulfide matrix. This indicates that the leaching process is not able to dissolve silver sulfides like acanthite, which shows a wide stability over variable pH and Eh conditions [17,25]. Furthermore, nitric acid was consumed by the reaction with Ag-sulfosalt phases to form Sb-Oxide phases, as mentioned above, and the resulting product/residue accumulated around particles of quartz, cassiterite and acanthite. This oxide envelope hinders further dissolution of the covered particles. Examples of those kind of particles are highlighted by red circles in Figure 15. Investigations of grain size and particle shape revealed, that quartz, acanthite and cassiterite show the same distribution on these parameters in products of minerals processing.

4. Conclusions

In this study, a vein type silver ore from the Bolivian Mina Porka was investigated for mineralogical and petrographical features using QEMSCAN© SEM technology. Major gangue minerals were quartz, sphalerite and k-feldspars. Most of the silver ore minerals were characterized as sulfo-salt phases like stephanite, miagyrite and pyrargyrite. This ore’s minerals show patchy intergrowth to each other and they are accompanied by acanthite. The sulfo-salt phases were handled as one ore phase due to their similar behavior during mineral and hydrometallurgical processing.
The investigation of mineral processing methods showed that flotation after milling to <100 µm is best suited for silver concentration. Laboratory scale flotation at pH 7–7.5 using Hostaflot PEB (100 g/t) as collector, zinc sulfate (5 kg/t) and OrePrep F-549 (25 g/t) as frother resulted in a silver content of 37.6% and a silver recovery of 92.9% in the product. It was possible to separate 59.5% of the initial mass as tailings, which mostly consisted of non-silver containing minerals. All lab scale products were mixed to one homogeneous concentrate, which corresponds in 37.4% of initial feed mass at 84.5% silver recovery.
The metallurgical investigations exposed a feasible cyanide free hydrometallurgical silver recovery process. Lab-scale experiments revealed the optimum leaching parameters to be 30 vol. % HNO3, s/l = 1/20, t = 1 h, T = 65 °C. Copper proved to be a successful reducing agent in the cementation process step that was conducted for silver separation. Within the lab-scale experimental trials, a total silver recovery of >90% was obtained. Large scale experiments were conducted with 13.34 kg silver concentrate to prove the process robustness at pilot scale. Due to a higher concentration of insoluble silver compounds (acanthite), incomplete filtration and worse stirring conditions, the upscaling trials showed lower silver recovery values compared to the lab-scale experiments.
In Figure 16, a flow chart summarizing all process steps is shown. The figure shows that 87.3% of the silver could be recovered in the labscale trials, but only 65% in the upscaling experiments from the silver ore. The flotation experiments enabled an enrichment of Zn in the tailings to 25.8 wt. % and 35.2 wt. % Sb in the leaching residue contains. Because of the high metal concentrations in these side streams, they represent a potential side product to the process.
The presented process could be improved by further treatment of the produced flotation tailings. Ag-particles with a coarser grain size can be recovered from the tailings via froth scavenger flotation. Silver losses in leaching and cementation residues can be reduced by recirculation. Moreover, the insoluble silver mineral acanthite can be isolated via density separation due to its high density (7.3 g/cm³) and then handled separately.
With an intent to fully exploit the natural non-renewable raw materials, it is necessary to make use of all valuable elements contained in the ore. Due to the fact that the tailings show a concentration of more than 25% of Zinc and approximately 5.2% silver (a silver content higher than the amounts existing in most mined lead deposits), it is wise to subject those tailings to further processing. The metallurgical treatment of the concentrate can be optimized by using a less concentrated leaching solution to reduce the chemical consumption and herewith the process costs. A high silver recovery with a less aggressive leaching solution could be achieved by extending the treatment time to 24 h and multiple step leaching.

Acknowledgments

This publication has been financially supported by the Aachen Know-How Centre Resource Technology (AKR). We would also like to thank the EMH GmbH (Essen, Germany), for the provided equipment and technical support. Moreover, we acknowledge the efforts of André Hellmann (Core Power UG), who facilitated the evaluation of process residues via XRD analysis.

Author Contributions

This research articles can be divided into three thematic areas, to which the different authors contributed. A.B. was responsible for the manuscript preparation and carried out the hydrometallurgical experiments. L.G. performed the mineral characterization of input materials and generated products. J.K. and I.S. conducted the mineral processing experiments and assessed the used methods. B.F. and H.W. supervised findings of this work and contributed to the experimental assessment. All authors discussed the results and contributed to the final manuscript.

Conflicts of Interest

The authors declare no conflict of interest.

References

  1. Marsden, J.O.; House, C. The Chemistry of Gold Extraction; Society for Mining Metallurgy and Exploration: Denver, CO, USA, 2006. [Google Scholar]
  2. Habashi, F. Handbook of Extractive Metallurgy; Volume III Precious Metals; Wiley-VCH: Weinheim, Germany, 1997. [Google Scholar]
  3. Kongolo, K.; Mwema, M.D. The extractive metallurgy of gold. Hyperfine Interact. 1998, 111, 281–289. [Google Scholar] [CrossRef]
  4. Donato, D.B.; Madden-Hallett, D. Heap leach cyanide irrigation and risk to wildlife. Ramifications for the international cyanide management code. Ecotoxicol. Environ. Saf. 2017, 140, 271–278. [Google Scholar] [CrossRef] [PubMed]
  5. O’Connell, R.; Tankard, W. World Silver Survey 2016; The Silver Institute: Washington, DC, USA, 2016. [Google Scholar]
  6. Bulatovic, S.M. Handbook of Flotation Reagents—Chemistry, Theory and Practice; Elsevier: Amsterdam, The Netherlands, 2007. [Google Scholar]
  7. Dorr, J.V.N. Cyanidation and Concentration of Gold and Silver Ores; McGraw-Hill Book Comp: New York, NY, USA, 1950. [Google Scholar]
  8. Quinteros-Riquelme, J.A. Improved Process Development for Complex Silver Ores through Systematic, Advanced Mineral Characterisation. Ph.D. Thesis, The University of Queensland, Brisbane, Australia, 8 December 2016. [Google Scholar]
  9. Taggart, A.F. Handbook of Mineral Dressing—Ores and Industrial Minerals; John Wiley & Sons: New York, NY, USA, 1945. [Google Scholar]
  10. Childs, J. Criminals of the earth to stewards of the environment: The social and environmental justice of Fair Trade gold. Geoforum 2014, 57, 129–137. [Google Scholar] [CrossRef]
  11. Hilson, G. Fair trade gold—Antecedents, prospects and challenges. Geoforum 2008, 39, 386–400. [Google Scholar] [CrossRef]
  12. Valcambi.com, Green Gold. Available online: http://www.valcambi.com/accreditations-compliance/green-gold (accessed on 27 October 2017).
  13. Butler, S. Comic Relief and Fairtrade Back Ethical Gold Mining in East Africa. Available online: https://www.theguardian.com/business/2017/oct/01/comic-relief-and-fairtrade-back-ethical-gold-mining-in-east-africa (accessed on 6 February 2017).
  14. Gerritsen, L. Support Fairtrade Gold with Your Next Smartphone. Available online: http://www.huffingtonpost.com/laura-gerritsen/support-fairtrade-gold-wi_b_9397988.html (accessed on 7 October 2017).
  15. Cahalane, C. Fairphone: One Smartphone Company’s Search for Conflict-Free Gold. Available online: https://www.theguardian.com/sustainable-business/2016/apr/29/fairphone-smartphone-company-search-conflict-free-gold (accessed on 7 October 2017).
  16. Wills, B.A.; Finch, J. Wills’ Mineral Processing Technology, 8th ed.; Elsevier Science & Technology: Amsterdam, The Netherlands, 2015. [Google Scholar]
  17. Holloway, P.C.; Merriam, K.P. Nitric acid leaching of silver sulphide precipitates. Hydrometallurgy 2004, 74, 213–220. [Google Scholar] [CrossRef]
  18. Adebayo, A.O.; Ipinmoroti, K.O. Leaching of Sphalerite with Hydrogen Peroxide and Nitric Acid. J. Miner. Mater. Charact. Eng. 2006, 5, 167–177. [Google Scholar] [CrossRef]
  19. Sadrnezhaad, S.K.; Ahmadi, E.; Mozammel, M. Kinetics of silver dissolution in nitric acid from Ag-AuO:04–CuO:10 and Ag-CuO:23 scraps. J. Mater. Sci. Technol. 2006, 22, 696–700. [Google Scholar]
  20. Jaskula, M. Cementation of Silver Ions on Metallic Copper. Jordan J. Earth Environ. Sci. 2009, 2, 84–95. [Google Scholar]
  21. Keles, O. An optimization study on the cementation of silver with copper in nitrate solutions by Taguchi design. Hydrometallurgy 2009, 95, 333–336. [Google Scholar] [CrossRef]
  22. Straehle, J.; Schweda, E. Jander/Blasius: Lehrbuch der Analytischen und Präparativen Anorganischen Chemie; S. Hirzel Verlag: Stuttgart, Germany, 2006. [Google Scholar]
  23. Carmichael, R.S. Handbook of Physical Properties of Rocks; CRC Press: Boca Raton, FL, USA, 1988. [Google Scholar]
  24. Metso Corporation. Basics in Minerals Processing Handbook; Metso Mining and Construction: Helsinki, Finland, 2013. [Google Scholar]
  25. Simmons, G.L.; Gathje, J.C. High Temperature Pressure Oxidation of Ores and Ore Concentrates Containing Silver Using Controlled Precipitation of Sulfate Species. U.S. Patent US006641642B2, 4 November 2003. [Google Scholar]
Figure 1. Leaching reactor (A) and tank for solution neutralization and cementation (B).
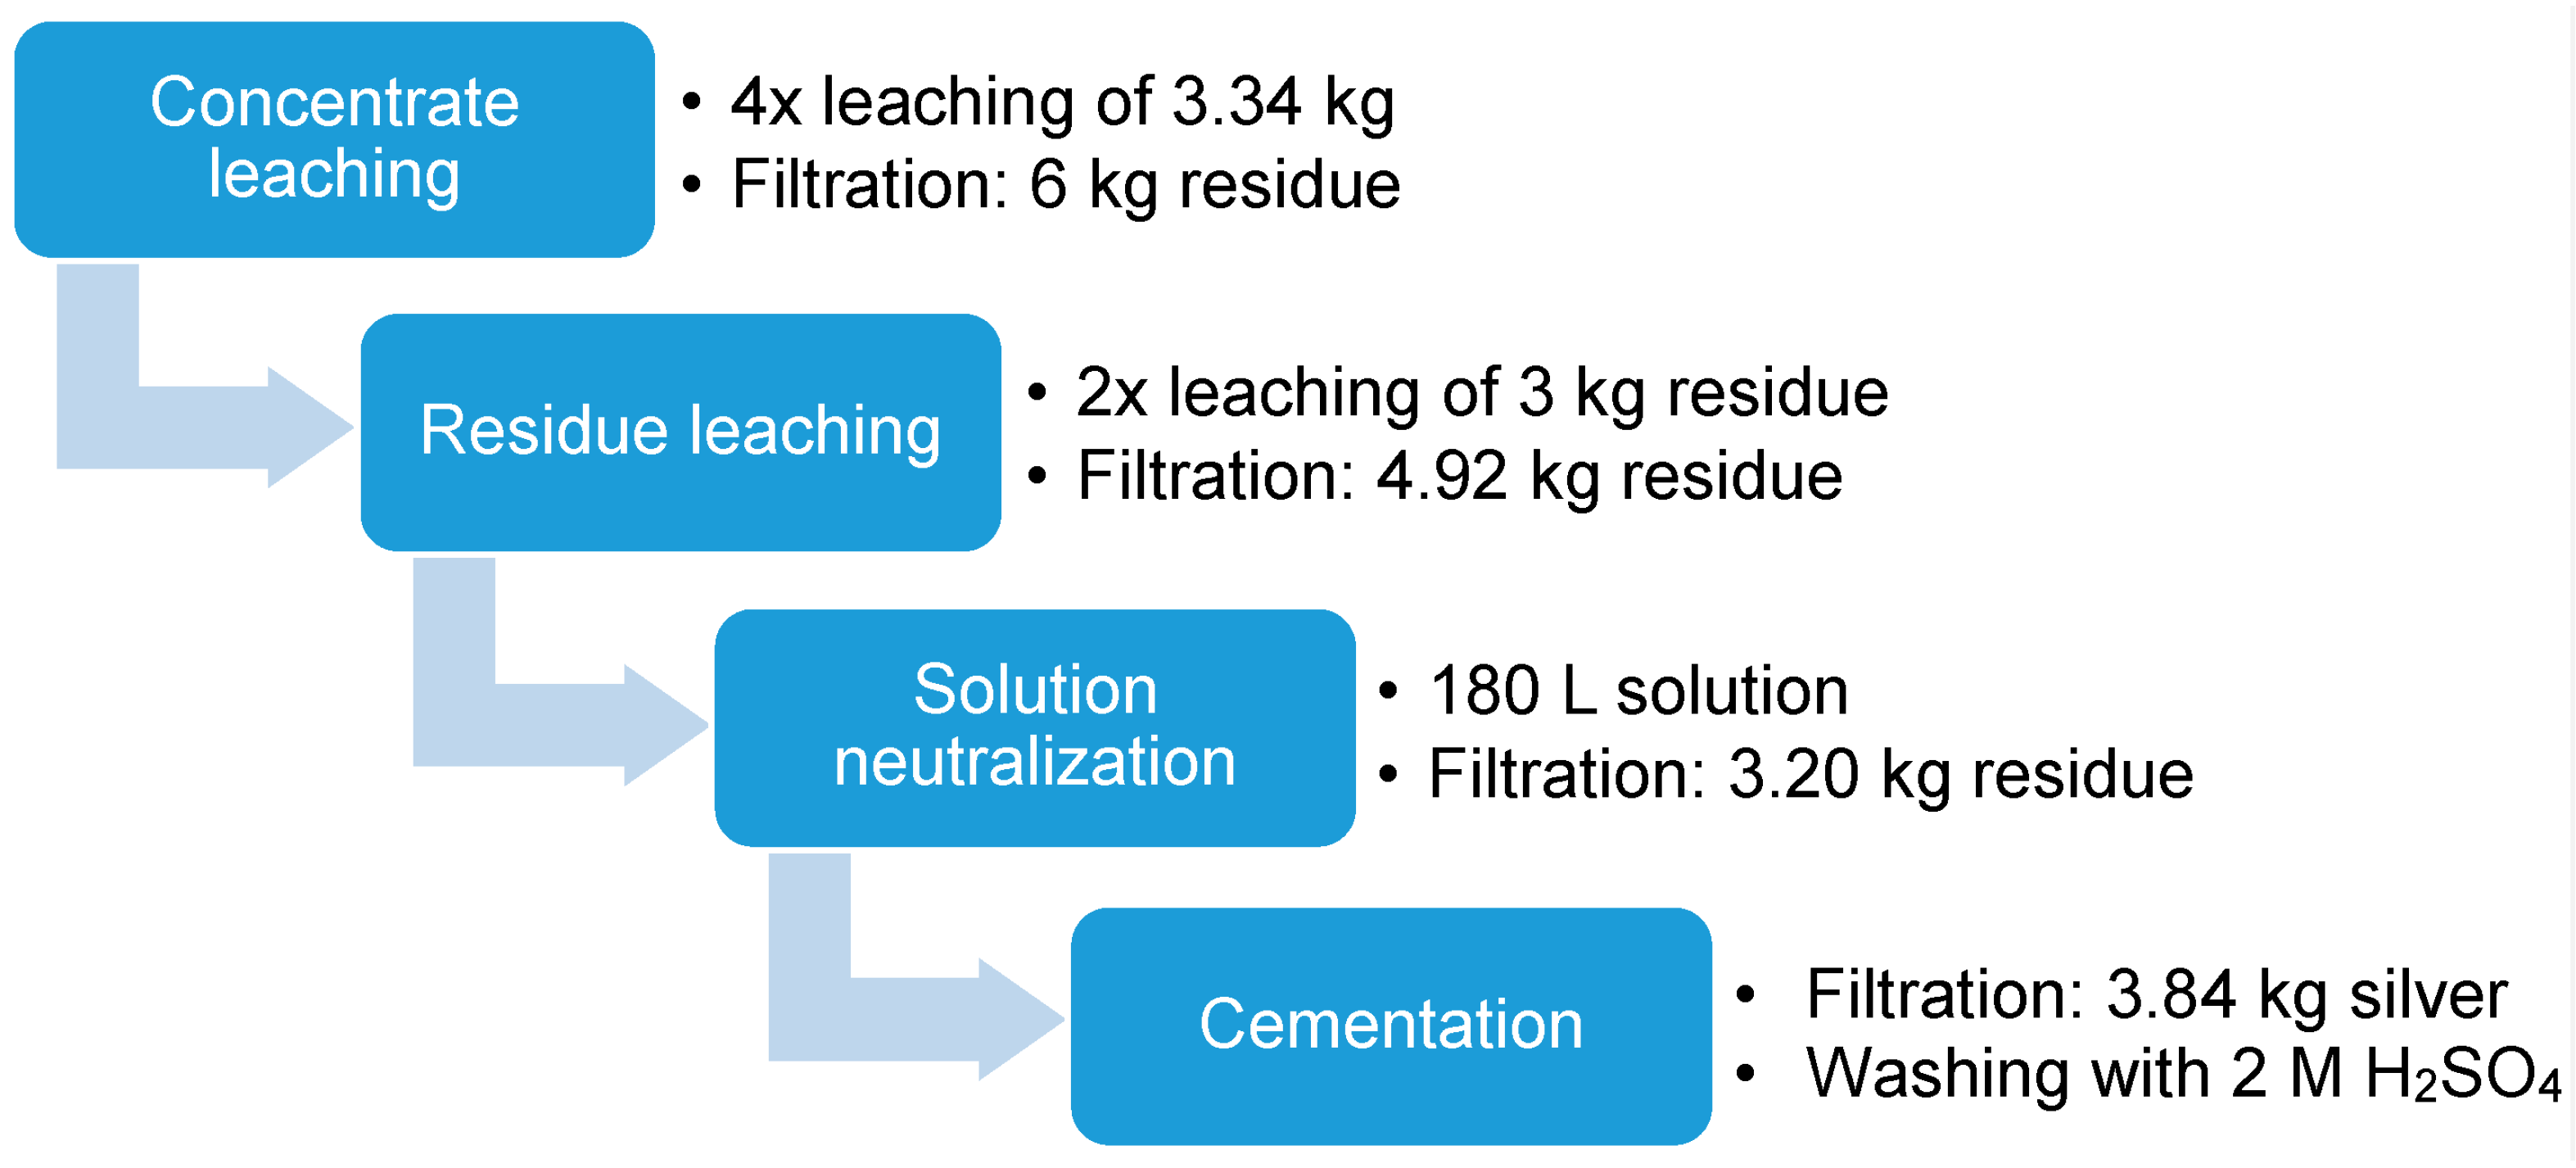
Metals 08 00114 g001
Figure 2. Overview of upscaling procedure.
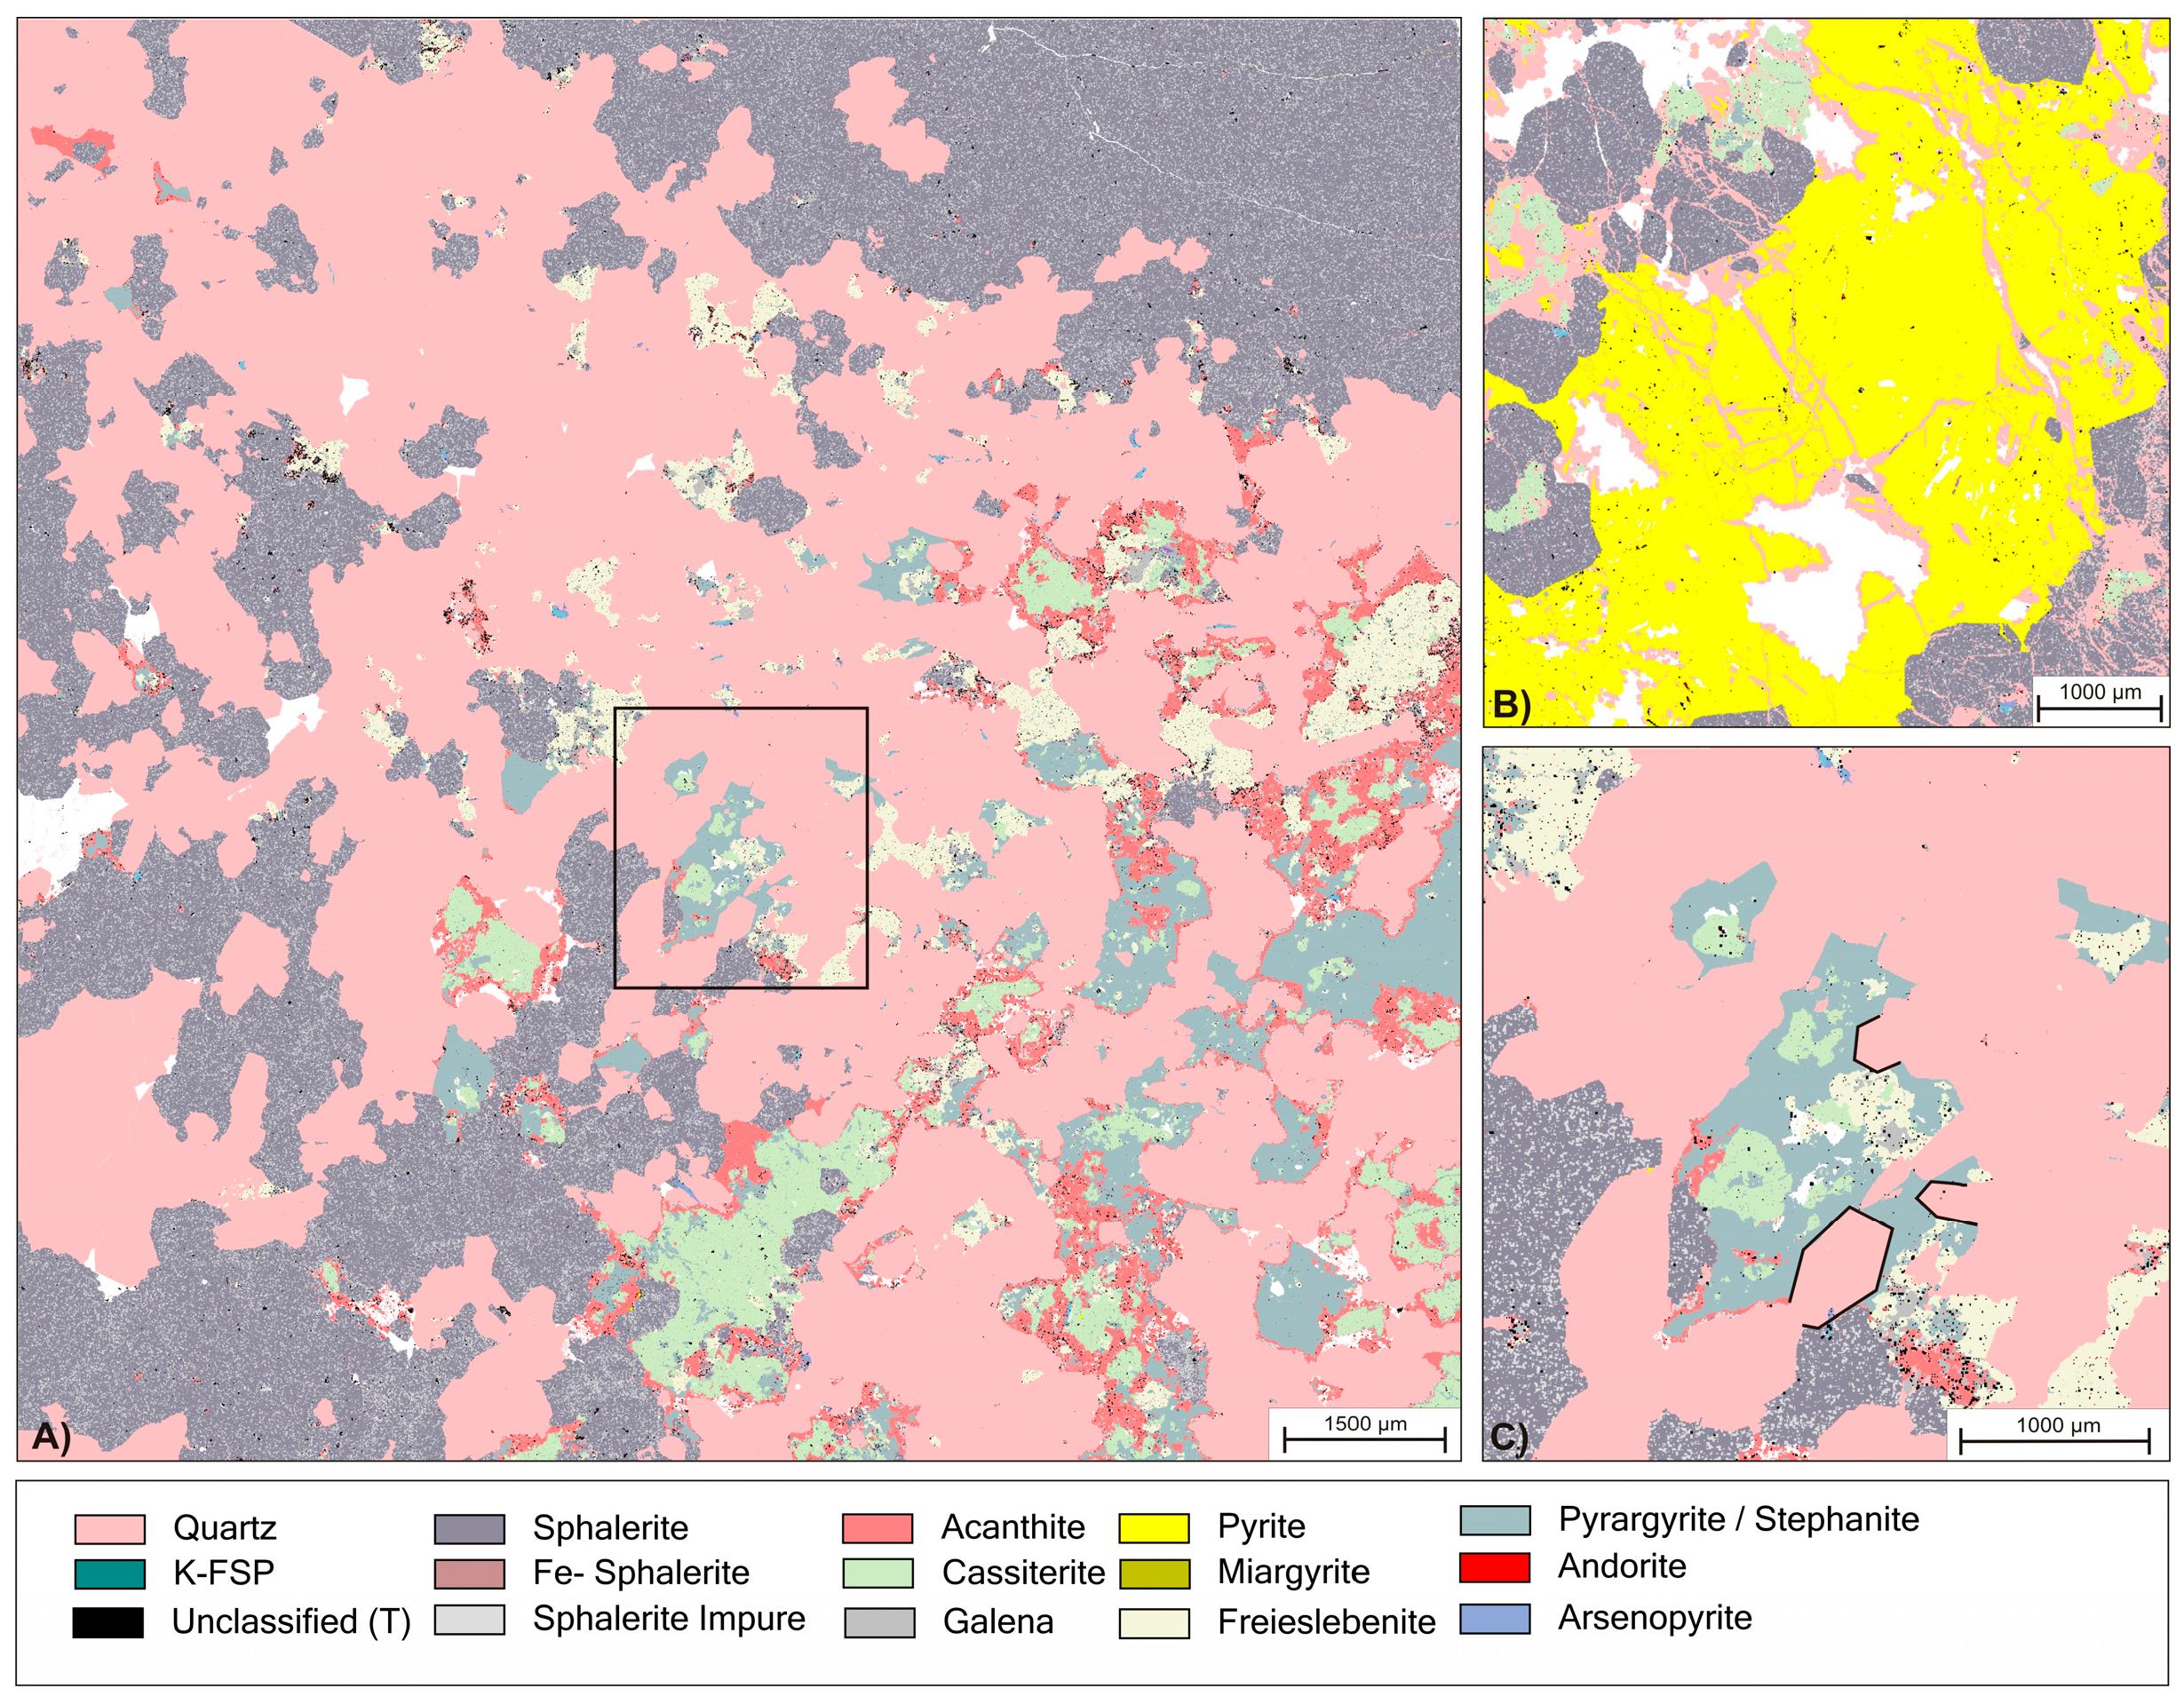
Metals 08 00114 g002
Figure 3. (A) Overview phase map of initial ore bearing vein; (B) Detailed view of different examples for hydraulic brecciation of sphalerite and pyrite. Fractures has been healed by quartz precipitation; (C) Detailed view of box in (A) with highlighted examples of idiomorphic textures at grain boundaries of quartz (pink) against an agglomerate of ore minerals.
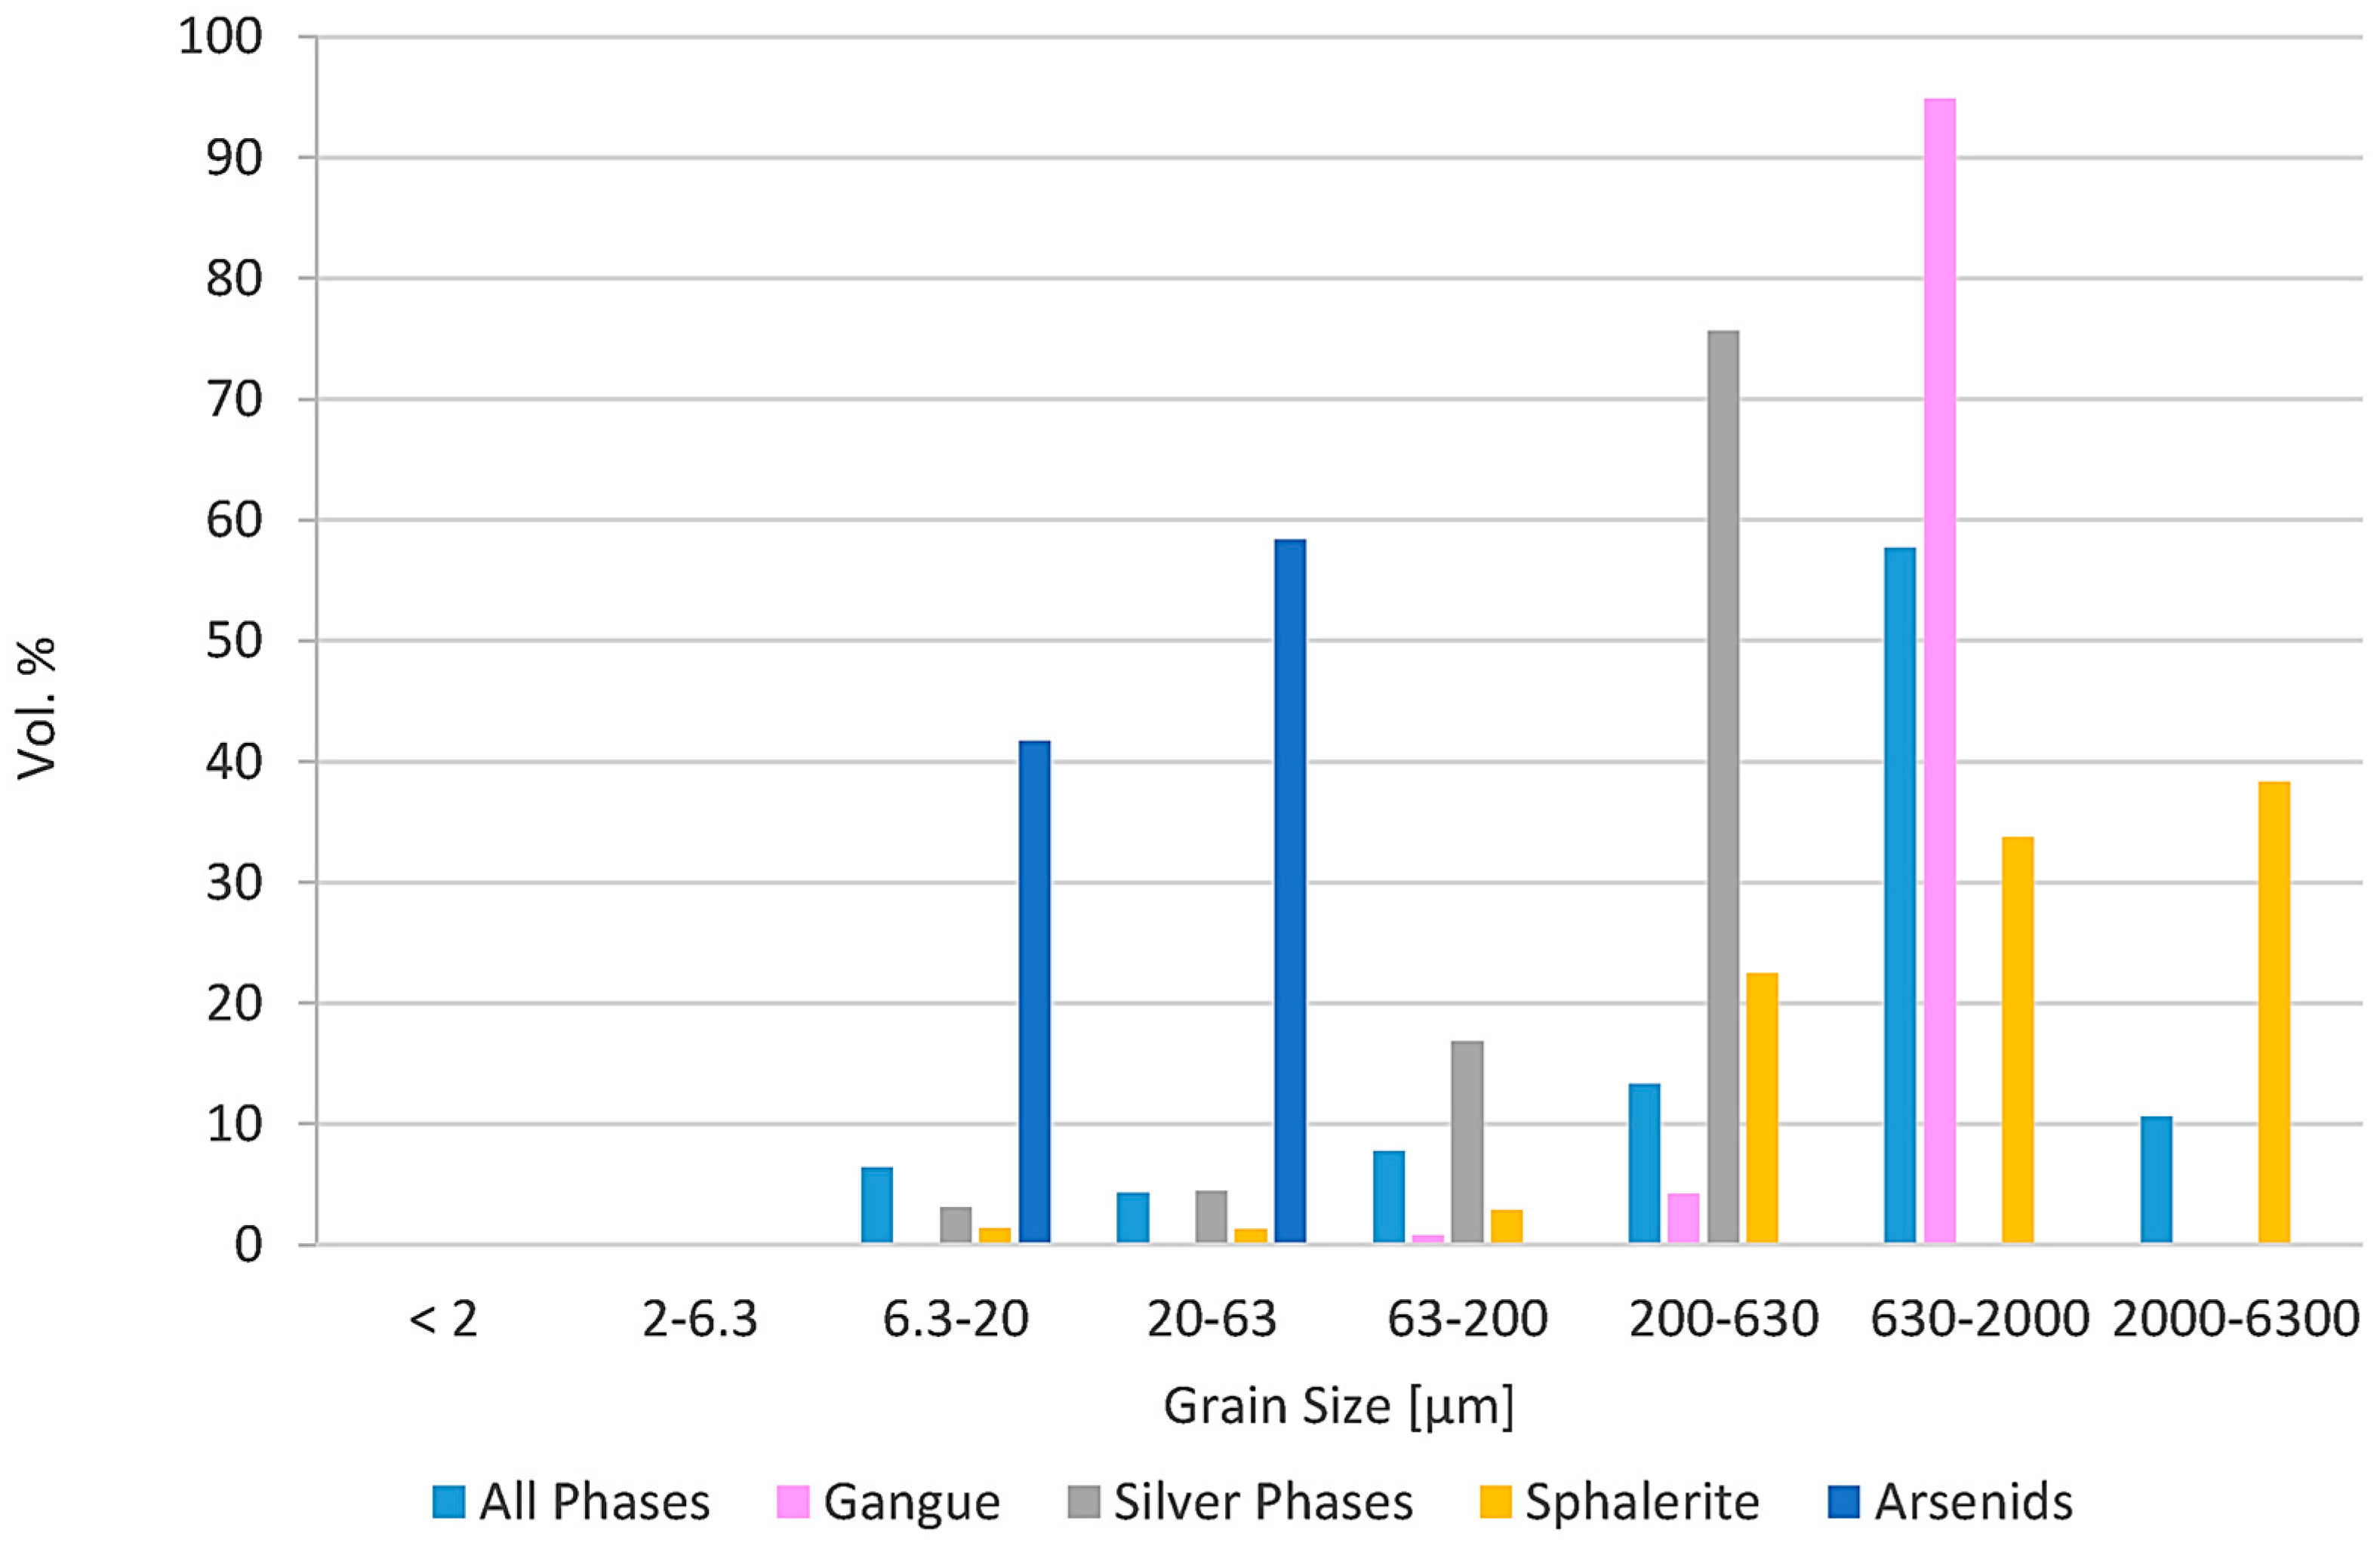
Metals 08 00114 g003
Figure 4. Grain Size of different phases from thin-section analysis. Based on this analysis, the target grain size was optimized before grinding. Silver phases were handled together due to their similar chemical character, except acanthite.
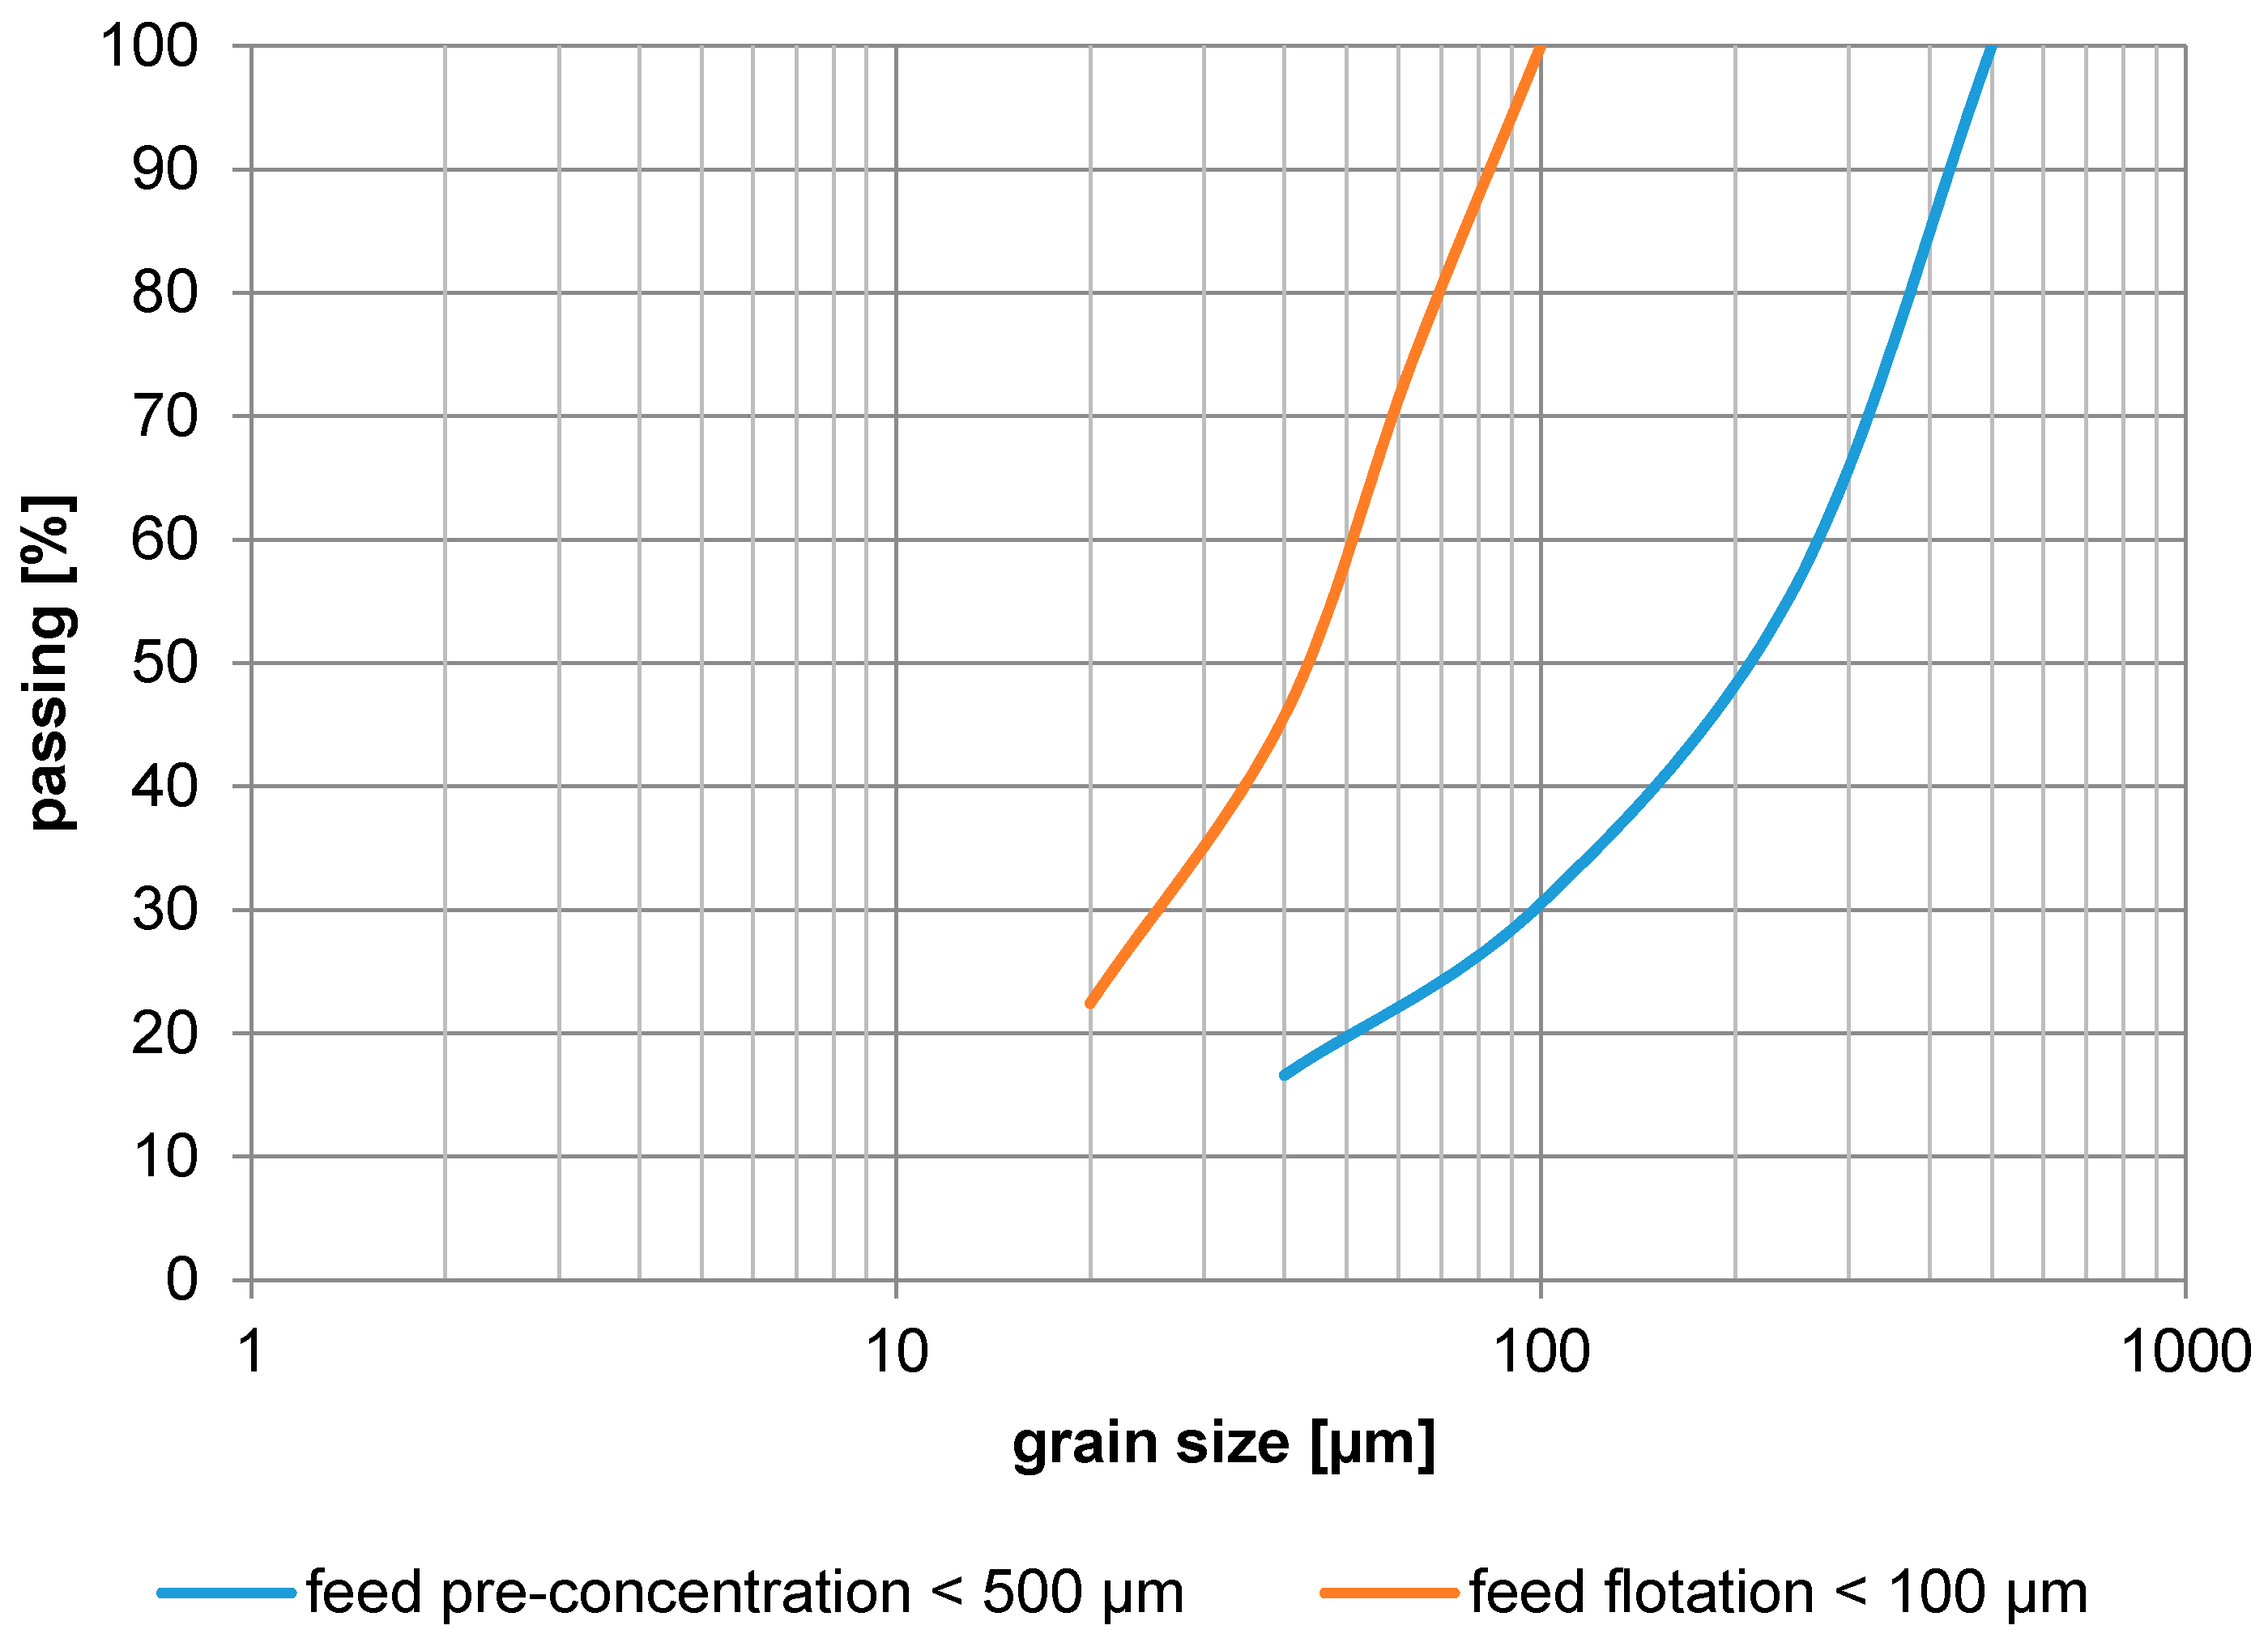
Metals 08 00114 g004
Figure 5. Grain size distribution (feed pre-concentration, feed flotation).
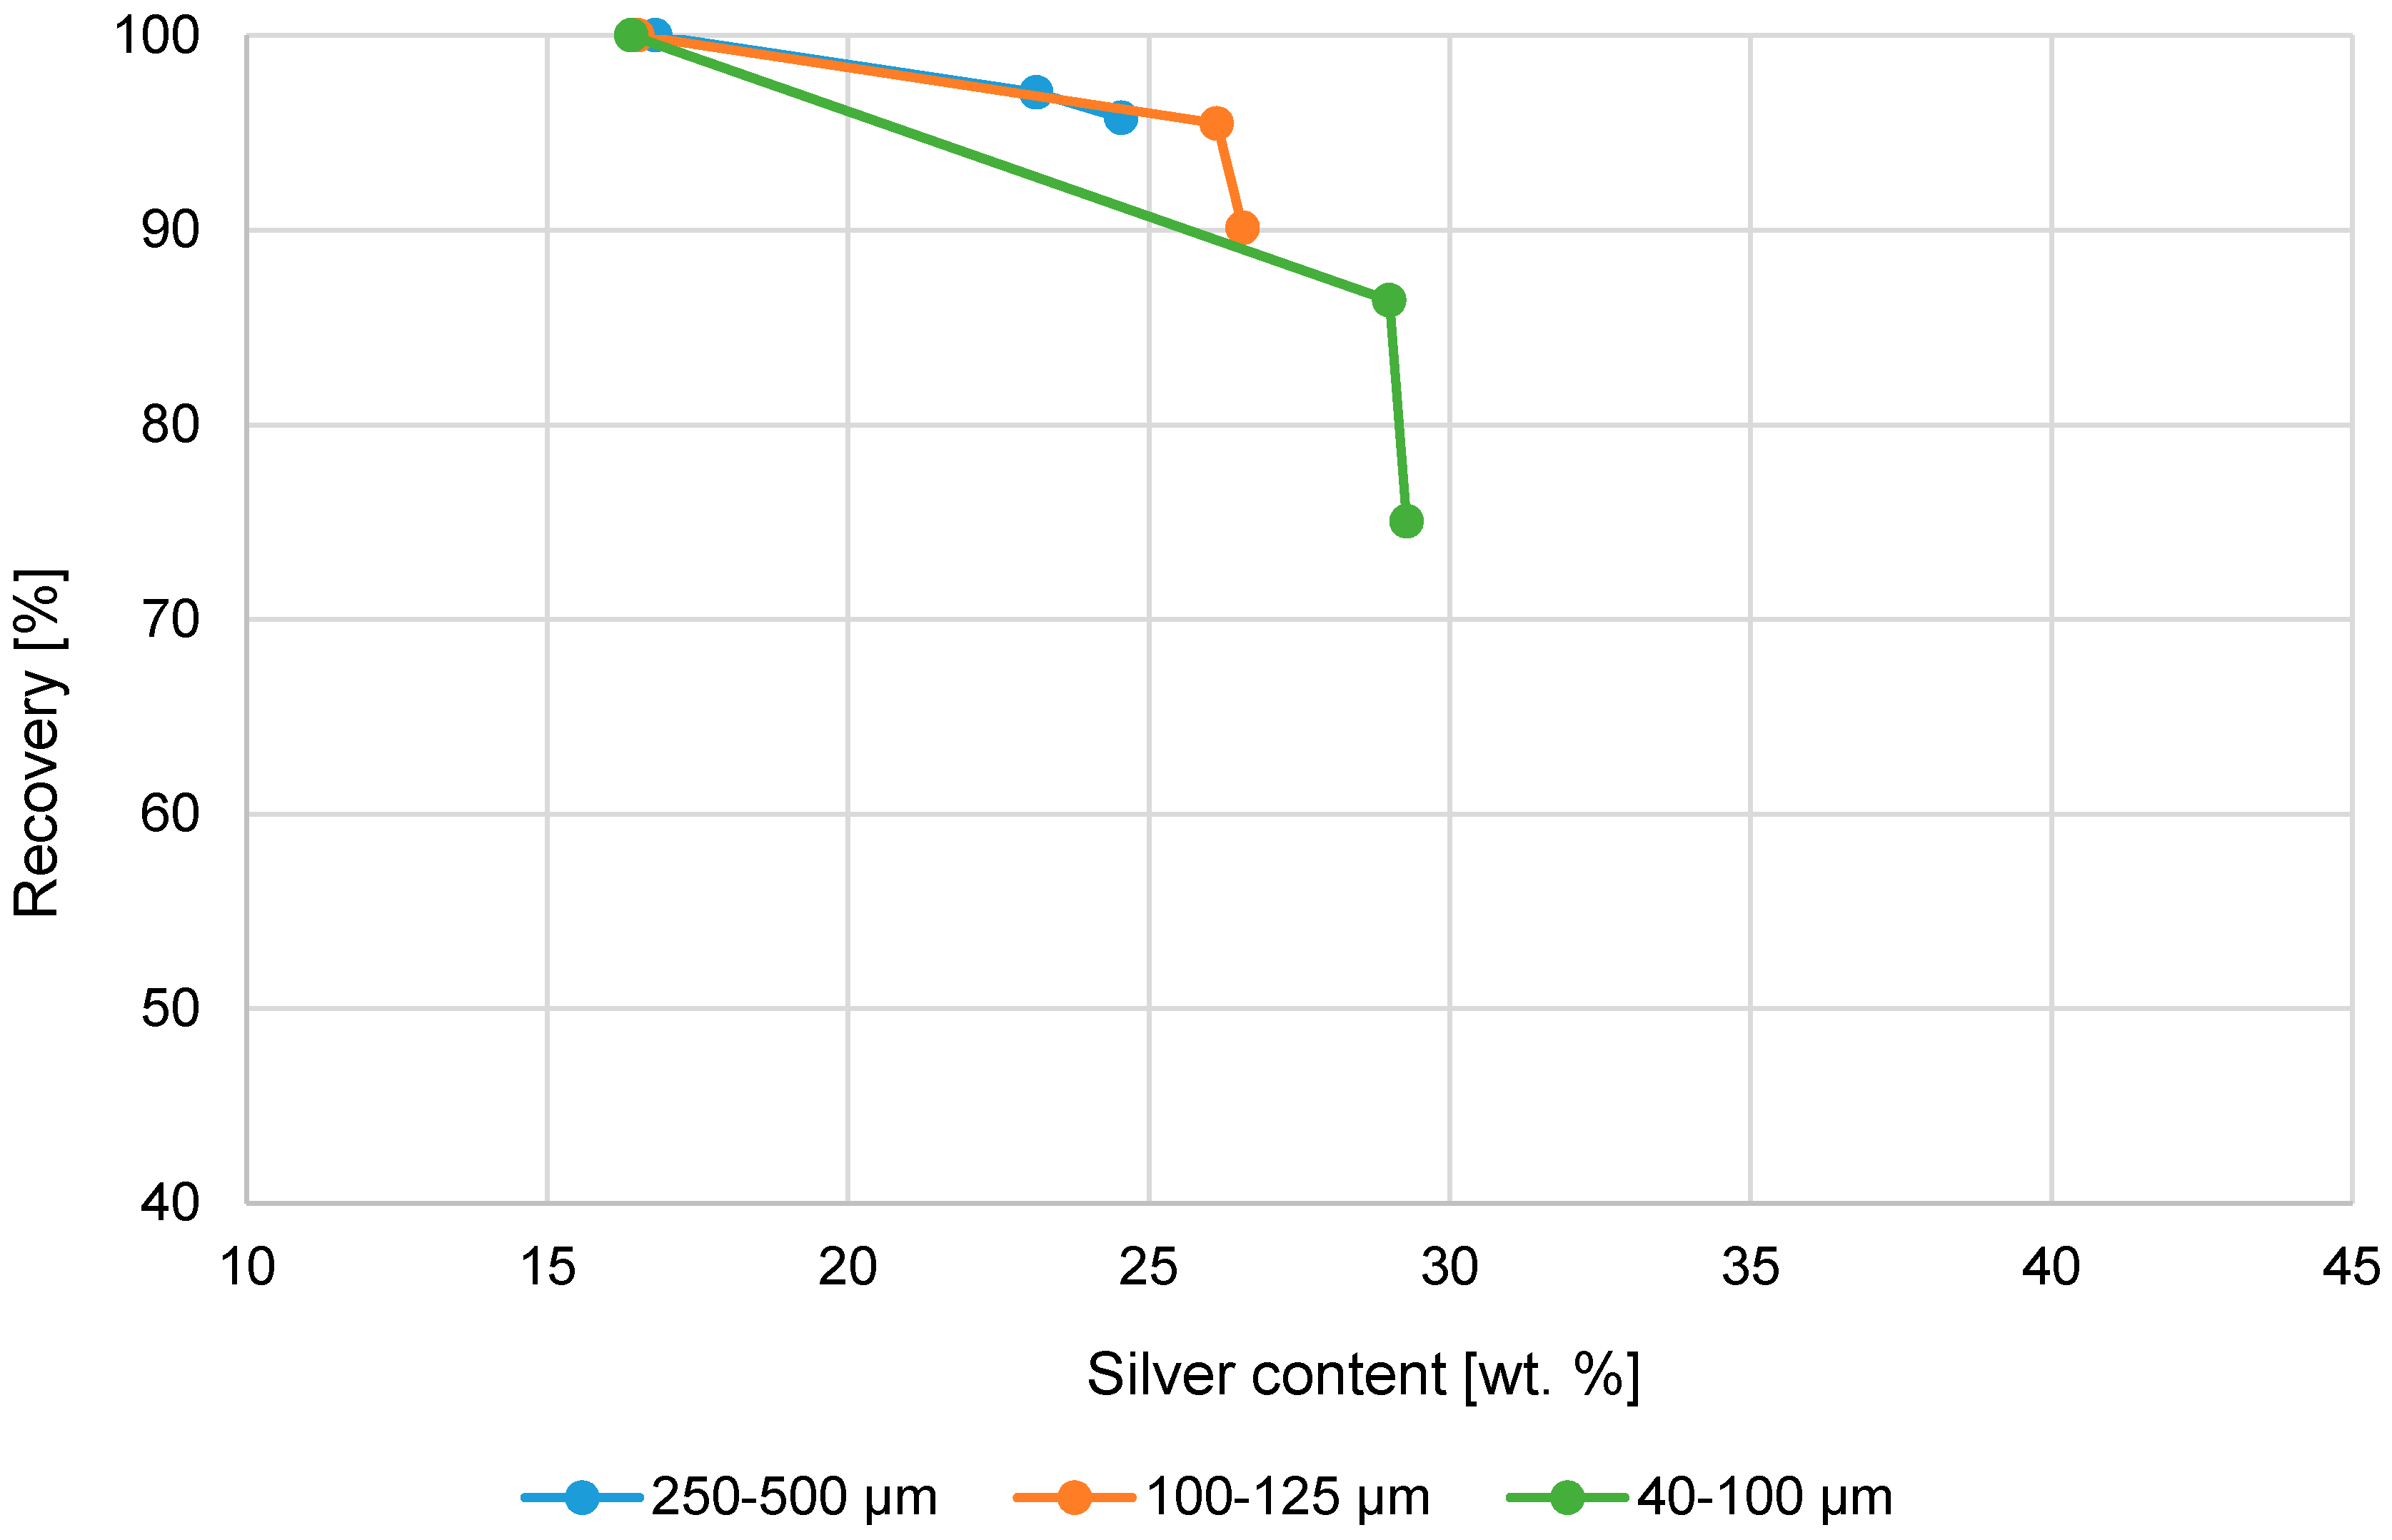
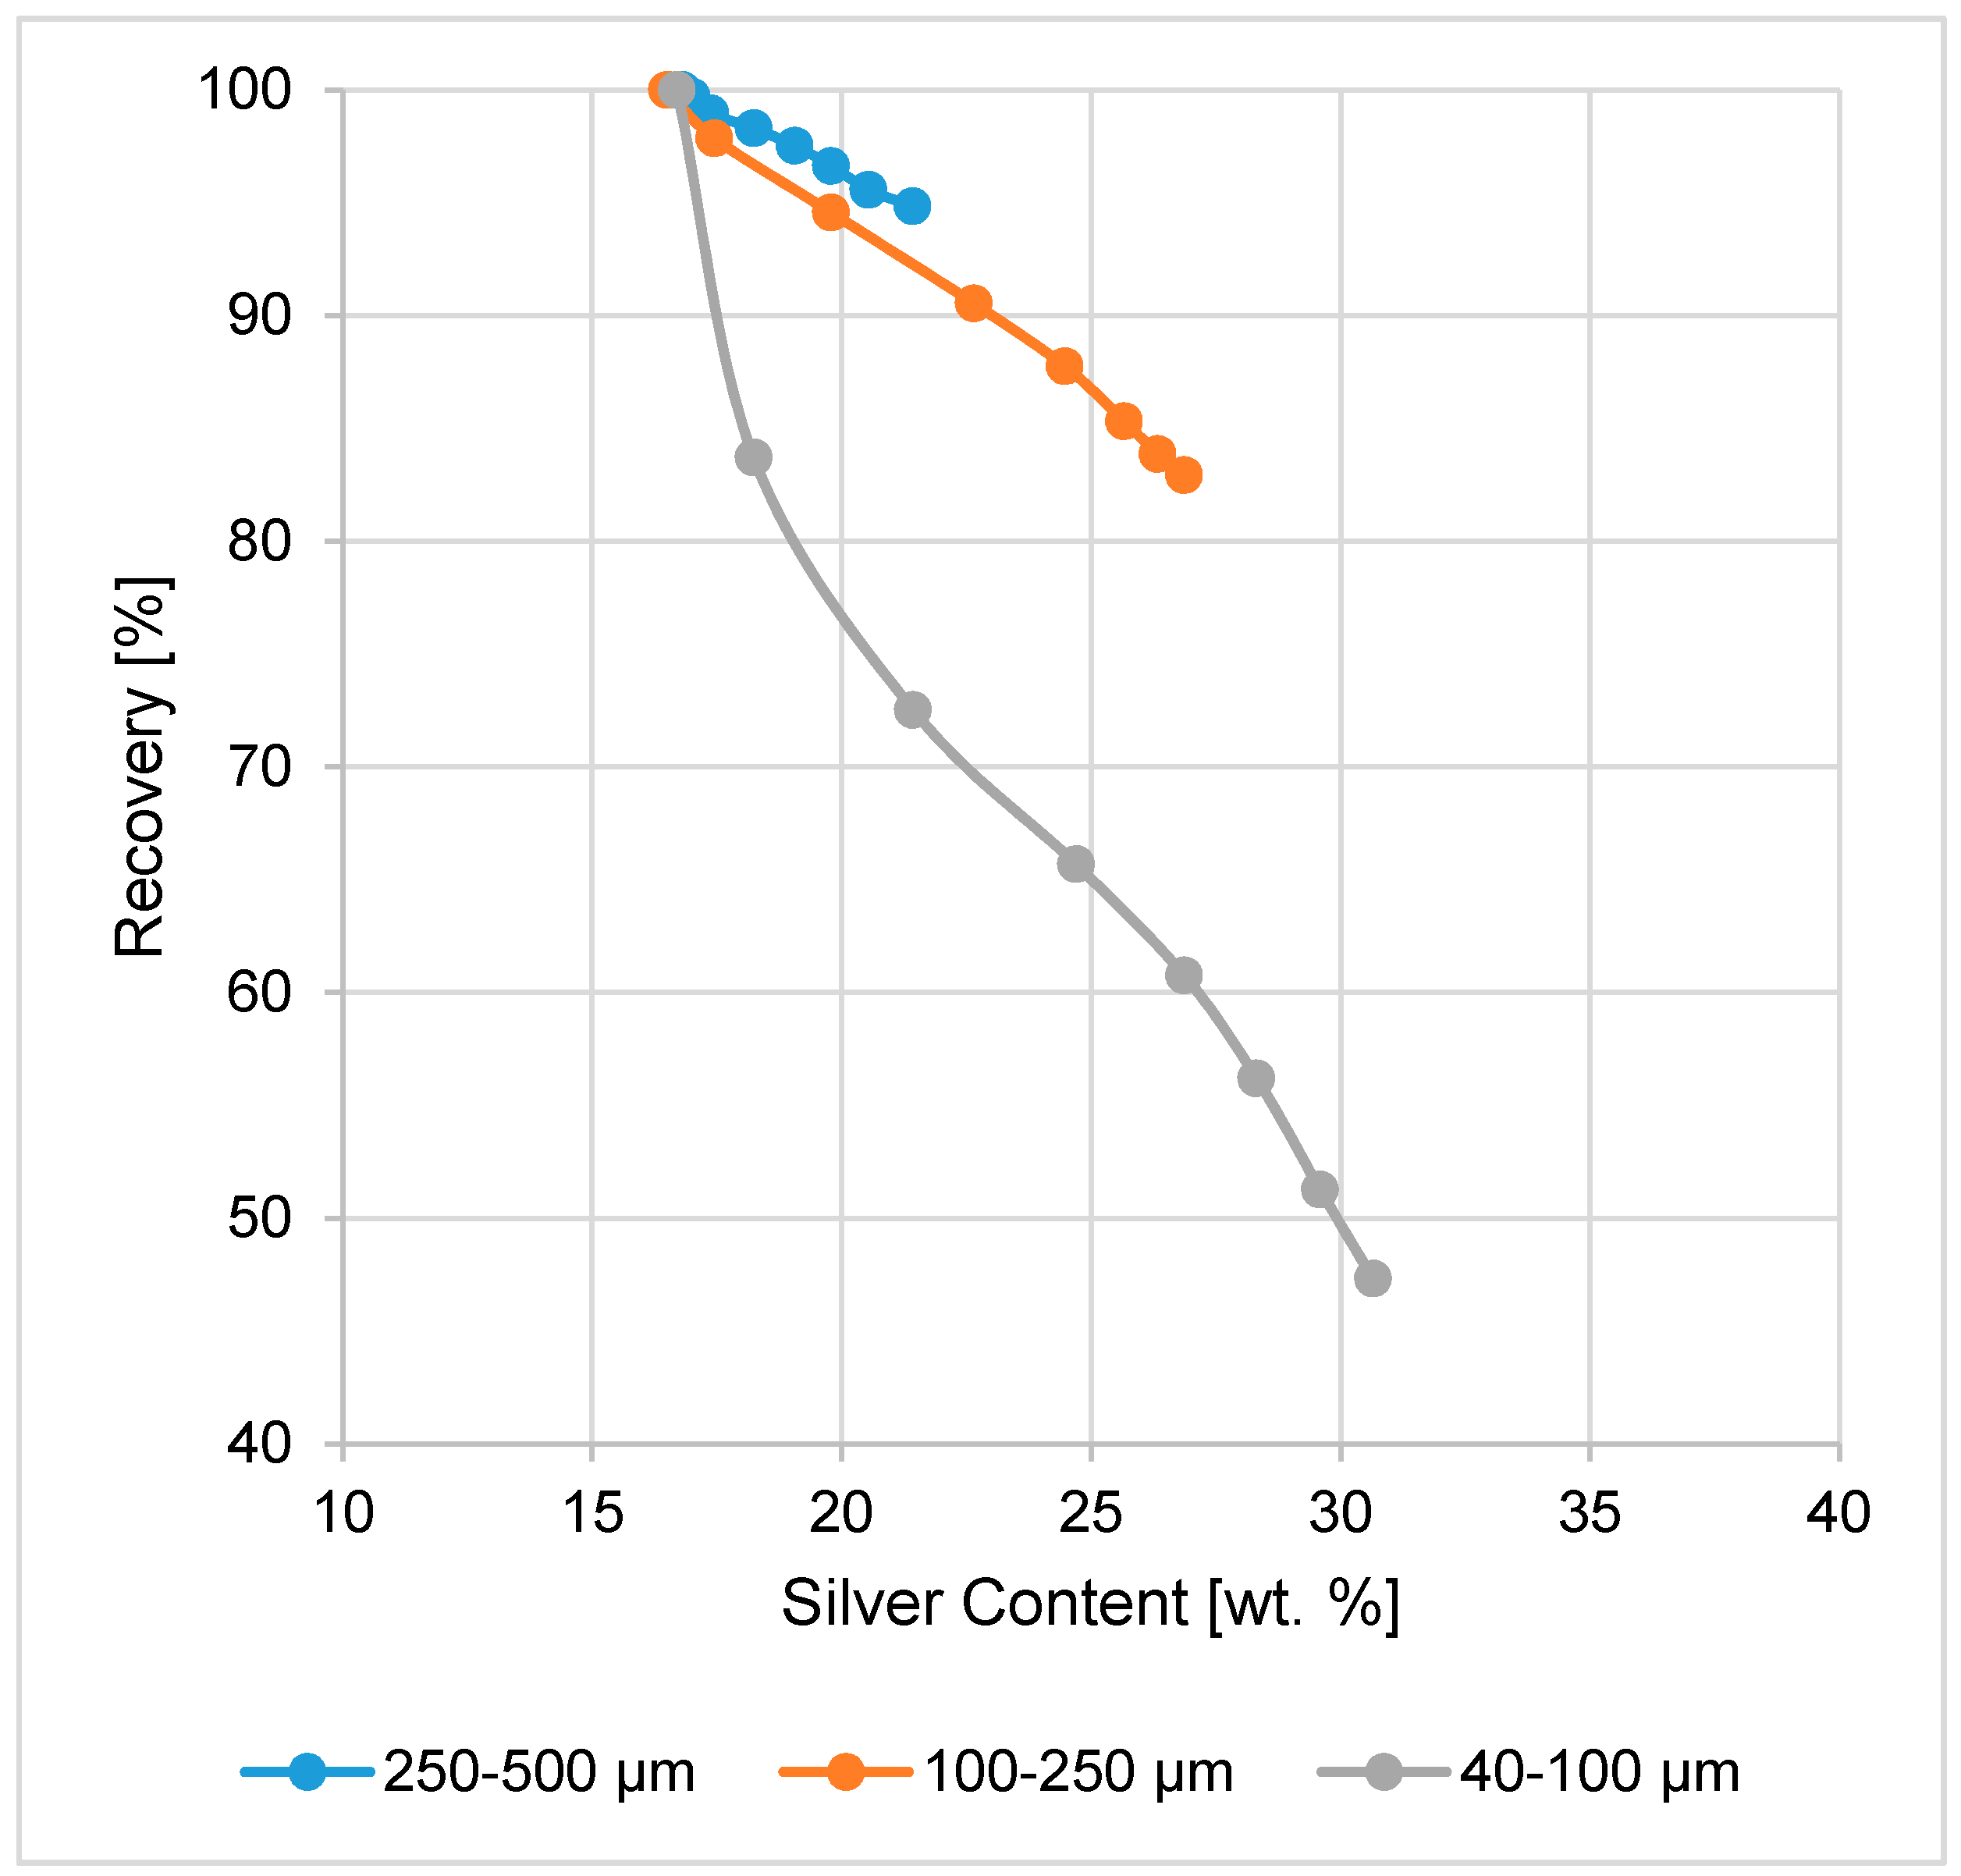
Metals 08 00114 g005
Figure 6. Cumulative silver recovery (%) and Ag-content (wt. %) in product using magnetic separation.
Metals 08 00114 g006
Figure 7. Cumulative silver recovery (%) and Ag-content (wt. %) in product using electrostatic separation.
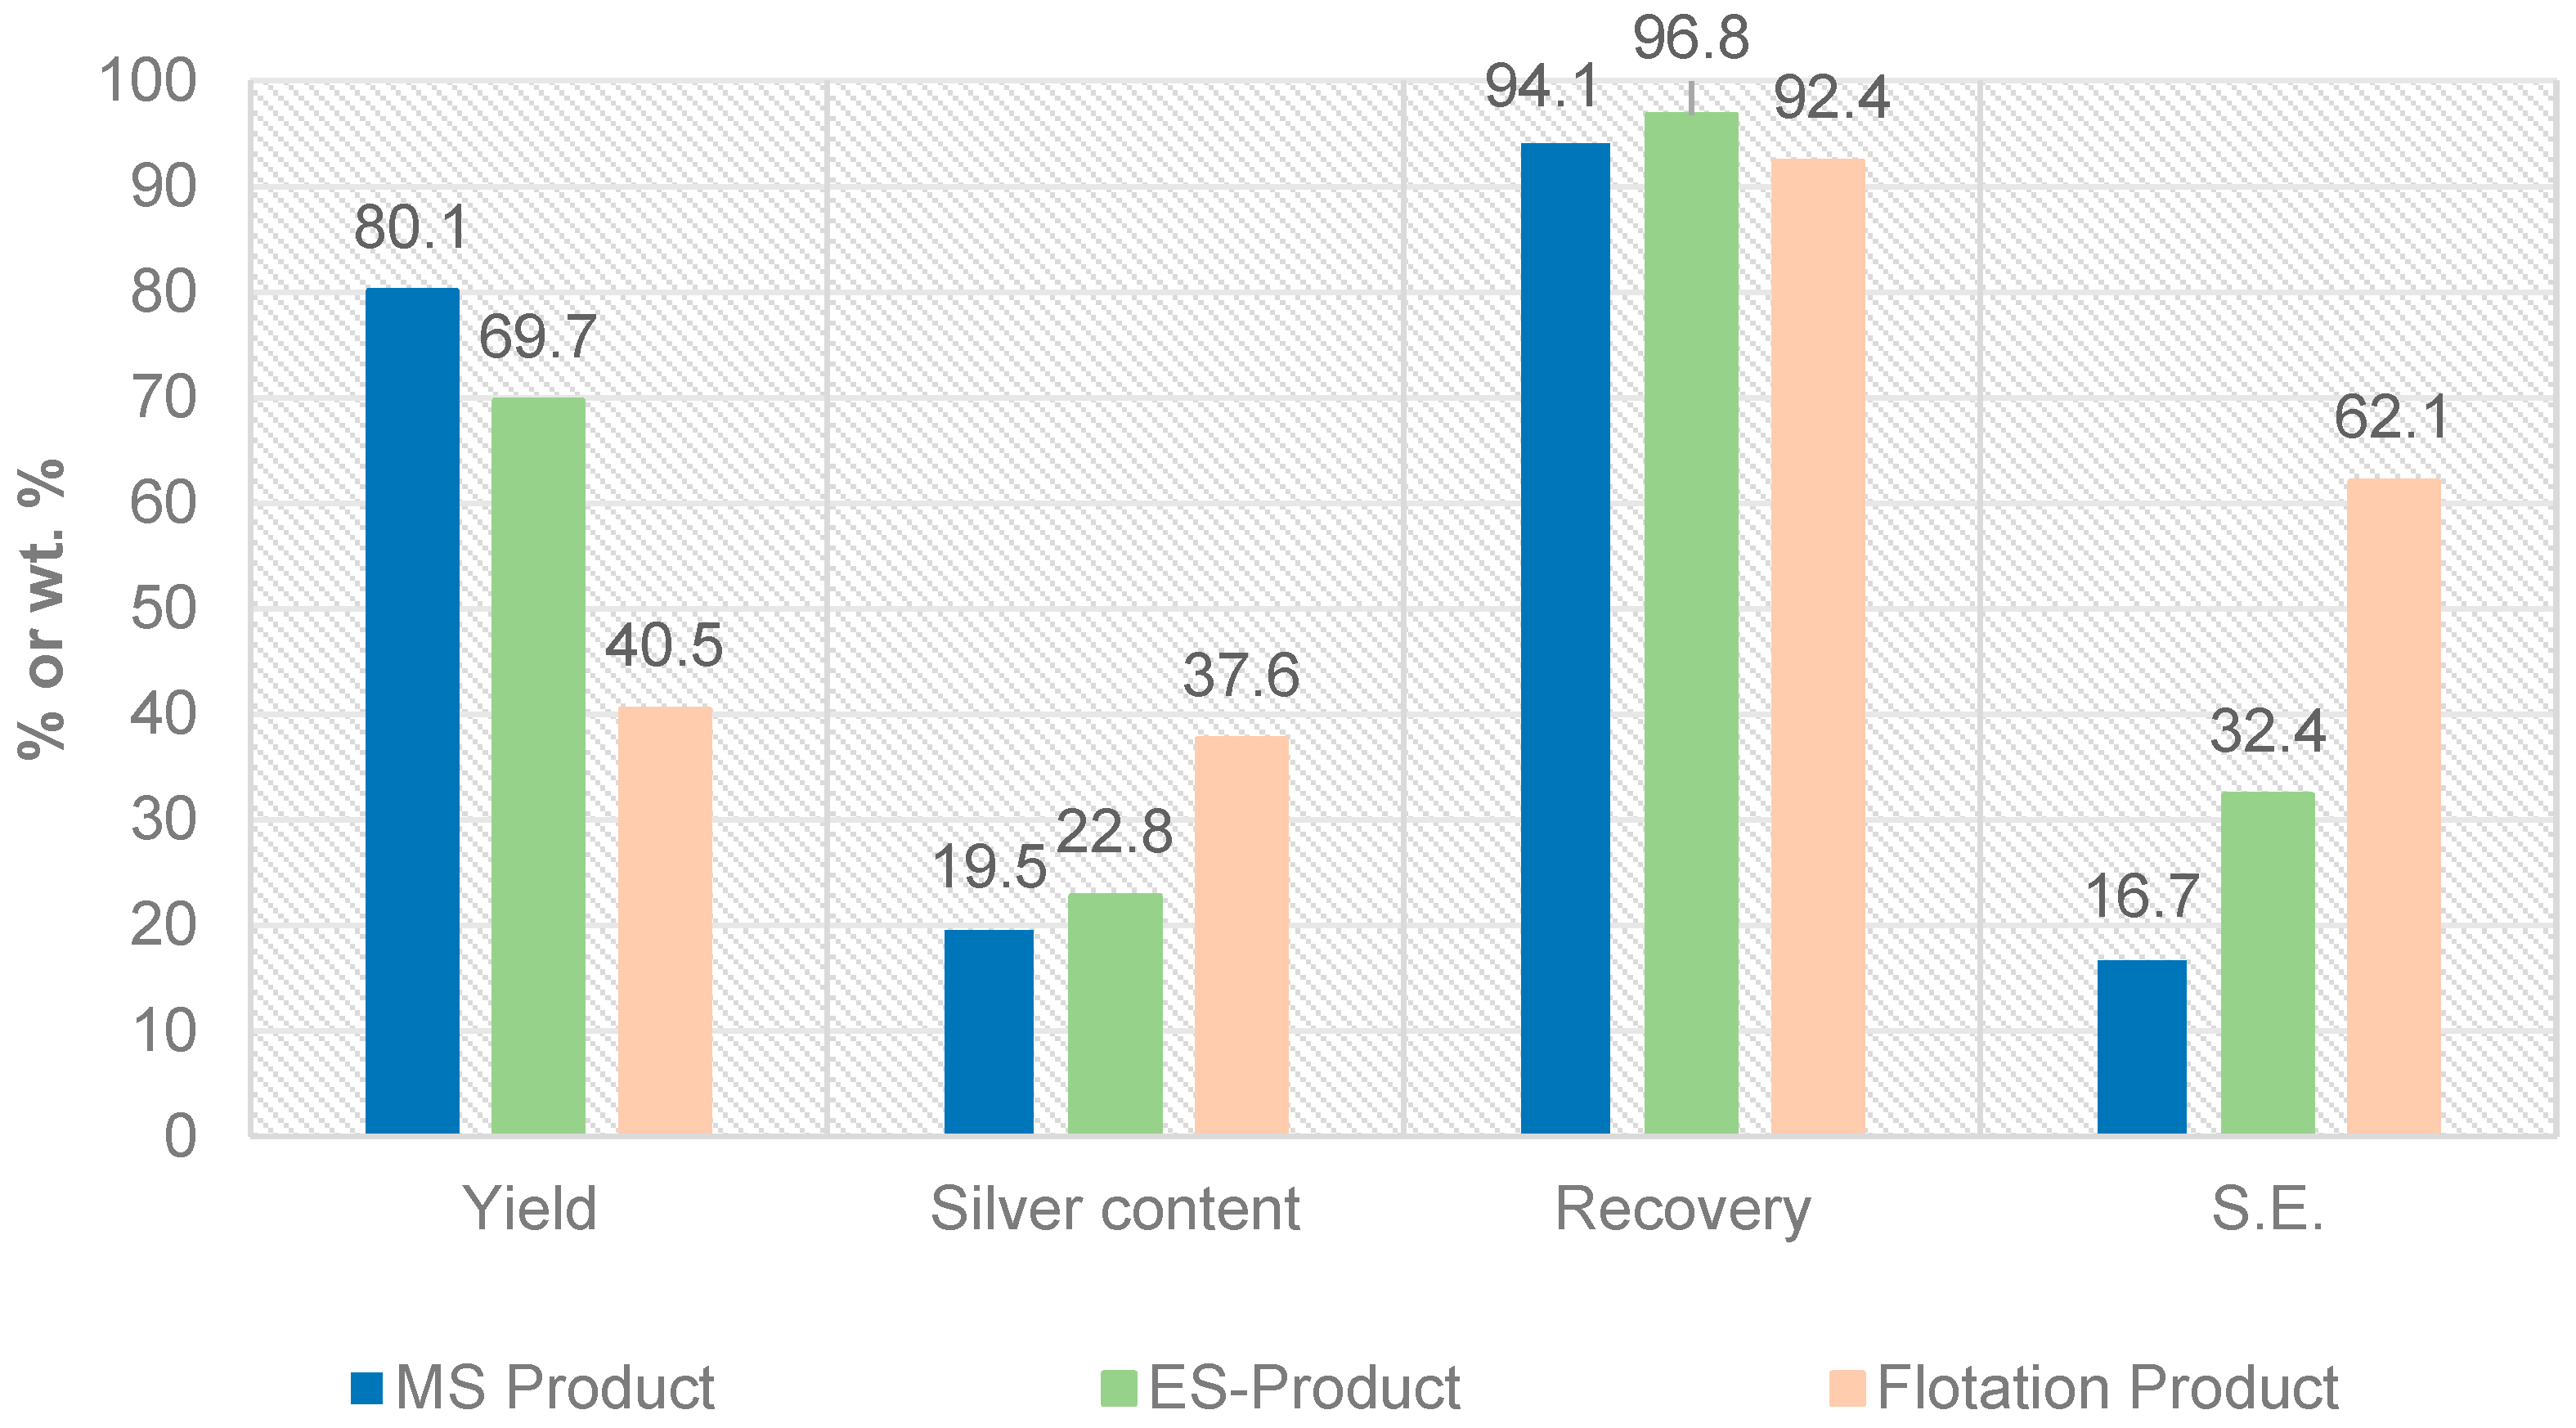
Metals 08 00114 g007
Figure 8. Comparison of the results of magnetic-, electrostatic separation and flotation (yield: mass output in relation to input, S.E.: separation efficiency).
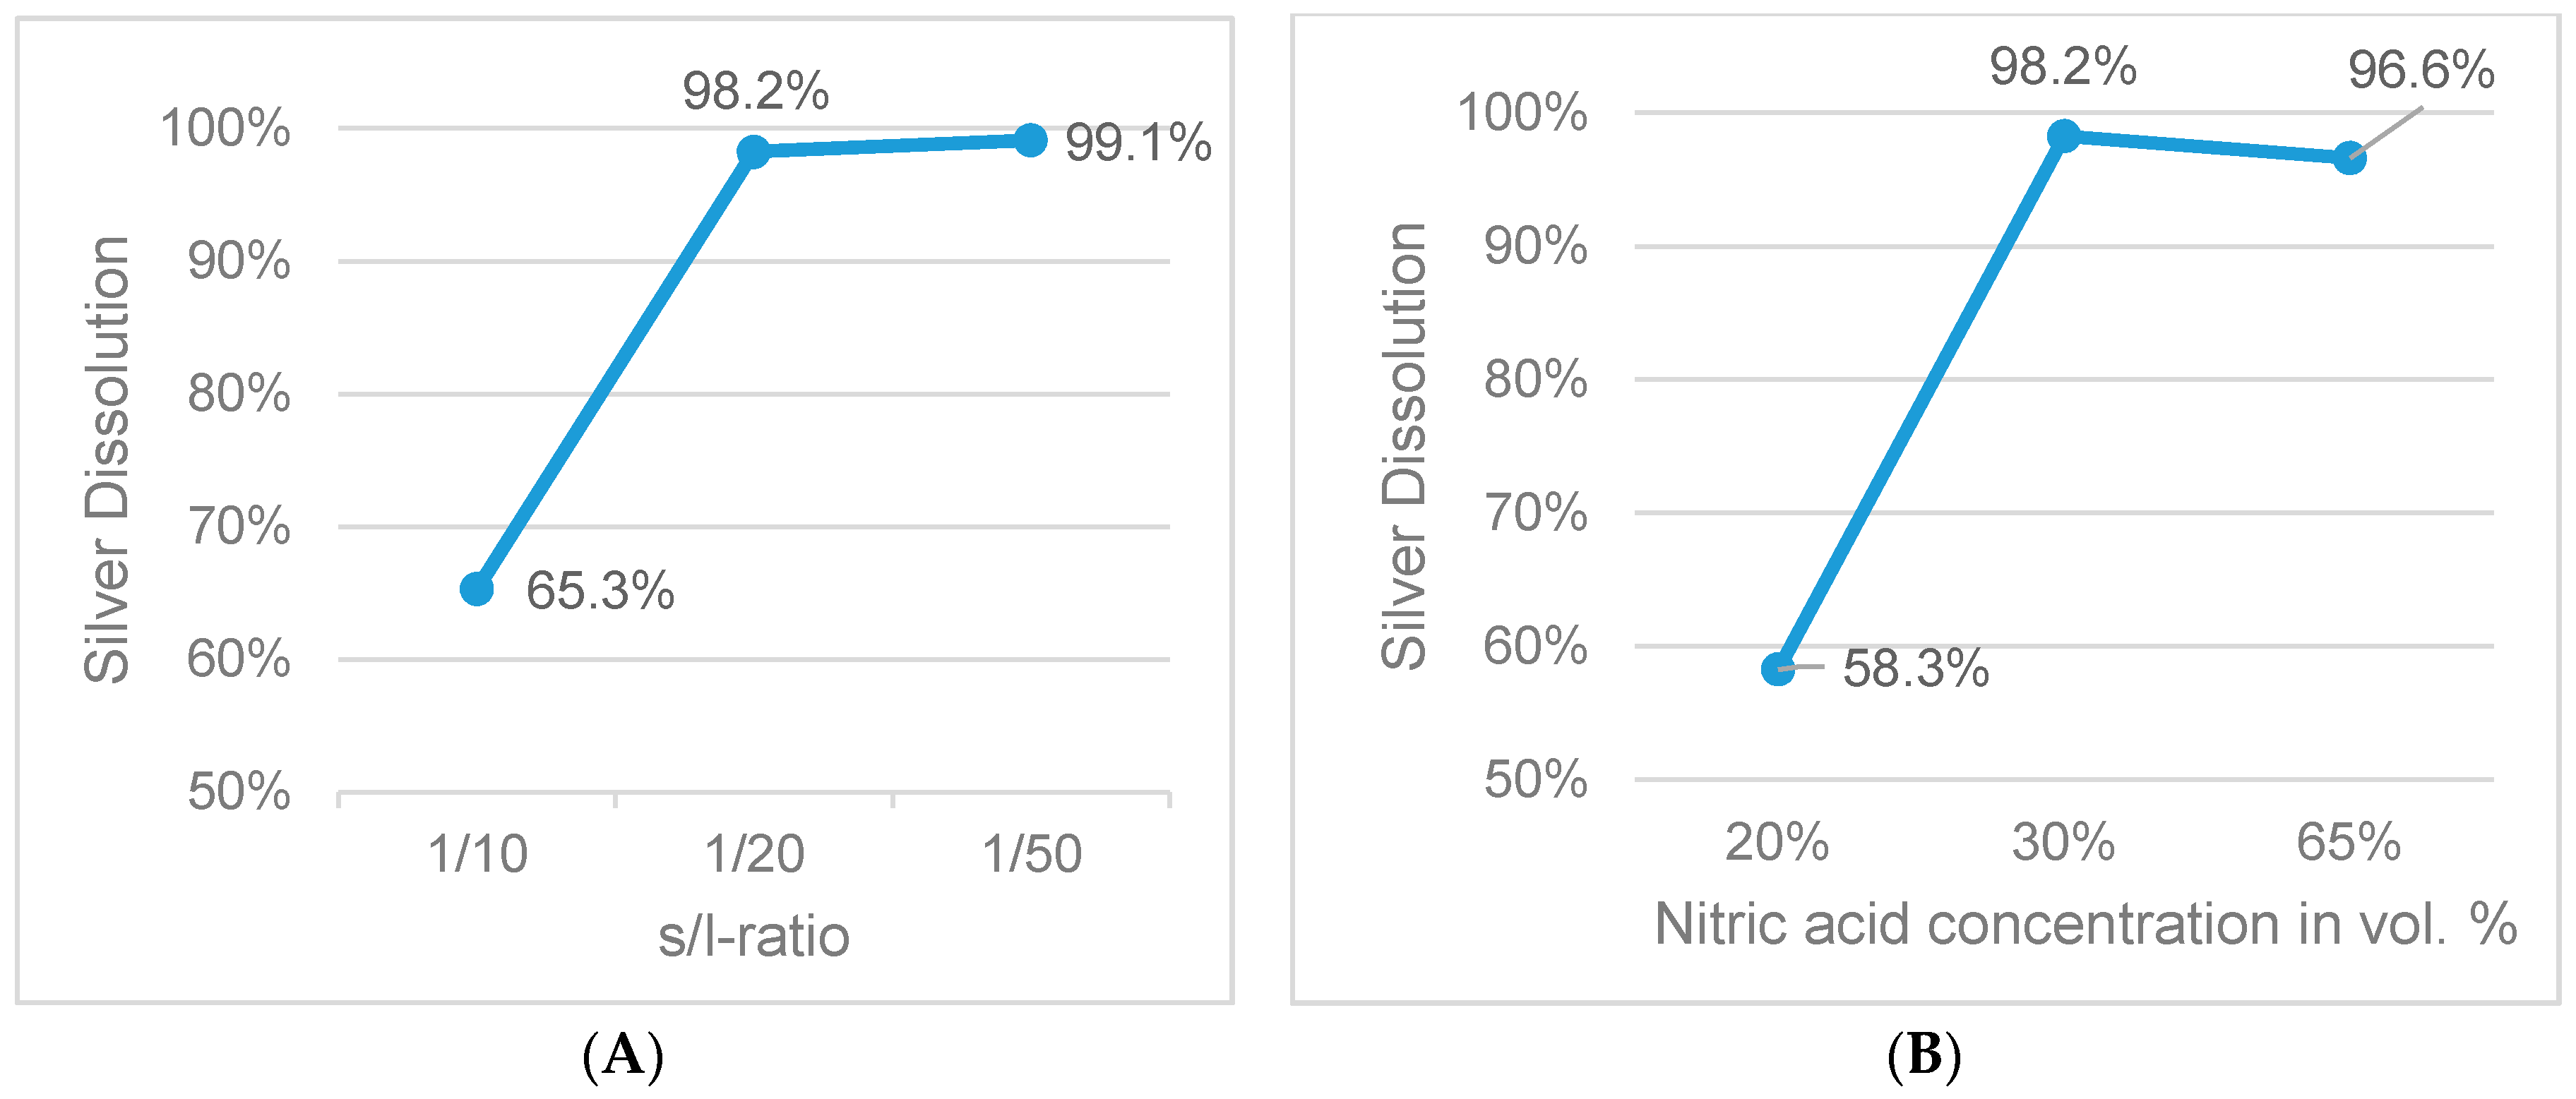
Metals 08 00114 g008
Figure 9. Influence of s/l-ratio (A) and acid concentration (B) on silver dissolution (fixed parameters: 1 h leaching duration, 65 °C).
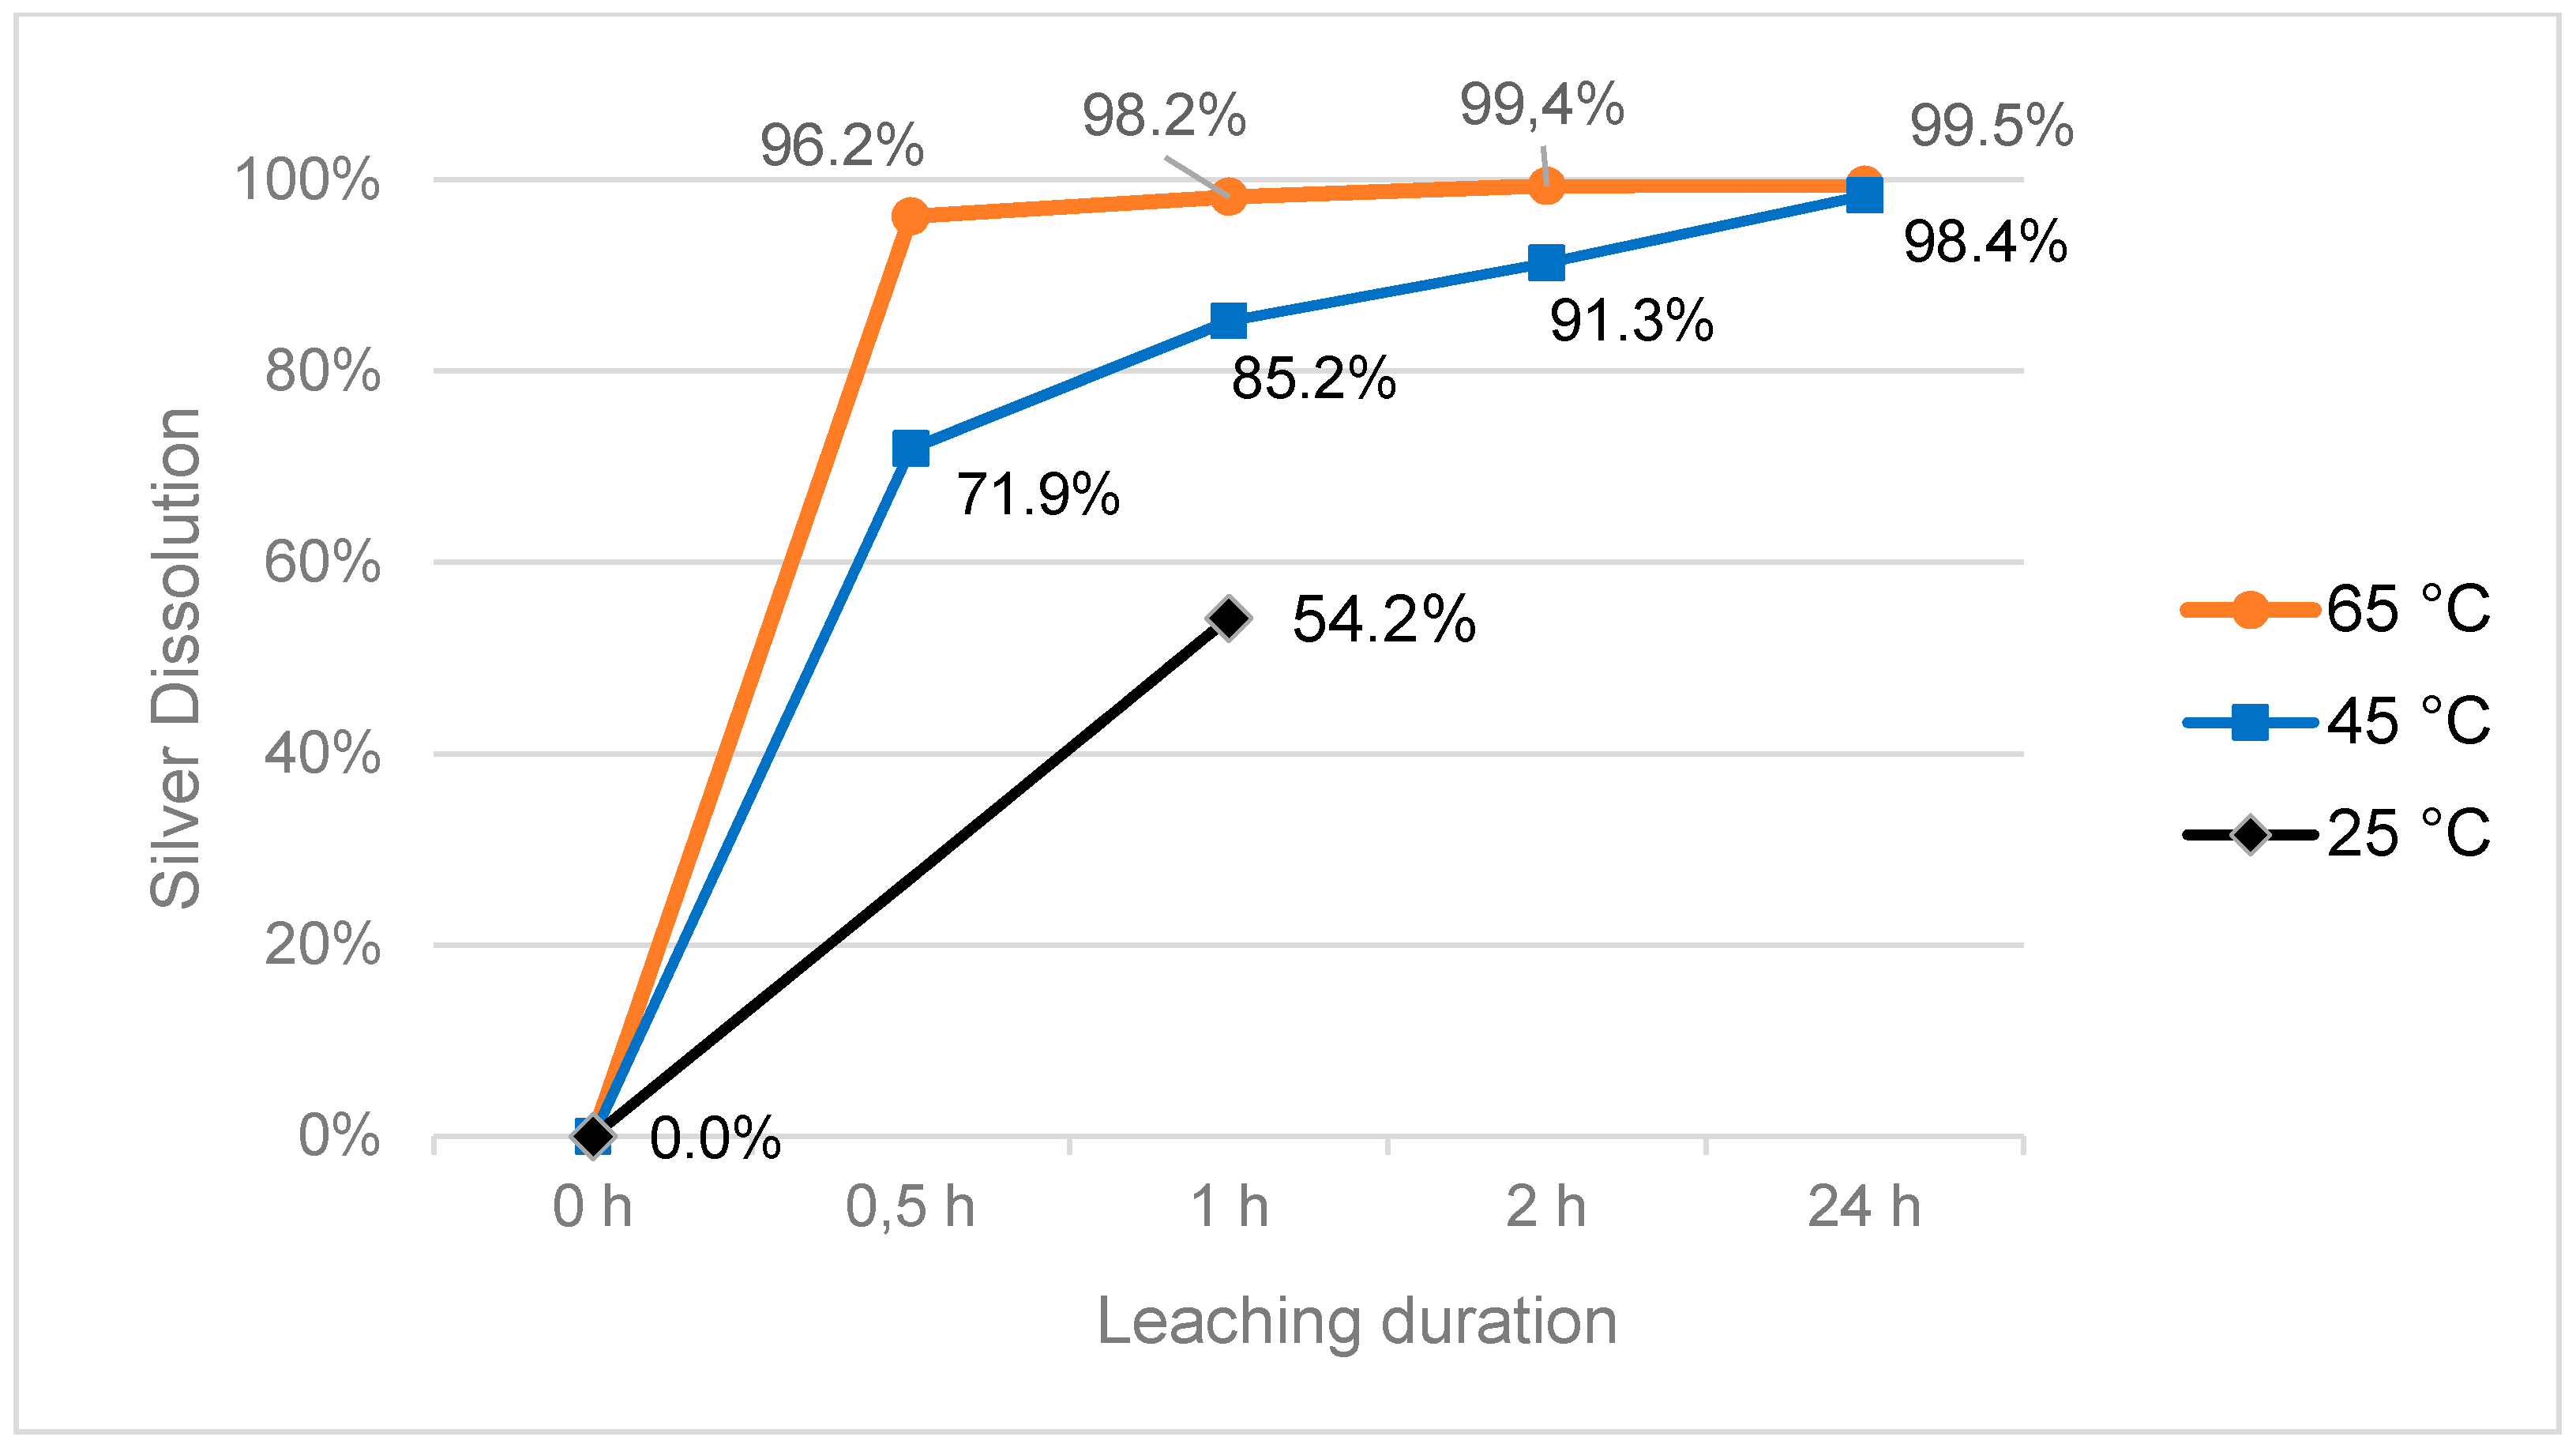
Metals 08 00114 g009
Figure 10. Influence of temperature and leaching duration on silver dissolution (fixed parameters: 30% HNO3, s/l = 1/20).
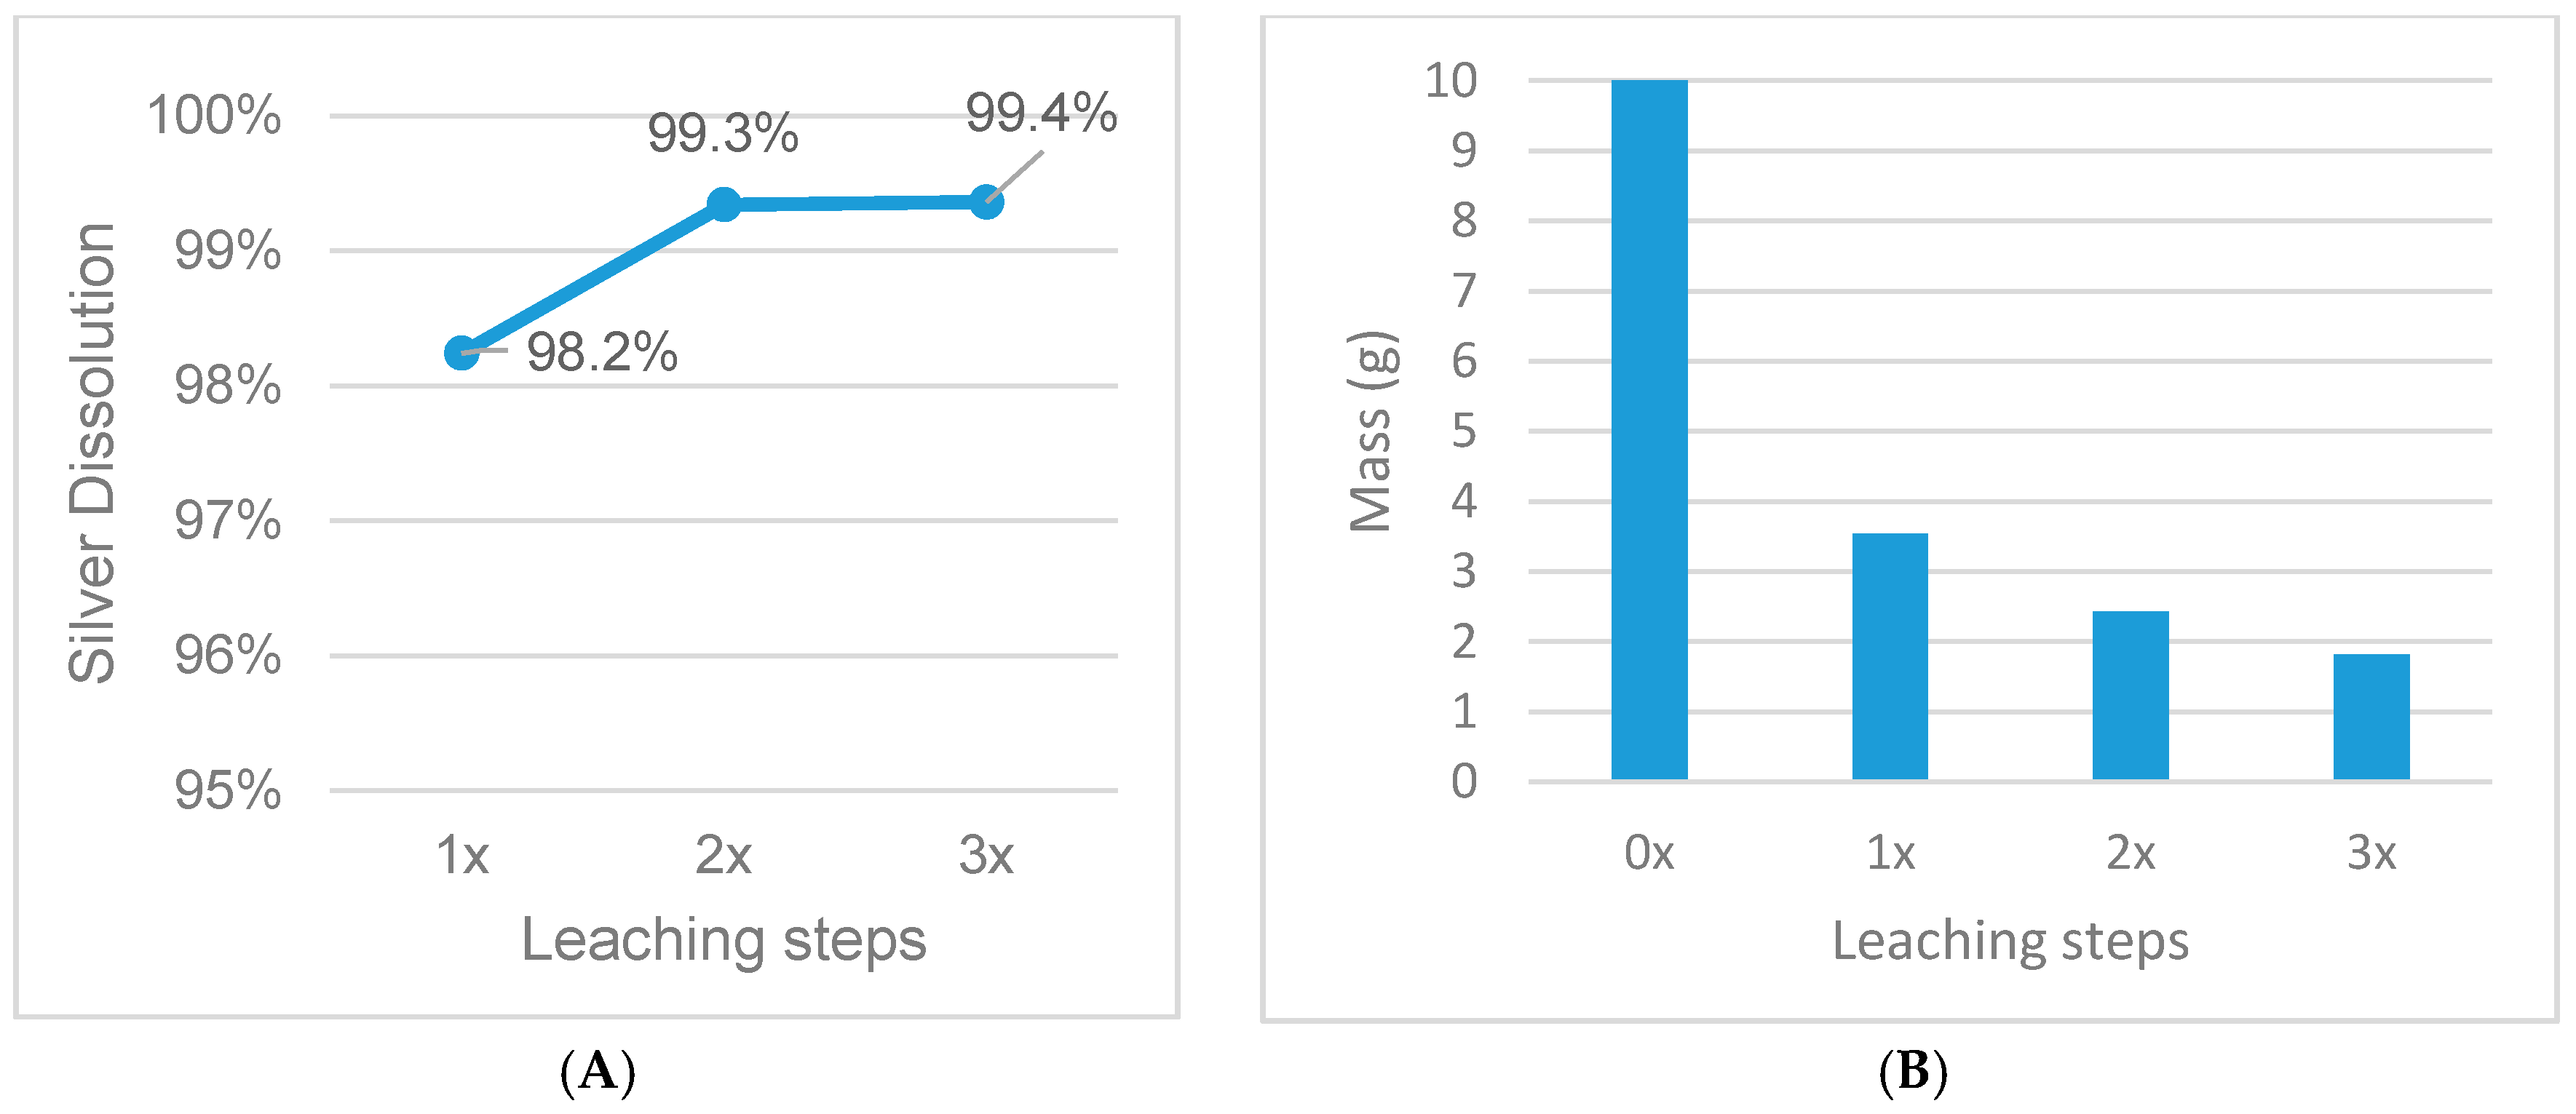
Metals 08 00114 g010
Figure 11. Influence of multiple-step leaching on silver dissolution (A) and mass reduction (B), fixed parameters: 30% HNO3, s/l = 1/20, 1 h leaching duration, 65 °C.
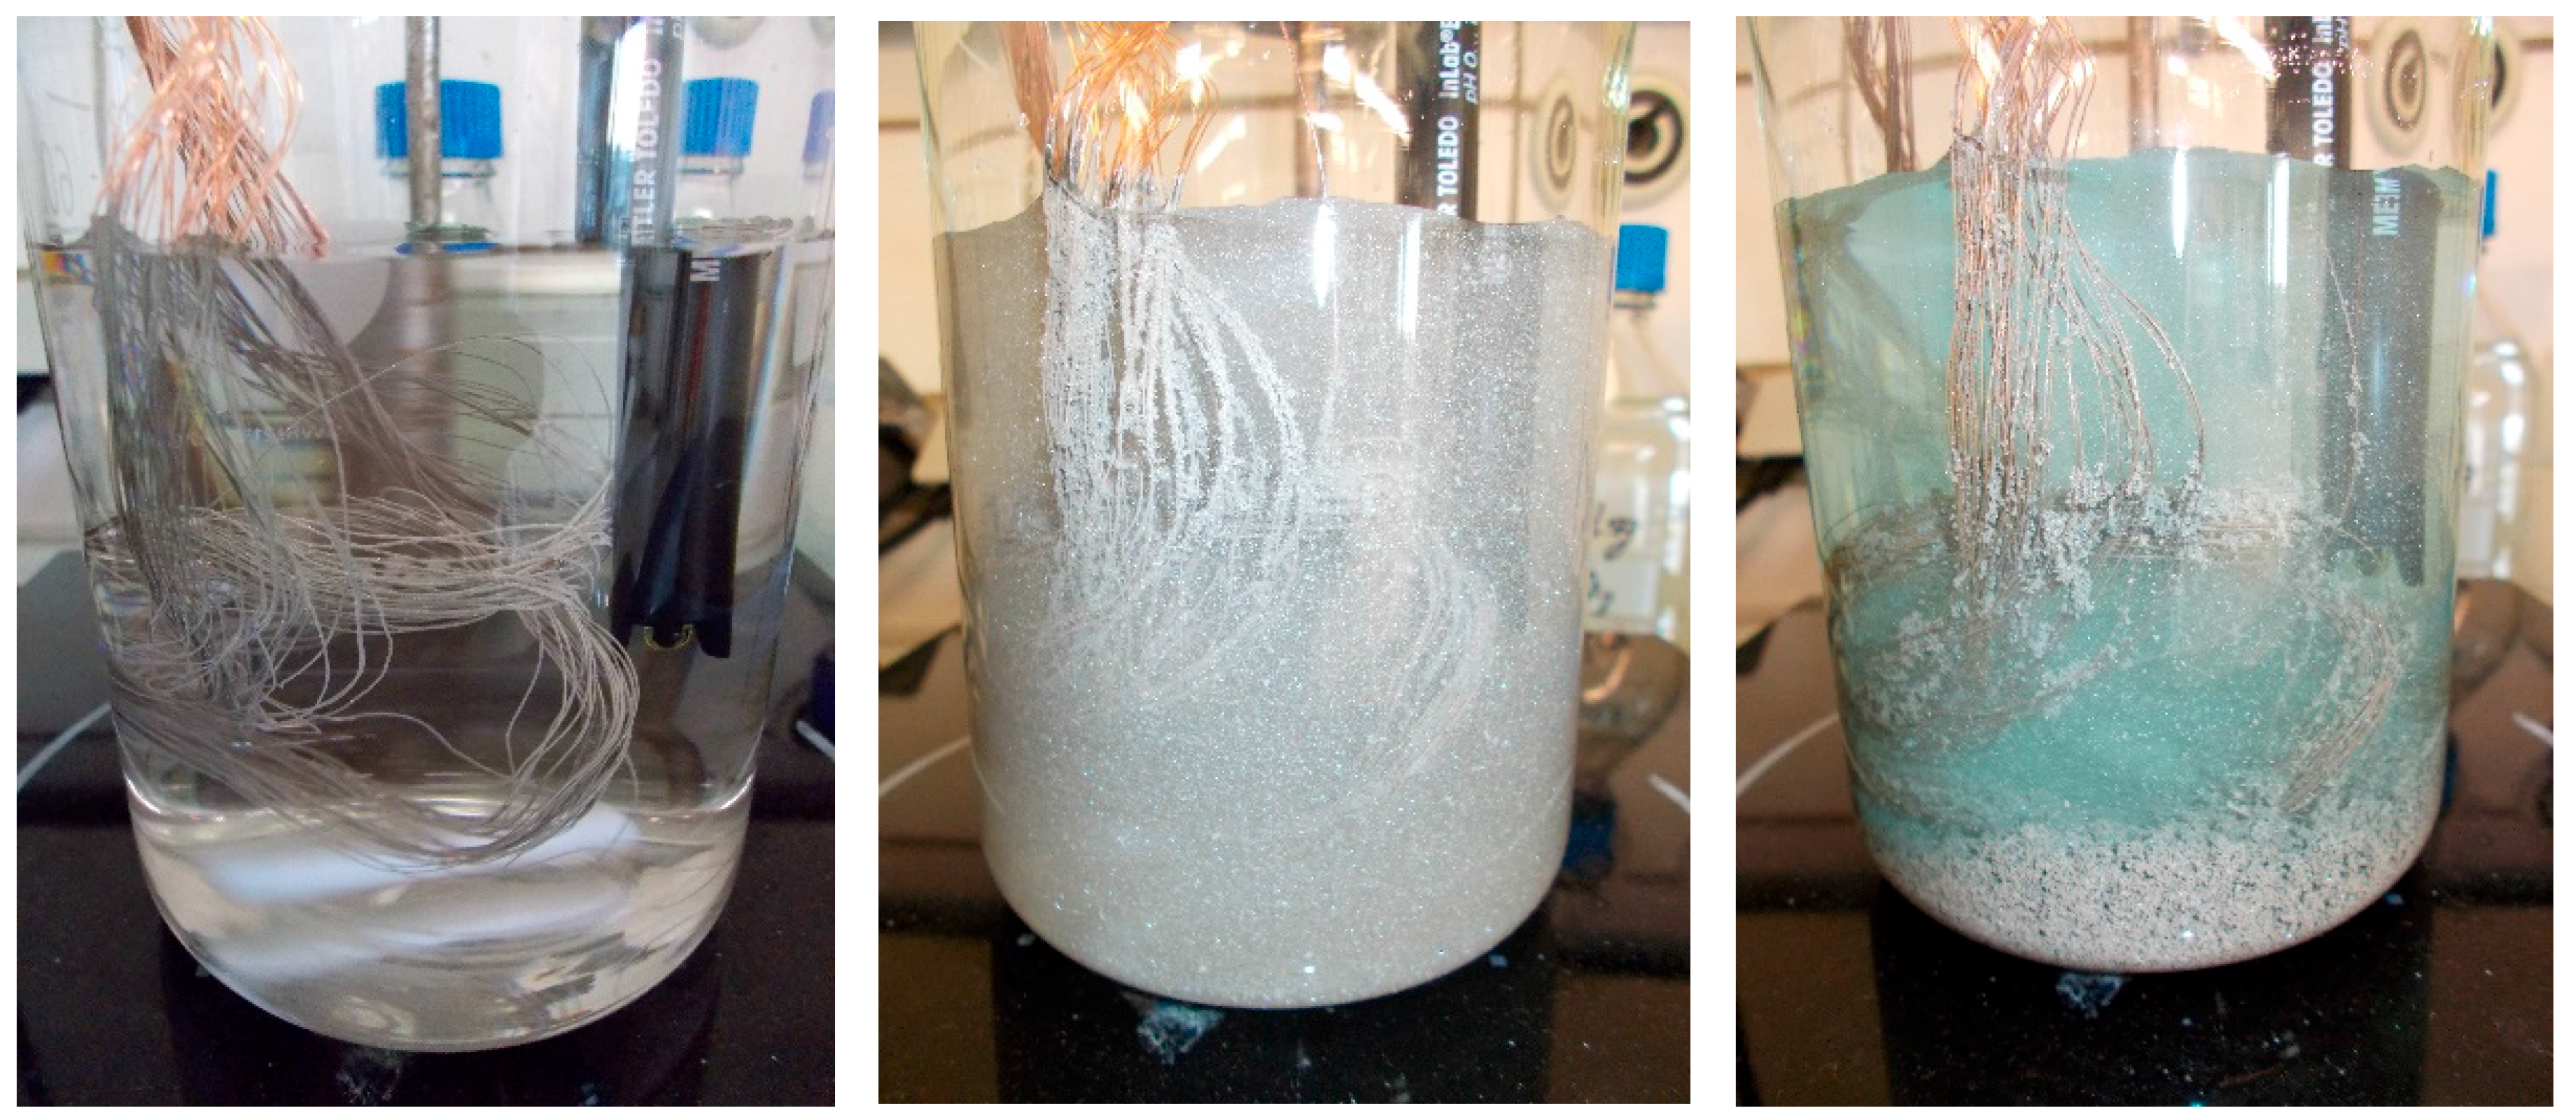
Metals 08 00114 g011
Figure 12. Silver cementation with copper wire in a stirred beaker.
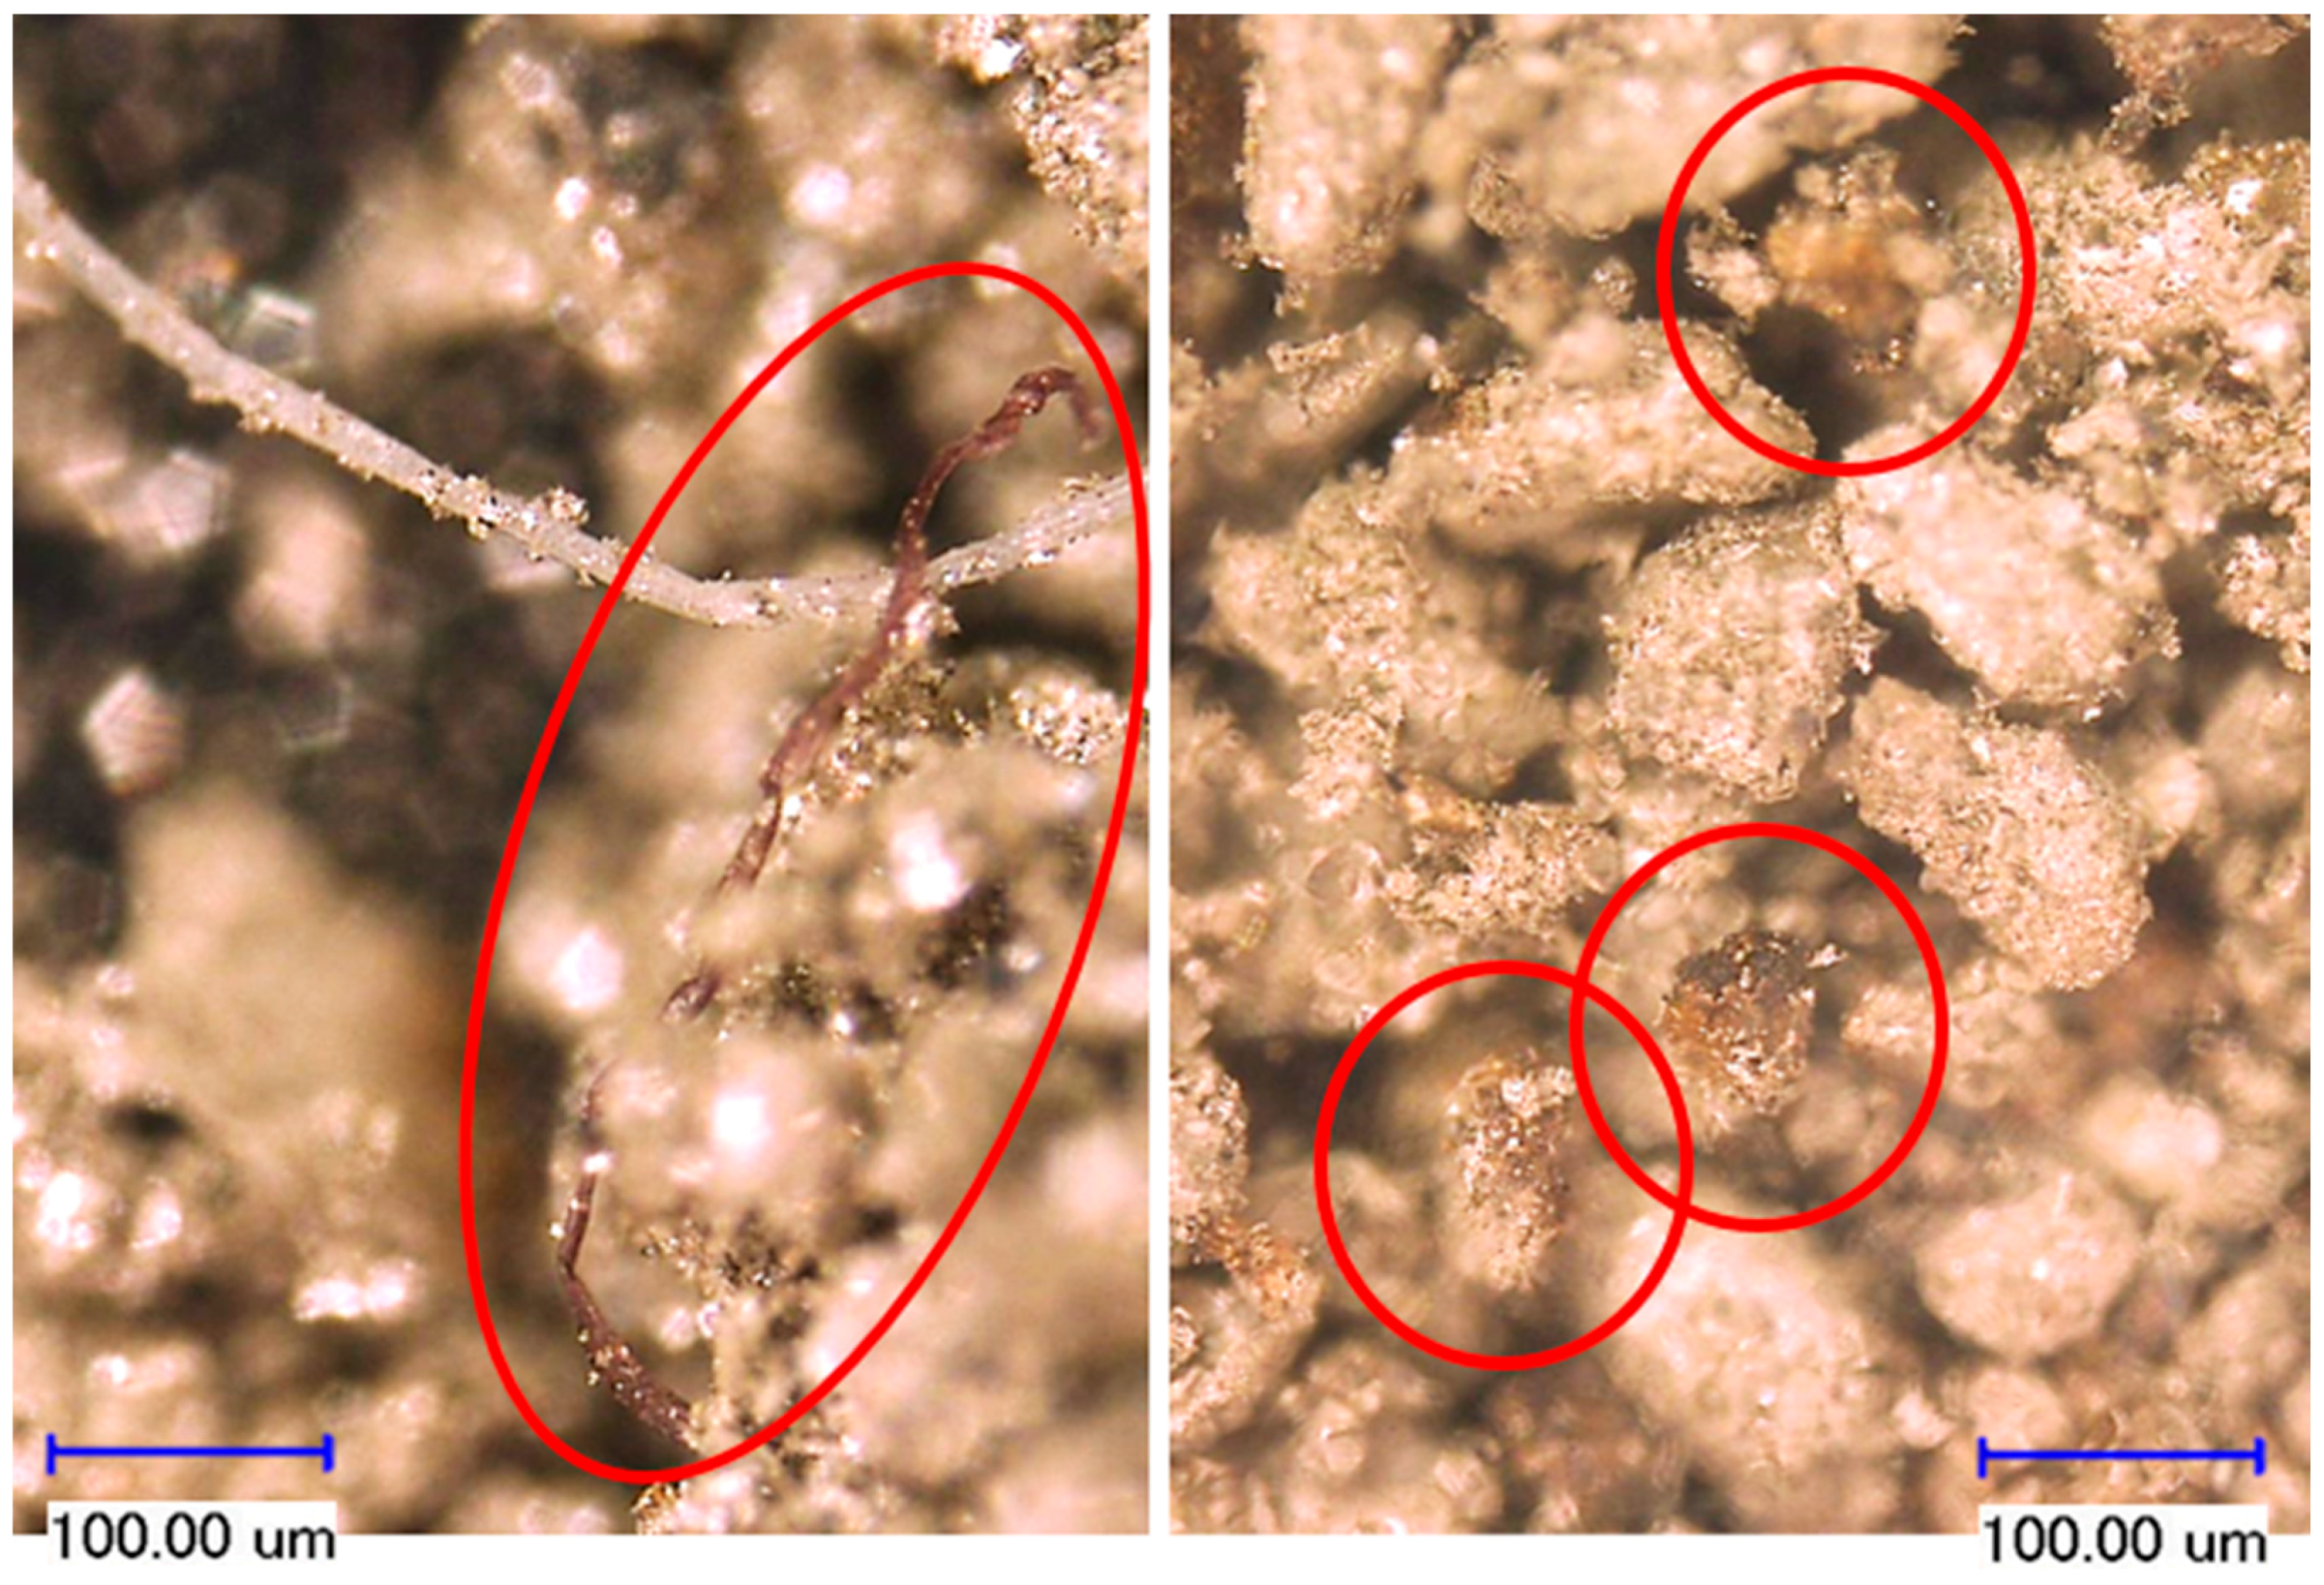
Metals 08 00114 g012
Figure 13. Copper impurities in silver cementate (magnification 500×).
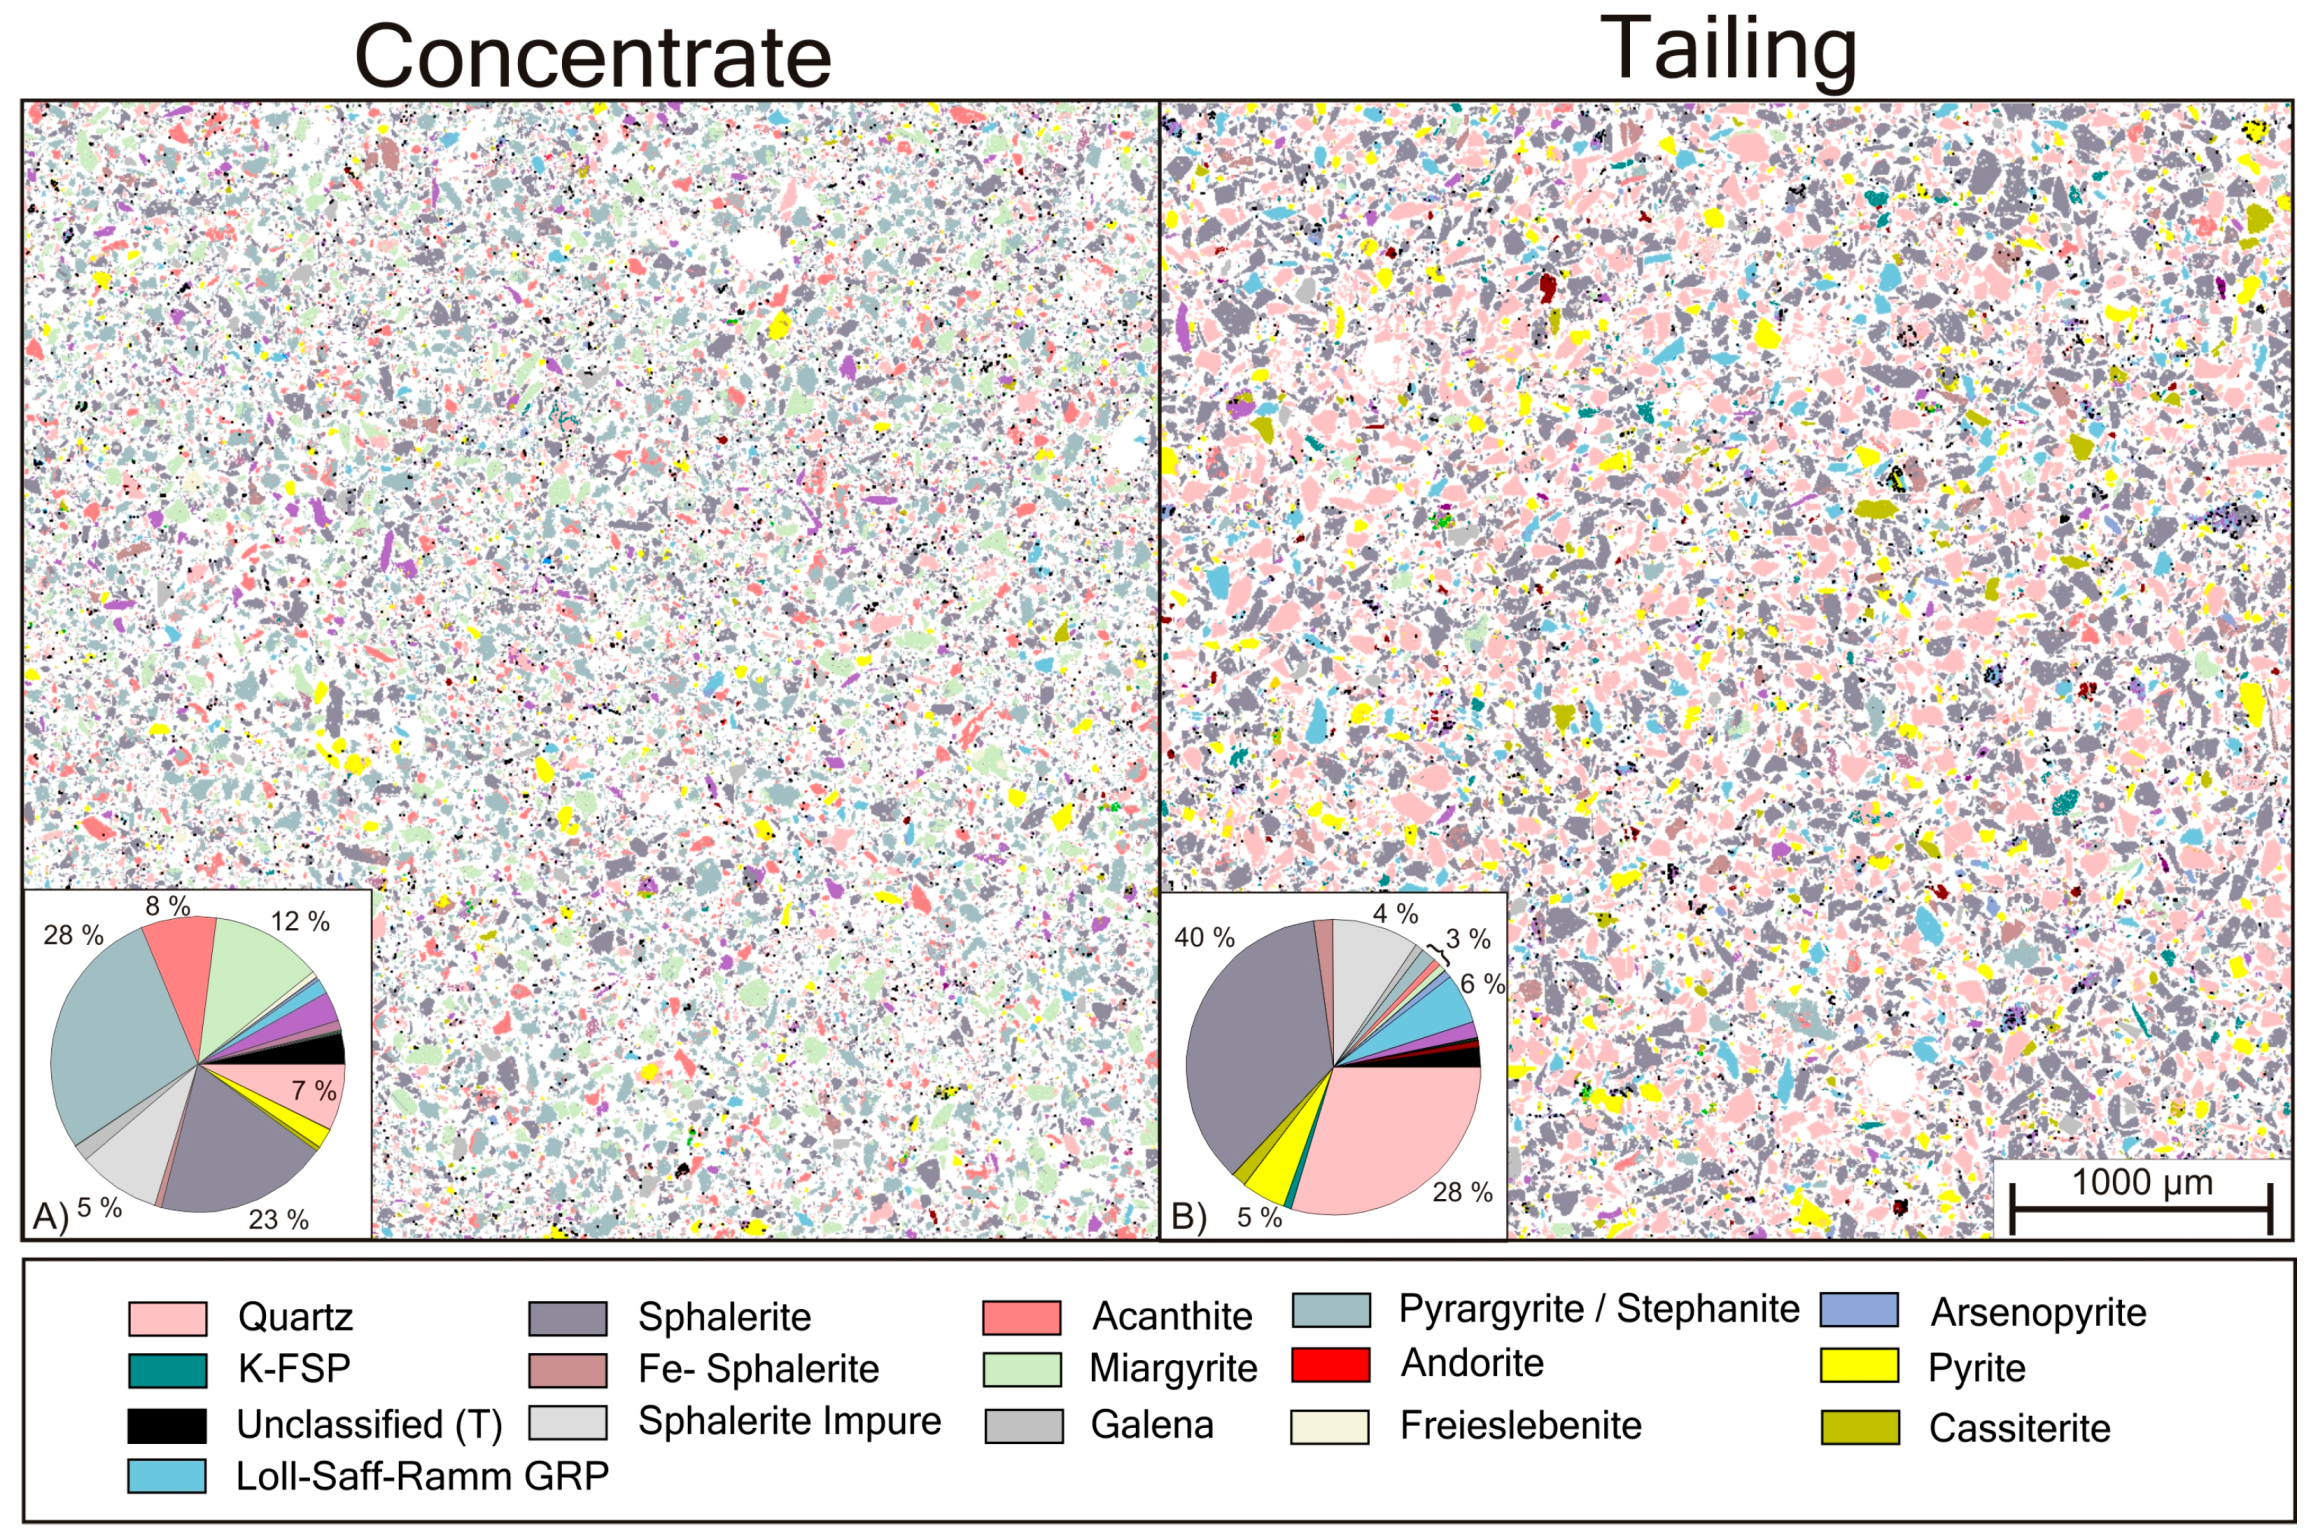
Metals 08 00114 g013
Figure 14. Detailed section view and modal composition (vol. %) of the minerals processing concentrate (A) and tailings (B).
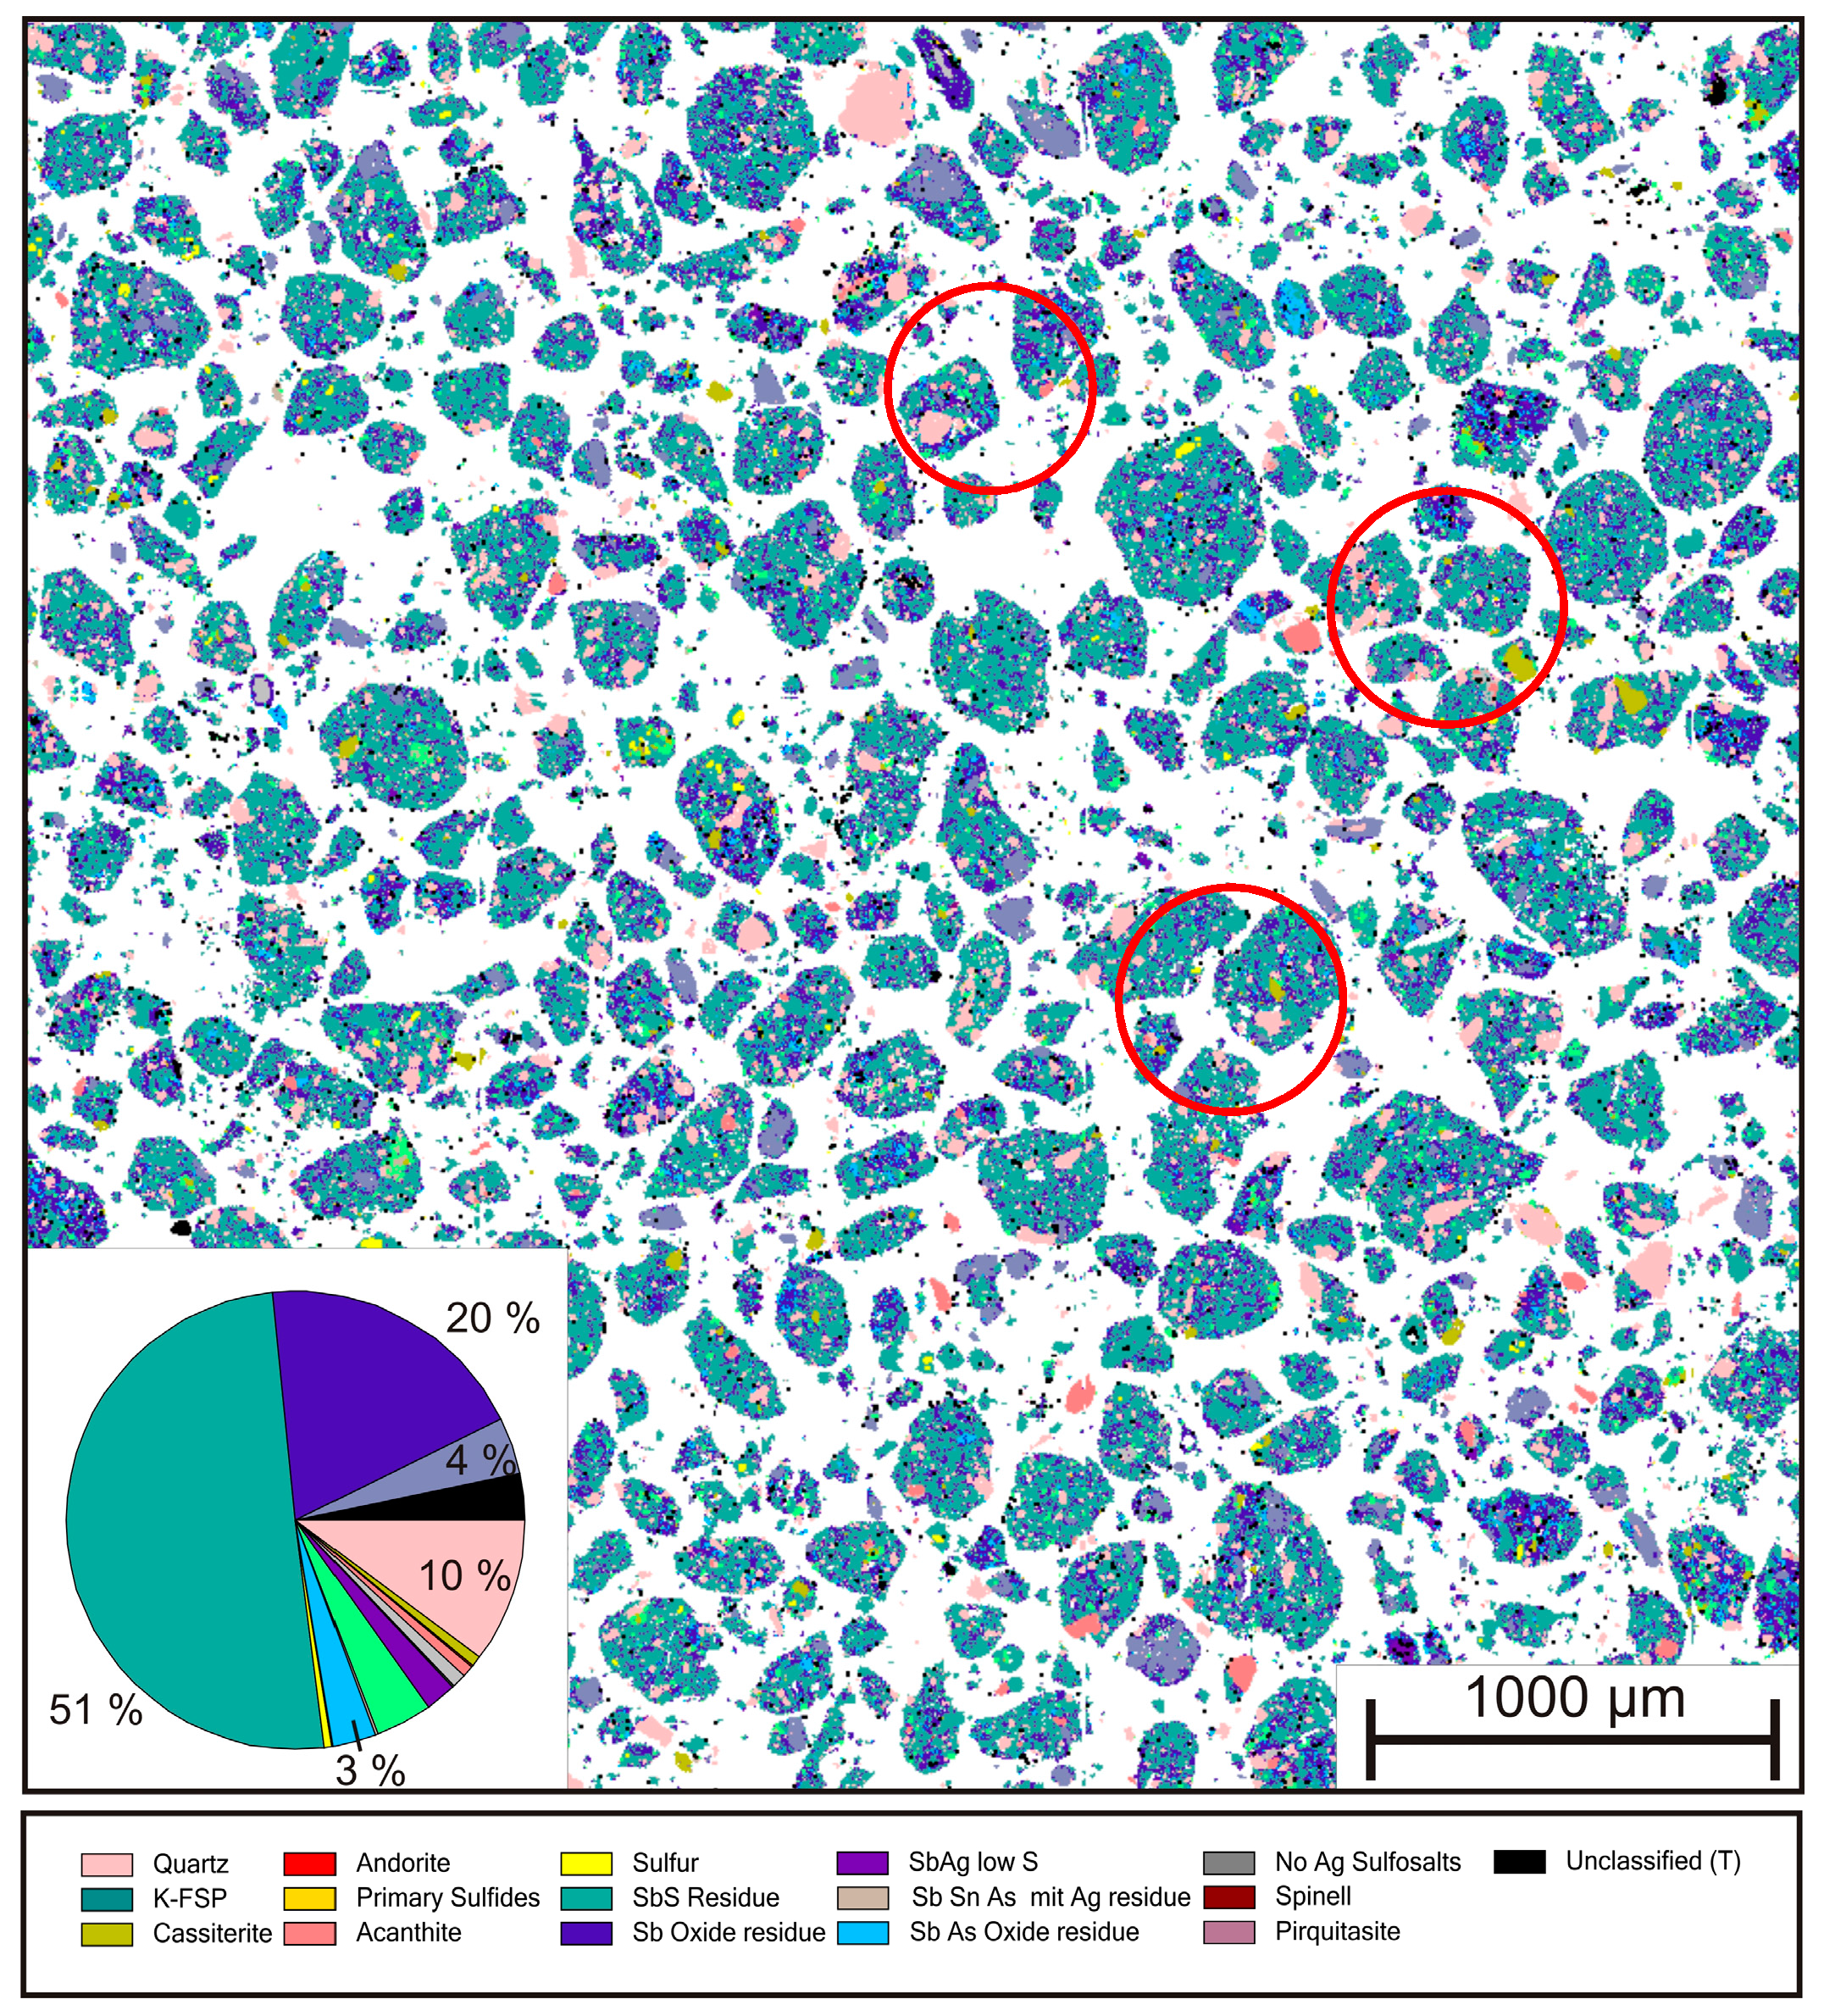
Metals 08 00114 g014
Figure 15. Section overview and modal distribution of leaching residue.
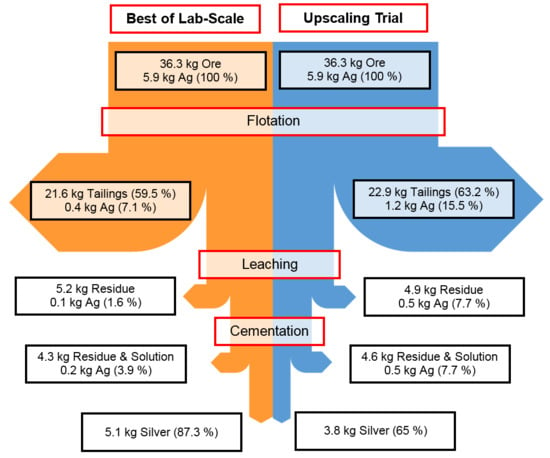
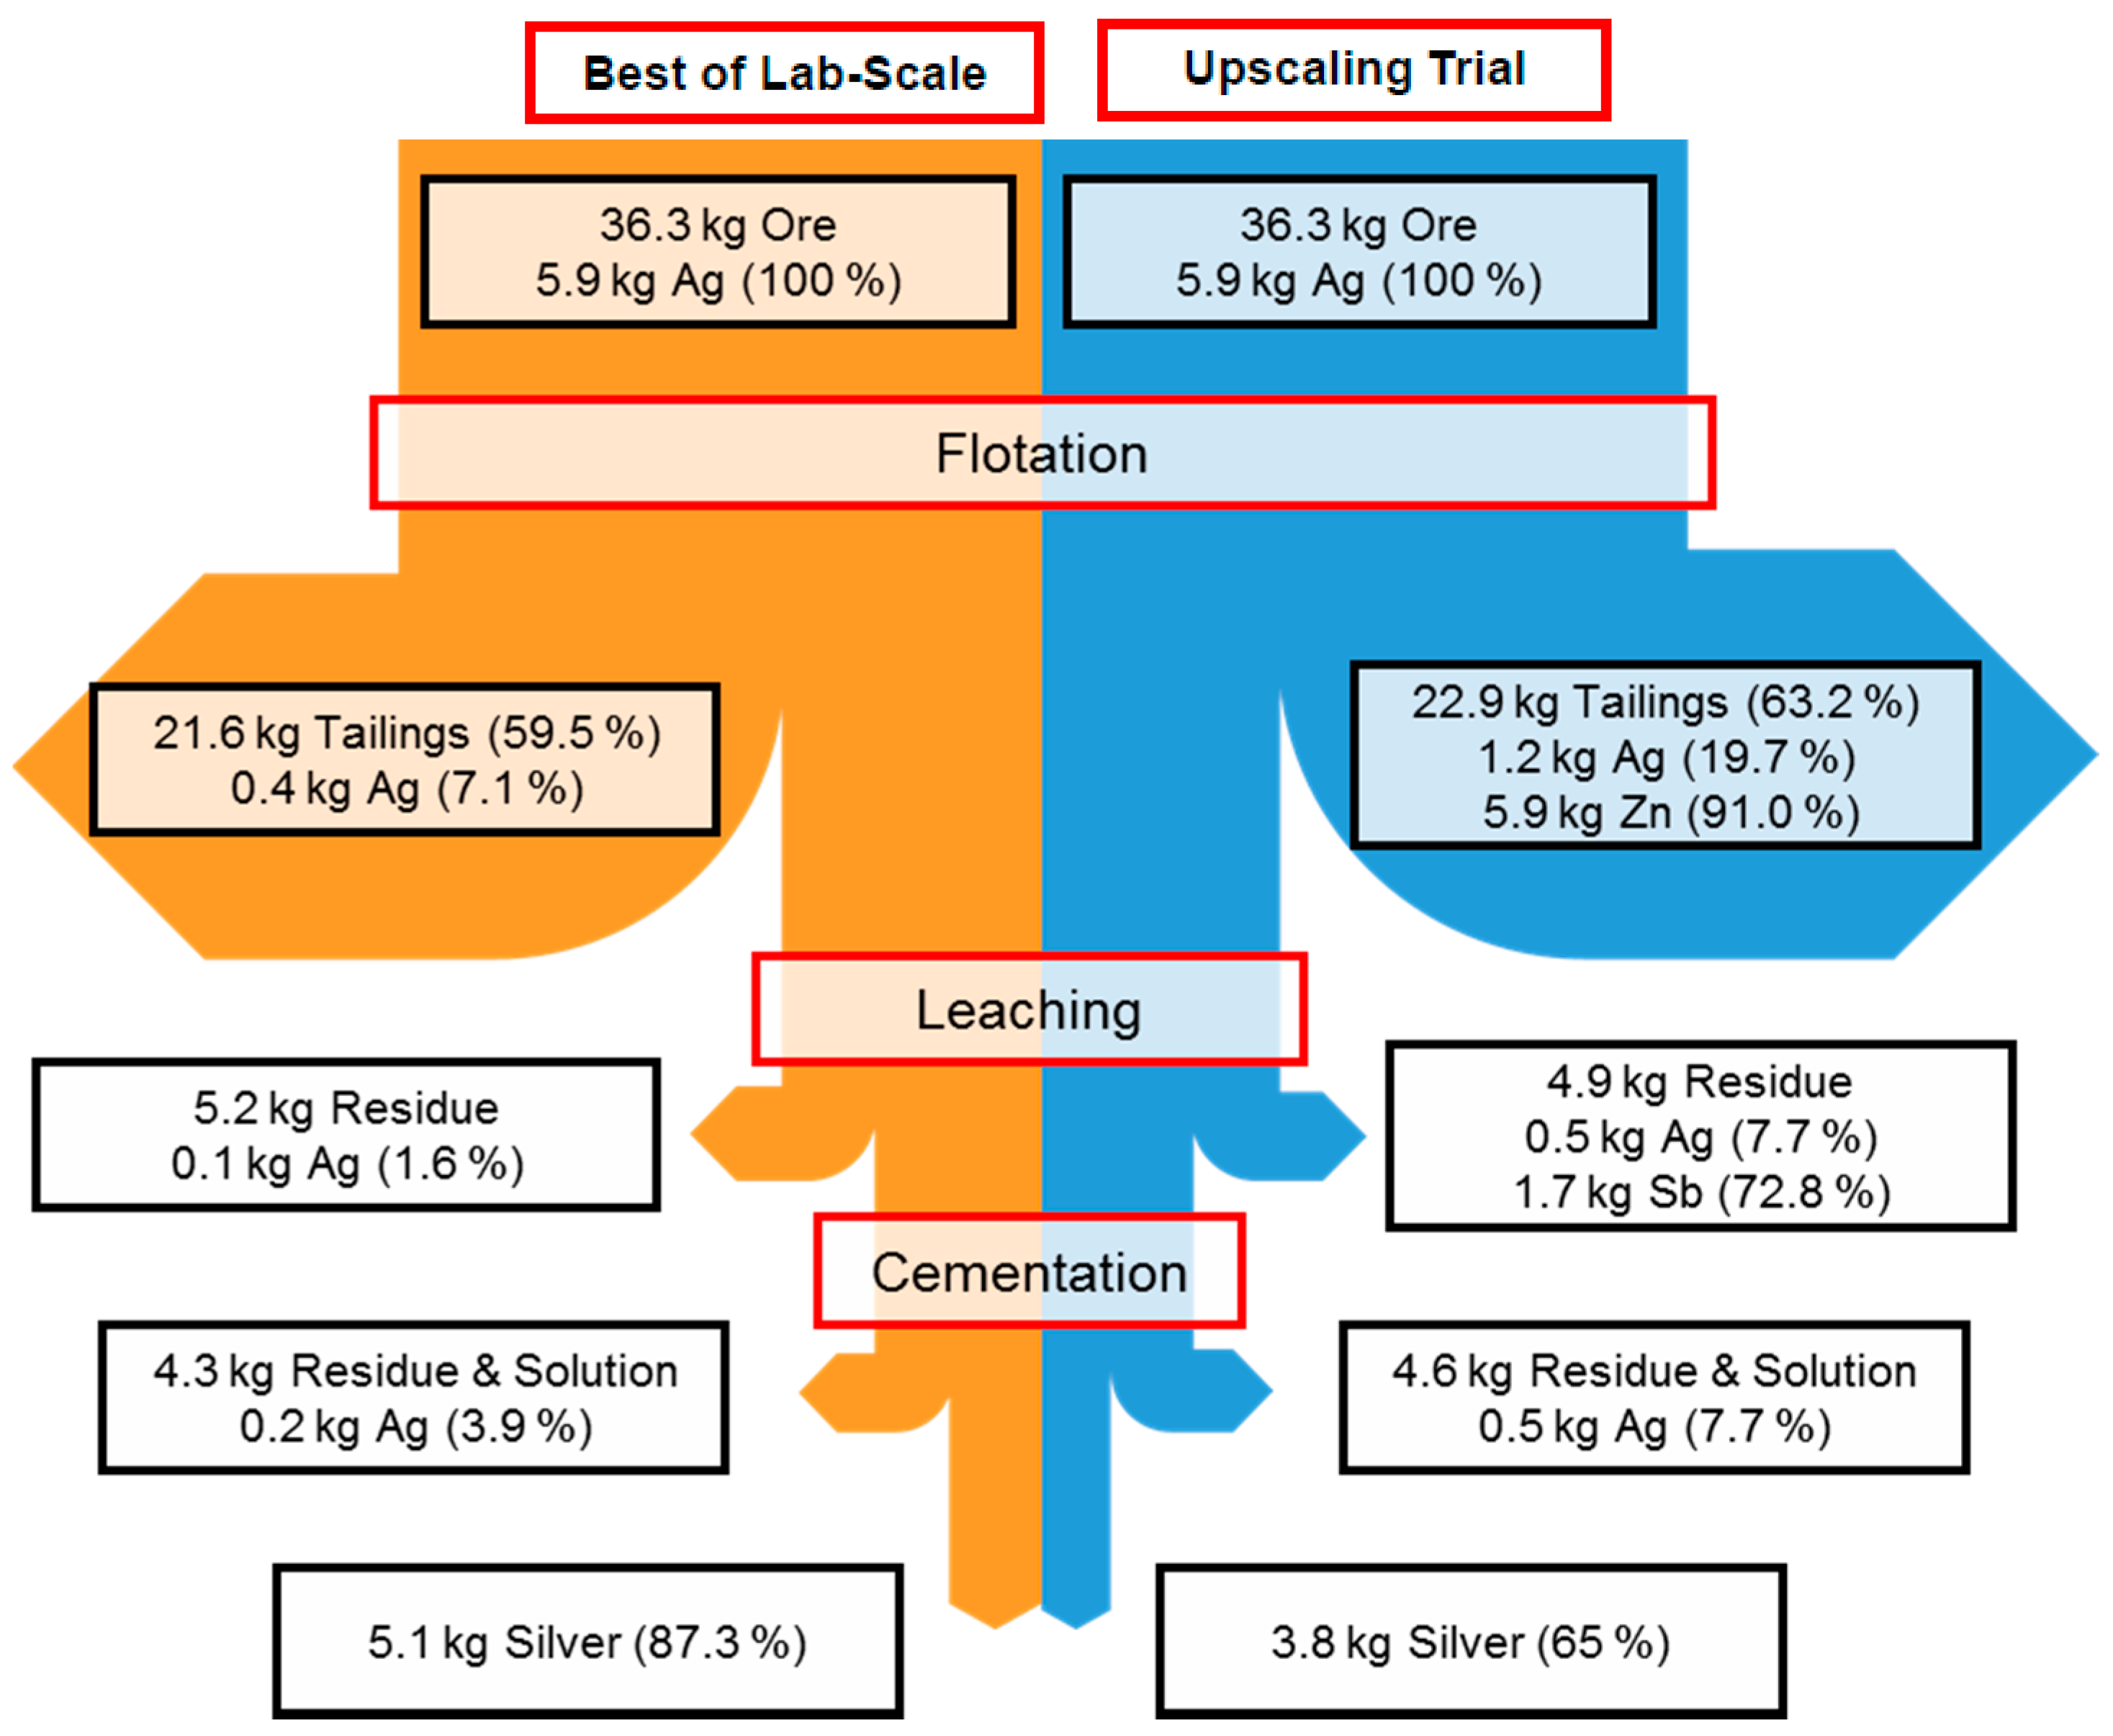
Metals 08 00114 g015
Figure 16. Mass flow diagram comparing best results of lab scale experiments (left) with the upscaling trial (right).
Metals 08 00114 g016
Table 1. Composition of silver concentrate used in small scale experiments in (wt. %).
SampleAgAsSPbZnSbOther
Preliminary Concentrate26.024.012.310.910.55.710.6
Table 2. Parameters of nitric acid leaching tests (parameter of investigation is set bold).
Tests/l Ratioc(HNO3), vol. %Stoich. Ratio of Ag–HNO3T, °CTime, hLeach. Steps
11/203035×6511
21/203035×6511
31/103017.5×6511
41/503087.5×6511
51/202023.3×6511
61/206575.7×6511
71/203035×650.51
81/203035×6521
91/203035×65241
101/203035×450.51
111/203035×4511
121/203035×4521
131/203035×45241
141/203035×2511
151/203035×6512
161/203035×6513
Table 3. Electrochemical potential of selected elements.
ReactionPotential E 0 in V
Zn 2 + +   2 e = Zn −0.762
Pb 2 + +   2 e = Pb −0.126
Fe 3 + +   3 e = Fe −0.037
H + +   e = H 0.000
Cu 2 + +   2 e = Cu 0.342
Cu + +   e = Cu 0.521
Fe 3 + +   e = Fe 2 + 0.771
Ag + +   e = Ag 0.800
Au 3 + +   3 e = Au 1.498
Table 4. Effect of pH value and type of collector on the selective froth flotation of silver sulfide minerals (Yield = mass output in relation to input, S.E.: Separation efficiency).
pHCollector (100 g/t) + Frother (25 g/t)Addition of Collector and FlotationDepressant, kg/tYield, wt. %Ag-Content, wt. %Silver Recovery, %S.E., %
5.5Hostaflot PEBstepwise-89.218.3399.111.9
7Hostaflot PEBstepwise-47.230.685.946.5
8.25Hostaflot PEBstepwise-26.728.141.318.5
9.5Hostaflot PEBstepwise-7.621.710.23.1
7Hostaflot PEBnormal-42.835.190.657.5
7Hostaflot PEBnormal540.537.692.462.1
7PAXnormal547.431.690.251.2
7Hostaflot LBSnormal542.029.074.839.1
7Ekofol ANT33normal520.527.334.016,2
Table 5. Composition ranges (wt. %) of metal and slag phases generated in several oxidizing melting experiments of silver ore.
SampleAgAsPbZnSb
Metal phase72.3–75.30.0–0.00.2–2.20.0–0.122.8–23.2
Slag phase14.7–31.015.6–41.38.9–10.26.2–11.43.0–4.7
Table 6. Silver precipitate composition in wt. %.
SampleAgCuSbPbFeZnAs
Cementation at pH 496.672.098<LOD0.16<LOD<LOD<LOD
Cementation at pH 597.701.32<LOD0.04<LOD0.03<LOD
H2SO4-washed Precipitate99.40.10.00.00.00.00.0
Table 7. Composition (wt. %) of reference trial leaching residue.
SampleAgAsSPbZnSb
Preliminary Concentrate26.024.012.310.910.55.7
Leaching residue0.00.237.00.00.70.4
Dissolution in %98.293.1-5.599.897.835.5
Table 8. Silver recovery of the upscaling process steps.
Samplekg%Best of Lab (%)
Metallic silver in concentrate4.748100.00100.00
Silver in leaching residue0.4539.551.76
PLS4.29590.4598.24
Leach purification sludge at pH 50.3537.433.52
Silver in solution after cementation0.0992.090.83
Metallic silver product3.84380.9493.89
Table 9. Composition of input and output streams (wt. %).
SampleAgSbPbFeZnAs
Concentrate35.613.24.73.414.92.0
Leaching residue9.235.20.40.40.04.4
Neutralization Residue11.07.618.110.02.02.5
Silver cementate99.60.00.00.00.00.0

