Assessment of Ductile, Brittle, and Fatigue Fractures of Metals Using Optical Coherence Tomography
by
 , and
, and
Gheorghe Hutiu
1, 
Virgil-Florin Duma
1,2,* ,
,
Dorin Demian
1,
Adrian Bradu
3 and
Adrian Gh. Podoleanu
3 1
3OM Optomechatronics Group, Aurel Vlaicu University of Arad, 77 Revolutiei Ave., Arad 310130, Romania
2
Doctoral School, Polytechnic University of Timisoara, 1 Mihai Viteazu Ave., Timisoara 300222, Romania
3
Applied Optics Group, School of Physical Sciences, University of Kent, Canterbury CT2 7NH, UK
*
Author to whom correspondence should be addressed.
Metals 2018, 8(2), 117; https://doi.org/10.3390/met8020117
Submission received: 30 December 2017
/
Revised: 2 February 2018
/
Accepted: 5 February 2018
/
Published: 8 February 2018
(This article belongs to the Special Issue Fracture Behaviour of Innovative Materials under Different Enviromental Conditions)
Abstract
:Some forensic in situ investigations, such as those needed in transportation (for aviation, maritime, road, or rail accidents) or for parts working under harsh conditions (e.g., pipes or turbines) would benefit from a method/technique that distinguishes ductile from brittle fractures of metals—as material defects are one of the potential causes of incidents. Nowadays, the gold standard in material studies is represented by scanning electron microscopy (SEM). However, SEM instruments are large, expensive, time-consuming, and lab-based; hence, in situ measurements are impossible. To tackle these issues, we propose as an alternative, lower-cost, sufficiently high-resolution technique, Optical Coherence Tomography (OCT) to perform fracture analysis by obtaining the topography of metallic surfaces. Several metals have been considered in this study: low soft carbon steels, lamellar graphite cast iron, an antifriction alloy, high-quality rolled steel, stainless steel, and ductile cast iron. An in-house developed Swept Source (SS) OCT system, Master-Slave (MS) enhanced is used, and height profiles of the samples’ surfaces were generated. Two configurations were used: one where the dimension of the voxel was 1000 μm3 and a second one of 160 μm3—with a 10 μm and a 4 μm transversal resolution, respectively. These height profiles allowed for concluding that the carbon steel samples were subject to ductile fracture, while the cast iron and antifriction alloy samples were subjected to brittle fracture. The validation of OCT images has been made with SEM images obtained with a 4 nm resolution. Although the OCT images are of a much lower resolution than the SEM ones, we demonstrate that they are sufficiently good to obtain clear images of the grains of the metallic materials and thus to distinguish between ductile and brittle fractures—especially with the higher resolution MS/SS-OCT system. The investigation is finally extended to the most useful case of fatigue fracture of metals, and we demonstrate that OCT is able to replace SEM for such investigations as well.
1. Introduction
The structure of metals can be analyzed using a variety of methods and systems. Structural images are thus obtained using magnifying lens, optical microscopes (ordinary or working at high temperatures), scanning electron microscopes (SEM), transmission or reflection electron microscopes, field ion or atomic force microscopes [1,2,3].
A specific topic regarding such investigations refers to metallic material fractures. They can be classified according to their deformation at failure (i.e., ductile or brittle), to the crystallographic manner in which the fracture occurs (i.e., sliding or cleavage), and to the form/appearance of fracture (i.e., fiber or fiery) [4,5,6,7,8,9,10]. Ductile fractures generate less serious problems than brittle fractures under operating conditions; it is therefore important to distinguish between both of them and, in the case of forensic investigations, to determine which type of fracture has been produced, in order to realize and certify whether the quality of the metallic materials is responsible for a certain incident or not. Fatigue fractures [11,12,13,14], which occur when metallic materials are subject to variable loads at high amplitudes, are responsible for around 90% of metallic fractures; their specific areas (which are also investigated in this study) are a combination of ductile and brittle fractures.
SEM is the gold standard for such investigations [1,2]. We proposed an alternative method, Optical Coherence Tomography (OCT) [15,16], for the profilometry of metallic surfaces, in order to distinguish between ductile and brittle fractures [17]. The effort to replace SEM with OCT is justified by the issues that SEM has, for example in forensic investigations (e.g., for the causes that generate pipe ruptures, structural failures of metallic bridges and buildings, damages of machinery parts, as well as railroad, automotive, train, or plane accidents). Thus, SEM is a lab-based method, samples have to be selected, and only small portions of the metallic parts involved in an incident can be cut and taken to the lab. In contrast, OCT instruments can be made mobile [18], therefore they can be used for in situ investigations. They can also be equipped with handheld scanning probes [18,19,20,21,22], to investigate different regions of interest as for example around large metallic parts. Also, when compared to SEM, OCT systems have a lower cost (at least with an order of magnitude), and do not require highly-trained operators.
The only drawback of the OCT instruments compared to SEM is their lower resolutions: for the former, resolutions are on the micrometer scale, while for the latter they are on the nanometer scale—with three orders of magnitude between them. The aim of this study is therefore to assess whether OCT has the potential to successfully replace SEM in such investigations. We have to point out in this respect that, to our knowledge, our previous, preliminary study has been the first one to demonstrate that such a replacement is possible [17].
The novelty of the present work is given by two aspects.
- First, from the point of view of the investigated samples, whilst in [17] only ductile and brittle fractures were considered (with only three examples), in the present study we investigate a wider range of materials that can be subject to ductile and brittle, but also fatigue fractures. As is well-known, the latter are those that occur most often in applications like those—of forensic type—pointed out above.
- Second, from the point of view of the instruments utilized, in order to be able to tackle with imaging fractures, an in-house developed Master-Slave (MS) powered Swept Source (SS) OCT system was employed. In a first configuration, the OCT instrument was capable to produce images with transversal resolutions similar to the one reported in [17], of around 10 μm (voxel size 103 μm3). In addition, here we also use an (MS)/SS-OCT instrument [23], capable of producing images with a superior transversal resolution, of 4 μm (and an axial resolution of 10 μm, therefore a voxel size of 4 × 4 × 10 = 160 μm3). The instrument is also able to produce volumetric reconstructions of the surface topography by using not cross sections, as is the case with conventional SS-OCT instruments, but en-face images/slices that can also be used to assess fractures by scanning surface grains (in conjunction with the cross sections made through samples). A SEM system with a 4 nm resolution is used to validate all OCT findings.
From a more general point of view of the investigations performed, while OCT is mostly applied in investigations of non-reflective samples—for which one is capable to make use of its major capability (i.e., to image beneath the surface of such samples)—in the present study reflective samples are considered, for which (only) the topography of samples is assessed. Thus, OCT has been initially developed for ophthalmology [1], and it is usually focused on biomedical applications, including in skin, dentistry, or endoscopy [24]. For non-medical applications, OCT has been used especially for in-depth investigations of non-metallic (i.e., non-reflective) samples, in Non-Destructive Testing (NDT) of plastics and composites [25,26], electronic materials [27,28], dental materials [21,29,30], glass [31,32], or even art works like paintings [33]—to determine their internal structure, matrices and reinforcement, superficial stress, layer thickness, defects occurring inside layers.
In comparison, much less effort was taken so far on investigations of reflective (i.e., metallic) surfaces, although there are for example analyses of surfaces resulting from various processing techniques [34,35]. Yet, this capability of OCT to generate topographic, volumetric reconstructions of a sample surface allows for obtaining its height profile, while optical microscopy or SEM cannot achieve this; this is essential for assessing the fracture type and its characteristics.
In the present paper, the materials investigated are presented, as well as the OCT and SEM systems utilized. The results of the assessments performed are shown for three possible types of fractures: ductile, brittle, and fatigue—with a discussion on validations of OCT images by using SEM. Finally, we conclude the study and point out directions of future work.
2. Materials and Methods
2.1. Materials
In order to demonstrate the applicability of the OCT method for fracture analysis, several types of materials have been chosen: the first one is typically subjected to ductile fracture (i.e., OLC 37 and 44); the second one is typically subjected to brittle fracture (i.e., EN-GJL-250, Sn-Sb-Cu, and OLC 45); the third one, a T10NiCr180 stainless steel was subjected to variable loads and high amplitudes in order to explore fatigue fractures. Microstructures of these metallic materials, presented in Table 1, have been analyzed after fracture.
For ductile fractures, samples with diameters of 10 mm (according to ISO 6892-1/2009) are considered, and for brittle fractures, samples with a section area of 10 × 10 mm2, with a V-shape notch (according to ISO 148-1/2016 and ISO 14556/2015). For fatigue fractures, according to ISO 1099/2006, strip-shaped samples with a section area of 15 × 5 mm2 have been considered, with the testing conditions pointed out in Section 2.2.
2.2. Sample Processing Method
The OL 37 and OL 44 steel samples have been subjected to tensile tests. Due to their chemical composition and microstructure, these types of steel break with a ductile fracture at a testing temperature of 20 °C.
Tensile tests have also been carried out, also at 20 °C, on the EN-GJL-250 cast iron sample, as well as on the Sn–Sb–Cu antifriction alloy sample until each of them broke. Due to their chemical compositions and microstructures, at this testing temperature the fracture of these materials is always brittle. The OLC 45 steel sample underwent an impact test using a pendulum at −20 °C, in order to trigger a brittle fracture of this type of steel.
After the testing of the above samples, parts with a 5 mm height and a 10 mm diameter, containing the fracture surface have been examined using both OCT and SEM, the latter for the validation of results obtained using OCT images.
T10NiCr180 stainless steel (sample with a 15 × 5 mm2 area in the fracture zone) has been subjected to an asymmetric tensile-compression loading cycle with a strain ratio R = 0.1, at a strain amplitude of 101.25 N/mm2, for 728,720 cycles to failure, resulting in fatigue fracture.
No metal coating and no other processing of the metallic samples has been made—for both methods—but the lateral margins of the samples have been marked in order to capture the same zone with both OCT and SEM.
2.3. Imaging Methods
The surface topography and microstructures have been analyzed using an in-house developed MS powered SS-OCT system [23]. In a first configuration, the telecentric scanning lens Microscope objective (MO) (please see Figure 1) was chosen in such a way that the measured transversal resolution was 10 μm, and the second one, an improved, 4 μm resolution. The resolution in the SEM images was 4 nm.
A detailed schematic diagram of the SS-OCT imaging instrument is presented in Figure 1a, while in Figure 1b the raw images obtained are shown.
As optical source, a swept source laser (SS, Axsun Technologies, Billerica, MA, USA), with a central wavelength at 1060 nm, sweeping range 106 nm (quoted at 10 dB), and a 100 kHz line rate is used. This allows an axial resolution measured in air of around 10 μm. The interferometer configuration uses two single-mode directional couplers, DC1 and DC2. DC1 has a ratio of 20/80, whilst DC2 is a balanced splitter, 50/50. DC2 feeds a balance detection receiver (Thorlabs, Newton, NJ, USA, model PDB460C). 20% of the SS power is conveyed toward the object arm via lens L1 (focal length 15 mm), which collimates the beam toward a pair of orthogonal galvanometer scanners GXY (Cambridge Technology, Bedford, MA, USA, model 6115), which are driven with a scan frequency of 66.7 Hz for the fast axis and 0.044 Hz for the slow axis. The scanning steps have been determined by the area of the investigated surface and by the required resolution; for example for an area of 1.5 × 1.5 mm2 and a lateral resolution of 10 μm, 1500 lines have to be considered for the slow scan—when using B-scans/cross-sections to achieve OCT images. The scanners are followed by an interface optics made from a telecentric scanning lens, MO, which finally determines the lateral resolution of the en-face images. Two situations were considered. In the first case, MO was chosen in such a way that the lateral resolution across the en-face image was around 10 μm, while for the second case a shorter focal length lens was chosen that determined a lateral resolution of around 4 μm across the image. The power on the sample in both situations is around 2.2 mW. At the other output of DC1, 80% of the SS power is directed toward the reference arm of the interferometer, equipped with two flat mirrors, M1 and M2, placed on a translation stage, TS, to adjust the optical path difference (OPD). Collimating lenses L1, L2 and L3 are identical. The signal from the balanced receiver is digitized by D (Alazartech, Quebec, Canada, model ATS9350, 500 MB/s). Trigger signals from the SS (TS) and from the galvanometer scanners (Tx and Ty) are used to synchronize the acquisition allowing for the production of the volumetric datasets. The acquired channeled spectra CS (OPD) were manipulated via a program implemented in LabVIEW 2016, 64 bit, deployed on a PC equipped with an Intel [email protected] GHz octacore processor (2 logical cores per physical core) and 16 GB of RAM.
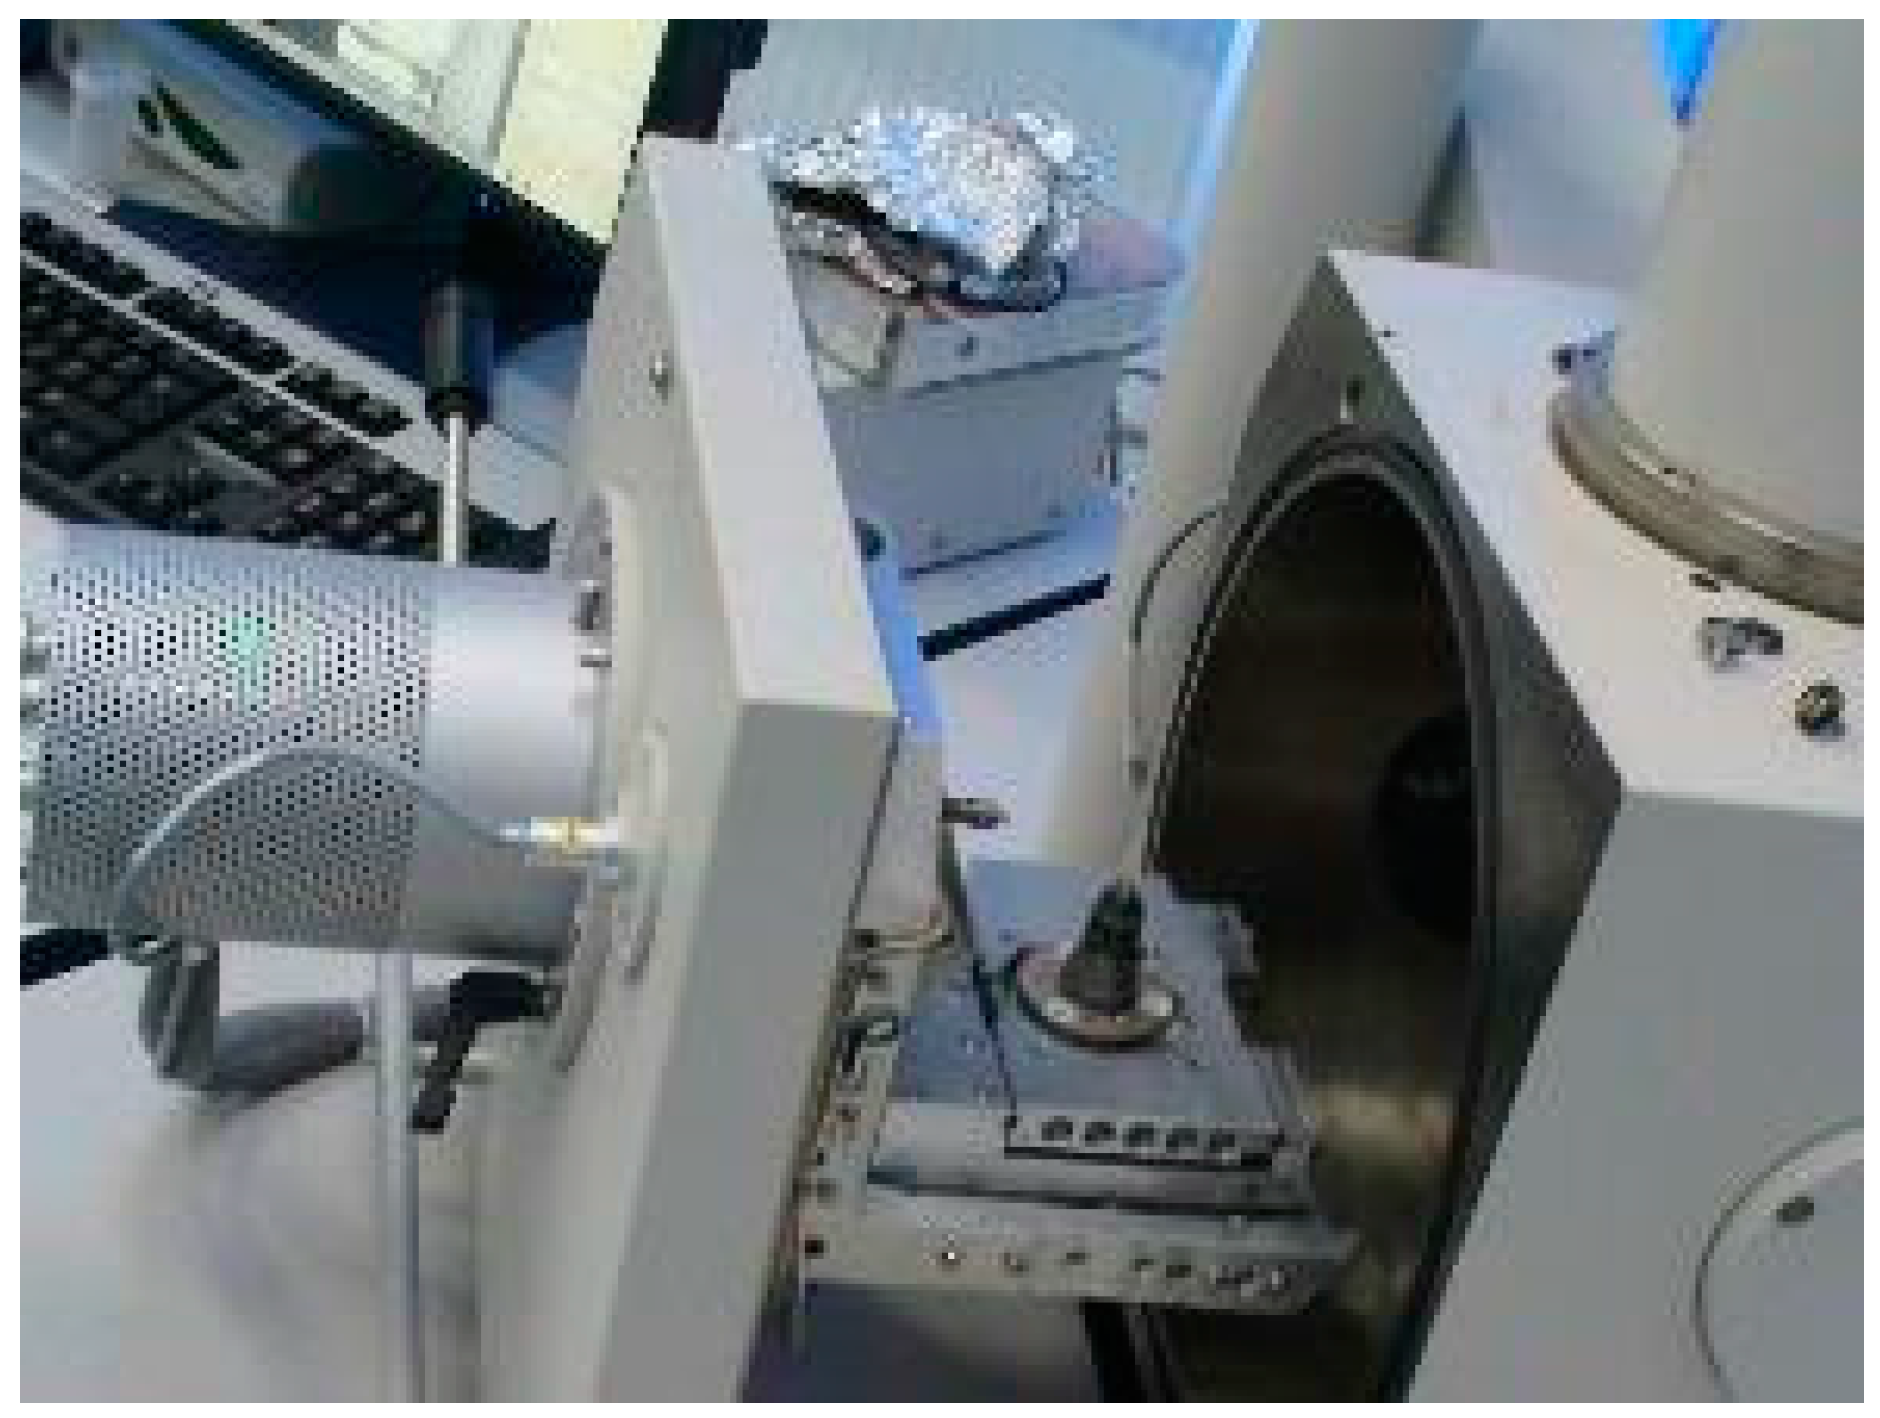
The SEM (Thermo Scientific™ Quanta™, Hillsboro, OR, USA) analysis has been carried out using a high vacuum FEI Quanta 250 system (Figure 2) and a secondary Everhard–Thomley electron detector. Different working parameters of the system, including the working distance (WD) and the pressure (Pa) are provided in the study for each SEM image.
The different metallic samples have been inserted in the SEM and each of them has been examined at two different magnitudes. All samples have been mounted on a copper conductive holder stub, by using carbon wafers with adhesive on both sides; their alignment provides the reduction of the tilting inside the SEM. Each mounting of samples has been done using a binocular microscope, thus assuring the exposure of the investigated area to the scanning electron beam.
3. Results and Discussion
3.1. Ductile Fractures
Figure 3, Figure 4 and Figure 5 show the fracture surfaces of low carbon steel samples OL 37 and OL 44. These types of steel have been chosen because they are subjected to ductile (or shearing) fracturing at the testing temperature of 20 °C, which is produced inside the crystal grains in sliding planes with maximum atom density. The fracture crack propagates along the maximum tangential stress of the load applied; such a crack moves under a 45° angle from the tensile stress applied.
Figure 3a, Figure 4a and Figure 5a show the overall images of the OL 37 and OL 44 ductile fractured samples. It can be noticed that all samples have cup-type shapes that are characteristic of ductile fractures. Figure 3b and Figure 4b show the fracture images of the OL 37 and OL 44 steel, generated using SEM. It can be remarked that all grains broke in a transgranular manner. As the grains have different orientations against the applied load, it can, however, be noticed that only a few grains were broken under the characteristic 45° angle from the tensile stress applied; this remark is valid for the surface grains that we have investigated; as OCT cannot penetrate metallic (reflective) materials, no volume investigations can be made. Figure 3c, Figure 4c, and Figure 5b show images of the broken surfaces of OL 37 and OL 44, generated using OCT. In order to demonstrate that the OCT images are similar to those generated using SEM, several surface grains have been numbered on the corresponding images of both investigations.
As in Figure 3 and Figure 4, the OCT investigations have been performed with the OCT instrument working in a low 10 μm resolution mode, we have explored in Figure 5 the same sample as in Figure 4 (i.e., a low carbon steel OL 44), but this time with an MS/SS-OCT in an improved 4 μm resolution mode. It can be seen that the latter system gives much clearer images of the broken surfaces; thus, Figure 5b shows much better images of the broken ductile grains; in contrast, the assessment of the ductile fracture type using the 10 μm transversal resolution OCT system in Figure 3 and Figure 4 is more difficult to perform due to the small dimensions of the grains on the metallic surfaces.
A quantitative assessment can also be performed on the topography obtained, regarding the dimensions of the grains on the SEM and OCT images. As the OCT instrument is capable of producing volumetric reconstructions of the sample under investigation, via software manipulation, such as ImageJ [37], the volumetric image can be rotated and tilted in order to make such assessments in a more precise way. Thus, from Figure 4b, the width and height of grain 1, for example, can be evaluated using SEM as equal to 0.22 mm and 0.18 mm, respectively. From Figure 4c, these dimensions can be evaluated using OCT as equal to 0.18 mm and 0.20 mm, respectively. A similar assessment can be done from Figure 5b,c. From the former, the width and height of grain 5, for example, can be evaluated using SEM as equal to 0.24 mm and 0.34 mm, respectively; from the latter these dimensions can be evaluated using OCT as equal to 0.22 mm and 0.31 mm, respectively. A good agreement can be seen regarding the above values, although those measured from OCT images are the exact ones, because SEM images cannot be rotated and tilted in order to obtain a lateral view of the grains. Also, when using SEM only some grains can be measured; when using OCT this can be done for any grain.
3.2. Brittle Fractures
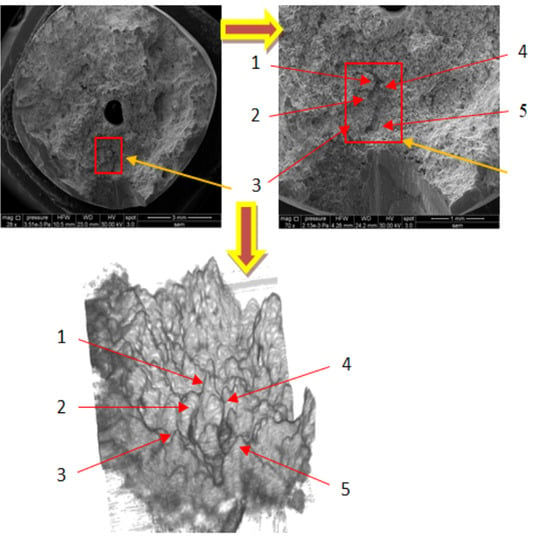
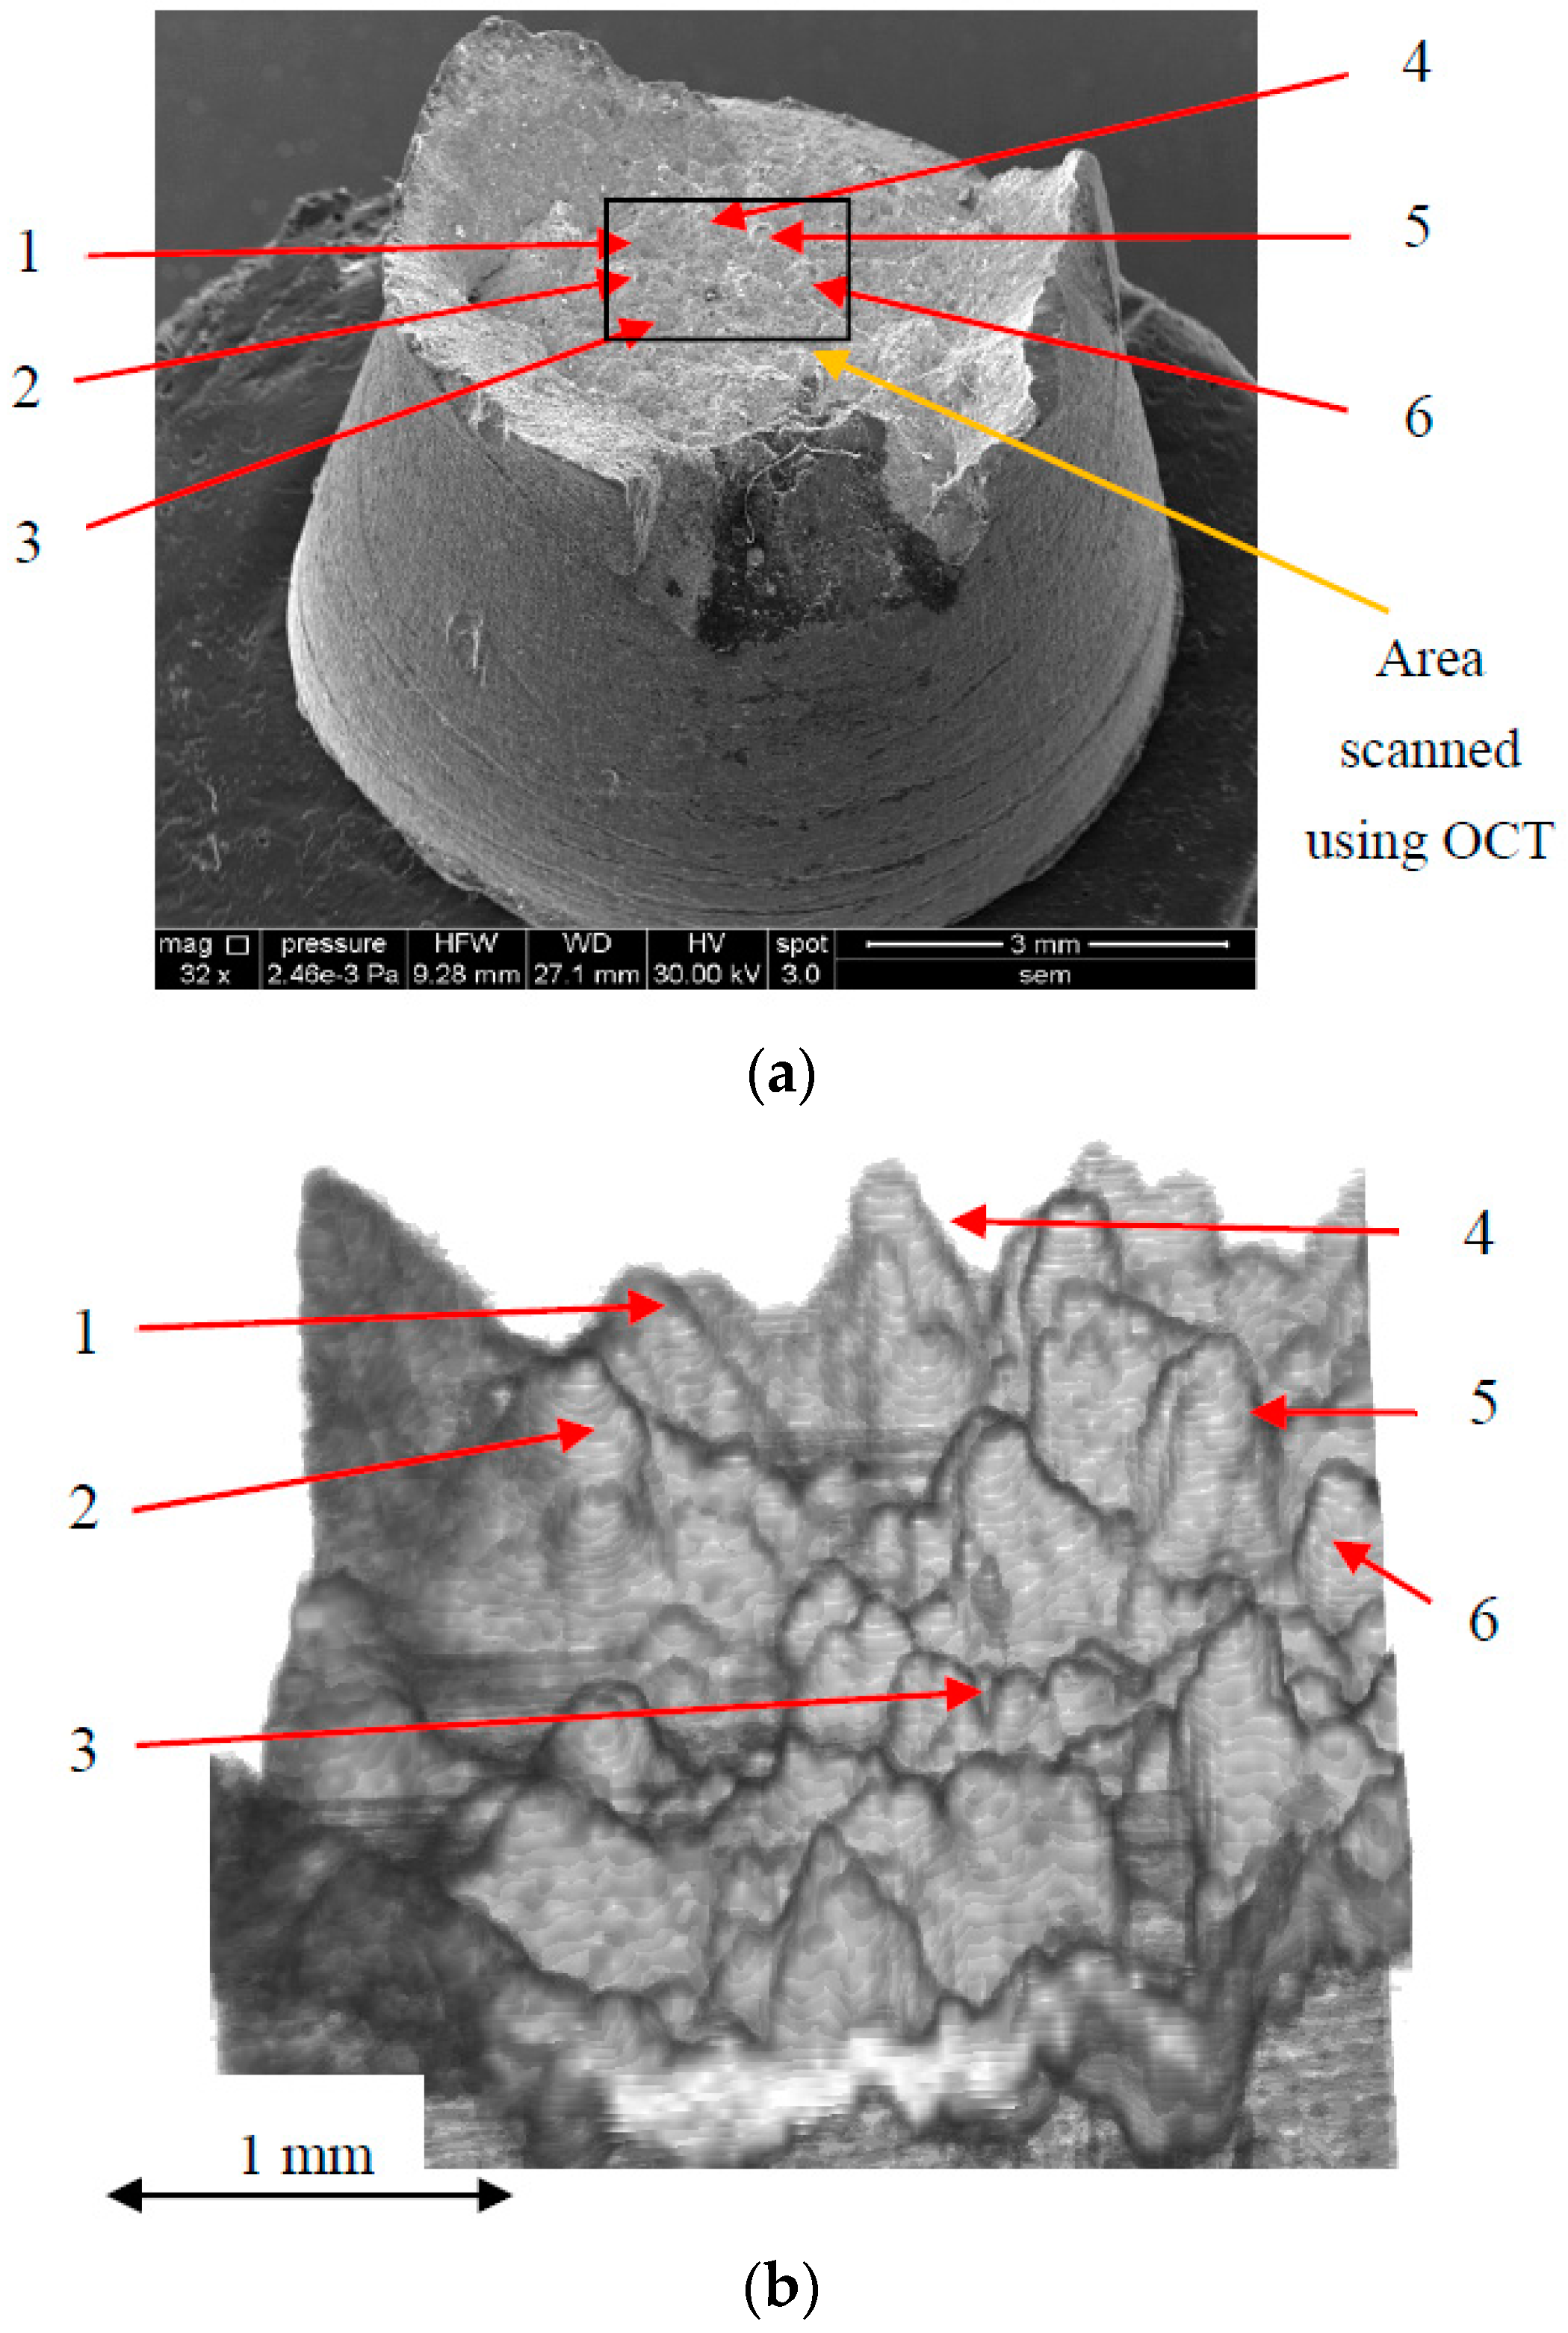
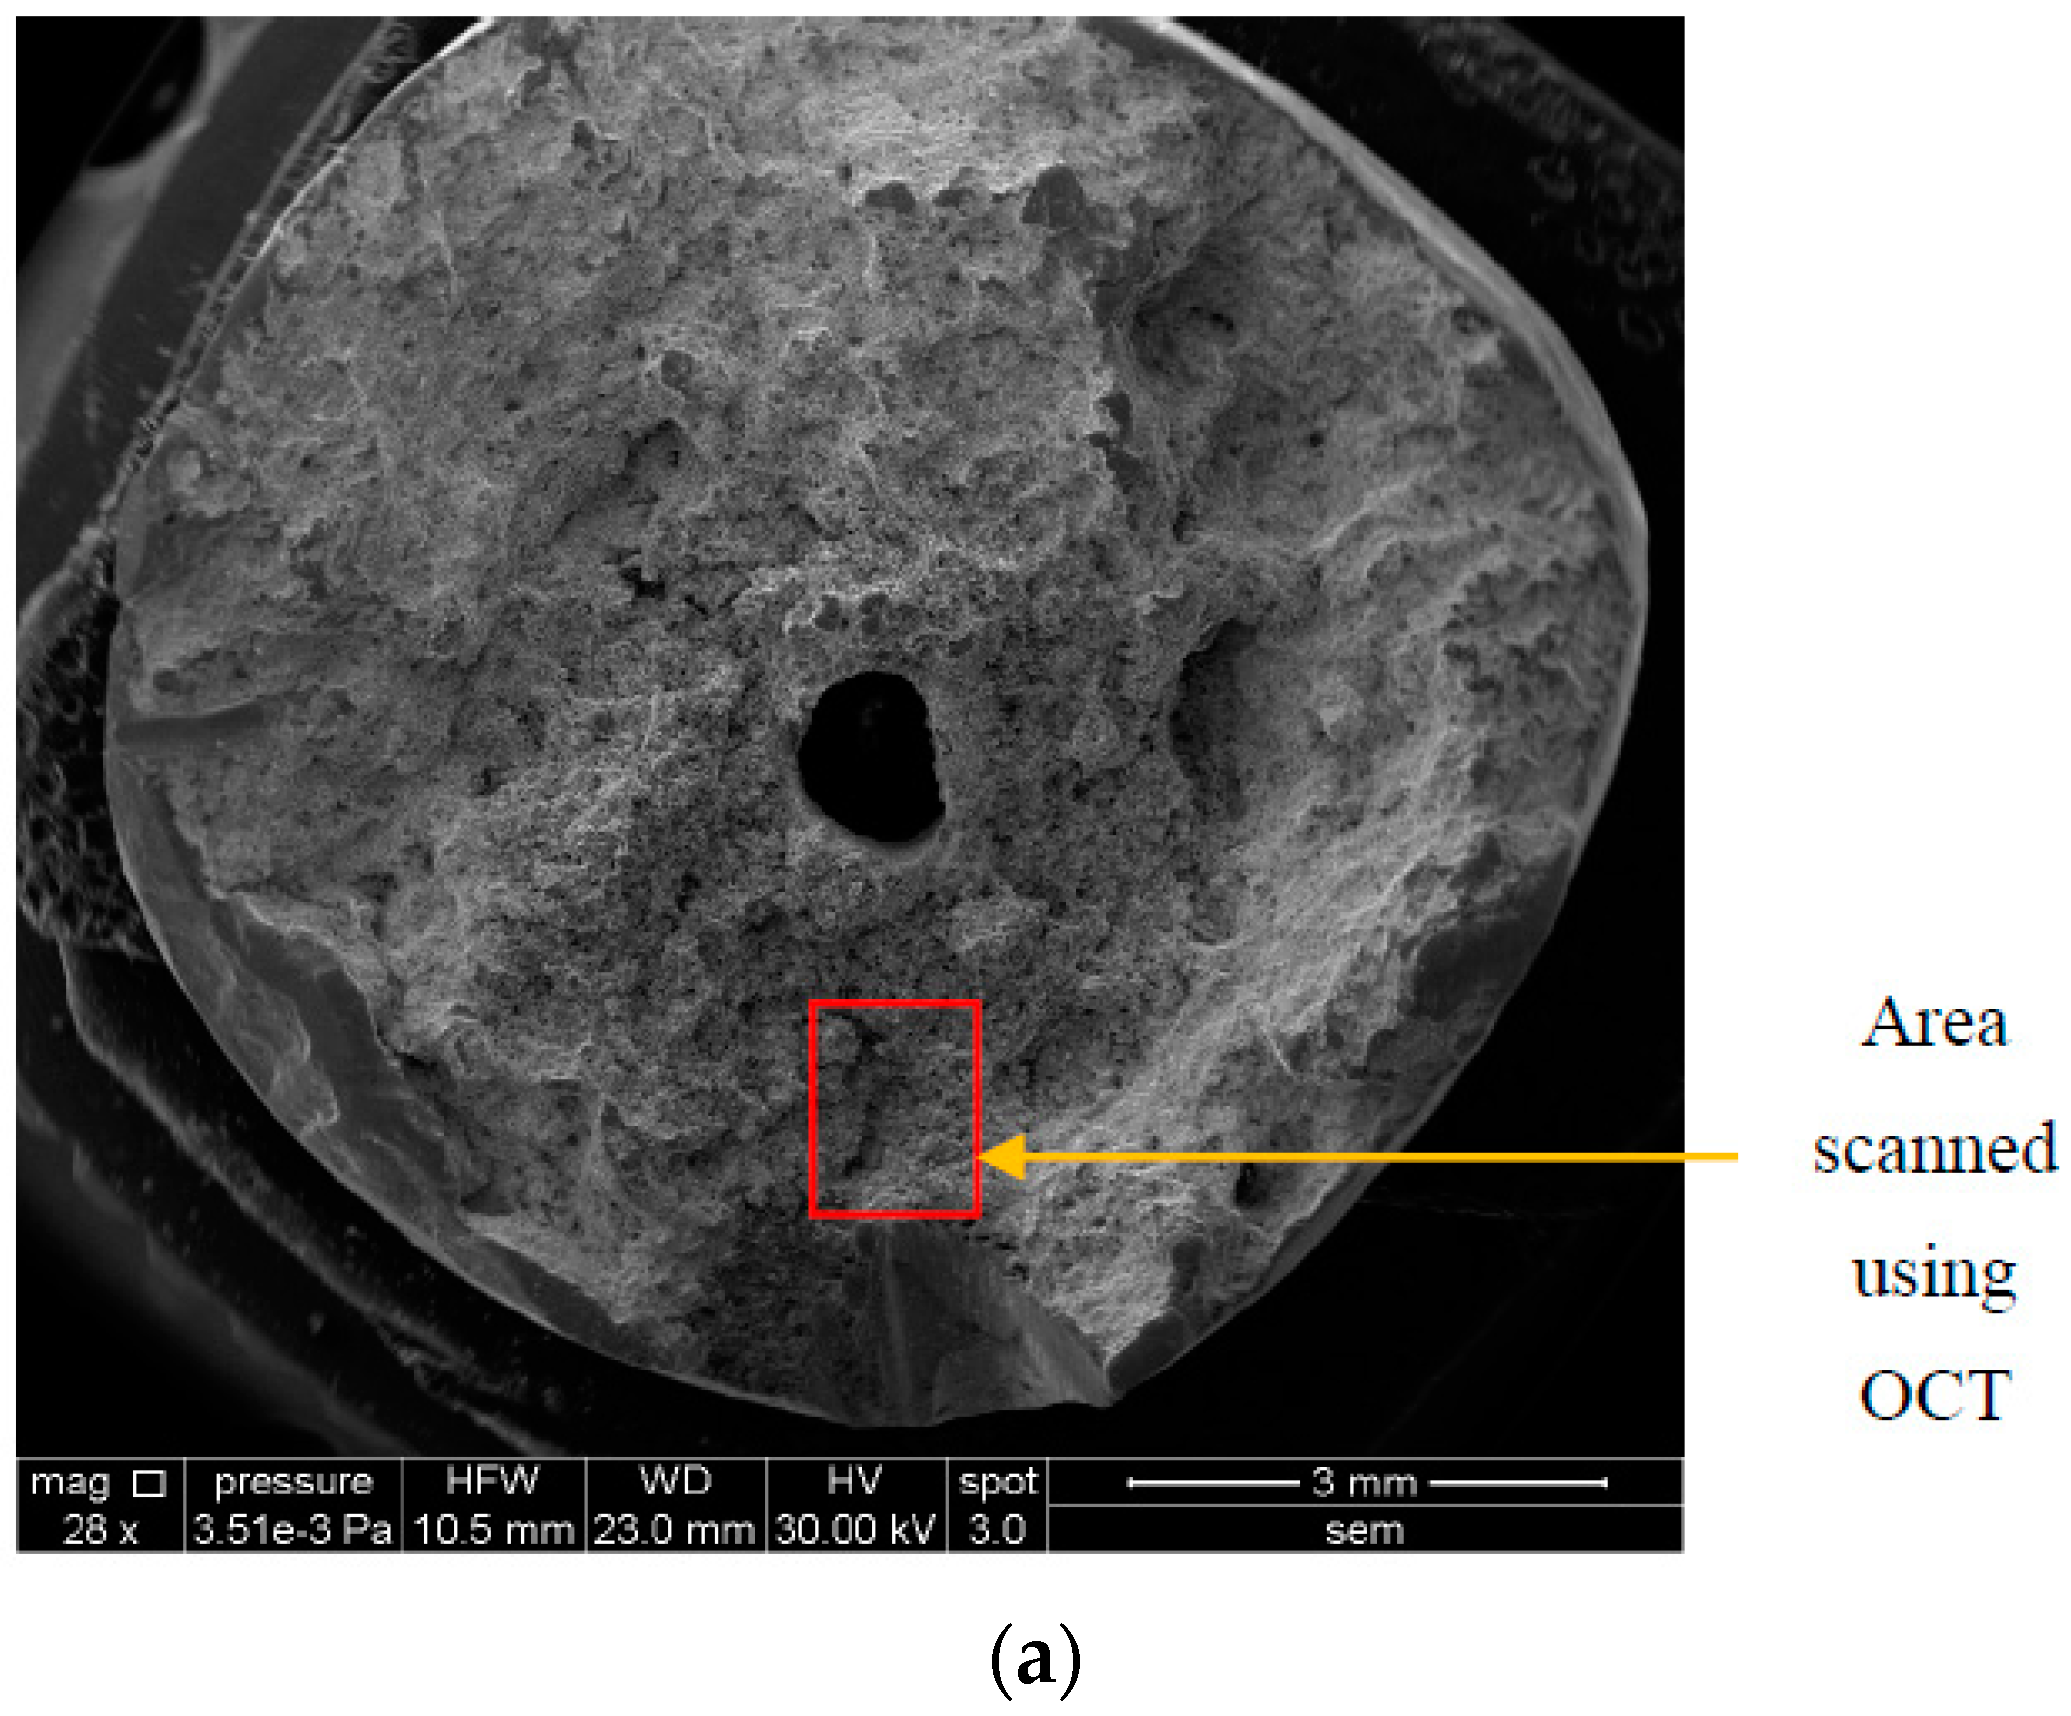
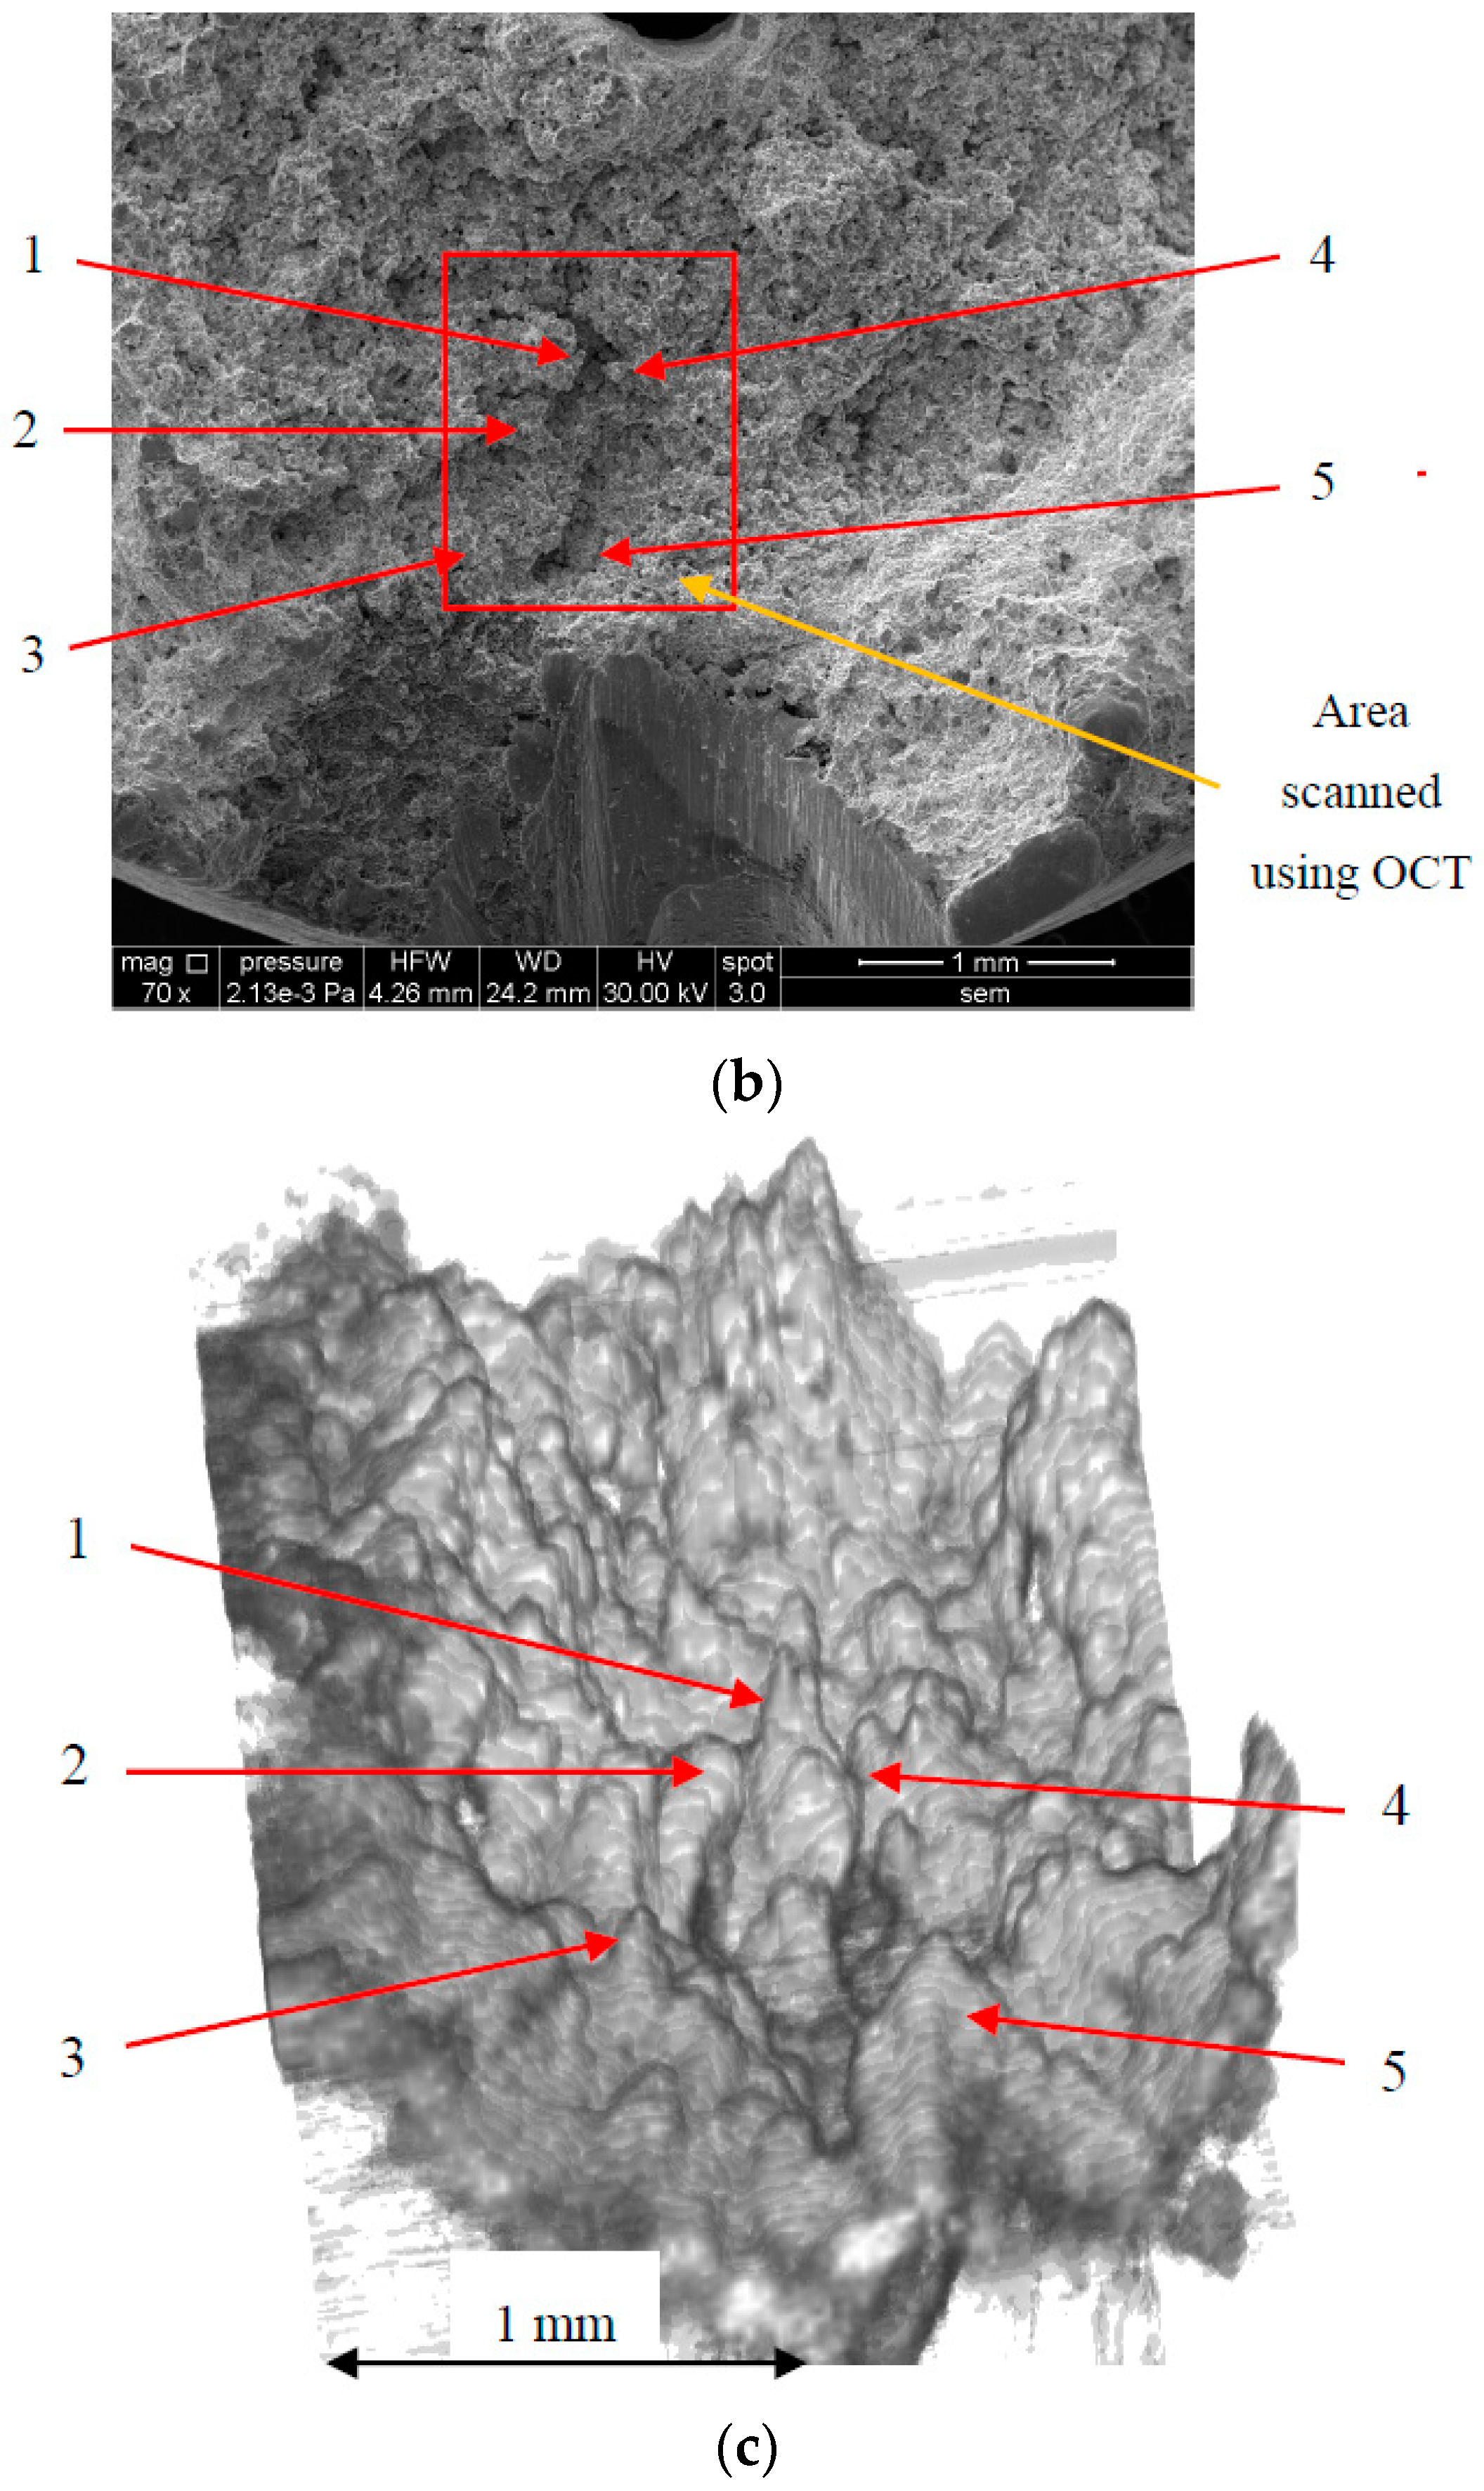
Figure 6 shows the image of the fractured surface of lamellar cast iron EN-GJL 250—for a 10 mm diameter sample.
Figure 6a,b show the overview of the cast iron sample generated using SEM. It can be noticed that the sample broke without elongation, which is a characteristic feature of a brittle fracture. The area where the OCT analysis was performed has been marked on both images (on the lateral part of the probe, in order to obtain the same image with both methods) and several grains have been numbered in order to evaluate OCT versus SEM. Note that specifically grains were selected, that were also seen on the SEM images with a broken tip and with the remaining surface perpendicular on the direction of the applied force. Further note that we used SEM analysis in the present study, and not optical metallographic microscopy, therefore no polishing/etching of the cast iron sample was made.
Figure 6c shows the image of this selected surface of the fracture generated using OCT. The grains generated using both methods (i.e., SEM and OCT) can be identified on the corresponding images, Figure 6b,c, respectively. Both images show that grains 1, 2, and 3 broke in a transgranular manner (with their surface perpendicular on the direction of the applied force), which also proves that the fracture was brittle. In general brittle fractures are achieved by cleavage; they consist of a breakdown of atomic bonds between atoms placed on two adjacent planes that are perpendicular to the direction in which the normal tensile load was applied. However, cleavage fracture is not visible on the magnification scale used.
Figure 7 shows the fractured surface of a Sn-Sb-Cu antifriction alloy—also for a sample with a 10 mm diameter. Figure 7a,b show an overview of the sample—generated using SEM. Figure 7a shows that, as in the previous case, the sample broke without elongation, which is a characteristic feature of a brittle fracture. The area where the OCT analysis was performed has been marked on both images and some grains have been numbered in order to evaluate the OCT volumetric image versus the SEM one. Figure 7c shows the image of the fracture surface generated using OCT; the grains imaged using SEM in Figure 7b can be identified in Figure 7c, as well. On both images, one can remark that, as in the previous case, the grains broke in a transgranular manner, perpendicular with regard to the direction of the applied force, which also proves that this fracture was brittle.
Figure 8 shows the image of the same fractured surface of the Sn–Sb–Cu antifriction alloy as in Figure 7—but with the MS/SS-OCT system with the improved 4 μm resolution. Figure 8a shows the overview of the same sample as in Figure 7, but with another area than in Figure 7b selected further on in Figure 8b for OCT. On the whole, the same conclusions as in Figure 7a,b have been obtained in Figure 8a,b, respectively: the sample broke without elongation and the grains broke in a transgranular manner, perpendicular to the direction of the applied force. Both are characteristic features of brittle fractures. The advantage of using this OCT system with an improved 4 μm resolution can be concluded from this case as well, as the broken grains are seen much clearer in Figure 8c; this figure looks similar to Figure 5c, but in the former one can see that all grains have been broken perpendicular to the applied force, while in the latter one can distinguish grains 3 and 6 broken at 45° with regard to the direction of the applied force. A clear advantage of OCT with regard to SEM can also be concluded from this comparison: the volumetric OCT image can be rotated and tilted in all directions (while the SEM image cannot be manipulated), therefore other grains can be noticed on the OCT image, and the surface angles of their peaks can be determined. The granular fracture surface is plane and perpendicular to the direction in which the tensile stress was applied. However, due to the fact that in polycrystalline materials cleavage planes in each grain are not always perpendicular to the direction of force (grain axes are differently oriented), at microscopic scale fracture surfaces are not perfectly plane, except for the grain surface.
Figure 9a shows the SEM overview of an OLC 45 steel sample that underwent an impact test using a pendulum, with an impact energy of 8 J. This test carried on at −20 °C triggers a brittle fracture of the steel sample. The 1.5 × 1.5 mm2 area selected and analyzed further on using OCT is outlined on this image; Figure 9b shows the image of the fracture surfaces generated using the improved 4 μm resolution of the MS/SS-OCT system. One can see that the grains broke in a brittle manner; for example, grains 3, 4, and 5 broke perpendicular to the direction in which the normal tensile stress/load was applied—through the grains (fiery aspect), while grains 1 and 2 broke at the boundaries of the crystal grains (fiber aspect). These characteristic details can only be seen using the 4 μm resolution MS/SS-OCT system, therefore the 10 μm resolution OCT system was not used in this case anymore.
Another capability (and thus, advantage) of OCT can be seen from such an image: using ImageJ, the program used to generate volumetric OCT images from stacks of en-face OCT images in MS/SS-OCT (or of B-scans/cross-sections in SS-OCT), one can perform other quantitative evaluations of the surface topography, obtaining for example the number of grains per surface unit. An issue in such an evaluation is that, by rotating volumetric images, different grains can be seen, while others may become hidden; therefore, an optimal view has to be determined using ImageJ. Thus, in Figure 9b, 30 grains can be obtained on the 1 × 1.5 mm2 surface investigated with OCT.
3.3. Fatigue Fractures
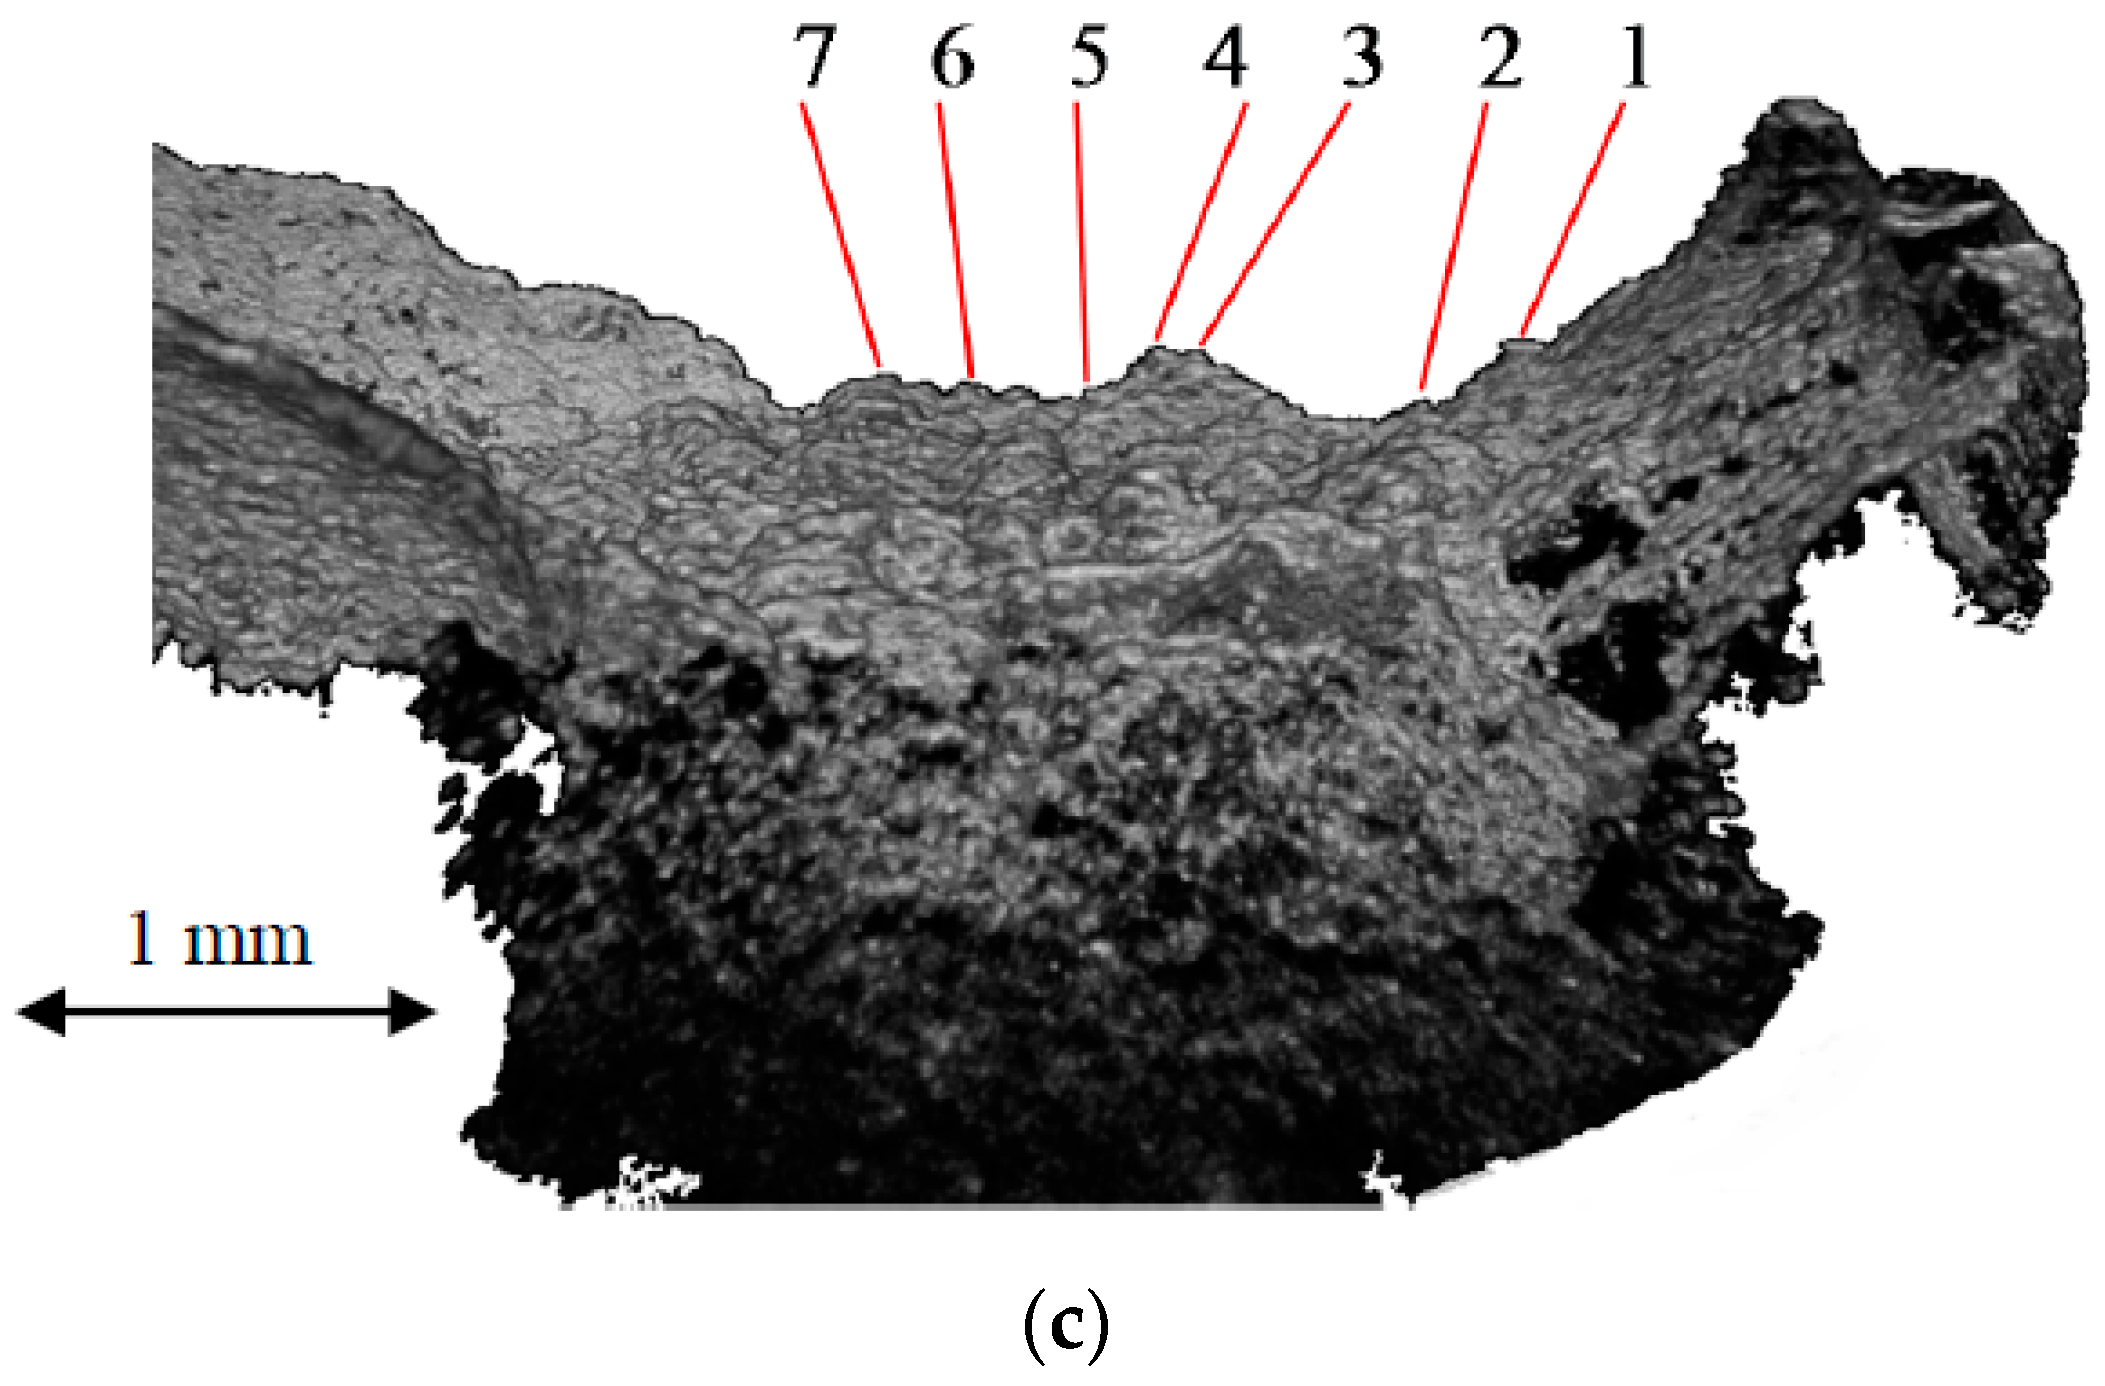
Figure 10a shows the image of the fractured surface of a T10NiCr180 stainless steel sample. This sample was subjected to the testing conditions specified in Section 2.2, resulting in fatigue fracture, which occurs when metallic materials are subjected to variable loads and high amplitudes. As pointed out in the introduction, more than 90% of failures occurring under working conditions are due to fatigue.
Three areas can be remarked for fatigue fractures at a microstructure level: the crack initiation area (for which the crack propagates in a ductile manner expanding over several grains); the fatigue fracture area (which displays fatigue lines called streaks), where the fracture crack passes through the grains and displays a fiery aspect at macroscopic level; the final fracture, which can be brittle or ductile, displaying a granulose aspect at a macroscopic level. In Figure 10 two of these different areas can be seen on the sample: thus, the fine grain area has been clearly broken by fatigue, while the coarse granulation area is specific to a brittle fracture.
Figure 10a shows the fracture surface generated using SEM, while Figure 10b shows the image of the selected area generated using OCT. In the latter one can see that all the grains broke brittle. For example, grains 1, 2, and 3 broke perpendicular to the direction in which the normal tensile stress was applied, and grains 4, 5, and 6 broke at the crystal grains’ boundaries. If there is no breakage due to fatigue because of the chemical composition and microstructure, this steel normally breaks in a ductile manner. In this specific case, the OCT analysis of this surface confirmed that the breakage of the steel was brittle.
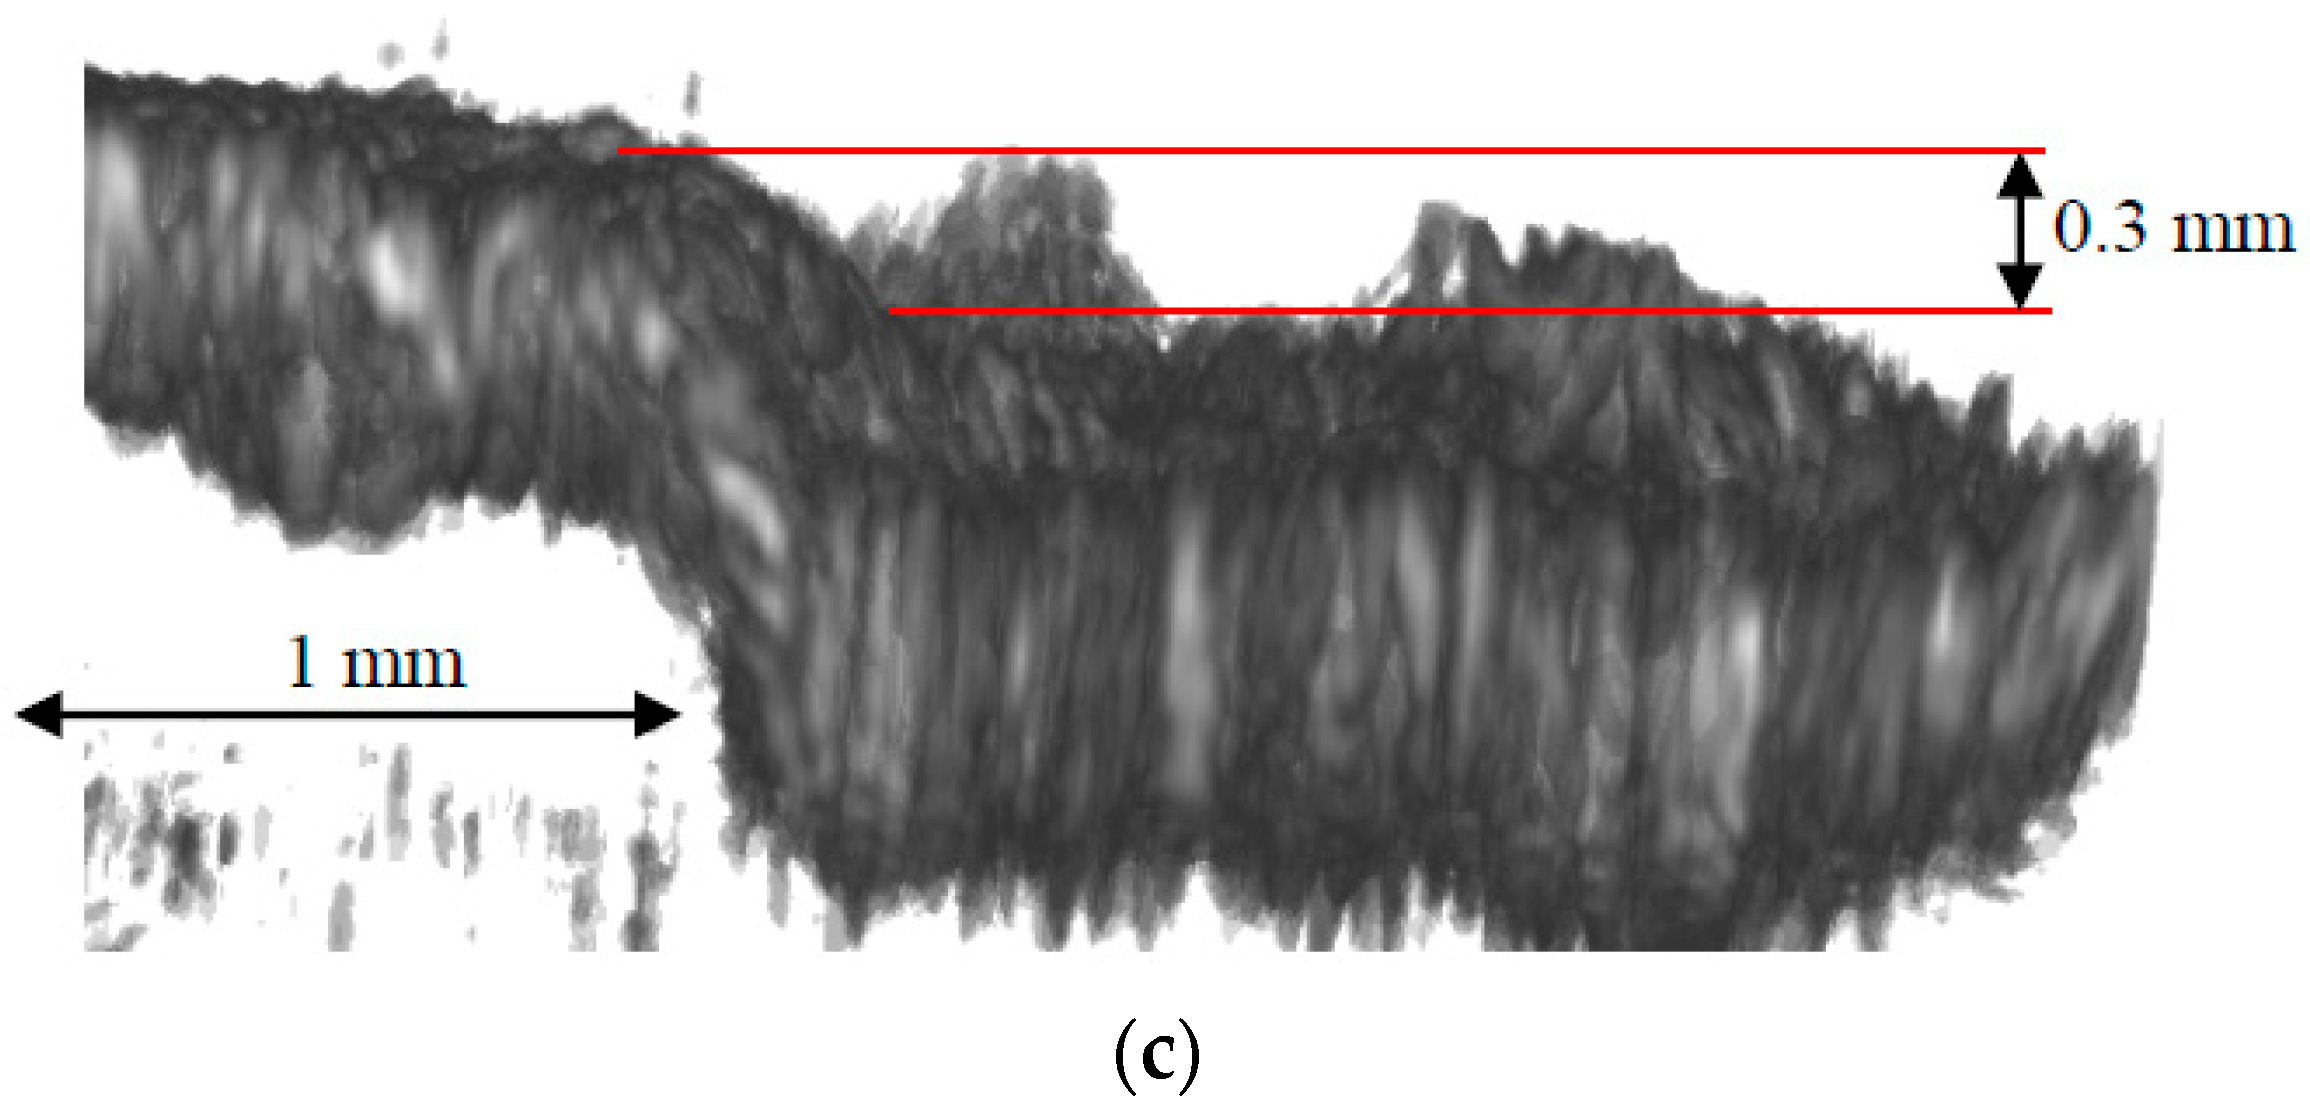
A dimensional evaluation can also be done using OCT in Figure 10, regarding the transition/step from the fatigue to the brittle area. To our knowledge, such an evaluation cannot be performed using SEM. Using the lateral OCT view in Figure 10c, we have evaluated this step to 0.3 mm, result that is in good accordance with the physical reality.
A limitation of the OCT technique is the fact that it lacks the ability to point out micro-inclusions, while SEM is able to do that. Because metallic materials are highly reflective, these micro-inclusions appear practically transparent in the OCT image, due to the strong back-scattered signal received from the sample.
4. Conclusions
(1) The images obtained show the fracture surfaces for several types of metallic materials, some that broke in a ductile manner, others in a brittle manner, and one subjected to a fatigue fracture. These images were generated using two types of technologies: the gold standard in the field, SEM, as well as OCT, a method that, as far as the authors are aware, was employed for the first time to serve investigations of metallic fractures.
(2) Analyzing the images generated using SEM (with a 4 nm resolution) and the images generated using OCT (at 4 or 10 μm axial resolution), it can be concluded that the assessment of the fracture type using OCT is compatible with that inferred using SEM. However, the 10 μm resolution (i.e., the 103 μm3 voxel) is barely able to provide images from which the assessment can be completed. The higher-resolution OCT instrument (i.e., with a 4 × 4 × 10 = 160 μm3 voxel) has proven the most appropriate to assess the type of fracture and to study the grains on the metallic surface. A remark should be made in this respect: would an ultrahigh resolution OCT instrument be useful for such an analysis? With further improvements, a voxel for such an instrument can be made as small as 1 μm3—with a different wavelength range, an increased complexity—and a corresponding higher cost—of the OCT system. The answer is that for the analysis presented in this study such an improved OCT instrument is not necessary; it would be however useful in the assessment of cleavage (that cannot be discriminated with a 4 μm resolution, for example), as well as in fatigue structures, the latter in order to image its grains on the surface—an investigation that can nowadays be made only using Atomic Force Microscopy (AFM); the latter has a much too small field-of-view (and much higher costs than OCT instruments), so a development of such an ultrahigh resolution OCT instrument would be useful, but only for such investigations, not for ductile or brittle fractures (or for this type of fractures in the fatigue areas of metallic parts). Another important direction of work in this respect refers to Low Cycle Fatigue (LCF) that occurs at high amplitudes and low frequencies; such testing conditions correspond to failures that occur during earthquakes, for example.
(3) The present study thus demonstrates that OCT can replace SEM in the analysis of metallic surfaces broken in a ductile or brittle manner, but also in the analysis of fatigue fractures; it has also helped to point towards the necessary resolution of an OCT system that should be used for such investigations. A distinct advantage of OCT over SEM refers to the fact that volumetric OCT images can be rotated and tilted in all directions (while SEM images cannot be manipulated), therefore different grains can be noticed on OCT images, and their widths, heights, as well as surface angles of their peaks can be determined. Also, aspects like the dimensions of the steps in fatigue fractures can be determined using OCT—in contrast to SEM, that cannot achieve this.
(4) Advantages of OCT with regard to SEM also include a lower cost, the fact that it does not require highly-trained operators, and the fact that it is not necessarily a lab-based technique. The former aspect has not been exploited in the present study; it is subject of future work to perform in situ investigations, of different damaged parts, made of different materials (including light alloys), using an OCT mobile unit and handheld scanning probes that we have been developing [21,22]—including for forensic assessments.
Acknowledgments
This work was supported by the Romanian National Authority for Scientific Research [CNDI–UEFISCDI project PN-III-P2-2.1-PED-2016-1937 (http://3om-group-optomechatronics.ro/)], including for covering the costs to publish in open access. Adrian Bradu and Adrian Gh. Podoleanu acknowledge the support of the European Research Council [Grant 249889 (http://erc.europa.eu)] and EPSRC [REBOT, grant EP/N019229/1]. Adrian Gh. Podoleanu is also supported by the NIHR Biomedical Research Centre at Moorfields Eye Hospital NHS Foundation Trust and UCL Institute of Ophthalmology, by the Royal Society Wolfson Research Merit Award, Innovation Fund Denmark, ShapeOCT 4107-00011A and the ERC ADASMART Proof of concept 754695 680879 and UBAPHODESA Marie Curie European Industrial Doctorate, 607627.
Author Contributions
Gheorghe Hutiu and Virgil-Florin Duma devised and designed the experiments; Adrian Gh. Podoleanu and Adrian Bradu devised the OCT instrument; Gheorghe Hutiu, Adrian Bradu, and Virgil-Florin Duma performed the OCT investigations; Gheorghe Hutiu and Demian Dorin performed the SEM investigations; Gheorghe Hutiu and Virgil-Florin Duma analyzed the data; Virgil-Florin Duma and Gheorghe Hutiu wrote the paper.
Conflicts of Interest
The authors declare no conflict of interest. The founding sponsors had no role in the design of the study; in the collection, analyses, or interpretation of data; in the writing of the manuscript, and in the decision to publish the results.
References
- Goldstein, J.; Newbury, D.E.; Lyman, C.L.; Echlin, P.; Lifshin, E.; Sawyer, L.; Michael, J.R. Scanning Electron Microscopy and X-ray Microanalysis, 3rd ed.; Springer Science + Business Media Inc.: Berlin, Germany, 2003; pp. 128–192. ISBN 978-1-4615-0215-9. [Google Scholar]
- Echlin, P. Handbook of Sample Preparation for Scanning Electron Microscopy and X-ray Microanalysis; Springer Science + Business Media Inc.: Berlin, Germany, 2009; pp. 19–65. ISBN 978-0-387-85731-2. [Google Scholar]
- Williams, D.B.; Carter, C.B. Transmission Electron Microscopy: A Textbook for Materials Science, 2nd ed.; Springer: New York, NY, USA, 1996; pp. 483–509. ISBN 978-0-387-76501-3. [Google Scholar]
- Xia, L.; Shick, C.F. Ductile crack growth. Transition to cleavage fracture incorporating statistics. J. Mech. Phys. Solids 1996, 44, 603–6011. [Google Scholar] [CrossRef]
- Honomura, T.; Yin, F.; Nagai, K. Ductile-brittle transition temperature of ultrafine ferrite/cementite microstructure in low carbon steel controlled by effective grain size. ISIJ Int. 2004, 44, 610–617. [Google Scholar] [CrossRef]
- Ruggieri, C.; Dodds, R.H. A transferability model for brittle fracture including constraint and ductile tearing effects: Probabilistic approach. Int. J. Fract. 1996, 34, 309–340. [Google Scholar] [CrossRef]
- Camacho, G.T.; Ortiz, M. Computation modeling of impact damage in brittle materials. Int. J. Solids Struct. 1996, 33, 2899–2938. [Google Scholar] [CrossRef]
- Tomota, Y.; Xia, Y.; Inoue, K. Mechanism of low temperature brittle fracture in high nitrogen bearing austenitic steels. Acta Mater. 1998, 46, 1577–1587. [Google Scholar] [CrossRef]
- Mullner, P.; Sotenthaler, C.; Uggowitzer, M.P.J.; Speidel, O. Brittle fracture in austenitic steel. Acta Metall. Mater. 1994, 42, 2211–2217. [Google Scholar] [CrossRef]
- Zhang, X.Z.; Knott, J.F. The statistical modeling of brittle fracture in homogenous and heterogeneous steel microstructures. Acta Mater. 2000, 48, 2135–2146. [Google Scholar] [CrossRef]
- Qian, J.; Fatemi, A. Mixed mode fatigue crack growth: A literature survey. Eng. Fract. Mech. 1996, 55, 969–990. [Google Scholar] [CrossRef]
- Ritchie, R.O. Mechanisms of fatigue-crack propagation in ductile and brittle solids. Int. J. Fract. 1999, 100, 55–83. [Google Scholar] [CrossRef]
- Zhang, Z.-F.; Berto, F. Fracture and Fatigue of Engineering Materials. Adv. Eng. Mater. 2016, 18, 1981–1982. [Google Scholar] [CrossRef]
- Pipinato, A.; Bruhwiler, E. Fatigue and fracture. In Innovative Bridge Design Handbook: Construction, Rehabilitation and Maintenance, 1st ed.; Pipinato, A., Ed.; Butterworth-Heinemann: Oxford, UK, 2016; pp. 49–87. ISBN 9780128000588. [Google Scholar]
- Huang, D.; Swanson, E.A.; Lin, C.P.; Schuman, J.S.; Stinson, W.G.; Chang, W.; Hee, M.R.; Flotte, T.; Gregory, K.; Puliafito, C.A.; et al. Optical coherence tomography. Science 1991, 254, 1178–1181. [Google Scholar] [CrossRef] [PubMed]
- Drexler, W.; Liu, M.; Kumar, A.; Kamali, T.; Unterhuber, A.; Leitgeb, R.A. Optical coherence tomography today: Speed, contrast, and multimodality. J. Biomed. Opt. 2014, 19, 071412. [Google Scholar] [CrossRef] [PubMed]
- Hutiu, G.; Duma, V.-F.; Demian, D.; Bradu, A.; Podoleanu, A.G. Surface imaging of metallic material fractures using optical coherence tomography. Appl. Opt. 2014, 53, 5912–5916. [Google Scholar] [CrossRef] [PubMed]
- Jung, W.; Kim, J.; Jeon, M.; Chaney, E.J.; Stewart, C.N.; Boppart, S.A. Handheld optical coherence tomography scanner for primary care diagnostics. IEEE Trans. Biomed. Eng. 2011, 58, 741–744. [Google Scholar] [CrossRef] [PubMed]
- Lu, C.D.; Kraus, M.F.; Potsaid, B.; Liu, J.J.; Choi, W.; Jayaraman, V.; Cable, A.E.; Hornegger, J.; Duker, J.S.; Fujimoto, J.G. Handheld ultrahigh speed swept source optical coherence tomography instrument using a MEMS scanning mirror. Biomed. Opt. Express 2014, 5, 293–311. [Google Scholar] [CrossRef] [PubMed]
- Monroy, G.L.; Won, J.; Spillman, D.R.; Dsouza, R.; Boppart, S.A. Clinical translation of handheld optical coherence tomography: Practical considerations and recent advancements. J. Biomed. Opt. 2017, 22, 121715. [Google Scholar] [CrossRef] [PubMed]
- Demian, D.; Duma, V.-F.; Sinescu, C.; Negrutiu, M.L.; Cernat, R.; Topala, F.I.; Hutiu, G.; Bradu, A.; Podoleanu, A.G. Design and testing of prototype handheld scanning probes for optical coherence tomography. Proc. Inst. Mech. Eng. Part H J. Eng. Med. 2014, 228, 743–753. [Google Scholar] [CrossRef] [PubMed]
- Duma, V.-F.; Dobre, G.; Demian, D.; Cernat, R.; Sinescu, C.; Topala, F.I.; Negrutiu, M.L.; Hutiu, G.; Bradu, A.; Podoleanu, A.G. Handheld scanning probes for optical coherence tomography. Rom. Rep. Phys. 2015, 67, 1346–1358. Available online: http://www.rrp.infim.ro/2015_67_4/A14.pdf (accessed on 1 February 2018).
- Podoleanu, A.G.; Bradu, A. Master–slave interferometry for parallel spectral domain interferometry sensing and versatile 3D optical coherence tomography. Opt. Express 2013, 21, 19324–19338. [Google Scholar] [CrossRef] [PubMed]
- Drexler, W.; Fujimoto, J.G. (Eds.) Optical Coherence Tomography: Technology and Applications; Springer International Publishing: Cham, Switzerland, 2015; ISBN 978-3-319-06420-8. [Google Scholar]
- Wiesauer, A.D.; Dufau, S.; Gotzinger, E.; Pircher, M.; Hitzenberger, C.D.; Stifter, D. Non-destructive quantification of internal stress in polymer materials by polarisation sensitive optical coherence tomography. Acta Mater. 2005, 53, 2785–2791. [Google Scholar] [CrossRef]
- Jonathan, E. Non-contact and non-destructive testing of silicon V-grooves: A non-medical application of optical coherence tomography (OCT). Opt. Lasers Eng. 2006, 44, 1117–1131. [Google Scholar] [CrossRef]
- Czajkowsk, J.; Pryka, T.; Alarousu, E.; Palosaari, J.; Myllyla, R. Optical Coherence Tomography as a Method of Quality Inspection for Printed Electronics Products. Opt. Rev. 2010, 17, 257–262. [Google Scholar] [CrossRef]
- Serrels, K.L.; Renner, M.K.; Reid, D.T. Optical coherence tomography for non-destructive investigation of silicon integrated-circuits. Microelectron. Eng. 2010, 87, 1785–1791. [Google Scholar] [CrossRef]
- Kyotoku, B.B.C.; Gomes, A.S.L. Dental fiber-reinforced composite analysis using optical coherence tomography. Opt. Commun. 2007, 279, 403–407. [Google Scholar] [CrossRef]
- Turki, A.; Bakhsha, B.; Sadrb, A.; Shimadaa, Y.; Junji Tagamia, B.; Yasunori, S. Non-invasive quantification of resin–dentin interfacial gaps using optical coherence tomography: Validation against confocal microscopy. Dent. Mater. 2011, 27, 915–925. [Google Scholar] [CrossRef]
- Stepien, R.; Buczynski, R.; Pysz, D.; Kujawa, I.; Filipkowski, M.M.; Diduszko, R. Development of thermally stable tellurite glasses designed for fabrication of microstructured optical fibers. J. Non Cryst. Solids 2011, 357, 873–883. [Google Scholar] [CrossRef]
- Price, J.H.P.; Feng, X.; Heidt, A.M.; Brambilla, G.; Horak, P.; Poletti, F.; Ponzo, G.; Petropoulos, P.; Petrovich, M.; Shi, J.; et al. Supercontinuum generation in non-silica fibers. Opt. Fiber Technol. 2012, 18, 327–344. [Google Scholar] [CrossRef]
- Liang, H.; Gomez Cid, M.; Cucu, R.G.; Dobre, G.M.; Podoleanu, A.G.; Saunders, D. En-face optical coherence tomography—A novel application of non-invasive imaging to art conservation. Opt. Soc. Am. 2005, 13, 6133–6144. [Google Scholar] [CrossRef]
- Laopornpichayanuwat, W.; Visessamit, J.; Tianprateep, M. 3-D surface roughness profile of 316-stainless steel using vertical scanning interferometry with a superluminescent diode. Measurement 2012, 45, 2400–2406. [Google Scholar] [CrossRef]
- Choi, W.J.; Jung, S.P.; Shin, J.G.; Yang, D.; Lee, B.H. Characterization of wet pad surface in chemical mechanical polishing (CMP) process with full-field optical coherence tomography (FF-OCT). Opt. Express 2011, 19, 13343–13350. [Google Scholar] [CrossRef] [PubMed]
- Hutiu, G.; Duma, V.-F.; Demian, D.; Bradu, A.; Podoleanu, A.G. Analysis of the fractures of metallic materials using optical coherence tomography. In Proceedings of the SPIE Optical Measurement Systems for Industrial Inspection X (Optical Metrology—LASER Congress), Munchen, Germany, 25–30 June 2017; Lehmann, P., Osten, W., Gonçalves, A.A., Eds.; SPIE Press: Bellingham, WA, USA, 2017; Volume 10329. [Google Scholar] [CrossRef]
- Rueden, C.T.; Schindelin, J.; Hiner, M.C.; DeZonia, B.E.; Walter, A.E.; Arena, E.T.; Eliceir, K.W. ImageJ2: ImageJ for the next generation of scientific image data. BMC Bioinform. 2017, 18, 529. [Google Scholar] [CrossRef] [PubMed]
Figure 1.
(a) Schematic diagram of the MS/SS-OCT system. SS, swept source; DC1, 20/80 single mode directional coupler; DC2, 50/50 single mode directional coupler; GXY, two-dimensional lateral scanning head (galvanometer-based); L1 to L3, achromatic lenses; microscope objective (MO): telecentric scanning lens; PD, photodetector; M1 and M2, flat mirrors; TS, translation stage; (b) OCT images provided by the instrument, with: a confocal image (lower part, left) to image the exact selected area on the xy surface of the sample; two B-scans (cross-sectional images), an xz and an yz one (where the z axis is the in-depth one, perpendicular on the surface of the sample), taken on the positions marked in red in the confocal image; nine xy C-scans/en-face images, taken each at a constant depth in the topography of the sample surface, between the dotted lines marked in the B-scans. All OCT images are presented simultaneously to the user.
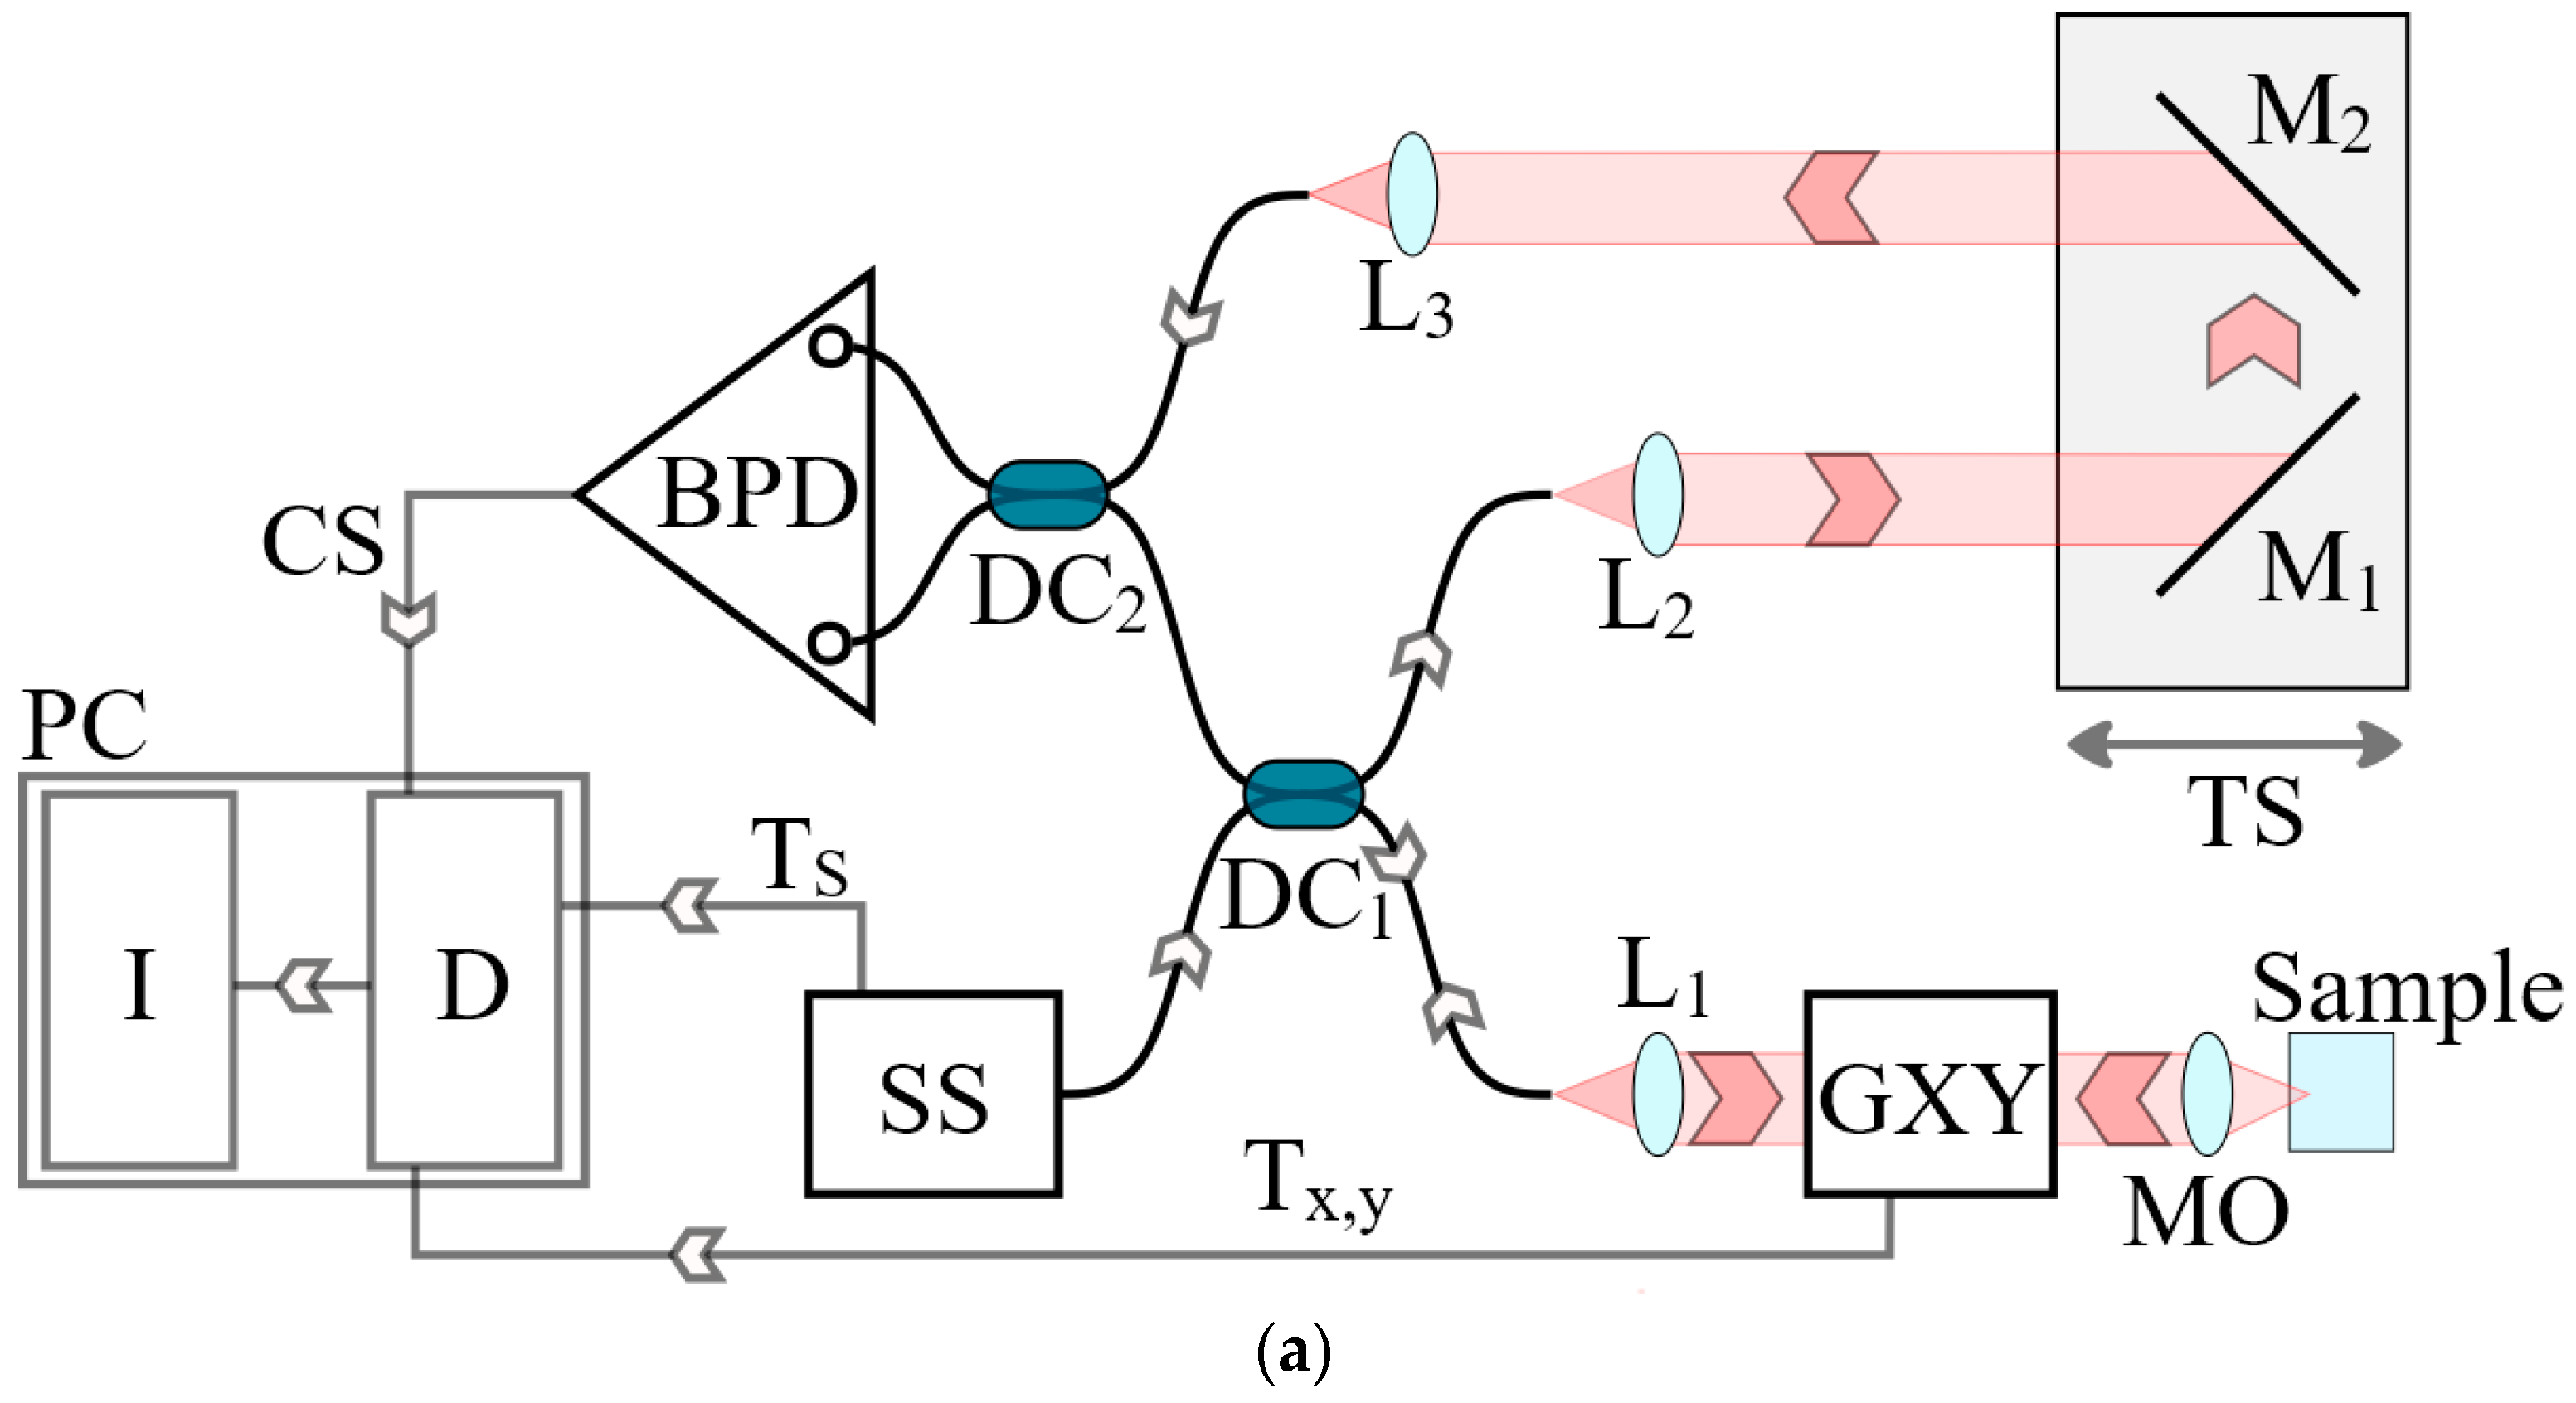
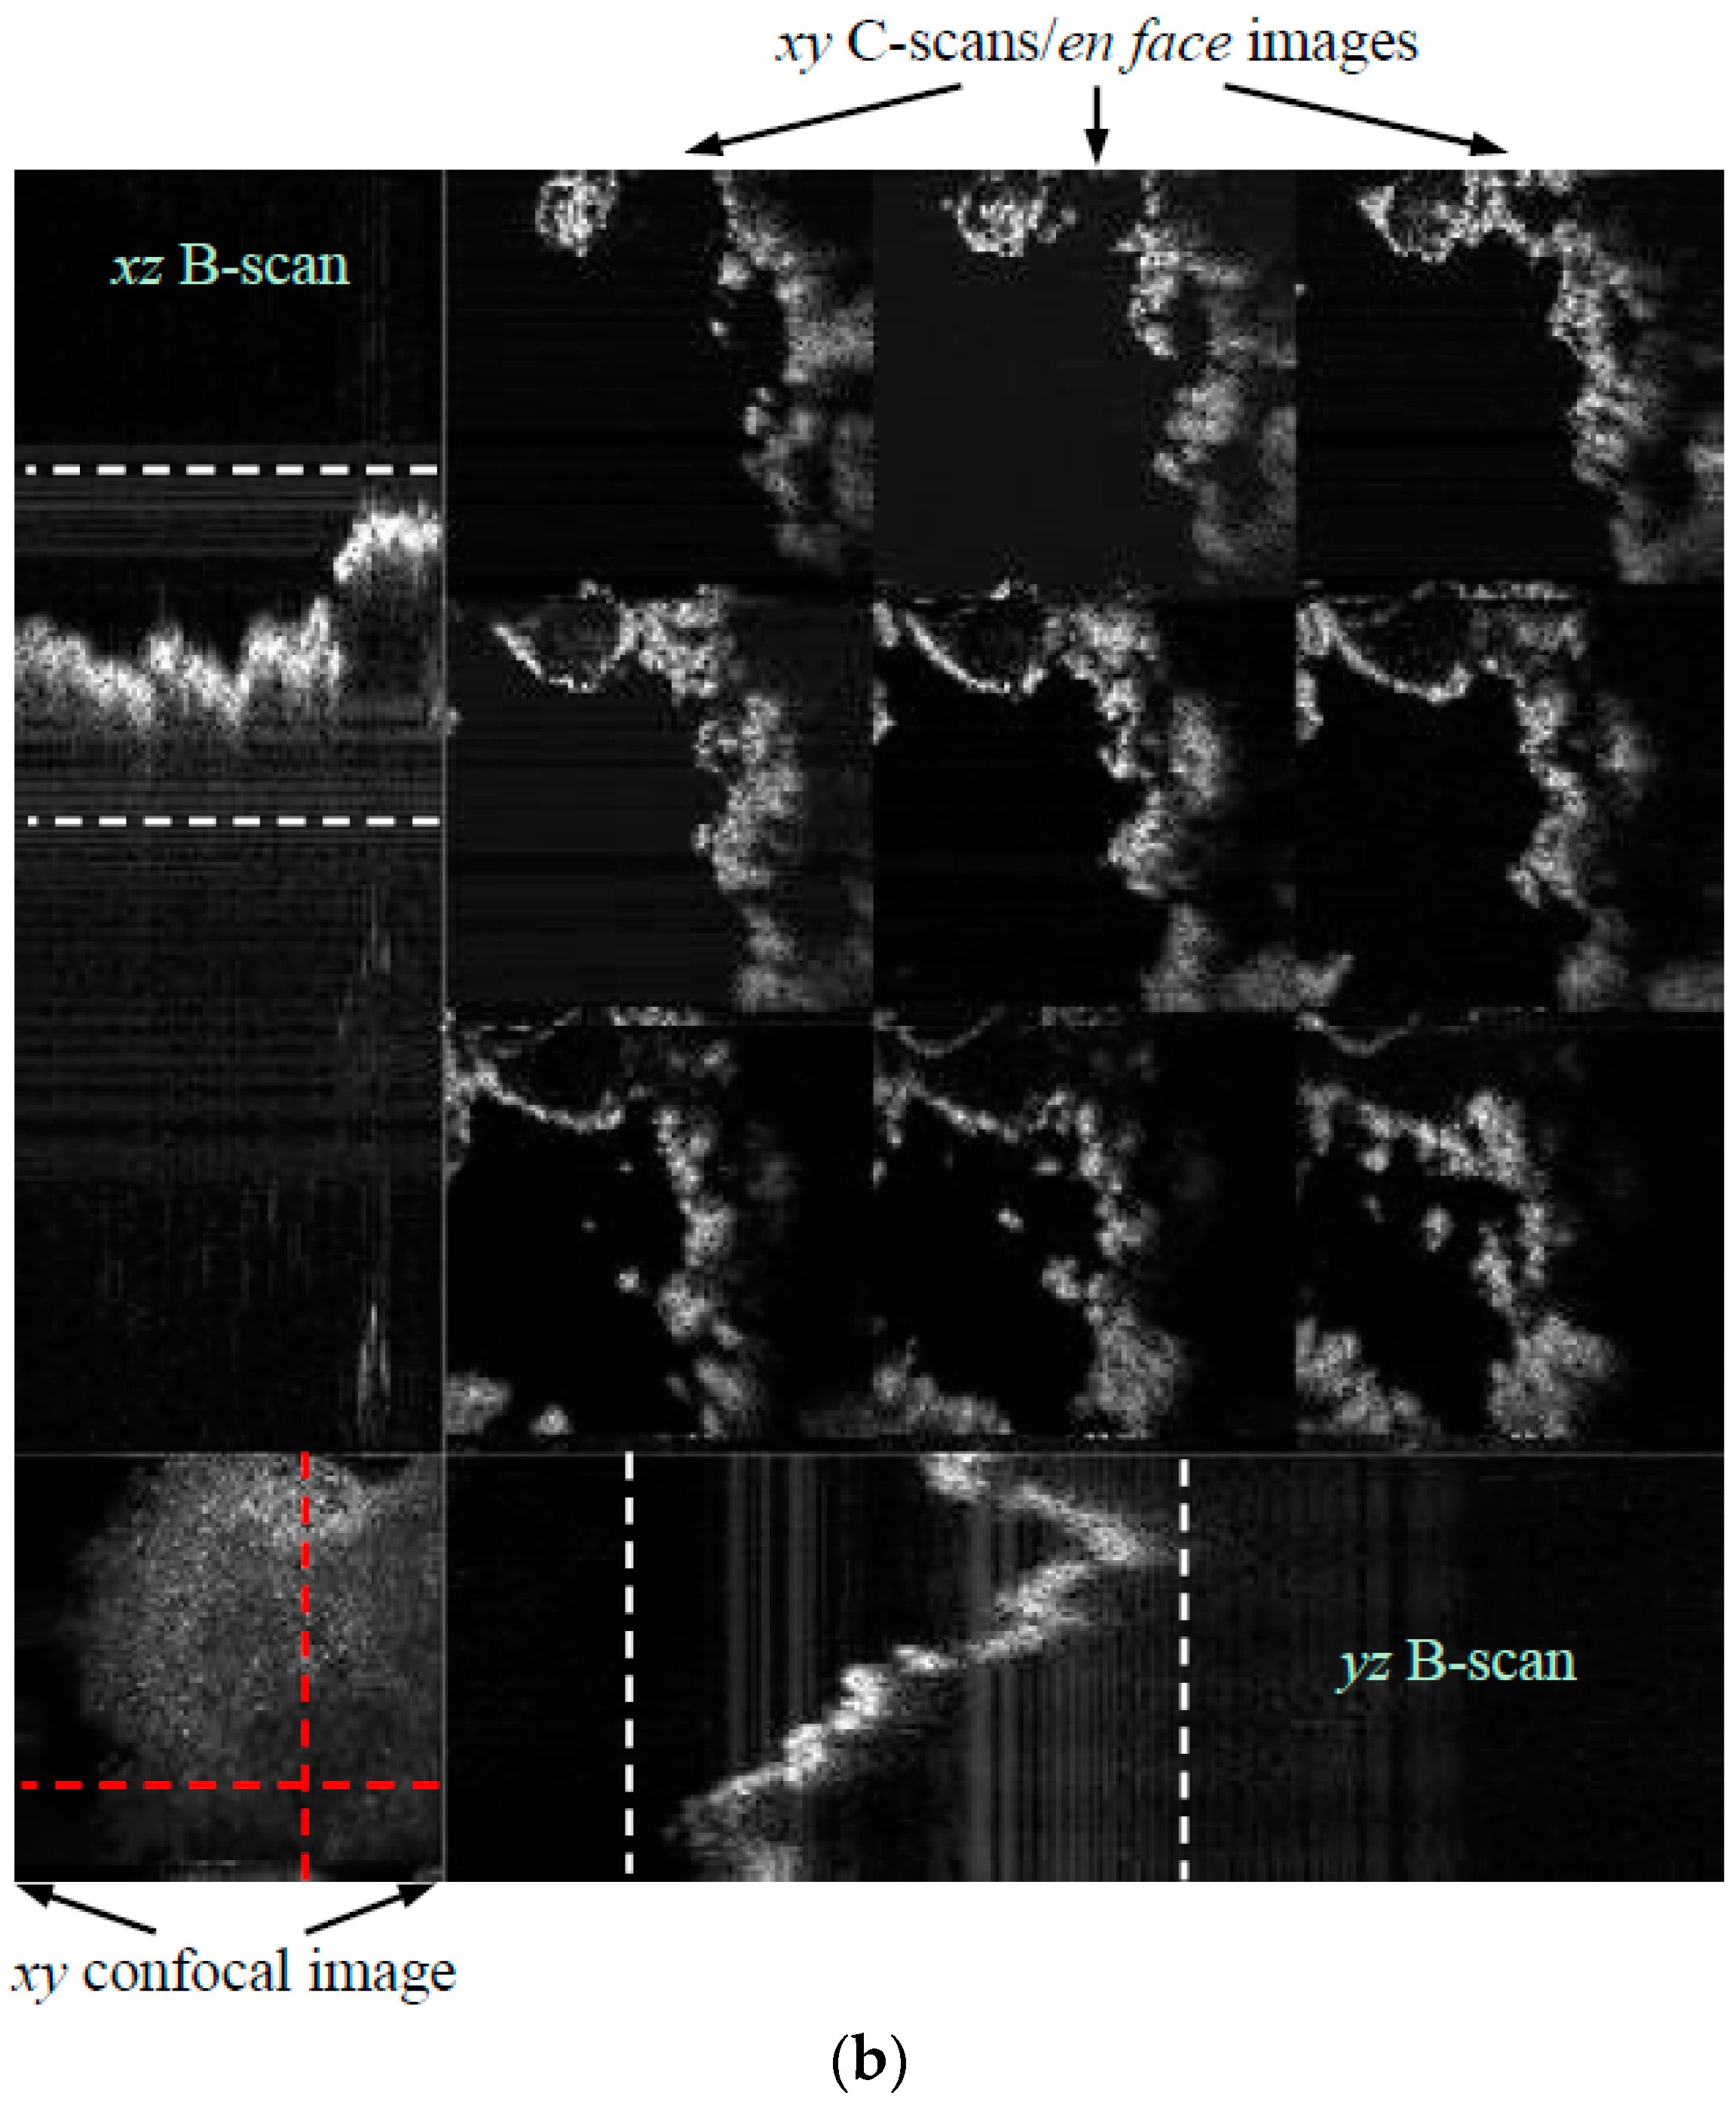
Figure 2.
FEI Quanta 250 Scanning Electron Microscope (SEM) utilized in the investigations, with a metallic sample positioned in its holder.
Figure 2.
FEI Quanta 250 Scanning Electron Microscope (SEM) utilized in the investigations, with a metallic sample positioned in its holder.

Figure 3.
Images of a fracture in OL 37 steel: (a) frontal SEM overview of the entire sample, with an area selected for SEM and OCT imaging; (b) SEM image of the marked area; (c) OCT image of the same area, with a 10 μm transversal resolution, with the same grains as in (b) numbered on the surface.
Figure 3.
Images of a fracture in OL 37 steel: (a) frontal SEM overview of the entire sample, with an area selected for SEM and OCT imaging; (b) SEM image of the marked area; (c) OCT image of the same area, with a 10 μm transversal resolution, with the same grains as in (b) numbered on the surface.
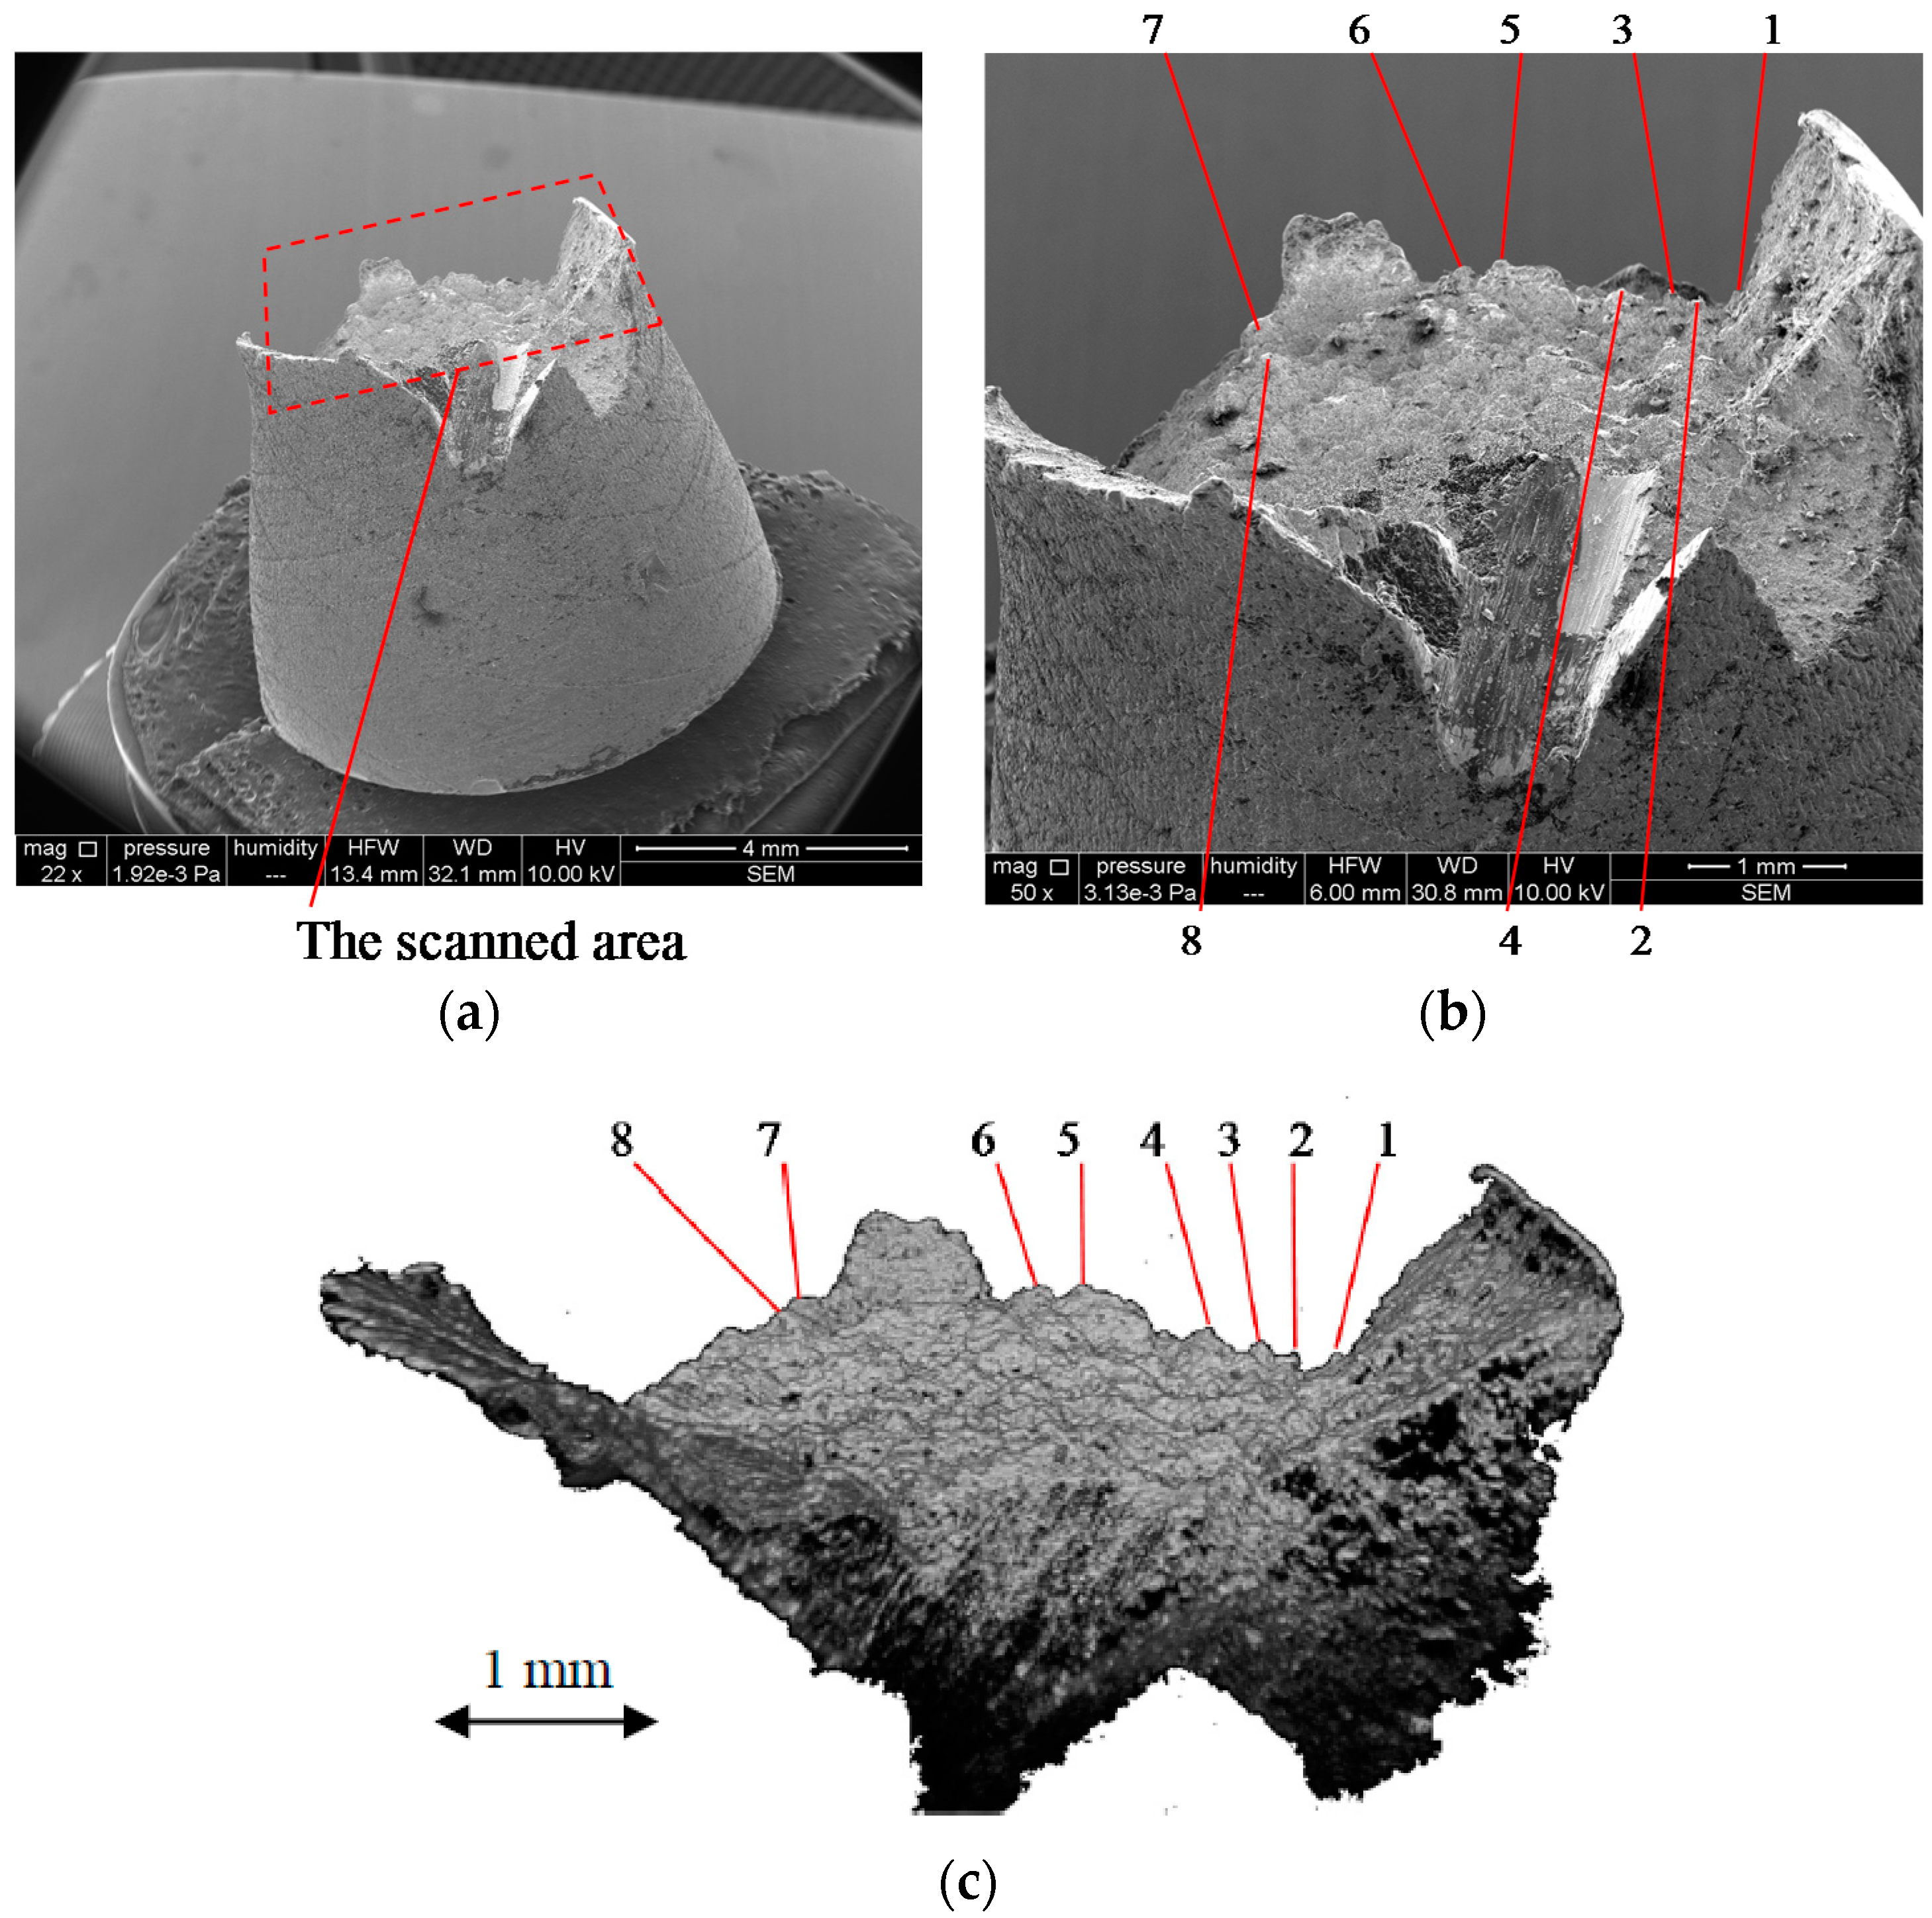
Figure 4.
Images of a fracture in OL 44 steel: (a) frontal SEM overview of the entire sample, with an area selected for SEM and OCT imaging; (b) SEM image of the marked area; (c) OCT image of the same area (with a 10 μm transversal resolution), with the same grains as in (b) numbered on the surface—also presented in [36].
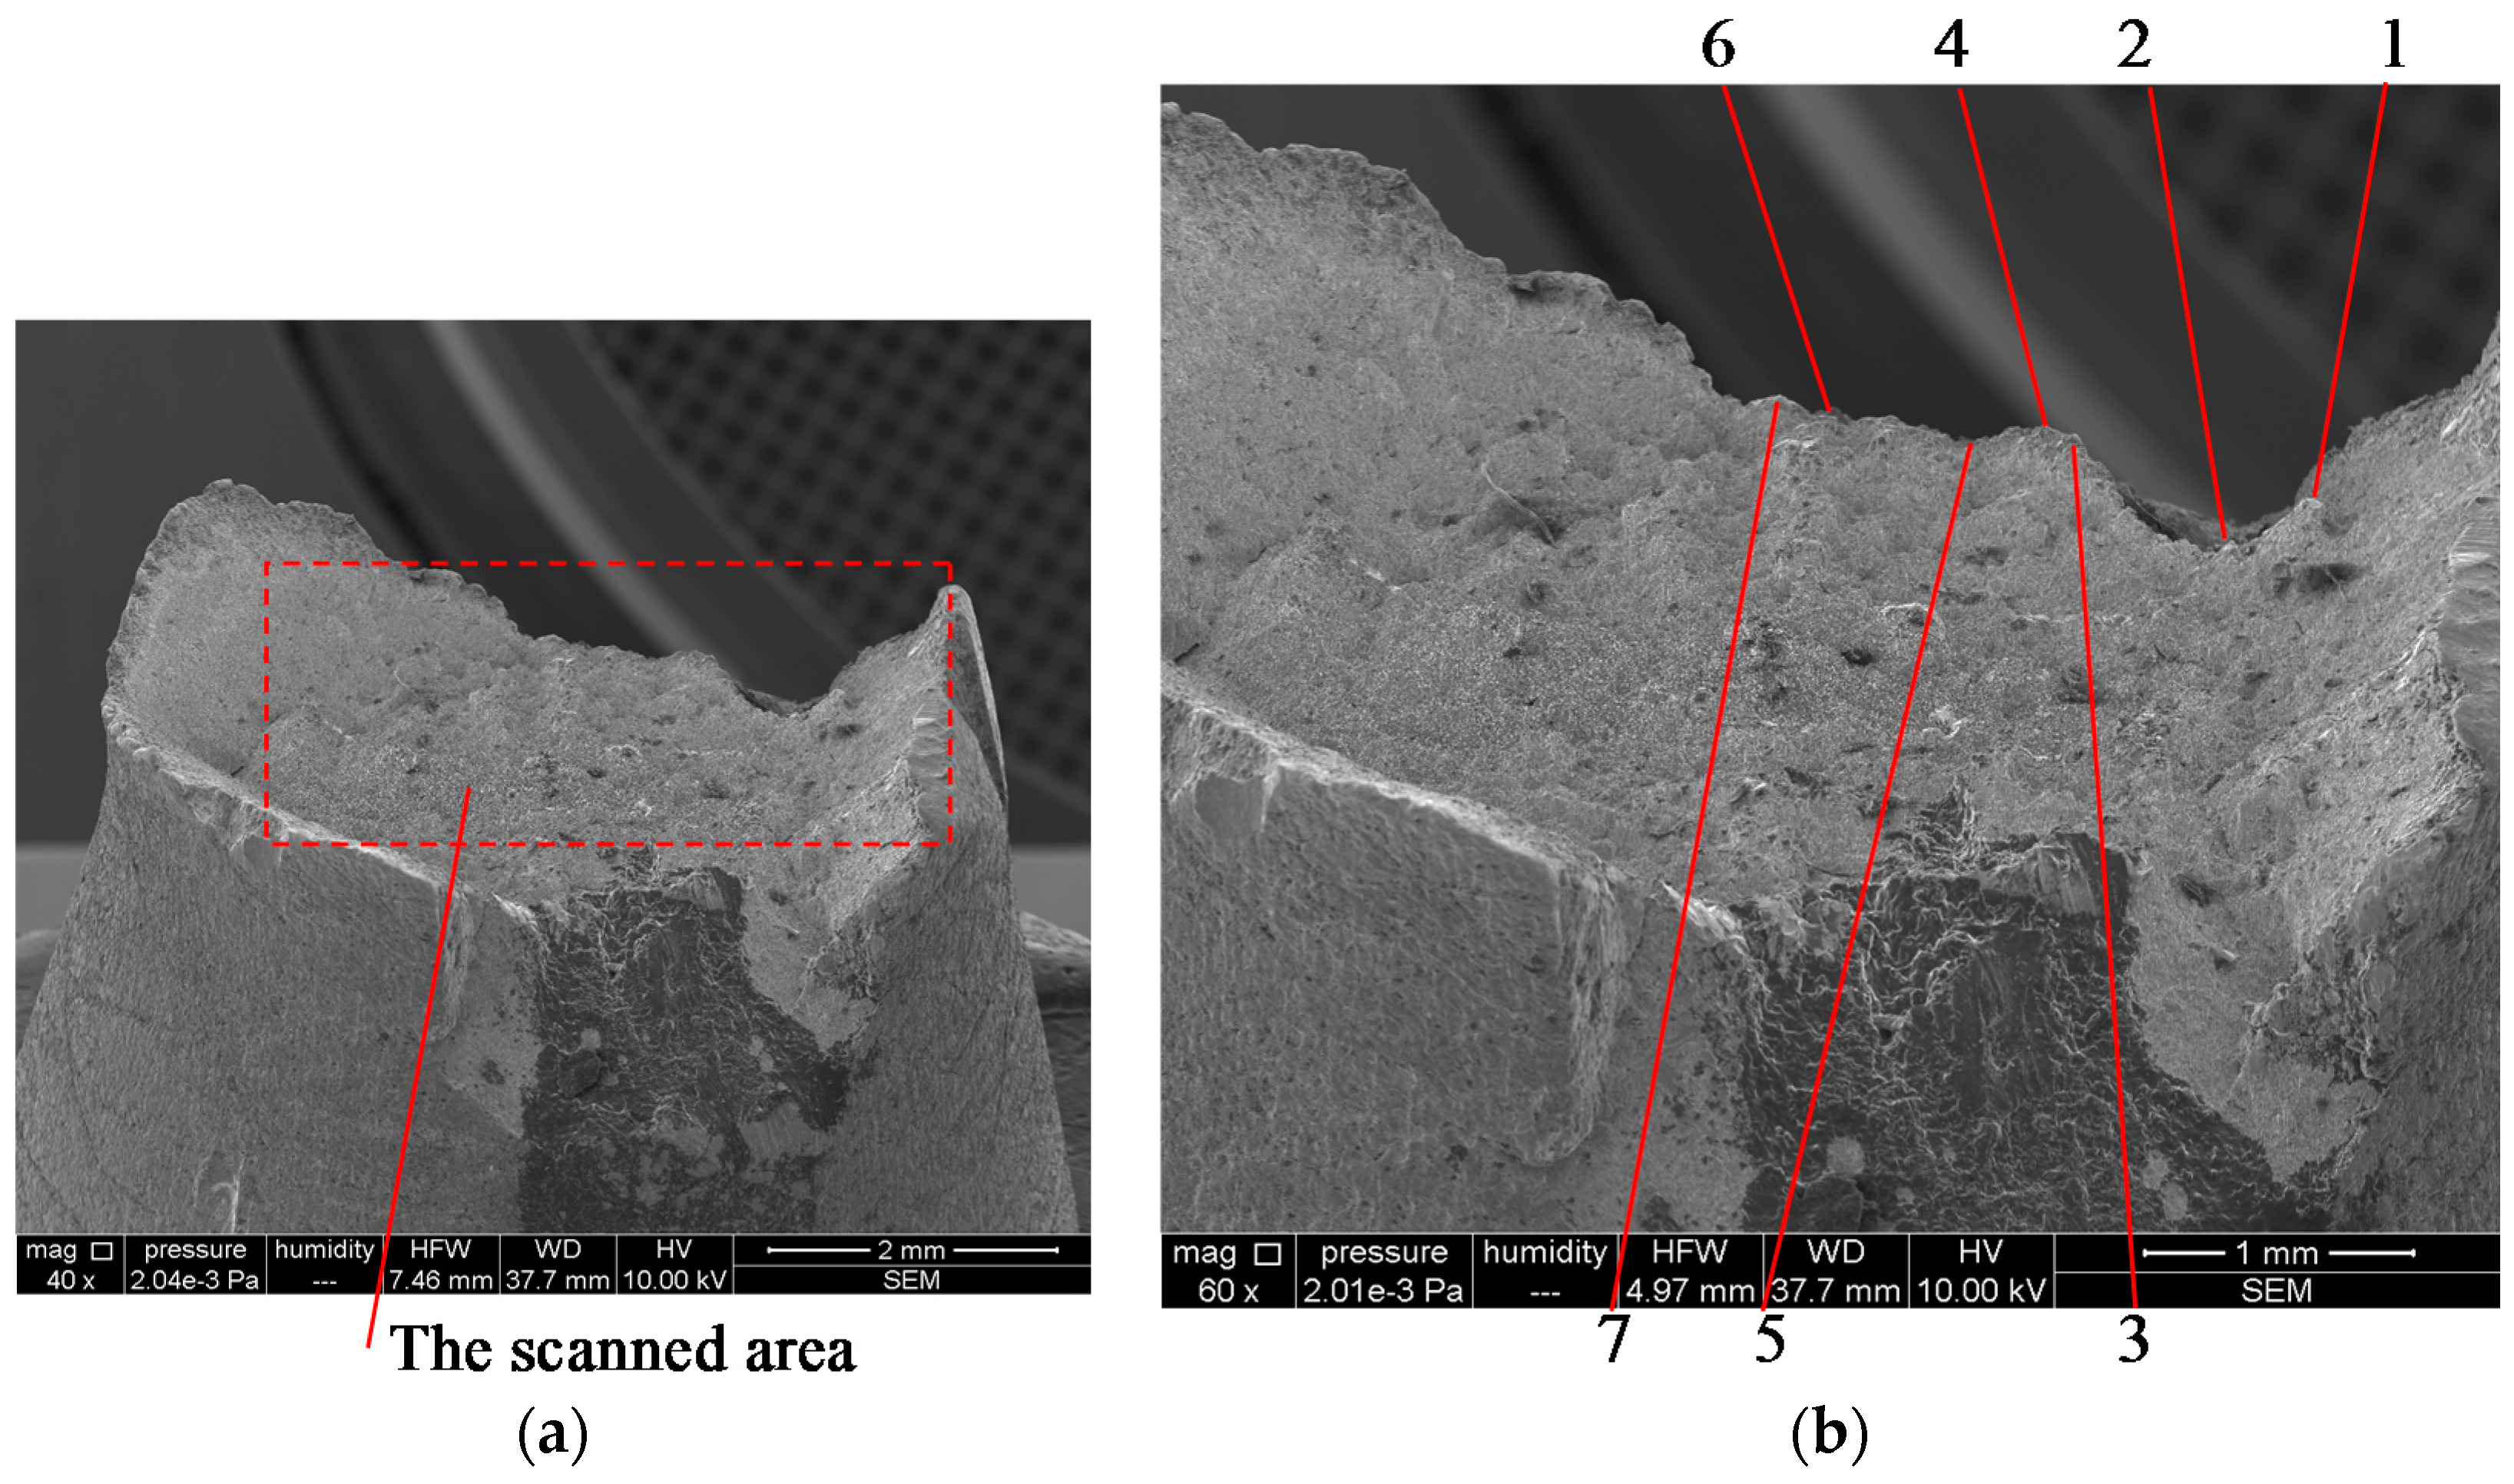

Figure 5.
Images of a fracture in OL 44 steel: (a) frontal SEM overview of the entire sample, with a marked area for the OCT investigation; (b) OCT image (1.5 × 1.5 mm2) obtained with the novel MS/SS-OCT system—with an improved, 4 μm transversal resolution—with the same grains as in (a) numbered on the surface after a 5× magnification of the area of interest.

Figure 6.
Images of a fracture in a lamellar cast iron EN-GJL 250: (a) frontal SEM overview of the entire sample, with a marked area for the OCT investigation; (b) SEM image of the selected area shown in (a); (c) OCT image of the same area with a 10 μm transversal resolution, with the same grains as in (b) numbered on the surface.
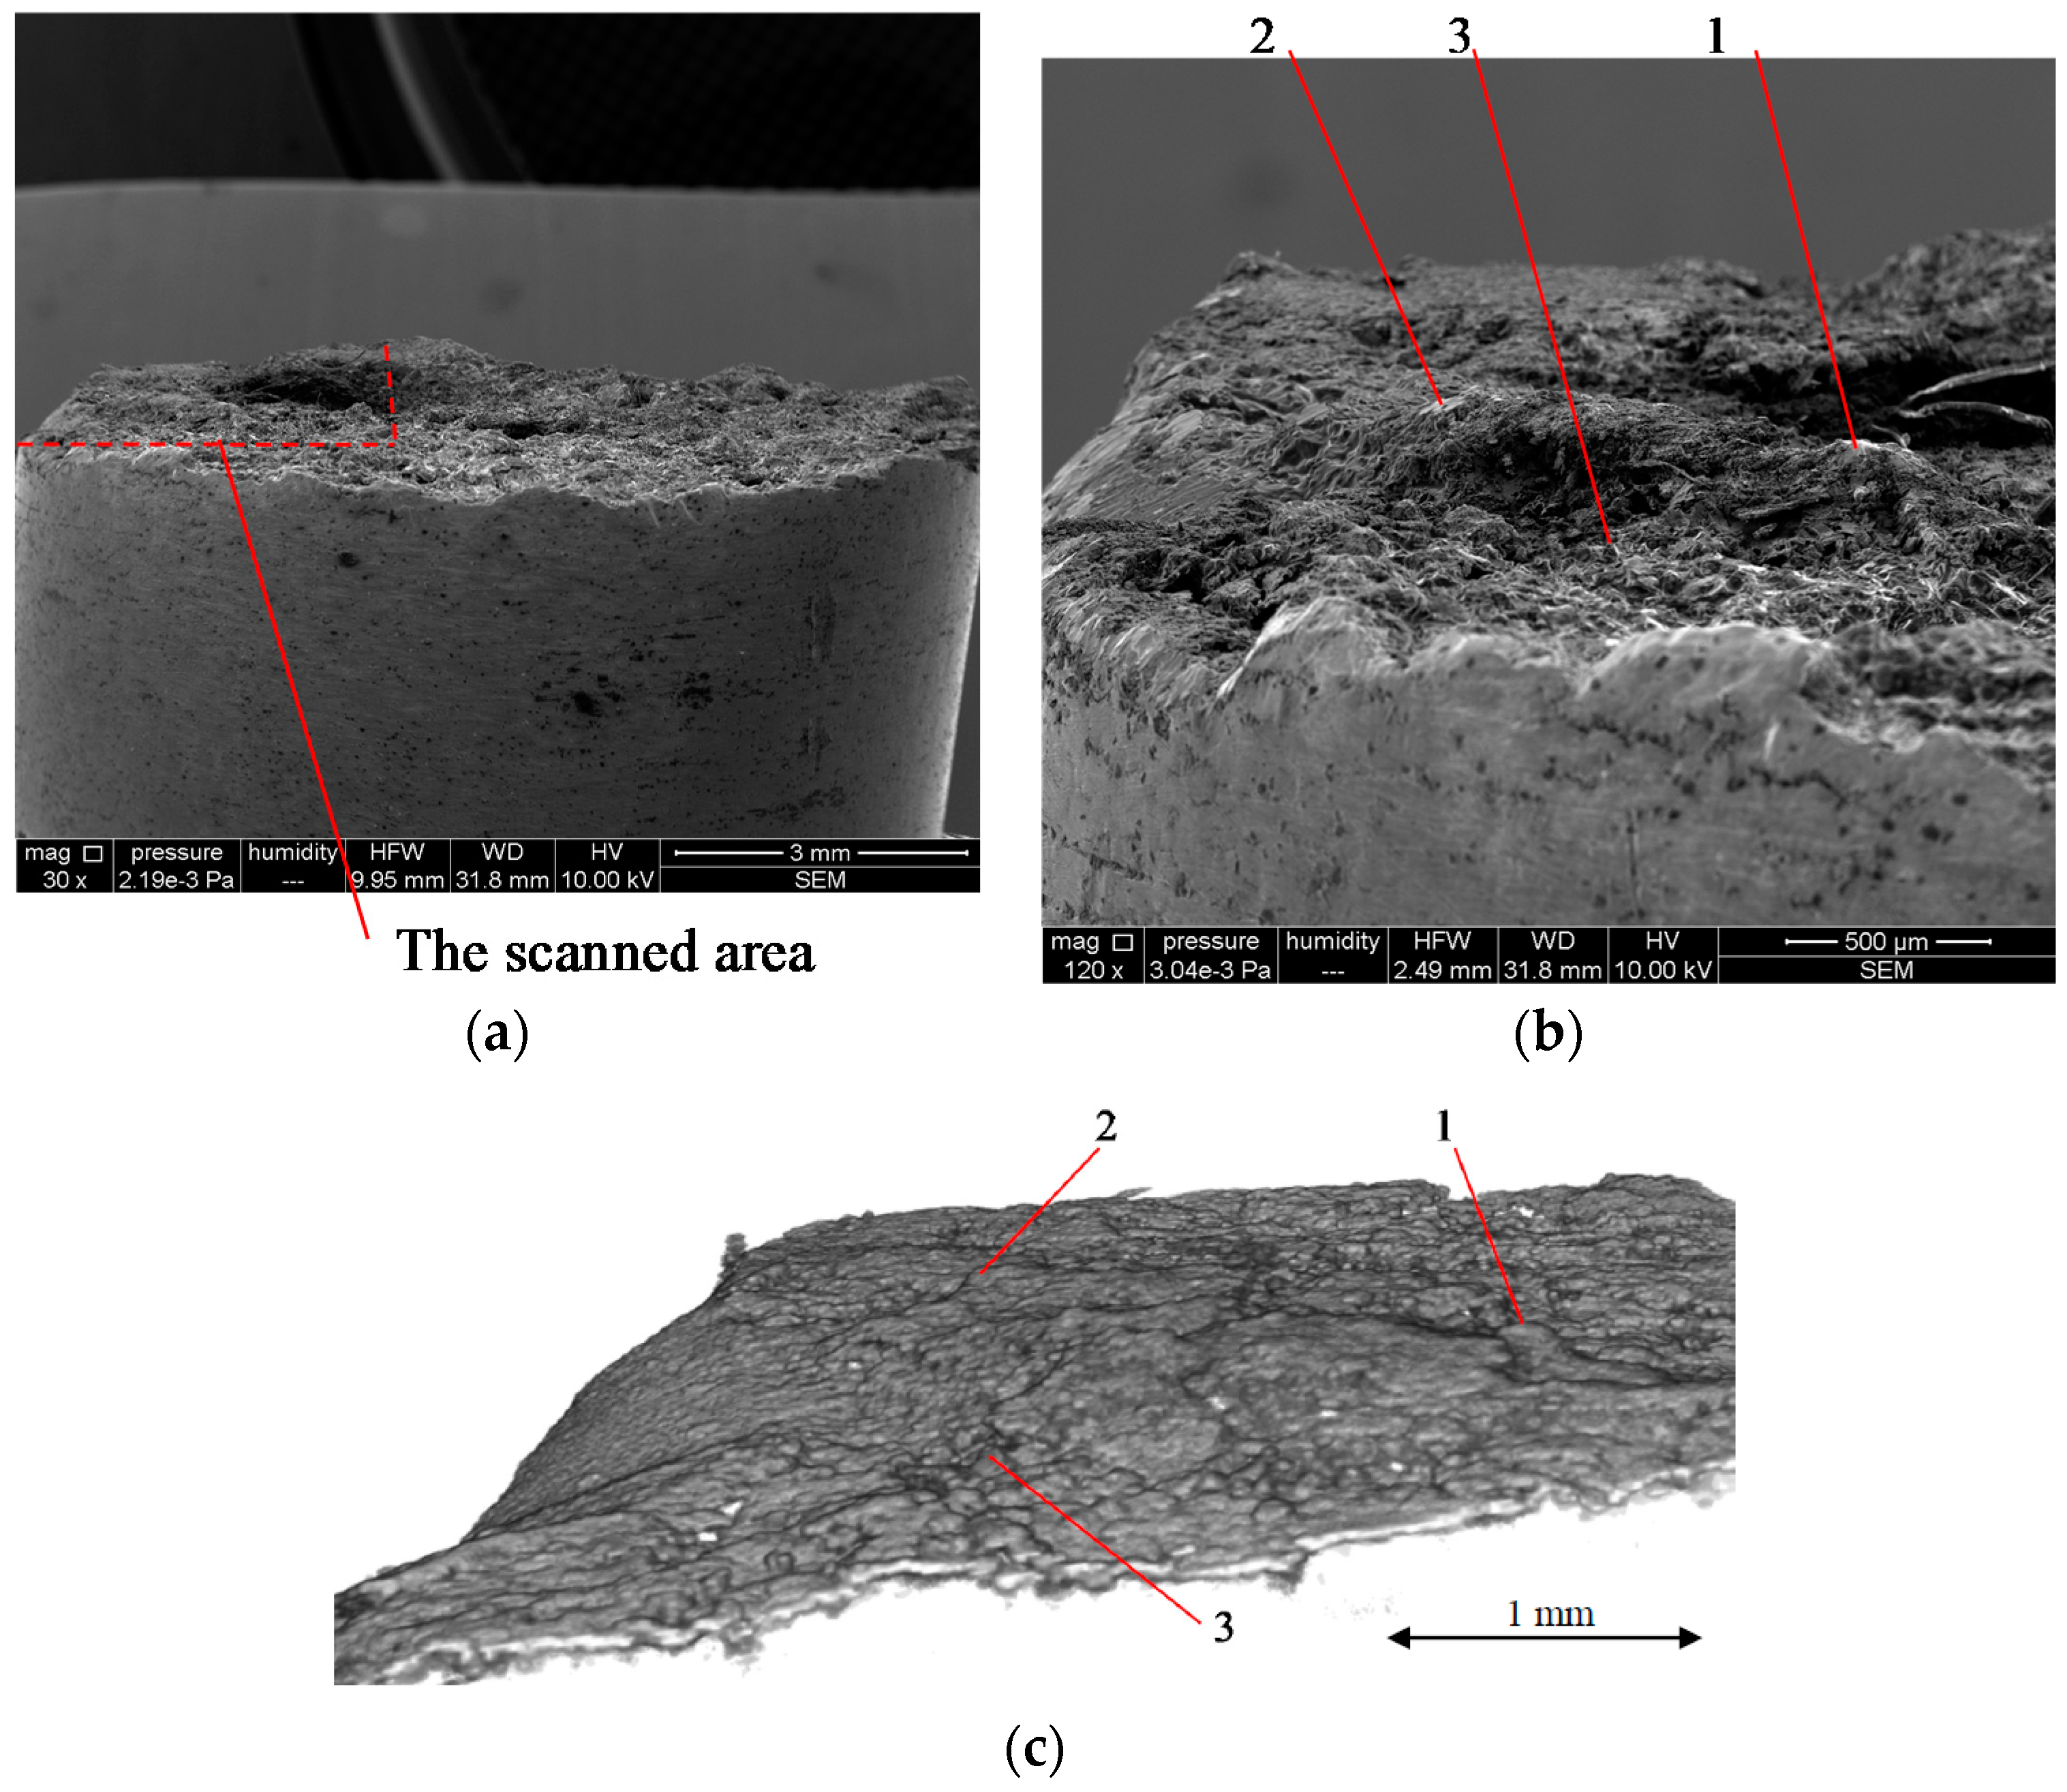
Figure 7.
Images of a fracture in a Sn-Sb-Cu antifriction alloy: (a) frontal SEM overview of the entire sample, with a marked area for the OCT investigation; (b) SEM image of the selected area; (c) OCT image of the same area with a 10 μm transversal resolution, with the same grains as in (b) numbered on the surface.
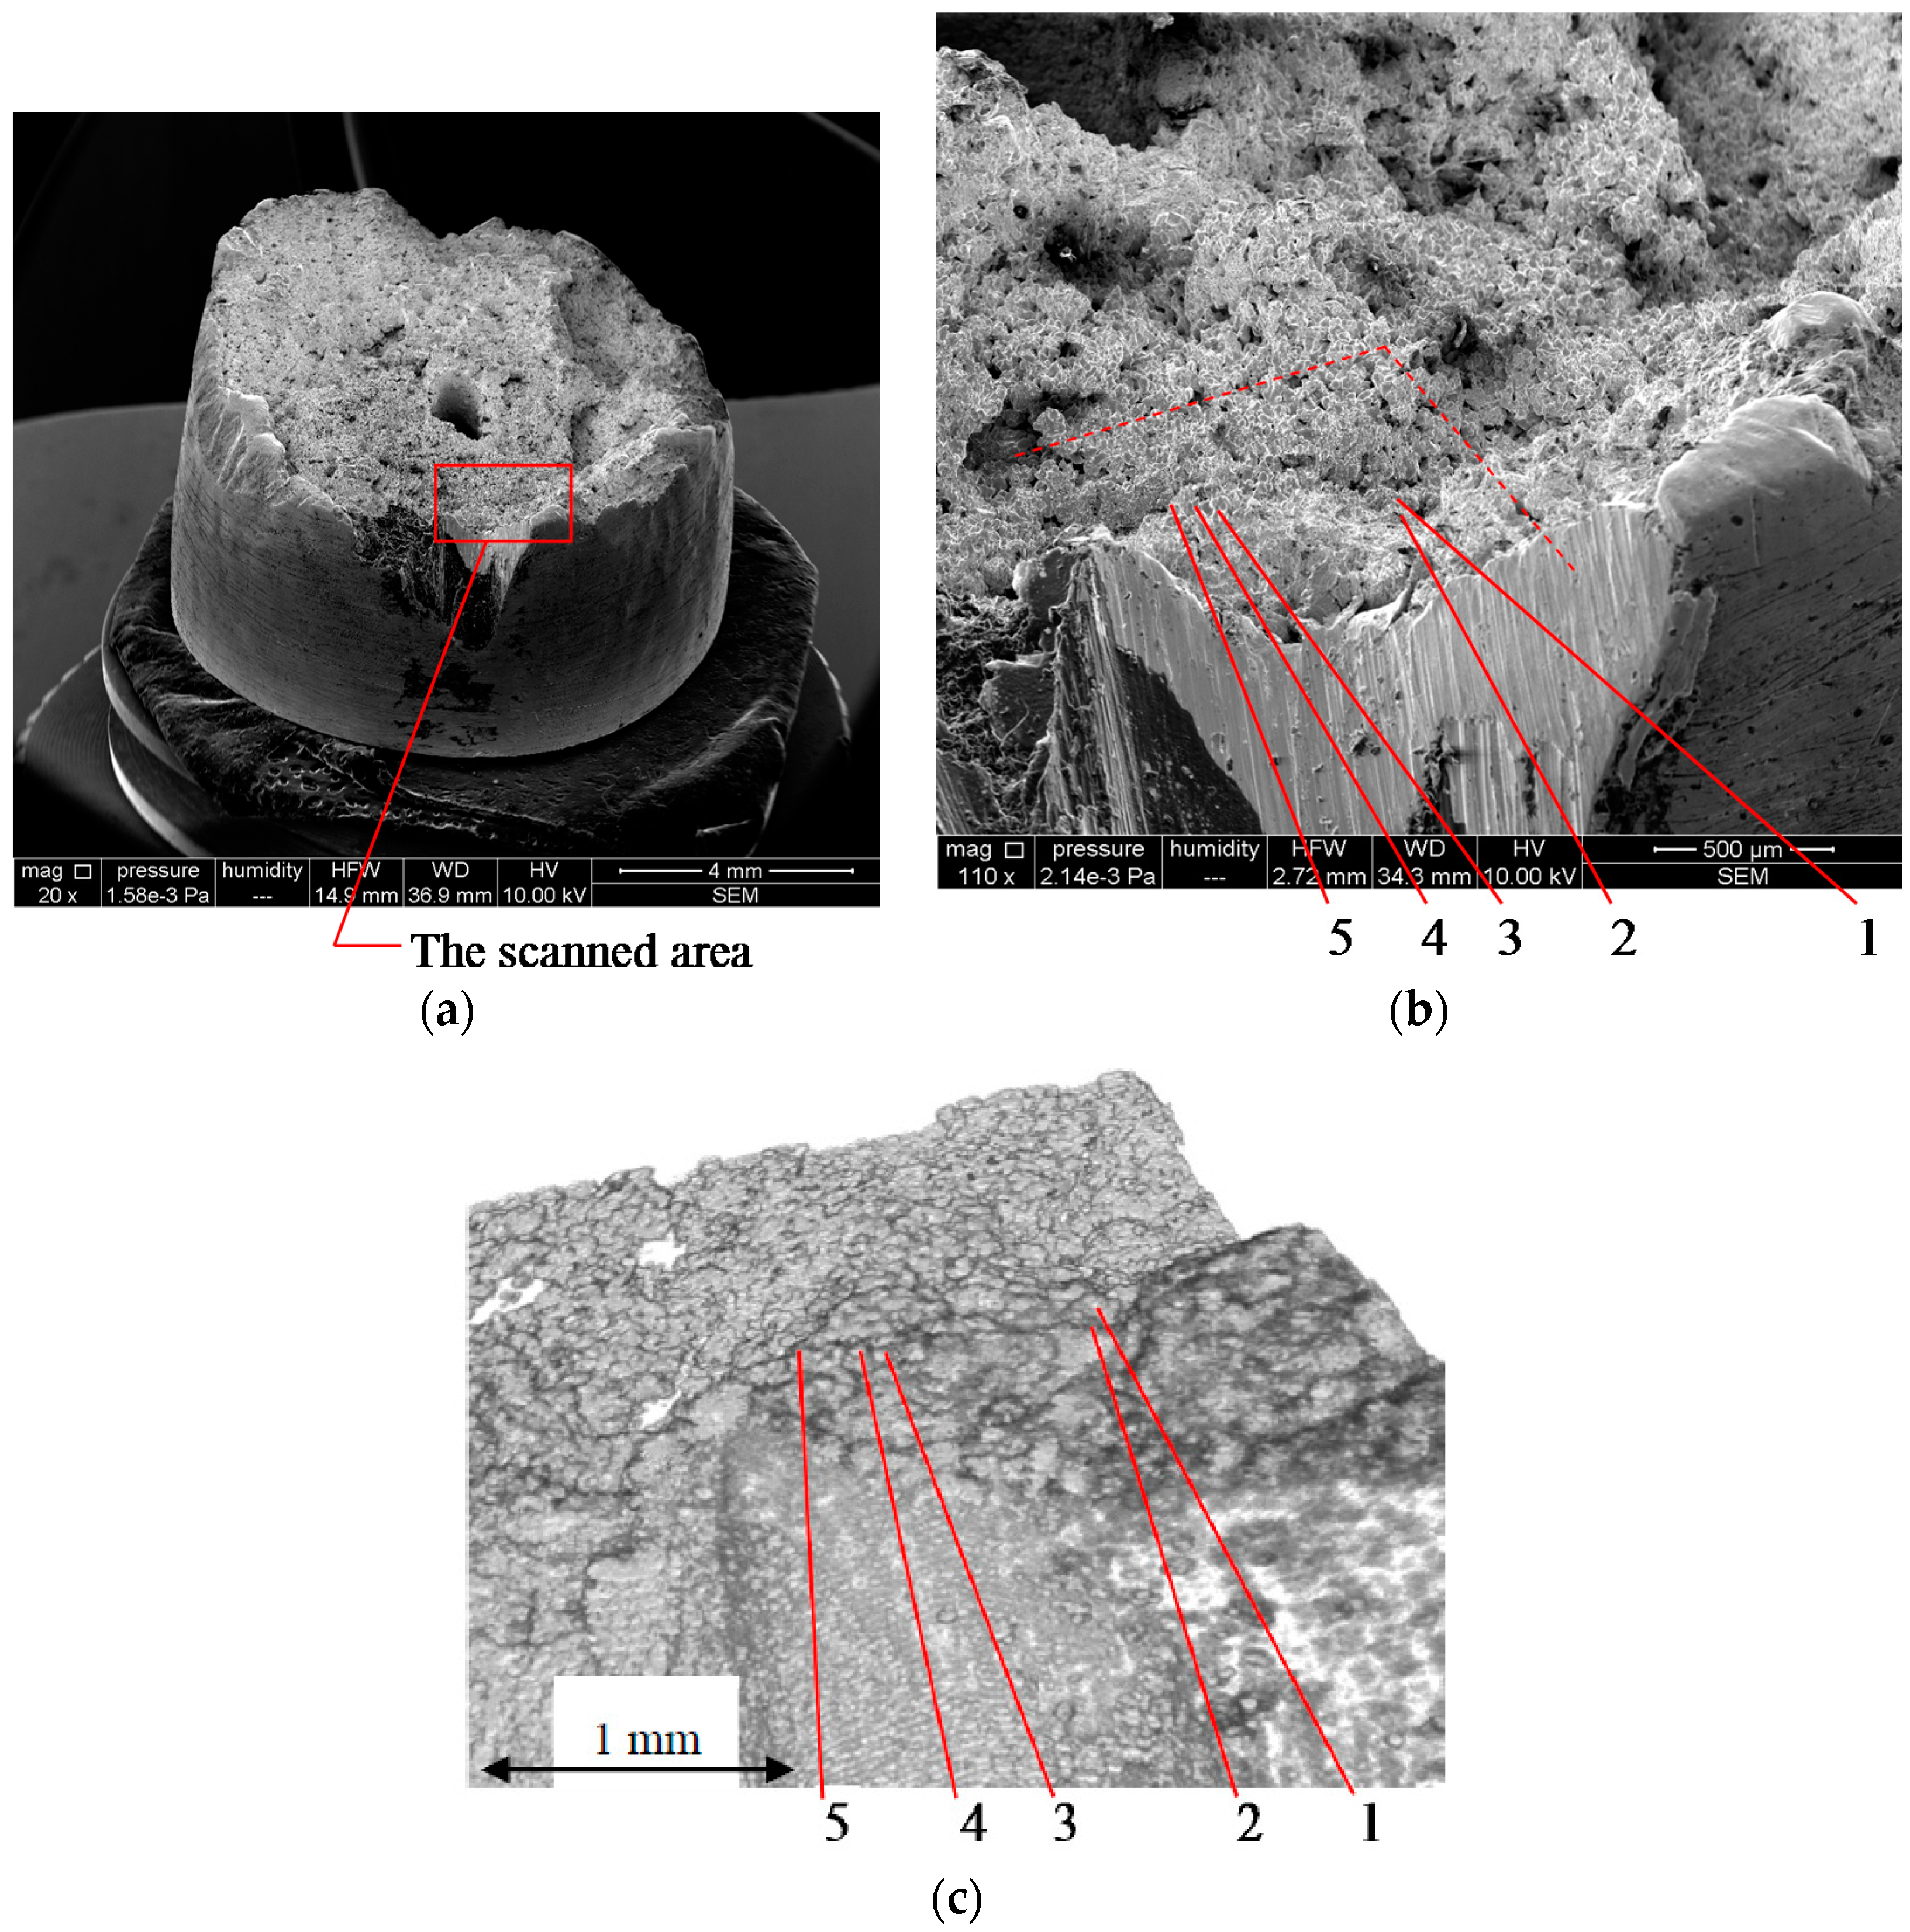
Figure 8.
Images of a fracture in a Sn-Sb-Cu antifriction alloy: (a,b) frontal SEM overview of the entire sample, the latter with a zoom to mark the area for OCT imaging; (c) OCT image (1 × 1.5 mm2) of the selected area, obtained with the MS/SS-OCT system—with the improved 4 μm transversal resolution.


Figure 9.
Images of a fracture in an OLC 45 steel: (a) SEM overview of the entire sample, with the marked area for OCT imaging; (b) OCT image of the selected area, obtained with the MS/SS-OCT system with the improved 4 μm transversal resolution, with several grains numbered on the surface.
Figure 9.
Images of a fracture in an OLC 45 steel: (a) SEM overview of the entire sample, with the marked area for OCT imaging; (b) OCT image of the selected area, obtained with the MS/SS-OCT system with the improved 4 μm transversal resolution, with several grains numbered on the surface.
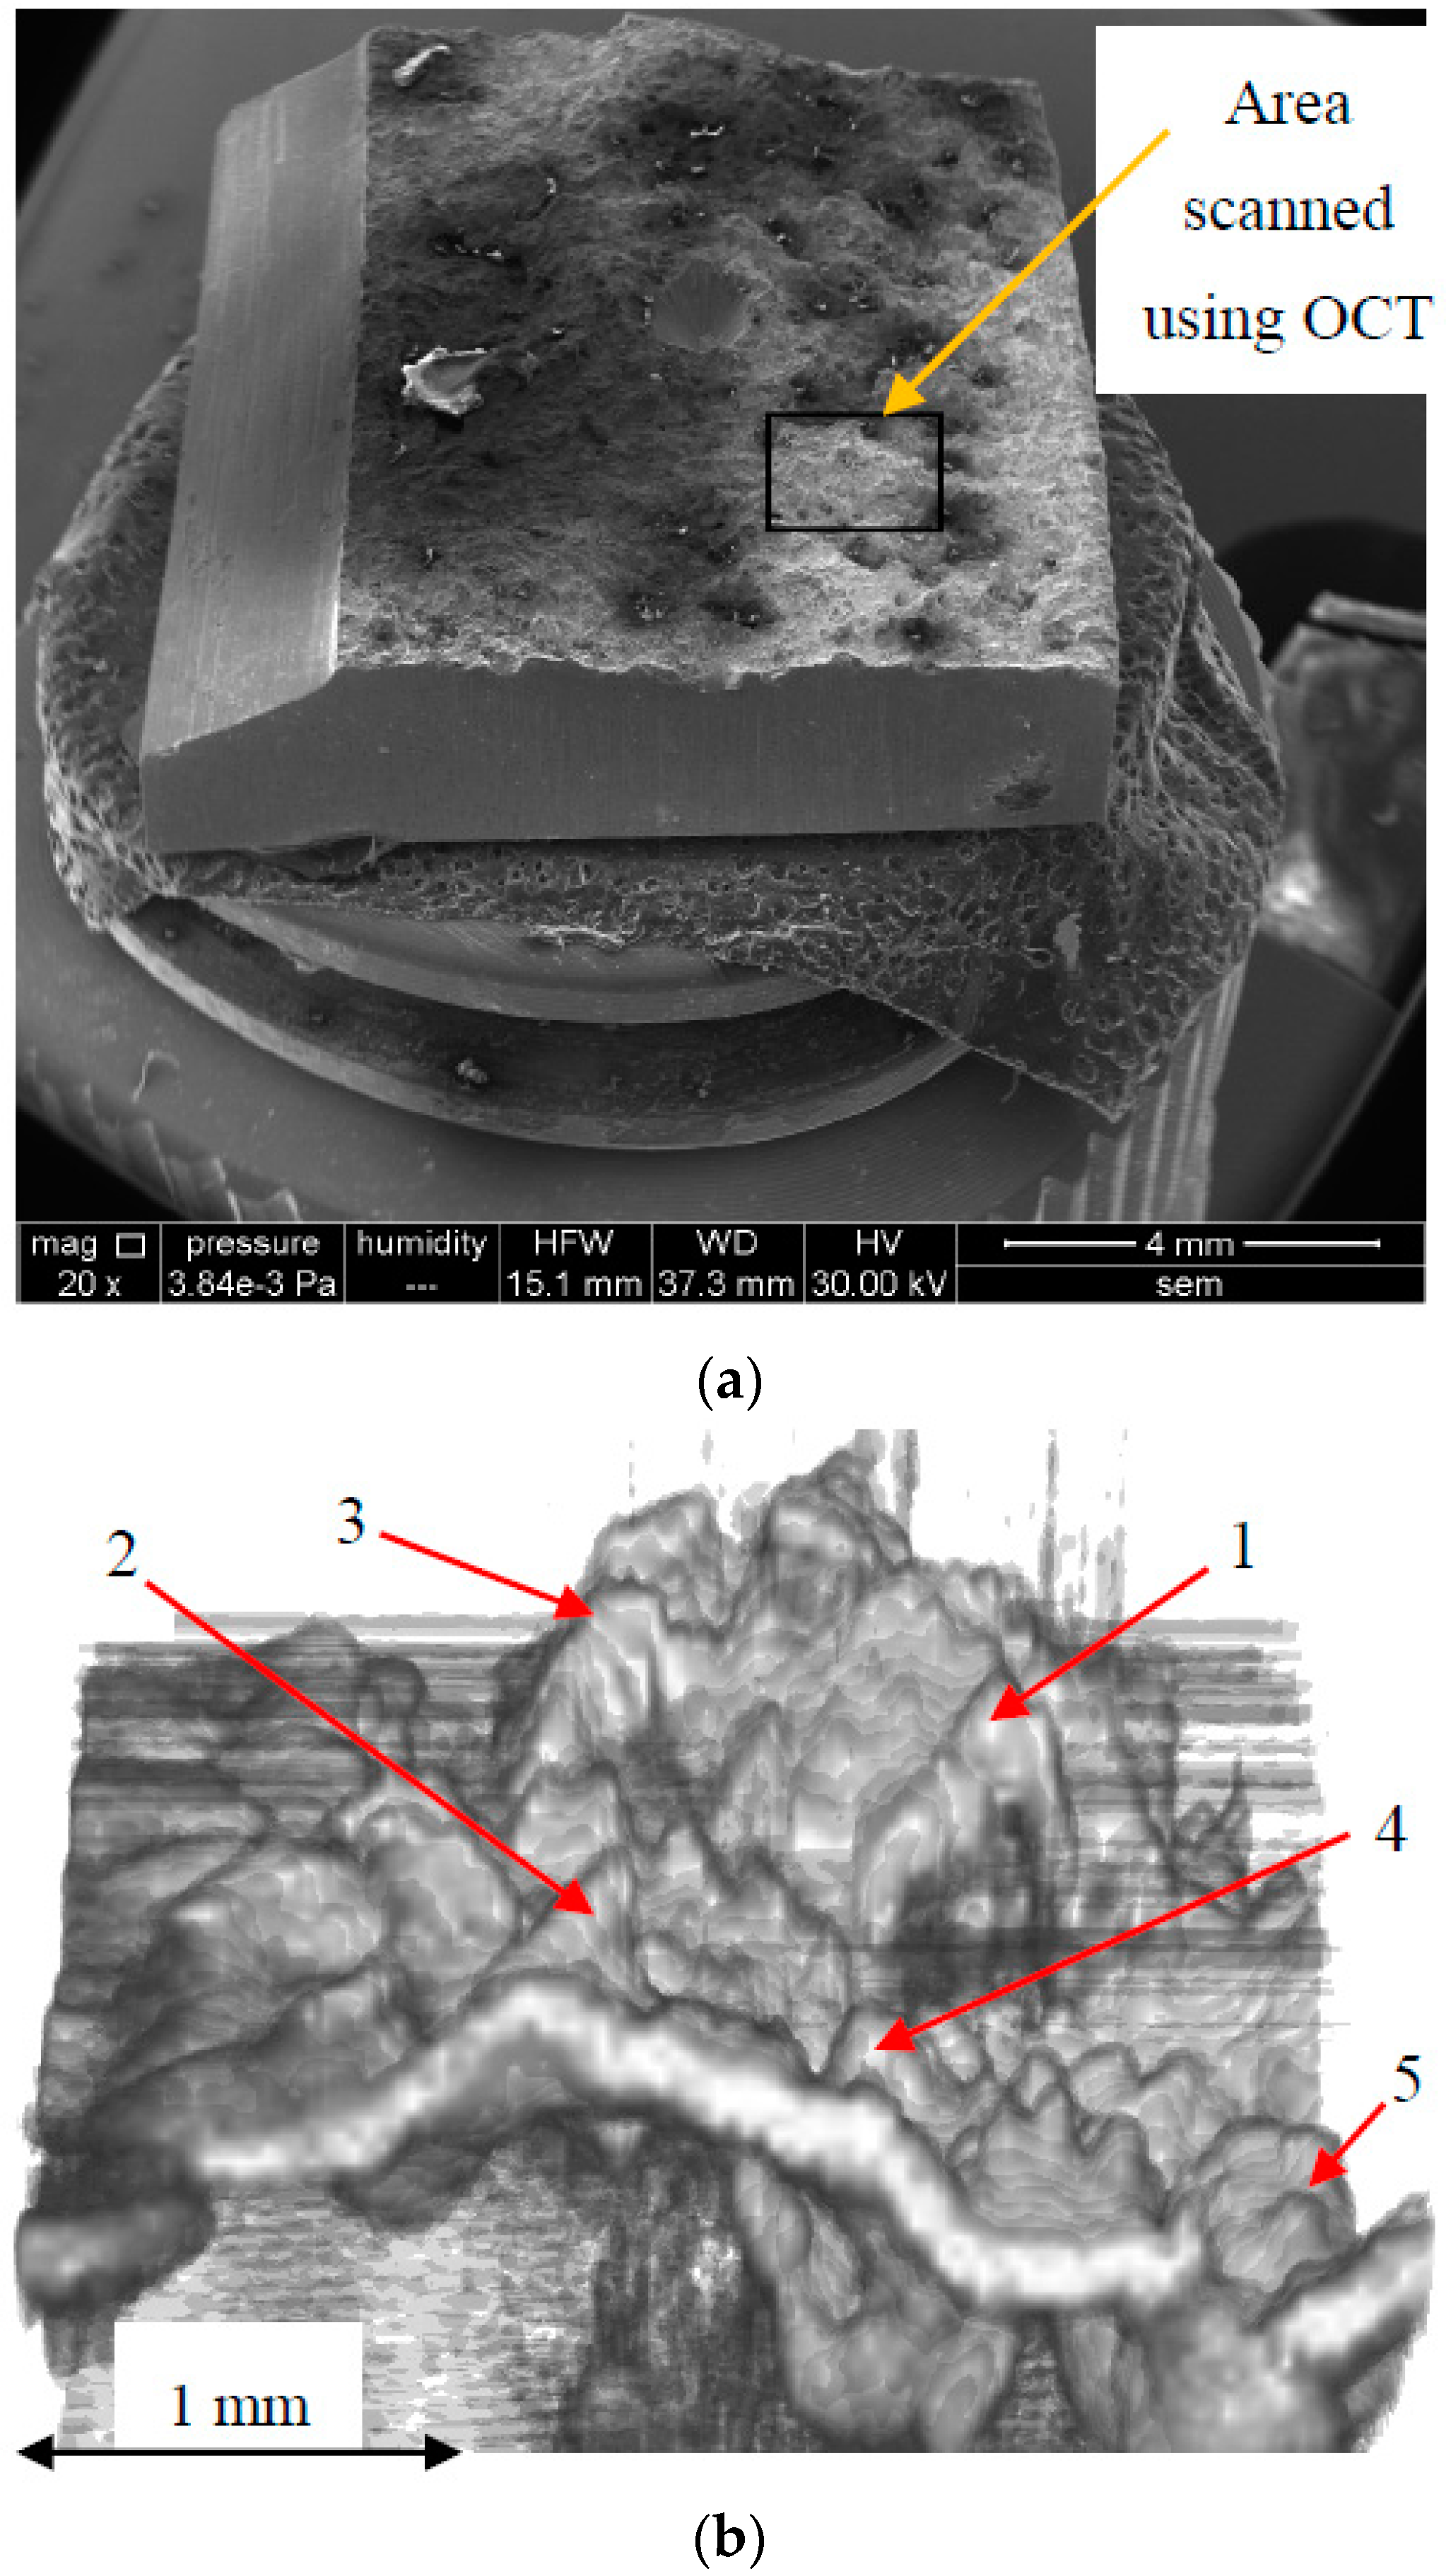
Figure 10.
Images of a fracture in a T10NiCr180 stainless steel sample: (a) SEM overview of the entire sample, with the selected area for OCT imaging; (b) OCT image of the selected area, obtained with the improved MS/SS-OCT system—with a 10 μm lateral resolution; (c) OCT image of the step from the fatigue area to the one of the brittle fracture.


Table 1.
Characteristics of the different materials subjected to fracture tests.
| Material | Symbol | Chemical Composition | Microstructure | Applications (Examples) |
|---|---|---|---|---|
| Low carbon steel | OL 37 OL 44 | C content ranging from 0.20 to 0.22%, Mn 0.85%, S 0.04%, P 0.05%, and Fe for the rest | Grains of ferrite and max. 25% perlite | Welded metallic parts; protection of wire meshes |
| Lamellar graphite cast iron | EN-GJL-250 (SREN 1561) | C 3.2%, Si 1.7%, P 0.3%, S 0.12%, and Fe for the rest | Ferrite, pearlite, phosphorous eutectic, and graphite grains | Castings with an average fracture strength |
| Antifriction alloy | Sn-Sb-Cu | Sb 12%, Cu 4%, Cd 1%, and Sn for the rest | A soft core of a Sn solid solution, with small amounts of dissolved Cu and Sb & with a hard phase of SnSb and Cu3Sn | Internal combustion engine bearings |
| High quality rolled steel | OLC 45 (STAS 880-88) | C 0.45%, Mn 0.7%, S 0.03%, P 0.04%, and the rest Fe | Ferrite and pearlite grains | Heat treated castings (with high rupture strength & average breaking tenacity), turbine blades, crown gears, crankshafts |
| Stainless steel | T10NiCr180 (STAS 10718-88) | C 0.007%, Si 0.78%, Mn 1.87%, Cu 1.72%, Ni 3.82%, Cr 18.11%, Mo 0.15%, Ti 0.13% | 100% austenitic microstructure | Parts resistant to high temperatures (including for automotive and aerospace) |
| Ductile cast iron | FGN 400-18 LT | C 3.43%, Si 2.30%, Mn 0.12%, S 0.09%, P 0.014% | 95% basic feritic mass, with graphite nodules | Rail wagon grease boxes |
© 2018 by the authors. Licensee MDPI, Basel, Switzerland. This article is an open access article distributed under the terms and conditions of the Creative Commons Attribution (CC BY) license (http://creativecommons.org/licenses/by/4.0/).
Share and Cite
MDPI and ACS Style
Hutiu, G.; Duma, V.-F.; Demian, D.; Bradu, A.; Podoleanu, A.G. Assessment of Ductile, Brittle, and Fatigue Fractures of Metals Using Optical Coherence Tomography. Metals 2018, 8, 117. https://doi.org/10.3390/met8020117
AMA Style
Hutiu G, Duma V-F, Demian D, Bradu A, Podoleanu AG. Assessment of Ductile, Brittle, and Fatigue Fractures of Metals Using Optical Coherence Tomography. Metals. 2018; 8(2):117. https://doi.org/10.3390/met8020117
Chicago/Turabian StyleHutiu, Gheorghe, Virgil-Florin Duma, Dorin Demian, Adrian Bradu, and Adrian Gh. Podoleanu. 2018. "Assessment of Ductile, Brittle, and Fatigue Fractures of Metals Using Optical Coherence Tomography" Metals 8, no. 2: 117. https://doi.org/10.3390/met8020117
Note that from the first issue of 2016, this journal uses article numbers instead of page numbers. See further details here.