Characteristics of Metal Magnetic Memory Testing of 35CrMo Steel during Fatigue Loading

1
College of Mechanical and Transportation Engineering, China University of Petroleum-Beijing, Beijing 102200, China
2
China National Offshore Oil Corporation, Beijing 100029, China
*
Author to whom correspondence should be addressed.
Metals 2018, 8(2), 119; https://doi.org/10.3390/met8020119
Submission received: 29 December 2017
/
Revised: 2 February 2018
/
Accepted: 4 February 2018
/
Published: 8 February 2018
(This article belongs to the Special Issue Advanced Non-Destructive Testing in Steels)
Abstract
:The fatigue fracture of a drillstring could cause drilling disturbances and some negative impacts (e.g., economic loss) will be brought when restoring the drillstring to functionality. In order to evaluate the effects of the fatigue damage of the drillstring during drilling, a new apparatus, which could monitor the load level in real-time, was built to perform the four-point bending fatigue test on 35CrMo steel, a typical material of drillstrings. Such an apparatus is based on metal magnetic memory (MMM) technology and can acquire the tangential and normal components of MMM signals. Based on the analysis of the change of surface morphology and MMM signals, it was concluded that the variation of MMM signals could be divided into four stages, which are used to accurately describe the fatigue damage process of the drillstring. Additionally, the MMM signal characteristics are introduced to especially evaluate the fatigue damage of the drillstring, including crack initiation. Furthermore, the scanning electron microscopy (SEM) results demonstrated that morphologies of fatigue fracture were related to the variation of MMM signals. Linear fitting results indicated that fatigue crack length had a good linear relationship with the characteristics, so it is feasible to monitor fatigue damage and predict the residual life of a drillstring by using MMM technology.
1. Introduction
A drillstring is a long, hollow tubular structure used to drive the drill bit from the surface to the oil and gas area [1]. The drillstring is made up of numerous drill pipes by means of tapered threaded connections. During the drilling process, the drillstring often suffers from early failure under large stress mutation caused by alternating loads [2]. Most of its failures are in the form of fatigue damage [3,4]. Investigation shows that 14% of oil and gas wells experienced underground fracture accidents of drillstrings to different degrees [5], and the average costs of a drilling accident caused by drillstring fracture is as high as $250 million [6,7]. Therefore, monitoring stress concentration or microcracks at the early stage during drilling and promptly taking precautions before crack propagation is of great significance to prevent fatigue failure of drillstrings.
The metal magnetic memory (MMM) method is a kind of non-destructive testing technology which can monitor stress concentration and early damage of a drillstring to effectively further prevent the occurrence of fracture accidents [8,9,10,11]. Different from the traditional non-destructive testing methods, the MMM method can detect the residual magnetic field induced by the mechanical stress and the geomagnetic field, and the object can be directly detected without artificial magnetization. It has shown good prospects of development and application in the fatigue damage detection of ferromagnetic materials [12]. In addition, the sensor, based on large magneto-resistance effects, has the characteristics of small volume, high sensitivity, small structure, and high reliability [13,14], which facilitates the detection of drillstring fatigue.
Experimental studies based on MMM signals have been carried out to investigate fatigue damage of ferromagnetic materials [15,16,17,18,19,20,21,22,23,24,25]. Li et al. [20] measured the variation of Hp(y) signals during rotary bending fatigue experiments, and the results showed that magnetization under tensile stress was different from that under compressive stress. Leng et al. [21] measured the Hp(y) signals on the specimen’s surface at different fatigue stages and found that the surface magnetic fields generated contain reversible and irreversible processes prior to failure, while there was a substantial increase just before fracture. Shi et al. [22] found that the stress concentration factor extremely affects the variation of Hp(y) signals through dynamic tension fatigue test. Dong et al. [23] extracted the ∆Hp(y) value, peak-to-peak value of Hp(y), during tension–tension fatigue tests and an approximate linear relationship was found between ∆Hp(y) and the fatigue crack length. Huang et al. [24,25] studied the variation of Hp(y) and its maximum gradient Kmax under the dynamic bending load and found that Kmax was potentially a very useful indicator to monitor the fatigue crack propagation for a ferromagnetic structural steel.
In short, based on the literature review, the main limitations mentioned above are summarized as follows: Most studies have focused on the variation of Hp(y) signal of ferromagnetic materials during the fatigue process [20,21,22,23,24,25]. Several issues, however, need to be further investigated when it is applied to assess the fatigue state of a drillstring. The morphology of the specimen’s surface corresponding to the variation of the MMM signals is ignored. In fact, the change of the magnetic field on the surface of specimen is mainly caused by the change of the microstructure. Additionally, Hp(x) is considered as a key indicator for fatigue damage evaluation due to the same important role in MMM signals compared with Hp(y). The results of MMM detection are affected by the material type and load type [17,20], and missing detection may occur if the detection results are obtained only from the Hp(y) signal. Thus, the combination of Hp(x) and Hp(y) signals may reduce the probability of missing detection.
Therefore, the objective of the current work is to analyze the change of Hp(x) and Hp(y) signal during a four-point bending fatigue test, which corresponds to the results of the morphology on the specimen’s surface by a CCD (charge coupled device) camera. Meanwhile, the SEM of the specimen’s surface and fracture is analyzed and the crack mechanism is studied by metallographical structure observations. The possible reasons for the variation of MMM signals, Hp(x) and Hp(y), with their characteristics, Hp(x)min, K(x)max, and K(y)max, are discussed.
2. Experimental Procedures
2.1. Experimental Instrument
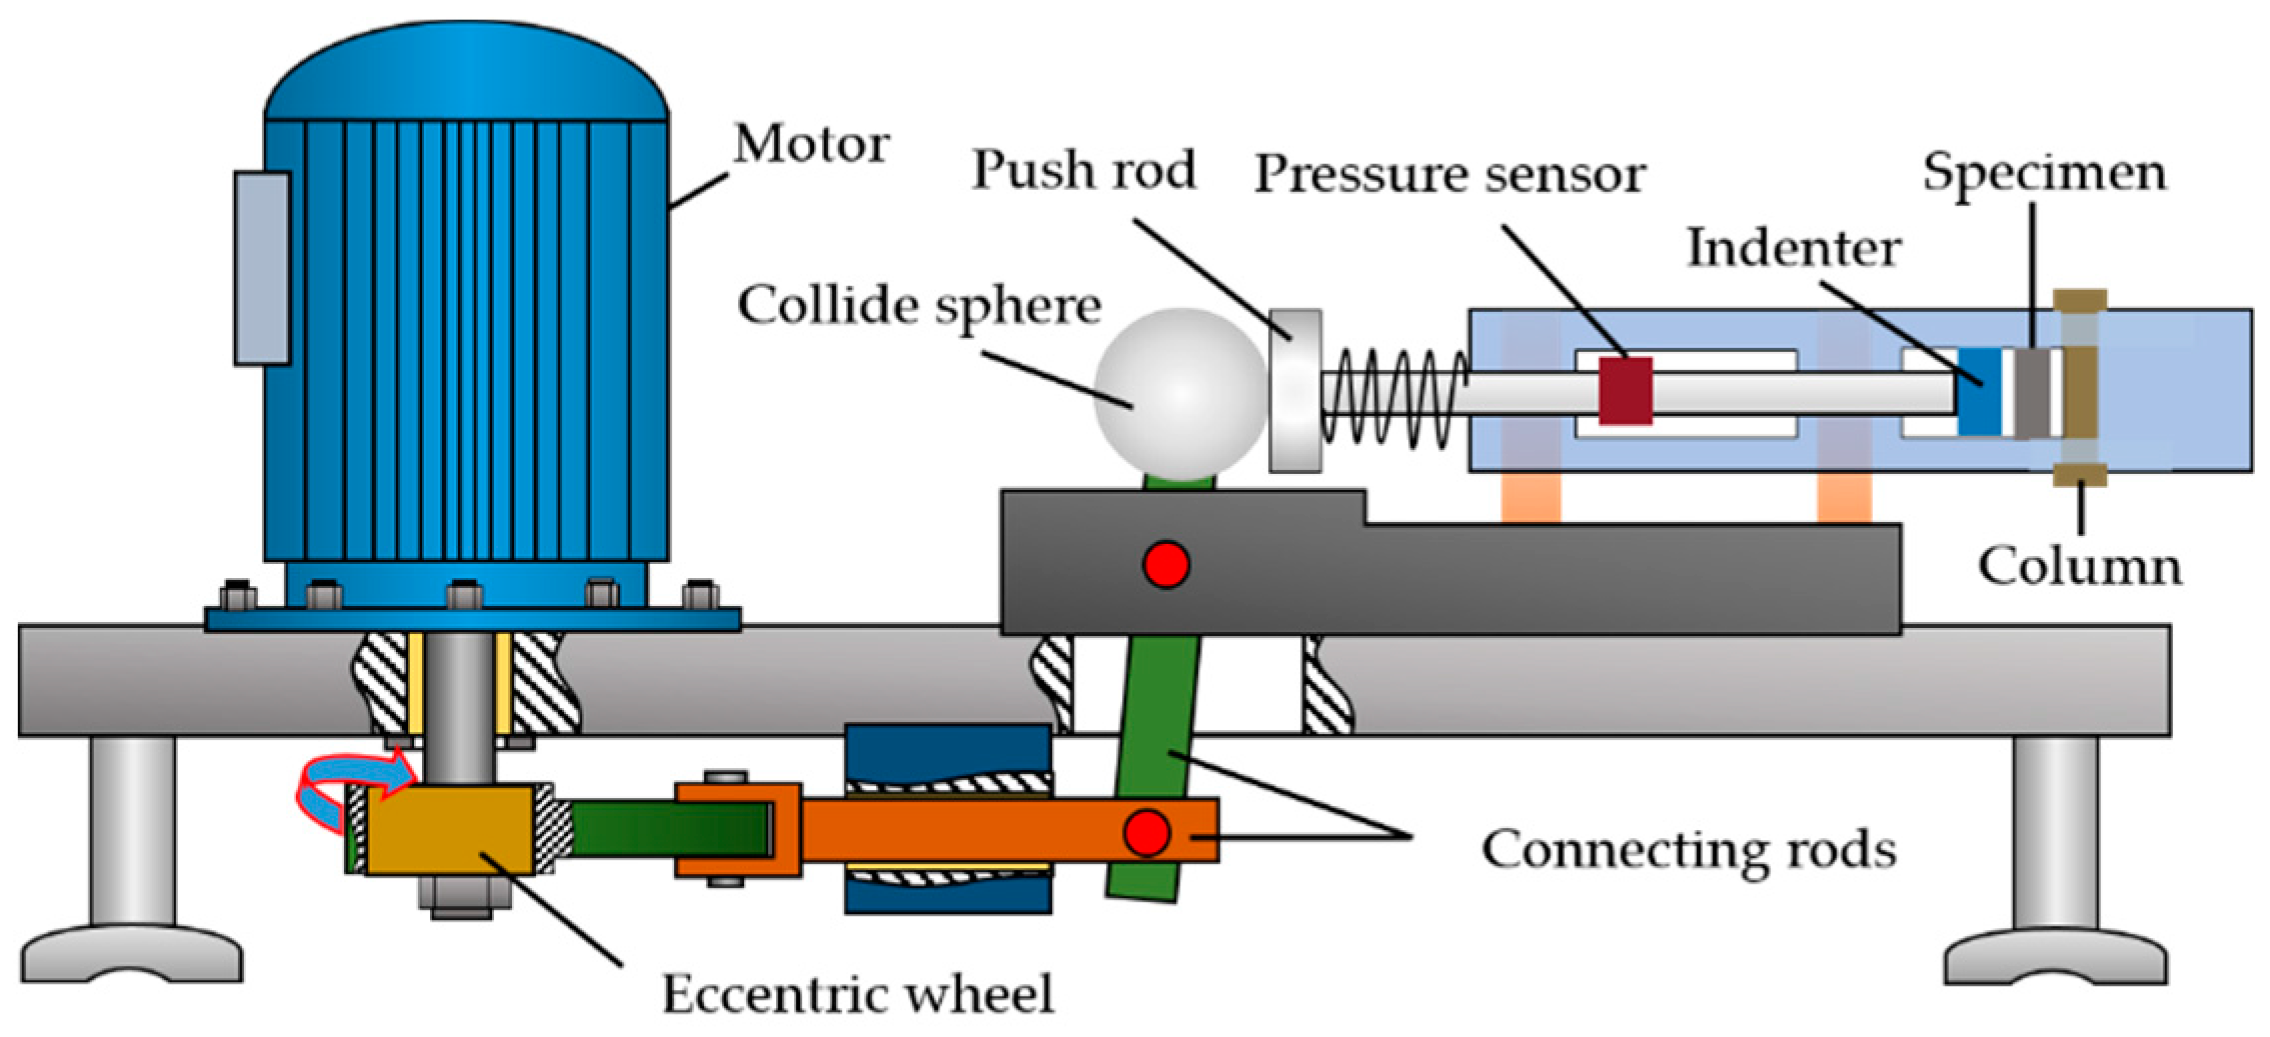
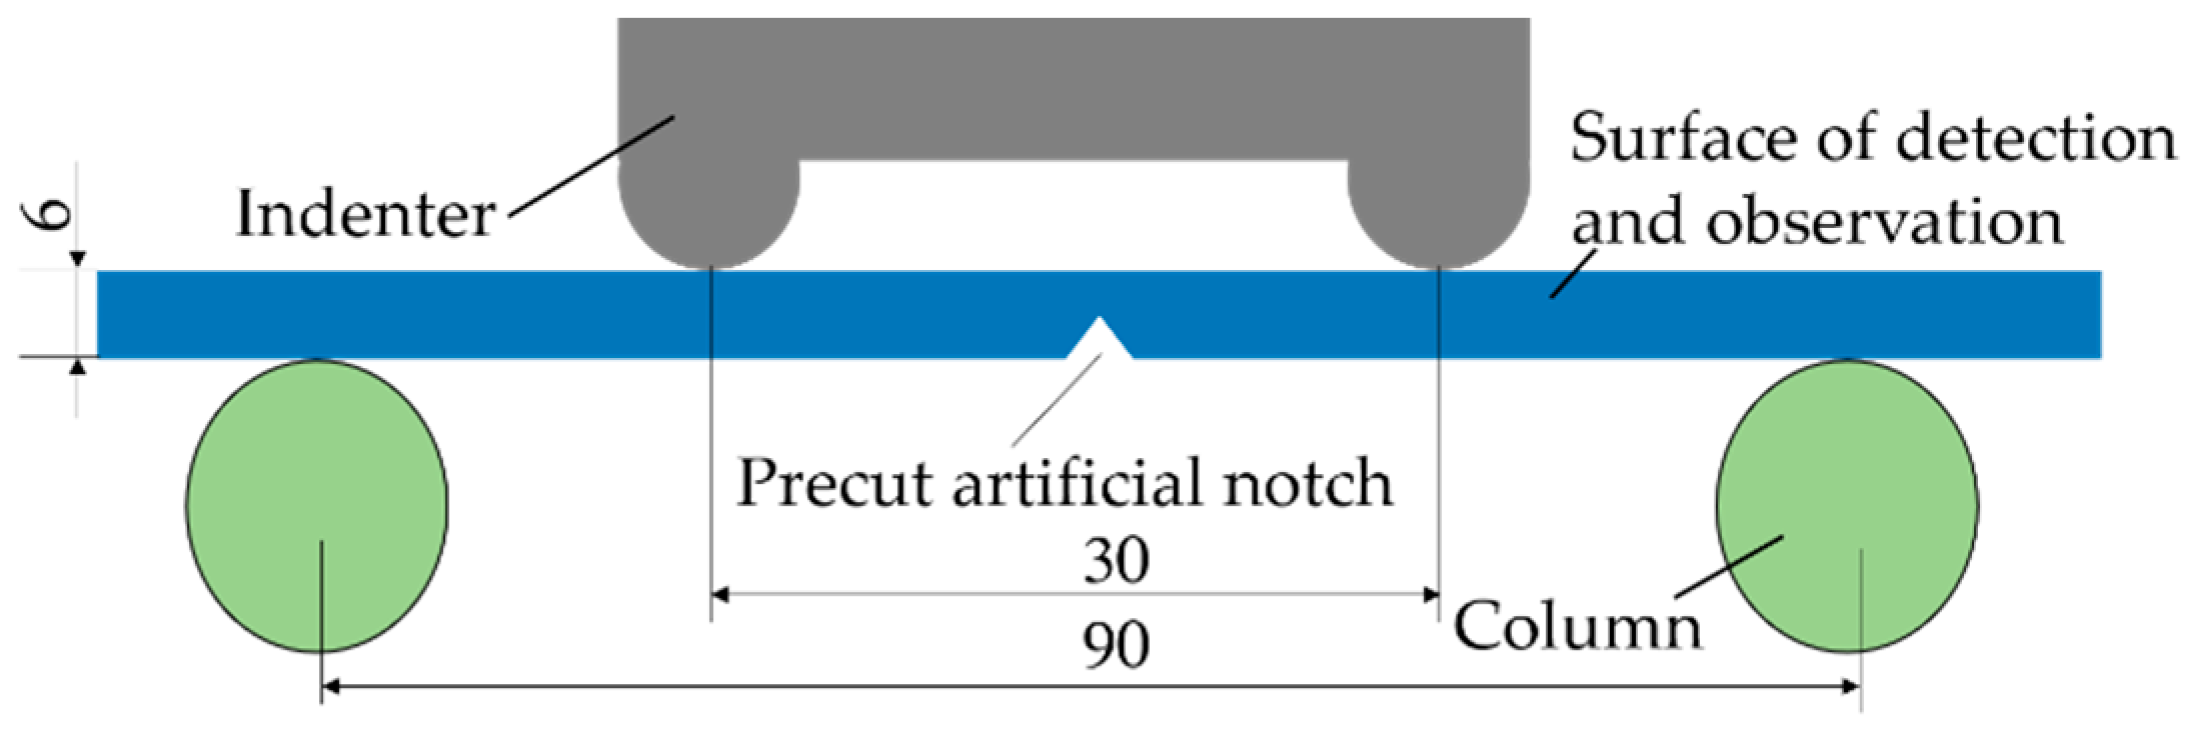
All fatigue tests were carried out on a homemade four-point bending fatigue testing machine. Figure 1 and Figure 2 are schematic diagrams of the experimental apparatus and loading, respectively. A constant amplitude fatigue test could be conducted on the test machine, whose eccentric wheel is driven by the motor, pushing colliding sphere to reciprocate back and forth. The indenter applied a load on the specimen under the action of a push rod. A pressure sensor was installed to monitor the pressure variation. The parts of the testing machine were made of non-magnetic materials to avoid interference from external magnetic field. The stress ratio “R” was zero, and frequency “f” was 5 Hz during the fatigue test.
Tangential and normal components of MMM signals, Hp(x) and Hp(y), were measured by large magneto-resistance sensors [13,14] along the south–north direction. The sensors were fixed on a 3D electrical scanning platform made of non-magnetic materials. The lift-off value between the sensors and the surface of specimen was 2 mm. During the detection, the moving velocity of the electric machine was 10 mm/s, and the sampling frequency was 500 Hz.
2.2. Specimen Preparation
The specimen was directly cut from a new full-size API five-inch drill pipe which was made of 35CrMo steel. As a typical material of drill pipe, 35CrMo steel not only has high yield strength and ultimate strength, but also has a good impact toughness value. Its chemical composition and mechanical properties are given in Table 1 and Table 2, and the mechanical properties are represented at a room temperature of 20 ± 4 °C. The geometry of the specimen is presented in Figure 3. A small precut artificial notch, which was 2 mm wide and 1.5 mm deep, was carefully cut by a linear cutting machine on the surface of the specimen. Testing path “S1” passed the top of the notch and was parallel to the center line. The effective testing distance “L” was 15 mm. In order to provide more realistic data for MMM technique which was applied to the damage of the drillstring, the specimen maintained the original magnetic field during the fatigue test.
2.3. Arrangement
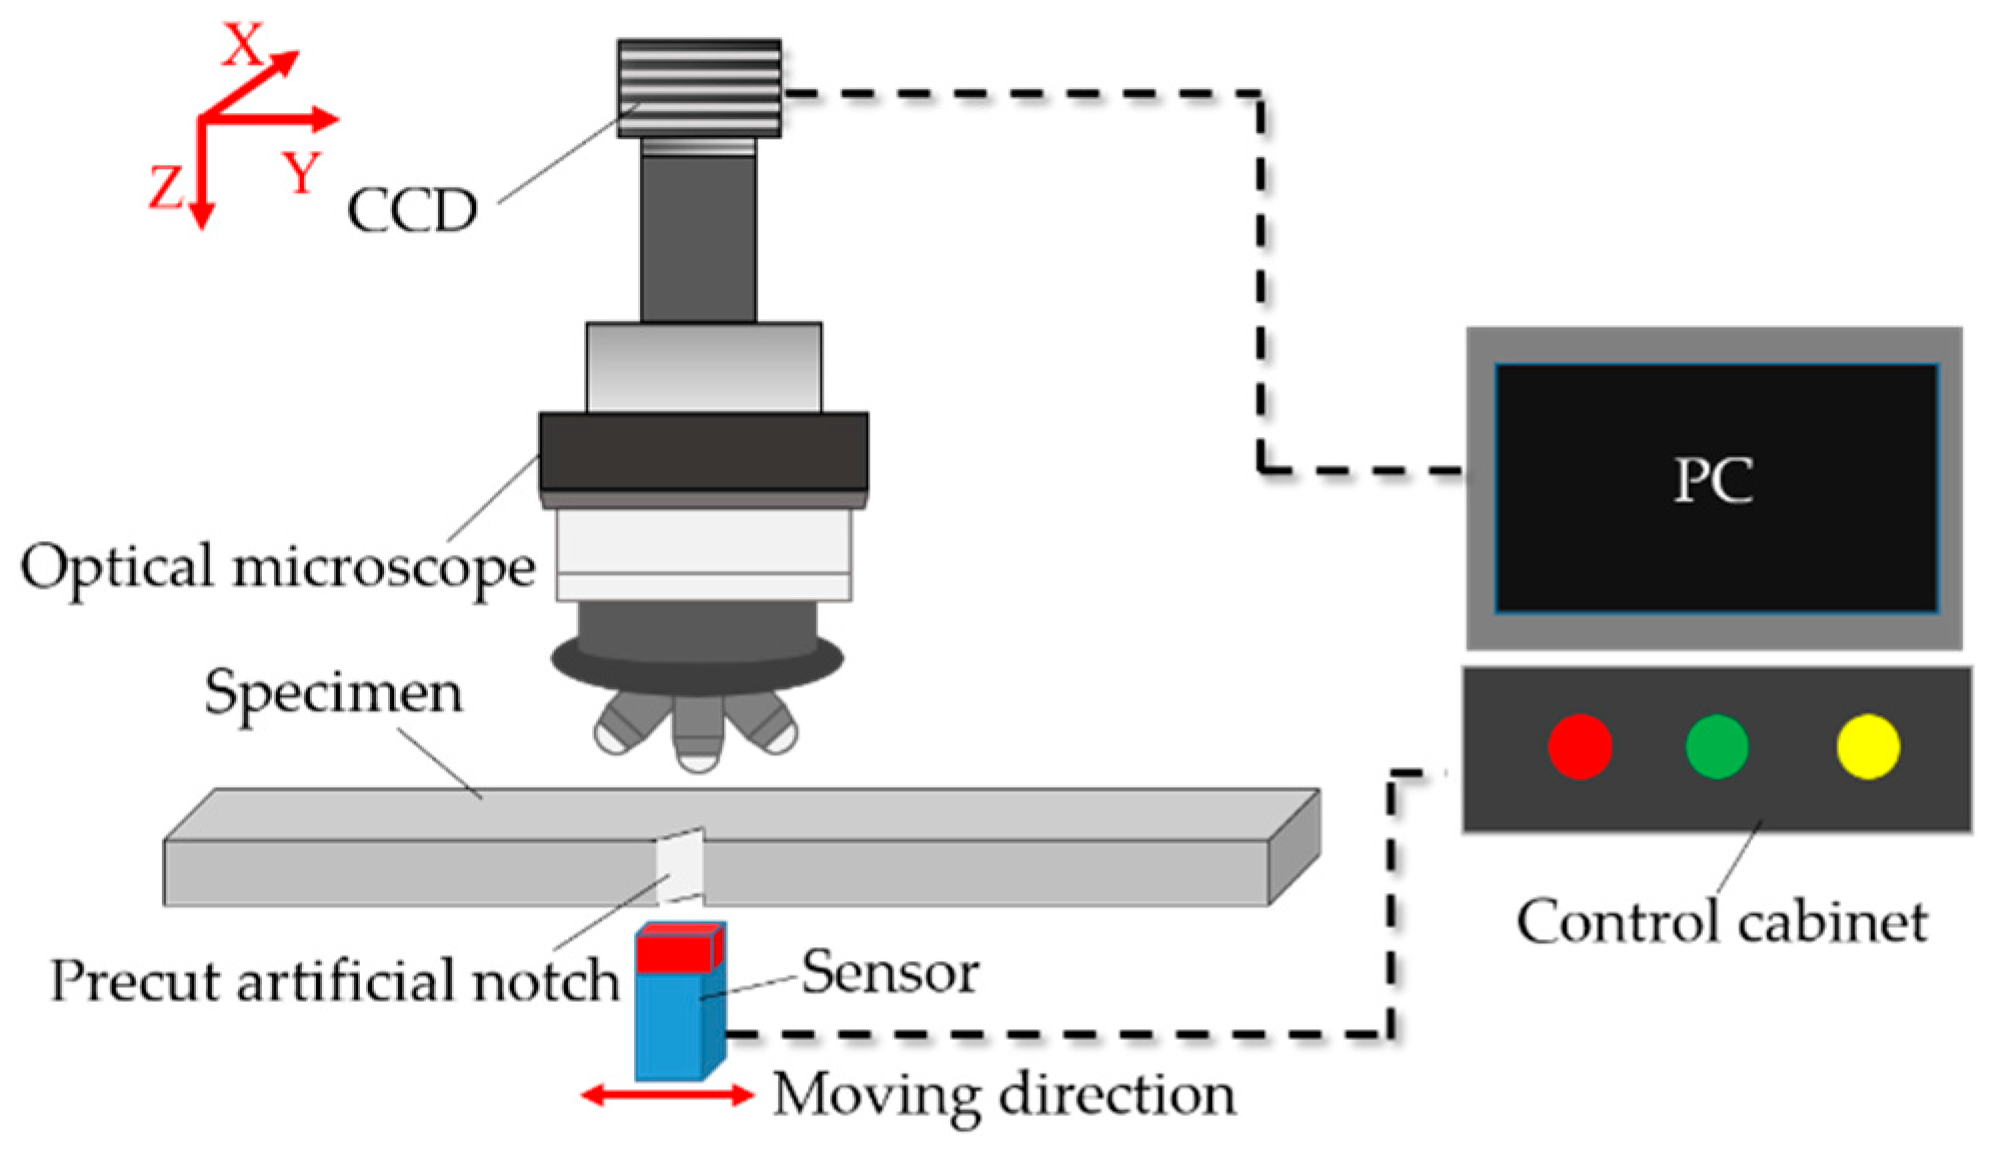
In order to observe the accumulation of plastic deformation and crack propagation on the surface of the specimen clearly, the surface of the specimen was polished with 1200 SiC paper and cleaned with ethanol and acetone prior to testing. The experiments were performed under the room temperature of 20 ± 4 °C with an ambient relative humidity of about 20 ± 5%. At the beginning of the test, the number of cycles for detection was 1 and 300. After the fatigue cycles reached 1000, the interval cycles of detection changed to 2000. The morphology of the specimen’s surface was observed with an optical microscope and a CCD camera. Meanwhile, MMM signals of the specimen surface were detected by sensor which can do reciprocating motion by use of control cabinet, as shown in Figure 4. The fatigue crack length was measured by the same scale. After the completion of the test, the crack propagation path was analyzed by scanning electron microscopy (SEM). Additionally, in order to study the crack mechanism, the metallographical structure of the specimen surface was observed. Before observation, the surface near the notch was etched in 4% nital solution at a room temperature of 20 ± 4 °C after polishing and then observed under an optical microscope.
3. Results and Discussion
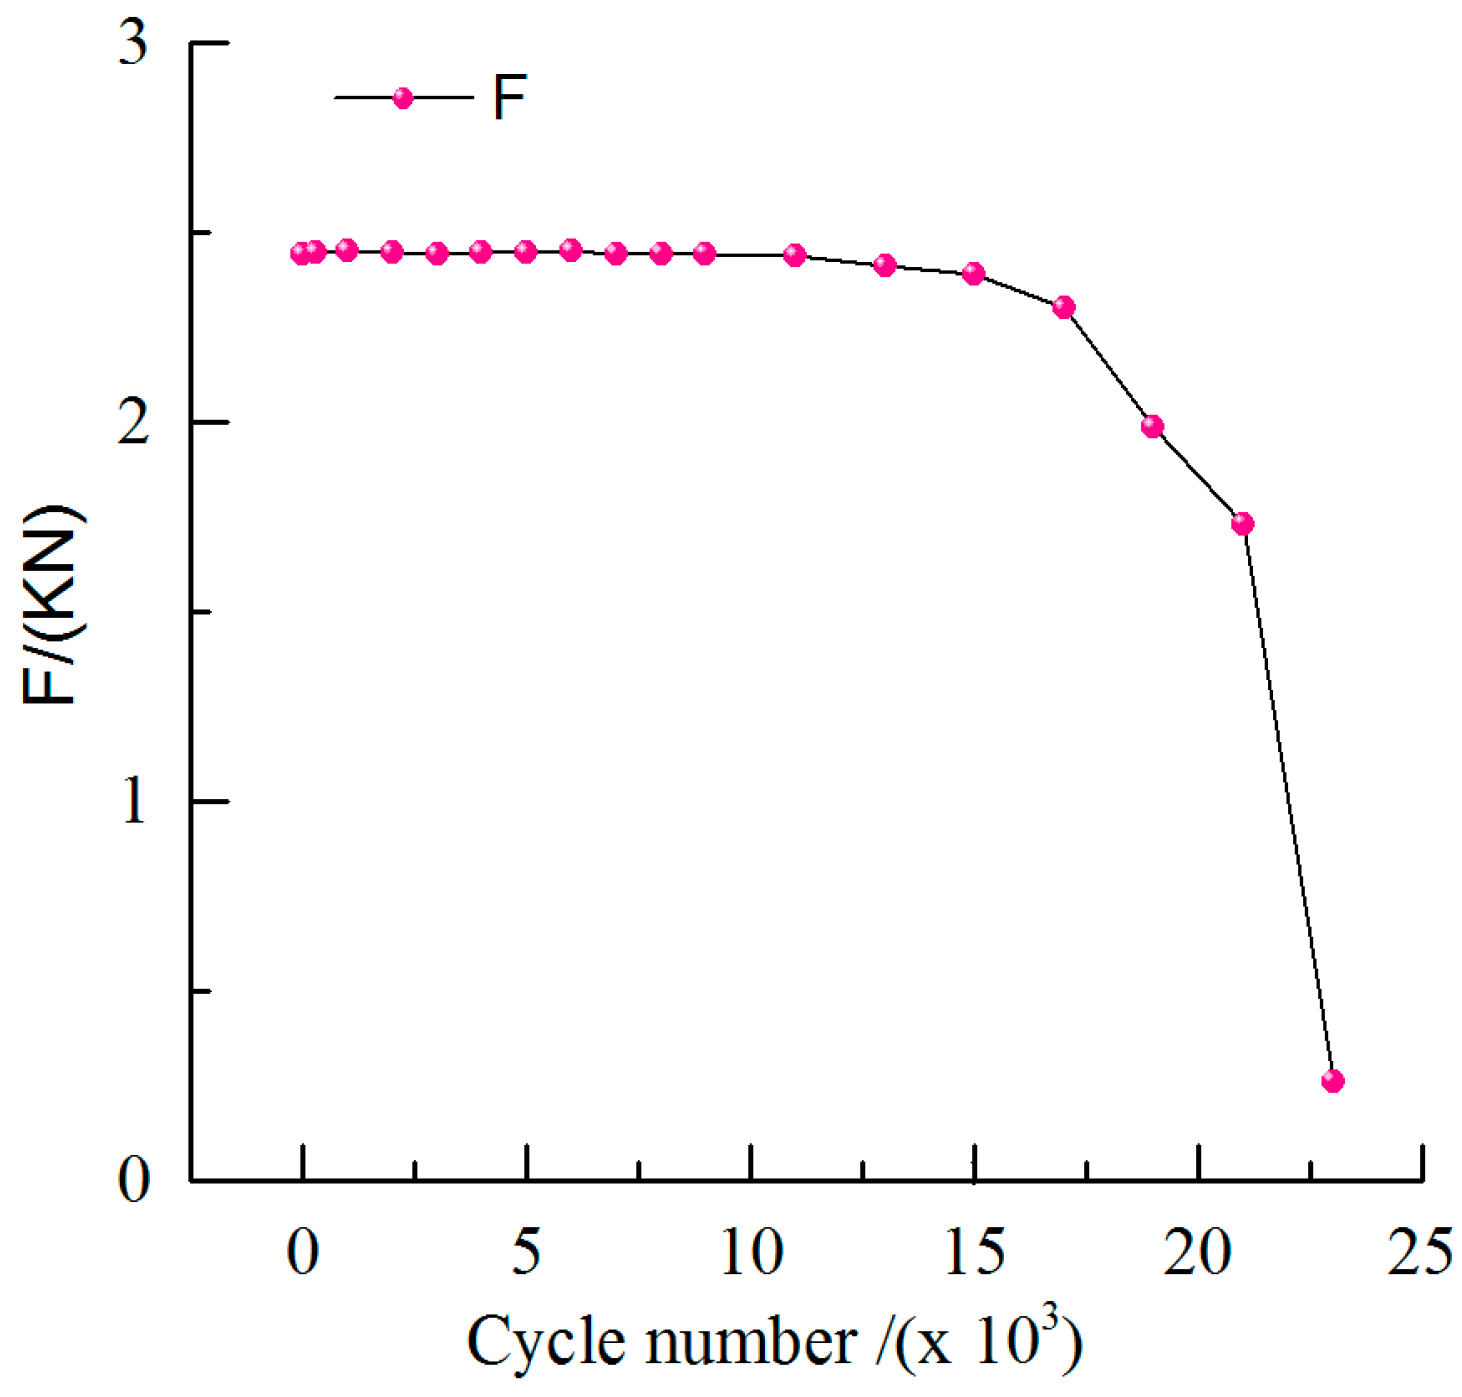
Three specimens were tested, and the results of them were similar. One of them was taken for instance, and a crack was initiated at 7000 cycles. The variation of maximum loading value “F” at different fatigue cycles is shown in Figure 5. At the beginning of fatigue test, “F” was stable. After 7000 cycles, fatigue crack initiated and fatigue specimen had obvious irreversible bending deformation. Under the condition of constant displacement loading, “F” value began to reduce. With the crack propagation, the downward trend of the “F” value became apparent, and the “F” value decreased in an accelerated manner when the fatigue specimen was approaching fracture after 19,000 cycles.
3.1. Morphology of the Specimen’s Surface
During the fatigue process, the results of the CCD camera at different cycles are shown in Figure 6. A picture was taken as a reference before the test (Figure 6a). It can be seen from Figure 6 that the variation of morphology on the specimen’s surface during the whole fatigue process could be divided into approximately three stages: the initial stage (before 300 cycles), the steady stage (300 to 7000 cycles), and the crack propagation stage (after 7000 cycles). In the initial stage, plastic deformation appeared and intensified significantly as the number of fatigue cycles increased (Figure 6a–c). Dislocation densities had an approximate linear relationship with the plastic deformation [26,27], so the increase of plastic deformation represented the accumulation of dislocation. After 300 cycles, dislocation blockings [22] near the notch appeared after the rapid accumulation of plastic deformation in the initial stage, and plastic deformation stopped growing rapidly (Figure 6c,d). The coalescence of growing dislocations resulted in crack initiation in the maximal stress concentration area, as shown in Figure 6e. There were many microcracks formed by plastic deformation accumulation around the main crack propagation path at the early stage of crack propagation (Figure 6f) and, afterward, the length of the crack grew steadily with the increase in the number of fatigue cycles (Figure 6g). The fatigue specimen had severe irreversible bending deformation when approaching fracture (Figure 6h).
The morphologies of fatigue fracture through SEM are shown in Figure 7. The crack propagation path is shown by the arrows in Figure 7a and it also shows the general view of the fracture surfaces [28,29] indicating the areas for (i) crack initiation (CI); (ii) fatigue crack growth, and propagation (CGP), and final fracture (FF). At the end of fatigue crack growth and propagation, the surface of the fracture was rough in Figure 7a. This was because when crack propagation was close to the critical dimension, the residual section of the specimen was not enough to withstand the load, fatigue crack entered rapid propagation until final fracture [30]. As shown in Figure 7b, the striation pattern could be used to distinguish between fatigue crack initiation and crack propagation, regarded as one of the main features for crack propagation [31]. The length “d” of the rack initiation zone along the crack propagation path was about 20 μm, which confirmed the fatigue crack initiation at the surface/sub-surface [29]. Fatigue striations and the secondary crack were observed at the crack propagation zone in Figure 7d,e. The final fracture surface had an obvious ductile dimpled morphology (Figure 7f), which confirmed that 35CrMo was a ductile material.
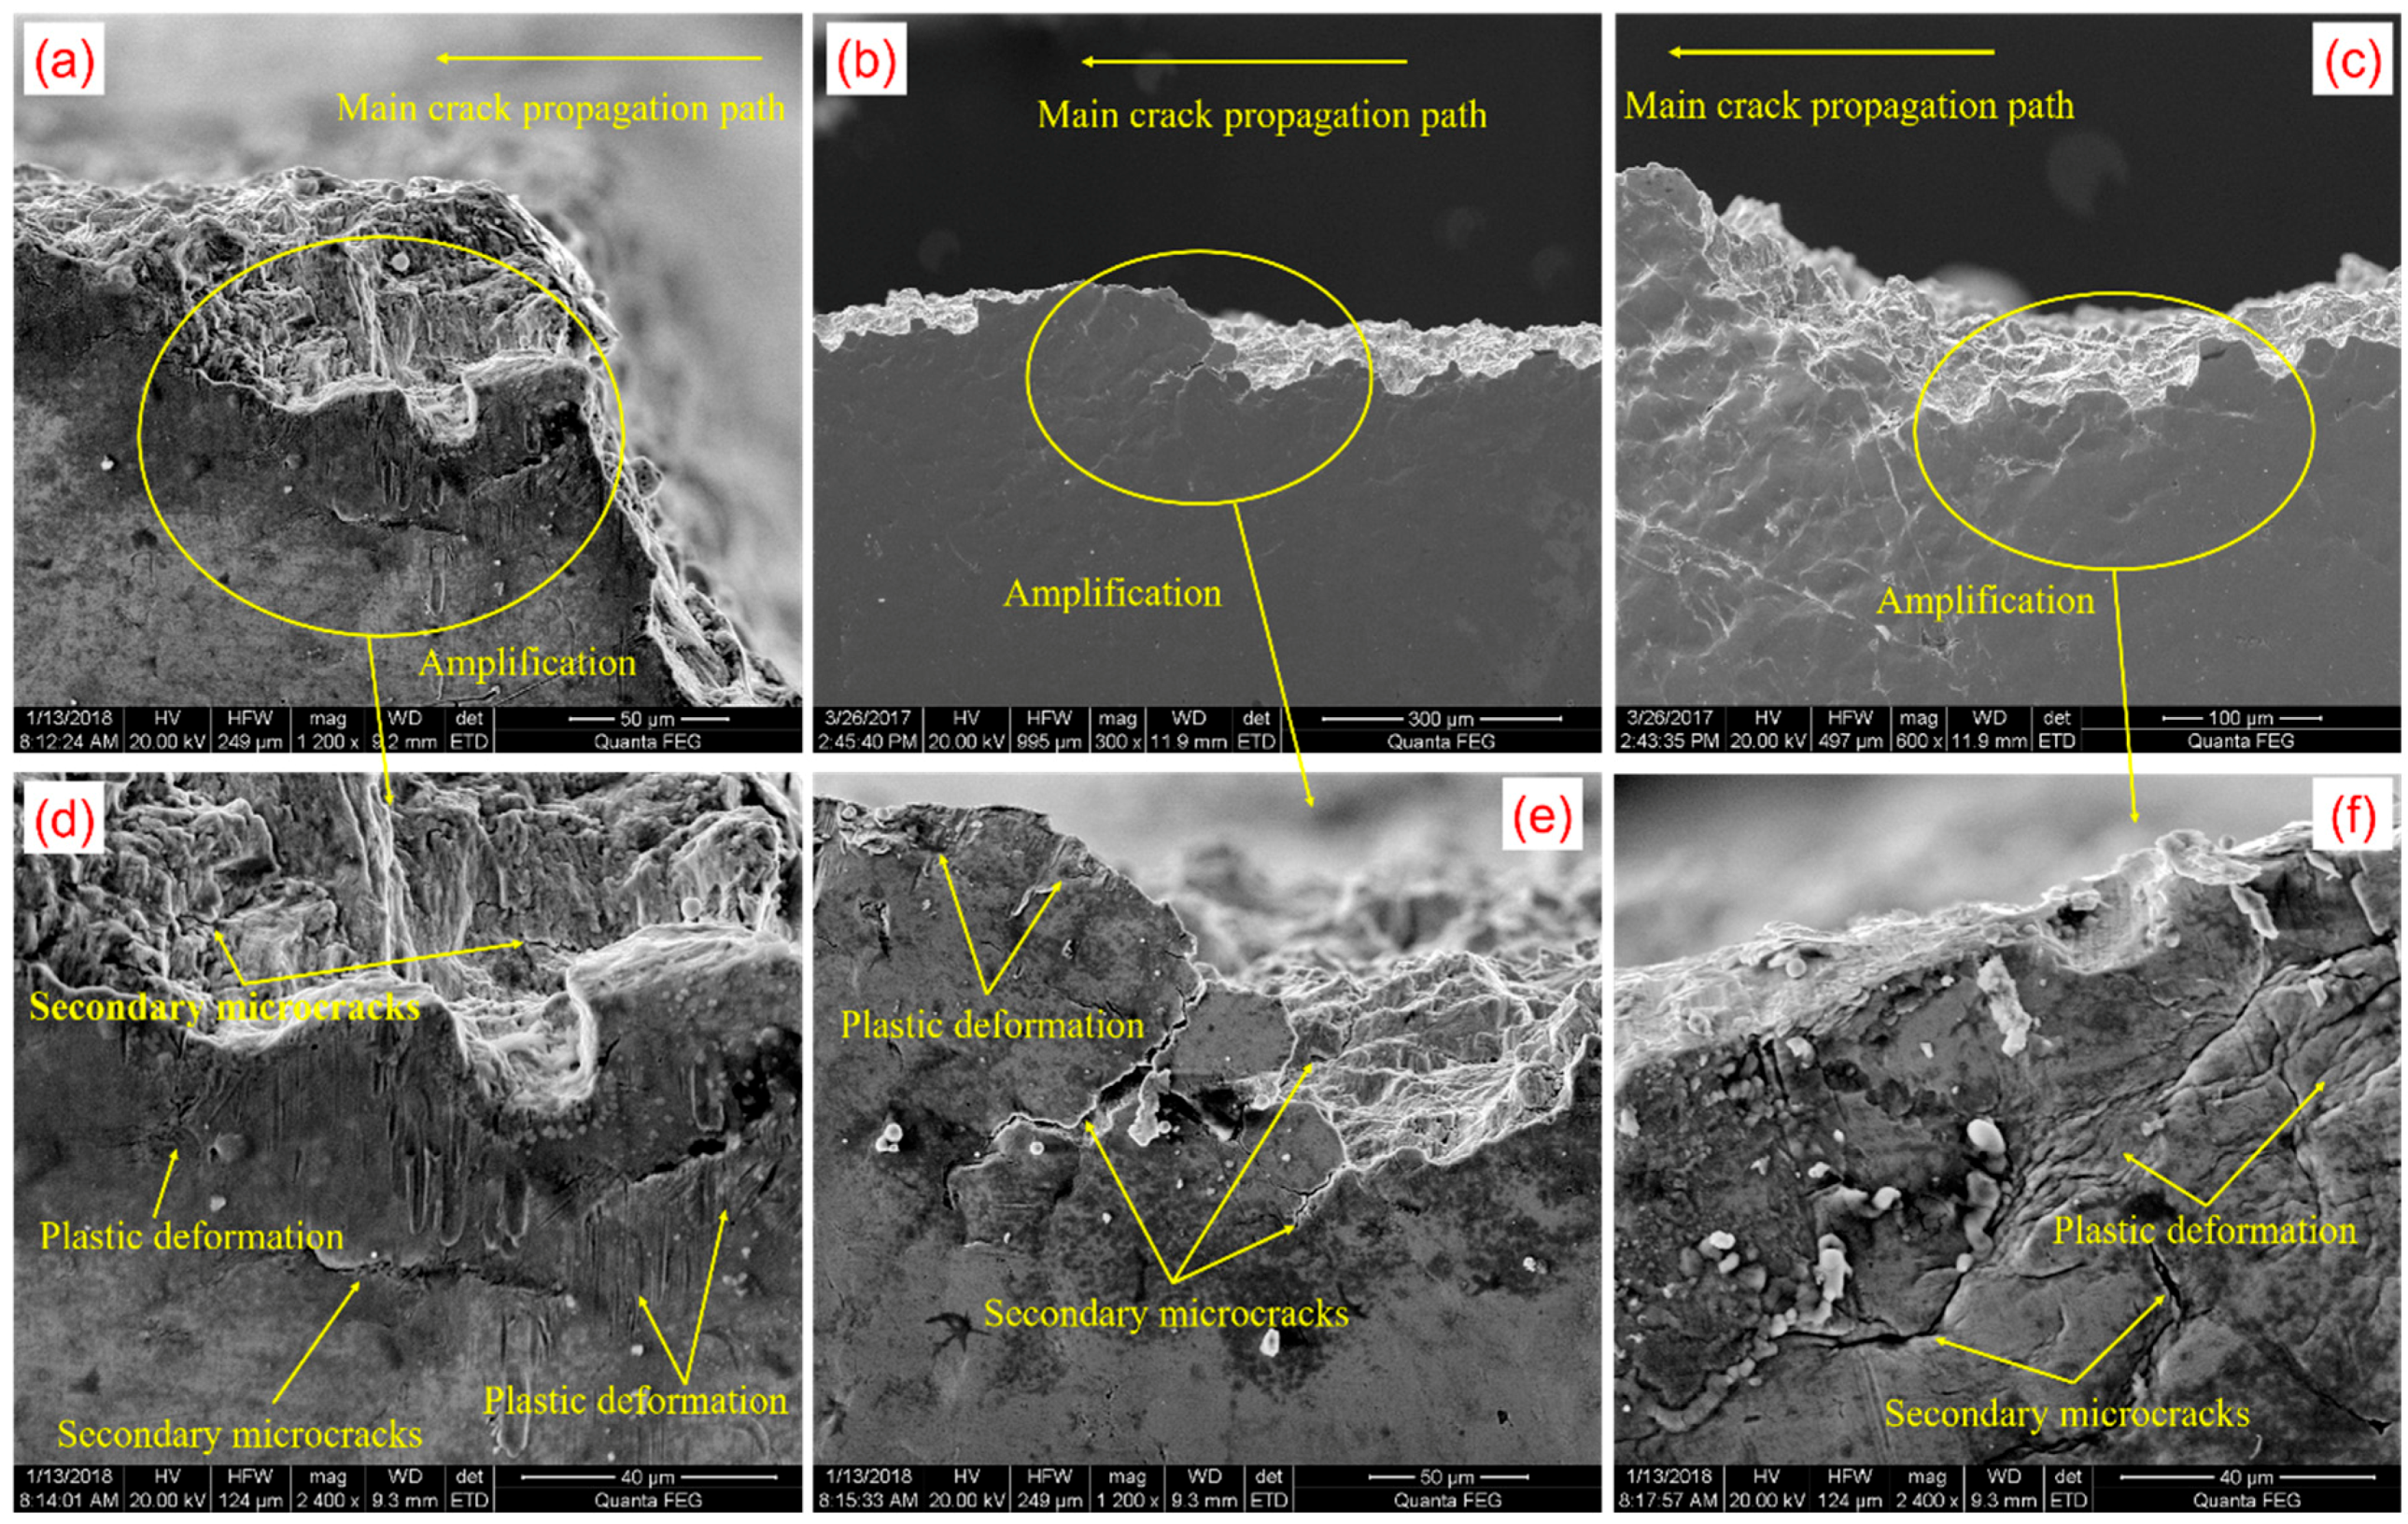
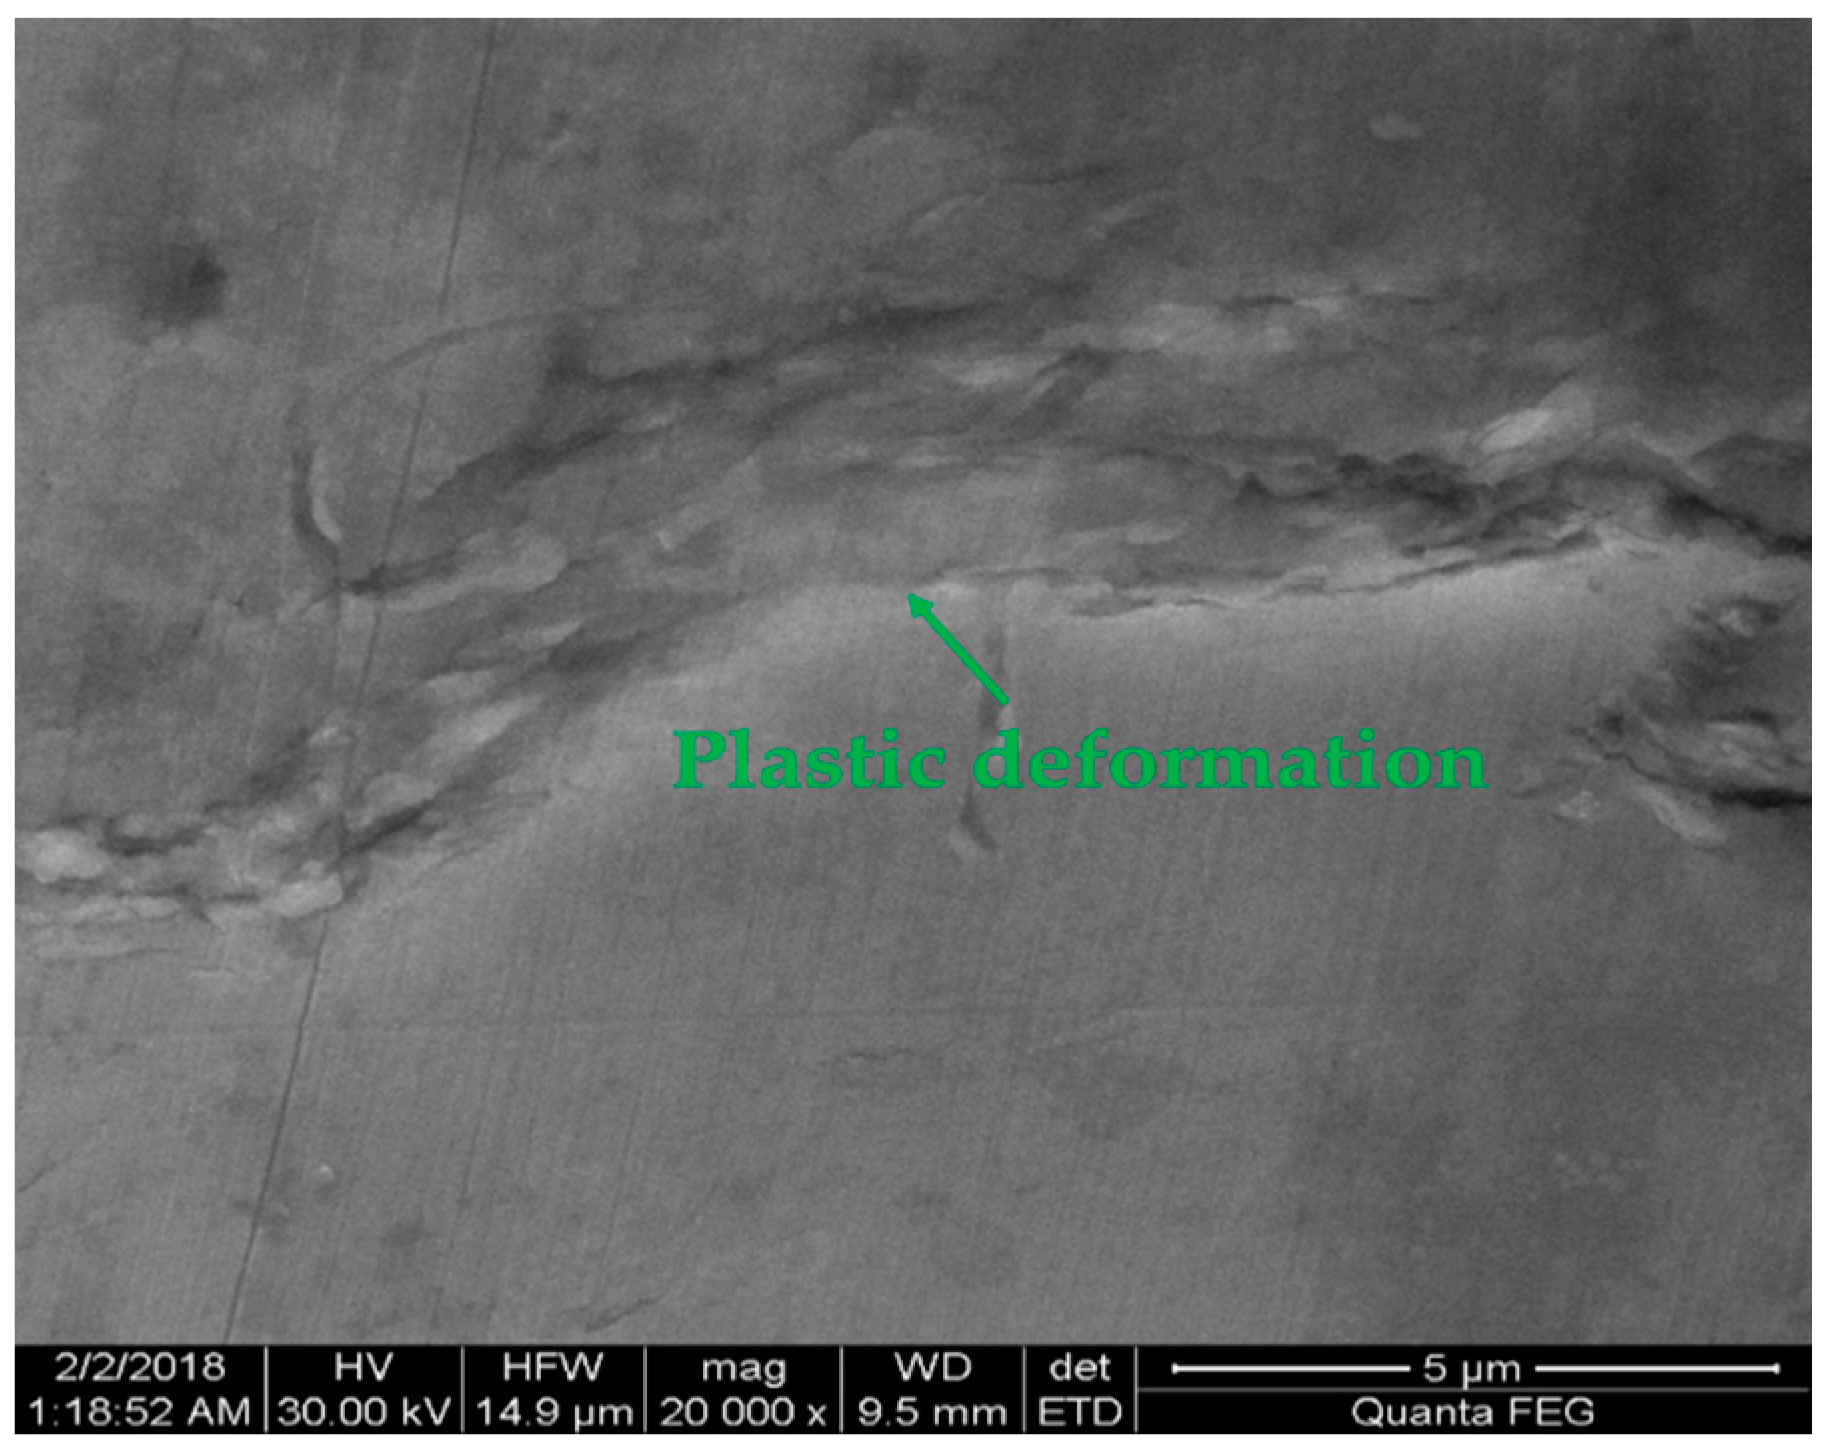
The specimen’s surface was observed along the crack propagation path by SEM at high magnification (Figure 8), and the results showed that there were a large number of secondary microcracks and plastic deformation along the main crack propagation path after specimen fracture, which demonstrated that the specimen’s surface morphology after crack initiation included both the plastic deformation and microcracks in Figure 6e–h. The morphology of crack initiation zone (Figure 8d) was caused by including the fatigue accumulation before the crack initiation (Figure 6a–d) and early crack propagation (Figure 6f), in which the fatigue accumulation at the early crack propagation (Figure 6f) led to the formation of secondary microcracks in crack initiation zone (Figure 8d). In addition, the specimen’s surface away from the crack initiation zone had obvious plastic deformation in Figure 9, where there were no microcracks, which indicated that the variation of the specimen surface morphology before crack initiation (Figure 6a–d) was caused by plastic deformation accumulation again. This was because the surface morphology away from the crack initiation zone was less affected by fatigue accumulation after crack initiation, which was preserved as the variation of the surface morphology before the crack initiation. The final fracture zone had a large amount of plastic deformation accumulation and secondary microcracks (Figure 8c,f), which were caused by the severe irreversible bending deformation in Figure 6h.
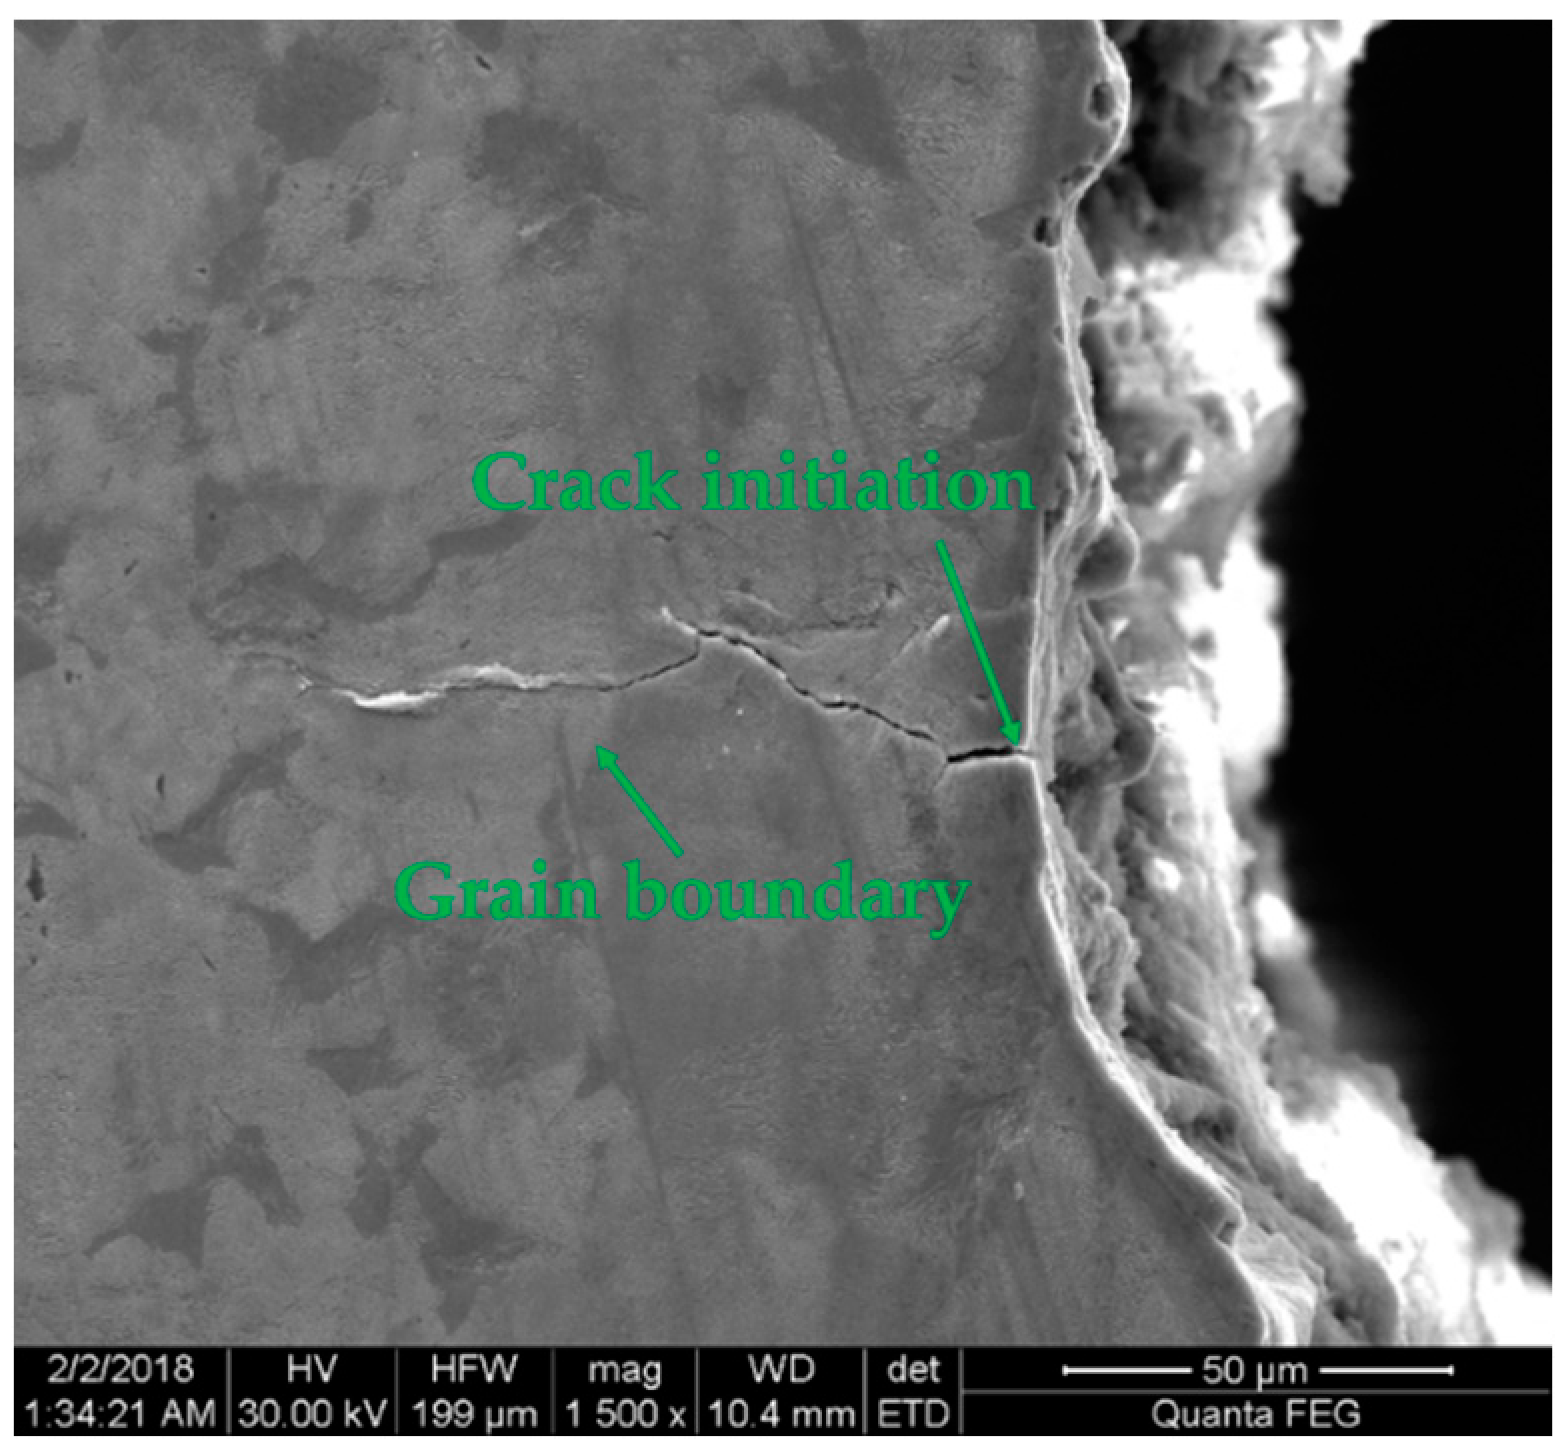
Figure 10 shows the metallographic structures near the notch after crack initiation. The fatigue test condition was the same as the above, and the crack initiated at 6800 cycles. The crack propagation path went through the lattice in Figure 10, which indicated that the crack mechanism was transcrystalline rupture.
3.2. MMM Signals
3.2.1. Before and after Loading
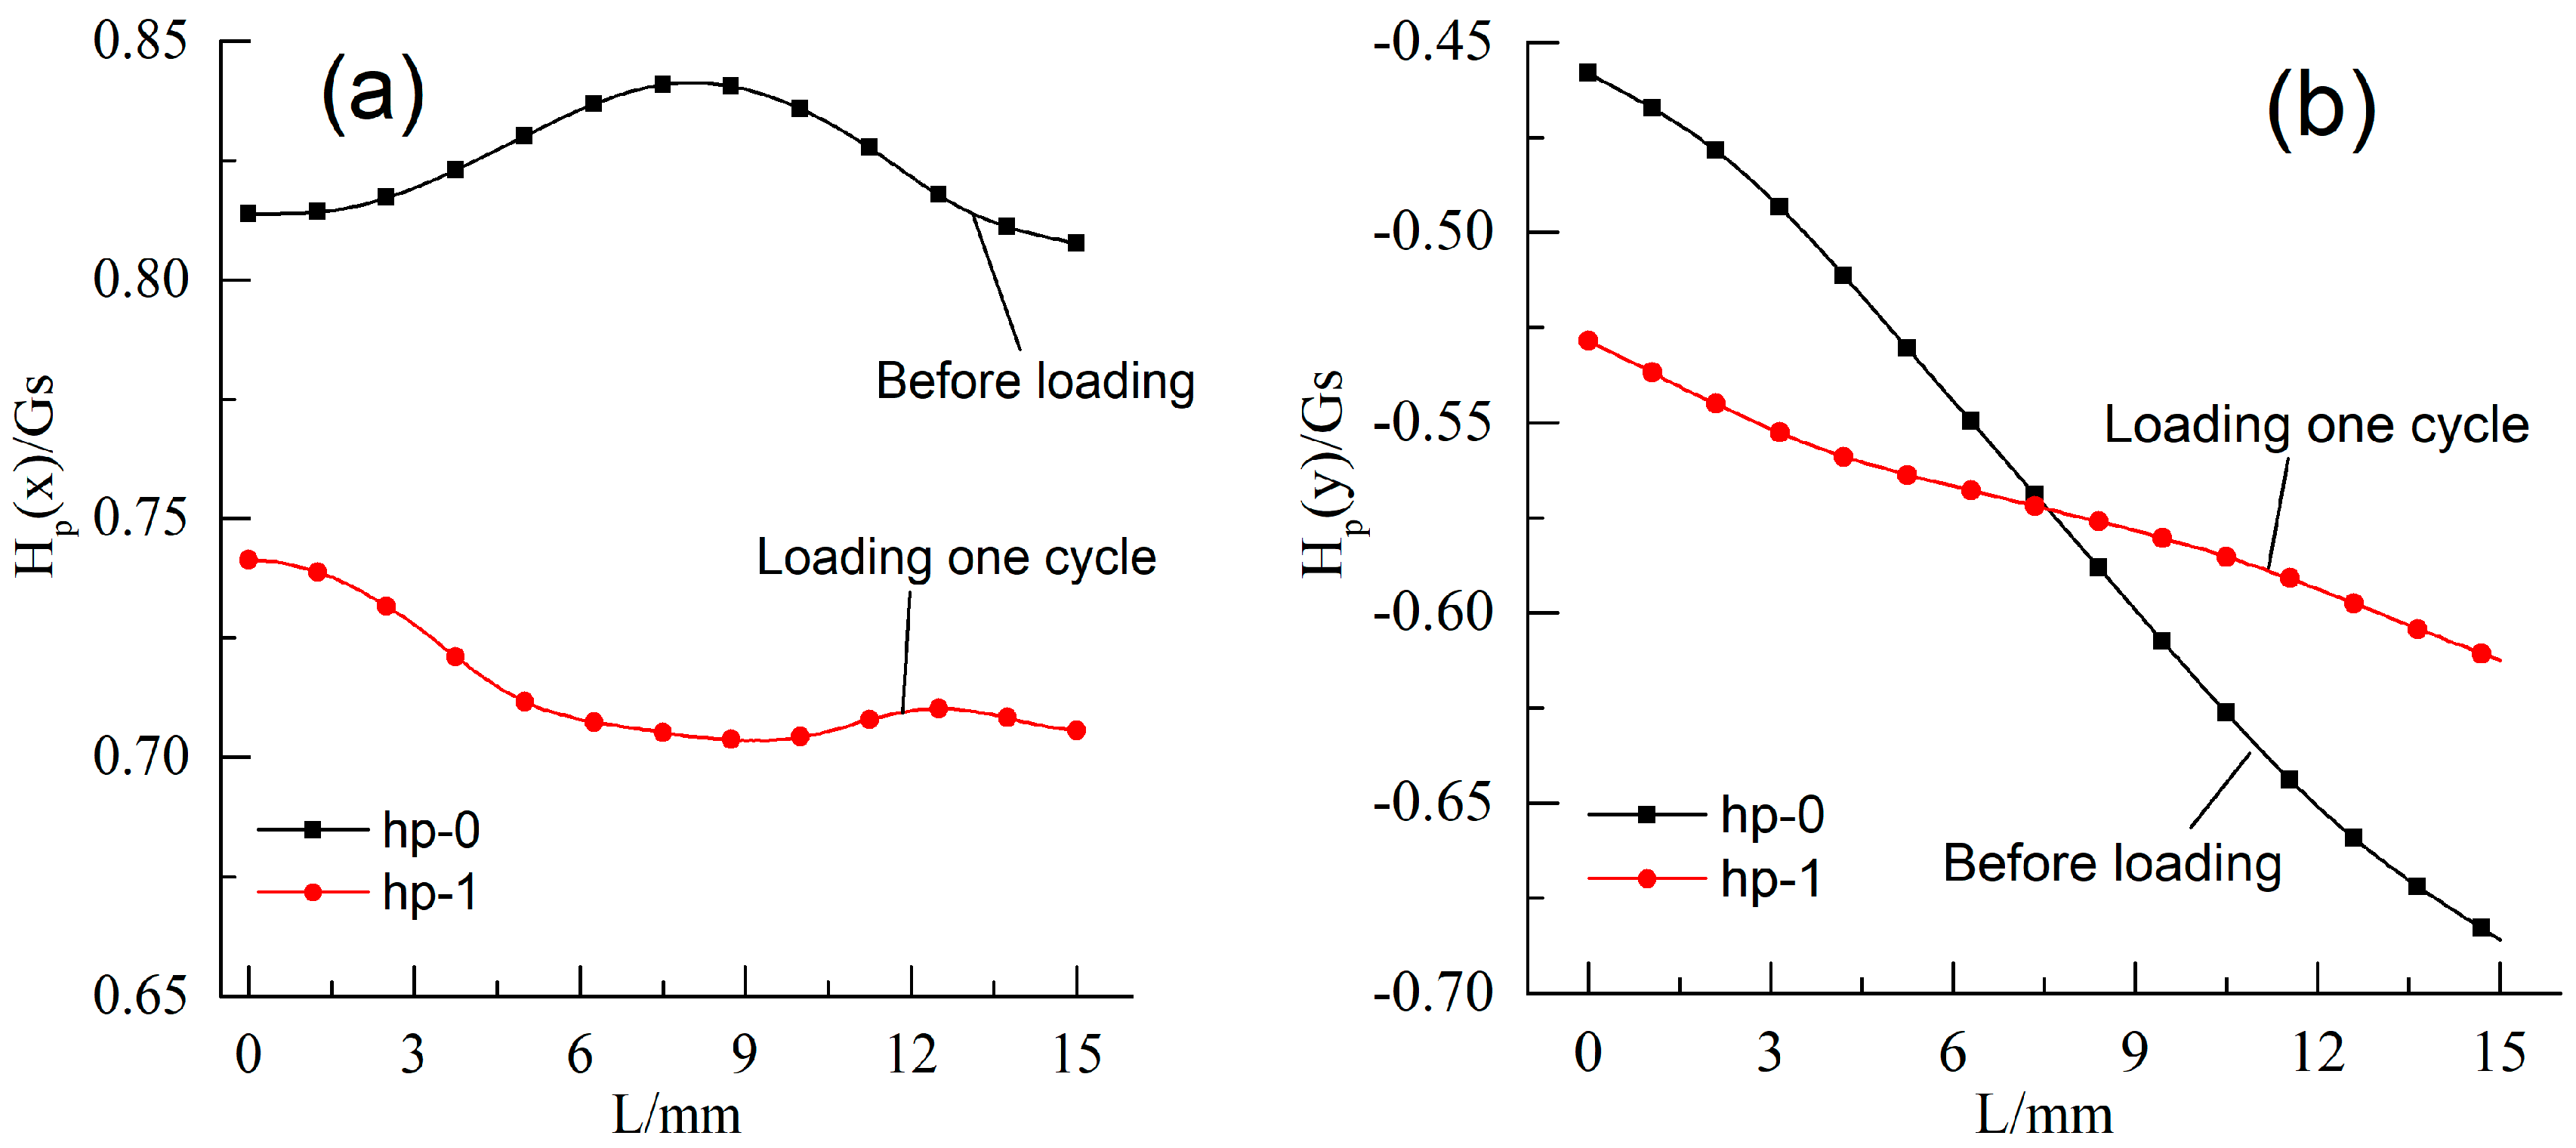
Figure 11 shows the distributions of Hp(x) and Hp(y) of the specimen before and after loading. Before loading, the initial Hp(x) signal curve had a peak at the notch. The initial Hp(y) signal curve had a peak and a trough near the notch, with the peak on the left and the trough on the right. After loading one cycle, the peak of Hp(x) signals changed into trough, and the Hp(x) signal curve declined rapidly. The peak and trough of Hp(y) signal curve exchanged the curve features, and the Hp(y) signal curve rotated counterclockwise significantly.
3.2.2. Cyclic Procedure
Cracks were initiated at 7000 cycles, and afterwards they entered the propagation stage. The Hp(x) and Hp(y) signal curves corresponding to different fatigue cycles are shown in Figure 12 and Figure 13. It can be seen that two parts, the curves before crack propagation and the ones after crack propagation, were used to show the variations of the Hp(x) and Hp(y) signal curves clearly during the whole fatigue cycle.
As indicated in Figure 12a and Figure 13a, all Hp(x) signals exhibited a consistent tendency during the fatigue process. Each curve had a trough at the notch. Hp(x) signal curves declined dramatically before 300 cycles with the increase of fatigue cycles. After that, Hp(x) signal curves were stable from 300 to 7000 cycles. When the fatigue crack initiated and entered the crack propagation stage, the Hp(x) signal curves continued to decrease. After 19,000 cycles, Hp(x) signal curves decreased in an accelerated manner.
The Hp(y) signal curves were also shown in Figure 12b and Figure 13b. Each curve had a peak and a trough near the notch with the trough on the left and the peak on the right. The curves rotated counterclockwise significantly with the increase of the fatigue cycles before 300 cycles. After that, the Hp(y) signal curves were stable from 300 to 7000 cycles with the increase of fatigue cycles. When fatigue cycles reached 9000 cycles, fatigue crack had entered propagation stage, and the Hp(y) curves continued to rotate counterclockwise quickly, while the features of the peak and the trough were more obvious. After 19,000 cycles, Hp(y) signal curves accelerated to rotate counterclockwise.
3.3. MMM Signal Characteristics
3.3.1. Variation of MMM Signal Characteristics during the Fatigue Process
To analyze the variation of MMM signals during four-point bending fatigue test profoundly, the characteristics of Hp(x) and Hp(y), the gradient of the Hp(x) signal curves at the notch, K(x) for short, the gradient of the Hp(y) signal curves between the peak and the trough, K(y) for short, and the minimal value of the Hp(x) signal curves, Hp(x)min for short, were extracted, respectively. K(x), K(y), K(x)max, K(y)max, and Hp(x)min are defined Equations (1)–(5), as follows:
where Hp(x)M and Hp(x)N are the Hp(x) signal values at the sampling points of “M” and “N”, respectively, K(x)max and K(y)max are the maximal values of the absolute values of K(x) and K(y), respectively, and “i” is the serial number of K(x), K(y), and Hp(x).
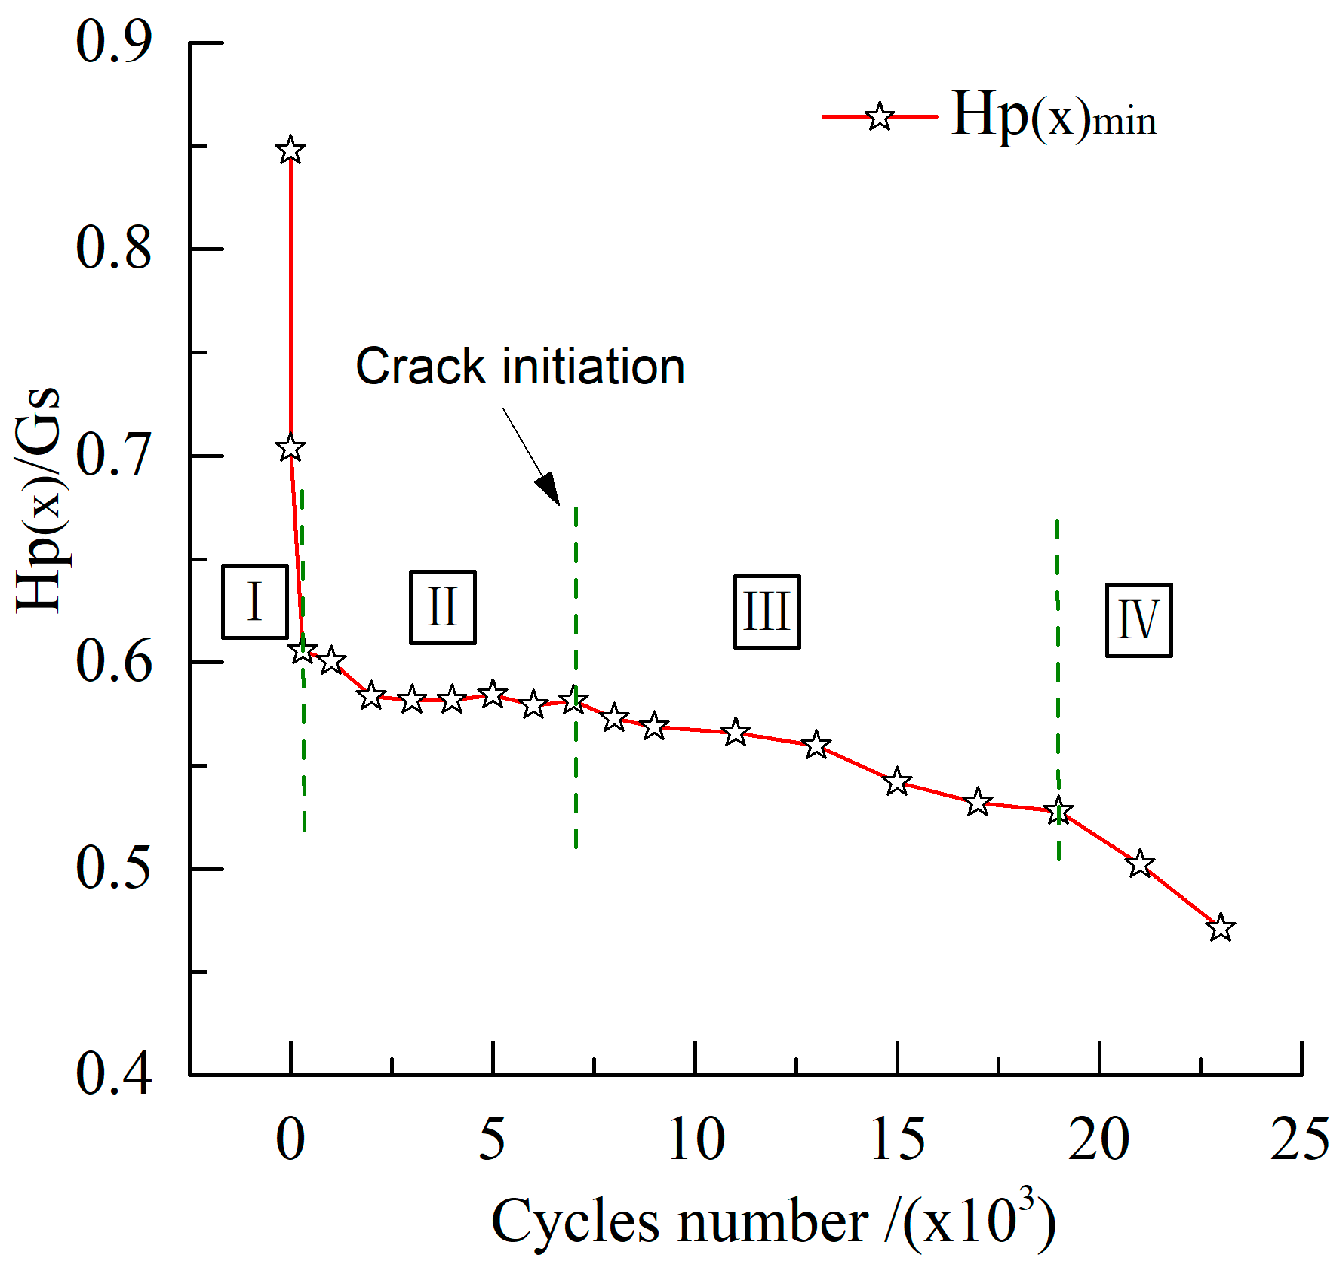
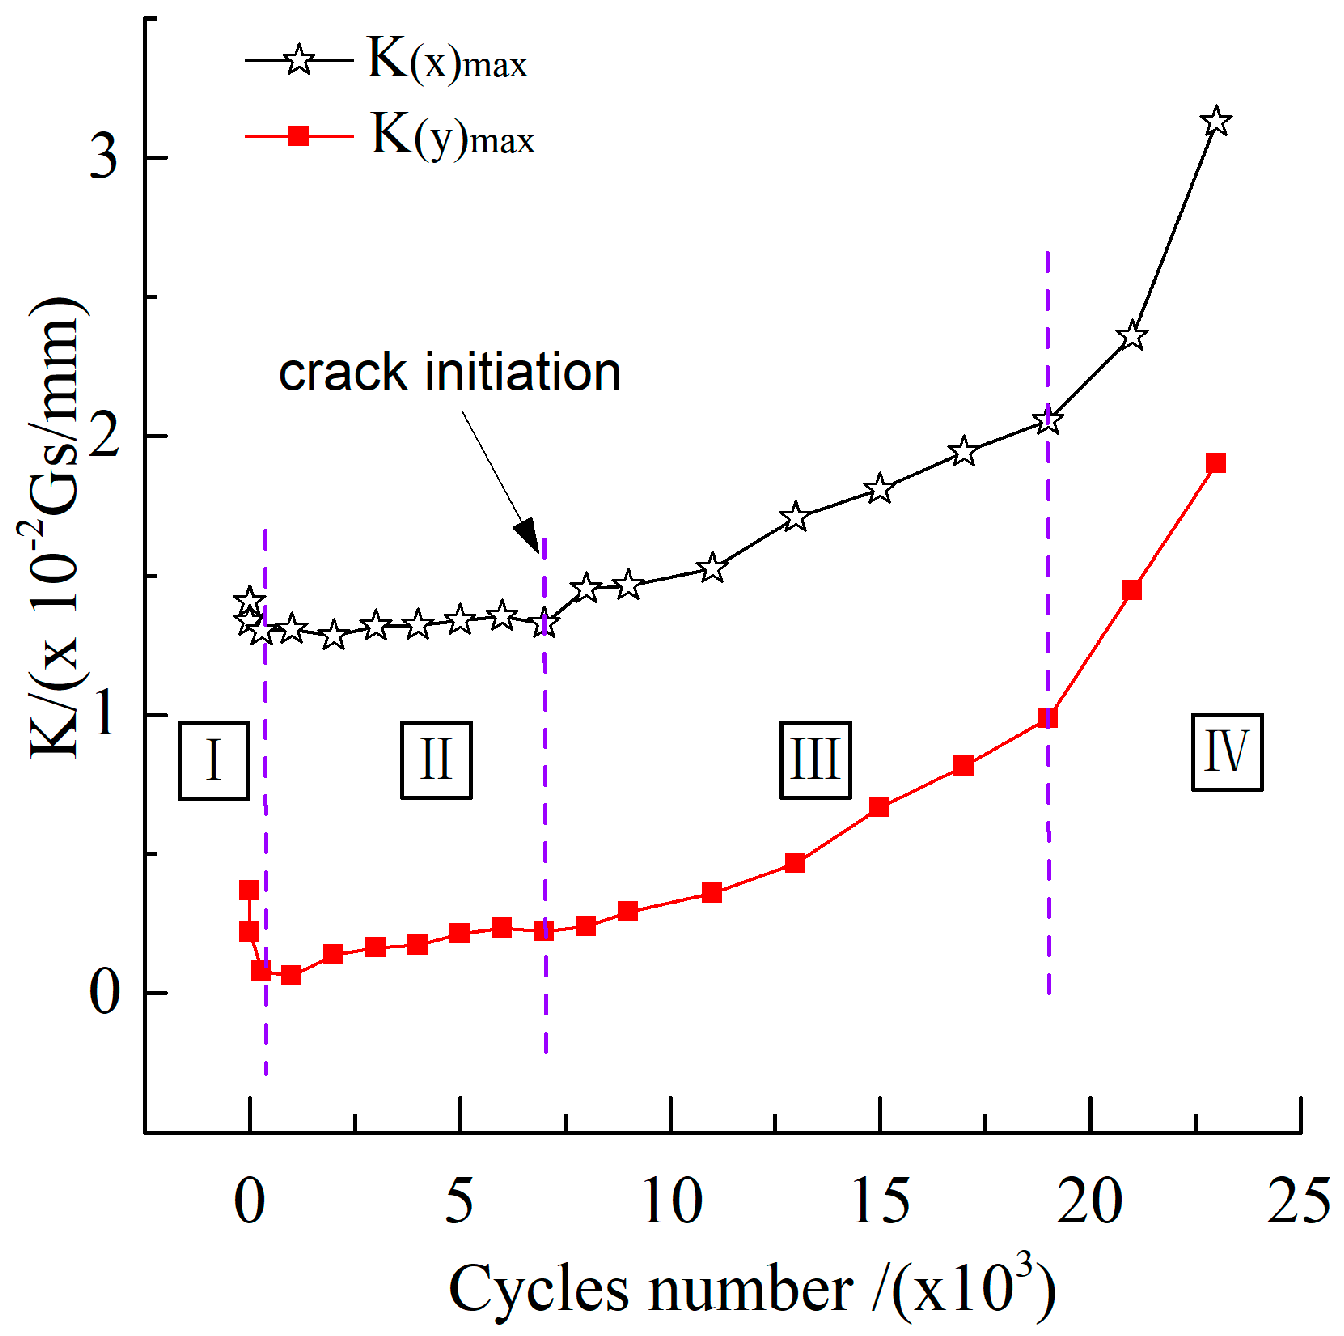
As shown in Figure 14 and Figure 15, the variation of Hp(x)min, K(x)max and K(y)max at different fatigue cycles could be divided into four stages:
- The initial stage I (1 to 300 cycles),
- The steady stage II (300 to 7000 cycles),
- The steady growth stage III (7000 to 19,000 cycles), and
- The rapid growth stage IV (19,000 to 23,000 cycles).
In the initial stage, the characteristics declined significantly with the increase of the fatigue cycles. After that, they became stable in the steady stage. After crack initiation, the K(x)max and K(y)max values began to increase, while Hp(x)min values continued to decline. When approaching fracture, the K(x)max and K(y)max values accelerated, while the Hp(x)min values declined in the rapid growth stage.
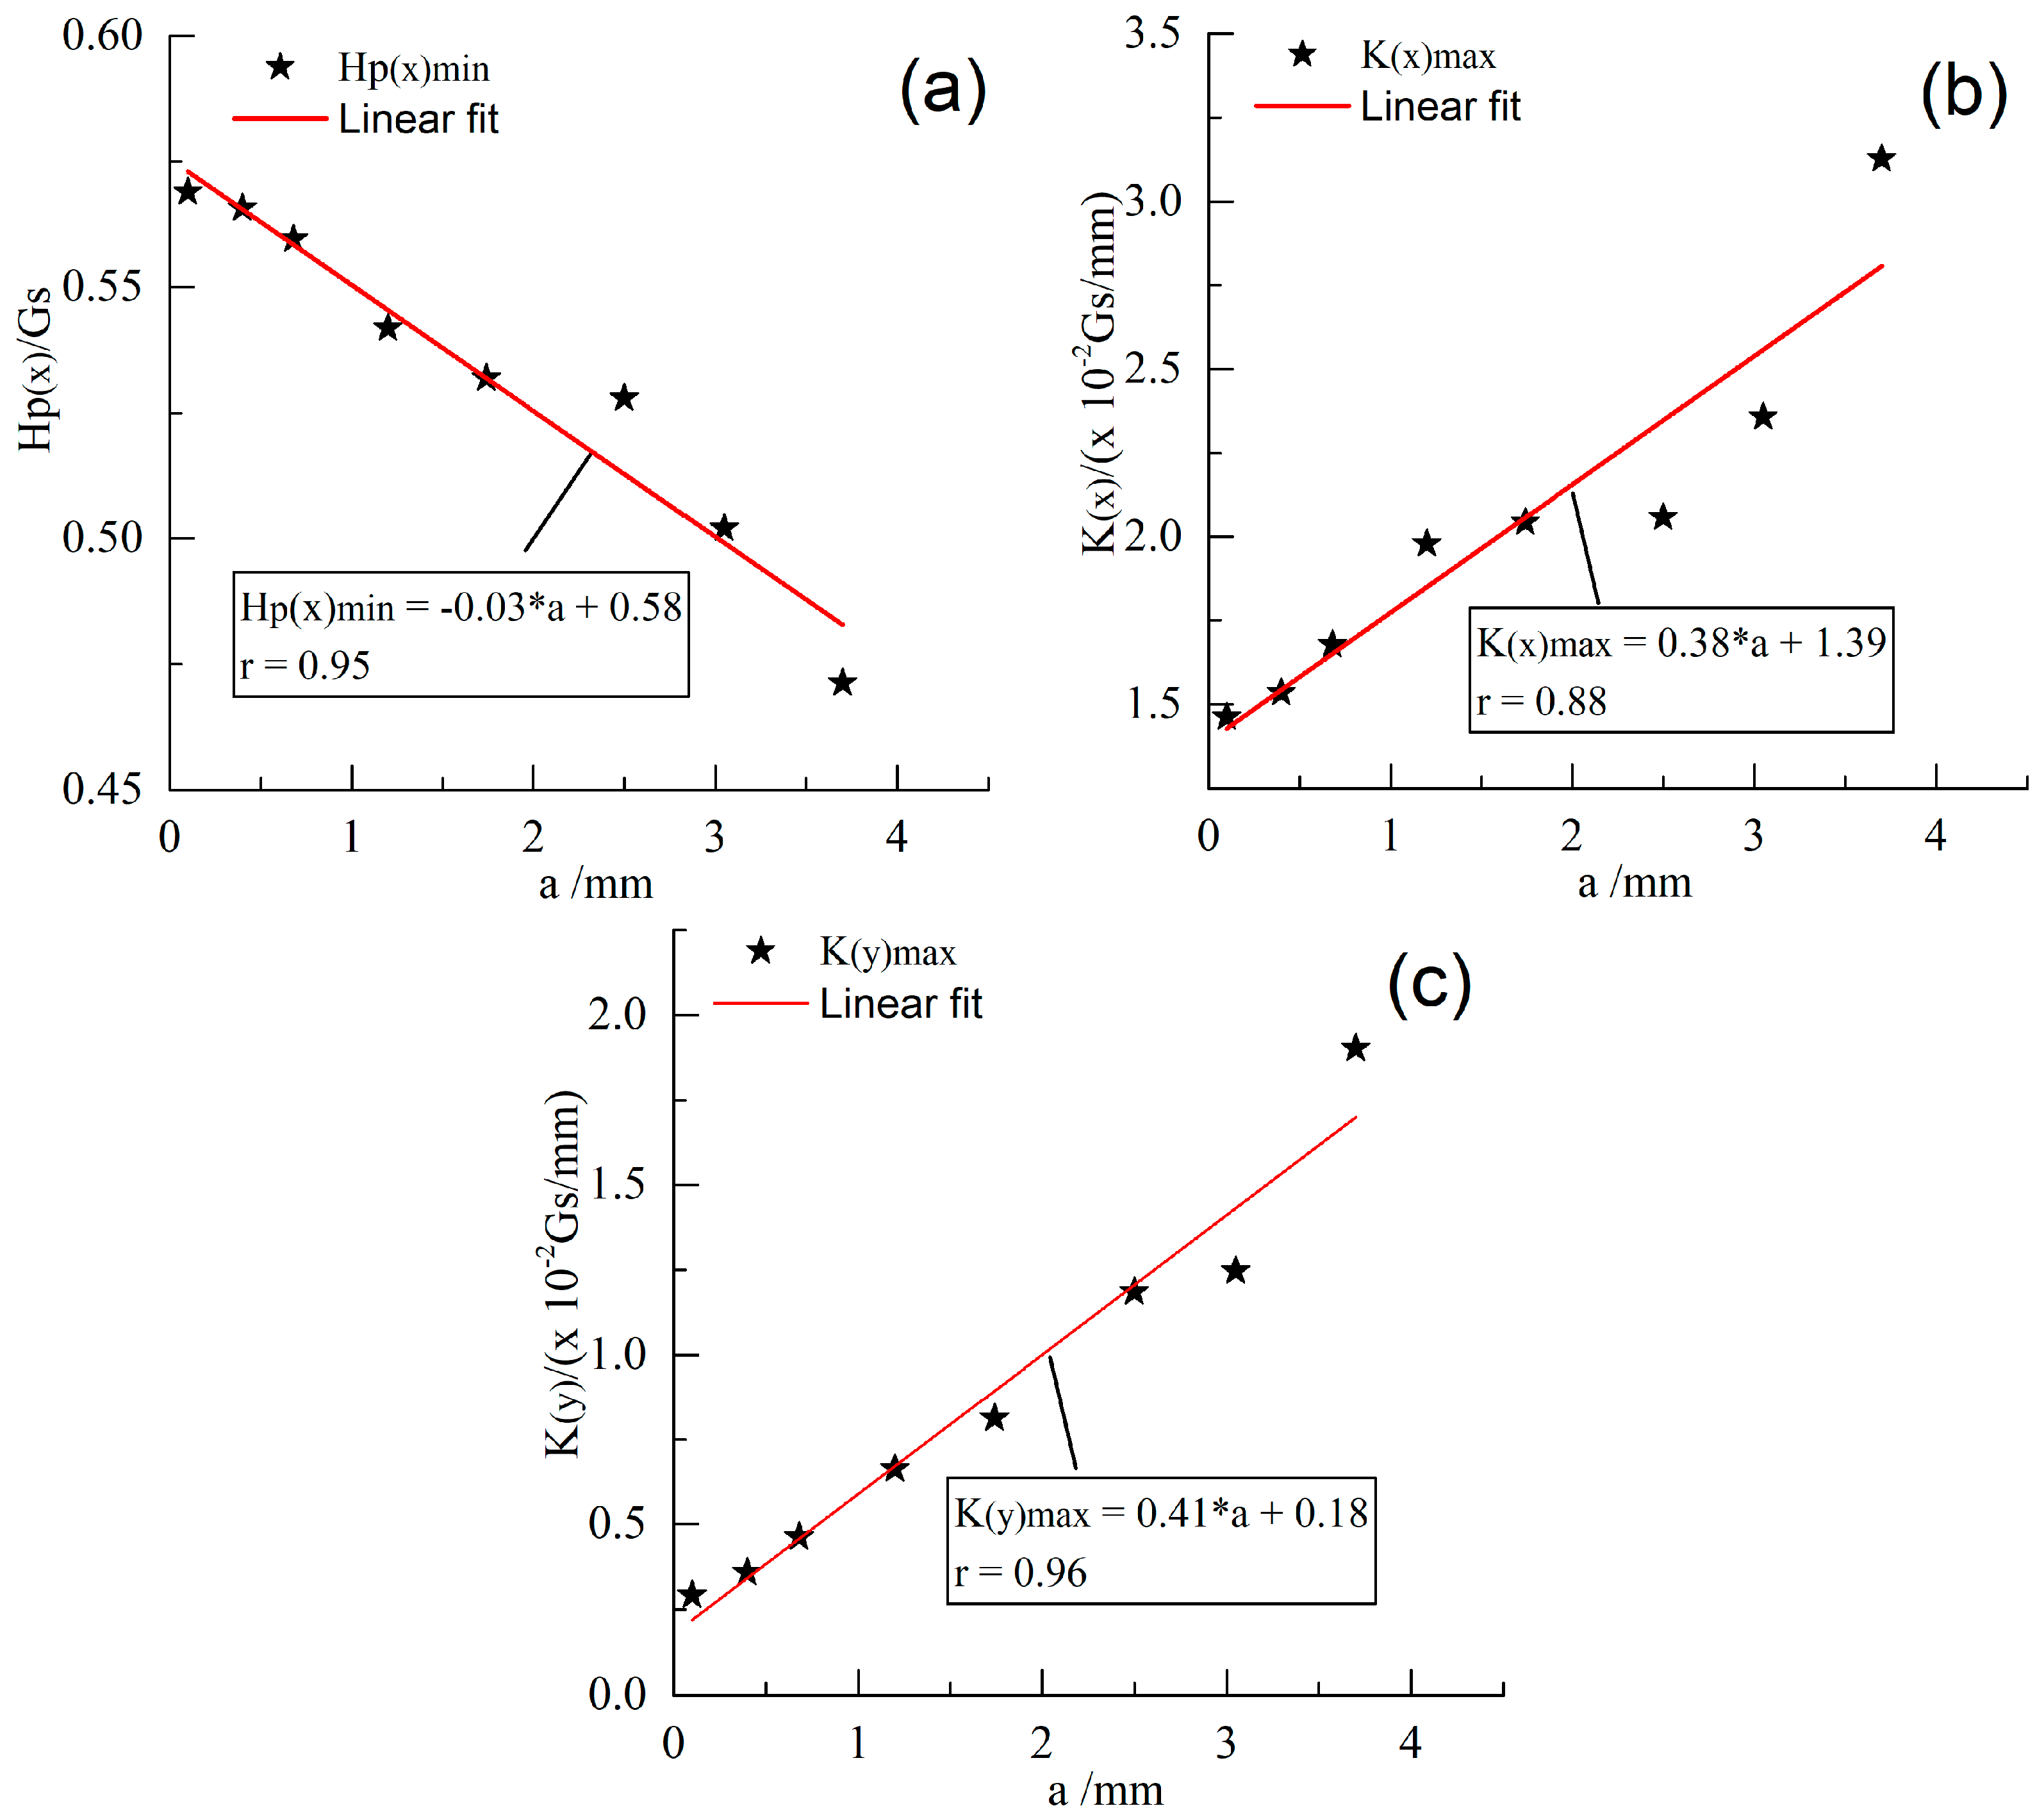
3.3.2. Relationship between Characteristics and Fatigue Crack Length
In order to investigate the regularity of magnetic memory signals in the fatigue crack propagation process, the relationships between the characteristics and the length of the fatigue crack were established (Figure 16). The lateral axis represented the total length of fatigue crack propagation “a”, and the longitudinal axis represented the value of Hp(x)min, K(x)max, and K(y)max, respectively. The correlation coefficients “r” were 0.95, 0.88, and 0.96 after linear fitting between Hp(x)min, K(x)max, and K(y)max and the length of fatigue crack “a”, respectively. The fitting results showed that the length of the crack propagation “a” had a good linear relationship with the values of Hp(x)min, K(x)max, and K(y)max. It could be obvious that the value of K(x)max and K(y)max increased with the increase of length of crack propagation, while the value of Hp(x)min declined. The data of Hp(x)min, K(x)max, and K(y)max were the self-emission signals generated from the propagation of fatigue crack, and they can be used as important parameters to evaluate the length of the fatigue crack. The crack also generated spontaneous abnormal magnetic signals which still existed after the applied load was removed. Therefore, it is possible to predict the residual life of a drillstring by the MMM signal characteristics.
3.4. Discussion
According to magnetics [32], domains with favored magnetic direction would grow, and those without would reduce in an applied magnetic field. The growth and reduction of domains caused movements of the domain walls, which required certain energy. Additionally, dislocations, a common type of defect in fatigue, increased the energy required, as is known to pin the domain wall motion. Thus, the magnetic properties of ferromagnetic materials would be easily affected by fatigue.
In the fatigue test, the specimen was forced through the impact and the residual stress of the specimen began to accumulate with the increase of plastic deformation. The stress equivalent magnetic field theory [33,34,35,36] shows that the effect of stress is equivalent to the external magnetic field. The stress changes the microscopic characteristics and the magnetic domain structure of the specimen; the metal specimen exhibits magnetization characteristics under the environmental magnetic field. The changes of MMM signal characteristics (Figure 14 and Figure 15) were discussed, which corresponded to the morphologies of the specimen’s surface at different fatigue cycles in Figure 6.
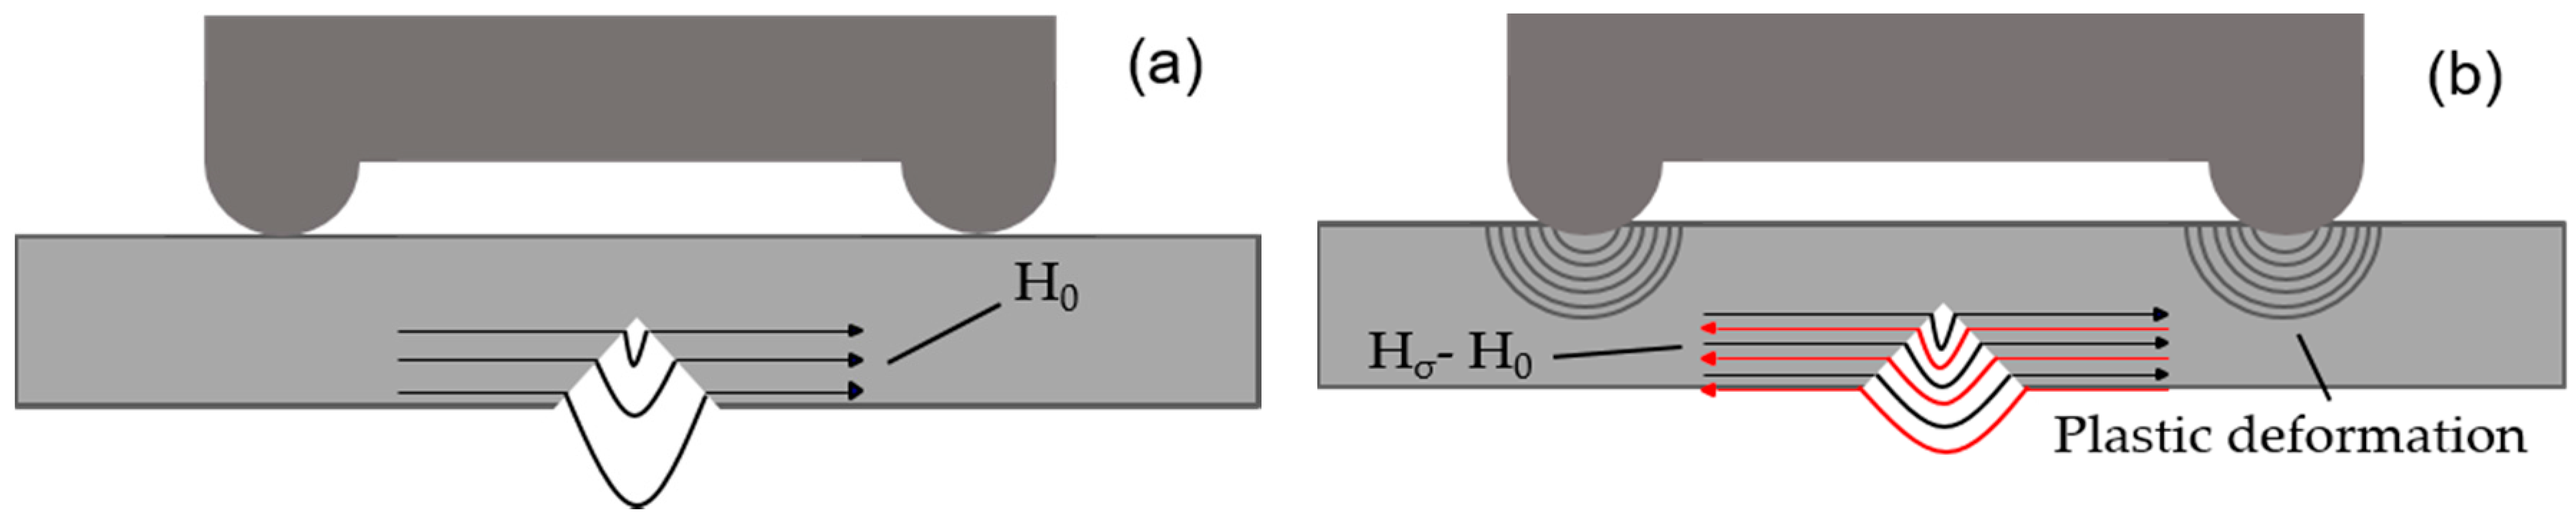
In the initial stage, the residual stress of the specimen accumulated rapidly because of the increase of plastic deformation from 0 to 300 cycles (Figure 6a–c). The equivalent magnetic field Hσ formed by the residual stress was opposite to the initial magnetic field H0 near the notch, which resulted in a decrease in the magnetic field of specimen surface (Figure 17). Consequently, the values of Hp(x)min, K(x)max and K(y)max declined rapidly.
When the fatigue cycles reached 300, the substantial plastic deformation was stable (Figure 6d,e) due to the appearance of dislocation blockings near the notch [22]. Consequently, the values of Hp(x)min, K(x)max and K(y)max were stable in the steady stage. With the increase of fatigue cycles, the crack initiated and propagated from the most serious stress concentration position of the specimen (Figure 6e,f). The specimen became discontinuous due to the formation of the fatigue crack. Magnetic lines, which should pass through the specimen, detoured into the air because of different magnetic permeability between air and specimen. More and more magnetic lines detoured with the increase of the fatigue crack. As a result, the magnetic leakage field on the specimen’s surface became stronger. Consequently, the values of K(x)max and K(y)max continued to increase, while Hp(x)min continued to decline. When approaching fracture, the fatigue specimen generated serious irreversible deformation (Figure 6h), and the air gap of cracks became larger. The longer the gap was, the narrower the path of the magnetic lines was, so the magnetic leakage field accelerated. Thus, the variation tendency of MMM signal characteristics became more significant.
The variations of MMM signal characteristics included the steady growth stage and rapid growth stage of fatigue crack growth and propagation (Figure 14 and Figure 15). The fatigue crack was in the state of steady growth at the beginning of crack propagation (Figure 6f,g), and the discontinuous area formed by the crack was continuously growing, too. Magnetic leakage field strengthened steadily due to the steady increase of discontinuous area, which corresponded to the steady growth stage of MMM signal characteristics during the fatigue process. When approaching the final fracture, the fatigue crack entered rapid propagation, fatigue specimen had serious irreversible bending deformation (Figure 6h) and the roughness of the fracture increased obviously (Figure 7a). Magnetic leakage field accelerated due to the rapid increase of the discontinuous area, in accordance with the rapid growth stage of MMM signal characteristics.
When the crack initiated at 7000 cycles, the stress was released, thus, at the same time the equivalent magnetic field Hσ formed by stress decreased. The magnetic field of the specimen’s surface tended to the initial magnetic field H0 because Hσ was opposite to the initial magnetic field H0 in Figure 17. Consequently, the values of K(x)max and K(y)max began to decline, while Hp(x)min increased, as shown in Figure 14 and Figure 15. However, the downward trend of K(y)max was not significant. Therefore, if the detection results were only obtained from K(y)max at crack initiation stage, it might cause missing detection. Of course, the same situation may occur in Hp(x)min and K(x)max because MMM detection results were susceptible to the measuring position, load type, etc. [17,18,20]. Consequently, in order to reduce the probability of missing detection, the combination of Hp(x)min, K(x)max and K(y)max should be used to evaluate the fatigue damage.
The results showed that the variations of Hp(x)min, K(x)max, and K(y)max had a relationship with the morphology of specimen surface and fracture. The Hp(x)min, K(x)max, and K(y)max could be used as potential parameters to monitor fatigue cracking. However, it should be noted that there are many factors influencing MMM signal characteristics, such as the type of material, measuring position, load type, and load value, etc. [17,18,20]. In conclusion, supposing that researchers intend to accurately monitor fatigue damage of ferromagnetic materials, including drillstrings, by MMM technology, a great deal of experimental investigation needs to be finished, including the factors of measuring the position, load type, and load value, all of which have influences on the MMM detection results. Additionally, the size of the ferromagnetic material is also a key factor for the result of MMM detection.
4. Conclusions
In conclusion, the MMM signals, Hp(x) and Hp(y), with their characteristics, Hp(x)min, K(x)max, K(y)max, were analyzed in accord with the morphology on the specimen surface when performing the four-point bending fatigue test. The main conclusions have been drawn as follows.
- The variations of MMM signal characteristics could be explained by the changes of morphology on specimen surface during fatigue process. At the initial stage, the characteristics decreased significantly with the increase of plastic deformation on the specimen’s surface because of the opposite direction between the equivalent magnetic field and the initial magnetic field. After that, the characteristics remained constant due to the appearance of dislocation blocking. After crack initiation, the characteristics entered a steady growth stage and the K(x)max and K(y)max values began to increase, while Hp(x)min continued to decline. Approaching fracture, the fatigue specimen generated serious irreversible deformation, and the variation tendency of K(x)max, K(y)max, Hp(x)min sped up. The results indicated that MMM signal characteristics could reflect fatigue process, including crack initiation, which had great significance to prevent fatigue failure of ferromagnetic materials, including drillstrings. Additionally, the combination of Hp(x) and Hp(y) signals to evaluate fatigue damage could reduce the probability of missing crack initiation, compared with the detection results from Hp(y) signals only.
- Fatigue crack initiation occurred at the surface/sub-surface of the specimen, fatigue striations and the secondary crack were observed at the crack propagation zone, and the final fracture surface had an obvious ductile dimpled morphology. At the end of crack propagation zone, the surface of fracture was rough, which corresponded to the rapid growth stage of MMM signal characteristics. The results showed that the variations of MMM signal characteristics were related to the morphology of fatigue fracture. In addition, the result of metallographical structure observation showed that the crack mechanism was transcrystalline rupture.
- The fitting results showed that the length of crack propagation “a” had a good linear relationship with the values of Hp(x)min, K(x)max and K(y)max. The results of the whole fatigue test indicated that it was possible to detect microcracks and predict the residual life of drillstrings. However, a large number of investigations have to be conducted if we intend to achieve these potential functions, including the size and the initial residual magnetic field of testing objects. These issues will be studied in the future by experimentation.
Acknowledgments
The authors would like to thank the Foundation of CNOOC (grant number YXKY-2017-ZY-09) for its financial support.
Author Contributions
Each of the authors contributed to performing the experiments and writing the article. Zhibin Hu is the main authors of this manuscript and this work was conducted under the advisement of Jianchun Fan. Shengnan Wu, Haoyuan Dai, and Shujie Liu helped to conduct the experiments. All authors revised and approved the publication.
Conflicts of Interest
The authors declare no conflict of interest.
References
- Cirimello, P.; Otegui, J.L. Oil well drill bit failure during pull out: Redesign to reduce its consequences. Eng. Fail. Anal. 2017, 83, 75–87. [Google Scholar] [CrossRef]
- Zamani, S.M.; Hassanzadeh-Tabrizi, S.A. Failure analysis of drill pipe: A review. Eng. Fail. Anal. 2016, 59, 605–623. [Google Scholar] [CrossRef]
- Baryshnikov, A.; Calderoni, A. A new approach to the analysis of drillstring fatigue behavior. SPE Drill. Complet. 2013, 12, 77–84. [Google Scholar] [CrossRef]
- Dao, N.H.; Sellami, H. Stress intensity factors and fatigue growth of a surface crack in a drill pipe during rotary drilling operation. Eng. Fract. Mech. 2012, 96, 626–640. [Google Scholar] [CrossRef] [Green Version]
- Dale, B.A. An experimental investigation of fatigue-crack growth in drillstring tubulars. SPE Drill. Eng. 1988, 3, 356–362. [Google Scholar] [CrossRef]
- Ojanomare, C.; Cornetti, P. Fatigue crack growth analysis of drill pipes during rotary drilling operations by the multiple reference state weight function approach. Eng. Fail. Anal. 2017, 74, 11–34. [Google Scholar] [CrossRef]
- Santus, C.; Bertini, L. Torsional strength comparison between two assembling techniques for aluminium drill pipe to steel tool joint connection. Int. J. Press. Vessels Pip. 2009, 86, 177–186. [Google Scholar] [CrossRef]
- Dubov, A.A. A study of metal properties using the method of magnetic memory. Met. Sci. Heat Treat. 1997, 39, 401–402. [Google Scholar] [CrossRef]
- Wilson, J.W.; Tian, G.Y. Residual magnetic field sensing for stress measurement. Sens. Actuators A Phys. 2007, 135, 381–387. [Google Scholar] [CrossRef]
- Shi, P.P.; Jin, K. A magnetomechanical model for the magnetic memory method. Int. J. Mech. Sci. 2017, 124–125, 229–241. [Google Scholar] [CrossRef]
- Ariffin, A.; Ahmad, I.M. Detection of cracked position due to cyclic loading for ferromagnetic materials based on magnetic memory method. Jurnal Teknologi 2015, 75, 67–70. [Google Scholar] [CrossRef]
- Shen, G.T.; Hu, B. Investigation on metal magnetic memory signal during loading. Int. J. Appl. Electromagn. Mech. 2010, 33, 1329–1334. [Google Scholar] [CrossRef]
- Rieger, G.; Ludwig, K. GMR sensors for contactless position detection. Sens. Actuators A Phys. 2001, 91, 7–11. [Google Scholar] [CrossRef]
- Chen, L.; Que, P.W. A giant-magnetoresistance sensor for magnetic-flux-leakage nondestructive testing of a pipeline. Russ. J. Nondestruct. Test. 2005, 41, 462–465. [Google Scholar] [CrossRef]
- Dong, L.H.; Xu, B.S. Stress dependence of the spontaneous stray field signals of ferromagnetic steel. NDT E Int. 2009, 42, 323–327. [Google Scholar] [CrossRef]
- Huang, H.H.; Yang, C. Magnetic memory signals variation induced by applied magnetic field and static tensile stress in ferromagnetic steel. J. Magn. Magn. Mater. 2016, 416, 213–219. [Google Scholar] [CrossRef]
- Dong, L.H.; Xu, B. Variation of stress-induced magnetic signals during tensile testing of ferromagnetic steels. NDT E Int. 2008, 41, 184–189. [Google Scholar] [CrossRef]
- Wang, Z.D.; Yao, K. Theoretical studies of metal magnetic memory technique on magnetic flux leakage signals. NDT E Int. 2010, 43, 354–359. [Google Scholar] [CrossRef]
- Jian, X.L.; Jian, X.C. Experiment on relationship between the magnetic gradient of low carbon steel and its stress. J. Magn. Magn. Mater. 2009, 321, 3600–3606. [Google Scholar] [CrossRef]
- Li, J.W.; Zhong, S. The variation of surface magnetic field induced by fatigue stress. J. Nondestruct. Eval. 2013, 32, 238–241. [Google Scholar] [CrossRef]
- Leng, J.C.; Xu, M.Q. Magnetic field variation induced by cyclic bending stress. NDT E Int. 2009, 42, 410–414. [Google Scholar] [CrossRef]
- Shi, C.L.; Dong, S.Y. Stress concentration degree affects spontaneous magnetic signals of ferromagnetic steel under dynamic tension load. NDT E Int. 2010, 43, 8–12. [Google Scholar] [CrossRef]
- Dong, L.H.; Xu, B.S. Monitoring fatigue crack propagation of ferromagnetic materials with spontaneous abnormal magnetic signals. Int. J. Fatigue 2008, 30, 1599–1605. [Google Scholar] [CrossRef]
- Huang, H.H.; Jiang, S.L. Investigation of magnetic memory signals induced by dynamic bending load in fatigue crack propagation process of structural steel. J. Nondestruct. Eval. 2014, 33, 407–412. [Google Scholar] [CrossRef]
- Huang, H.H.; Qian, Z.C. Magnetic memory signals of ferromagnetic weldment induced by dynamic bending load. Nondestruct. Test. Eval. 2017, 32, 166–184. [Google Scholar] [CrossRef]
- Wang, Z.D.; Deng, B. Physical model of plastic deformation on magnetization in ferromagnetic materials. J. Appl. Phys. 2011, 109, 083928. [Google Scholar] [CrossRef]
- Lo, C.C.H.; Kinser, E. Modeling the interrelating effects of plastic deformation and stress on magnetic properties of materials. J. Appl. Phys. 2003, 93, 6626–6628. [Google Scholar] [CrossRef]
- Mishnev, R.; Dudova, N. Low cycle fatigue behavior of a 10Cr–2W–Mo–3Co–NbV steel. Int. J. Fatigue 2016, 83, 344–355. [Google Scholar] [CrossRef]
- Atapek, Ş.H.; Pantelakis, S.G.Ş. Fractographical analysis of fatigue failed Cu–2.55Ni–0.55Si alloy. Theor. Appl. Fract. Mech. 2016, 83, 60–66. [Google Scholar] [CrossRef]
- Liu, X.L.; Zhang, Z. Fatigue Fractography Quantitative Analysis; National Defense Industry Press: Beijing, China, 2010; pp. 26–31. ISBN 978-7-118-07062-0. [Google Scholar]
- Lynch, S. Some fractographic contributions to understanding fatigue crack growth. Int. J. Fatigue 2017, 104, 12–26. [Google Scholar] [CrossRef]
- Jiang, S.T.; Li, W. Magnetic Physics of the Condensed Matter; Science Press: Beijing, China, 2003; pp. 258–289. ISBN 7-03-011190-7. [Google Scholar]
- Ren, W.; Sun, J. Experimental study on effect of stress on magnetic domain structure under geomagnetic condition. J. Mech. Eng. 2013, 49, 8–13. [Google Scholar] [CrossRef]
- Jiles, D.C.; Atherton, D.L. Theory of ferromagnetic hysteresis. J. Magn. Magn. Mater. 1986, 61, 48–60. [Google Scholar] [CrossRef]
- Jiles, D.C.; Li, L. A new approach to modeling the magneto-mechanical effect. J. Appl. Phys. 2004, 95, 7058–7060. [Google Scholar] [CrossRef]
- Jiles, D.C.; Devine, M.K. Recent developments in modeling of the stress derivative of magnetization in ferromagnetic materials. Am. Inst. Phys. 1994, 76, 7015–7017. [Google Scholar] [CrossRef]
Figure 1.
Schematic diagram of the four-point bending fatigue experiment apparatus.

Figure 2.
Schematic diagram of the load (Unit: mm).

Figure 3.
Geometry and dimensions of the specimen (unit: mm).
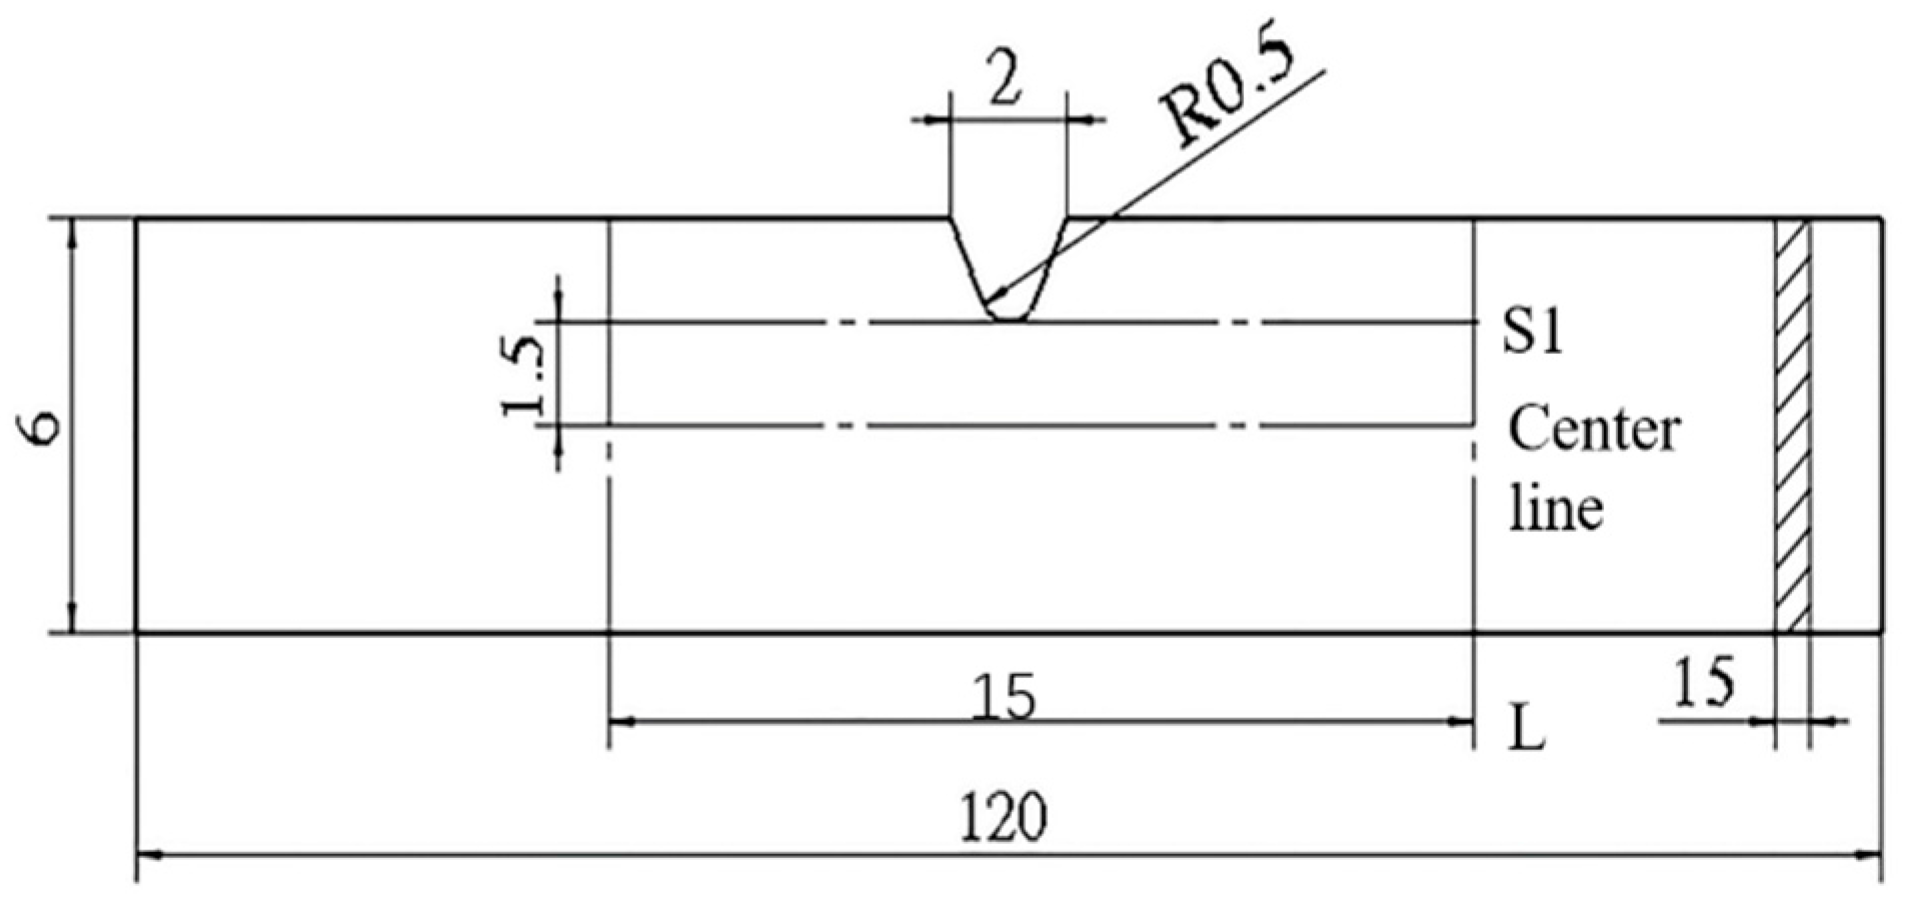
Figure 4.
The schematic diagram of plastic deformation observation and MMM signals detection.

Figure 5.
The variation of max loading value “F” at different fatigue cycles.

Figure 6.
The morphology of specimen surface at different fatigue cycles: (a) 0 cycles; (b) 1 cycle; (c) 300 cycles; (d) 1000 cycles; (e) 7000 cycles; (f) 9000 cycles; (g) 17,000 cycles; and (h) 23,000 cycles.
Figure 6.
The morphology of specimen surface at different fatigue cycles: (a) 0 cycles; (b) 1 cycle; (c) 300 cycles; (d) 1000 cycles; (e) 7000 cycles; (f) 9000 cycles; (g) 17,000 cycles; and (h) 23,000 cycles.
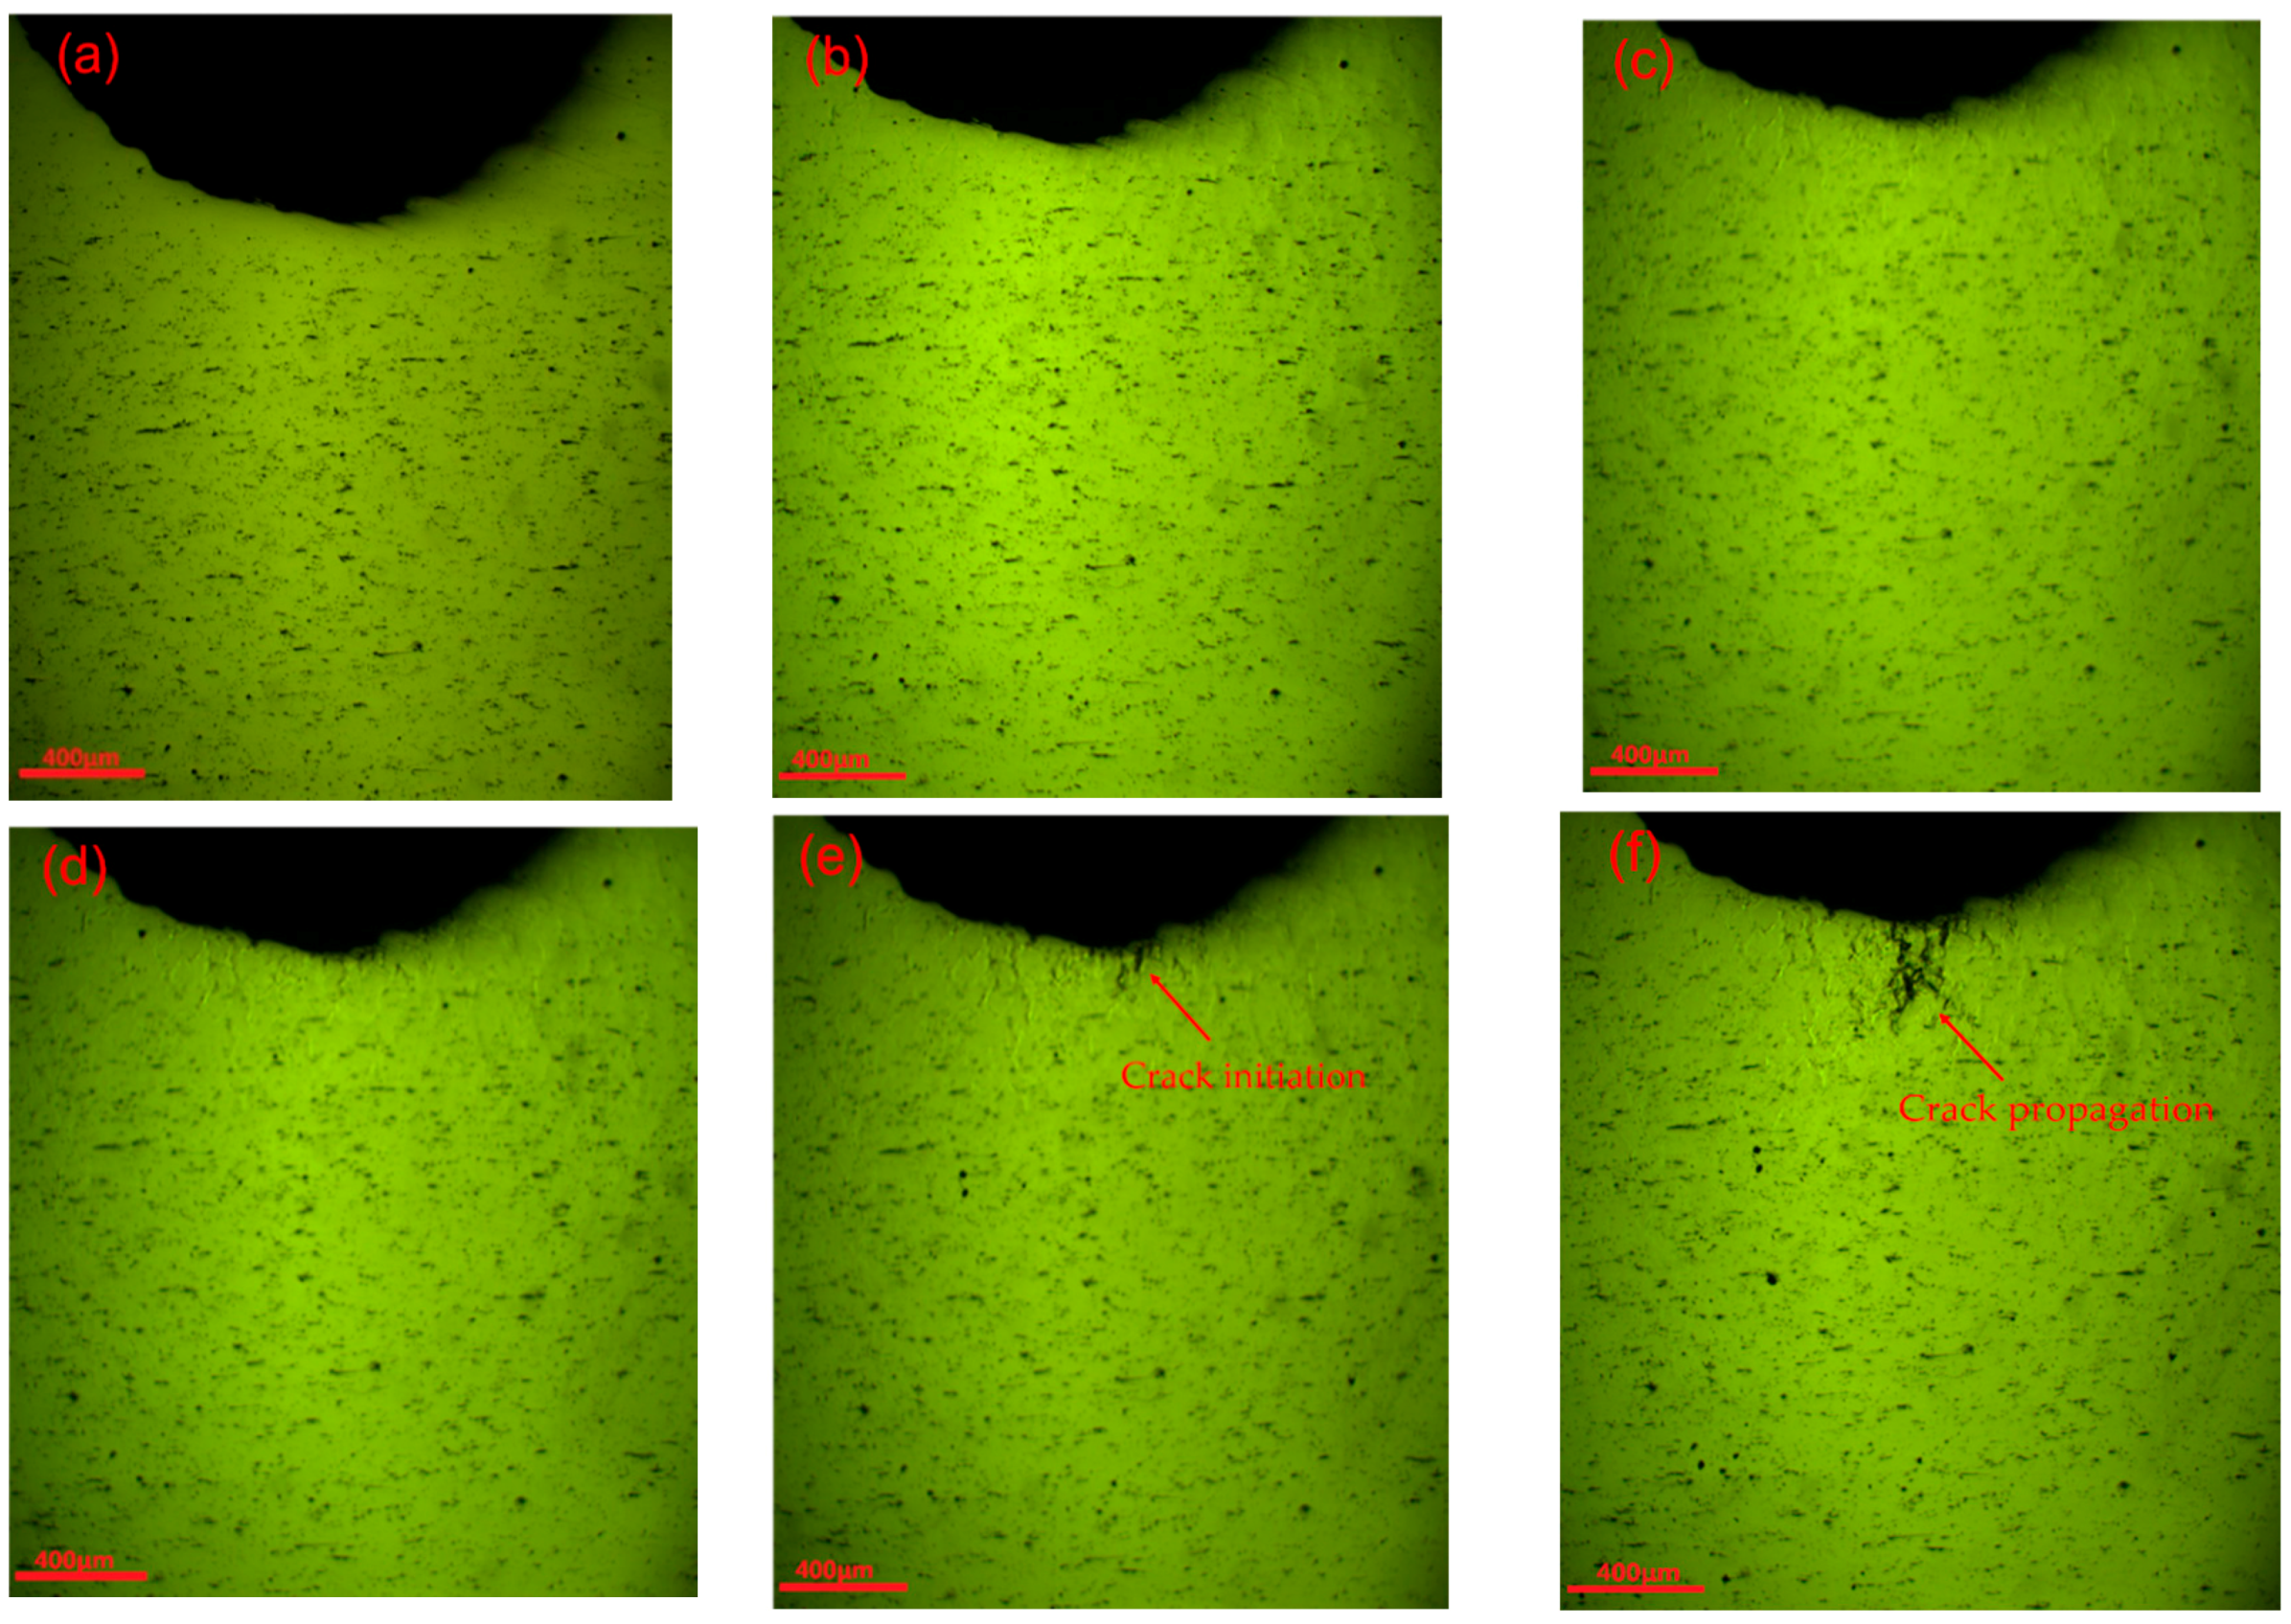
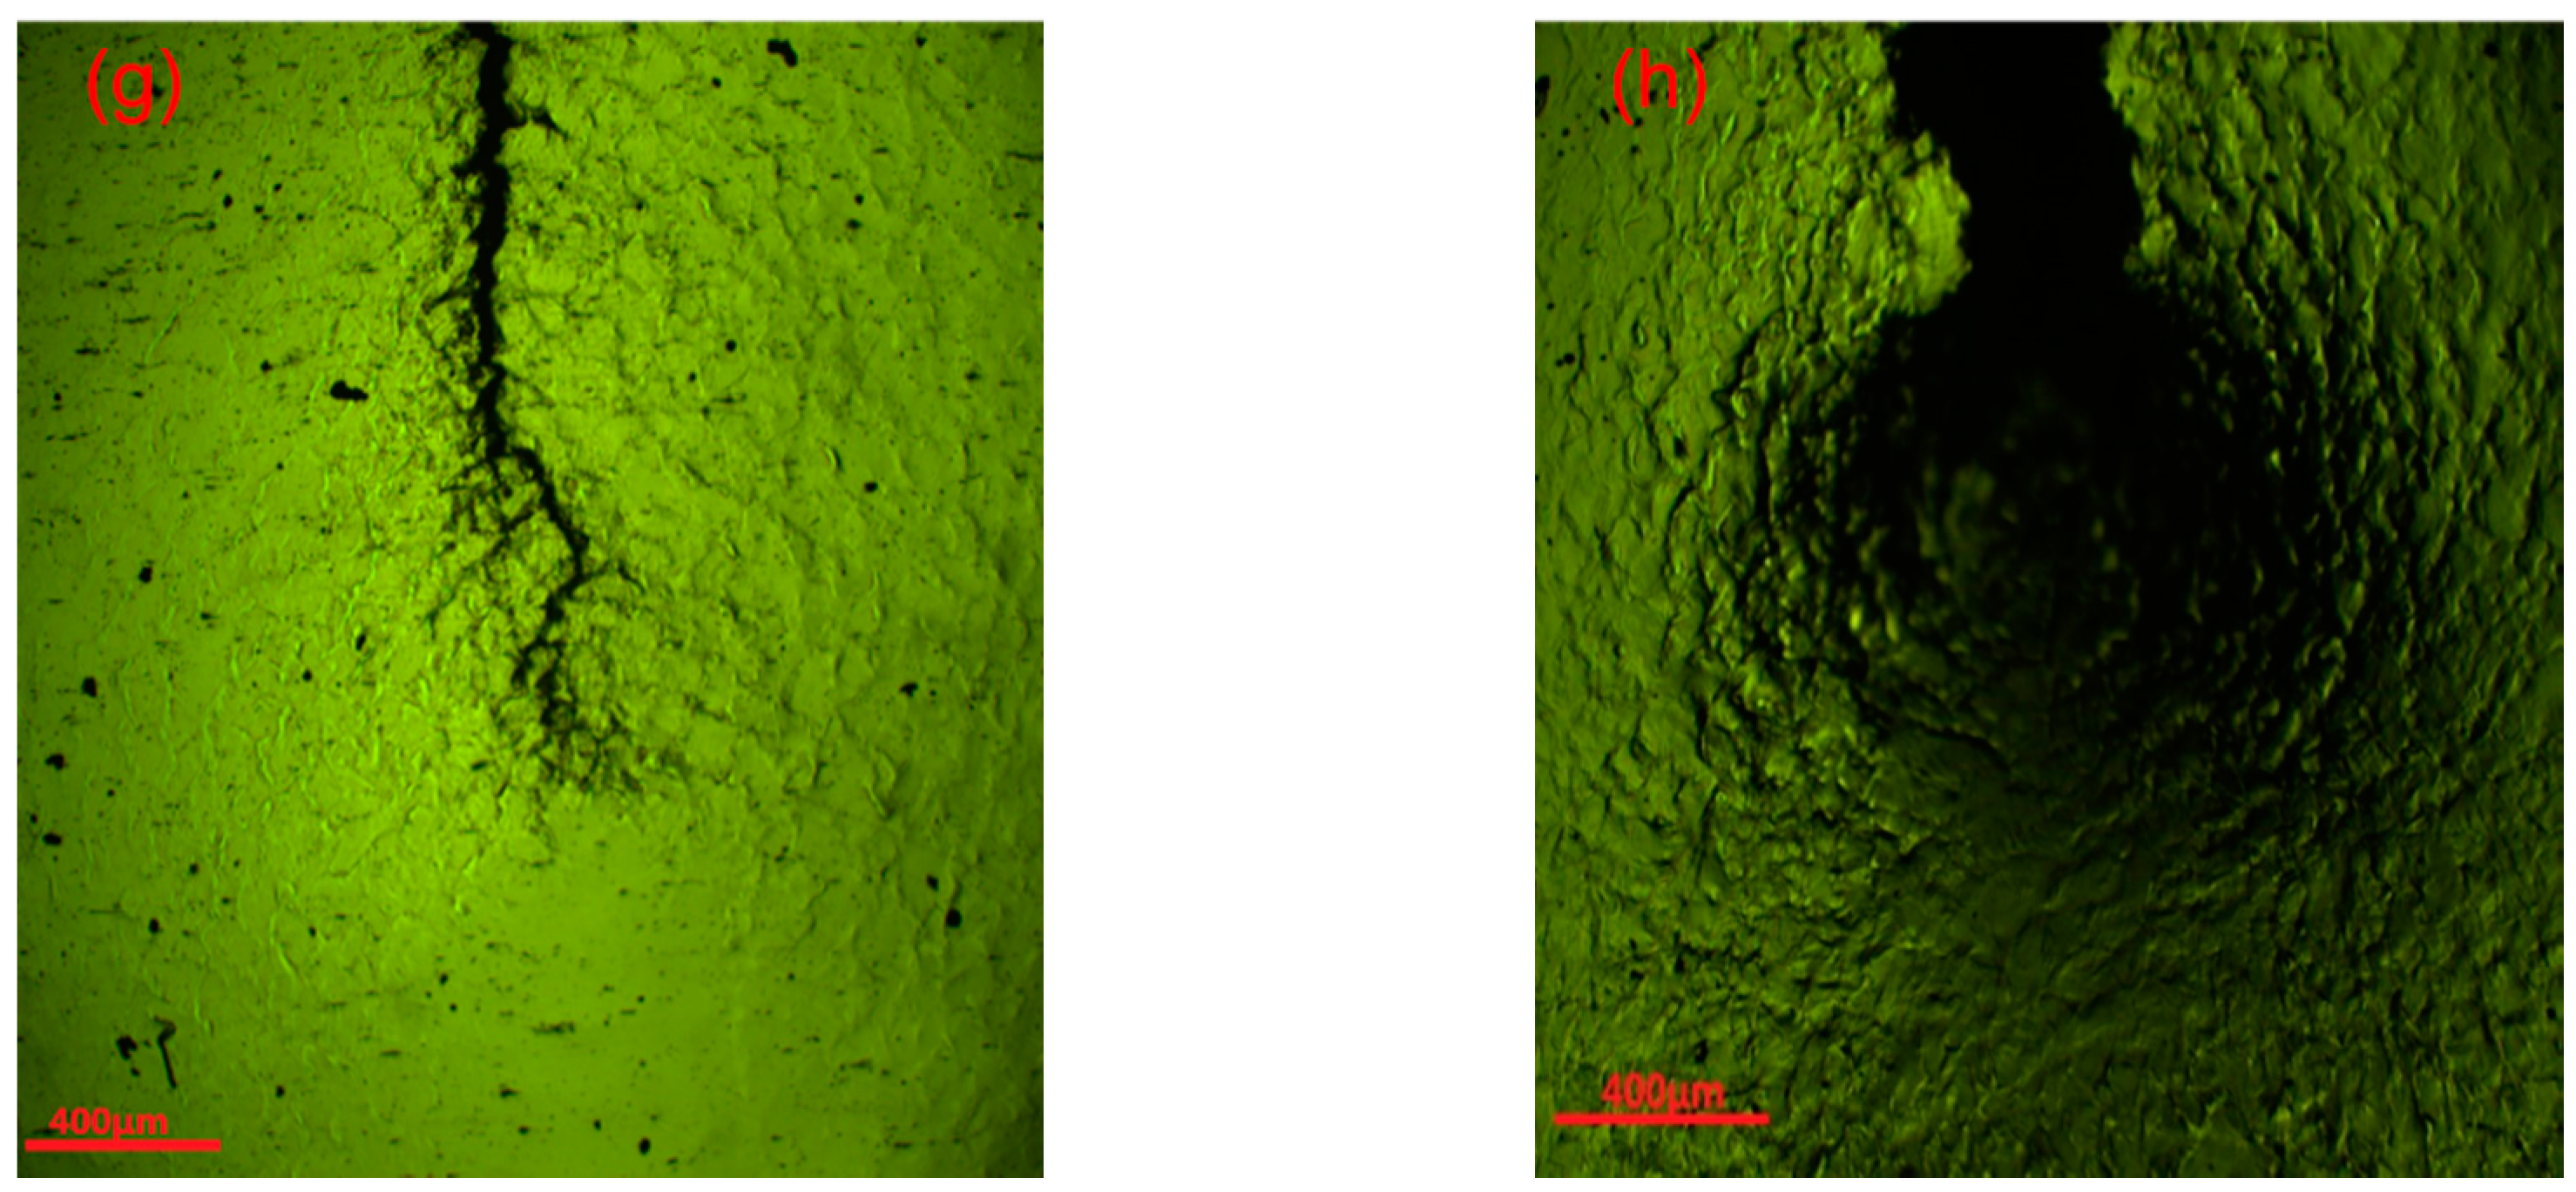
Figure 7.
Morphologies of fatigue fracture through SEM along main crack propagation: (a) the whole fracture surface morphology; (b) crack initiation zone and propagation zone; (c) amplification of the crack initiation zone; (d) amplification of the crack propagation zone; (e) crack propagation zone at high magnification; and (f) amplification of the final fracture.
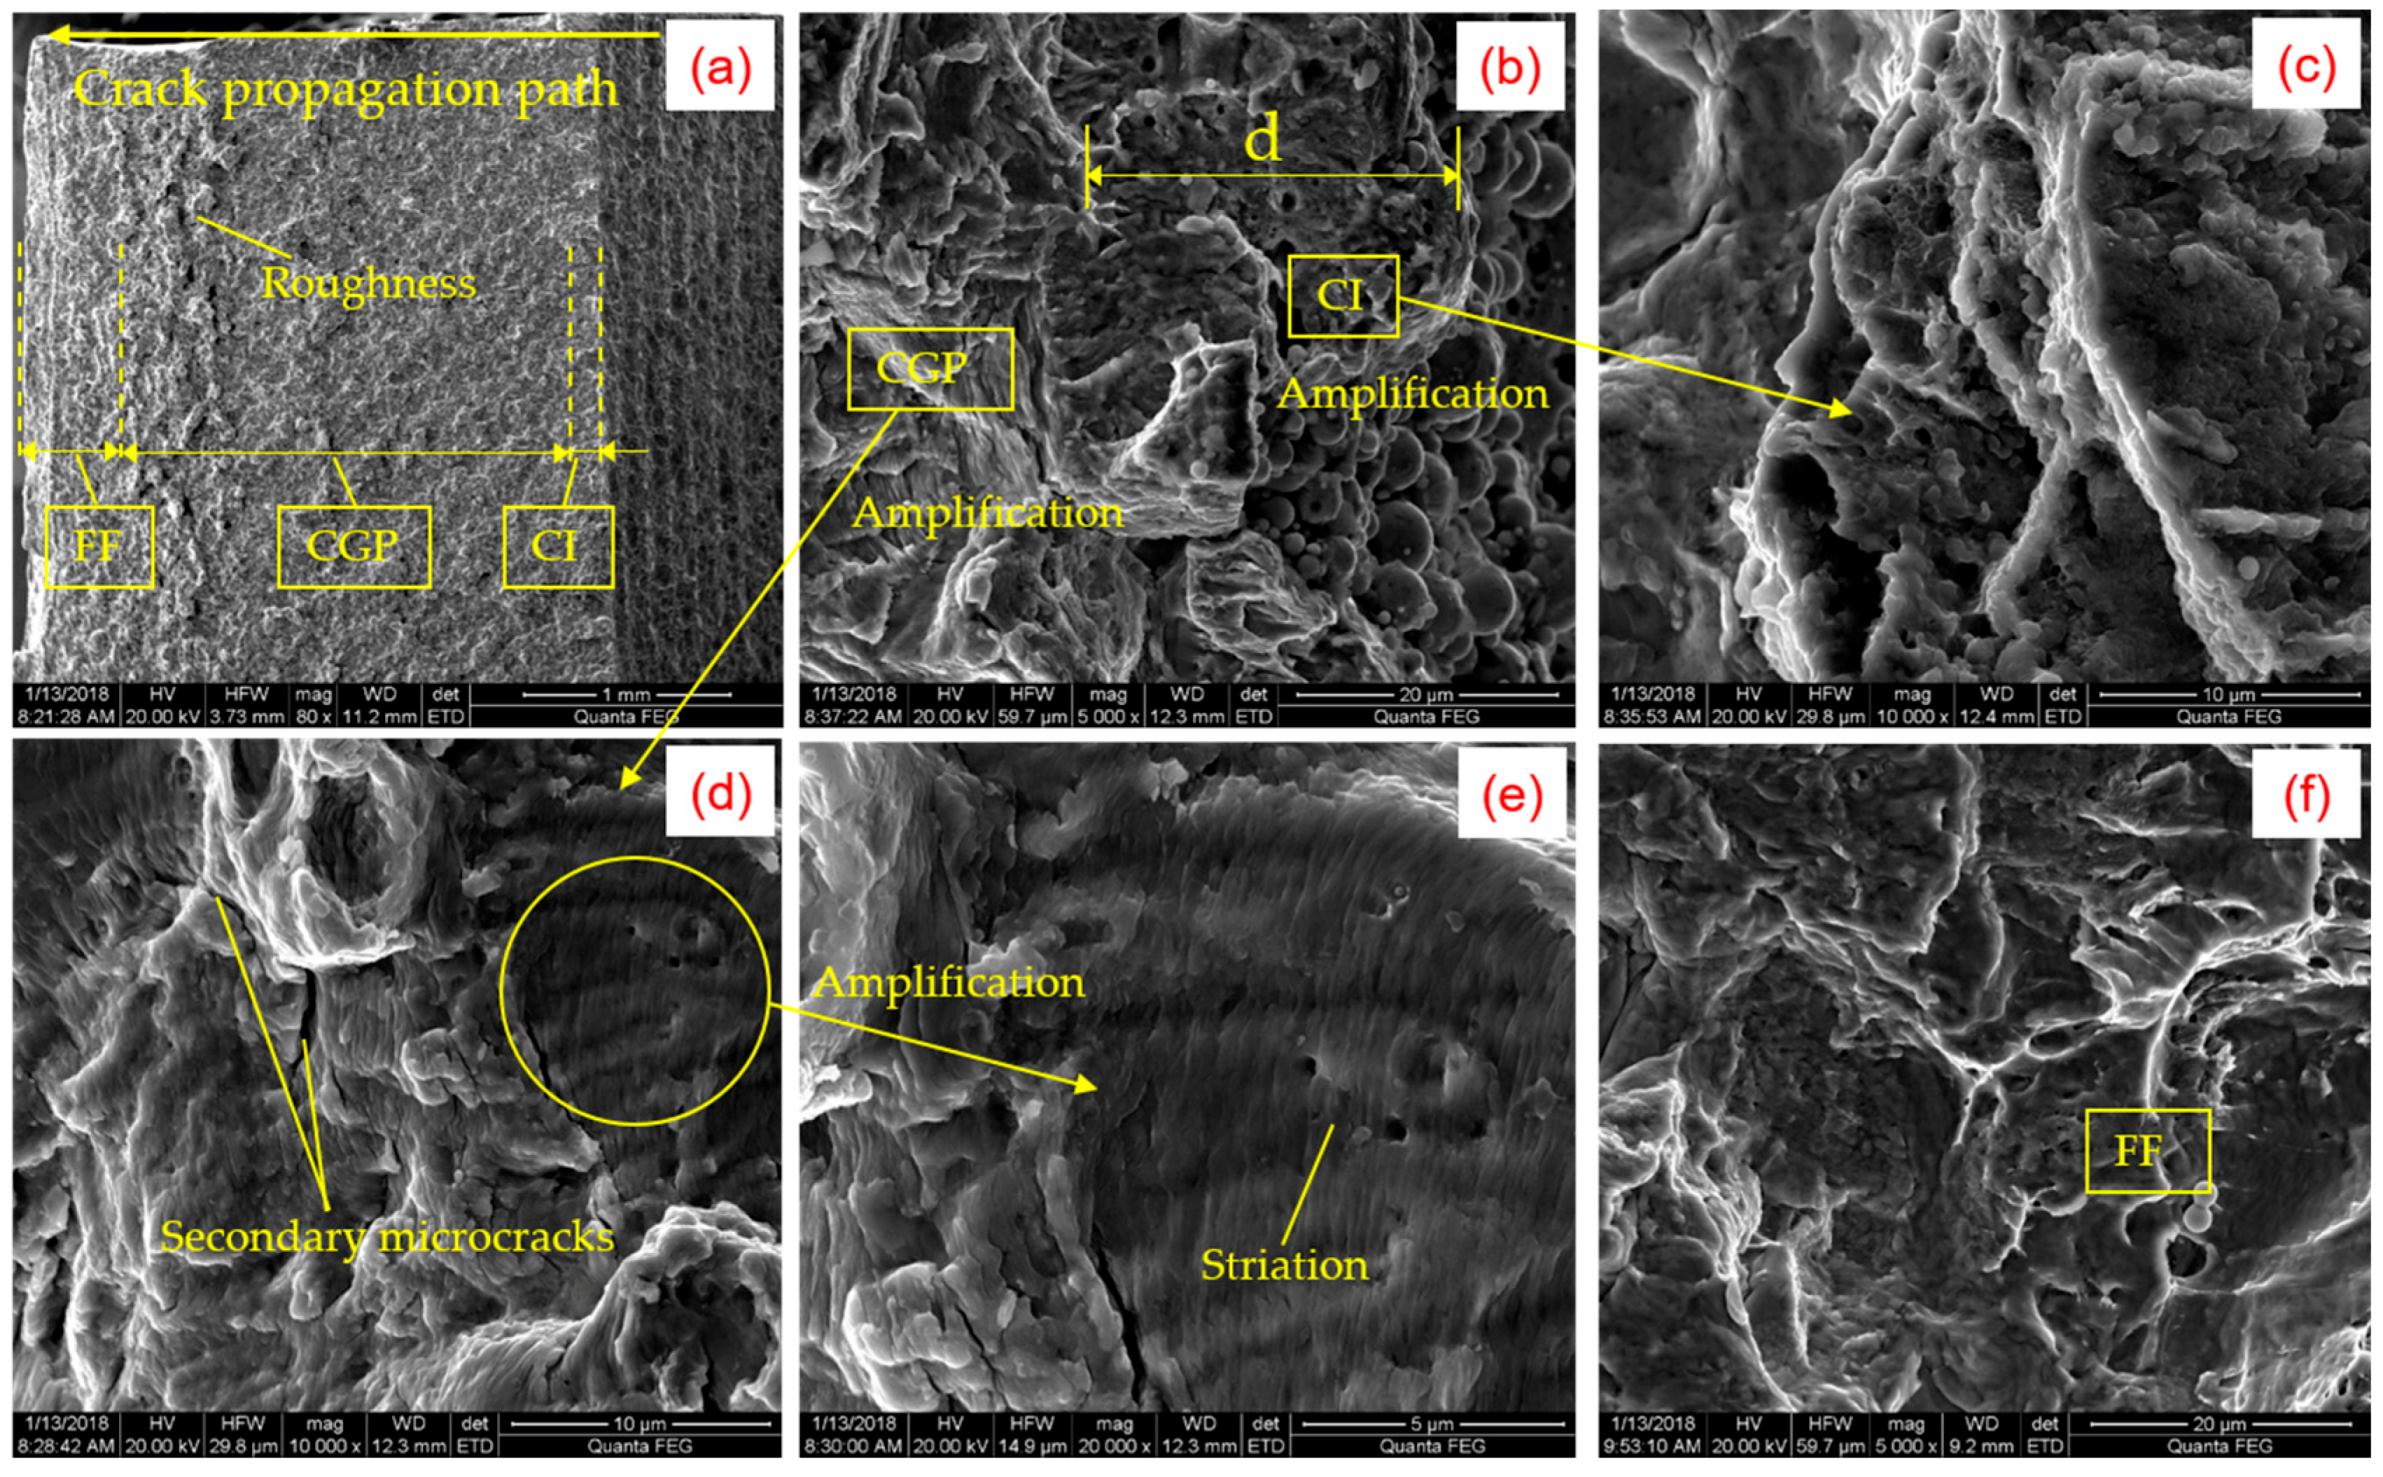
Figure 8.
Morphologies of specimen surface through SEM along the main crack propagation: (a) crack initiation zone; (b) crack propagation zone; (c) final fracture (d) amplification of the crack initiation zone; (e) amplification of the crack propagation zone; and (f) amplification of the final fracture zone.

Figure 9.
Morphology of the specimen’s surface away from crack initiation zone.

Figure 10.
Optical micrographs by SEM after crack initiation.

Figure 11.
MMM signals of the specimen before and after load: (a) Hp(x); and (b) Hp(y).

Figure 12.
MMM signals of the specimen before crack propagation: (a) Hp(x); and (b) Hp(y).
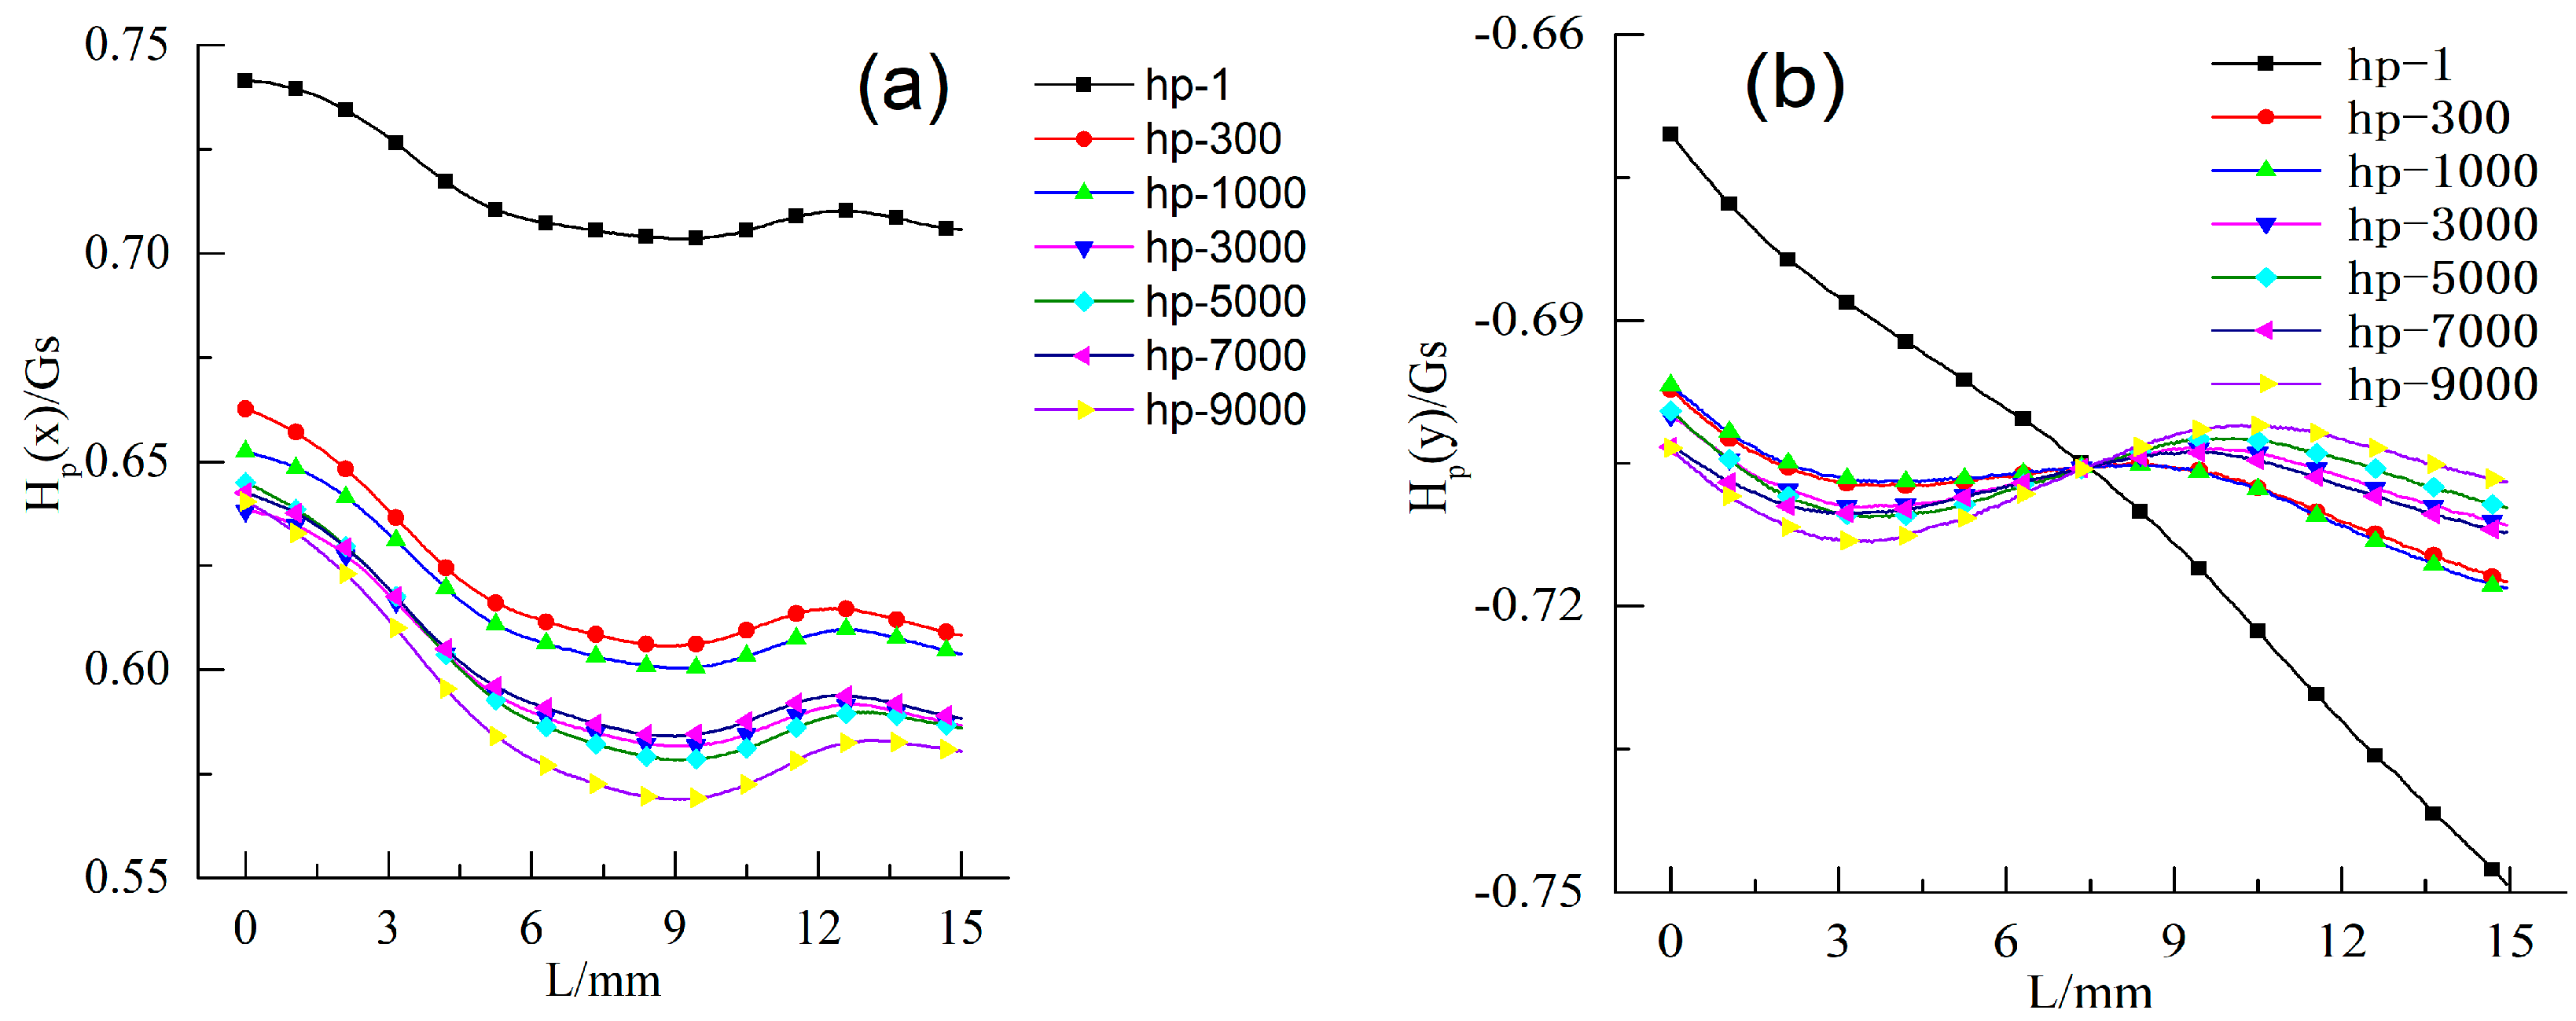
Figure 13.
MMM signals of the specimen after crack propagation: (a) Hp(x); and (b) Hp(y).
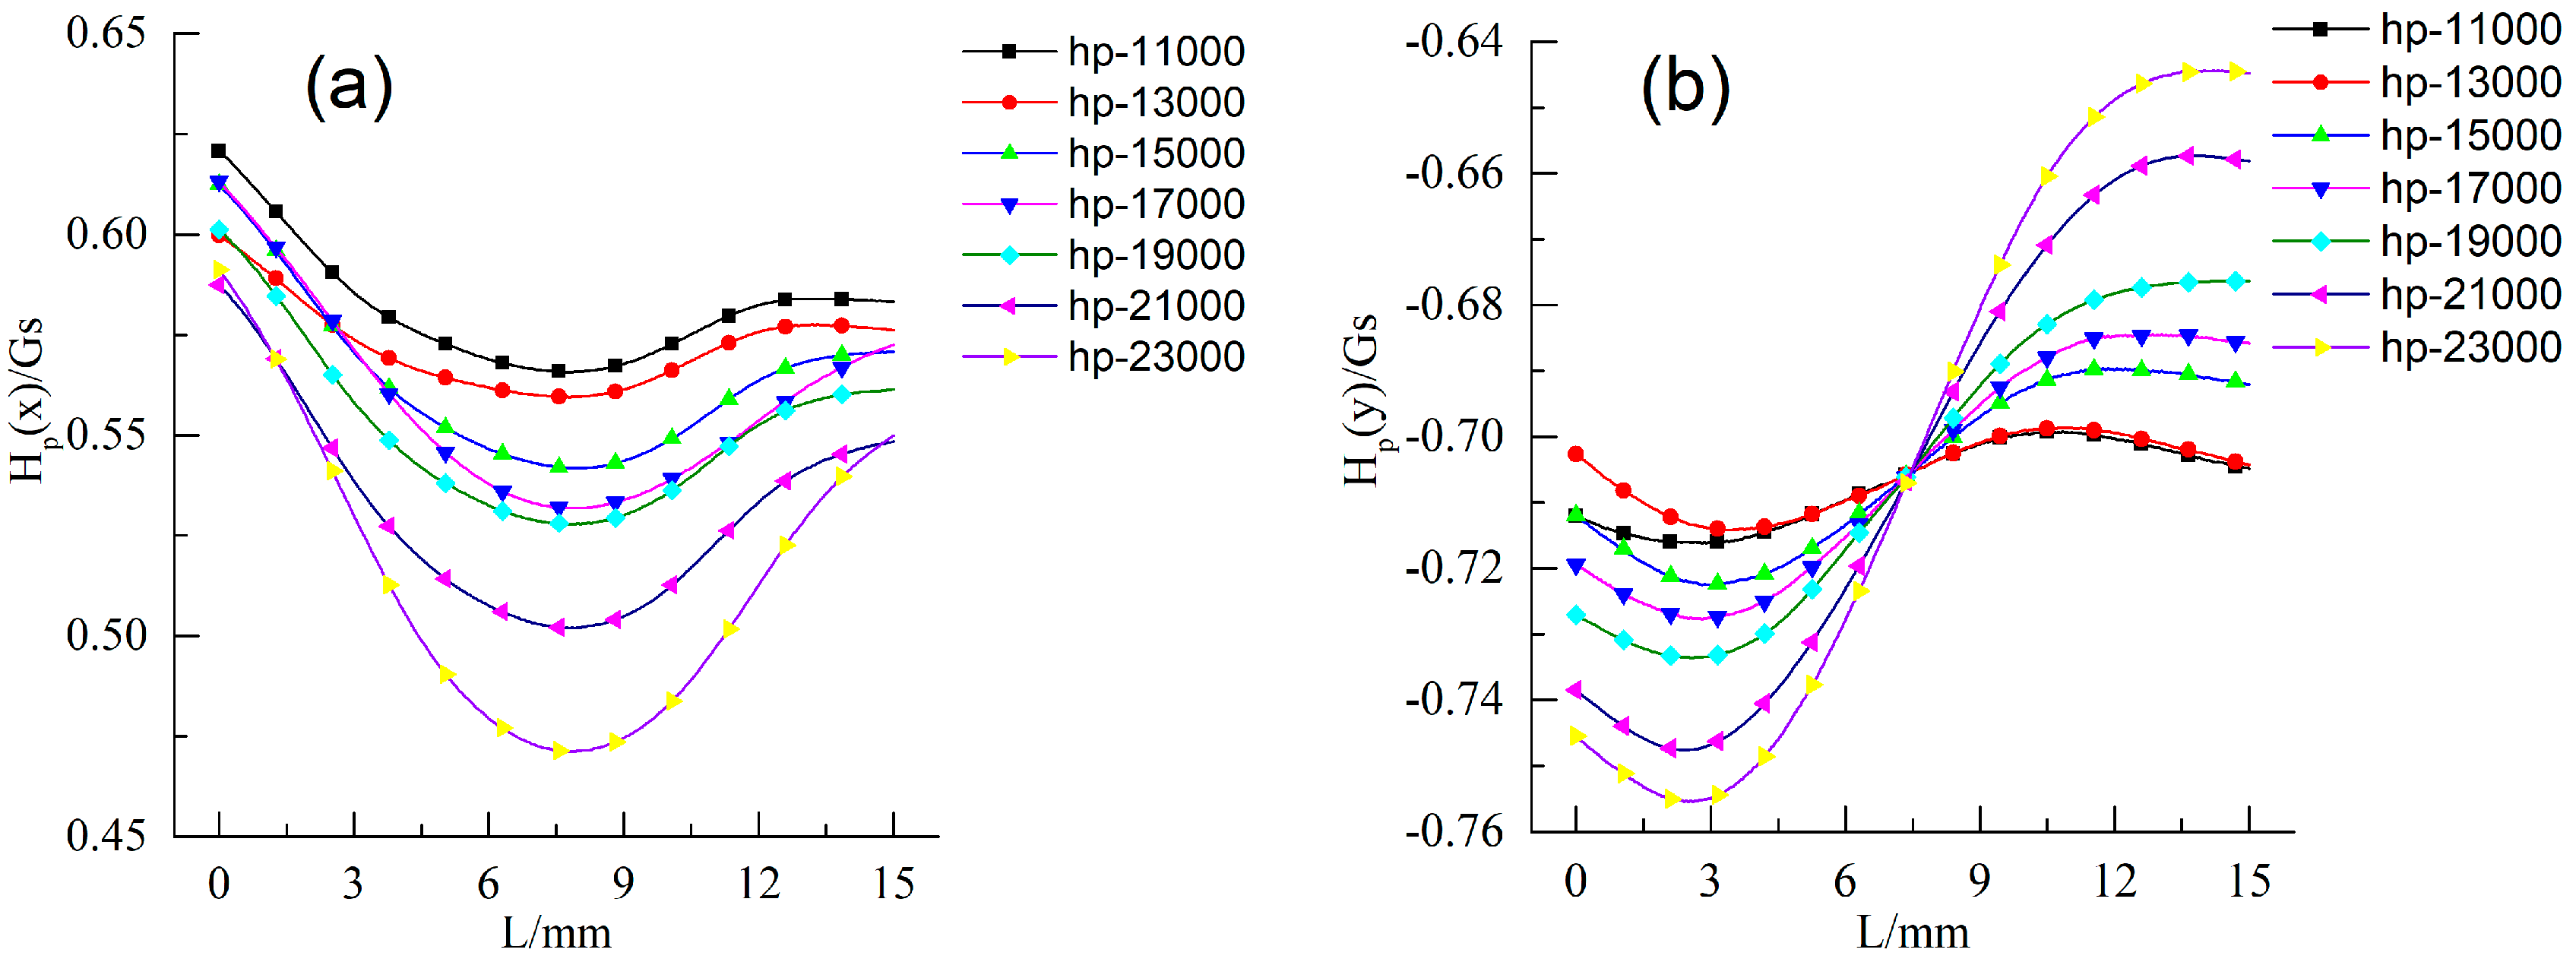
Figure 14.
Variations of Hp(x)min at different fatigue cycles.

Figure 15.
Variations of K(x)max and K(y)max at different fatigue cycles.

Figure 16.
The relationship between the characteristics and the length of the crack propagation after linear fitting: (a) Hp(x)min; (b) K(x)max; and (c) K(y)max.
Figure 16.
The relationship between the characteristics and the length of the crack propagation after linear fitting: (a) Hp(x)min; (b) K(x)max; and (c) K(y)max.

Figure 17.
Magnetic field distribution of the notch: (a) before loading; and (b) after loading.


Table 1.
Chemical components (%) of the specimen material.
| Material | C | Si | Mn | P | S | Cr | Mo |
|---|---|---|---|---|---|---|---|
| 35CrMo | 0.32~0.40 | 0.17~0.37 | 0.40~0.70 | ≤0.035 | ≤0.035 | 0.80~1.10 | 0.15~0.25 |
Table 2.
Mechanical properties of the specimen material.
| Material | Yield Strength σs (MPa) | Ultimate Strength σb (MPa) | Impact Toughness Value аkv (J/cm2) |
|---|---|---|---|
| 35CrMo | ≥835 | ≥985 | ≥78 |
© 2018 by the authors. Licensee MDPI, Basel, Switzerland. This article is an open access article distributed under the terms and conditions of the Creative Commons Attribution (CC BY) license (http://creativecommons.org/licenses/by/4.0/).
Share and Cite
MDPI and ACS Style
Hu, Z.; Fan, J.; Wu, S.; Dai, H.; Liu, S. Characteristics of Metal Magnetic Memory Testing of 35CrMo Steel during Fatigue Loading. Metals 2018, 8, 119. https://doi.org/10.3390/met8020119
AMA Style
Hu Z, Fan J, Wu S, Dai H, Liu S. Characteristics of Metal Magnetic Memory Testing of 35CrMo Steel during Fatigue Loading. Metals. 2018; 8(2):119. https://doi.org/10.3390/met8020119
Chicago/Turabian StyleHu, Zhibin, Jianchun Fan, Shengnan Wu, Haoyuan Dai, and Shujie Liu. 2018. "Characteristics of Metal Magnetic Memory Testing of 35CrMo Steel during Fatigue Loading" Metals 8, no. 2: 119. https://doi.org/10.3390/met8020119
Note that from the first issue of 2016, this journal uses article numbers instead of page numbers. See further details here.