Review

Atomistic Simulations to Predict Favored Glass-Formation Composition and Ion-Beam-Mixing of Nano-Multiple-Metal-Layers to Produce Ternary Amorphous Films

Key Laboratory of Advanced Materials (MOE), School of Materials science and Engineering, Tsinghua University, Beijing 100084, China
*
Author to whom correspondence should be addressed.
Metals 2018, 8(2), 129; https://doi.org/10.3390/met8020129
Submission received: 17 January 2018 / Revised: 4 February 2018 / Accepted: 7 February 2018 / Published: 11 February 2018

Abstract

:
Based on the framework of long-range empirical formulas, the interatomic potentials were constructed for the Ni-Nb-Mo (fcc-bcc-bcc) and Ni-Zr-Mo (fcc-hcp-bcc) ternary metal systems. Applying the constructed potentials, atomistic simulations were performed to predict the energetically favored glass formation regions (GFRs) in the respective composition triangles of the systems. In addition, the amorphization driving forces (ADFs), i.e., the energy differences between the solid solutions and disordered phases, were computed and appeared to correlate with the so-called glass forming abilities. To verify the atomistic prediction, ion beam mixing with nano-multiple-metal-layers was carried out to produce ternary amorphous films. The results showed that the composition of ternary amorphous films obtained by ion beam mixing all locate inside the GFRs, supporting the predictions of atomistic simulations. Interestingly, the minimum ion dosage required for amorphization showed a negative correlation with the calculated ADF, implying that the predicted amorphization driving force could be an indicator of the glass formation ability.

1. Introduction

Amorphous alloys (i.e., metallic glasses, MGs) have attracted significant interest due to their eminent physical, chemistry and mechanical properties [1,2,3,4,5]. Several powerful non-equilibrium processing techniques, e.g., liquid melt quenching [6], ion beam mixing (IBM) [7,8], mechanical alloying [9,10] and laser-melting techniques [11,12,13], have been developed to produce amorphous alloys. Among these techniques, the ion beam mixing [14] technique is capable of fabricating MGs in both miscible and immiscible metal systems [15,16]. Since the effective cooling speed is as high as 1012–1013 K/s, IBM is a very powerful and effective method to produce a number of amorphous alloys in equilibrium immiscible systems. In the field of MGs, one fundamental scientific issue is estimating glass formation ability (GFA), which describes the level of difficulty or easiness of metallic glass formation [17,18,19]. In the past decades, researchers have proposed several empirical criteria or rules to indicate the GFA of an alloy. For instance, with regard to the equilibrium phase diagram, Turnbull et al. [20] have suggested a deep eutectic criterion to predict metallic glass formation upon liquid melt quenching. By employing extensive IBM studies, Liu et al. [7] have put forward a structural difference rule to predict amorphous alloy formation by IBM, and further proposed the total width of two-phase regions derived from the equilibrium phase diagram could characterize the GFR of a binary metal system [21,22]. In addition, Inoue et al. [23] and Johnson et al. [24] have framed the empirical rules to predict element selection and the composition range of glass-forming alloys. Although these empirical criteria or rules are helpful for producing amorphous alloys, they cannot satisfyingly predict the GFR/GFA [25,26,27,28]. Therefore, the issue is a challenging one and needs to be further clarified.
In general, the IBM contains two consecutive steps, i.e., the atomic collision cascade and relaxation [29,30,31,32]. Naturally, the short relaxation period, approximately 10−10–10−9 s, not only restricts the kinetic conditions for the alloy phase formation, but also influences the structural characteristics of the alloy phase. During the relaxation, only a few atomic rearrangements are allowed to form a metastable crystalline phase of simple structure, otherwise the disordered state is preserved to form a glassy phase. As a result, the non-equilibrium alloys derived from the IBM approach are either the simple structural crystalline alloys or amorphous alloys. It follows that the competing phase to the amorphous phase is the solid solution with simple structure, i.e., fcc, hcp or bcc. A great number of research studies [25,26] have supported this point of view. Therefore, the issue of estimating the glass formation region becomes a comparison of the relative stability of the solid solution phase versus the amorphous phase as a function of alloy compositions. In the present work, IBM of nano-multiple-metal-layers is conducted to support the favored alloy composition predicted by the developed model.
Recently, thin film MGs have been extensively studied in the fields of science and engineering. The research significance of thin film MGs is mainly due to their interesting mechanical properties [33,34,35,36,37]. For instance, by increasing the Ni concentration from 25% to 48%, there is an increase of elastic modulus, Poisson’s ratio, strength, activation volume, and fracture toughness in ZrxNi100−x thin film MGs [35]. Besides, although both the failure mechanisms and the mechanisms leading to the onset of plasticity are independent for Zr65Ni35 thin films, they are dependent on the shear banding process in bulk MGs [36]. Nevertheless, the GFR/GFA of an alloy is the principle question in the field of MGs. ZrCu, ZrNi and NiNb binary systems have attracted extensive attention because they are all representative models with a wide amorphization range [38,39,40,41,42,43,44]. Buschow et al. [38] fabricated the Zr-Ni MGs by melt spinning over a wide range of 3d-metal concentrations. Meanwhile, Ghidelli et al. [39] investigated the atomic structure of ZrxNi100−x thin film MGs produced by DC-Magnetron sputtering. However, Mo additions to the glass formation of ZrNi and NiNb binary systems studied by both atomistic simulation and IBM of nano-multiple-metal-layers, is still lacking.
In principle, the GFA of an alloy is not only based on the applied production technique, but also is determined by the basic characteristics of the metal systems. From the physical perspective, the interatomic interaction of a metal system can be described by the interatomic potential, which governs the energetic states of the alloy phases and physical properties, including the GFR/GFA of an alloy. Once the interatomic potential of the metal system is developed, the interatomic interactions and physical behaviors could be determined through the relevant simulation [25,26,27,28]. Taking the interatomic potential as the initial base, we developed a reliable model to clarify the underlying process of metallic glass formation and design the optimized compositions to fabricate the MGs. To address the issue, we focused on developing an atomistic model that could predict a quantitative alloy composition region for metallic glass formation, and compute the amorphization driving force (ADF) for a specific alloy. We focused on the ternary transition metal systems containing at least two different crystalline structures, and chose the Ni-Nb-Mo (fcc-bcc-bcc) and Ni-Zr-Mo (fcc-hcp-bcc) systems to discuss the relevant physical properties. Several scientific issues are discussed as follows: (i) a set of long-range interatomic potentials is proposed for the Ni-Nb-Mo and Ni-Zr-Mo ternary systems; (ii) atomistic simulations, including molecular dynamics (MD) and Monte Carlo (MC), are performed to derive the favored metallic glass formation composition for the respective ternary systems; and (iii) ion beam mixing experiments of nano-multiple-metal-layers are conducted to investigate the metallic glass formation predicted by the atomistic simulations.

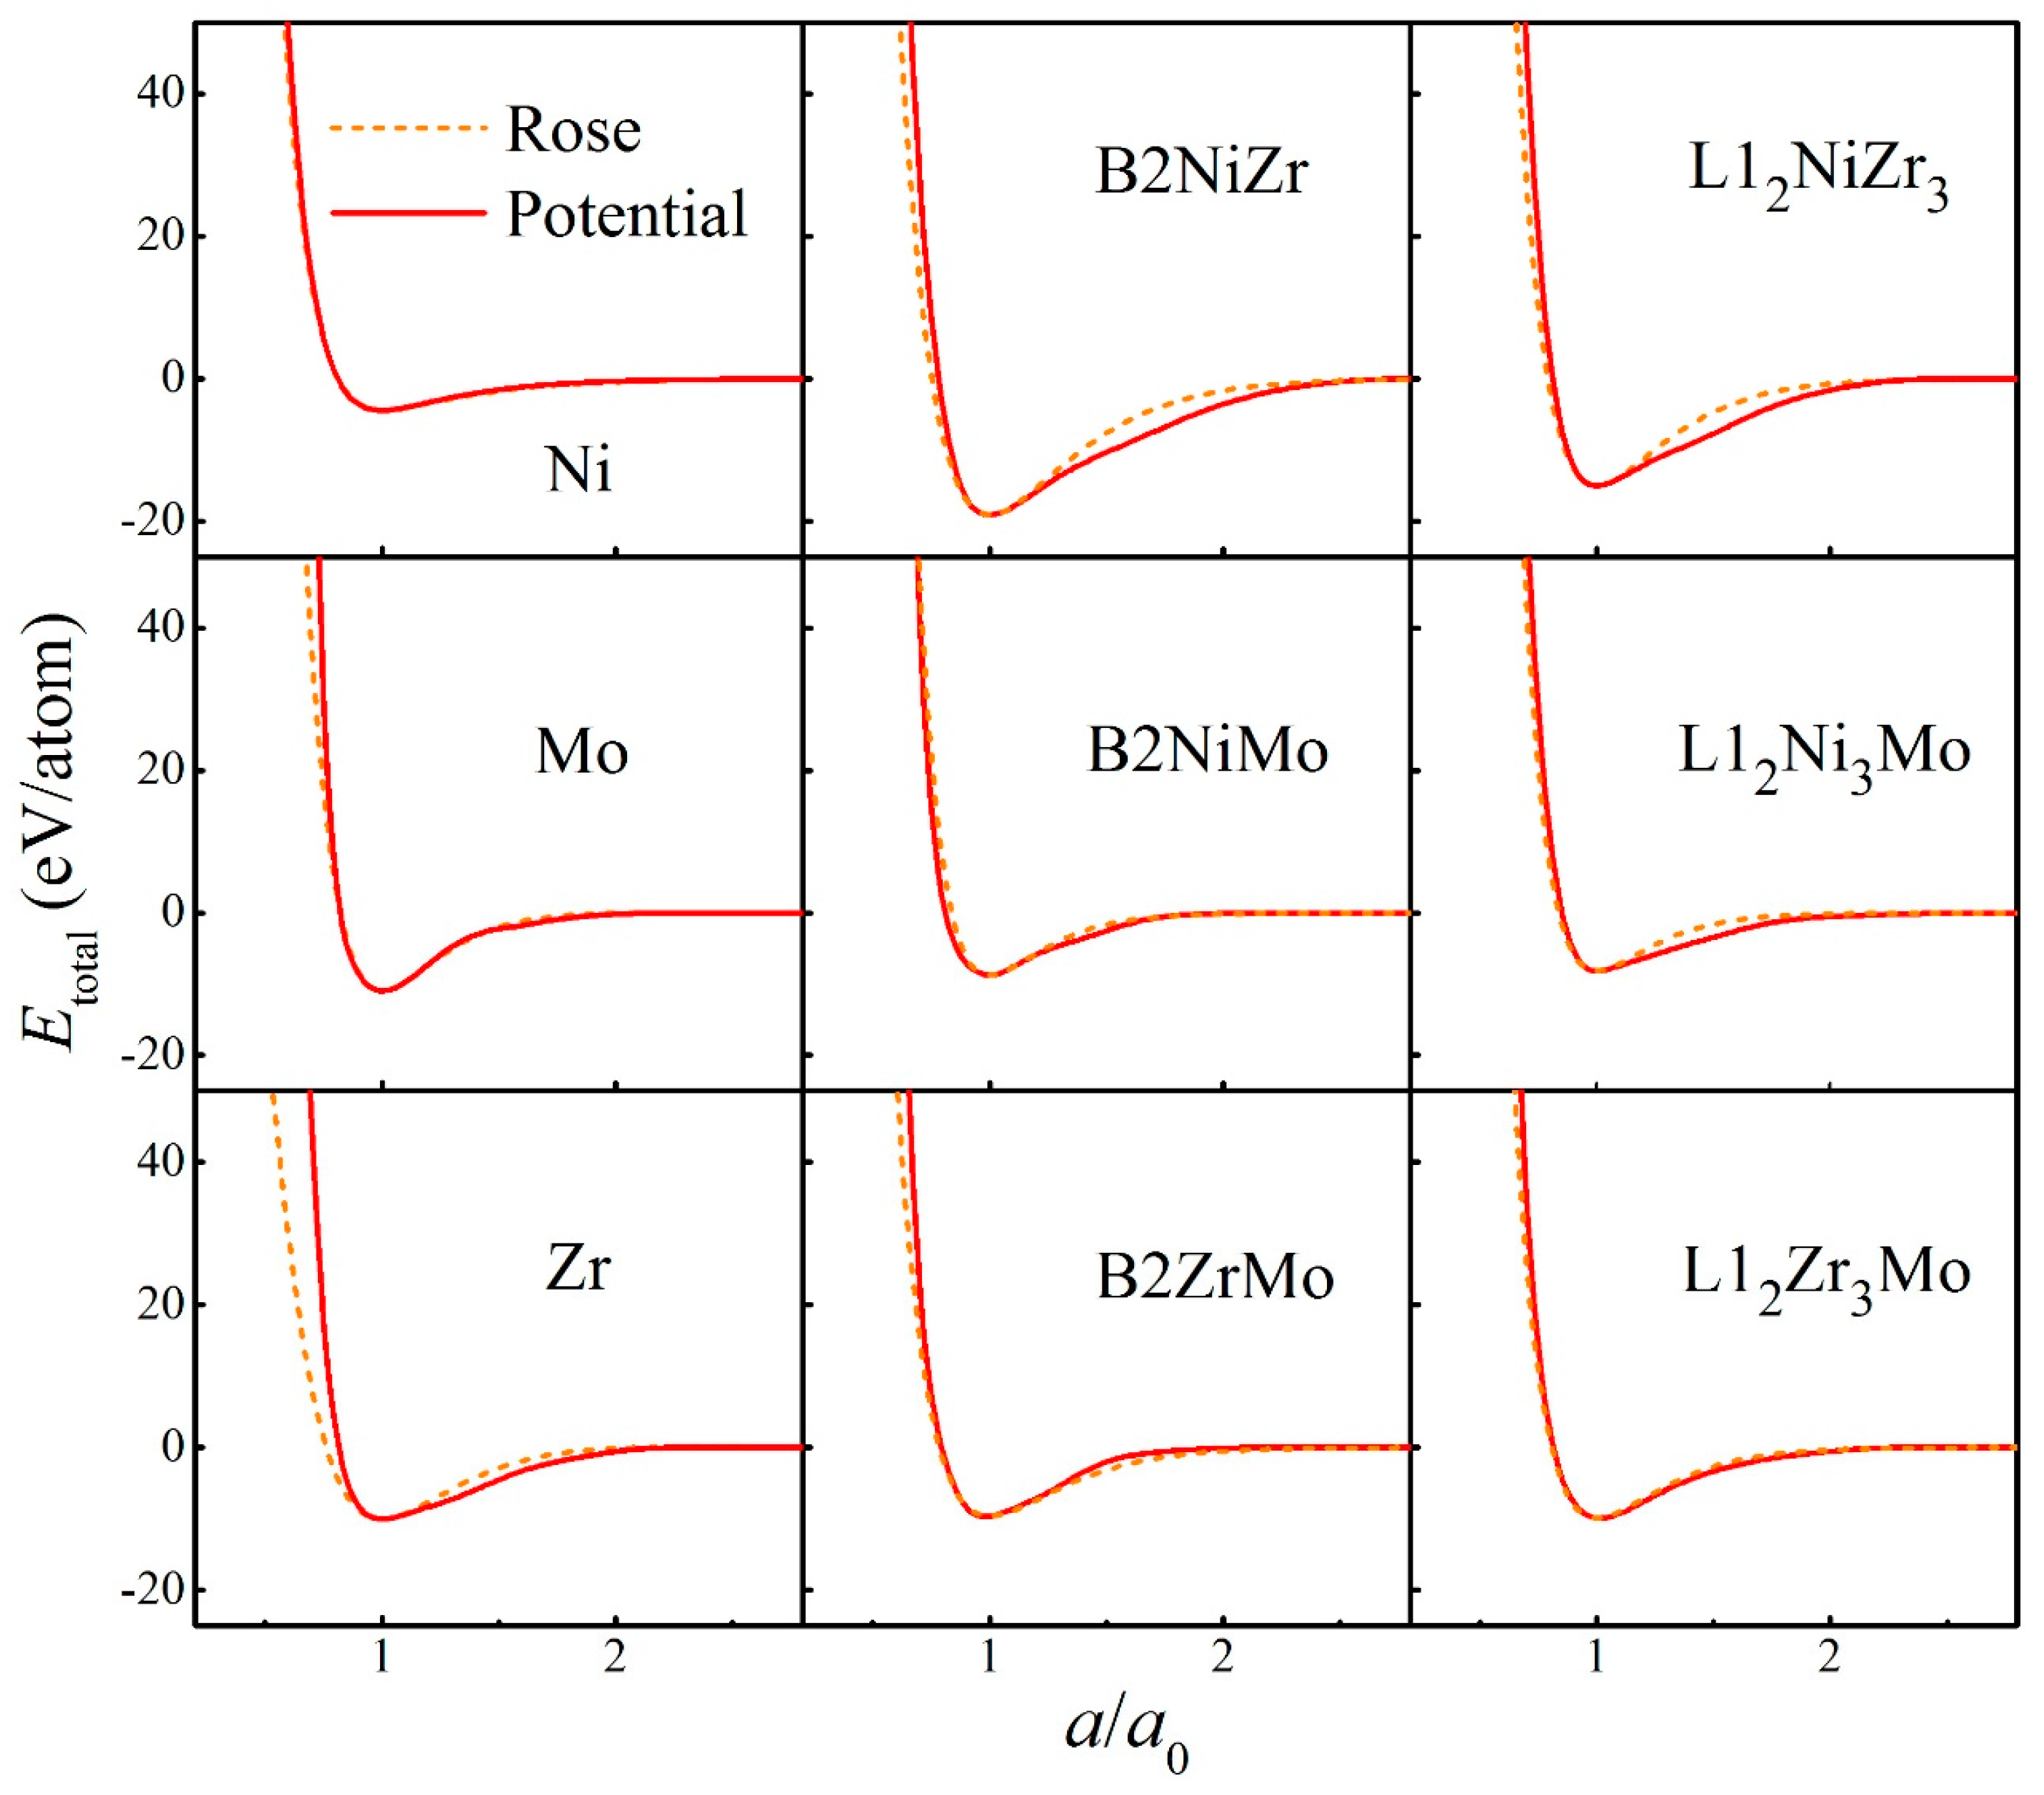
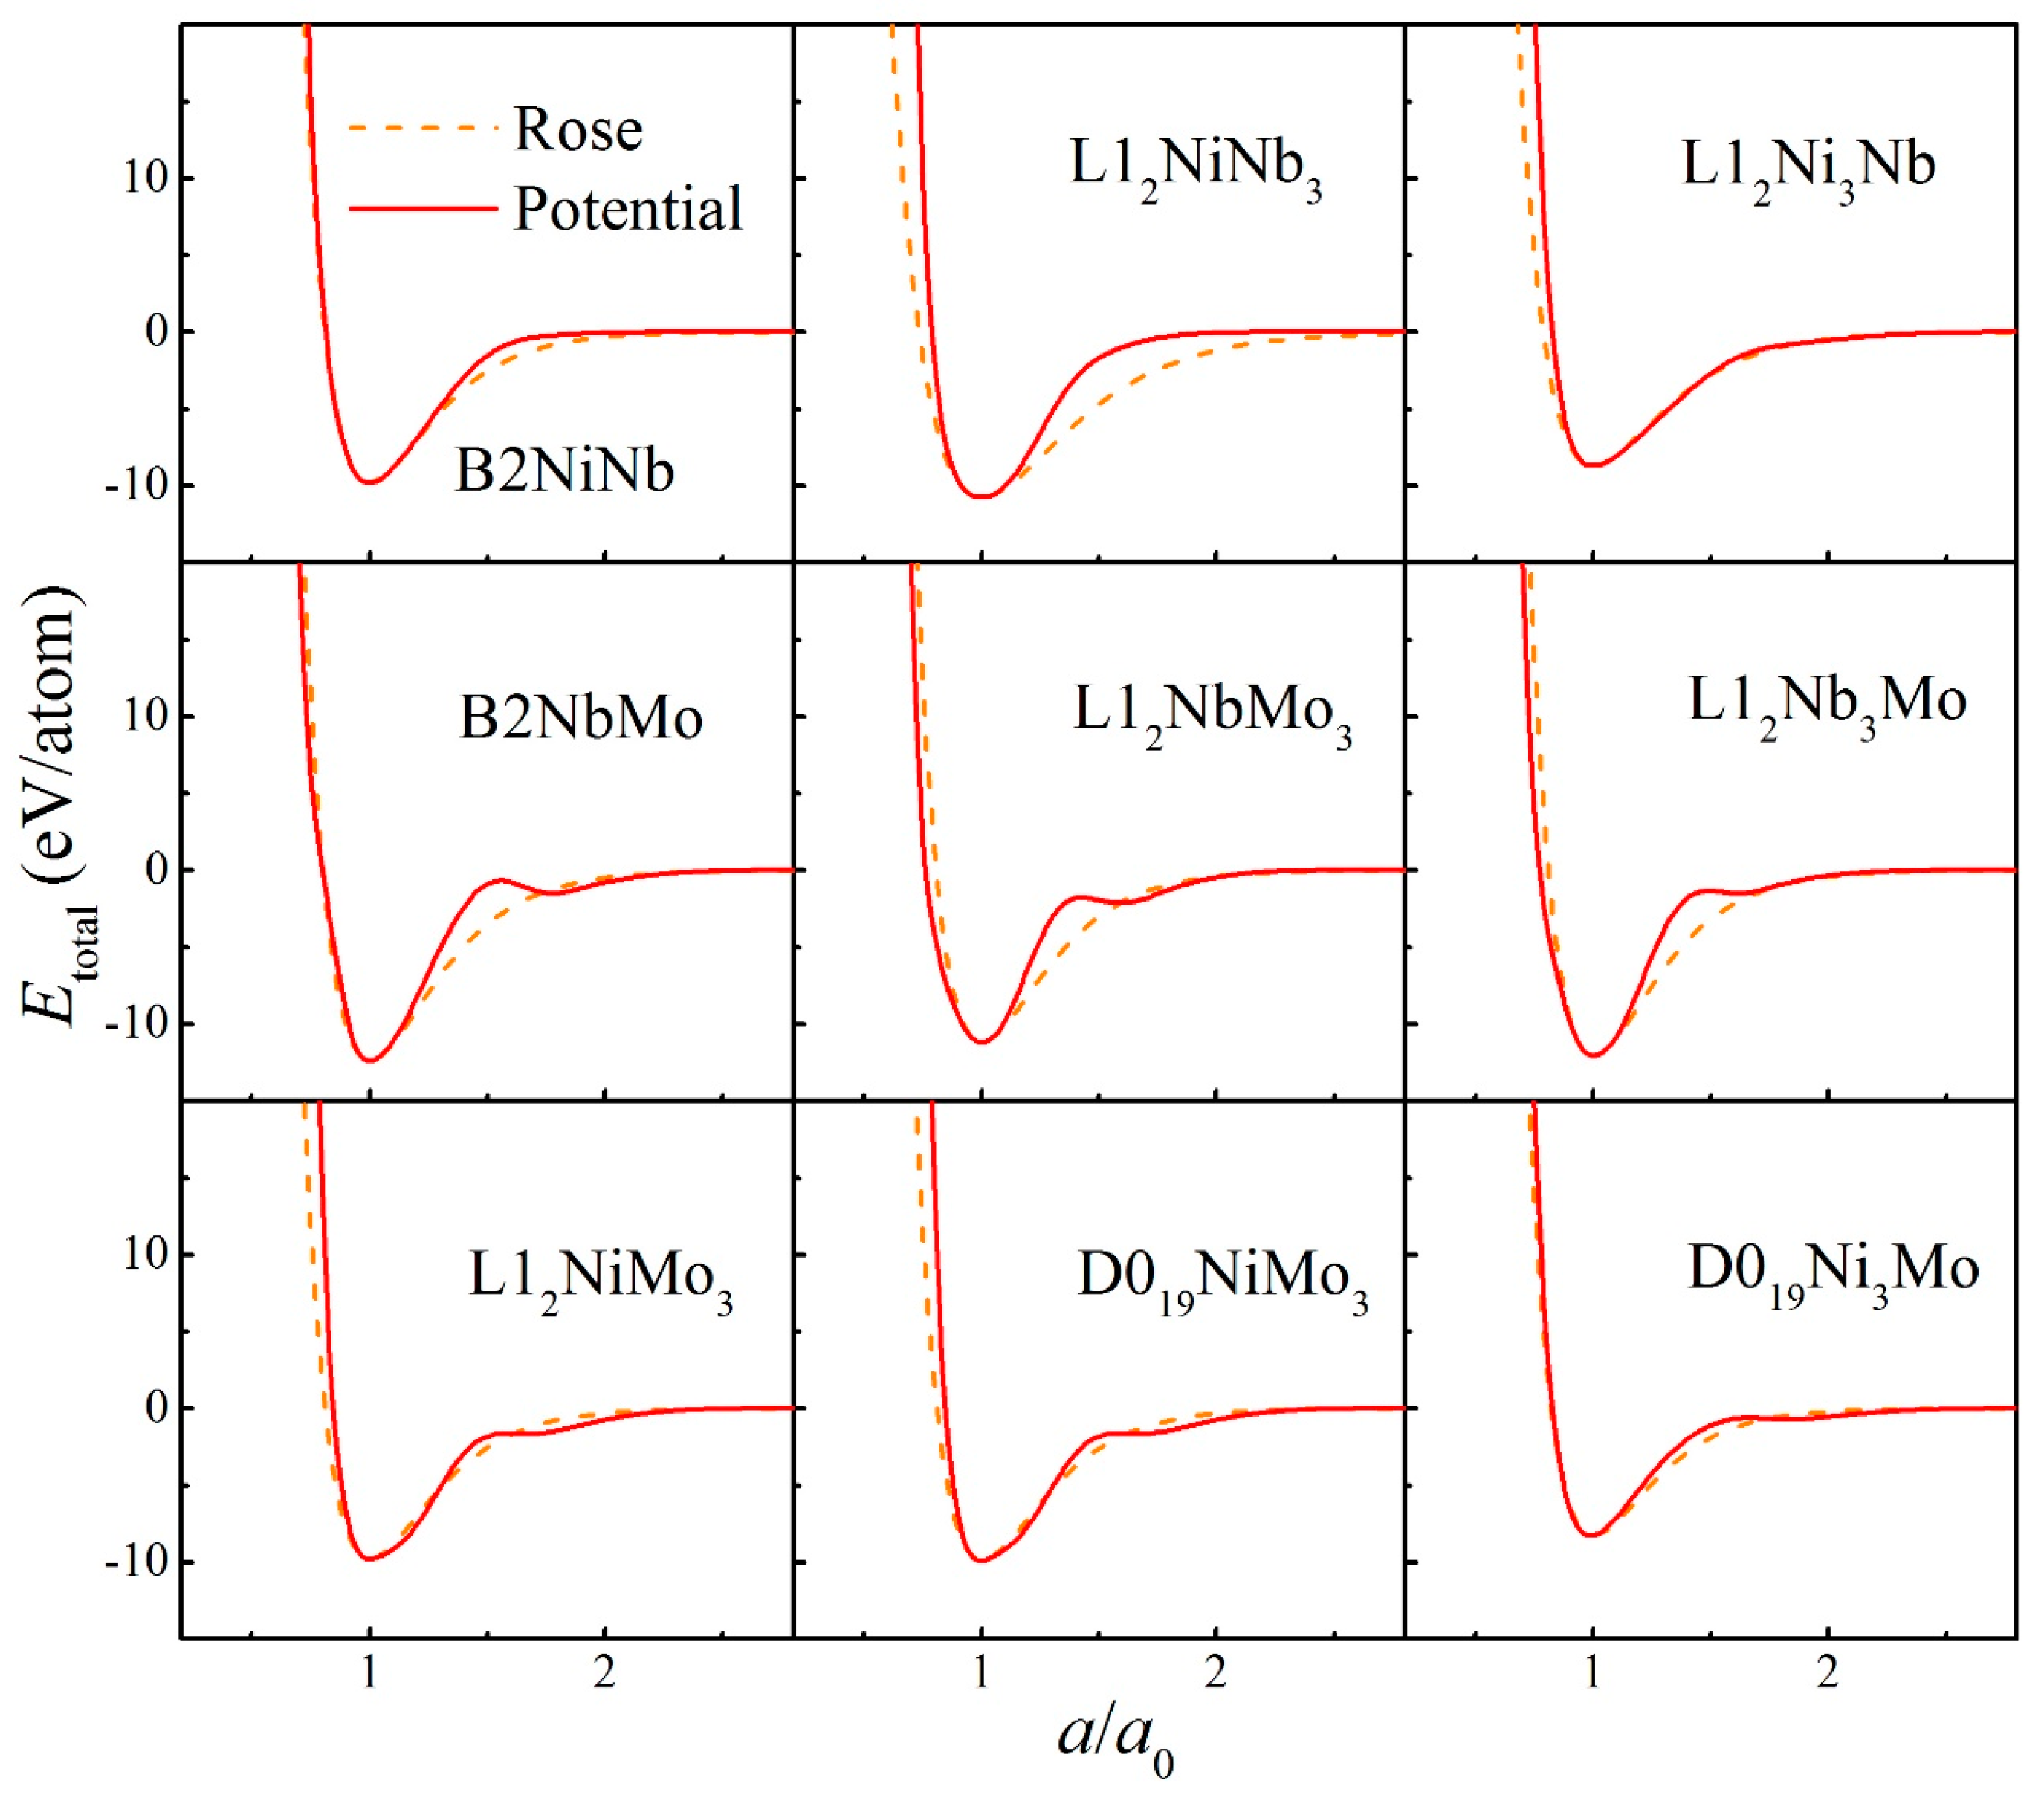
2. Construction of Ternary Interatomic Potential

The interatomic potential of a ternary system describes the interatomic interactions among the atoms involved. Therefore, if the potential is determined, most of the physical properties, including the GFA as well as the atomic configuration, can be computed or derived from relevant simulations. Great efforts have been devoted to develop realistic potentials, e.g., the embedded atom method (EAM) [45,46], the Finnis-Sinclair potential [47], the second-moment approximation of tight-binding (TB-SMA) potential [48],and their various modifications [49,50,51].
Dai et al. [52,53,54] have proposed a long-range empirical potential for bcc and fcc metals, and also extended this to hcp metals. Based on the long-range empirical potential [55,56], the potential energy Ei of atom i can be calculated as follows:
E i = 1 2 j i V ( r i j ) j i ϕ ( r i j )
where rij is the distance between atoms i and j of the alloy system at equilibrium. The pair term V(rij) and electron-density term ϕ(rij) can be expressed, respectively, by:
V ( r i j ) = ( 1 r i j / r c 1 ) m ( c 0 + c 1 r i j + c 2 r i j 2 + c 3 r i j 3 + c 4 r i j 4 ) , 0 < r i j r c 1
ϕ ( r i j ) = α 2 ( 1 r i j / r c 2 ) n , 0 < r i j r c 2
where rc1 and rc2 are the cutoff radii for the pair and electron-density terms, respectively, α and ci are the potential parameters to be determined by the fitting procedure. The exponents m and n are integers that can be adjusted according to a specific system.
For an A-B-C ternary metal system constituted by any combination of the fcc, hcp and bcc metals, there should be six sets of potential parameters, i.e., three sets for interactions of pure metals A-A, B-B and C-C, and three sets for the cross interactions of A-B, B-C and C-A. The potential parameters of pure metals can be determined by fitting to the basic physical properties, i.e., the cohesive energies, lattice constants, bulk moduli, and elastic constants of the pure metals [57]. The cross potential parameters of A-B, B-C and C-A can be determined by fitting to the basic physical properties of the intermetallic compounds with various compositions and structures. To obtain the physical properties of the compounds, the first-principle calculations were performed by employing the Cambridge Serial Total Energy Package (CASTEP) [58,59] in Material Studio, which uses the projector augmented wave (PAW) method [60] to yield higher computation efficiency. During the calculation, the exchange and correlation functions are chosen as the generalized-gradient approximation (GGA) of Perdew and Wang (PW91) [61]. Firstly, the geometry optimization is performed to calculate the lattice constants and total energies of compounds at equilibrium, and then the elastic constants and bulk moduli are calculated. Besides, the cohesive energy of the compounds is also derived from the total energy obtained by first-principle calculation.
The fitted potential parameters of the Ni-Nb-Mo (fcc-bcc-bcc) system [55] are presented in Table 1. Furthermore, the potential parameters of the Ni-Zr-Mo (fcc-hcp-bcc) system [56] constituted by three major different crystalline structures are presented in Table 2. Table 3 and Table 4 present the lattice constants, cohesive energies, and bulk moduli of B2 and L12 compounds in the Ni-Nb-Mo and Ni-Zr-Mo systems computed from the constructed interatomic potentials. The physical properties derived from potentials match well with those via the first-principle calculations and experiments [62,63,64]. This proves the reliability of the constructed interatomic potentials. In addition, to examine whether constructed potentials can describe interactions at non-equilibrium states or not, the equation of states (EOS) derived from potentials was computed and compared with the Rose Equation [65]. From Figure 1 and Figure 2, it can be seen that the energy curves calculated from potentials remain smooth and continuous with the Rose Equation over the whole range, for both the Ni-Nb-Mo and Ni-Zr-Mo systems. The constructed long-range empirical potentials turn out to effectively determine the interatomic potentials, even far from the equilibrium state. This confirms that the developed potentials can well characterize the structure and energy of the respective systems.

3. Methods and Models

3.1. Atomistic Simulation

Based on the constructed ternary interatomic potential, a series of molecular dynamics (MD) simulations were performed using the Large-scale Atomic/Molecular Massively Parallel Simulator (LAMMPS) package [66]. To study the relative stabilities of the Ni-Zr-Mo (fcc-hcp-bcc) ternary system, three types of solid solution models, i.e., fcc, hcp, and bcc models, were constructed according to the dominate component of the alloy composition. For example, the fcc solid solution model consists of 6912 (12 × 12 × 12 × 4) atoms, among which the main component is Ni, then the solute atoms were randomly substituted by a certain number of solvent atoms to achieve a desired concentration. Periodic boundary conditions were applied in the three directions. With a time-step of 5 × 10⁻¹⁵ s, MD simulations were performed in the framework of an isothermal-isobaric ensemble. To reach a stable state, the simulation was performed at 300 K and 0 Pa for millions of time steps until all the related dynamic variables exhibited no secular variation. In addition to MD simulations, a series of MC simulations were performed to calculate the formation energy of the solid solution [25,26]. The MC simulations were conducted at 300 K and 0 Pa under an isothermal-isobaric ensemble. They were performed in the box deformation model, where the fractional coordinates of atoms in the box are fixed but the box could either expand or shrink. To reach the minimum energy state, the solid solution model is adjusted by optimizing the lattice constants with the same symmetry. According to recent studies [67], the simulated solid solution model can be compared to the liquid melt quenching process via the atomistic simulations. The inherent hierarchical structure and its effect on the mechanical property of MGs are clarified by the solid solution model and liquid melt quenching method via atomistic simulations. It was revealed that both producing techniques exhibit no pronounced differences in the local atomic structure and mechanical behavior. Therefore, the atomistic simulations in the present work reveal the physics of the thin film metallic glasses.
The structural changes for the solid solution models are monitored by the structure factor S(q). The S(q) [68] can be computed by
S ( q ) = 1 N | k = 1 N b k exp ( i q r k ) | 2
where N is the number of atoms, q is the scattering vector, bk and rk are the scattering length and position vector of atom k, respectively. Besides, the S(q) calculated by Equation (4) is not normalized.

3.2. Ion Beam Mixing

To design the nano-multiple-metal-layers, we need to consider and determine three parameters, i.e., the total thickness of the layers, the relative thickness of the two constituent metals and the individual layer thickness in the samples. During the ion beam mixing experiment, uniform mixing was achieved when the total thickness of the layers was measured to be in the projected range (Rp), plus the projected range straggling (ΔRp) of the irradiation ions [69]. According to the transport of ions in matter (TRIM) program [70], the total thickness of the A-B-C ternary metal layers was computed to be around 40 nm, matching the irradiation ion range. The relative thickness of two constituent metals can be calculated by separating the total thickness of the layers depending on the desired alloy composition. The individual layer thickness should be thin enough to be mixed efficiently during ion beam mixing, and is 5 nm. Here, four sets of Ni-Nb-Mo nano-multiple-metal-layers [71], i.e., Ni50Nb38Mo12, Ni60Nb16Mo24, Ni70Nb22Mo8 and Ni50Nb20Mo30, and four sets of Ni-Zr-Mo nano-multiple-metal-layers [72], i.e., (NiZr)90Mo10, (NiZr)80Mo20, (NiZr)70Mo30, and (NiZr)60Mo40, were designed and fabricated to support the glass formation region predicted by the atomistic simulations. The real compositions for all of the Ni-Nb-Mo nano-multiple-metal-layers are: Ni52Nb35Mo13, Ni61Nb15Mo24, Ni72Nb20Mo8 and Ni51Nb19Mo30, suggesting the accuracy control of the thin film compositions. To promote the initial energetic state of the nano metal layers to a high level, 9 or 10 layers were employed to increase the interfaces free energy for each sample.
Afterwards, the A-B-C nano-multiple-metal-layers were prepared by alternatively depositing pure metal A (99.99%), B (99.99%) and C (99.99%) onto the NaCl single crystal substrate at a rate of about 0.3 Å/s. The e-gun evaporation system was under the vacuum level of 10−6 Pa. The as-deposited nano-multiple-metal-layers were irradiated by xenon ions within a range from 8 × 10¹⁴ to 7 × 10¹⁵ Xe+/cm2 in an implanter under a vacuum level lower than 5 × 10⁻⁴ Pa. In order to avoid overheating, the sample holder was cooled by liquid nitrogen (77 K), and the current density was limited to be 15 μA/cm2 during the irradiation process. To characterize the nano metal layer structures, the A-B-C nano-multiple-metal-layers were examined and investigated at room temperature (300 K) by a transmission electron microscopy. Also, the bright field image of samples was analyzed by high resolution transmission electron microscopy. To measure the real composition of the deposited and irradiated nano-multiple-metal-layers, X-ray fluorescence (XRF) and energy dispersive spectroscopy (EDS) were performed in the structure analysis.

4. Metallic Glass Formation Predicted by Atomistic Simulation

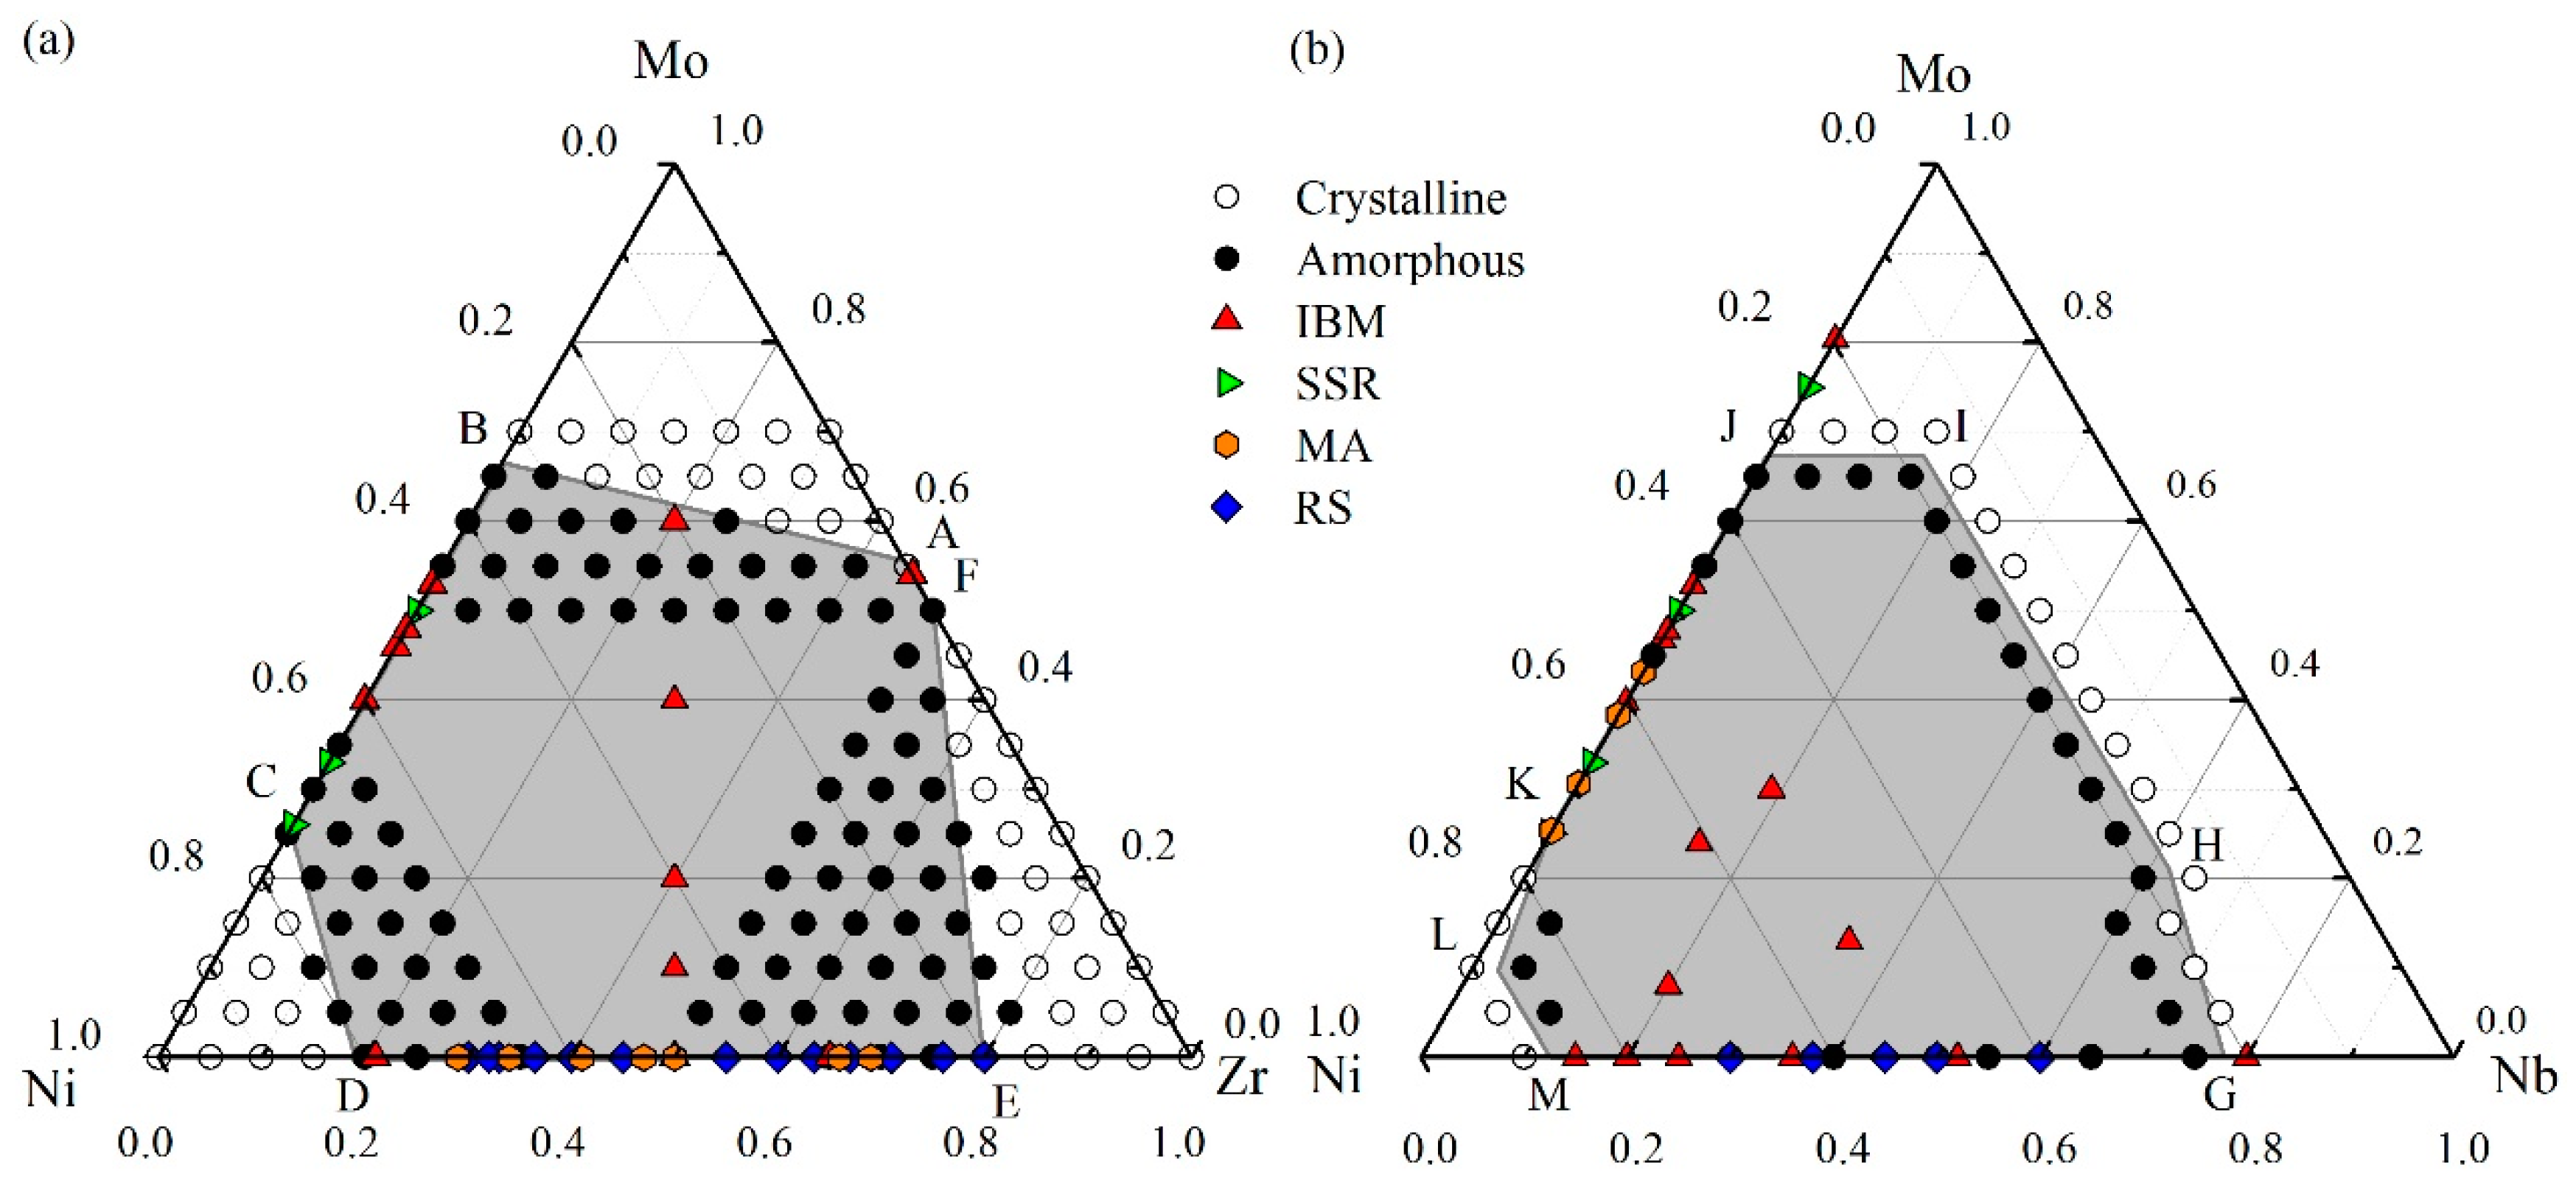
4.1. Glass Formation Region for the Ni-Zr-Mo System

By performing MD simulations, two different states of Ni-Zr-Mo alloys were obtained: a crystalline state (CS) and an amorphous state (AS). We take two alloys, i.e., Ni90Zr5Mo5 and Ni64Zr36, in the fcc-solid solution model as examples. Figure 3 presents the structure factor S(q) and projection of atomic positions for both states. For the Ni90Zr5Mo5 alloy, the S(q) curve in Figure 3a exhibits a typical crystalline feature, which is associated with the atomic position projection in Figure 3b. For the Ni64Zr36 alloy, all the crystalline peaks beyond the second peak have either flattened or disappeared as shown in Figure 3c, matching well with the S(q) curve measured by X-ray diffraction (XRD) [73]. The atomic position projection of Ni64Zr36 in Figure 3d indicates that the original crystalline lattice has spontaneously collapsed and transformed into an amorphous state. It follows that by increasing the solute concentration, the crystalline lattice of the original solid solution model would be seriously distorted, and finally turn into a disordered state. Consequently, the underlying physical mechanism of the crystal-to-amorphous transformation is the collapsing of crystalline lattice in a solid solution model when the solute concentration exceeds the critical solid solubility.
According to the results of MD simulations, we have grouped all the NixZryMo100–x−y alloys into two structural states, i.e., crystalline state (CS) and amorphous states (AS). The constructed glass formation region at 300 K is shown in Figure 4a. The Ni-Zr-Mo composition triangle can be divided into four regions by three critical solubility lines, i.e., AB, CD and EF. When an alloy composition situates beyond the critical lines towards one of the three corners, the Ni-Zr-Mo alloy keeps its original crystalline structure, and all of three corner regions are considered as crystalline regions. When an alloy composition falls into the central hexagonal region enclosed by the critical lines, the crystalline structure becomes unstable and then completely collapses, transforming into a disordered state. This shaded area is therefore identified as the amorphous area, i.e., the GFR of the Ni-Zr-Mo system. In addition, we compare the simulated GFR with the thermodynamic predictions and experimental data. According to the other studies [72], the GFR predicted by the thermodynamic calculation within the framework of Miedema’s model and Alonso’s method mostly overlaps the simulated GFR. Besides, various experimental data have been collected and marked by different symbols, mostly located within the central hexagonal region. For the Ni-Mo side, the glass formation composition range of 25–68 at.% Mo predicted in Figure 4a presents a minor deviation from that of 25–75 at.% Mo, obtained from a solid-state reaction (SSR) [74]. The deviation may be caused by the factors such as the ideal simulation model, impurities, and chemical and structural fluctuations [75]. For the Ni-Zr side, the mechanical alloying (MA) [76] experiments reveal a glass formation range of 24–83 at.% Zr. Besides, XRD diffractograms of ZrxNi100−x thin film MGs produced by magnetron sputtering method [39] indicate that the compositions are lying within the present simulated amorphization range (10–80 at.% Zr), namely Zr42Ni58, Zr65Ni35 and Zr75Ni25. Furthermore, ternary Ni-Zr-Mo MGs, e.g., (NiZr)100−xMox, can be fabricated by IBM (marked as red triangles), and completely located within the central shaded region. Therefore, MD simulation can design and predict the glass formation region of the Ni-Zr-Mo system well.

4.2. Glass Formation Region for the Ni-Nb-Mo System

Similarly, the whole Ni-Nb-Mo composition region as shown in Figure 4b can be divided into three regions by two CS-AS boundary polylines, i.e., GHIJ and KLM. The central shaded area surrounded by the two polylines GHIJ and KLM is considered as the amorphous region of the Ni-Nb-Mo system, within which metallic glasses are energetically favored to form. By comparison, the GFR of the Ni-Nb-Mo system derived from thermodynamics [71] covers most of the simulated region. Besides, the IBM data [71] for the Ni-Nb system indicate a glass formation range of 15–80 at.% Nb, whereas the RS data [43] present a range of 30–60 at.% Nb. Both glass formation composition regions in the experiment are close to that of 15–75 at.% Nb in Figure 4b. In addition, ternary Ni-Nb-Mo metallic glasses produced by IBM are all located within the GFR, indicating the conformity between the MD simulations and the experimental data.
To further confirm the reliability of metallic glass formation derived from the MD simulations, the structure factor of the simulated Ni52Nb35Mo13 alloy was compared with the IBM experiments as shown in Figure 5. The first, second and third peaks are located at the q1 = 2.75 Å−1, q2 = 5.5 Å−1 and q3 = 8.05 Å−1, respectively. By analyzing the selected area diffraction (SAD) patterns of the transmission electron microscope (TEM) image, the average diameters of the three halos appearing in the SAD patterns were calculated to be 2.24, 4.21 and 6.09 centimeters, respectively. Afterwards, the wave vector, q can be transformed from the average diameters of the diffused halos, and measured as qa = 2.804 Å−1, qb = 5.269 Å−1 and qc = 7.622 Å−1, respectively. By comparing q1 to qa, q2 to qb, and q3 to qc, the maximum errors of the deviations are all lower than 5%, revealing that the S(q) curve corresponds to the SAD patterns. As a result, the atomic structure of the simulated alloy is similar to that of the real alloy produced by the experiments, indicating that the simulation model under the proposed long-range empirical formulas is reasonable.

4.3. Glass Formation Ability of the Ternary Systems

Theoretically, the energy difference between the solid solution and the amorphous phase serves as the driving force for the crystal-to-amorphous transition. The higher the driving force, the larger the GFA and the easier the metallic glasses can be synthesized, i.e., the issue related to evaluating the GFA of the ternary system can be transformed into calculating the driving force at a specific composition.
Let the Eam, Es.s stand for the average energy per atom of the amorphous phase and solid solution in the ternary A-B-C system. The amorphization driving force (ADF), i.e., energy difference between the solid solution and amorphous phase, can be computed by
Δ E am - s . s = E am E s . s
The ADFs of the Ni-Zr-Mo and Ni-Nb-Mo systems were calculated and are presented in Figure 6, in addition to the ADF of the (NiZr)100−xMox alloys along the vertical line XY. For the Ni-Zr-Mo system in Figure 6a, the ADF is negative within the whole GFR, suggesting that the formation energy of an amorphous phase is lower than that of the solid solution and the metallic glass formation is energetically favored. Intuitively, the larger the energy difference, the stronger the ADF, and the larger the GFA of the alloy. It was found that the alloys with compositions marked as red dots have a lower ADF than those with compositions in the other regions, suggesting a stronger ADF for the alloys. Within the red dot region, the Ni45Zr40Mo15 alloy symbolized by the black pentagram is shown as the composition with the maximum ADF. Additionally, the composition of Ni45Zr40Mo15 obtained from the atomistic simulation is close to that of Ni48Zr48Mo4 obtained from thermodynamic calculation [56]. Therefore, the Ni45Zr40Mo15 alloy and the nearby compositions can be considered energetically favored for metallic glass formation.
We also computed the ADF for the Ni-Nb-Mo system and the results are presented in Figure 6b. The maximum ADF for the Ni-Nb-Mo alloy is determined to be the composition of Ni55Nb30Mo15. In addition, the composition of Ni56Nb36Mo8 obtained from thermodynamics [71] is also close to that of Ni55Nb30Mo15 predicted by the atomistic simulations. As a result, the Ni55Nb30Mo15 alloy as well as the nearby compositions can be more thermally stable or easily produced than other Ni-Nb-Mo alloys. In particular, the ADF for the Ni-Nb binary system firstly increases by increasing the Nb concentration, and decreases after reaching the maximum ADF of the Ni-Nb alloy. The Ni45Nb55 alloy and the nearby compositions are considered to be most likely to form MGs for the Ni-Nb system. Similarly, the Ni55Mo45 alloy and the nearby compositions are most likely to form MGs for the Ni-Mo system.

5. Experimental Verification of Atomic Simulation Prediction

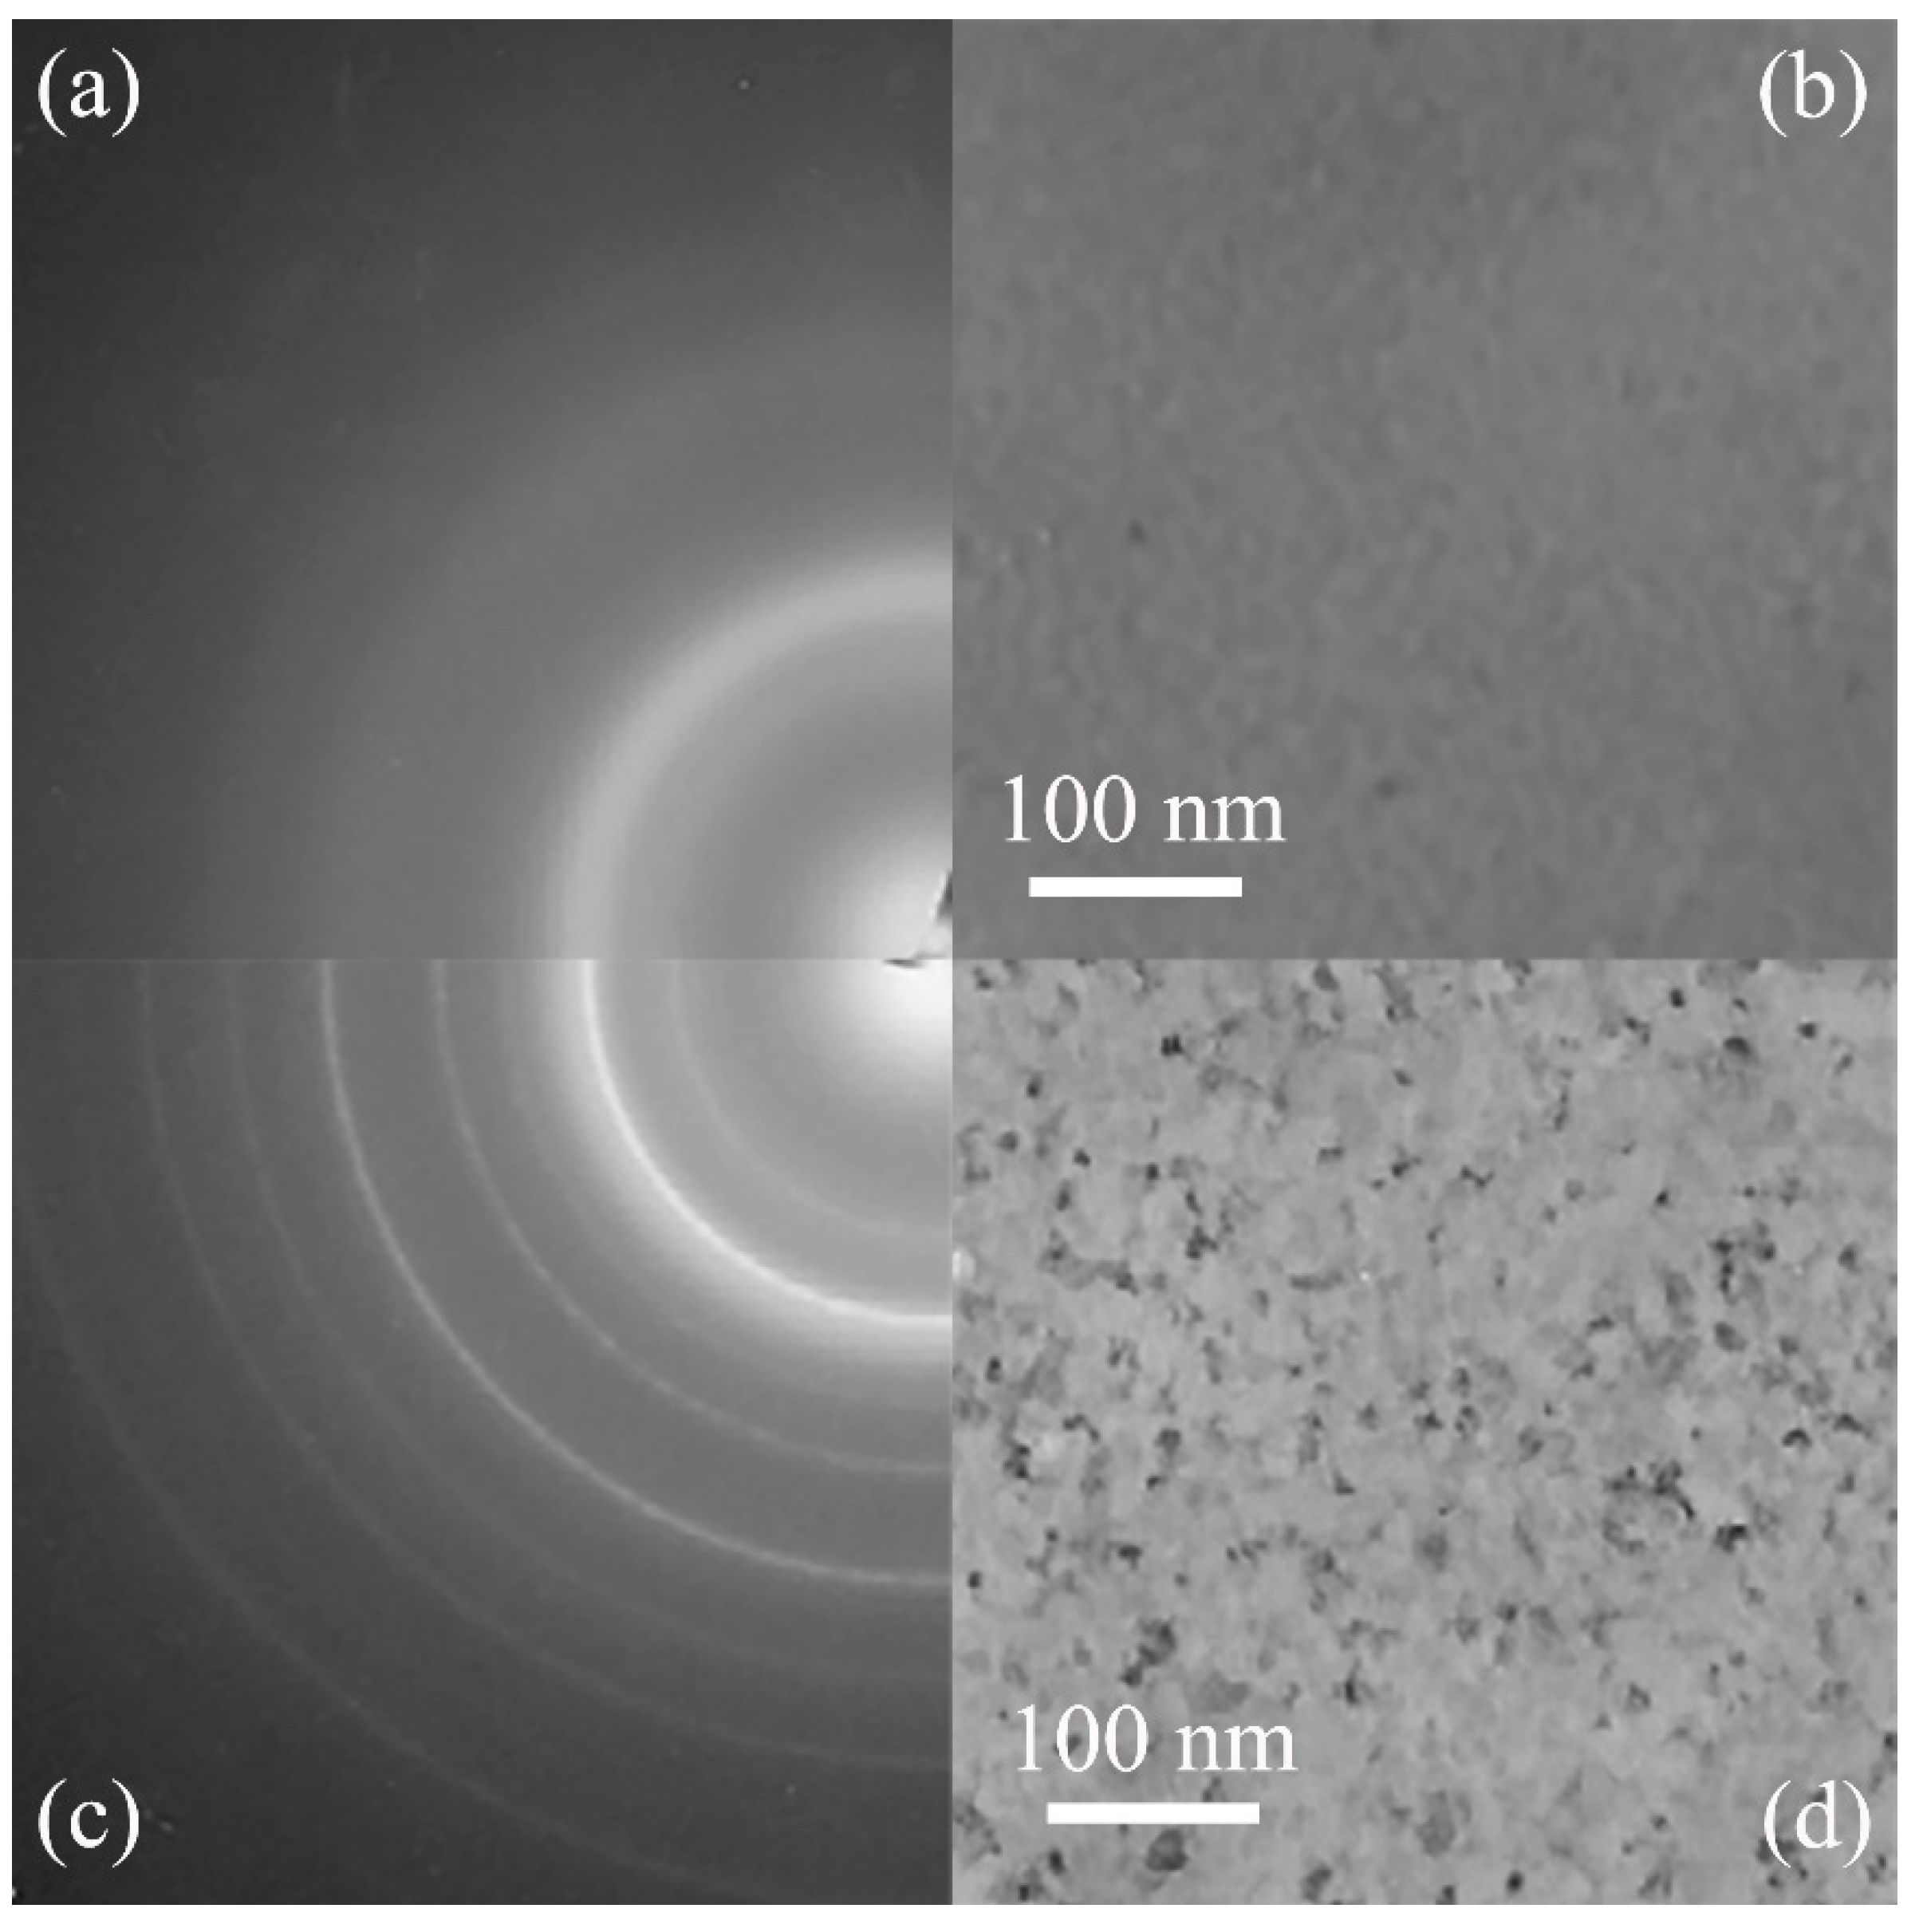
5.1. Metallic Glass Formation by Ion Beam Mixing

We now present the structural transformation that took place in the Ni-Nb-Mo nano-multiple-metal-layers, which are irradiated with various doses ranging from 8 × 10¹⁴ Xe+/cm2 to 5 × 10¹⁵ Xe+/cm2 (shown in Table 5). All compositions of the four Ni-Nb-Mo nano-multiple-metal-layers locate in the glass formation region predicted by the atomistic simulation. For instance, the composition of sample 4 in Table 5 is Ni51Nb19Mo30, with high concentrations of Ni and Mo while the concentration of Nb is low. The corresponding SAD patterns of the phase evolution occurring in the Ni51Nb19Mo30 nano-multiple-metal-layers upon irradiation are presented in Figure 7. In Figure 7a, the lattice constants of the bcc and fcc structure phase are computed as 3.16 Å and 3.54 Å, respectively, revealing the lattice constant of the constituent Mo and Ni in the system. After irradiation doses of 1 × 10¹⁵ Xe+/cm2 in Figure 7b, the Ni-rich fcc crystalline phase diffraction ring transforms into a diffuse halo, whereas the Mo-rich bcc crystalline phase still remains. As the irradiation doses increase to 5 × 10¹⁵ Xe+/cm2 in Figure 7c, the diffused halos without diffraction rings appear, suggesting that the nano-multiple-metal-layers turn into the uniform amorphous phase without the crystalline phase. From Table 5, as the irradiation doses increase, a similar phase transformation also take place in Ni61Nb15Mo24 and Ni72Nb20Mo8 nano-multiple-metal-layers upon ion beam mixing. The uniform amorphous phase is obtained by ion beam mixing experiments upon irradiation to an appropriate dosage. At lower ion dosage, the amorphous and crystalline phases coexist, while the uniform amorphous phase is obtained by increasing the ion dosage to a higher value.
The experimental observation of amorphous phase formation can be explained by destroying the structure of crystalline lattices by ion beams. The stable structure of crystalline lattice makes it difficult for the amorphous phase to form. For example, if high ion dosage is needed to destroy the crystalline lattice and form the uniform amorphous phase, the GFA of the corresponding alloy can be considered as poor under the same circumstance (e.g., beam flux, accelerating voltage, etc.). If a low ion dosage is required to produce amorphous alloys, the GFA of an alloy is regarded as good. No matter whether the GFA of an alloy is good or poor, there exists a minimum required ion dosage Dm, below which no uniform amorphous phase can be formed [77]. Furthermore, there exists a negative correlation between the GFA of an alloy and the Dm, i.e., the lower the minimum required ion dosage, the better the GFA of an alloy. To examine this negative correlation, it can be seen from Table 5 that Ni52Nb35Mo13 amorphous alloy could be easily formed, and possesses the lowest Dm among all of the Ni-Nb-Mo nano-multiple-metal-layers. Coincidentally, the composition of Ni52Nb35Mo13 also presents the largest ADF calculated by atomistic simulations, of all the samples, indicating the highest GFA. Therefore, the negative correlation is not only supported by IBM experiments, but also proven by atomistic simulation results.
Table 6 summarizes the phase evolution that takes place in the four sets of the Ni-Zr-Mo nano-multiple-metal-layers. For the (NiZr)60Mo40 nano-multiple-metal-layers, the SAD patterns and corresponding bright field image are presented in Figure 8a,b, respectively, after the ion dosage was increased to 7 × 10¹⁵ Xe+/cm2. As can be seen from Figure 8a, there exists a diffused halo reflecting the amorphous phase, which is also verified by the gray matrix of uniform amorphous phase in Figure 8b. Nevertheless, after the Mo concentration increased to 60 at.%, no uniform amorphous phase could be obtained in the (NiZr)40Mo60 nano-multiple-metal-layers until irradiated to the dose of 7 × 10¹⁵ Xe+/cm2. The SAD patterns in Figure 8c show an amorphous halo as well as several diffraction rings derived from the Mo-rich bcc crystalline phase with the lattice constant indexed as 3.12 Å. The corresponding bright field image confirms the dual-phase nature, i.e., an amorphous-crystalline coexisting compound.

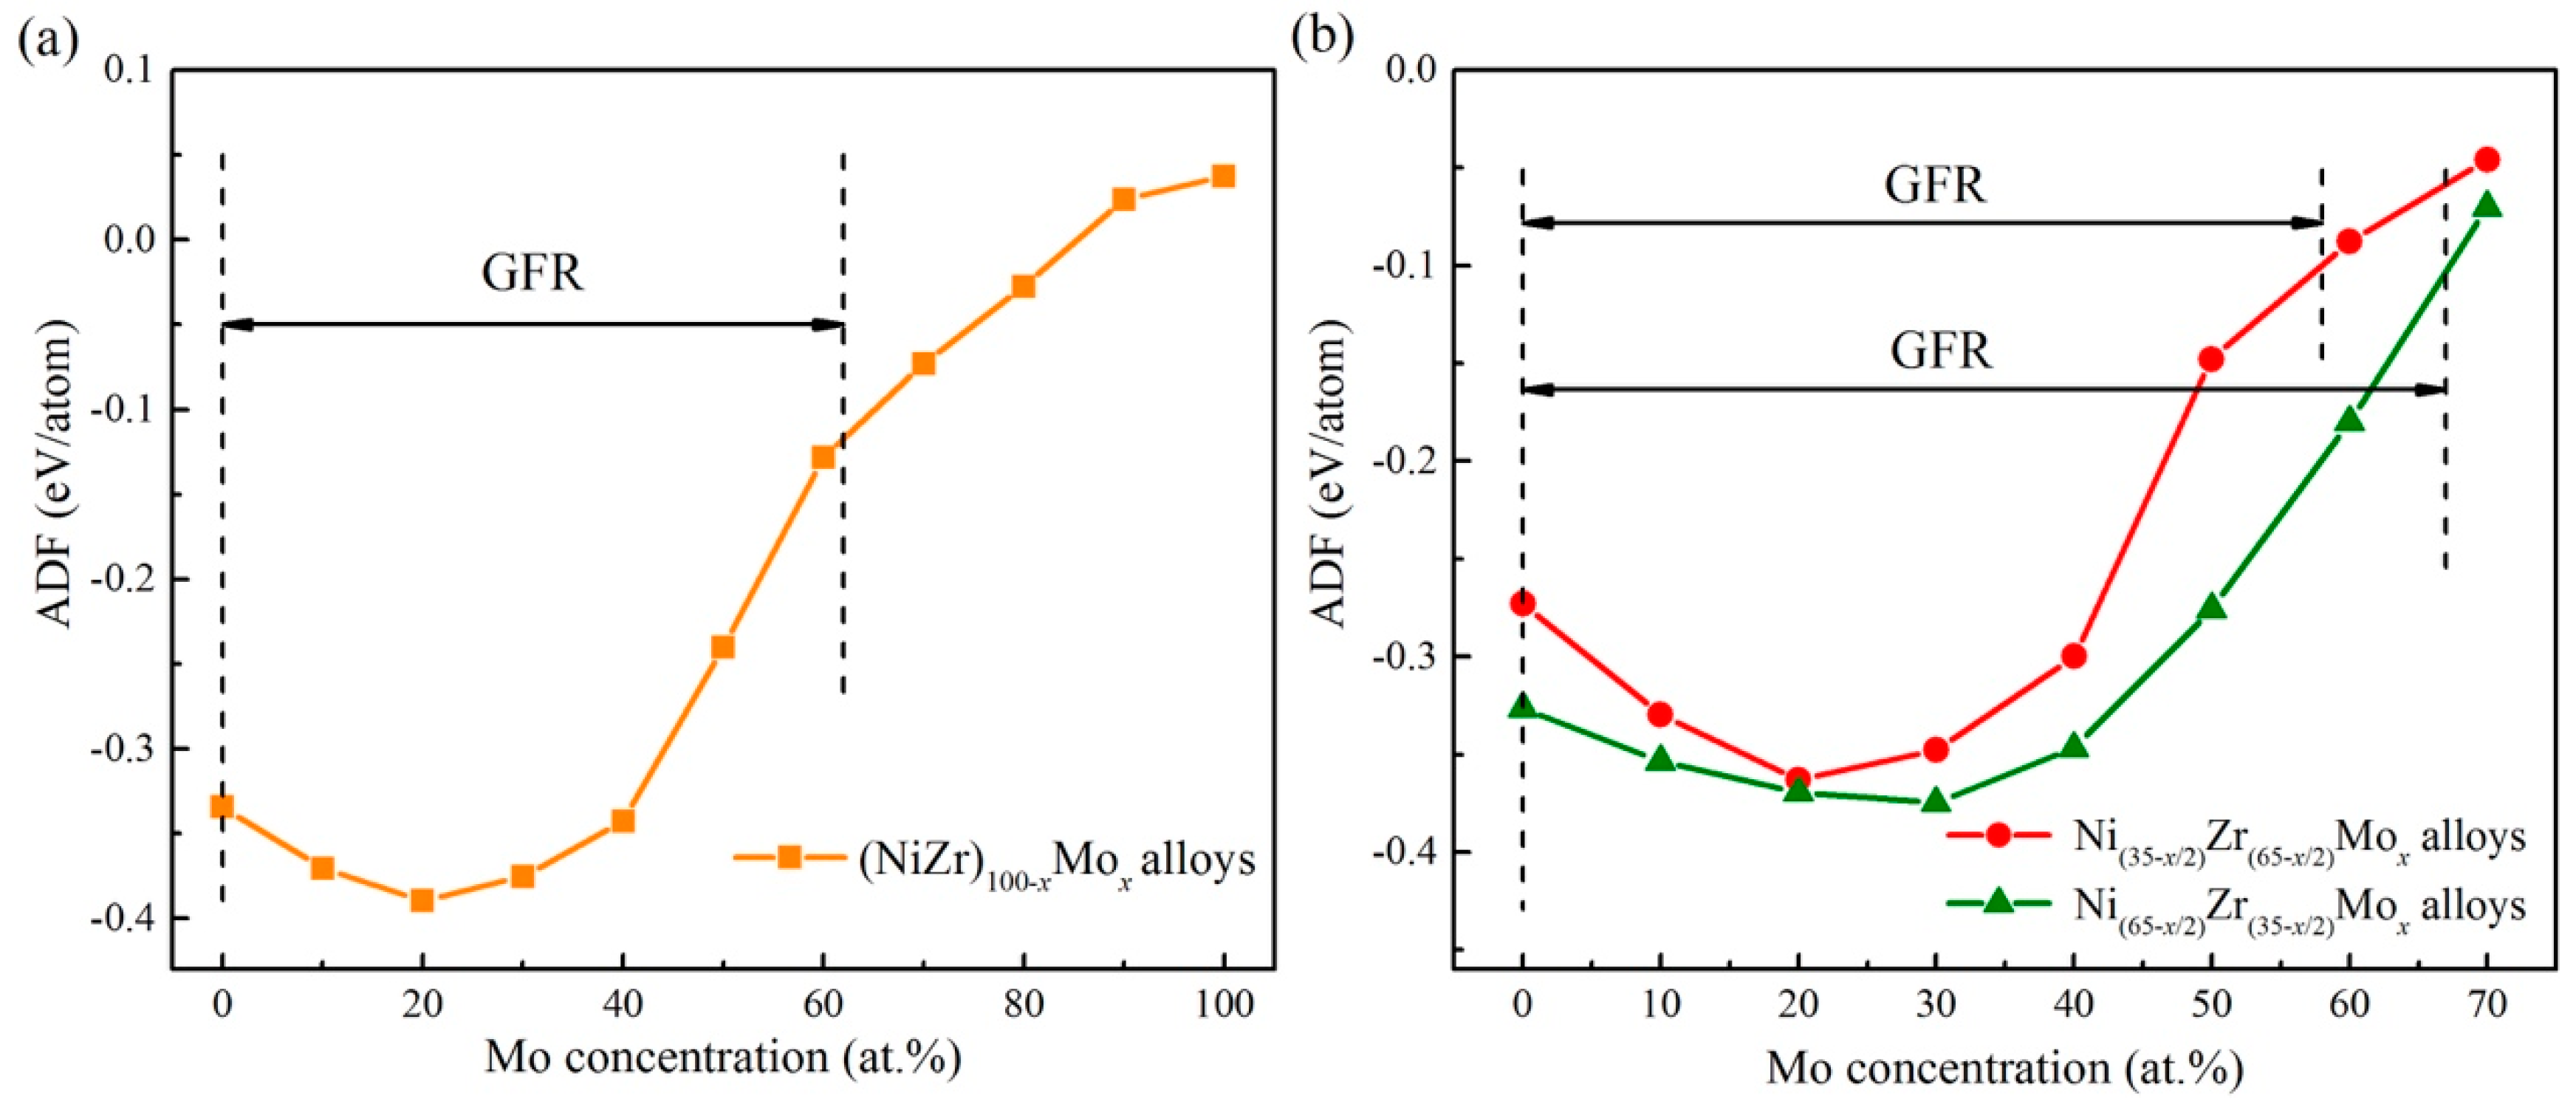
5.2. Connections between ADF and GFA

The ADF predicted from the atomistic simulations is also connected with the experimental data. From Figure 9a, it can be seen that the ADF of (NiZr)100 − xMox alloy starts to increase gradually by adding an appropriate amount of Mo, but decreases after reaching the peak value with further addition of the Mo content. When the Mo content is higher than 60 at.%, the crystalline lattice remains stable and no uniform amorphous phase can be produced, presenting the GFR of (NiZr)100−xMox as 0–60 at.% Mo. By comparing the results of ion beam mixing experiments in Table 6, it can be seen that as the Mo concentration increases, the uniform amorphous phase could be formed in (NiZr)100−xMox (x = 10, 20, 40), with its compositions all locating within the predicted GFR of the Ni-Zr-Mo system. This indicates that the simulation prediction is relevant to the experimental data. Nevertheless, when the Mo concentration increases to 60 at.%, the (NiZr)40Mo60 alloy becomes a mixture of the amorphous phase and Mo-rich bcc crystalline phase. The above experimental observation can be explained by the predicted GFR. Since the composition of (NiZr)40Mo60 is near the critical solid solubility line AB, no uniform amorphous phase could be formed. In other words, excessive adding of the Mo concentration would depreciate the GFA of an alloy.
Compared to the (NiZr)100−xMox alloys, a ADF changing rule similar to that of the Mo addition to the Ni(35−x/2)Zr(65−x/2)Mox and Ni(65−x/2)Zr(35−x/2)Mox alloys can be observed in Figure 9b.Therefore, it is of great importance to explain the effect of Mo addition on the glass formation of Ni-Zr alloy from a theoretical perspective. There are two dominant explanations for the observed phenomenon. On the one hand, given that the atomic radius of Mo (rMo = 1.39 Å) is between those of Ni (rNi = 1.25 Å) and Zr (rZr = 1.58 Å), the Mo addition promotes three elements with different crystalline structures to regulate the coordination polyhedron. Therefore, it improves the formation of short-range compositional order [78]. In addition, the mixing heats ΔHf of the Zr-Mo and Ni-Mo systems are –9 and –11 kJ/mol, respectively. As the negative mixing heats ΔHf of Mo with Zr and Ni force the Mo atoms to fully spread in the Ni-Zr matrix, it is able to promote interaction among the constituent elements and stabilize the amorphous phase [79], i.e., improve the GFA. On the other hand, a negative mixing heat ΔHf could also favor compound formation, leading to restricted diffusion and counteracting glass formation [80]. Besides, as the melting temperature of Mo is 2850 K, such a high melting point would stabilize the crystalline structure and make the uniform amorphous phase formation difficult, i.e., it reduces the GFA. Once the influence of a high melting temperature is beyond that of size difference and the heat of formation, no uniform amorphous phase can be energetically fabricated, downgrading the GFA of an alloy by further increasing the Mo content.

6. Conclusions

The long-range empirical potential was constructed for the Ni-Nb-Mo (fcc-bcc-bcc) and Ni-Zr-Mo (fcc-hcp-bcc) systems, especially for the Ni-Zr-Mo system consisting of three different crystalline structures. Based on the constructed n-body potential, atomistic simulations not only revealed the underlying process of metallic glass formation as the spontaneous collapse of the crystalline lattice while the solute content exceeds the critical value, but also predicted the composition range energetically favored for metallic glass formation. Besides, the amorphization driving force, defined as the energy difference between the solid solution, and the amorphous phase for each alloy was computed and found to be positively correlated with glass forming ability, which is frequently defined in terms of critical size or cooling rate, etc.
To prove the atomistic simulation prediction for metallic glass formation, ion beam mixing of nano-multiple-metal-layers was performed to produce Ni-Nb-Mo and Ni-Zr-Mo metallic glass films. The composition of these ternary metallic films produced by ion beam mixing all located within the predicted glass formation region. Ion-beam mixing experiments indicated that there exists a minimum ion dosage for amorphization and the minimum ion dosage showed somewhat negative correlation with the glass forming ability. It was also found that the amorphization driving force of (NiZr)100−xMox alloy gradually increases with the proper addition of Mo concentration, whereas it decreases with excessive addition of the Mo content. Therefore, the amorphization driving force of each alloy can be defined as an indicator of its glass forming ability.

Acknowledgments

The authors are grateful to the financial support from the Ministry of Science and Technology of China (2017YFB0702301, 2017YFB0702401, 2017YFB0702201), the National Natural Science Foundation of China (51571129, 51631005), Tsinghua Fudaoyuan Research Fund, and the Administration of Tsinghua University.

Author Contributions

J. H. Li., J. B. Liu and B. X. Liu conceived and designed the manuscript; M. H. Yang and Y. Li performed the experiments and atomistic simulations; M. H. Yang wrote the paper; J. H. Li and J. B. Liu revised the paper.

Conflicts of Interest

The authors declare no conflict of interest.

References

  1. Sheng, H.W.; Luo, W.K.; Alamgir, F.M.; Bai, J.M.; Ma, E. Atomic packing and short-to-medium-range order in metallic glasses. Nature 2006, 439, 419–425. [Google Scholar] [CrossRef] [PubMed]
  2. Cheng, Y.Q.; Ma, E. Atomic-level structure and structure-property relationship in metallic glasses. Prog. Mater. Sci. 2011, 56, 379–473. [Google Scholar] [CrossRef]
  3. Schuh, C.A.; Hufnagel, T.C.; Ramamurty, U. Mechanical behavior of amorphous alloys. Acta Mater. 2007, 55, 4067–4109. [Google Scholar] [CrossRef]
  4. Yu, H.B.; Richert, R.; Samwer, K. Structural rearrangements governing Johari-Goldstein relaxations in metallic glasses. Sci. Adv. 2017, 3, e1701577. [Google Scholar] [CrossRef] [PubMed]
  5. Sun, Y.; Zhang, F.; Ye, Z.; Zhang, Y.; Fang, X.W.; Ding, Z.J.; Wang, C.Z.; Mendelev, M.I.; Ott, R.T.; Kramer, M.J.; et al. ‘Crystal Genes’ in Metallic Liquids and Glasses. Sci. Rep. 2016, 6, 23734. [Google Scholar] [CrossRef] [PubMed]
  6. Klement, W.K.; Willens, R.H.; Duwez, P. Non-crystalline Structure in Solidified Gold-Silicon Alloys. Nature 1960, 187, 869–870. [Google Scholar] [CrossRef]
  7. Liu, B.X.; Johnson, W.L.; Nicolet, M.-A.; Lau, S.S. Structural difference rule for amorphous alloy formation by ion mixing. Appl. Phys. Lett. 1983, 42, 45–47. [Google Scholar] [CrossRef]
  8. Liu, B.X.; Johnson, W.L.; Nicolet, M.-A.; Lau, S.S. Amorphous film formation by ion mixing in binary metal systems. Nucl. Instrum. Methods Phys. Res. 1983, 209, 229–234. [Google Scholar] [CrossRef]
  9. Koch, C.C.; Cavin, O.B.; McKamey, C.G.; Scarbrough, J.O. Preparation of “amorphous” Ni60Nb40 by mechanical alloying. Appl. Phys. Lett. 1983, 43, 1017–1019. [Google Scholar] [CrossRef]
  10. Suryanarayana, C. Mechanical alloying and milling. Prog. Mater. Sci. 2001, 46, 1–184. [Google Scholar] [CrossRef]
  11. Bordeenithikasem, P.; Liu, J.B.; Kube, S.A.; Li, Y.L.; Ma, T.X.; Scanley, B.E.; Broadbridge, C.C.; Vlassak, J.J.; Singer, J.P.; Schroers, J. Determination of critical cooling rates in metallic glass forming alloy libraries through laser spike annealing. Sci. Rep. 2017, 7, 7155. [Google Scholar] [CrossRef] [PubMed]
  12. Lin, H.K.; Cheng, K.C.; Huang, J.C. Effects of laser annealing parameters on optical and electrical properties of ITO/metallic glass alloy Bi-layer films. Nanoscale Res. Lett. 2015, 10, 274. [Google Scholar] [CrossRef] [PubMed]
  13. Ruffino, F.; Torrisi, V.; Grillo, R.; Cacciato, G.; Zimbone, M.; Piccitto, G.; Grimaldi, M.G. Nanoporous Au structures by dealloying Au/Ag thermal- or laser-dewetted bilayers on surfaces. Superlattice Microst. 2017, 103, 28–47. [Google Scholar] [CrossRef]
  14. Martin, G.; Bellon, P. Driven Alloys. Solid State Phys. 1996, 50, 189–331. [Google Scholar]
  15. Liu, B.X.; Lai, W.S.; Zhang, Z.J. Solid-state crystal-to-amorphous transition in metal-metal multilayers and its thermodynamic and atomistic modelling. Adv. Phys. 2001, 50, 367–429. [Google Scholar] [CrossRef]
  16. Suryanarayana, C. Non-Equilibrium Processing of Materials; Pergamon: Oxford, UK, 1999. [Google Scholar]
  17. Haasen, P.; Jaffee, R.I. Amorphous Metals and Semiconductors: Proceedings of an International Workshop; Pergamon Press: Coronado, CA, USA, 1985. [Google Scholar]
  18. Lv, Z.P.; Bei, H.; Liu, C.T. Recent progress in quantifying glass-forming ability of bulk metallic glasses. Intermetallics 2007, 15, 618–624. [Google Scholar]
  19. Wen, T.Q.; Tang, L.; Sun, Y.; Ho, K.M.; Wang, C.Z.; Wang, N. Crystal genes in a marginal glass-forming system of Ni50Zr50. Phys. Chem. Chem. Phys. 2017, 19, 30429–30438. [Google Scholar] [CrossRef] [PubMed]
  20. Turnbull, D. Amorphous Solid Formation and Interstitial Solution Behavior in Metallic Alloy Systems. J. Phys. 1974, 35, C4.1–C4.10. [Google Scholar]
  21. Liu, B.X. Further studies of ion mixing in binary metal system. Nucl. Instrum. Methods Phys. Res. 1985, 7–8, 547–551. [Google Scholar]
  22. Liu, B.X. Ion mixing and metallic alloy phase formation. Phys. Status Solidi A 1986, 94, 11–34. [Google Scholar] [CrossRef]
  23. Inoue, A. Stabilization of metallic supercooled liquid and bulk amorphous alloys. Acta Mater. 2000, 48, 279–306. [Google Scholar] [CrossRef]
  24. Johnson, W.L. Bulk glass-forming metallic alloys: Science and technology. MRS Bull. 1999, 24, 42–56. [Google Scholar] [CrossRef]
  25. Li, J.H.; Dai, X.D.; Liang, S.H.; Tai, K.P.; Kong, Y.; Liu, B.X. Interatomic potentials of the binary transition metal systems and some applications in materials physics. Phys. Rep. 2008, 455, 1–134. [Google Scholar] [CrossRef]
  26. Li, J.H.; Dai, Y.; Cui, Y.Y.; Liu, B.X. Atomistic theory for predicting the binary metallic glass formation. Mater. Sci. Eng. R 2011, 72, 1–28. [Google Scholar] [CrossRef]
  27. Luo, S.Y.; Li, J.H.; Liu, J.B.; Liu, B.X. Atomic modeling to design favored compositions for the ternary Ni-Nb-Zr metallic glass formation. Acta Mater. 2014, 76, 482–492. [Google Scholar] [CrossRef]
  28. Sun, Y.; Zhang, Y.; Zhang, F.; Ye, Z.; Ding, Z.J.; Wang, C.Z.; Ho, K.M. Cooling rate dependence of structural order in Al90Sm10 metallic glass. J. Appl. Phys. 2016, 120, 015901. [Google Scholar] [CrossRef]
  29. Thompson, M.W. Defects and Radiation Damage in Metals; Cambridge University Press: Cambidge, UK, 1969. [Google Scholar]
  30. Russell, K.C. Phase-stability under irradiation. Prog. Mater. Sci. 1984, 28, 229–434. [Google Scholar] [CrossRef]
  31. Bransden, B.H. Atomic Collision Theory; Benjamin-Cummings Pub.: London, UK, 1983. [Google Scholar]
  32. Sigmund, P. Particle Penetration and Radiation Effects; Springer: Berlin, Germany, 2006. [Google Scholar]
  33. Greer, J.R.; Hosson, J.T.M.D. Plasticity in small-sized metallic systems: Intrinsic versus extrinsic size effect. Prog. Mater. Sci. 2011, 56, 654–724. [Google Scholar] [CrossRef]
  34. Jang, D.C.; Greer, J.R. Transition from a strong-yet-brittle to a stronger-and-ductile state by size reduction of metallic glasses. Nat. Mater. 2010, 9, 215–219. [Google Scholar] [CrossRef] [PubMed]
  35. Ghidelli, M.; Gravier, S.; Blandin, J.-J.; Djemia, P.; Mompiou, F.; Abadias, G.; Raskin, J.-P.; Pardoen, T. Extrinsic mechanical size effects in thin ZrNi metallic glass films. Acta Mater. 2015, 90, 232–241. [Google Scholar] [CrossRef]
  36. Ghidelli, M.; Idrissi, H.; Gravier, S.; Blandin, J.-J.; Raskin, J.-P.; Schryvers, D.; Pardoen, T. Homogeneous flow and size dependent mechanical behavior in highly ductile Zr65Ni35 metallic glass films. Acta Mater. 2017, 131, 246–259. [Google Scholar] [CrossRef]
  37. Ghidelli, M.; Volland, A.; Bandin, J.-J.; Pardoen, T.; Raskin, J.-P.; Mompiou, F.; Djemia, P.; Gravier, S. Exploring the mechanical size effects in Zr65Ni35 thin film metallic glasses. J. Alloys Compd. 2014, 615, S90–S92. [Google Scholar] [CrossRef]
  38. Buschow, K.H.J.; Beekmans, N.M. Thermal stability and electronic properties of Zr-Co and Zr-Ni alloys. Phys. Rev. B 1979, 19, 3843. [Google Scholar] [CrossRef]
  39. Ghidelli, M.; Gravier, S.; Blandin, J.-J.; Pardoen, T.; Raskin, J.-P.; Mompiou, F. Compositional-induced structural change in ZrxNi100-x thin film metallic glasses. J. Alloys Compd. 2014, 615, S348–S351. [Google Scholar] [CrossRef]
  40. Guo, G.-Q.; Yang, L.; Huang, C.-L.; Chen, D. Structural origin of the different glass-forming abilities in ZrCu and ZrNi metallic glasses. J. Mater. Res. 2011, 26, 2098. [Google Scholar]
  41. Mattern, N.; Bednarčik, J.; Pauly, S.; Wang, G.; Das, J.; Eckert, J. Structural evolution of Cu-Zr glasses under tension. Acta Mater. 2009, 57, 4133–4139. [Google Scholar] [CrossRef]
  42. Zhang, Z.J.; Bai, H.Y.; Qiu, Q.L.; Yang, T.; Tao, K.; Liu, B.X. Phase evolution upon ion mixing and solid-state reaction and thermo-dynamic interpretation in the Ni-Nb system. J. Appl. Phys. 1993, 73, 1702–1710. [Google Scholar] [CrossRef]
  43. Kimura, H.; Inoue, A.; Yamaura, S.; Sasamori, K.; Nishida, M.; Shinpo, Y.; Okouchi, H. Thermal stability and mechanical properties of glassy and amorphous Ni-Nb-Zr alloys produced by rapid solidification. Mater. Trans. 2003, 44, 1167–1171. [Google Scholar] [CrossRef]
  44. Oreshkin, A.I.; Mantsevich, V.N.; Savinov, S.V.; Oreshkin, S.I.; Panov, V.I.; Yavari, A.R.; Miracle, D.B.; Louzguine-Luzgin, D.V. In situ visualization of Ni-Nb bulk metallic glasses phase transition. Acta Mater. 2013, 61, 5216–5222. [Google Scholar] [CrossRef]
  45. Daw, M.S.; Baskes, M.I. Semiempirical, quantum mechanical calculation of hydrogen embrittlement in metals. Phys. Rev. Lett. 1983, 50, 1285. [Google Scholar] [CrossRef]
  46. Daw, M.S.; Baskes, M.I. Embedded-atom method-Derivation and application to impurities, surface, and other defects in metals. Phys. Rev. B 1984, 29, 6443–6453. [Google Scholar] [CrossRef]
  47. Finnis, M.W.; Sinclair, J.E. A simple empirical n-body potential for transition-metals. Philos. Mag. A 1984, 50, 45–55. [Google Scholar] [CrossRef]
  48. Tomanek, D.; Aligia, A.A.; Balseiro, C.A. Calculation of elastic strain and electronic effects on surface segregation. Phys. Rev. B 1985, 32, 5051–5056. [Google Scholar] [CrossRef]
  49. Baskes, M.I.; Johnson, R.A. Modified embedded-atom potentials for hcp metals. Model. Simul. Mater. Sci. Eng. 1994, 2, 147–163. [Google Scholar] [CrossRef]
  50. Hu, W.; Zhang, B.; Huang, B.; Gao, F.; Bacon, D.J. Analytic modified embedded atom potentials for hcp metals. J. Phys. Condens. Matter 2001, 13, 1193–1213. [Google Scholar] [CrossRef]
  51. Johnson, R.A.; Oh, D.J. Analytic modified embedded atom potentials for bcc metals. J. Mater. Res. 1989, 4, 1195–1201. [Google Scholar] [CrossRef]
  52. Dai, X.D.; Li, J.H.; Kong, Y. Long-range empirical potential for the bcc structured transition metals. Phys. Rev. B 2007, 75, 052102. [Google Scholar] [CrossRef]
  53. Dai, X.D.; Kong, Y.; Li, J.H. Long-range empirical potential model: Application to fcc transition metals and alloys. Phys. Rev. B 2007, 75, 104101. [Google Scholar] [CrossRef]
  54. Dai, Y.; Li, J.H.; Liu, B.X. Long-range empirical potential model: Extension to hexagonal close-packed metals. J. Phys. Condens. Matter 2009, 21, 385402. [Google Scholar] [CrossRef] [PubMed]
  55. Li, Y.; Luo, S.Y.; Li, J.H.; Liu, J.B.; Liu, B.X. Interatomic potential to predict the glass-forming ability of Ni-Nb-Mo ternary alloys. J. Mater. Sci. 2014, 49, 7263–7272. [Google Scholar] [CrossRef]
  56. Yang, M.H.; Li, S.N.; Li, Y.; Li, J.H.; Liu, B.X. Atomistic modeling to optimize composition and characterize structure of Ni-Zr-Mo metallic glasses. Phys. Chem. Chem. Phys. 2015, 17, 13355. [Google Scholar] [CrossRef] [PubMed]
  57. Lide, D.R.; Bruno, T.L. CRC Handbook of Chemistry and Physics; CRC Press: New York, NY, USA, 2012. [Google Scholar]
  58. Clark, S.J.; Segall, M.D.; Pickard, C.J.; Hasnip, P.J.; Probert, M.I.; Refson, K.; Payne, M.C. First principles methods using CASTEP. Z. Kristallogr.-Cryst. Mater. 2005, 220, 567–570. [Google Scholar] [CrossRef] [Green Version]
  59. Segall, M.D.; Lindan, P.J.D.; Probert, M.J.; Pickard, C.J.; Hasnip, P.J.; Clark, S.J. First-principles simulation: Ideas, illustrations and the CASTEP code. J. Phys. Condens. Matter 2002, 14, 2717–2744. [Google Scholar] [CrossRef]
  60. Blochl, P.E. Projector augmented-wave method. Phys. Rev. B 1994, 50, 17953–17979. [Google Scholar] [CrossRef]
  61. Perdew, J.P.; Wang, Y. Pair-distribution function and its coupling-constant average for the spin-polarized electron-gas. Phys. Rev. B 1992, 46, 12947–12954. [Google Scholar] [CrossRef]
  62. Ikehata, H.; Nagasako, N.; Furuta, T.; Fukumoto, A.; Miwa, K.; Saito, T. First-principles calculations for development of low elastic modulus Ti alloys. Phys. Rev. B 2004, 70, 174113. [Google Scholar] [CrossRef]
  63. Brandes, E.A.; Brook, G.B. Smithells Metals Reference Book, 8th ed.; Elsevier Butterworth-Heinemann Ltd.: Oxford, UK, 2004. [Google Scholar]
  64. Zhang, Q.; Lai, W.S.; Liu, B.X. Molecular dynamics study of solid state interfacial reaction in the Ni-Mo system. J. Comput.-Aided Mater. Des. 1999, 6, 103–116. [Google Scholar] [CrossRef]
  65. Rose, J.H.; Smith, J.R.; Guinea, F.; Ferrante, J. Universal features of the equation of state of metals. Phys. Rev. B 1984, 29, 2963–2969. [Google Scholar] [CrossRef]
  66. Plimpton, S. Fast Parallel Algorithms for Short-Range Molecular Dynamics. J. Comput. Phys. 1995, 117, 1–19. [Google Scholar] [CrossRef]
  67. Yang, M.H.; Li, J.H.; Liu, B.X. Proposed correlation of structure network inherited from producing techniques and deformation behavior for Ni-Ti-Mo metallic glasses via atomistic simulations. Sci. Rep. 2016, 6, 29722. [Google Scholar] [CrossRef] [PubMed]
  68. Suryanarayana, C.; Norton, M.G. X-ray Diffraction: A Practical Approach; Plenum Press: New York, NY, USA, 1998. [Google Scholar]
  69. Liu, B.X.; Lai, W.S.; Zhang, Q. Irradiation induced amorphization in metallic multilayers and calculation of glass-forming ability from atomistic potential in the binary metal systems. Mater. Sci. Eng. Rep. 2000, 29, 1–48. [Google Scholar] [CrossRef]
  70. Ziegler, J.F.; Biersack, J.P.; Littmark, U. The Stopping and Range of Ions in Solids; Pergamon Press: New York, NY, USA, 1985. [Google Scholar]
  71. Li, Y.; Wang, T.L.; Ding, N.; Liu, J.B.; Liu, B.X. Metallic glass formation in the ternary Ni-Nb-Mo system by ion beam mixing. Sci. China Technol. Sci. 2012, 55, 2206–2211. [Google Scholar] [CrossRef]
  72. Yang, M.H.; Li, N.; Li, J.H.; Liu, B.X. Effects of Mo addition on the metallic glass formation of (ZrNi)100−xMox alloys. J. Alloys Compd. 2014, 606, 7–10. [Google Scholar] [CrossRef]
  73. Kaban, I.; Jόvári, P.; Kokotin, V.; Shuleshova, O.; Beuneu, B.; Saksl, K.; Mattern, N.; Eckert, J.; Greer, A.L. Local atomic arrangements and their topology in Ni-Zr and Cu-Zr glassy and crystalline alloys. Acta Mater. 2013, 61, 2509–2520. [Google Scholar] [CrossRef]
  74. Zhang, Z.J.; Liu, B.X. Solid-state reaction to synthesize Ni-Mo metastable alloys. J. Appl. Phys. 1994, 76, 3351–3356. [Google Scholar] [CrossRef]
  75. Li, J.H.; Zhao, S.Z.; Dai, Y.; Cui, Y.Y.; Liu, B.X. Formation and structure of Al-Zr metallic glasses studied by Monte Carlo simulations. J. Appl. Phys. 2011, 109, 113538. [Google Scholar] [CrossRef]
  76. Weeber, A.W.; Bakker, H. Extension of the glass-forming range of Ni-Zr by mechanical alloying. J. Phys. F Met. Phys. 1998, 18, 1359–1369. [Google Scholar] [CrossRef]
  77. Yang, M.H.; Li, J.H.; Liu, B.X. Proposed correlation of glass formation ability with critical dosage for the amorphous alloys formed by ion beam mixing. RSC Adv. 2015, 5, 16400. [Google Scholar] [CrossRef]
  78. Xi, X.K.; Li, L.L.; Zhang, B.; Wang, W.H.; Wu, Y. Correlation of atomic cluster symmetry and glass-forming ability of metallic glass. Phys. Rev. Lett. 2007, 99, 095501. [Google Scholar] [CrossRef] [PubMed]
  79. Xu, D.H.; Duan, G.; Johnson, W.L. Unusual Glass-Forming Ability of Bulk Amorphous Alloys Based on Ordinary Metal Copper. Phys. Rev. Lett. 2004, 92, 245504. [Google Scholar] [CrossRef] [PubMed]
  80. Xia, L.; Fang, S.S.; Wang, Q.; Dong, Y.D. Thermodynamic modeling of glass formation in metallic glasses. Appl. Rev. Lett. 2006, 88, 171905. [Google Scholar] [CrossRef]
Figure 1. Total energies calculated from interatomic potential (Red solid line) and corresponding Rose equation [65] (Orange dashed line) as a function of lattice constant for various compounds in the Ni-Nb-Mo system.
Metals 08 00129 g001
Figure 2. Total energies calculated from interatomic potential (Red solid line) and corresponding Rose equation [65] (Orange dashed line) as a function of lattice constant for pure metals as well as B2 and L12 compounds in the Ni-Zr-Mo system.
Metals 08 00129 g002
Figure 3. The structure factor (S(q)) and projection of atomic positions for (a,b) the crystalline state (Ni90Zr5Mo5) and (c,d) the amorphous state (Ni64Zr36), respectively [56]. The XRD data [73] for Ni64Zr36 MGs are also presented and marked as olive dots. Blue solid circles are for Ni, orange solid circles for Zr, and yellow solid circles for Mo.
Metals 08 00129 g003
Figure 4. The glass formation region (the central area) derived from molecular dynamics (MD) simulation with various experimental data for (a) a Ni-Zr-Mo system [56] and (b) a Ni-Nb-Mo system [55].
Metals 08 00129 g004
Figure 5. The structure factor S(q) of the Ni52Nb35Mo13 alloy derived from MD simulation [55] and the corresponding selected area diffraction (SAD) patterns [71]. The q1, q2 and q3 represent the first, second and third peak positions of the structure factor S(q).
Metals 08 00129 g005
Figure 6. The formation energy difference between the solid solution and amorphous phase for (a) Ni-Zr-Mo system [56], and (b) Ni-Nb-Mo system [55]. The quantitative energy scale for dots with different colors are presented for the respective systems.
Metals 08 00129 g006
Figure 7. The SAD patterns of resultant phases formed in the Ni51Nb19Mo30 nano-multiple-metal-layers [71] (a) at as-deposited state, after being irradiated to a dose of (b) 1 × 10¹⁵ Xe+/cm2 and (c) 5 × 10¹⁵ Xe+/cm2.
Metals 08 00129 g007
Figure 8. The SAD patterns and corresponding bright field image of the (a,b) (NiZr)60Mo40 and (c,d) (NiZr)40Mo60 nano-multiple-metal-layers [72] after irradiation with a dose of 7 × 10¹⁵ Xe+/cm2.
Metals 08 00129 g008
Figure 9. The amorphization driving force (ADF) for the (NiZr)100−xMox alloy [56] as shown by the XY line in Figure 6 (a), as well as the ADF for the Ni(35−x/2)Zr(65−x/2)Mox and Ni(65−x/2)Zr(35−x/2)Mox alloys (b).
Metals 08 00129 g009
Table 1. The parameters of the constructed potential for the Ni-Nb-Mo system [55].
ParametersNi-NiNb-NbMo-MoNi-Nb Ni-MoNb-Mo
m444444
n586866
rc1 (Å)5.7694.8034.7585.1885.2455.259
rc2 (Å)7.2456.8197.2425.1505.0177.550
c0 (eV)313.3095561.73510,271.2932246.7182297.9752837.964
c1 (eV/Å)−381.137−7613.754−14,753.967−2878.560−3065.951−4301.152
c2 (eV/Å2)172.5243927.5897943.7431410.8241548.7582449.419
c3 (eV/Å3)−34.507−896.592−1896.380−308.742−351.481−618.445
c4 (eV/Å4)2.59776.071169.33425.06230.26758.207
α (eV)4.09129.38511.82858.52019.1958.480
Table 2. The parameters of the constructed potential for the Ni-Zr-Mo system [56].
ParametersNi-NiZr-ZrMo-MoNi-ZrNi-MoZr-Mo
m444444
n646565
rc1 (Å)5.7506.4384.6184.7835.2684.944
rc2 (Å)7.1727.2236.4147.3856.2175.312
c0 (eV)322.0651353.85511,867.251331.7551444.5531582.121
c1 (eV/Å)−391.987−1453.094−17,112.524−430.706−1776.802−2021.254
c2 (eV/Å2)178.332586.5199255.419254.058810.354977.406
c3 (eV/Å3)−36.094−104.936−2218.683−74.642−161.714−207.188
c4 (eV/Å4)2.7707.009198.4268.79811.68615.759
α (eV)5.3907.830−11.8798.343−3.227−11.513
Table 3. Lattice constants (a, Å), cohesive energies (Ec, eV), and bulk moduli (B0, Mbar) of B2 and L12 compounds in the Ni-Nb-Mo system derived from the potential (first line) and first-principle calculation (second line) [55].
CompoundsNbNiNbMoNb3NiNbNi3Nb3MoNbMo3Mo3NiMoNi3
StructureB2B2L12L12L12L12L12L12
a (Å)3.1113.1983.9293.6794.1834.0043.7613.644
3.0953.2264.1003.7004.1594.0523.8713.647
Ec (eV)6.1217.5226.7146.1217.5226.8036.1135.057
6.0477.6526.7076.0477.6526.8006.1504.994
B0 (Mbar)2.2371.8461.4442.2371.8462.2982.3892.287
2.1661.8101.7652.1661.8102.1442.4122.230
Table 4. Lattice constants (a, Å), cohesive energies (Ec, eV), and bulk moduli (B0, Mbar) of B2 and L12 compounds in the Ni-Zr-Mo system obtained from the potential (first line) and experiments or first-principle calculations (second line) [56].
CompoundsNiZrNiMoZrMoNi3ZrNiZr3Ni3MoNiMo3Zr3Mo
StructureB2B2B2L12L12L12L12L12
a (Å)3.1623.0443.2843.7704.2973.5843.6784.428
3.2122.9983.3493.7594.2793.6473.8714.379
Ec (eV)5.7175.4476.0325.3445.7675.0606.0016.172
5.7205.3906.0545.3425.8034.9946.1506.175
B0 (Mbar)1.4632.6251.5241.6871.2672.2271.3161.211
1.4222.3281.4911.6971.0712.2302.4121.172
Table 5. Phase transformation for the Ni-Nb-Mo multiply layers upon Xe+ beam mixing to different doses [71]. (A: amorphous phase; Bcc: bcc crystalline phase; Fcc: fcc crystalline phase).
Dosage 1 2 3 4
(Xe+/cm2)Ni52Nb35Mo13Ni61Nb15Mo24Ni72Nb20Mo8Ni51Nb19Mo30
8 × 10¹⁴AA + BccA + FccA + Bcc
1 × 10¹⁵AAA + FccA + Bcc
2 × 10¹⁵AAA + FccA + Bcc
3 × 10¹⁵AAAA + Bcc
5 × 10¹⁵AAAA
Table 6. Phase transformation for the Ni-Zr-Mo multiple layers upon Xe+ beam mixing to different doses [72]. (A: amorphous phase; Bcc: bcc crystalline phase).
Dosage 1234
(Xe+/cm2)(NiZr)90Mo10(NiZr)80Mo20(NiZr)60Mo40(NiZr)40Mo60
1 × 10¹⁵A + BccA + BccA + BccA + Bcc
3 × 10¹⁵AA + BccA + BccA + Bcc
5 × 10¹⁵AAA + BccA + Bcc
7 × 10¹⁵AAAA + Bcc

