An Investigation on the Adiabatic Shear Bands in Depleted U-0.75 wt % Ti Alloy under Dynamic Loading


State Key Laboratory of Explosion Science and Technology, Beijing Institute of Technology, Beijing 100081, China
*
Authors to whom correspondence should be addressed.
Metals 2018, 8(2), 145; https://doi.org/10.3390/met8020145
Submission received: 10 January 2018
/
Revised: 1 February 2018
/
Accepted: 14 February 2018
/
Published: 22 February 2018
(This article belongs to the Special Issue Deformation Behavior of the Alloys under Simple and Combined Loading Conditions at Various Deformation Rate)
Abstract
:Adiabatic shear bands in uranium alloy projectiles/penetrators, during penetration, allow them to “self-sharpen,” a process that is absent in most tungsten alloy projectiles/penetrators. U-0.75 wt % Ti alloy samples have been accelerated to impact steel targets, and the distribution of adiabatic shear bands in residual samples has been studied in detail to understand the effect of self-sharpening on penetration. In our study, self-sharpening was evidenced by the distribution of the shear bands in the recovered sample. The shear bands formed during impact were observed to change direction when they crossed grain boundaries, which indicated that the grain boundaries had an influence on the adiabatic shear bands of U-0.75 wt % Ti. Micro-hardness test results showed that the Vickers micro-hardness in the adiabatic shear zone was 18% lower than that in the matrix. In the split-Hopkinson pressure bar (SHPB) experiment, a strain rate of around 2891 s−1 was the threshold strain rate that triggered the formation of adiabatic shear bands in the U-0.75 wt % Ti alloy.
1. Introduction
Depleted uranium (DU) alloys have enormous advantages in military applications both in vehicular protective armor and in armor-piercing rounds, as uranium is a moderately strong and ductile metal that can be cast, formed, and welded by a variety of standard methods. It is well accepted that shear bands are extremely important in the dynamic deformation of materials, as they are usually fracture precursors. Many metals [1,2,3,4], alloys, and polymers exhibit shear bands under dynamic loading. Shear bands are regions in a material, mostly in metals, where plastic deformation is highly concentrated. This process is so rapid that the produced heat is also concentrated, so it is considered adiabatic. For uranium alloys such as U–Ti, the uranium shear band initiates at the mantle near the transition that begins in the mushroomed region and the relatively undeformed rod, at which point a cusp forms, which is the so-called self-sharpening effect. The superiority of penetrator alloys made with a DU alloy over tungsten has recently been attributed to its so-called “self-sharpening” mechanism. Studies by Rosenberg and Dekel [5] and Magness [6] have shown that a fundamental difference between uranium-based and W–Ni–Fe systems is that shear band formation occurs only in the uranium-containing alloys. The shear localization susceptibilities of U–Ti and W–Ni–Fe alloys have been discussed by Zurek and Follansbee [7]: uranium alloys are more prone to catastrophic localized deformations (adiabatic shearing) due to the existence of a soft high-temperature phase, which is reached under large strains at high strain rates. In penetration simulations performed by Batra and Stevens [8], shear bands formed continuously in the ejecta of the DU penetrator, which is consistent with the phenomena of the self-sharpening mechanism, and only one shear band occurred in the tungsten heavy alloy (WHA) ejecta in contrast, which was followed by more uniform deformations. They also observed that, compared with the WHA rods, the DU rods penetrated deeper, and the tunnels had smaller diameters and rougher surfaces relative to the essentially smooth tunnels that arose from the WHA penetrators.
A split-Hopkinson press bar (SHPB), also known as a Kolsky bar [9,10,11,12], is a characterization tool for the mechanical response of materials deforming at high strain rates (102–104 s−1) and is a very good way to subject the material to quantitative high strain rates. The studies of Liu et al. and Zhang et al. [13,14] using the SHPB method showed that orientated dimples and distorted deformation were found on the fractures, and the refusion phenomenon was found on the 45° fracture surface at the strain rate of 7300 s−1. The fracture morphology exhibited the dimple character of plastic metal. Hu et al. obtained relationships where the mechanical behavior of the materials varied with the strain rate and temperature and calculated the coefficients of the Johnson-Cook model. He et al. [15] showed that adiabatic shear bands in U–Ti alloy samples were deformed at very high strain rates, whose initiation was caused by the development of micro-cracks.
DU is usually judged as self-sharpening based on the result of the sharpening that occurs in the head of the projectile or simulation calculation during the penetration process, which is presumably due to the adiabatic shear bands. We used a small U-0.75 wt % Ti alloy projectile (with an 8 mm diameter and 12 mm length) to penetrate the steel plate, and the distribution of adiabatic shear bands throughout the residual samples was studied in detail in order to understand the effect of this self-sharpening on penetration. Next, we used the SHPB experiment to explore the shear strain required for the formation of the strain rate.
2. Materials and Methods
2.1. Preparation of Materials and Microstructural Characterization
Pure uranium is found in three crystal phases: a low-temperature orthorhombic α-phase, a high-temperature tetragonal β-phase, and a body-centered cubic (BCC) γ-phase that exists at higher temperatures [16,17,18]. Depleted uranium has a lower amount of the fissile U-235 isotope than natural uranium and is usually alloyed to improve its corrosion resistance and mechanical properties. A variety of structures may be obtained when samples are cooled from the γ-phase region to room temperature at different rates and under different conditions [19,20,21]. A U-0.75 wt % Ti material was selected to investigate the characteristics of adiabatic shear band formation. Titanium is a stabilizer of the high-temperature γ-phase in dilute U–Ti alloys. The U–Ti alloy with a 0.75% mass percent of Ti (U-0.75 wt % Ti), ordinarily produced by vacuum induction melting, is used for applications that require the highest combinations of strength and ductility. During the melting process, some of the titanium reacts with tramp carbon to form solid titanium carbides. While the uranium carbides that may form during solidification are dispersed throughout the ingot or casting, titanium carbides float to the surface of the melt and can be removed. Good carbon control and excellent microscale cleanliness are thus possible with U–Ti alloys [16,22].
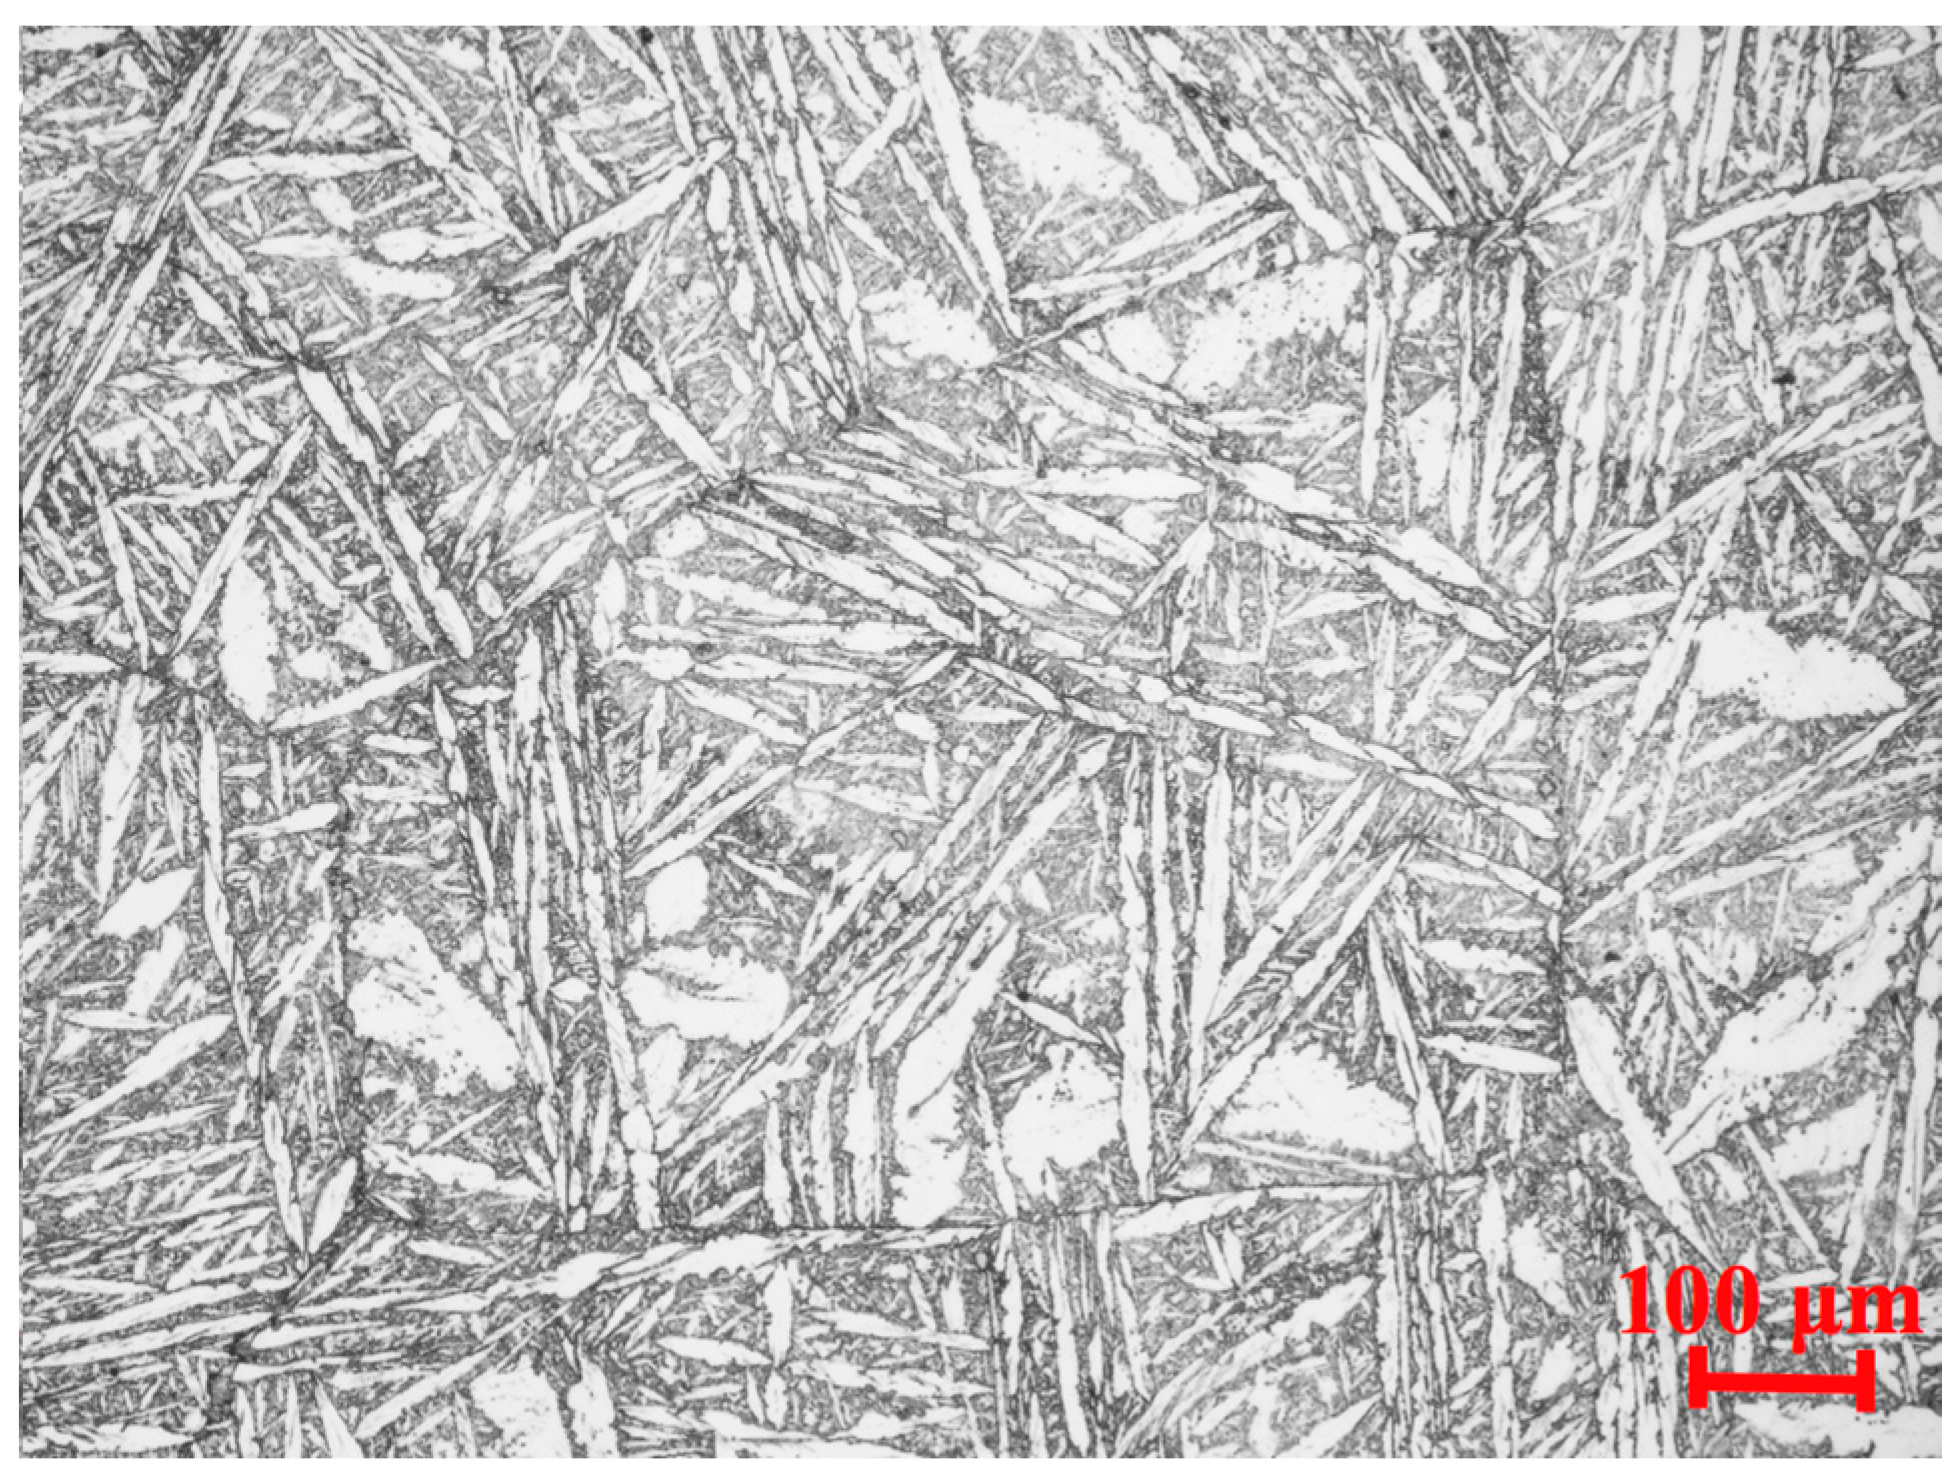
The U-0.75 wt % Ti was solution-heat-treated at 820 °C for 2 h to remove hydrogen and introduce titanium into the γ-phase uranium solution. After the solution was quenched with water and adjusted to room temperature to produce supersaturated α’ martensite, the solution was tempered at 350 °C for 8 h to form fine coherent precipitates of U2Ti. This produced a microstructure composed of α’ martensite laths with lengths of 20–100 μm. Figure 1 shows the microstructure of the heat-treated U-0.75 wt % Ti sample prior to the dynamic loading experiment.
Metallographic microscopy on a ZEISS Axio Scope A1 (Carl Zeiss AG, Oberkochen, Germany) and scanning electron microscope (SEM) on a VEGA 3 XMU (TESCAN, Brno, Czech Republic) was conducted. The ZEISS Axio Scope A1 can automatically splice microscopic photos into one at a certain magnification, which allowed us to observe the distribution of adiabatic shear bands throughout the sample. The polished samples were electrochemically etched in 5 min using a corrosive solution containing 100 mL of phosphoric acid (85%), 100 mL of glycerin, and 160 mL of alcohol. To investigate the difference between the micro-hardness in the shear bands and the sample matrix, a micro-hardness test was conducted on a TMVP-1 micro-Vickers tester (Beijing Shidai Corporation, Beijing, China). The mechanical properties of U-0.75 wt % Ti are shown in Table 1.
2.2. Impact Testing and Microstructural Characterization
A 13.1 mm ballistic gun was utilized to accelerate the DU sample to high velocity. The experimental setup is shown in Figure 2a. A cylindrical U-0.75 wt % Ti sample, with an 8 mm diameter and 12 mm length (shown in Figure 2b) was used to impact a 4340-steel plate 20 mm thick. The DU sample embedded into and almost completely penetrated the 4340-steel plate at a velocity of 1300 m/s (shown in Figure 2c), causing an obvious convex protrusion on the rear.
After the impact experiment, the DU sample and steel were not welded together and were easily separated. The residual sample was taken down from the 4340-steel plate after the impact test (shown in Figure 2d). The U-0.75 wt % Ti sample was cut in the direction of the penetration into halves via wire electrical discharge machining (WEDM). Then, the halved sample was fixed in resin for metallographic observations.
2.3. Split-Hopkinson Pressure Bar (SHPB) Testing and Microstructural Characterization
The SHPB setup, shown in Figure 3, consisted of three major components: the striker, the incident bar, and the transmission bar. The striker impacts the incident bar to generate a stress wave pulse that propagates continuously throughout the incident bar, the sample, and the transmission bar. Due to the different wave impedances of the sample and the bars, when the stress wave pulse encounters the sample, a part of the stress wave is reflected to form a reflected pulse, and the other part passes through the sample to form a transmitted pulse. All pulses can be recorded using the strain gauge. According to the theory of one-dimensional stress wave propagation and the stress equilibrium of the sample, we could calculate the stress-strain relationship of the samples under a certain strain rate.
The SHPB experimental setup and DU sample are shown in Figure 3. Uniformly compressive cylindrical samples with a 6 mm diameter and 3 mm length were used to obtain the stress-strain curves of the U-0.75 wt % Ti alloys at different strain rates. The diameter of the rod was 16 mm, the length was 1.2 m, and the yield stress was 1700 MPa made of high-strength martensitic steel. The length of the impact rod was 200 mm. The filter of the dynamic strain gauge was 200 K, and the sampling rate of the data acquisition equipment was 1 MSa/s (1 million samples per second). To investigate the influence of strain rate on the adiabatic shear bands, residual samples under five different strain rates (near the strain rate at which the material was broken) were metallurgically analyzed after the experiment ended.
3. Results and Discussions
3.1. Microstructure after Impacting
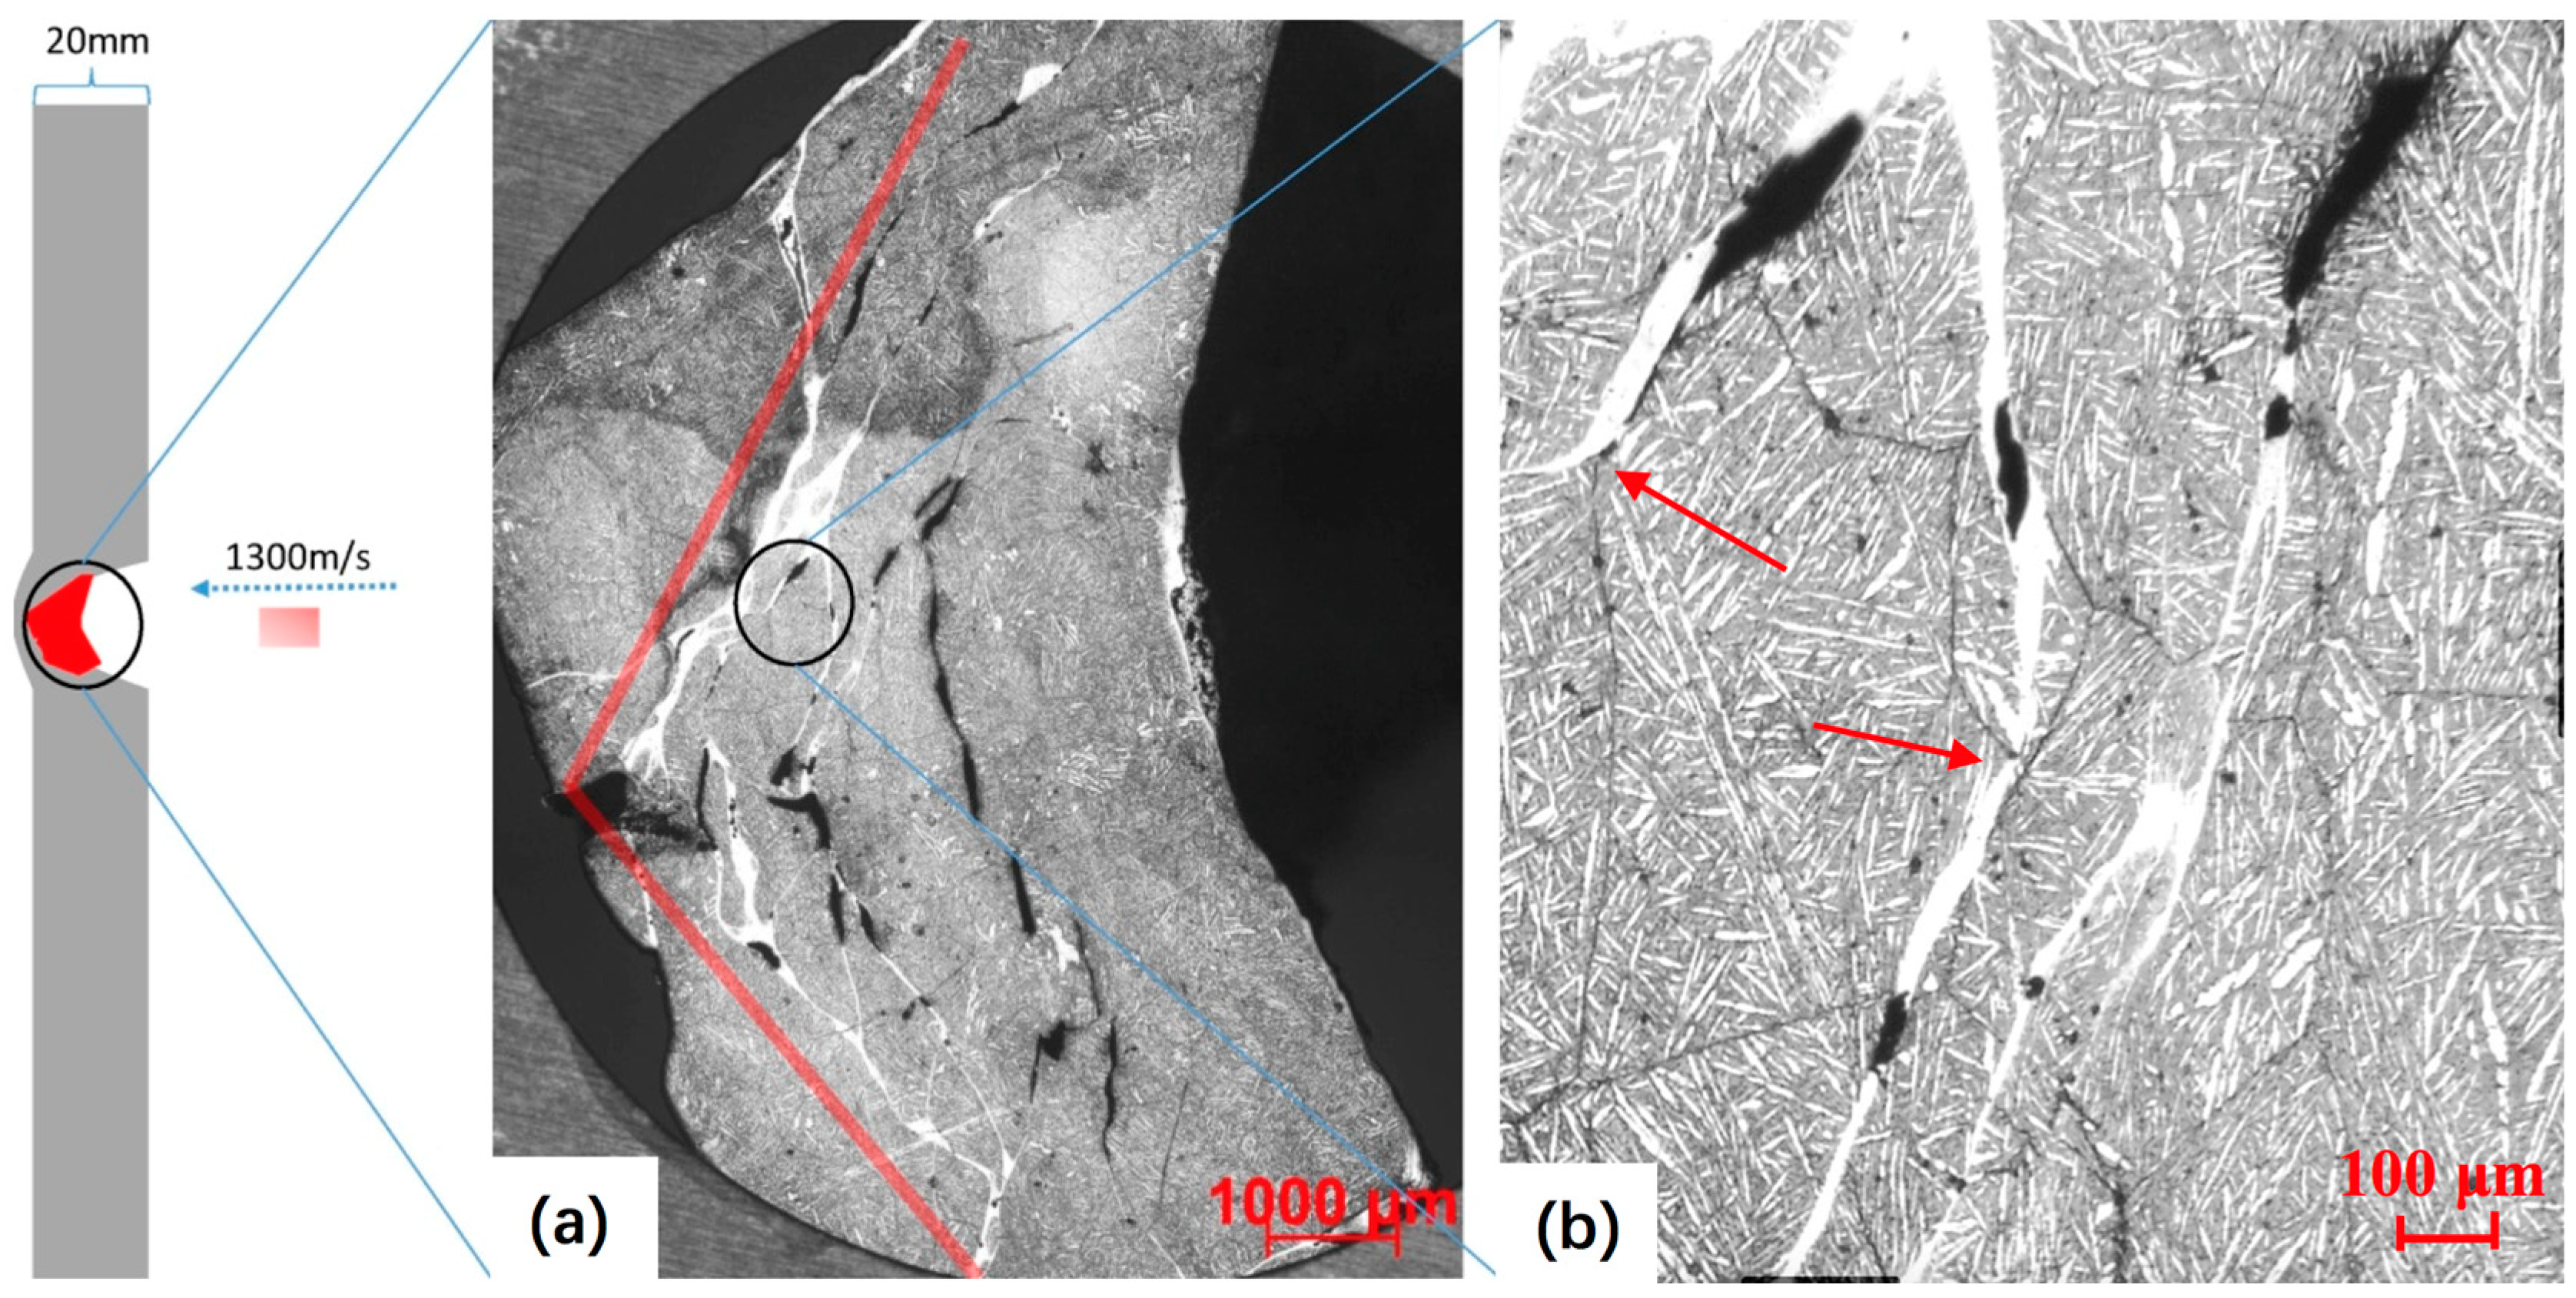
Figure 4 shows the metallographic microstructure of the adiabatic shear bands of a cylindrical U-0.75 wt % Ti sample (8 mm diameter, 12 mm length) after being embedded in a 4340-steel plate. Figure 4 was automatically spelled throughout the residual sample by a ZEISS Axio Scope A1 in a magnification of 100×. From Figure 4a, we can clearly see that the distribution of shear bands was mostly concentrated in the two outer sides of the cross section (marked by the red lines with an interior angle of nearly 110°). The centerline of the interior angle was parallel to the impact direction of the U-0.75 wt % Ti alloy into the 4340-steel plate, as indicated by the arrows in Figure 4. This kind of shear band distribution is very important.
The uranium shear bands initiate at the mantle near the transition from the mushroomed region and the relatively undeformed region, at which point a sharp-angled front-end forms in the relatively undeformed region, which is the so-called “self-sharpening” effect. The superiority of DU over tungsten-alloy penetrators is usually assigned to the self-sharpening of the uranium alloy rod tip due to the adiabatic shear failure that uranium alloys experience. In the penetration simulations performed by Batra and Stevens [8], the uranium shear band initiates at the mantle near the transition from the mushroomed region and the relatively undeformed rod, at which point a cusp forms. As the deformed penetrator material rotates and the ejecta is formed, a WHA (tungsten heavy alloy) rod is uniformly deformed while the deformations periodically localize into narrow bands in the DU ejecta. Self-sharpening is therefore determined by the appearance of shear bands in the uranium alloy. The metallurgical images shown in Figure 4 present direct evidence of the self-sharpening mechanism. The self-sharpening mechanism is directly confirmed by the shear bands distribution present after impact, as shown in Figure 4a.
Figure 4b presents a detailed microscopic image of the U-0.75 wt % Ti alloy where shear bands were observed to change direction (marked with red arrows) when they crossed a grain boundary. Shear bands were also found to be blocked (marked with red arrows) when passing through the grain boundaries. These findings are important as the grain boundaries and grain size have an influence on the formation of shear bands. We also found from Figure 4b that there were cracks inside the shear bands, which showed that the shear bands were the primary form of material damage.
3.2. Scanning Electron Microscope and Vickers Micro-Hardness Results on Shear Bands
We detected the elemental composition in the shear band using energy dispersive spectroscopy (EDS) technology to ensure that there was no composition of iron in the shear band after impacting the 4340-steel plate. Figure 5 presents energy dispersive spectroscopy (EDS) results, showing that there was no Fe element in the shear bands. Therefore, the shear bands did not mix with any melted iron produced by the impact, thus providing further evidence that the white band is an adiabatic shear band.
Vickers micro-hardness test results obtained from one sample are shown in Table 2. The micro-hardness in the adiabatic shear zone was on average 18% lower than that in the matrix. Figure 6 presents the micro-hardness metallographic photographs of shear bands and material matrix. The micro-hardness metallographic photographs of #5 and #6 were tested in the material matrix but are not shown in this figure. The #2 test position in Figure 6a was close to the sample matrix, so its micro-hardness results were greater than that of the fully inner shear band.
Shear bands are usually termed as either “transformed” or “deformed” according to how the prior shear deformation is partitioned between two discrete zones in a metallographic cross-sectional image [23]. Metals are therefore classified by their tendency to form these two types of shear zones during adiabatic shear deformation: one consideration is the phase change and recrystallization behavior, and another is the strong deformation and grain elongation. It is generally considered that the flow stress in certain metals increases with increasing effective plastic strain and strain rate but decreases with a rise in the temperature during dynamic loading. As a result, the formation conditions and microstructure of the shear bands vary widely in different materials. Zener and Hollomon [24] attributed the adiabatic shear band formation to the point where thermal softening overcame work (or strain) hardening and presented a simple and classic interpretation: “When the material undergoes an element of strain adiabatically, the stress is raised by the strain hardening, and lowered by the associated rise in temperature.” That the competition between thermal softening and work hardening controls shear band formation can be qualitatively understood by considering heat conduction. The time available for heat conduction to occur decreases as strain rate increases; for a given strain, higher temperatures are therefore reached at higher strain rates [24,25].
The impact pressure can be calculated theoretically by the one-dimensional shock wave theory [25,26,27,28]. When a sample impacts a stationary plate at the velocity of v0, the shock wave propagates in the sample and plate, respectively.
For the sample and plate,
For shock wave velocity,
By interfacial continuity,
P is the shock wave pressure; ρ is the density; D is the shock wave velocity; u is the particle velocity; a and b are the Hugoniot coefficient; subscript du and t represent the sample and plate, respectively. By combining Equations (1)–(3), the impact pressure Pdu on the sample can be obtained.
According to the Hugoniot curve, a shock wave propagates through a sample and increases its average temperature. Assuming that the thermodynamic process is adiabatic, and the internal friction is negligible, the average impact temperature T1 can be expressed as follows:
where γ0 is the Gruneisen coefficient; T0 is the initial temperature of the solid (generally considered to be 300 K); V0 is the initial specific volume of the solid; V1 is the post-shock specific volume; Cv is the heat capacity at constant volume; P1 is the shock wave pressure.
The material parameters for the calculation of impact pressure and average temperature are listed in Table 3 [25].
The calculation indicated that the impact of the sample on the steel plate at 1300 m/s resulted in an impact pressure of 9.12 GPa with an average impact temperature rise of 796.75 °C. This temperature is certainly sufficient to transform the material to a γ-phase and increased the flow stress in the U-0.75 wt % Ti. Such a transformation is necessary for the DU sample to form a eutectoid microstructure upon cooling. Metals with a low thermal diffusivity and low resistance to adiabatic shear localization tend to form more transformed shear bands. These metals are also capable of transforming to other phases at elevated temperatures (and pressures) and of forming martensite on rapid cooling to room temperature. The same phenomenon was also found in the spallation experiment by Zurek [29]. From the SEM photograph in the shear band, we found that there was no specific visible texture inside the shear band as shown in Figure 7.
We deduced from the SEM result of the shear band, the Vickers micro-hardness test results, and the calculated impact temperature rises that the shear band experienced a process of phase change.
3.3. Dynamic Mechanical Characterization and Microstructure after SHPB
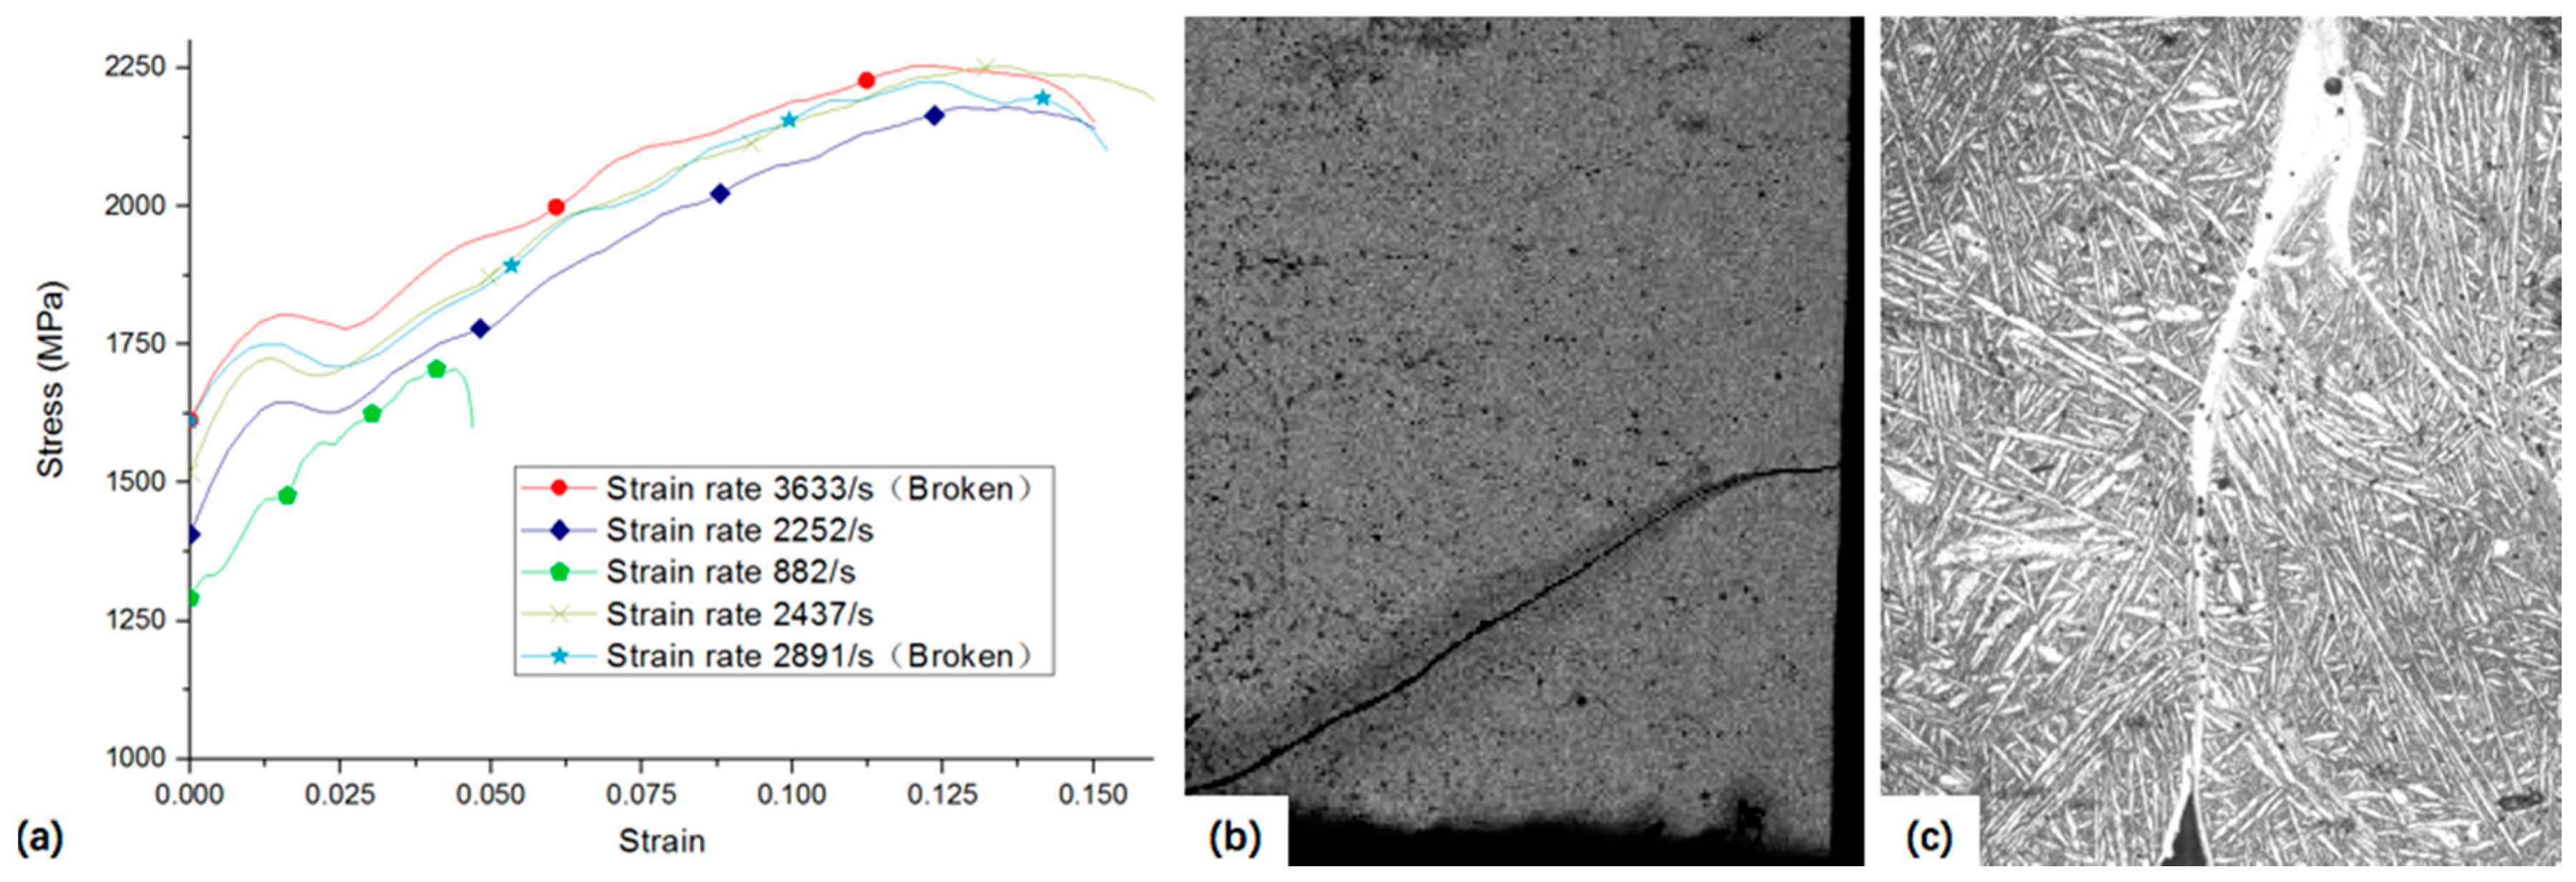
Figure 8a presents the typical stress-strain curves obtained under dynamic loading. From the curves, it was easy to find that U-0.75 wt % Ti is a strain-rate-sensitive material. Metallurgical analyses of the samples after SHPB testing are shown in Figure 8b,c. Figure 8b presents the image of a sample after it was subjected to a stain rate of 2437 s−1. We did not find adiabatic shear bands in the sample at this strain rate (shown in Figure 8b), and there was only a crevice instead of a shear band in the sample, which indicated that the adiabatic shear band cannot form below a certain strain rate.
Figure 8c presents the metallographic image of a sample after it was subjected to a stain rate of 2891 s−1. The sample broke into three parts near 45° angles and showed a single shear band. Adiabatic shear bands were followed by cracks, indicating that, under high strain rate conditions, the adiabatic shear bands appeared before the crack occurred. We did not find any adiabatic shear bands in the sample below this strain rate. It can be summarized that the strain rate of 2891 s−1 is around the threshold value required to trigger the appearance of shear bands in this U-0.75 wt % Ti alloy.
4. Conclusions
- (1)
- Clear shear bands concentrated in an angle were observed in the microstructure of the uranium alloy after impact. These findings are the direct evidence of the so-called “self-sharpening” mechanism that was confirmed by the shear band distribution formed after impact.
- (2)
- The Vickers micro-hardness test results showed that the micro-hardness in the adiabatic shear zone was 18% lower than that in the matrix. Based on the theoretical calculations, the Vickers micro-hardness, and SEM results, we deduced that the shear bands experienced a process of phase change, with average impact temperature rises of 796.75 °C at an impact speed of 1300 m/s.
- (3)
- A strain rate of around 2891 s−1 was determined to be the threshold value required to trigger the appearance of adiabatic shear bands for the U-0.75 wt % Ti alloy.
Acknowledgments
The authors are very grateful for the support received from the National Natural Science Foundation of China (No. 11472053).
Author Contributions
Bo Wang and Yongxiang Dong conceived and designed the experiments; Bo Wang and Guangyan Huang performed the experiment and analyzed the data; Bo Wang wrote the paper.
Conflicts of Interest
The authors declare no conflict of interest.
References
- Hu, N.; Molinari, J.F. Shear bands in dense metallic granular materials. J. Mech. Phys. Solids 2004, 52, 499–531. [Google Scholar] [CrossRef]
- Maaß, R.; Löffler, J.F. Shear-band dynamics in metallic glasses. Adv. Funct. Mater. 2015, 25, 2353–2368. [Google Scholar] [CrossRef]
- Wei, Q.; Jia, D.; Ramesh, K.T.; Ma, E. Evolution and microstructure of shear bands in nanostructured Fe. Appl. Phys. Lett. 2002, 81, 1240–1242. [Google Scholar] [CrossRef]
- Olmsted, P.D. Perspectives on shear banding in complex fluids. Rheol. Acta 2008, 47, 283–300. [Google Scholar] [CrossRef]
- Rosenberg, Z.; Dekel, E. On the role of nose profile in long-rod penetration. Int. J. Impact Eng. 1999, 22, 551–557. [Google Scholar] [CrossRef]
- Magness, L.S. Properties and performance of KE penetrator materials. In Proceedings of the Tungsten and Tungsten Alloys Conference, Arlington, TX, USA, 15–18 November 1992; Bose, A., Dowding, R., Eds.; Metal Powder Industries Federation: Princeton, NJ, USA, 1993; pp. 15–22. [Google Scholar]
- Zurek, A.K.; Follansbee, P.S. A comparison of shear localization susceptibility in U-0.75 wt pct Ti and W–Ni–Fe during high strain rate deformation. Metall. Mater. Trans. A 1995, 26, 1483–1490. [Google Scholar] [CrossRef]
- Batra, R.; Stevens, J. Adiabatic shear bands in axisymmetric impact and penetration problems. Comput. Methods Appl. Mech. Eng. 1998, 151, 325–342. [Google Scholar] [CrossRef]
- Kolsky, H. An investigation of the mechanical properties of materials at very high rates of loading. Proc. Phys. Soc. B 1949, 62, 676. [Google Scholar] [CrossRef]
- Asay, J.R.; Shahinpoor, M. High-Pressure Shock Compression of Solids; Springer: New York, NY, USA, 2012. [Google Scholar]
- Chen, W.W.; Song, B. Split Hopkinson (Kolsky) Bar: Design, Testing and Applications; Springer: New York, NY, USA, 2010. [Google Scholar]
- Zhao, H.; Elnasri, I.; Li, H.J. The mechanism of strength enhancement under impact loading of cellular materials. Adv. Eng. Mater. 2006, 8, 877–883. [Google Scholar] [CrossRef]
- Liu, T.; Zhang, P.; He, L. Dynamic mechanical properties of U–Ti alloy. Atom. Energy Sci. Technol. 2009, 43, 1095–1099. [Google Scholar]
- Liu, T.; Zhang, P.; He, L.; Bai, B. Dynamic compression performances and adiabatic shearing characters of U–Ti alloys. Rare Met. Mater. Eng. 2010, 39, 800–803. [Google Scholar]
- He, L.; Xiao, D.; Wu, X.; Liu, T.; Jiang, C. Deformation and failure mechanism of U–Ti alloy by SHPB. Rare Met. Mater. Eng. 2013, 42, 1382–1386. [Google Scholar]
- ASM Handbook. Properties and Selection: Nonferrous Alloys and Special-Purpose Materials; ASM International: Almere, The Netherlands, 1990; Volume 2, pp. 889–896. [Google Scholar]
- Starikov, S.; Kolotova, L. Features of cubic and tetragonal structures of U-Mo alloys: Atomistic simulation. Scr. Mater. 2016, 113, 27–30. [Google Scholar] [CrossRef]
- Clark, D.L.; Keogh, D.W.; Neu, M.P.; Runde, W. Uranium and uranium compounds. In Kirk-Othmer Encyclopedia of Chemical Technology; Whitlock, J., Ed.; John Wiley & Sons: New York, NY, USA, 2001. [Google Scholar]
- Kimmel, G.; Landau, A.; Sariel, J.; Admon, U. Phase transformations in dilute U–Ti alloys. J. Less Common Met. 1986, 121, 483–486. [Google Scholar] [CrossRef]
- Peehs, M.; Walter, T.; Walter, S.; Zemek, M. Uranium, uranium alloys, and uranium compounds. In Ullmann’s Encyclopedia of Industrial Chemistry; John Wiley & Sons: New York, NY, USA, 2007. [Google Scholar]
- McDiarmid, M.A.; Gaitens, J.M.; Squibb, K.S. Uranium and thorium. In Patty’s Toxicology; John Wiley & Sons: New York, NY, USA, 2012. [Google Scholar]
- Sunwoo, A.; Goto, D. Effects of processing on microstructure and properties of α-uranium formed parts. Scr. Mater. 2002, 47, 261–266. [Google Scholar] [CrossRef]
- Timothy, S. The structure of adiabatic shear bands in metals: A critical review. Acta Metall. 1987, 35, 301–306. [Google Scholar] [CrossRef]
- Meyers, M.A. Dynamic Behavior of Materials; John Wiley & Sons: New York, NY, USA, 1994. [Google Scholar]
- Zener, C.; Hollomon, J.H. Effect of strain rate upon plastic flow of steel. J. Appl. Phys. 1944, 15, 22–32. [Google Scholar] [CrossRef]
- Zhang, X.; Shi, A.; Qiao, L.; Zhang, J.; Zhang, Y.; Guan, Z. Experimental study on impact-initiated characters of multifunctional energetic structural materials. J. Appl. Phys. 2013, 113, 083508. [Google Scholar] [CrossRef]
- Feng, S.; Wang, C.; Huang, G. Experimental study on the reaction zone distribution of impact-induced reactive materials. Propellants Explos. Pyrotech. 2017, 42, 896–905. [Google Scholar] [CrossRef]
- Wang, H.; Zheng, Y.; Yu, Q.; Liu, Z.; Yu, W. Impact-induced initiation and energy release behavior of reactive materials. J. Appl. Phys. 2011, 110, 074904. [Google Scholar]
- Zurek, A. Preshock-induced phase transition in spalled U-0.75 wt % Ti. J. Nucl. Mater. 1999, 264, 155–160. [Google Scholar] [CrossRef]
Figure 1.
Metallographic image of a U-0.75 wt % Ti sample heat-treated at 820 °C for 2 h, water-quenched, and then tempered at 350 °C for 8 h. The microstructure is composed of lath-shaped α’ martensite (20–100 μm long).
Figure 1.
Metallographic image of a U-0.75 wt % Ti sample heat-treated at 820 °C for 2 h, water-quenched, and then tempered at 350 °C for 8 h. The microstructure is composed of lath-shaped α’ martensite (20–100 μm long).

Figure 2.
Experimental setup and depleted uranium (DU) sample. (a) The experimental setup. (b) The DU sample before impact testing. (c) The DU sample embedded into and almost completely penetrated the 4340-steel plate at a velocity of 1300 m/s. (d) The residual sample was taken down from the 4340-steel plate after the impact test.
Figure 3.
Split-Hopkinson pressure bar (SHPB) experimental setup images: (a) The SHPB test device. (b) Protection and recycling boxes made of steel. (c) Ultra-dynamic strain gauges and data acquisition equipment. (d) Laser speed measuring device. (e) Typical raw incident, reflection, and transmission signals. (f) Sample before test. (g) Typical form of material damage: broken into three pieces along 45°.
Figure 4.
Metallographic images of a cylindrical U-0.75 wt % Ti sample with an 8 mm diameter and 12 mm length embedded in a 4340-steel plate: (a) the distribution of shear bands was clearly concentrated in the two outer sides of the cross-section with an interior angle (marked as red lines) of nearly 110°, and (b) some shear bands changed direction (marked with red arrows) when they encountered or crossed a grain boundary (marked as red lines).

Figure 5.
The energy dispersive spectroscopy (EDS) result in the shear band showed that there was no Fe in the shear bands.
Figure 5.
The energy dispersive spectroscopy (EDS) result in the shear band showed that there was no Fe in the shear bands.
Figure 6.
Vickers Micro-hardness test results: (a) micro-hardness metallographic photographs of the internal shear bands and (b) the material matrix.
Figure 6.
Vickers Micro-hardness test results: (a) micro-hardness metallographic photographs of the internal shear bands and (b) the material matrix.
Figure 7.
The SEM result of the inner shear band shows that the shear band gets through a state of high temperature. There was no visible texture in the shear band under this magnification.
Figure 7.
The SEM result of the inner shear band shows that the shear band gets through a state of high temperature. There was no visible texture in the shear band under this magnification.
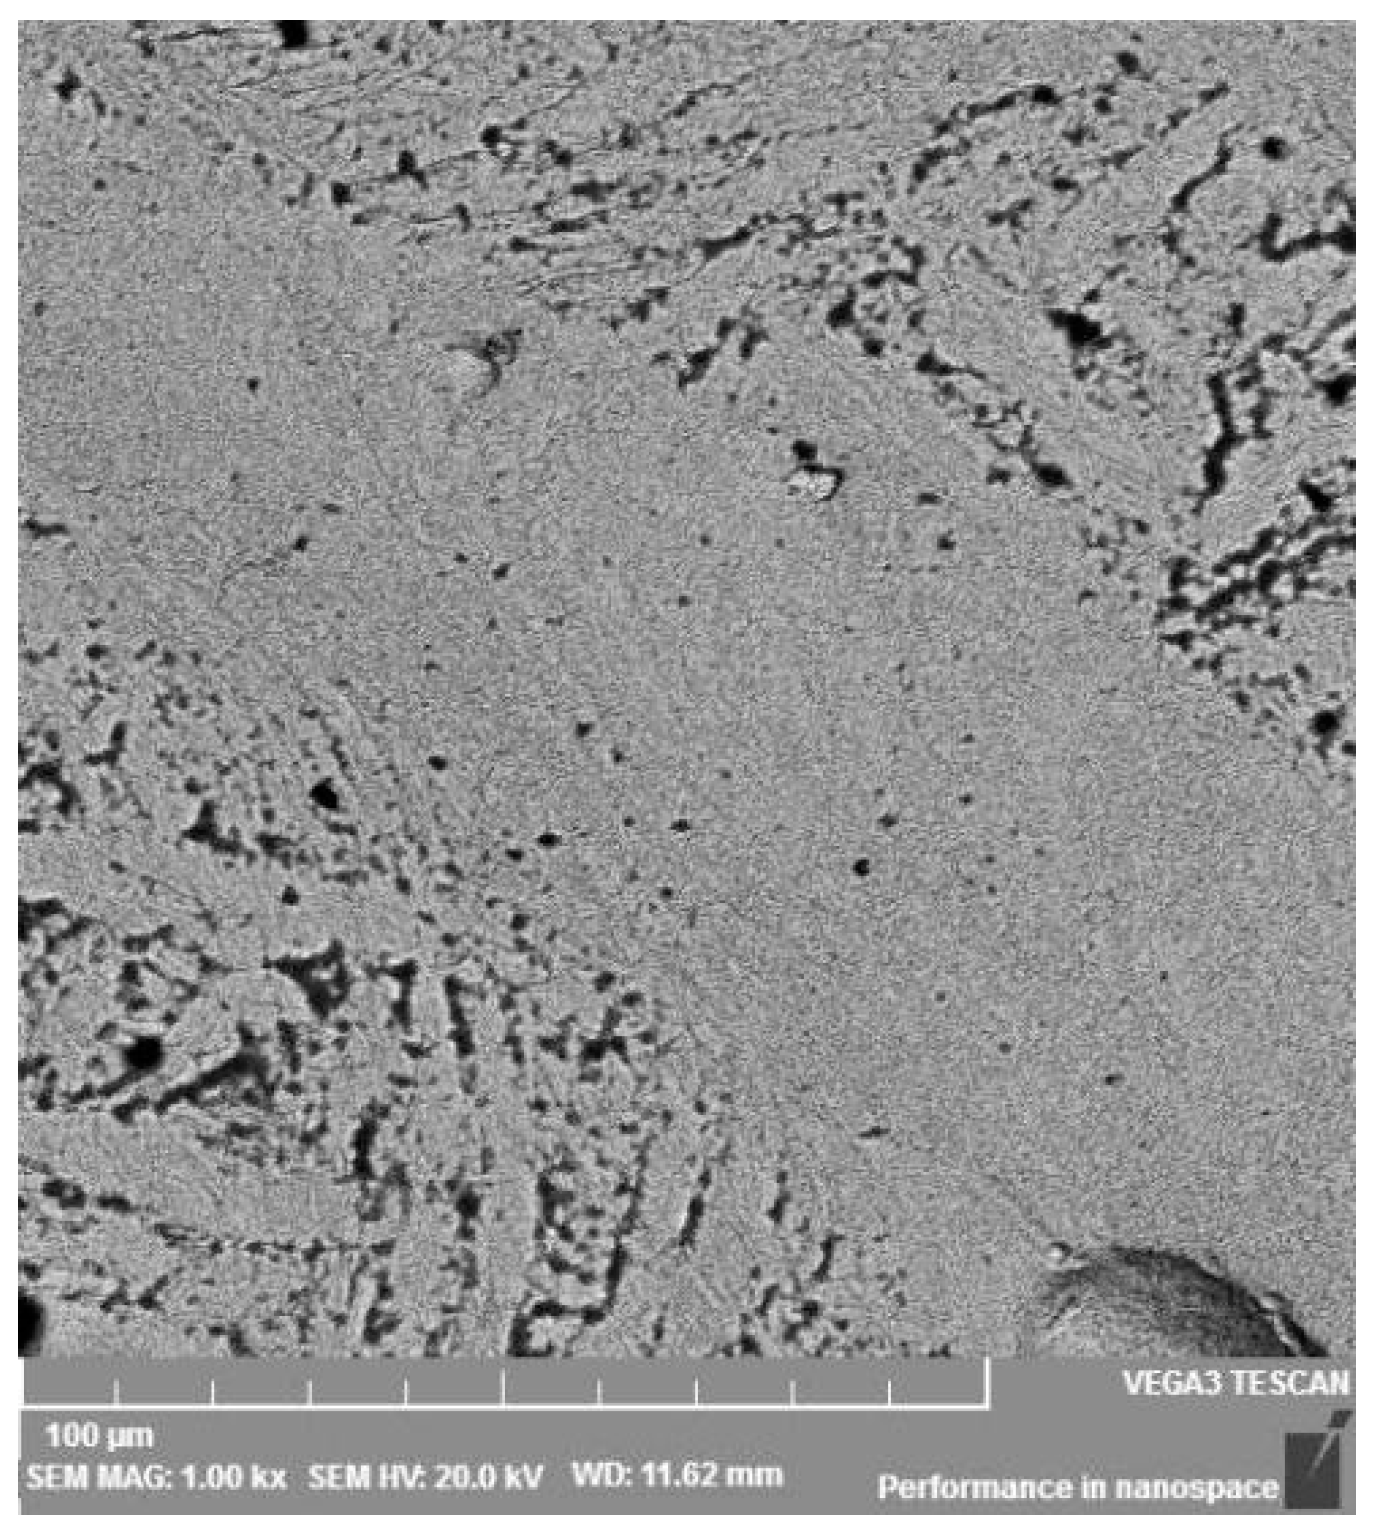
Figure 8.
(a) True-strain–true-stress curves of U-0.75 wt % Ti obtained with split-Hopkinson pressure bar (SHPB) tests. (b) Metallographic image corresponding to the stain rate of 2437 s−1: only a crevice, instead of shear band, in the sample. (c) Metallographic image corresponding to a stain rate of 2891 s−1: adiabatic shear bands are followed by cracks.

Table 1.
Mechanical properties of U-0.75 wt % Ti.
| Material | Test Temperature | Diameter | Yield Stress (σs) | Tensile Strength (σb) | Elongation |
|---|---|---|---|---|---|
| U-0.75 wt % Ti | 27 °C | 5.02 mm | 1122.9 MPa | 1519.4 MPa | 16.6% |
Table 2.
Vickers Micro-hardness test results in the shear band and the sample matrix.
| No. | Test Location | Vickers Micro-Hardness | Average Value |
|---|---|---|---|
| #1 | Shear band | 365 HW | 368 HW |
| #2 | Shear band | 396 HW | (18% decline) |
| #3 | Shear band | 345 HW | - |
| #4 | Sample matrix | 445 HW | 449 HW |
| #5 | Sample matrix | 455 HW | - |
| #6 | Sample matrix | 449 HW | - |
Table 3.
The material parameters for the calculation of impact pressure and average temperature.
| No. | Materials | ρ (g/cm3) | a (mm/μs) | b | γ | Cv J/(g·K) |
|---|---|---|---|---|---|---|
| 1 | DU | 18.95 | 2.49 | 2.20 | 2.1 | 0.12 |
| 2 | Steel | 7.85 | 3.57 | 1.92 | 1.8 | 0.45 |
© 2018 by the authors. Licensee MDPI, Basel, Switzerland. This article is an open access article distributed under the terms and conditions of the Creative Commons Attribution (CC BY) license (http://creativecommons.org/licenses/by/4.0/).
Share and Cite
MDPI and ACS Style
Wang, B.; Dong, Y.; Huang, G. An Investigation on the Adiabatic Shear Bands in Depleted U-0.75 wt % Ti Alloy under Dynamic Loading. Metals 2018, 8, 145. https://doi.org/10.3390/met8020145
AMA Style
Wang B, Dong Y, Huang G. An Investigation on the Adiabatic Shear Bands in Depleted U-0.75 wt % Ti Alloy under Dynamic Loading. Metals. 2018; 8(2):145. https://doi.org/10.3390/met8020145
Chicago/Turabian StyleWang, Bo, Yongxiang Dong, and Guangyan Huang. 2018. "An Investigation on the Adiabatic Shear Bands in Depleted U-0.75 wt % Ti Alloy under Dynamic Loading" Metals 8, no. 2: 145. https://doi.org/10.3390/met8020145
Note that from the first issue of 2016, this journal uses article numbers instead of page numbers. See further details here.