Article

Estimation of Fracture Loads in AL7075-T651 Notched Specimens Using the Equivalent Material Concept Combined with the Strain Energy Density Criterion and with the Theory of Critical Distances

1
LADICIM (Laboratory of Materials Science and Engineering), University of Cantabria, E.T.S. de Ingenieros de Caminos, Canales y Puertos, Av/Los Castros 44, 39005 Santander, Spain
2
Department of Engineering Design and Materials, Norwegian University of Science and Technology, Richard Birkelands bei 2b, 7491 Trondheim, Norway
3
Fracture Research Laboratory, Faculty of New Sciences and Technologies, University of Tehran, P.O. Box 14395-1561 Tehran, Iran
4
Centro Tecnológico de Componentes-CTC, C/Isabel Torres n°1, 39011 Santander, Spain
5
Department of Mechanical Engineering, Iran University of Science and Technology, P.O. Box 16846-13114 Tehran, Iran
*
Author to whom correspondence should be addressed.
Metals 2018, 8(2), 87; https://doi.org/10.3390/met8020087
Submission received: 22 December 2017 / Revised: 16 January 2018 / Accepted: 21 January 2018 / Published: 25 January 2018

Abstract

:
The main goal of this paper is the application of the Strain Energy Density (SED) criterion and the Theory of Critical Distances (TCD), both of them in combination with the Equivalent Material Concept (EMC), to predict the fracture loads of aluminum alloy Al7075-T651 Compact Tension (CT) specimens containing U-shaped notches. For this purpose, 45 fracture tests were performed combining two rolling orientations (transverse and longitudinal) and 6 notch radii, which cover from crack-type defects (0 mm) up to 2 mm-notch radius. Crack-type specimens are used to define the fracture properties of the material and the rest of the tests are used to check and compare the experimental fracture loads with the loads predicted using the different aforementioned criteria: SED, EMC-SED and EMC-TCD. The theoretical results of the fracture load predictions for the virtual brittle material obtained employing the EMC are in good agreement with the experimental results reported for real samples.

1. Introduction

Aluminum alloys of the 7xxx series are widely used in engineering structures, particularly in aerospace structures. By using special heat treatment processes, the mechanical properties of these alloys such as fracture toughness, tensile properties or fatigue strength can be improved. Two noteworthy alloys are Al7075-T6 and Al7075-T651. These alloys are used in situations where it is necessary to introduce notches (e.g., slots, holes, etc.), which, on the one hand, allow two or more components to be joined, but on the other hand, act as stress concentrators that may reduce the load bearing capacity of the component.
Heretofore, in order to simplify the analysis of notched components, notches have been evaluated as crack-type defects using the sharp crack methodology, generally based on Fracture Mechanics. This assumption is excessively conservative. The load-bearing capacity of the components that contain notches is greater than cracked components, since the stress fields at the tip of the defect are less severe than those existing at the crack tip and the fracture mechanisms tend to be more ductile [1]. For this reason, it is necessary to develop different methodologies that take into account these particularities. In this way, predictions of fracture loads for notched components could be more accurate and the over-conservatism could be reduced.
There are many different criteria to analyze the fracture behavior of notched components. In this paper, two of them will be evaluated. These two criteria are the Theory of Critical Distances (TCD) [1,2,3,4,5,6,7,8] and the Strain Energy Density (SED) criterion [9,10,11,12,13,14,15,16,17]. The TCD has been successfully applied to polymers (e.g., [1,2]), metals (e.g., [2,3,4]), composites (e.g., [5]) and rocks (e.g., [6]), and has also been combined with Failure Assessment Diagrams in order to provide structural integrity assessment methodologies for structural components containing notches [7]. A comprehensive review of the TCD may be found in [8]. However, the SED criterion, whose origins may be found in [9,10,11,12] has also been successfully applied to different materials and loading conditions (e.g., [13] for mode I, [14] for mode II, and [15] for welded structures. A complete description of this criterion, as well as an extensive application to different types of materials may be found in [16], and ref. [17] provides useful expressions that allow this criterion to be easily applied. Both of them (TCD and SED) have a linear-elastic nature and provide accurate predictions when analyzing fracture conditions in brittle materials. When applied in more ductile situations, the TCD may still be applied after a calibration process (e.g., [1,2,5]), while the SED criterion loses accuracy (e.g., [13,15,16]).
Other criteria that can be considered to study the notch effect are the Global Criterion [18,19], Process Zone Models [20,21,22,23,24], Statistical Models [25,26] or Mechanistic Models [27], among others. The Globlal Criterion defines the notch stress intensity factor (notch stress intensity factor (NSIF), Kρ) and establishes that failure occurs when the NSIF is equal to a given critical value (Kρc), which depends on the material and the notch radius. It has linear-elastic nature and presents difficulties related to the definition and obtainment of the different parameters involved in the analysis. Process Zone Models generally consider that fracture takes place across an extended defect tip on which the corresponding stress field and the material behavior are defined. Their origin may be found in [20,21], successful applications may be found (for example) in [22] for concretes and [23] for polymethylmethacrylate (PMMA) in notched conditions, and a complete overview of their theoretical assumptions is described in [24]. Statistical Models take into account that the observed fracture resistance of a given material may present a significant scatter, given that engineering materials are not perfectly homogeneous. This was first analyzed in [25], whereas, as an example, [26] includes a Weibull distribution for the fracture analysis of structural steels. Finally, mechanistic models relate the fracture behavior of materials with their microstructural characteristics. The Ritchie-Knott-Rice (RKR) model [27] is one of the most representative mechanistic models, and proposes that cleavage fracture takes place when the stress ahead of the crack tip exceeds a critical value (σf) over a characteristic distance which, for the mild steel they tested, was equal to two grain size diameters. In any case, the application of these other criteria may result complex and really time-consuming
With the aim of applying both the TCD and the SED to non linear-elastic conditions, but keeping their simple linear-elastic formulation, both approaches will be combined with the Equivalent Material Concept (EMC) [28,29,30,31,32].
With all of this, Section 2 provides an overview of the TCD, the SED criterion and the EMC, Section 3 presents the materials and methods, Section 4 presents the results and the corresponding discussion, and Section 5 presents the final conclusions.

2. Theoretical Background

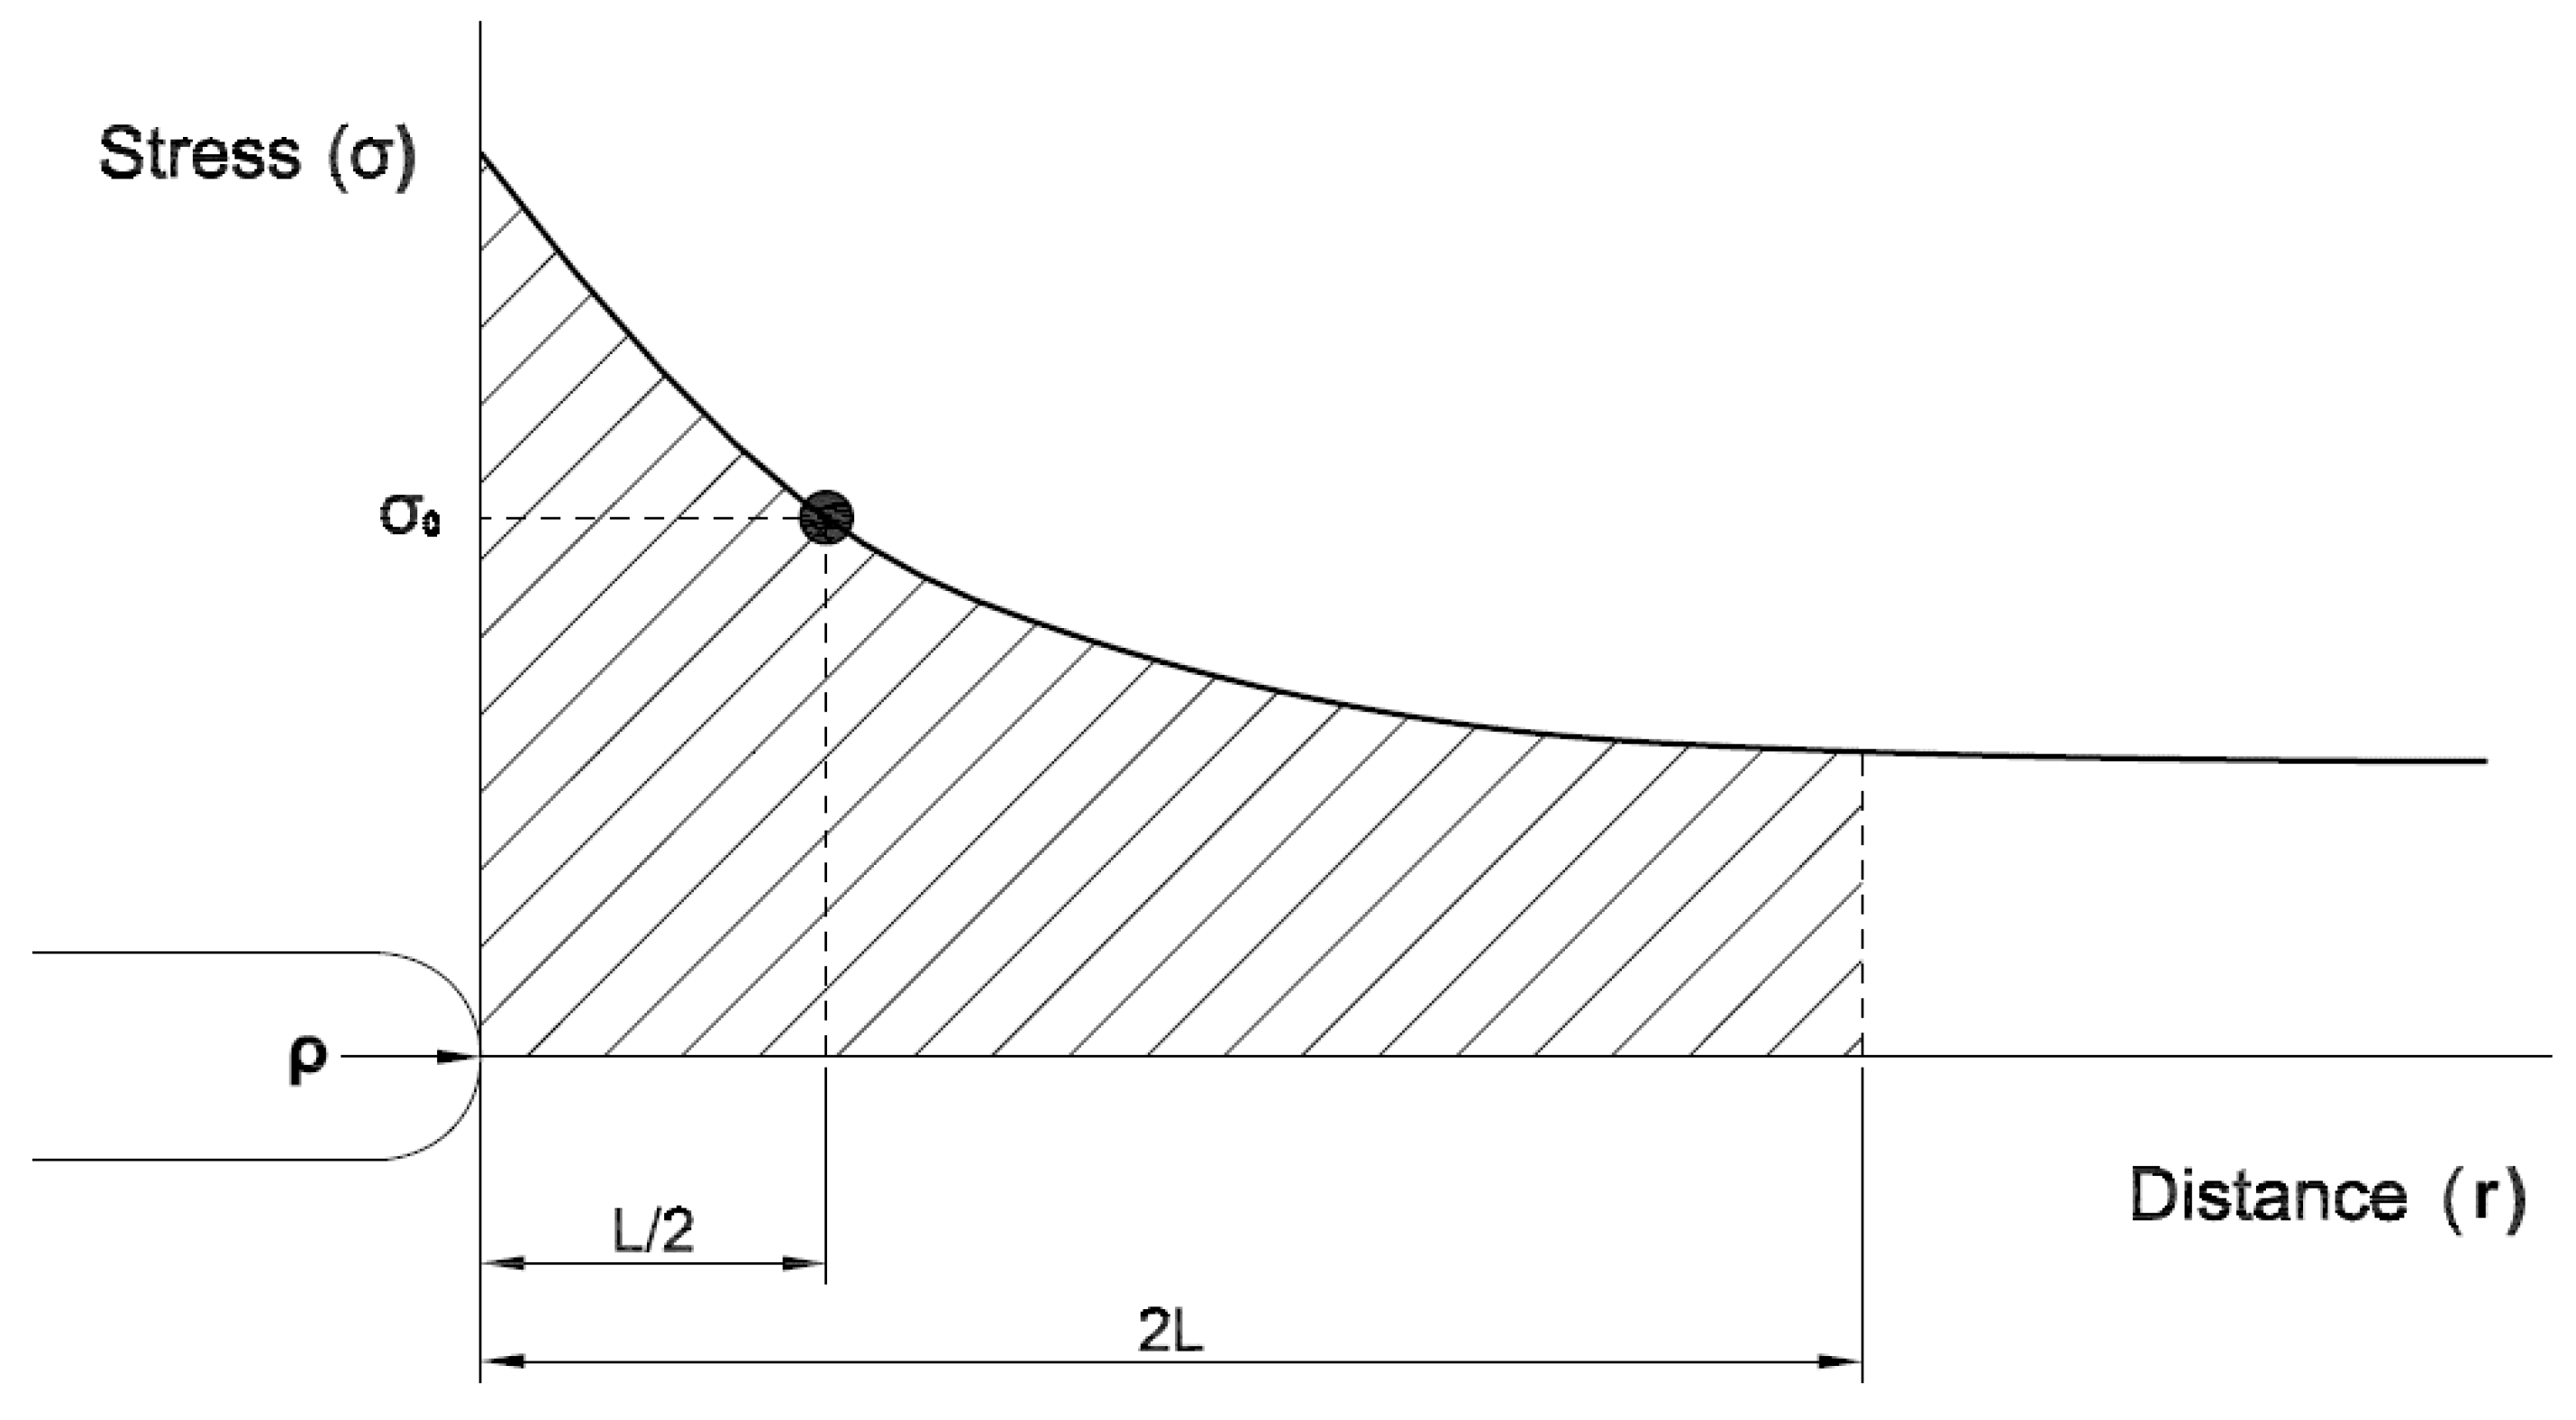
2.1. Theory of Critical Distances

In the nineteen-fifties, Neuber [33] and Peterson [34] established the basis of the TCD, although when their methodologies were proposed, it was not easy to obtain accurate stress-fields in notched structural components.
With the development of finite element analysis, accurate stress-fields could be obtained. This fact enabled Taylor [8] to go back to the TCD, which is actually a group of methodologies that allow the effect of notches on the fracture behavior of engineering materials to be predicted. For this purpose, it is necessary to define two parameters: L (the critical distance), which is defined by Equation (1), and σ0 (the inherent strength), which are related through Equation (1):
L = 1 π ( K c σ 0 ) 2
where Kc is the material fracture toughness. In the case of the linear-elastic behavior of the material, σ0 is equal to the ultimate tensile strength, σu. If the behavior of the material is not linear-elastic, σ0 generally is greater than σu and requires calibration.
Within the TCD, there are two methodologies that stand out for their simplicity: the Point Method (PM) and the Line Method (LM). Both of them lead to similar predictions of the fracture load and provide accurate results when compared to the corresponding experimental fracture loads.
The Point Method establishes that fracture will occur when, at a distance L/2 from the notch tip, the value of the stress is equal to the inherent strength, Equation (2):
σ ( L 2 ) = σ 0
However, according to the Line Method, fracture will occur when the mean stress over a distance of 2L from the notch tip, is equal to the inherent strength, Equation (3):
1 2 L 0 2 L σ ( r ) d r = σ 0
Figure 1 shows the graphical definition of the different methods mentioned above.
Considering the stress distribution proposed by Creager-Paris [35] for U-shaped notches (Equation (4), KI being the stress intensity factor for a crack with the same dimensions of the notch being analyzed) and the fracture conditions established by the PM and the LM, it is possible to derive useful expressions for the apparent fracture toughness ( K   C N ) (Equation (5) for the PM and in Equation (6) for the LM):
σ ( r ) = K I π 2 ( r + ρ ) ( 2 r + ρ ) 3 / 2
K C N = K C ( 1 + ρ L ) 3 / 2 ( 1 + 2 ρ L )
K C N = K C 1 + ρ 4 L
The apparent fracture toughness is understood here as the fracture resistance developed by the material in notched conditions.

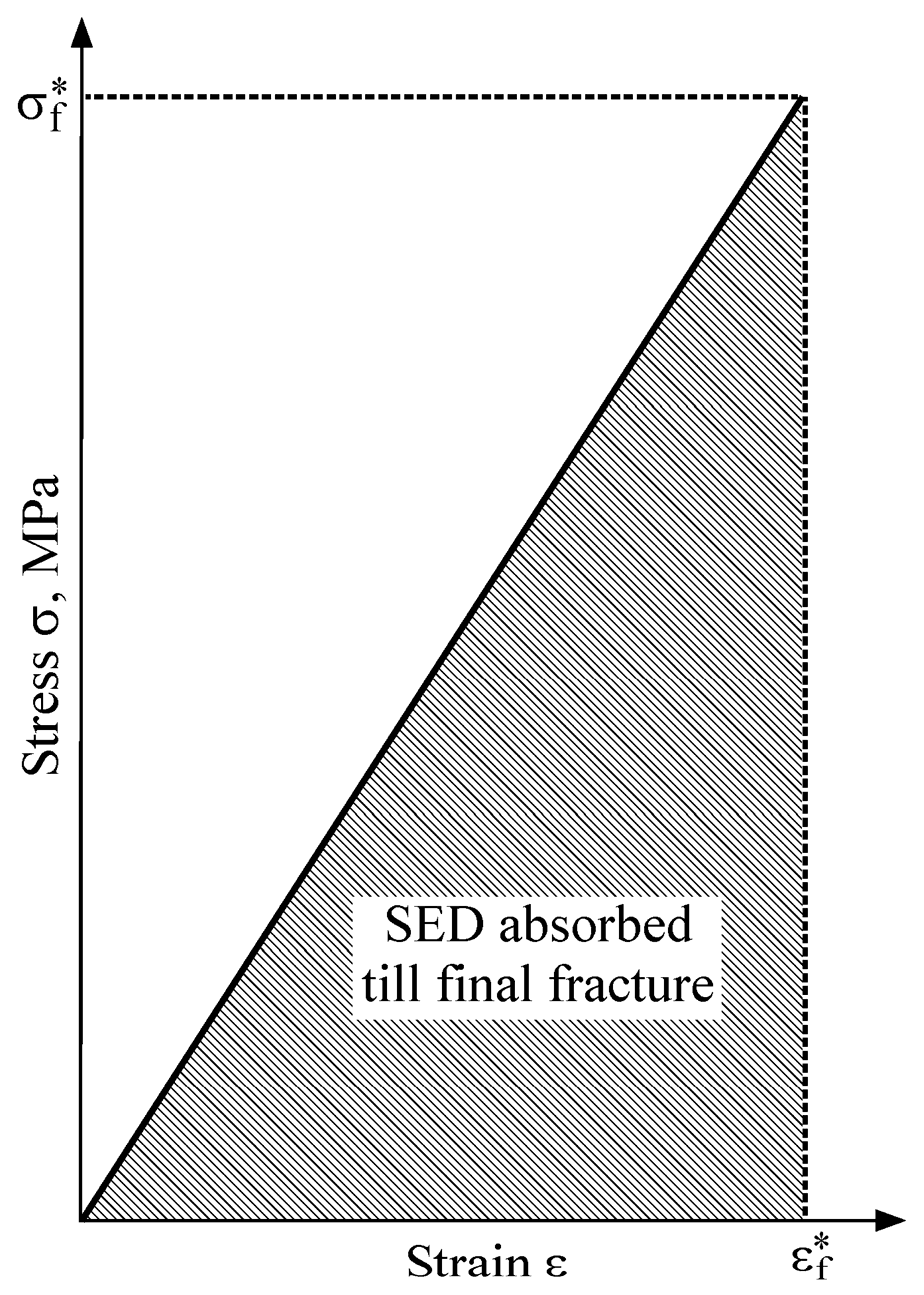
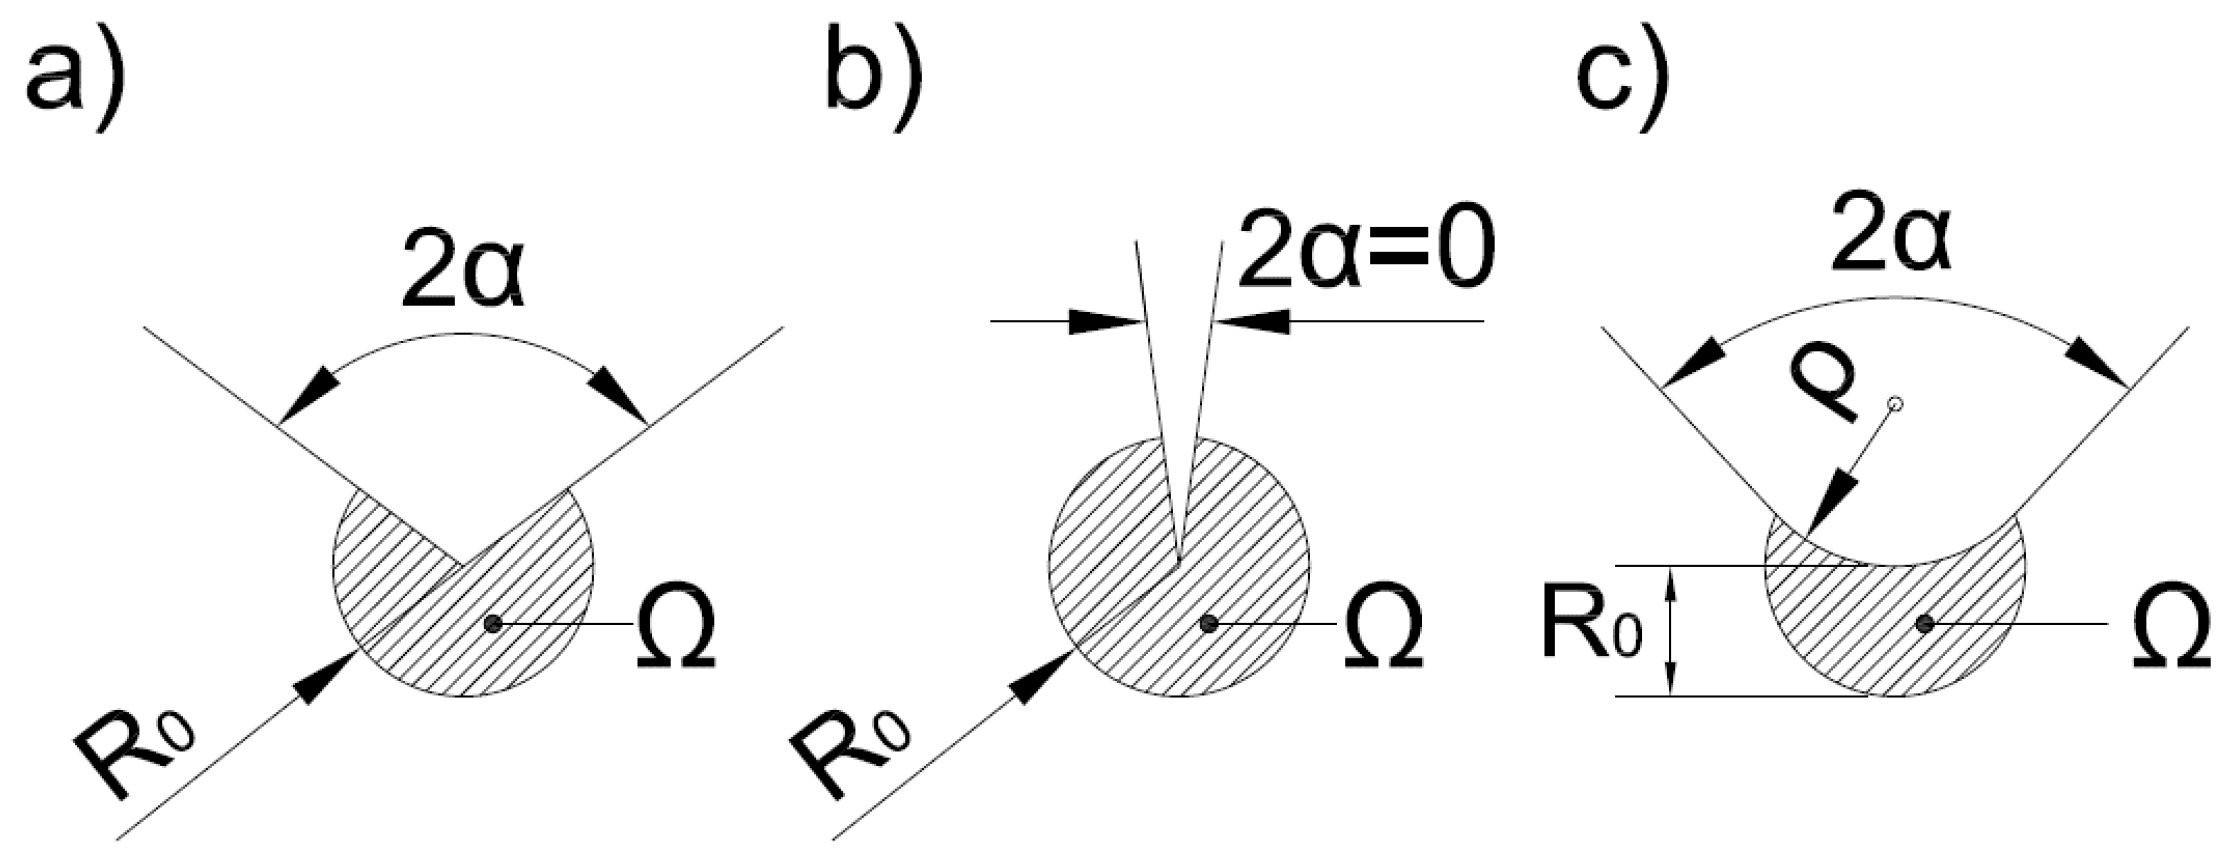
2.2. Strain Energy Density Criteron

The origins of the Strain Energy Density (SED) criterion date back to the seventies, when Sih published its basis [9,10]. The Strain Energy Density criterion establishes that fracture occurs when Equation (7) is satisfied:
W ¯ = W c
where W ¯ is the mean value of the SED within the control volume Ω (with radius R0, see Figure 2) and Wc is the critical SED value. When the behavior of the material is brittle, WC can be obtained by applying Equation (8):
W c = σ u 2 2 E
σu being the ultimate tensile strength of the material and E being the Young’s modulus.
Under plane strain conditions, a relationship has been provided for R0 by considering the crack case, according to Equation (9) (see Figure 2):
R 0 = ( 1 + υ ) ( 5 8 υ ) 4 π ( K c σ u ) 2
When plane stress conditions are dominant, the equation defining R0 is (10) [16]:
R 0 = ( 5 3 υ ) 4 π ( K c σ u ) 2
Plane strain conditions are dominant as long as the fracture resistance is lower than the value defined by Equation (11) [36]:
K c = σ y ( B 2.5 ) 1 / 2
while plane stress conditions are achieved when the fracture resistance is higher than the value defined by Equation (12) [36]:
K c = σ y ( π B ) 1 / 2
σy represents the material yield strength, υ is the material Poisson’s ratio, and B is the specimen thickness. Those situations between the plane strain and the plane stress conditions require an interpolation of Equations (9) and (10) to define R0.
For blunt V-notches, the mean value of the SED within the control volume can be obtained through Equation (13) [16]:
W ¯ = F ( 2 α ) H ( 2 α , R 0 ρ ) σ m a x 2 E
where F(2α) depends on the opening angle, H(2α, R0/ρ) depends on the opening angle and the ratio between R0 and the notch radius, and σmax is the maximum elastic stress at the notch tip. Table 1 and Table 2, respectively, show the value of F and H for different notch geometries.

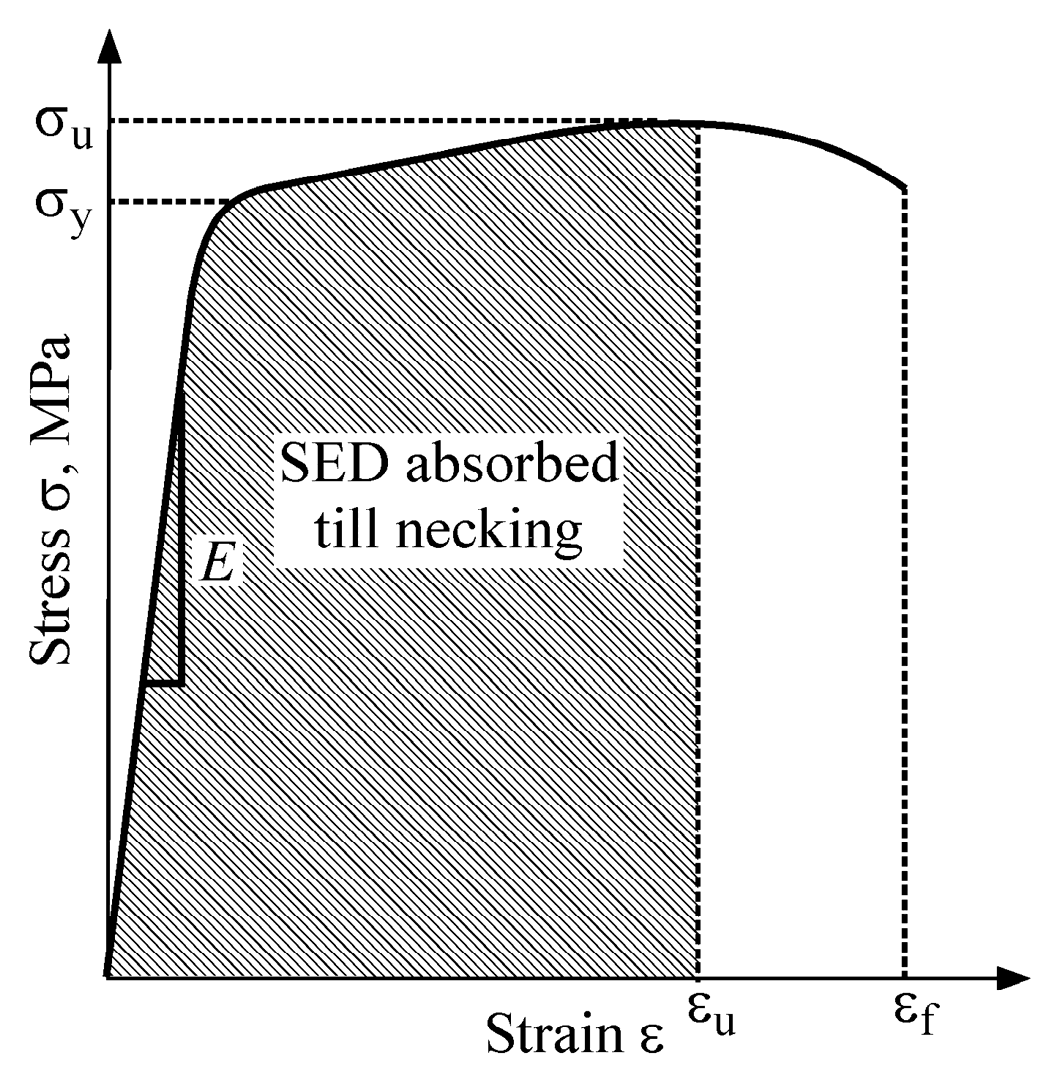
2.3. Equivalent Material Concept

In 2012, Torabi [30] proposed, for the first time, the Equivalent Material Concept (EMC) in order to equate a real ductile material exhibiting elastic-plastic behavior with a virtual brittle material showing perfectly elastic behavior. He assumed the well-known power-law equation for the tensile stress-strain relationship in the plastic region (see Equation (14), in which the parameters σ, εp, K, and n are the true stress, the true plastic strain, the strain-hardening coefficient, and the strain-hardening exponent, respectively, and computed the total strain energy density (SED) for the real ductile material up to the peak point (i.e., the ultimate point). Then, it was assumed that the virtual brittle material absorbs the same amount of tensile SED for brittle fracture to take place. From this basic assumption, the tensile strength of the equivalent material was finally computed as a closed-form expression.
σ = K ε p n
A typical engineering stress-strain curve for a ductile material is represented in Figure 3 in which the area under the curve is the Strain Energy Density (SED). The total SED consists of the elastic and plastic components as follows:
( S E D ) t o t = ( S E D ) e + ( S E D ) P = 1 2 σ y ε y + ε P y ε p σ d ε p
where σy, εy, and ε P y are the yield strength, the elastic strain at yield point, and the true plastic strain at yield point, respectively. Considering Hooke’s Law (σy = Eεy) and substituting Equation (14) into Equation (15) gives:
( S E D ) t o t = σ y 2 2 E + ε P y ε p K ε P n d ε p = σ y 2 2 E + K n + 1 [ ( ε p ) n + 1 ( ε P y ) n + 1 ]
The true plastic strain at yield point ( ε P y ) is simply considered to be equal to 0.002 (i.e., 0.2% offset) and hence:
( S E D ) t o t = σ y 2 2 E + K n + 1 [ ( ε p ) n + 1 ( 0.002 ) n + 1 ]
The crack initiation in the ductile material (i.e., the necking instance) will occur just when the ultimate load is reached. Thus, the total SED (Equation (17)) should be computed until this point. In other words, the plastic strain εp in Equation (17) is replaced with the true plastic strain at maximum load εu,True as follows:
( S E D ) n e c k i n g = σ y 2 2 E + K n + 1 [ ( ε u , T r u e ) n + 1 ( 0.002 ) n + 1 ]
Figure 4 depicts a typical stress-strain curve for the virtual brittle material with a perfectly linear elastic behavior. It can be simply obtained from this figure that the total strain energy absorbed until fracture is σff*/2, where σf* and εf* are the tensile strength and the strain at fracture for the virtual brittle material, respectively. Since the basic assumption of EMC is that both the real ductile and virtual brittle materials have the same Young’s modulus (E) and K-based fracture toughness (Kc), the SED for the equivalent material until fracture can be written as:
( S E D ) E M = σ f * 2 2 E
As mentioned above, the SED values for the real ductile and virtual brittle materials are the same in accordance with EMC. Hence, setting Equations (18) and (19) to be equal results in:
σ f * 2 2 E = σ y 2 2 E + K n + 1 [ ( ε u , T r u e ) n + 1 ( 0.002 ) n + 1 ]
Eventually, the following closed-form expression is proposed by EMC for calculating the σf*:
σ f * = σ y 2 + 2 E K n + 1 [ ( ε u , T r u e ) n + 1 ( 0.002 ) n + 1 ]
where εu,True (the true plastic strain at peak point) can be computed from the εu (engineering plastic strain at peak point) by the following expression: εu,True = ln(1 + εu).
The σf* computed from Equation (21) together with a valid fracture toughness can be conveniently utilized in various brittle fracture criteria (e.g., TCD or SED criterion) for theoretically predicting the crack initiation in ductile components weakened by a notch.

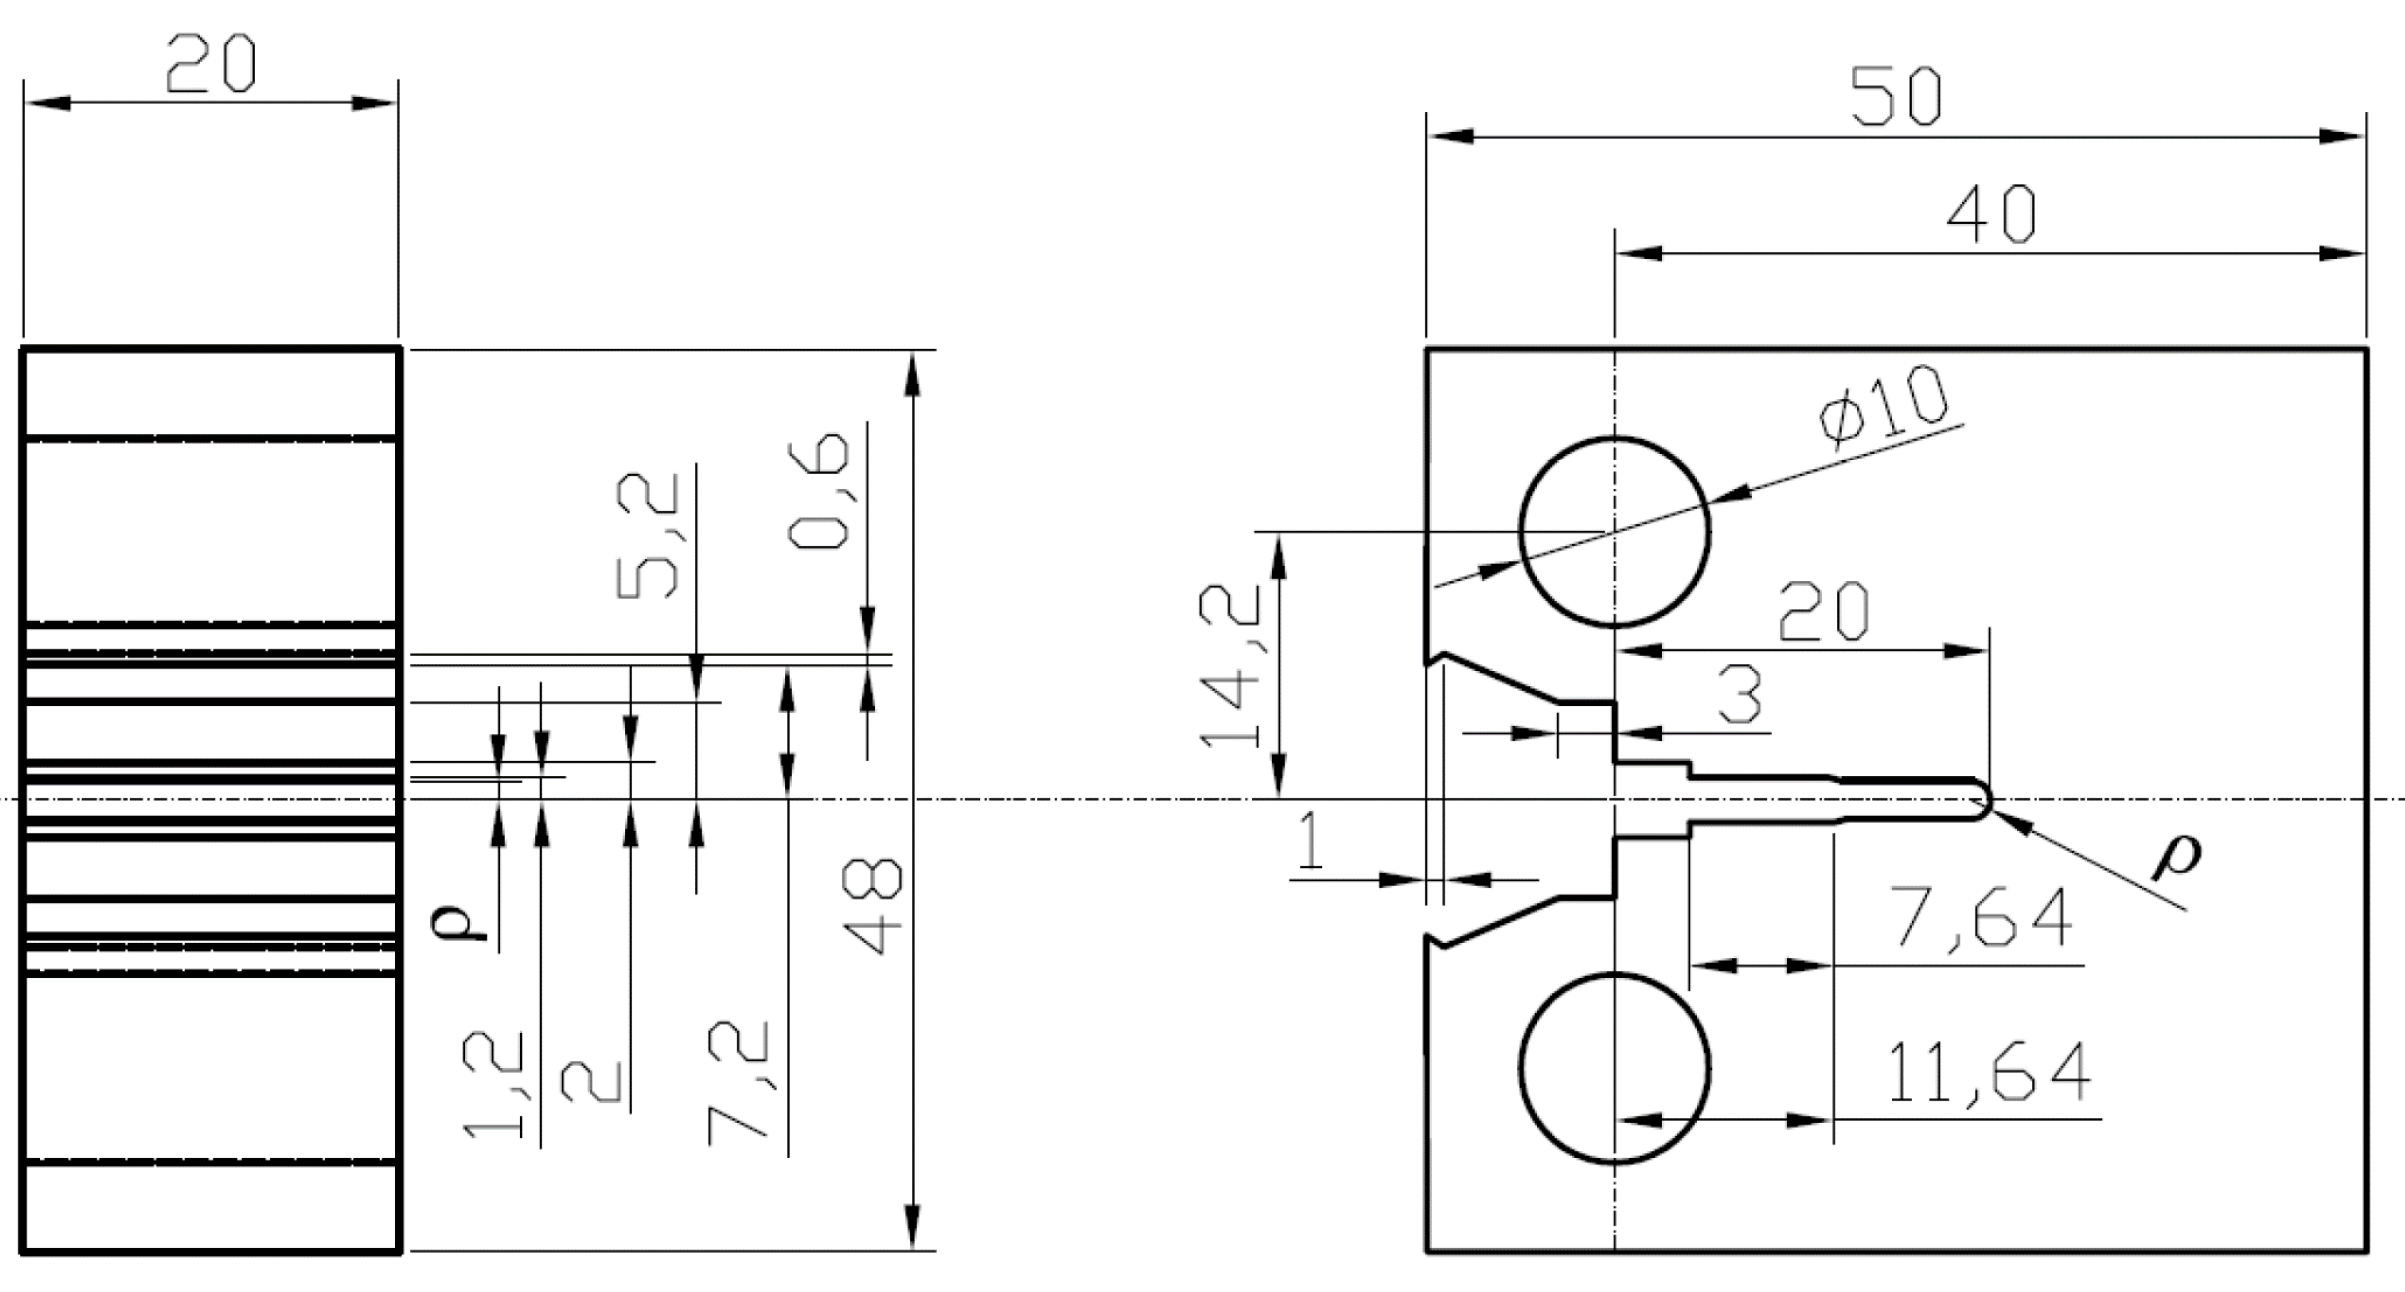
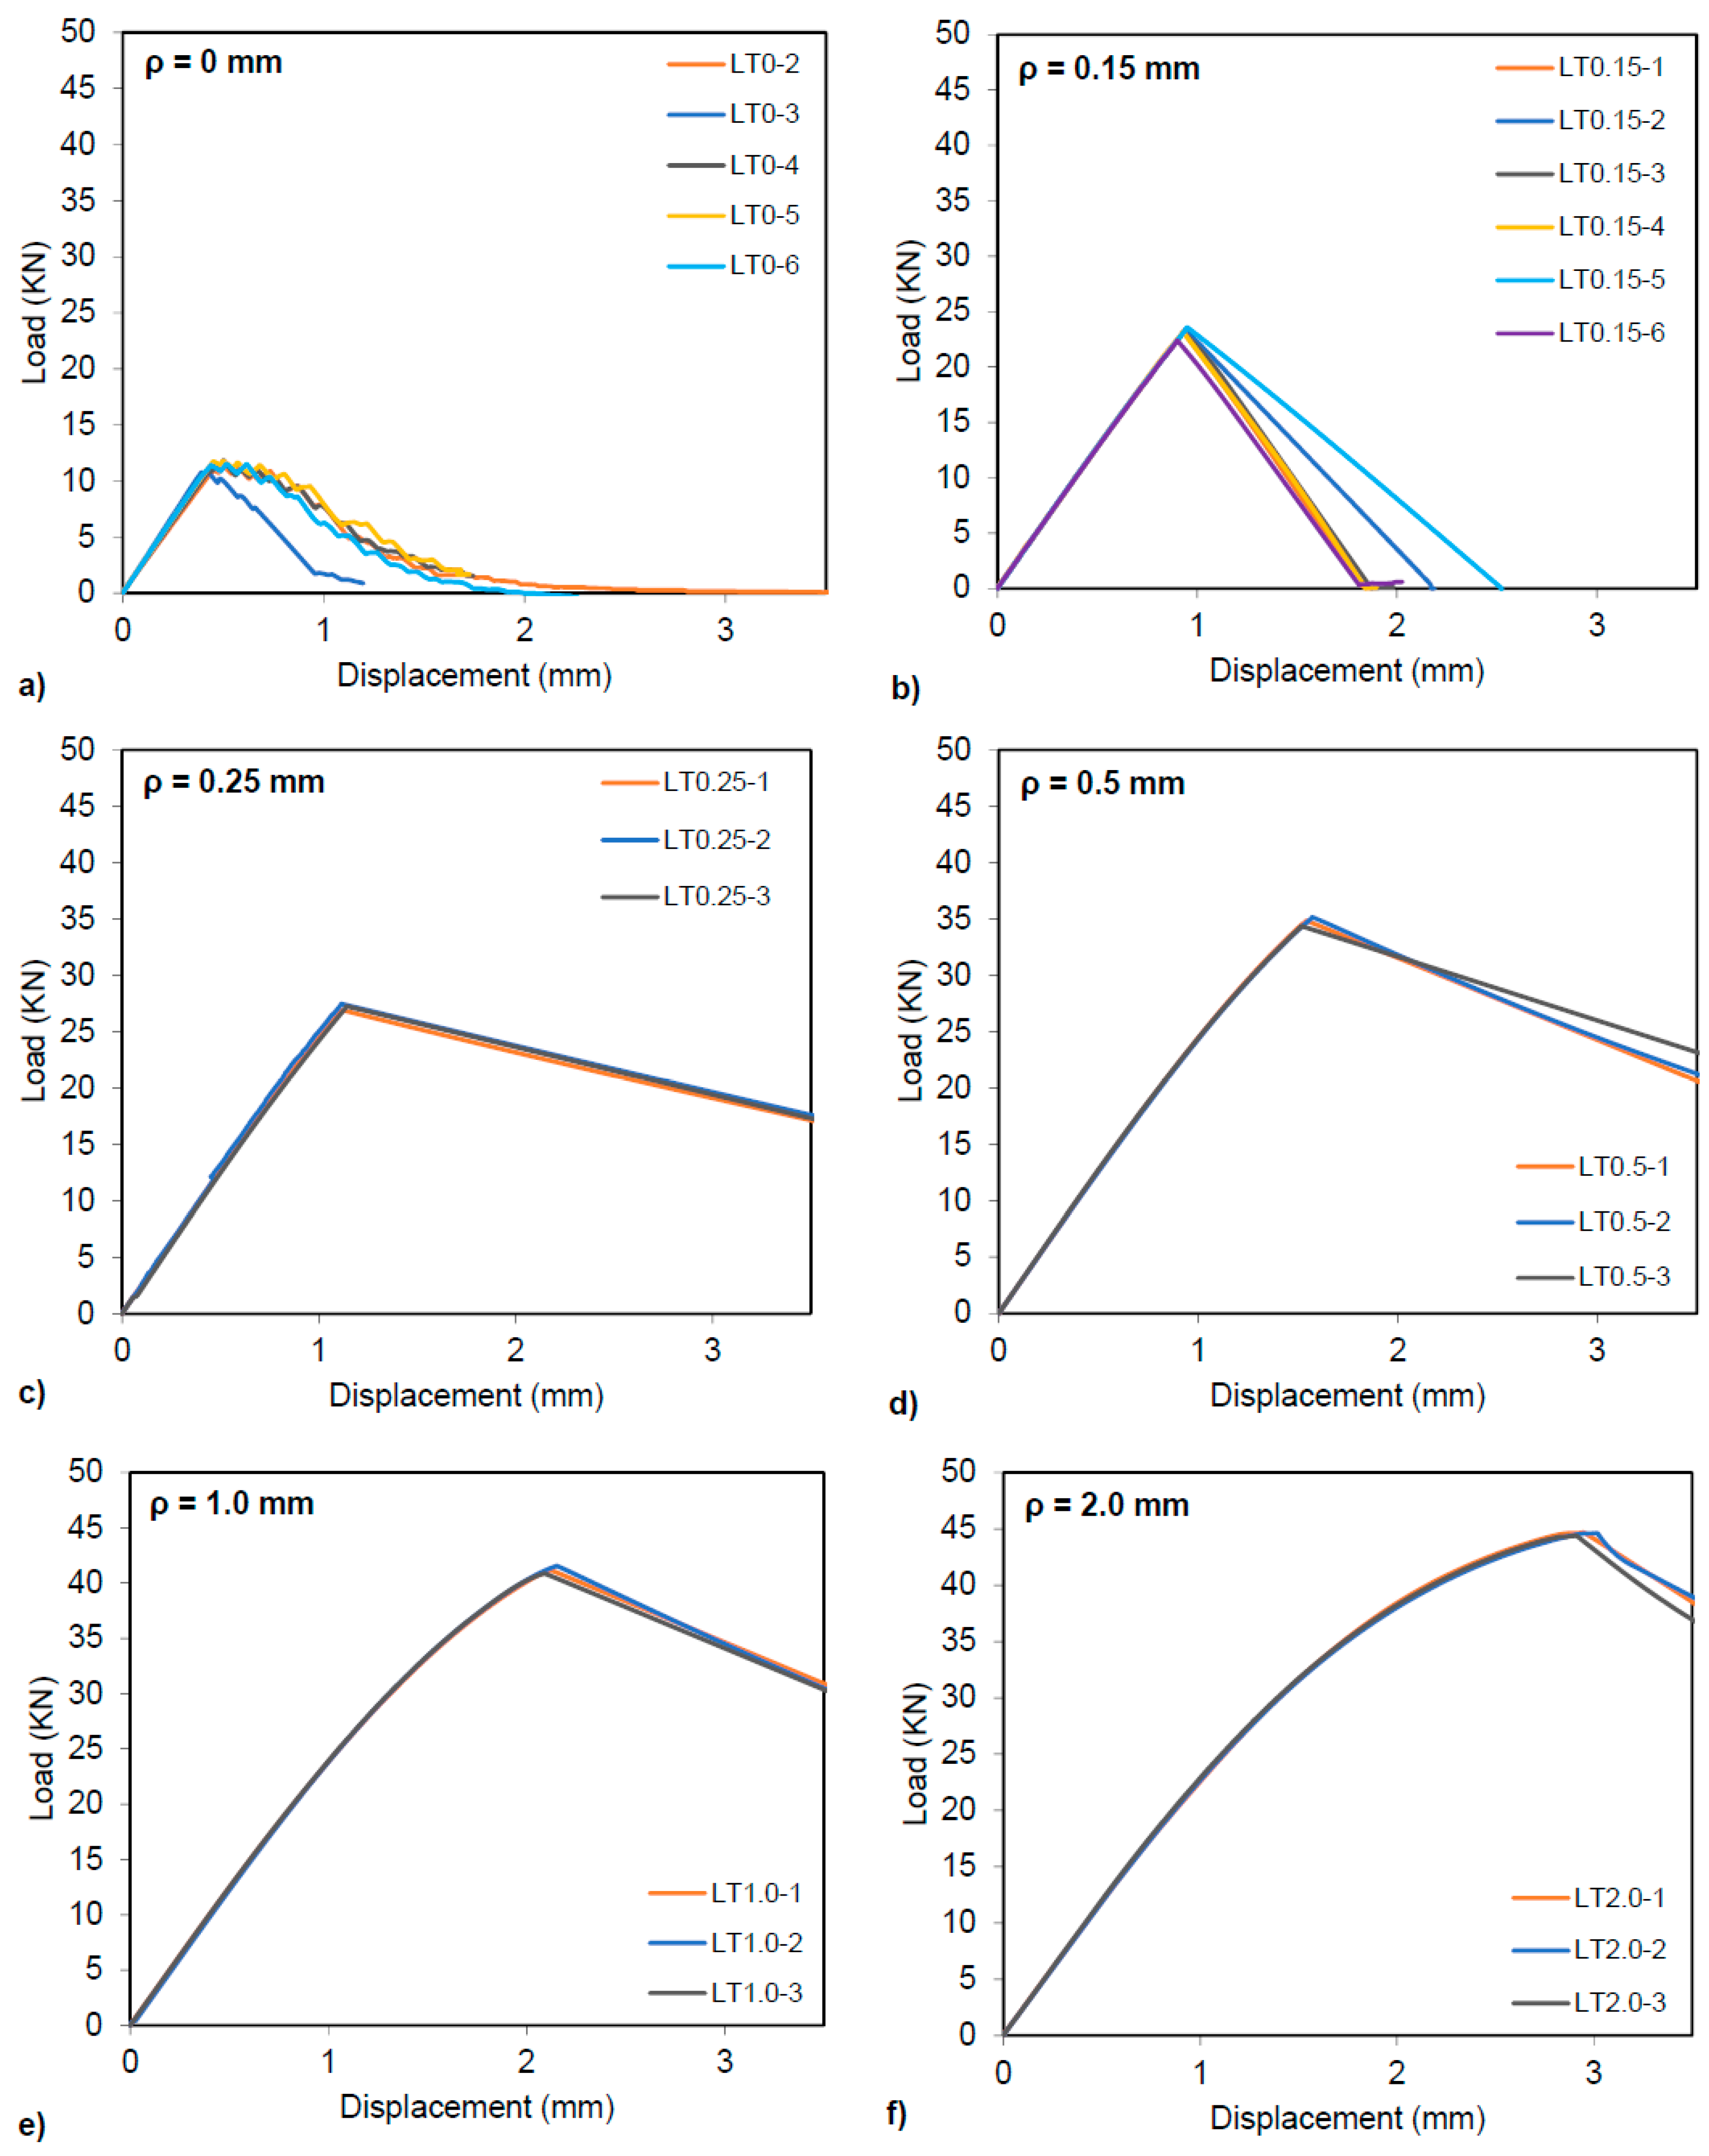
3. Materials and Methods

The analyzed material is aluminum alloy Al7075-T651. The material has been obtained from a 2000 mm × 1000 mm × 20 mm rolled plate [3] and its chemical composition is shown in Table 3 [3].
In order to define the mechanical properties of the material, four tensile tests were performed, two for each orientation (longitudinal and transversal) [3]. The mechanical properties of the material are gathered in Table 4 [3].
σy being the yield stress, σu the ultimate tensile strength and emax being the strain under maximum load.
Fracture tests were performed on 48 compact tension (CT) specimens, whose geometry is shown in Figure 5. 24 of the tests were performed with LT specimens, which means that the load was applied in the rolling (Longitudinal) direction and the crack propagates perpendicularly (Transversally) to the rolling direction. However, the remaining 24 tests were carried out with TL specimens (the load was applied Transversally to the rolling direction and the crack propagates along the rolling direction-Longitudinally). In this case, the load was applied transversally to the rolling direction and the propagation of the crack occurred in the rolling direction. Figure 6 shows the experimental load-displacement curves for TL specimens and Figure 7 shows the experimental load-displacement curves for LT specimens [3].
For both types of specimens (TL and LT), six sets of tests were carried out, corresponding to different notch radii (from 0 to 2 mm). The 0 and 0.15 mm sets were composed of six specimens each, and the rest of the sets, 0.21, 0.47, 1 and 2 mm, were composed of three specimens each. In the case of 0 mm radius for LT specimens, one of the tests was not valid.
The experimental fracture loads for Aluminum alloy Al7075-T651 compact tension specimens are shown in Table 5.
The results obtained in cracked specimens (ρ = 0) were used to derive the corresponding Kc values, providing 26.65 MPa·m1/2 for TL orientation and 27.01 MPa·m1/2 for LT orientation.

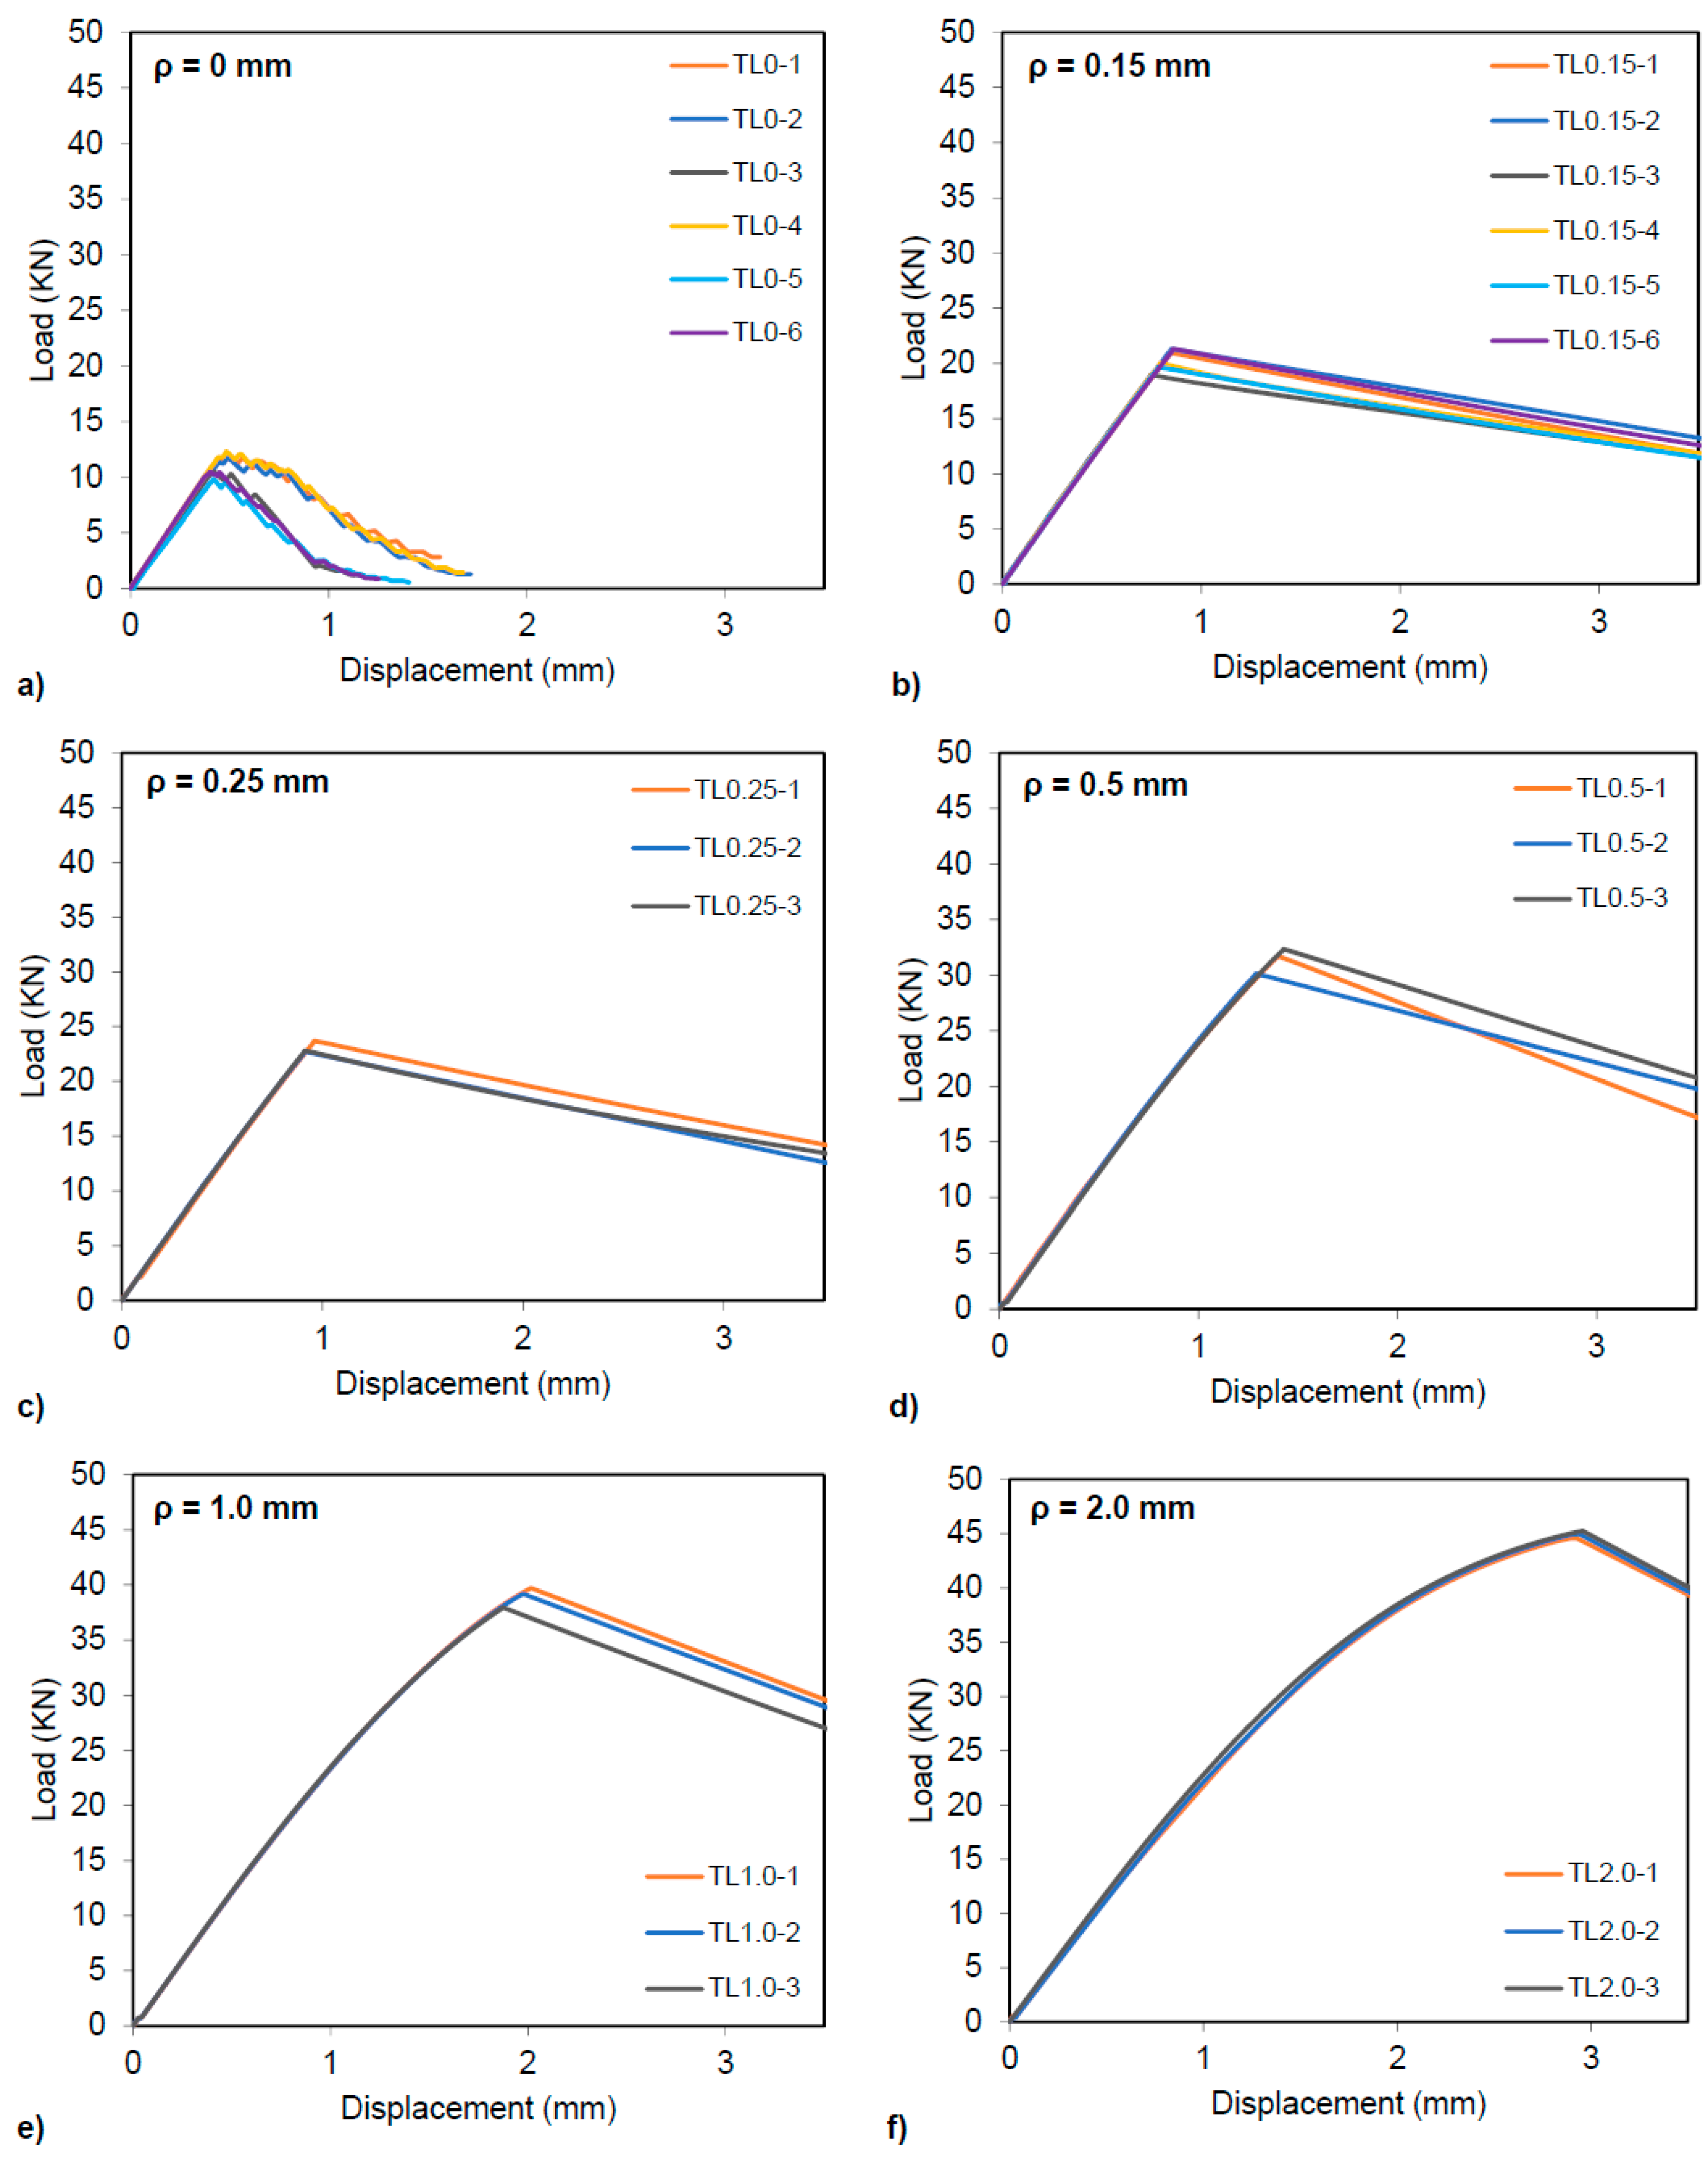
4. Results and Discussion

The fracture loads have been predicted by applying the different aforementioned methods in order to compare the results obtained and to analyze the differences between them.

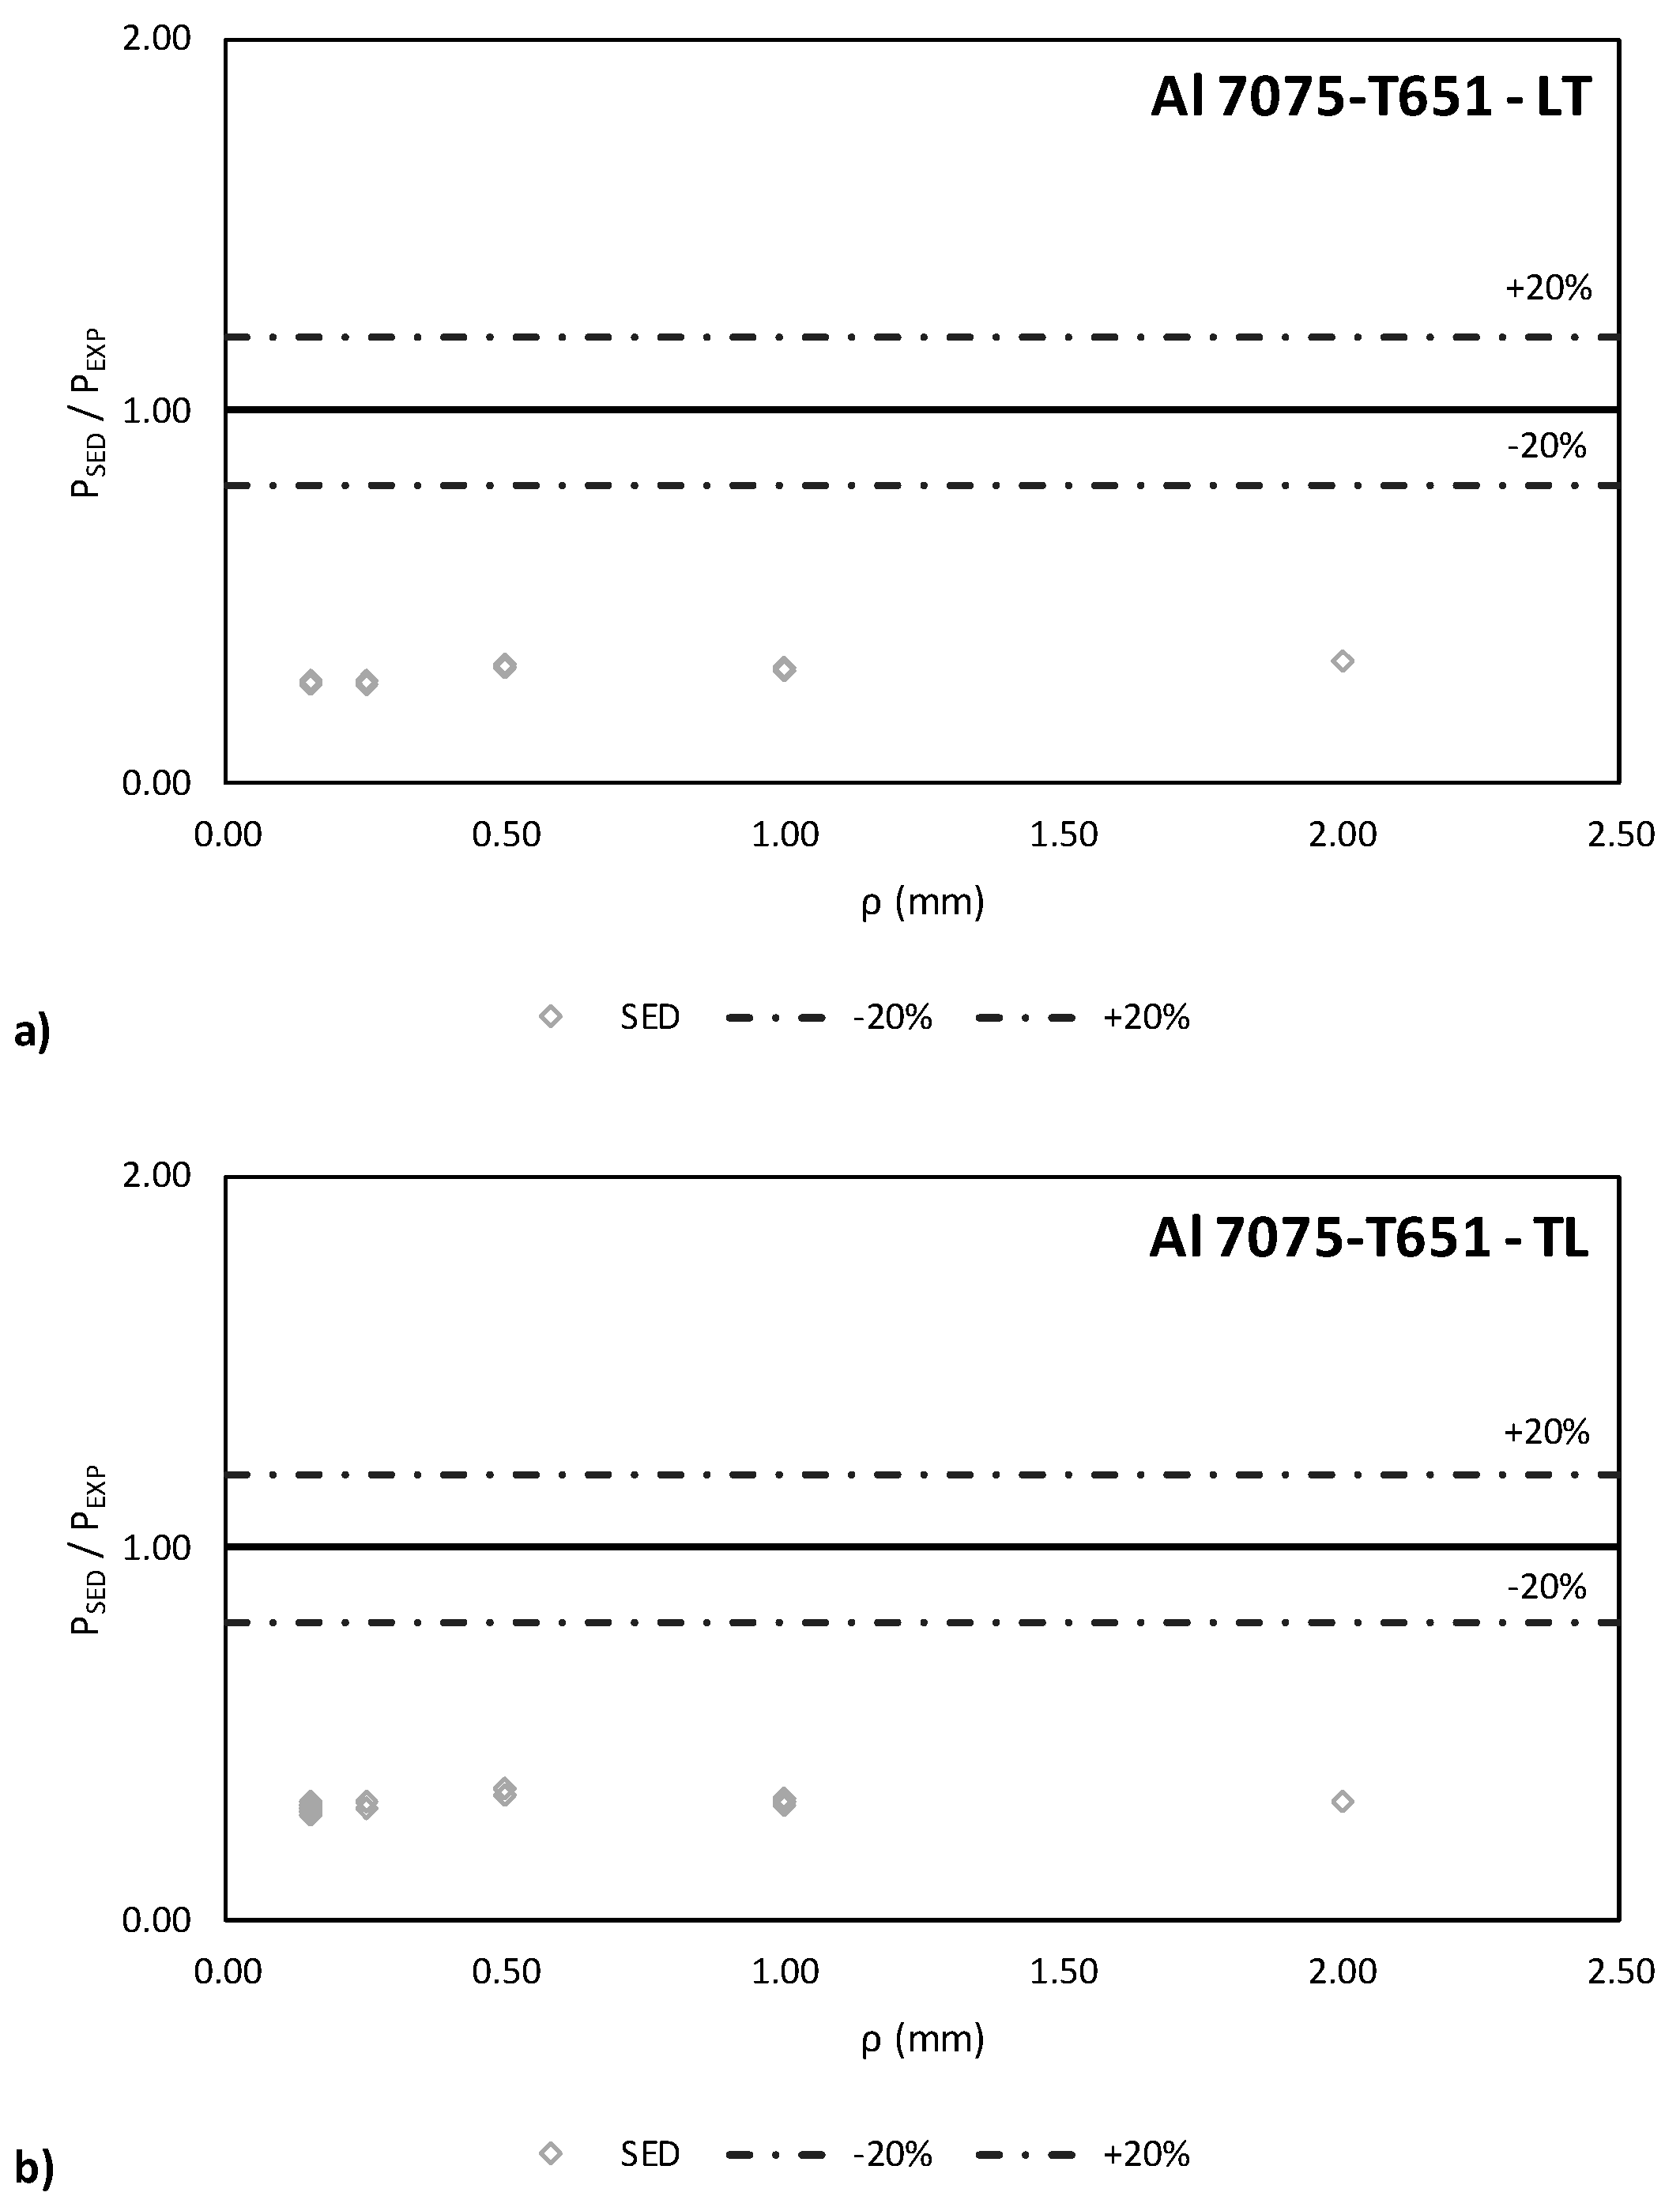
4.1. SED Fracture Load Predictions

When the material being analyzed exhibits a perfect linear elastic behavior, the critical value Wc can be obtained by considering Equation (8). Establishing the fracture condition established by Equation (7):
F ( 2 α ) H ( 2 α , R 0 ρ ) σ m a x 2 E = σ u 2 2 E
where the value of F(2α = 0°) is equal to 0.785 as shown in Table 1 and H depends on υ and the ratio between R0 (Equation (9) for plane strain conditions, Equation (10) for plane stress conditions, or an interpolation value in an intermediate case) and the notch radius. Values of H(2α = 0°) are summarized in Table 2. The values of the ultimate tensile strength (σu) and Young’s modulus (E) for Al-7075 T-651 are summarized in Table 4.
Considering that the value of σmax is reached at r = 0 and applying the stress distribution at the notch tip (Equation (4)) for U-shaped notches proposed by Creager-Paris [35], the stress intensity factor (KI) can be obtained by applying Equation (23). Finally, the fracture load can be predicted by substituting the rest of the values in the analytical solution of the stress intensity factor for CT specimens (Equation (24)):
σ ( r = 0 ) = σ m a x = 2 K I π ρ
K I = P S E D B W ( 2 + a W ) ( 1 a W   ) 3 / 2 ( 0.886 + 4.64 ( a W ) 13.32 ( a W ) 2 + 14.72 ( a W ) 3 5.60 ( a W ) 4 )
In Table 6 and Figure 8, the fracture load estimations obtained using the SED criterion are shown.
It can be observed that the fracture load predictions are well below the actual experimental fracture loads, with the SED criterion providing a clear over-conservatism. These poor results may be related with the use of the linear elastic region of the tensile test, and the fact that a large part of the stress-strain curve is not considered. Therefore, the estimations of the critical values of the strain energy density are not representative values for a material that exhibits large plastic deformations before failure.

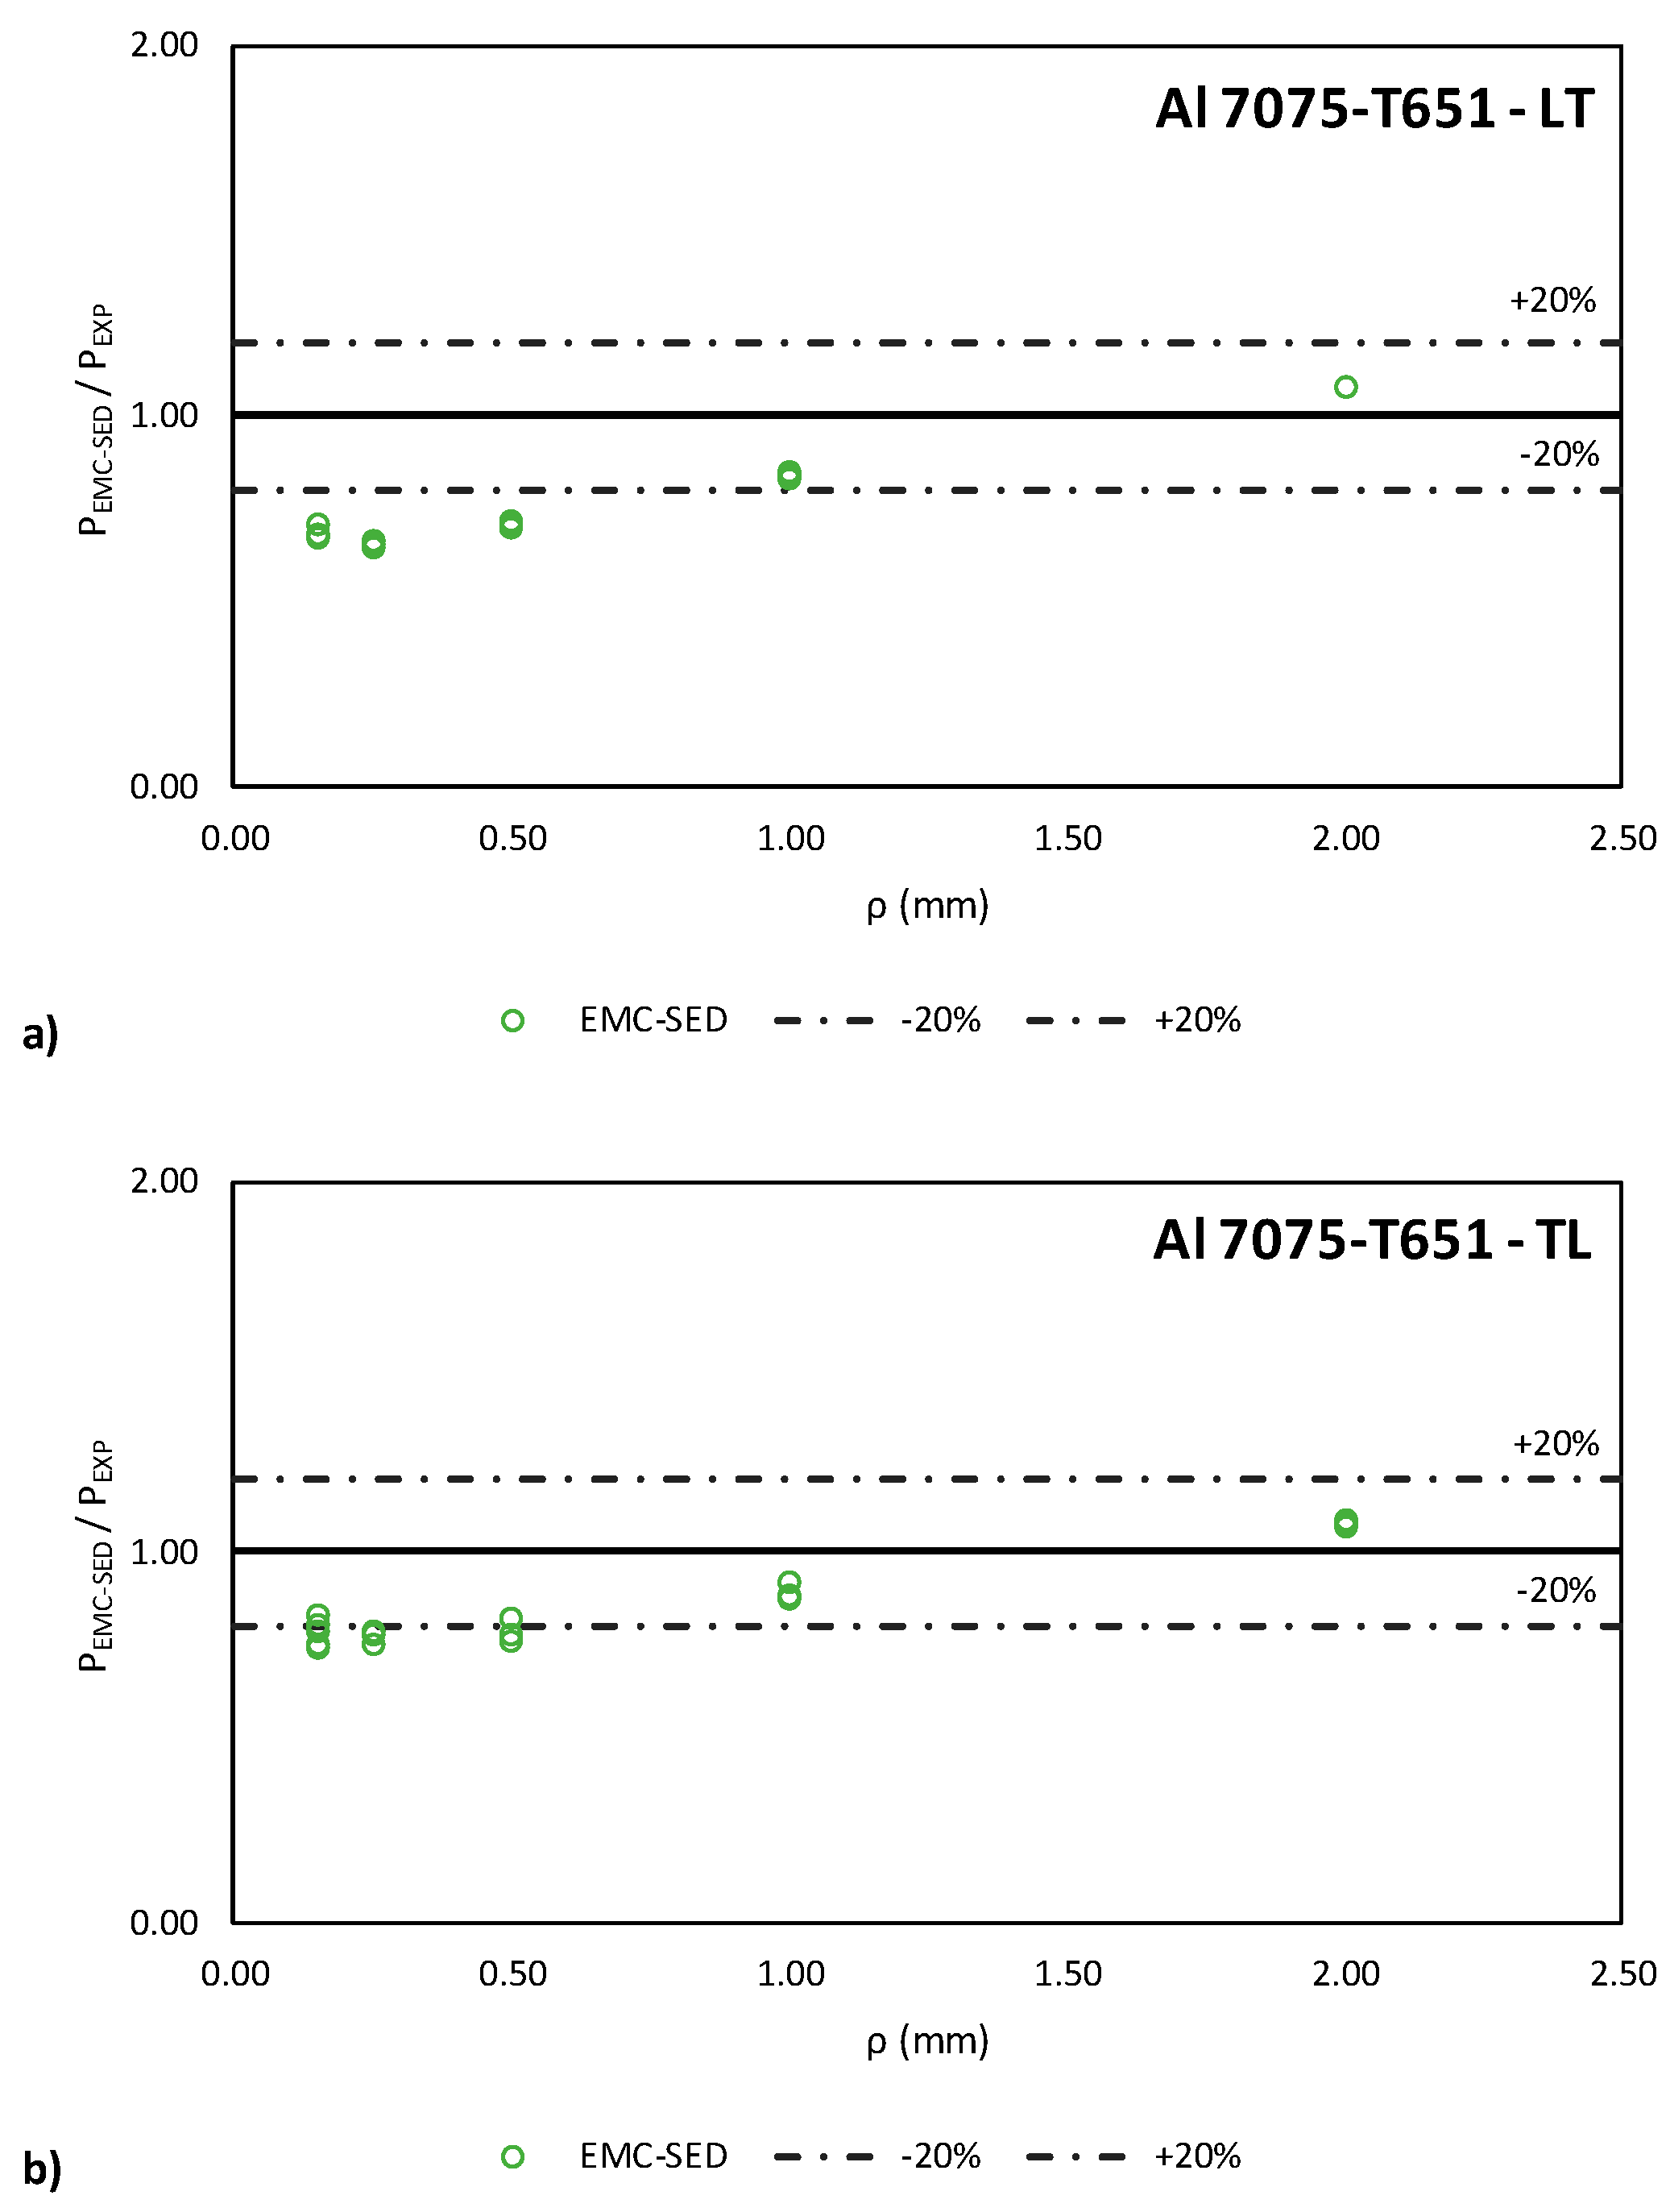
4.2. Equivalent Material Concept-Strain Energy Density (EMC-SED) Fracture Load Predictions

Due to the poor agreement between the predictions and the fracture loads obtained using the linear elastic formulation of the SED criterion, it is necessary to define a new way to evaluate materials with nonlinear elastic behavior. For this reason, this section shows the predictions provided by the combination of the SED criterion and the EMC.
The values of the EMC parameters are shown in Table 7.
Once the values of the EMC parameters are obtained, since the equivalent material has a perfect linear elastic behavior, the value of the critical strain energy density Wc can be calculated by changing the value of σu for the value of σf* in Equation (22), therefore:
F ( 2 α ) H ( 2 α , R 0 ρ ) σ m a x 2 E = σ f * 2 2 E
where the value of F(2α = 0°) is equal to 0.785 as can be seen in Table 1 and H may be derived from Table 2.
Considering the stress distribution at the notch tip proposed by Creager-Paris (Equation (4)) [35], assuming that the value of σf* is reached at r = 0, and applying the analytical solution of the stress intensity factor for CT specimens (Equation (24)), the fracture loads can be obtained using the SED criterion combined with the EMC, as can be seen in Table 8 and Figure 9.
It can be observed how the consideration of the EMC significantly improves the predictions, with most of the results within ±20% accuracy. The predictions are conservative for most of the radii, and are slightly larger than the actual loads for the 2.0 mm radius.

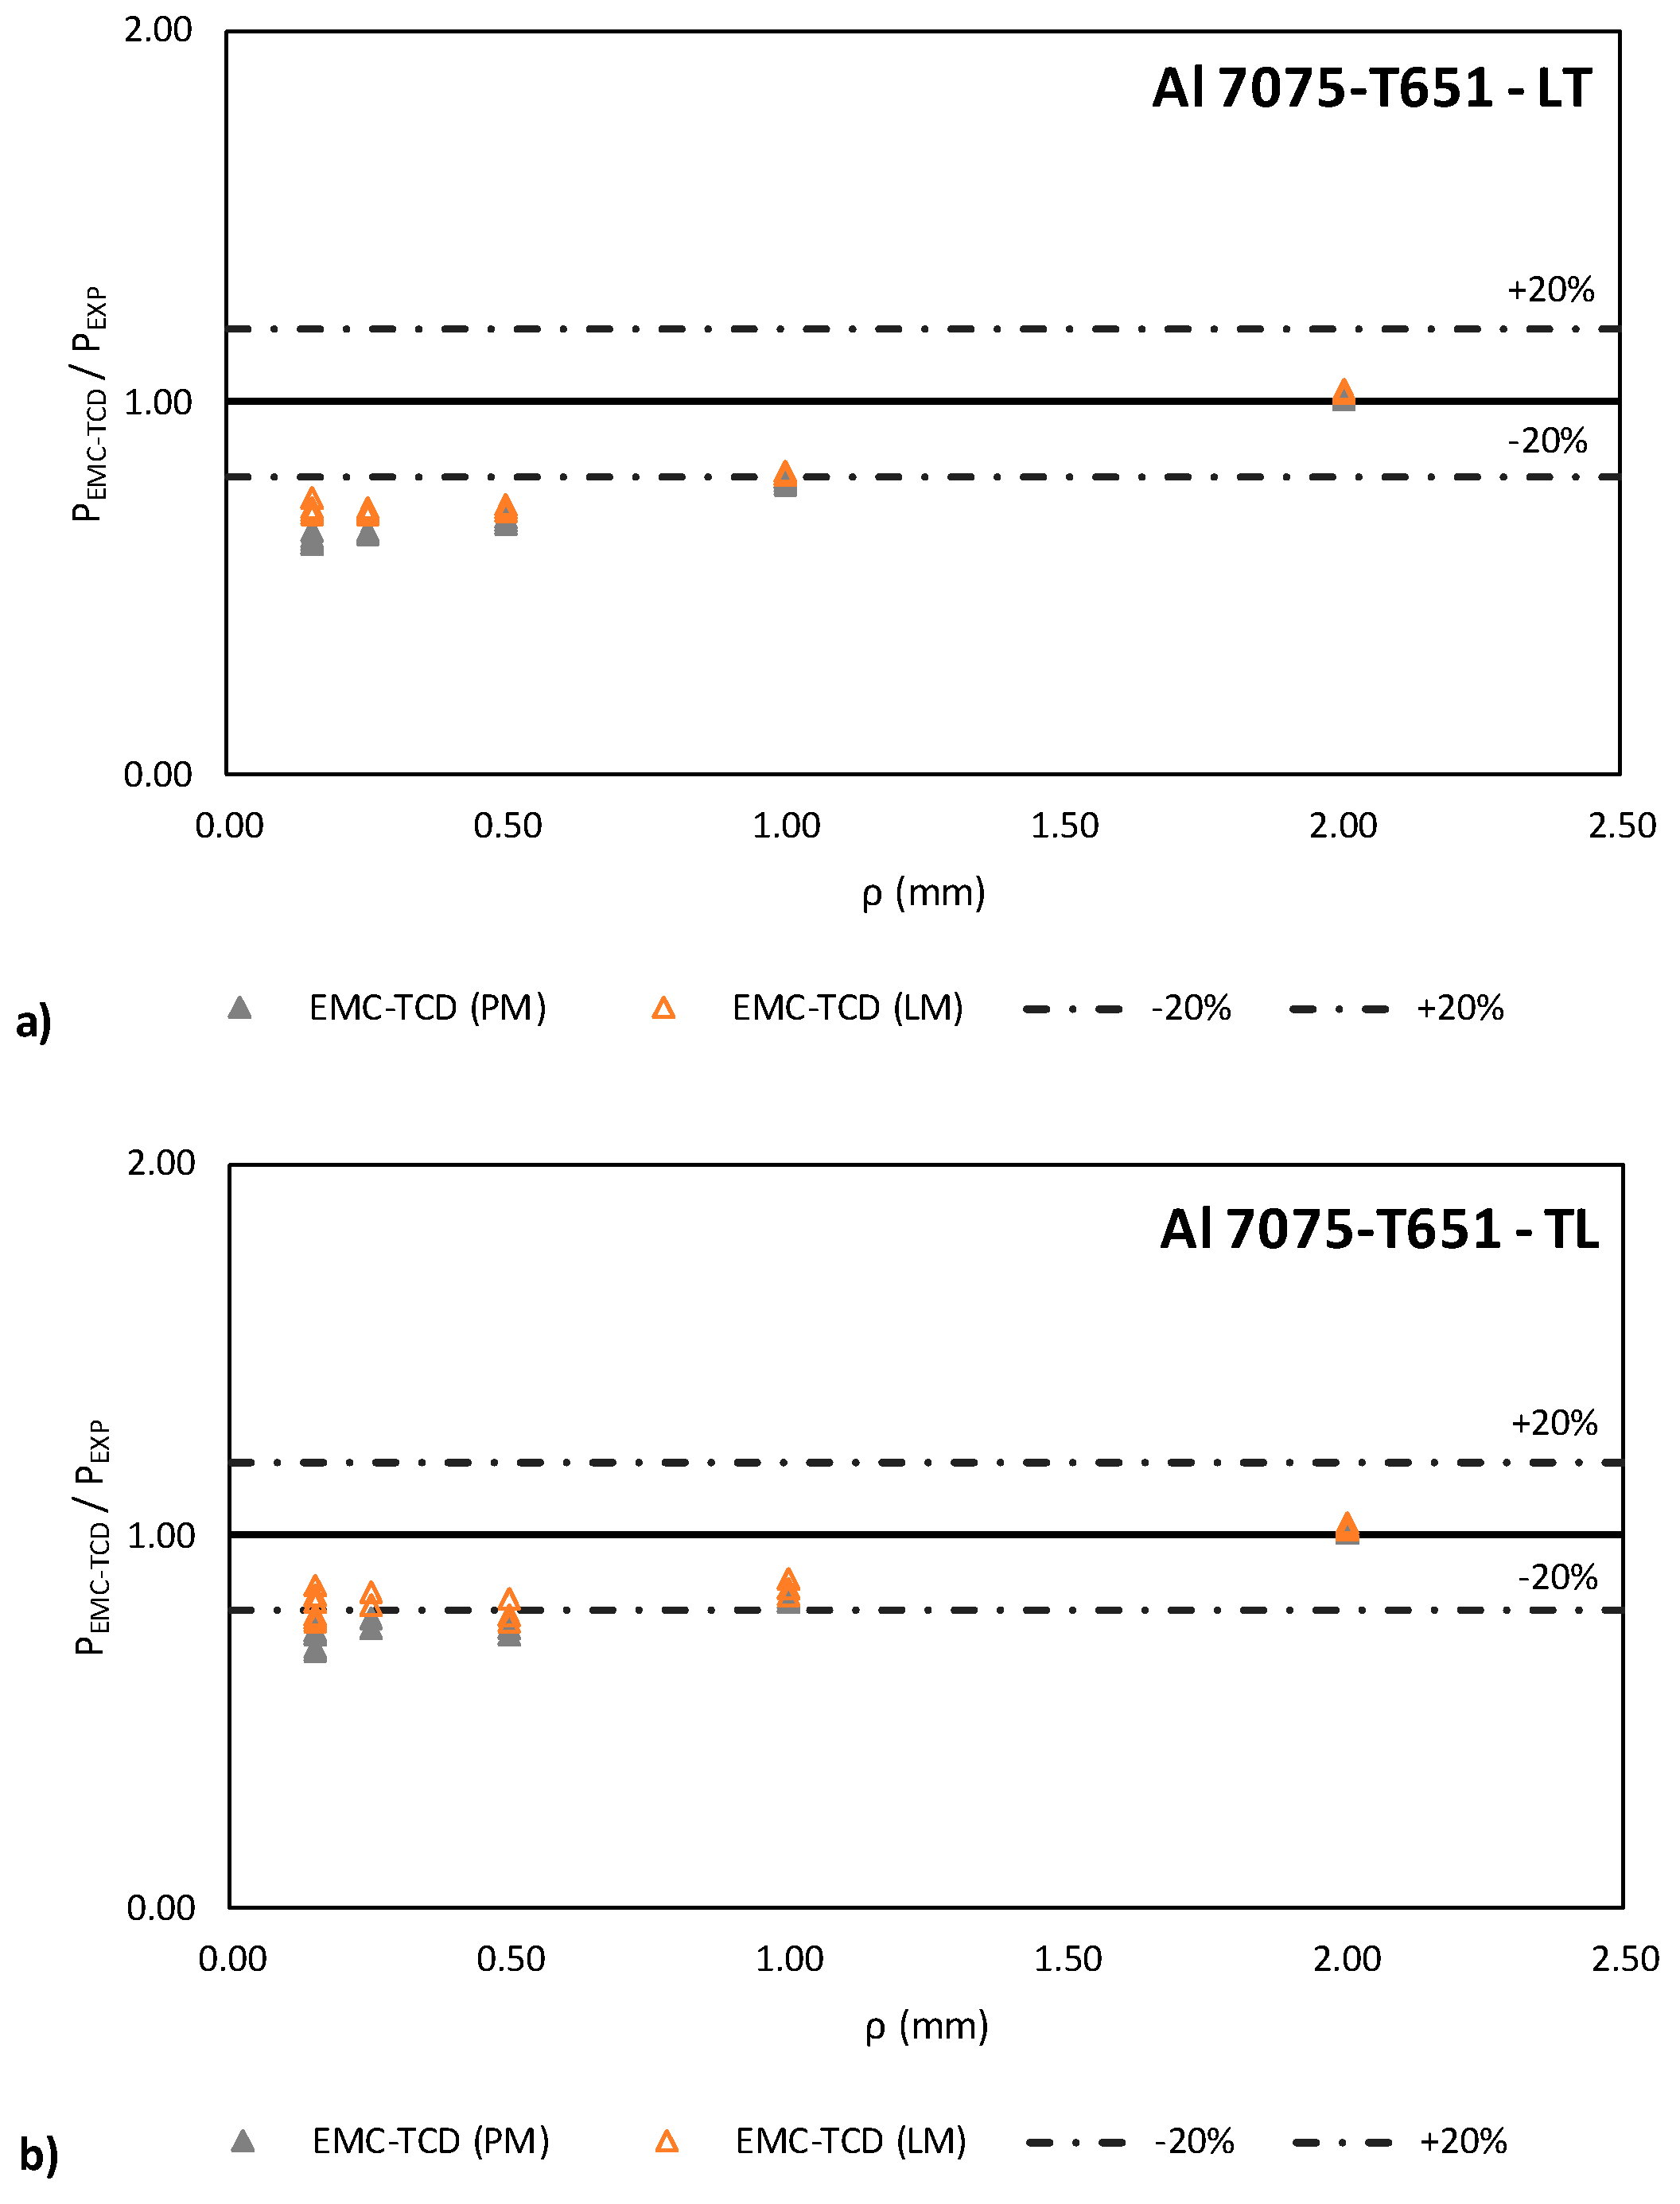
4.3. Theory of Critical Distances-Strain Energy Density (TCD-SED) Fracture Load Predictions

Before considering the TCD with the EMC, it is important to notice that the direct application of the TCD (without any previous calibration and assuming σ0 = σu) provides poor results (similar to those provided by the SED criterion). For the sake of simplicity, these results are not presented here. The analysis of these specimens using the TCD with a calibration process may be found in [3].
In order to combine the Equivalent Material Concept with the Theory of Critical Distances, the parameters of the EMC, shown in Table 7, are used to apply the linear elastic formulation of the TCD.
Firstly, by assuming the linear elastic behavior of the virtual brittle material, the critical distance can be obtained by applying Equation (1), considering the value of σ0 equal to σf*. The value of L* obtained is 0.0366 mm for TL specimens and 0.0304 mm for LT specimens. The real value of L for TL specimens is 0.015 mm, while for LT specimens it is 0.0215 mm, as can be seen in [3].
Once the value of the critical distance is obtained and assuming Creager-Paris [35] stress distribution, the application of the TCD is straightforward.
When the PM is used to predict the fracture load, the fracture condition is:
σ ( L / 2 ) = K I π 2 ( L / 2 + ρ ) ( L + ρ ) 3 / 2 = σ f *
Considering the analytical solution of the stress intensity factor for the CT specimens, predictions of the fracture load (PEMC-PM) can be obtained through Equation (27):
K I = P E M C - P M B W ( 2 + a W ) ( 1 a W   ) 3 / 2 ( 0.886 + 4.64 ( a W ) 13.32 ( a W ) 2 + 14.72 ( a W ) 3 5.60 ( a W ) 4 )
However, if the LM is used instead of the PM, the average stress (σav) between the notch tip (r = 0) and the point corresponding to a distance equal to 2L has to be calculated (Equation (28)). Once the average stress is calculated, the critical condition (for brittle materials) establishes that σav = σf*.
σ a v = K I 2 L 2 π ( 2 ρ 2 + 2 L ρ ρ 2 + 2 L ) = σ f *
By obtaining the value of KI from Equation (28) and using the analytical expression for the stress intensity factor of CT specimens, the value of the fracture load (PEMC-LM) predicted can be predicted by the following equation:
K I = P E M C - L M B W ( 2 + a W ) ( 1 a W   ) 3 / 2 ( 0.886 + 4.64 ( a W ) 13.32 ( a W ) 2 + 14.72 ( a W ) 3 5.60 ( a W ) 4 )
In Table 9 and Figure 10, the predicted results of the fracture loads obtained are shown. These values have been obtained by using the different methods of the Theory of Critical Distances mentioned above (PM and LM) for both material orientations being analyzed (TL and LT).
The predictive accuracies provided by the EMC-LM combination are slightly higher than those provided by the EMC-PM criterion, and are generally the best ones obtained in this work. The EMC-SED criterion results are generally between the EMC-PM and the EMC-LM results for small radii, and provide the highest accuracy for larger radii.

5. Conclusions

This work makes an additional contribution to the development of the analysis of notched components. The use of the methodologies described here allows safe predictions of the fracture load of notched components to be obtained. In addition, the results are obtained efficiently, since there is no need to perform a large number of tests or complex simulations in order to apply the proposed methodologies.
The main conclusions of the present research can be summarized as follows:
  • The strict formulation of the Strain Energy Density criterion can only be employed to analyze brittle materials that have linear elastic behavior. Its application on materials that exhibit non-linear elastic behavior results in poor predictions, since a significant part of the stress-strain curve has not been taken into account.
  • The combination of the Strain Energy Density criterion with the Equivalent Material Concept provides accurate results for large notch radii while for small notch radii the degree of approximation of the model is noticeably conservative.
  • When the Theory of Critical Distances is combined with the Equivalent Material Concept to predict fracture loads, good agreement has been found between the predicted values and the experimental fracture loads for large notch radii whereas for small notch radii the fracture loads are, again, conservative.
  • The use of the EMC combined with either of SED or TCD, allows accurate predictions of the fracture loads to be obtained without any previous calibration of the model. Only the material stress-strain curve, which can be easily obtained, is required for the application of these methods.
  • The applicability of the combination of EMC-SED and EMC-TCD in real engineering applications is recommendable since it does not require time-consuming elastoplastic analysis.

Acknowledgments

The authors of this work would like to express their gratitude to the Spanish Ministry of Science and Innovation for the financial support of the Project MAT2014-58443-P: “Análisis del comportamiento en fractura de componentes estructurales con defectos en condiciones debajo confinamiento tensional”, on the results of which this paper is based.

Author Contributions

S.C. and V.M. conceived, designed and performed the experiments; all the authors analyzed the data; F.B., A.R.T. and P.A. contributed analysis tools; J.D.F. and S.C. wrote the paper.

Conflicts of Interest

The authors declare no conflict of interest. The founding sponsors had no role in the design of the study; in the collection, analyses, or interpretation of data; in the writing of the manuscript, and in the decision to publish the results.

References

  1. Cicero, S.; Madrazo, V.; Carrascal, I.A. Analysis of notch effect in PMMA using the Theory of Critical Distances. Eng. Fract. Mech. 2012, 86, 56–72. [Google Scholar] [CrossRef]
  2. Cicero, S.; García, T.; Madrazo, V. On the Line Method apparent fracture toughness evaluations: Experimental overview, validation and some consequences on fracture assessments. Theor. Appl. Fract. Mech. 2015, 78, 15–19. [Google Scholar] [CrossRef]
  3. Madrazo, V.; Cicero, S.; Carrascal, I.A. On the Point Method and the Line Method notch effect predictions in Al7075-T651. Eng. Fract. Mech. 2012, 79, 363–379. [Google Scholar] [CrossRef]
  4. Cicero, S.; Madrazo, V.; Carrascal, I.A. On the Point Method load-bearing capacity predictions in Al7075-T651 structural components containing stress risers. Eng. Fail. Anal. 2012, 26, 129–138. [Google Scholar] [CrossRef]
  5. Ibáñez-Gutiérrez, F.T.; Cicero, S.; Carrascal, I.A.; Procopio, I. Effect of fibre content and notch radius in the fracture behaviour of short glass fibre reinforced polyamide 6: An approach from the Theory of Critical Distances. Compos. Part B Eng. 2016, 94, 299–311. [Google Scholar] [CrossRef]
  6. Cicero, S.; García, T.; Castro, J.; Madrazo, V.; Andrés, D. Analysis of notch effect on the fracture behaviour of granite and limestone; an approach from the Theory of Critical Distances. Eng. Geol. 2014, 177, 1–9. [Google Scholar] [CrossRef]
  7. Cicero, S.; Madrazo, V.; Carrascal, I.A.; Cicero, R. Assessment of notched structural components using Failure Assessment Diagrams and the Theory of Critical Distances. Eng. Fract. Mech. 2011, 78, 2809–2825. [Google Scholar] [CrossRef]
  8. Taylor, D. The Theory of Critical Distances: A New Perspective in Fracture Mechanics; Elseiver: Oxford, UK, 2007. [Google Scholar]
  9. Sih, G.C. Strain-energy-density factor applied to mixed mode crack problems. Int. J. Fract. 1974, 10, 305–321. [Google Scholar] [CrossRef]
  10. Kipp, M.E.; Sih, G.C. The strain energy density failure criterion applied to notched elastic solids. Int. J. Solids Struct. 1975, 11, 153–173. [Google Scholar] [CrossRef]
  11. Gillemot, L.F. Criterion of crack initiation and spreading. Eng. Fract. Mech. 1975, 8, 239–253. [Google Scholar] [CrossRef]
  12. Molski, K.; Glinka, G. A method of elastic-plastic stress and strain calculation at a notch root. Mater. Sci. Eng. 1981, 50, 93–100. [Google Scholar] [CrossRef]
  13. Lazzarin, P.; Campagnolo, A.; Berto, F. A comparison among some recent energy-and stress-based criteria for the fracture assessment of sharp V-notched components under Mode I loading. Theor. Appl. Fract. Mech. 2014, 71, 21–30. [Google Scholar] [CrossRef]
  14. Campagnolo, A.; Berto, F.; Leguillon, D. Fracture assessment of sharp V-notched components under Mode II loading: A comparison among some recent criteria. Theor. Appl. Fract. Mech. 2016, 85, 217–226. [Google Scholar] [CrossRef]
  15. Berto, F.; Lazzarin, P. A review of the volume-based strain energy density approach applied to V-notches and welded structures. Theor. Appl. Fract. Mech. 2009, 52, 183–194. [Google Scholar] [CrossRef]
  16. Berto, F.; Lazzarin, P. Recent developments in brittle and quasi-brittle failure assessment of engineering materials by means of local approaches. Mater. Sci. Eng. R 2014, 75, 1–48. [Google Scholar] [CrossRef]
  17. Lazzarin, P.; Berto, F. Some expressions for the strain energy in a finite volume surrounding the root of blunt V-notches. Int. J. Fract. 2005, 135, 161–185. [Google Scholar] [CrossRef]
  18. Niu, L.S.; Chehimi, C.; Pluvinage, G. Stress field near a large blunted V notch and application of the concept of notch stress intensity factor to the fracture of very brittle materials. Eng. Fract. Mech. 1994, 49, 325–335. [Google Scholar] [CrossRef]
  19. Pluvinage, G. Fatigue and fracture emanating from notch; the use of the notch stress intensity factor. Nucl. Eng. Des. 1998, 185, 173–184. [Google Scholar] [CrossRef]
  20. Dugdale, D.S. Yielding of steel sheets containing slits. J. Mech. Phys. Solids 1960, 8, 100–108. [Google Scholar] [CrossRef]
  21. Barenblatt, G.I. The formation of equilibrium cracks during brittle fracture. General ideas and hypothesis. Axially symmetric cracks. J. Appl. Math. Mech. 1959, 23, 622–636. [Google Scholar] [CrossRef]
  22. Hilleborg, A.; Modeer, M.; Petersson, P.E. Analysis of crack formation and crack growth in concrete by means of fracture mechanics and finite elements. Cem. Concr. Res. 1976, 6, 777–782. [Google Scholar] [CrossRef]
  23. Gómez, F.J.; Elices, M.; Valiente, A. Cracking in PMMA containing U-shaped notches. Fatigue Fract. Eng. Mater. Struct. 2000, 23, 795–803. [Google Scholar] [CrossRef]
  24. Lawn, B. Fracture of Brittle Solids; Cambridge University Press: Cambridge, UK, 1993. [Google Scholar]
  25. Weibull, W. The Phenomenon of Rupture in Solids; Generalstabens litografiska anstalts foÌrlag: Stockholm, Sweden, 1939; Volume 153, 55p. [Google Scholar]
  26. Beremin, F.M.; Pineau, A.; Mudry, F.; Devaux, J.C.; D’Escatha, Y.; Ledermann, P. A local criterion for cleavage fracture of a nuclear pressure vessel steel. Metall. Trans. A 1983, 14, 2277–2287. [Google Scholar] [CrossRef]
  27. Ritchie, R.O.; Knott, J.F.; Rice, J.R. On the relationship between critical tensile stress and fracture toughness in mild steel. J. Mech. Phys. Solids 1973, 21, 395–410. [Google Scholar] [CrossRef]
  28. Torabi, A.R.; Berto, F.; Campagono, A. Elastic-plastic fracture analysis of notched Al 7075-T6 plates by means of the local energy combined with the equivalent material concept. Phys. Mesomech. 2016, 19, 204–214. [Google Scholar] [CrossRef]
  29. Torabi, A.R.; Campagono, A.; Berto, F. A successful combination of the equivalent material concept and the averaged strain energy density criterion for predicting crack initiation from blunt V-notches in ductile aluminium plates under mixed mode loading. Phys. Mesomech. 2016, 19, 382–391. [Google Scholar] [CrossRef]
  30. Torabi, A.R. Estimation of tensile load-bearing capacity of ductile metallic materials weakened by a V-notch: The equivalent material concept. Mater. Sci. Eng. A 2012, 536, 249–255. [Google Scholar] [CrossRef]
  31. Torabi, A.R.; Alaei, M. Mixed-mode ductile failure analysis of V-notched Al 7075-T6 thin sheets. Eng. Fract. Mech. 2015, 150, 70–75. [Google Scholar] [CrossRef]
  32. Torabi, A.R.; Habibi, R.; Mohammad Hosseini, B. On the Ability of the Equivalent Material Concept in Predicting Ductile Failure of U-Notches under Moderate- and Large-Scale Yielding Conditions. Phys. Mesomech. 2015, 18, 337–347. [Google Scholar] [CrossRef]
  33. Neuber, H. Theory of Notch Stresses: Principles for Exact Calculation of Strength with Reference to Structural form and Material; Springer: Berlin, Germany, 1958. [Google Scholar]
  34. Peterson, R.E. Notch sensitivity. In Metal Fatigue; McGraw Hill: New York, NY, USA, 1959; pp. 293–306. [Google Scholar]
  35. Creager, M.; Paris, C. Elastic Field Equations for Blunt Cracks with Reference to Stress Corrosion Cracking. Int. J. Fract. 1967, 3, 247–252. [Google Scholar] [CrossRef]
  36. Knott, J.F. Fundamentals of Fracture Mechanics; Butterworths: London, UK, 1973. [Google Scholar]
Figure 1. Graphical definition of the Pont Method (PM) and the Line Method (LM).
Metals 08 00087 g001
Figure 2. Control volume (area) for sharp V-notch (a); crack (b) and blunt V-notch (c) under mode I loading [16].
Metals 08 00087 g002
Figure 3. Schematic of a typical stress-strain curve for a ductile material. Reproduced with permission from Torabi, A.R.; Berto, F.; Campagono, Phys. Mesomech. Published by Springer, 2016 [28].
Metals 08 00087 g003
Figure 4. Schematic of the stress-strain curve for the equivalent brittle material. Reproduced with permission from Torabi, A.R.; Berto, F.; Campagono, Phys. Mesomech. Published by Springer, 2016 [28].
Metals 08 00087 g004
Figure 5. Geometry of compact tension (CT) specimens [3], dimensions in mm.
Metals 08 00087 g005
Figure 6. Load-Displacement curves for TL specimens with different notch radius. (a) 0 mm, (b) 0.15 mm, (c) 0.25 mm, (d) 0.5 mm, (e) 1 mm, (f) 2 mm [3].
Metals 08 00087 g006
Figure 7. Load-displacement curves for LT specimens with different notch radius. (a) 0 mm, (b) 0.15 mm, (c) 0.25 mm, (d) 0.5 mm, (e) 1 mm, (f) 2 mm [3].
Metals 08 00087 g007
Figure 8. Comparison between fracture load predictions (SED criterion) and experimental fracture loads; (a) TL specimens; (b) LT specimens.
Metals 08 00087 g008
Figure 9. Comparison between fracture load predictions (EMC-SED criterion) and experimental fracture loads; (a) TL specimens; (b) LT specimens.
Metals 08 00087 g009
Figure 10. Comparison between fracture load predictions (EMC-TCD) and experimental fracture loads; (a) TL specimens; (b) LT specimens.
Metals 08 00087 g010
Table 1. Values of F(2α). Reproduced with permission from Berto, F.; Lazzarin, P. Mater. Sci. Eng.: R Published by Elsevier, 2014 [16].
2α (rad)0π/6π/4π/3π/22π/33π/45π/6
F(2α)0.7850.69170.66920.6620.70490.87791.07171.4417
Table 2. Values of H for U-shaped notches (2α = 0) Reproduced with permission from Berto, F.; Lazzarin, P. Mater. Sci. Eng.: R Published by Elsevier, 2014 [16].
Rc/ρν = 0.20ν = 0.25ν = 0.30ν = 0.35ν = 0.40
0.010.59560.58130.56380.54320.5194
0.050.54010.52580.50860.48840.4652
0.10.48280.46870.45180.43220.4099
0.30.33410.32160.30690.29020.2713
0.50.25080.24010.22760.21350.1976
10.14730.13990.13140.12170.111
Table 3. Chemical composition of Al7075-T651.
ZnMgCuCrFeSiAl
Al7075-T6515.412.841.470.190.170.15Rest
Table 4. Mechanical properties of Al7075-T651.
TestE (GPa)σy (MPa)σu (MPa)emax (%)
TL-174.8537.4601.68.09
TL-273.9541.0602.89.95
LT-171.0550.8607.89.13
LT-272.3557.3616.29.02
Table 5. Experimental fracture loads for TL and LT specimens. Reproduced with permission from Madrazo, V.; Cicero, S.; Carrascal, I.A. Eng. Fract. Mech. Published by Elsevier, 2012 [3].
SpecimenNotch Radius (mm)Experimental Fracture Load (KN)SpecimenNotch Radius (mm)Experimental Fracture Load (KN)
TL0-1011.78-0-
TL0-211.32LT0-210.96
TL0-310.51LT0-310.76
TL0-412.30LT0-411.35
TL0-59.81LT0-511.72
TL0-610.46LT0-611.40
TL0.15-20.1520.95LT0.15-10.1523.09
TL0.15-321.31LT0.15-223.36
TL0.15-418.95LT0.15-323.12
TL0.15-520.03LT0.15-423.13
TL0.15-619.66LT0.15-523.54
TL0.15-721.32LT0.15-622.35
TL0.25-10.2523.68LT0.25-10.2526.95
TL0.25-222.68LT0.25-227.47
TL0.25-322.79LT0.25-327.25
TL0.5-10.531.71LT0.5-10.534.83
TL0.5-230.14LT0.5-235.14
TL0.5-332.33LT0.5-334.36
TL1.0-1139.71LT1.0-1141.12
TL1.0-239.17LT1.0-241.54
TL1.0-337.95LT1.0-340.85
TL2.0-1244.58LT2.0-1244.66
TL2.0-244.96LT2.0-244.60
TL2.0-345.23LT2.0-344.39
Table 6. SED fracture loads for TL and LT specimens.
SpecimenPSED (KN)SpecimenPSED (KN)
TL0.15-26.09LT0.15-16.19
TL0.15-3LT0.15-2
TL0.15-4LT0.15-3
TL0.15-5LT0.15-4
TL0.15-6LT0.15-5
TL0.15-7LT0.15-6
TL0.25-17.20LT0.25-17.32
TL0.25-2LT0.25-2
TL0.25-3LT0.25-3
TL0.5-110.78LT0.5-110.95
TL0.5-2LT0.5-2
TL0.5-3LT0.5-3
TL1.0-112.47LT1.0-112.67
TL1.0-2LT1.0-2
TL1.0-3LT1.0-3
TL2.0-114.36LT2.0-114.53
TL2.0-2LT2.0-2
TL2.0-3LT2.0-3
Table 7. Values of EMC parameters.
MaterialE (GPa)σf* (MPa)
Al 7075-T651 LT71.62709
Al 7075-T651 TL74.42727
Table 8. Equivalent Material Concept-Strain Energy Density (EMC-SED) fracture loads for TL and LT specimens.
SpecimenPEMC-SED (KN)SpecimenPEMC-SED (KN)
TL0.15-215.75LT0.15-115.78
TL0.15-3LT0.15-2
TL0.15-4LT0.15-3
TL0.15-5LT0.15-4
TL0.15-6LT0.15-5
TL0.15-7LT0.15-6
TL0.25-117.75LT0.25-117.80
TL0.25-2LT0.25-2
TL0.25-3LT0.25-3
TL0.5-124.70LT0.5-124.64
TL0.5-2LT0.5-2
TL0.5-3LT0.5-3
TL1.0-134.77LT1.0-134.59
TL1.0-2LT1.0-2
TL1.0-3LT1.0-3
TL2.0-148.32LT2.0-148.03
TL2.0-2LT2.0-2
TL2.0-3LT2.0-3
Table 9. Equivalent Material Concept-Theory of Critical Distances (EMC-TCD) fracture loads for TL> and LT specimens using the PM and the LM.
SpecimenPEMC-PM (KN)PEMC-LM (KN)SpecimenPEMC-PM (KN)PEMC-LM (KN)
TL0.15-214.6816.49LT0.15-114.6816.54
TL0.15-3LT0.15-2
TL0.15-4LT0.15-3
TL0.15-5LT0.15-4
TL0.15-6LT0.15-5
TL0.15-7LT0.15-6
TL0.25-117.7219.29LT0.25-117.6819.30
TL0.25-2LT0.25-2
TL0.25-3LT0.25-3
TL0.5-123.7324.96LT0.5-123.6324.89
TL0.5-2LT0.5-2
TL0.5-3LT0.5-3
TL1.0-132.6133.52LT1.0-132.4333.37
TL1.0-2LT1.0-2
TL1.0-3LT1.0-3
TL2.0-145.4446.11LT2.0-145.1745.85
TL2.0-2LT2.0-2
TL2.0-3LT2.0-3

