Effect of Carbon Content on the Properties of Iron-Based Powder Metallurgical Parts Produced by the Surface Rolling Process

1
School of Materials Science and Engineering, Tongji University, Shanghai 201804, China
2
Shanghai Key Laboratory for R&D and Application of Metallic Functional Materials, Shanghai 201804, China
3
Shanghai Automotive Powder Metallurgy Co. Ltd., Shanghai 201908, China
4
Shanghai Powder Metallurgy Automobile Material Engineering Research Center, Shanghai 201908, China
*
Authors to whom correspondence should be addressed.
Metals 2018, 8(2), 91; https://doi.org/10.3390/met8020091
Submission received: 8 November 2017
/
Revised: 7 January 2018
/
Accepted: 24 January 2018
/
Published: 26 January 2018
Abstract
:In recent years, the rolling densification process has become increasingly widely used to strengthen powder metallurgy parts. The original composition of the rolled powder metallurgy blank has a significant effect on the rolling densification technology. The present work investigated the effects of different carbon contents (0 wt. %, 0.2 wt. %, 0.45 wt. %, and 0.8 wt. %) on the rolling densification. The selection of the raw materials in the surface rolling densification process was analyzed based on the pore condition, structure, hardness, and friction performance of the materials. The results show that the 0.8 wt. % carbon content of the surface rolling material can effectively improve the properties of iron-based powder metallurgy parts. The samples with 0.8 wt. % carbon have the highest surface hardness (340 HV0.1) and the lowest surface friction coefficient (0.35). Even if the dense layer depth is 1.13 mm, which is thinner than other samples with low carbon content, it also meets the requirements for powder metallurgy parts such as gears used in the auto industry.
1. Introduction
Powder metallurgy (PM) parts have become increasingly widely used in the auto industry [1,2]. Compared with forging, the advantages of the PM process are that it is suitable for complexly shaped parts, the raw material utilization rate is high, and the production cost is reduced [3,4]. However, the inherent porosity in traditional single pressed and sintered products is one of the major factors causing reduction in the mechanical properties of PM parts [5,6]. Although new advances in powder metallurgy such as hot isostatic pressing (HIP), selective laser melting (SLM), and high-velocity compaction technology are used to manufacture high-performance components with homogeneous high density, the facilities required for these processes are more specialized and the production costs are higher compared with those of the surface rolling process [6,7,8]. Therefore, in order to expand the application field of PM parts, surface densification is a cost-effective and highly precise method enabling the surface of parts to be densified, while still keeping the internal porous state. Surface densification can greatly enhance the mechanical properties and surface properties of PM parts while retaining the advantages of powder metallurgy; specifically, maintaining the light weight and damping capacity of PM parts [6,7,8,9,10].
Rolling densification belongs to the secondary processing process in the PM industry [11]. In the rolling process, the dense layer is obtained by plastic deformation on the surface of the sintered blank [12]. This surface densification process takes only 8–15 s for each blank; therefore, the efficiency is significantly higher than other densification methods [13].
The original powder chemical composition affects the structure and mechanical properties of the sintered blanks and then has an impact on the effect of surface rolling. Because the original powder composition is complex, the roles of different elements will be mutually influenced. Consequently, this work studied the effect of single element carbon on surface rolling densification. Carbon exists in steel mainly in the form of cementite and graphite. The ductility of carbon steel decreases rapidly with an increasing proportion of cementite and graphite. It is noteworthy that the orientation of carbide lamellae leads to the anisotropic mechanical properties in the materials, and the rolling process will result in a highly controllable change in the direction of the carbide lamellae [12,14]. Meanwhile, the finer carbide lamellae can be beneficial for wear resistance. Consequently, the effects of carbon content are a priority research area for surface rolling in this work.
The carbon content added to the sintered steel was generally between 0.2 wt. % and 1.0 wt. % in the previous published literature, and the form was graphite. However, the previous literature mostly focused on comparing the properties of rolling parts with those of wrought parts as well as researching rolling process parameters such as rolling speed and rolling pressure. For the material used in the surface rolling process, the previous literature indicated that the rolling process requires a soft material with sufficient core hardness in order to allow the densification of the surface region while macro deformation is prevented [15]. However, there is no specific experiment or research to support this assumption and define an appropriate carbon content in surface rolling sintered materials. Therefore, this paper investigates the influence of the gradient of carbon content on the densification of surface rolling in order to provide evidence for the selection of surface rolling PM materials. In PM sintered steel, there is a threshold value of 1.0 wt. % for the carbon content. When the carbon content is higher than 1.0 wt. % the tensile strength of the parts will decrease, and sintering deformation is more likely to occur in the material. In addition, the alloying elements will also be segregated, leading to a reduction in the cutting performance and plastic properties of the material. Therefore, in this paper, a range of 0~0.8 wt. % carbon was chosen to investigate the effect of carbon content on the performance of surface densification. Results obtained from this work will enrich the basic knowledge of PM surface rolling technology and provide a reference for the selection of surface densification materials.
2. Materials and Methods
2.1. Preparation of PM Components
The raw material of the surface-densified samples was Höganäs powder. The steel powder was pre-alloyed powder with 0.85 wt. % Mo mixed with 1.40 wt. % Cu and different contents of graphite (0 C, 0.2 C, 0.45 C, and 0.8 C) in the Star-mix way. Table 1 below shows the chemical composition of the PM materials, which have the same content of Cu and Mo and only differ in the carbon content. The element Cu is used for improving the strength of the PM parts. The element Mo is used for enhancing the hardenability of PM parts, as they undergo a high-frequency quenching process after rolling. The size of these powders is about 150 μm. According to our production experience, the parts with 1.0 wt. % carbon content are susceptible to cracking after sintering as a great amount of cementite is generated in them. So, the values of carbon content up to 1.0 wt. % were not studied in this research.
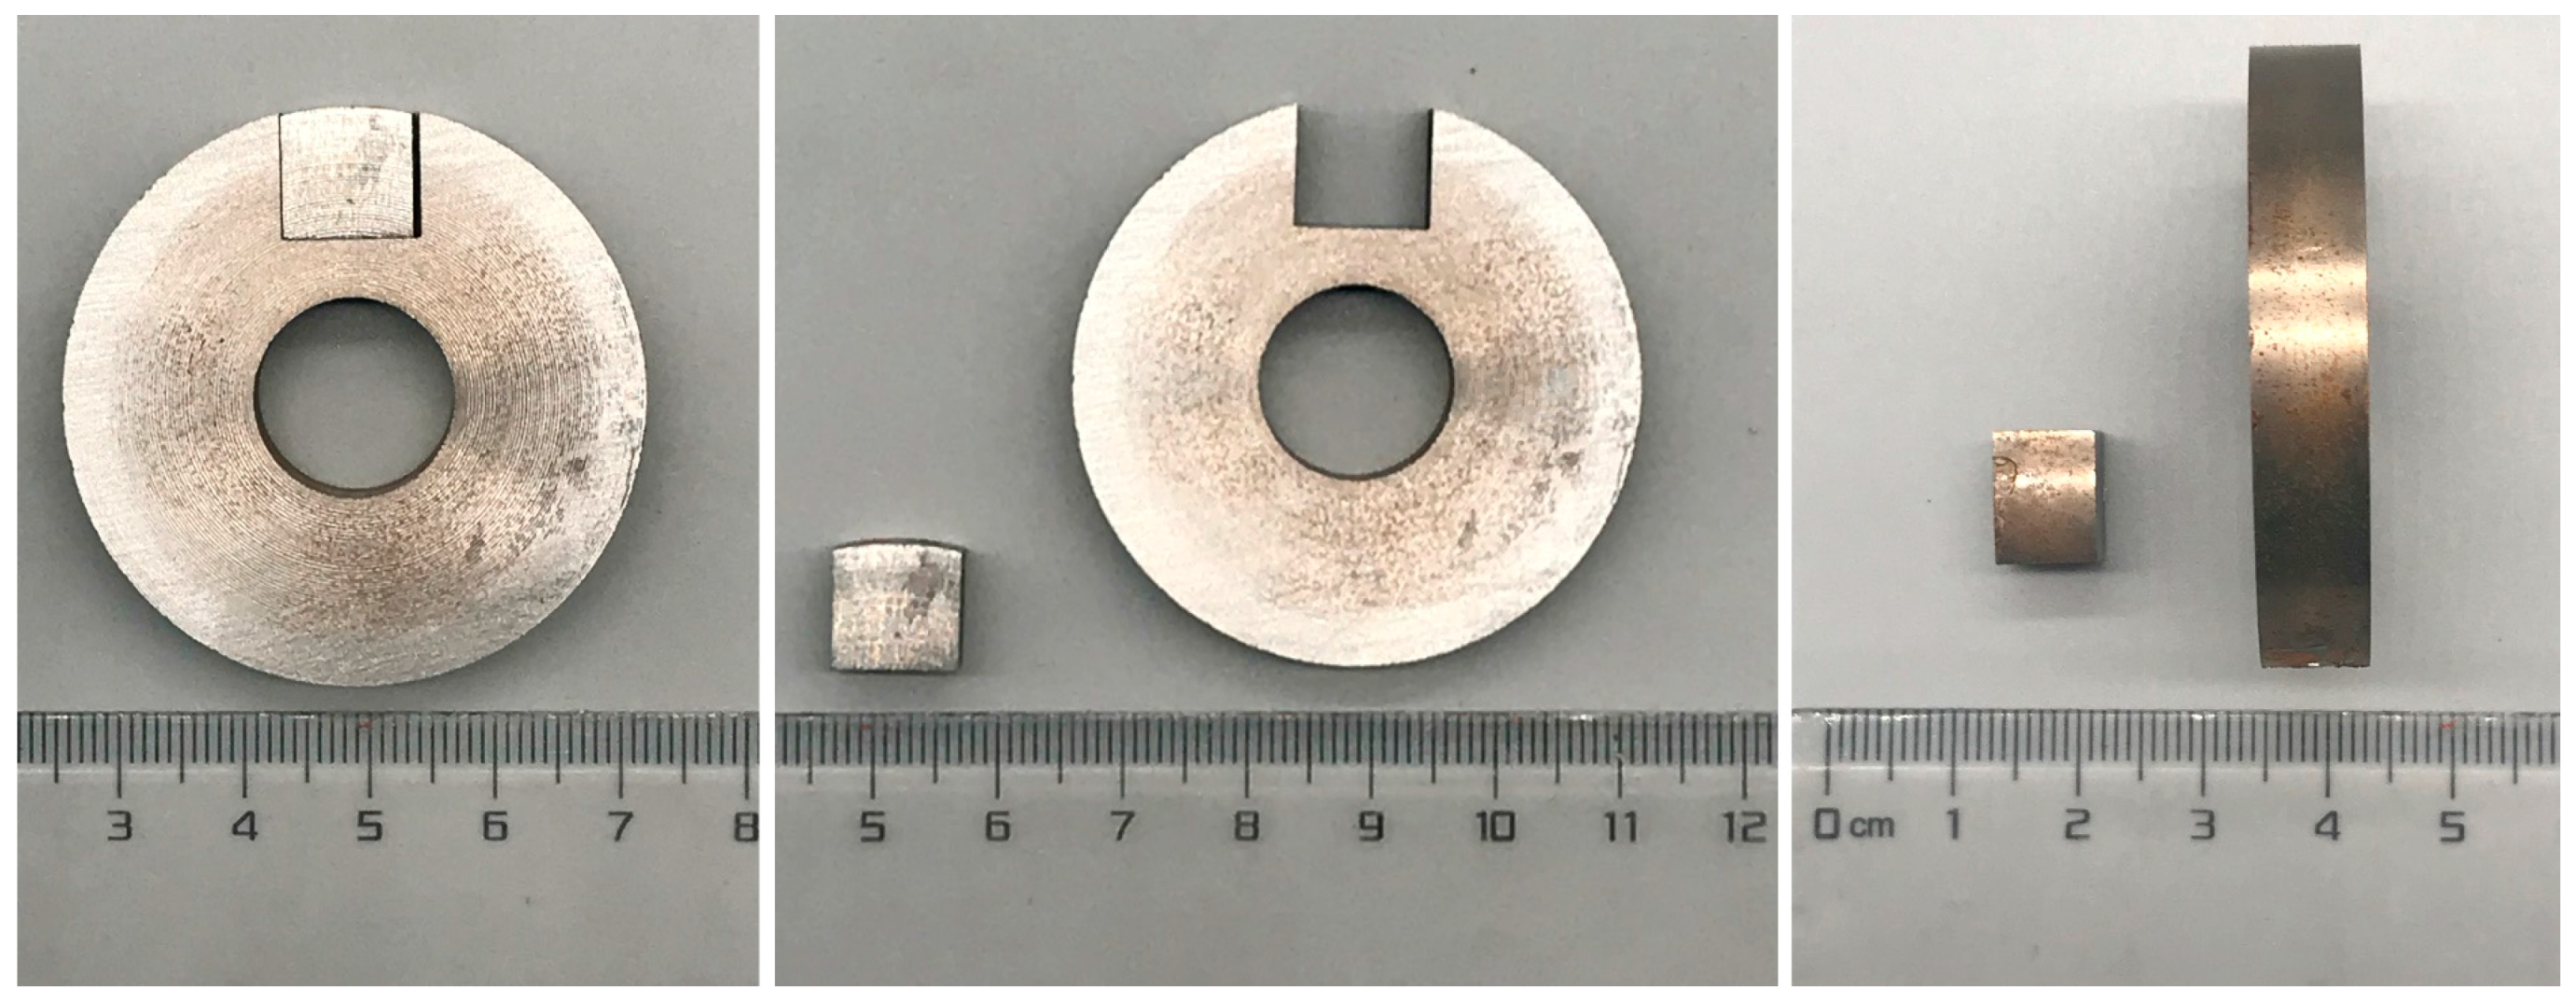
The blanks were pressed on a mechanical press under a pressure of 650~700 MPa. The sintering process was performed via a single normal-temperature sintering (1393 K × 30 min) route in a continuous furnace under an ammonia dissolving atmosphere. Ammonia dissolving is used as a protective atmosphere to protect the parts from oxidation during the sintering process. It does not have any chemical reaction with the parts. The carbon potential was controlled by the protective ammonia dissolving atmosphere so that the carbon content of the blank was maintained at the same level as the original ones. All of the part densities were well controlled by compacting. After sintering, the densities of green parts with each of the different carbon contents were measured based on the Archimedes drainage method, with the values fluctuating between 7.08 and 7.12 g/cm3. The average density of the sintered samples was then calculated at about 7.10 g/cm3. Sample photographs are shown in Figure 1, and the dimensions are outer diameter (OD) = 25 mm, inner diameter (ID) = 15 mm, thickness = 8 mm.
2.2. Surface Rolling Apparatus and Methods
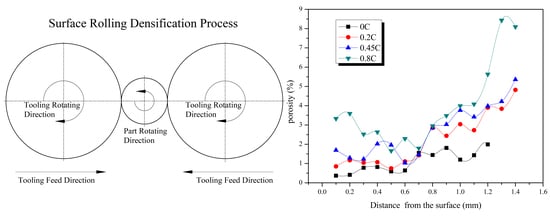
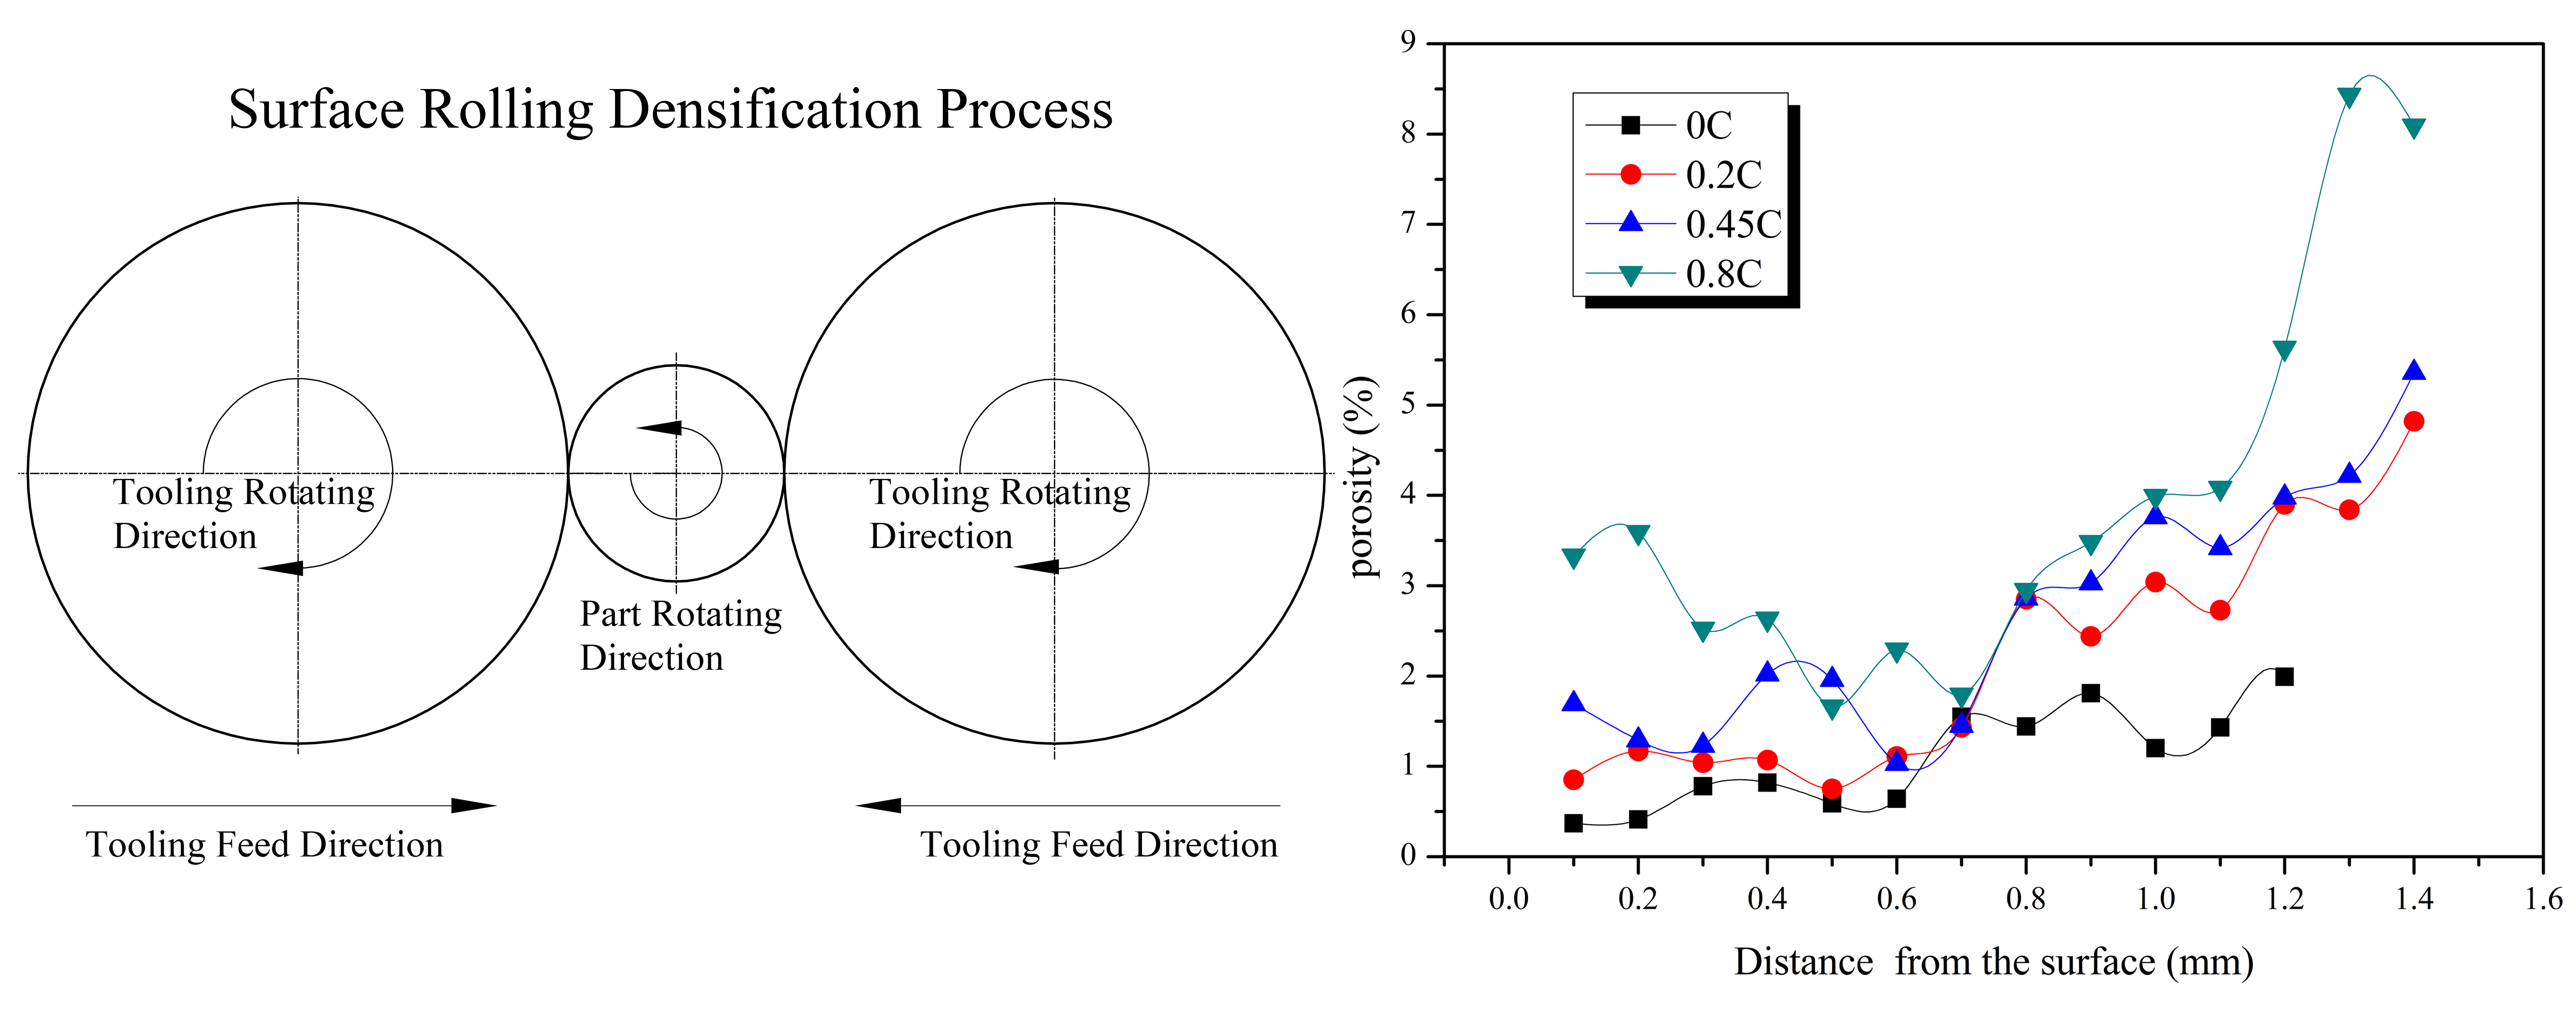
The rolling densification process was carried out on a FLEX M20 HCN rolling machine from Escofier, Chalon-sur-Saône, France, as shown in Figure 2. During the rolling process, two roller dies were spinning in the same direction and at the same speed. Through moving both of the roller dies with pressure on the components, the surface area was densified. During the process, the rolling speed was 30 r/min and the feeding speed of the roller dies was 0.6 mm/s. After reaching the preset distance, the roller dies stopped the feed at 0.8 mm and kept the distance for 1 s. These parameters of the rolling process have been studied in our previous research [16], and it was found that with these parameters we can produce PM parts with a surface dense-layer deeper than 0.3 mm and a density higher than 7.5 g/cm3. This meets the performance use requirements.
In the present work, the pores in the material were observed by a metallographic microscope (Olympus, bx51, Tokyo, Japan), and the depth and distribution of the dense layer were analyzed by image processing software. The hardness distribution on the cross-section of the sample was measured by a micro Vickers hardness tester (DHV-1000 Shanghai, Shanghai, China) with a test load of 0.98 N and an indentation of 10 s. Each hardness point on the distribution figure is the average hardness value of five different indentations at the same distance from the surface. The roughness detector (Mitutoyo, SJ-410, Kawasaki, Japan) detected the roughness level of the sample surface after rolling. The structure and morphology of the samples were examined by SEM (Cam Scan, Apollo300, Cambridge, UK). The deformation and frictional properties of the microspheres were tested by nano-scratch experiments (CSM, NST, Peseux, Switzerland).
3. Results
3.1. Surface-Densified Layer Properties
The porosity distribution on the cross-section in the surface layer is shown in Figure 3. It can be seen that as the carbon content increases, the overall level of porosity in the densified layer increases. It is obvious that the porosity of 0 C is the lowest of all the specimens. The porosity of 0 C fluctuates less than 2% in a large region (0–1.2 mm from the surface). Therefore, the dense layer depth (defined as porosity <3.84% [13]) of the 0 C samples is the thickest in this work. The porosity of 0.2 C is obviously higher overall than that of 0 C in the surface layer, and it has some fluctuations after 0.7 mm with a mostly upward trend. The porosity distributions of 0.45 C and 0.8 C show large fluctuations and instability in the dense layer region. The porosity declines first and then rises from the surface to the center in the 0.45 C and 0.8 C samples.
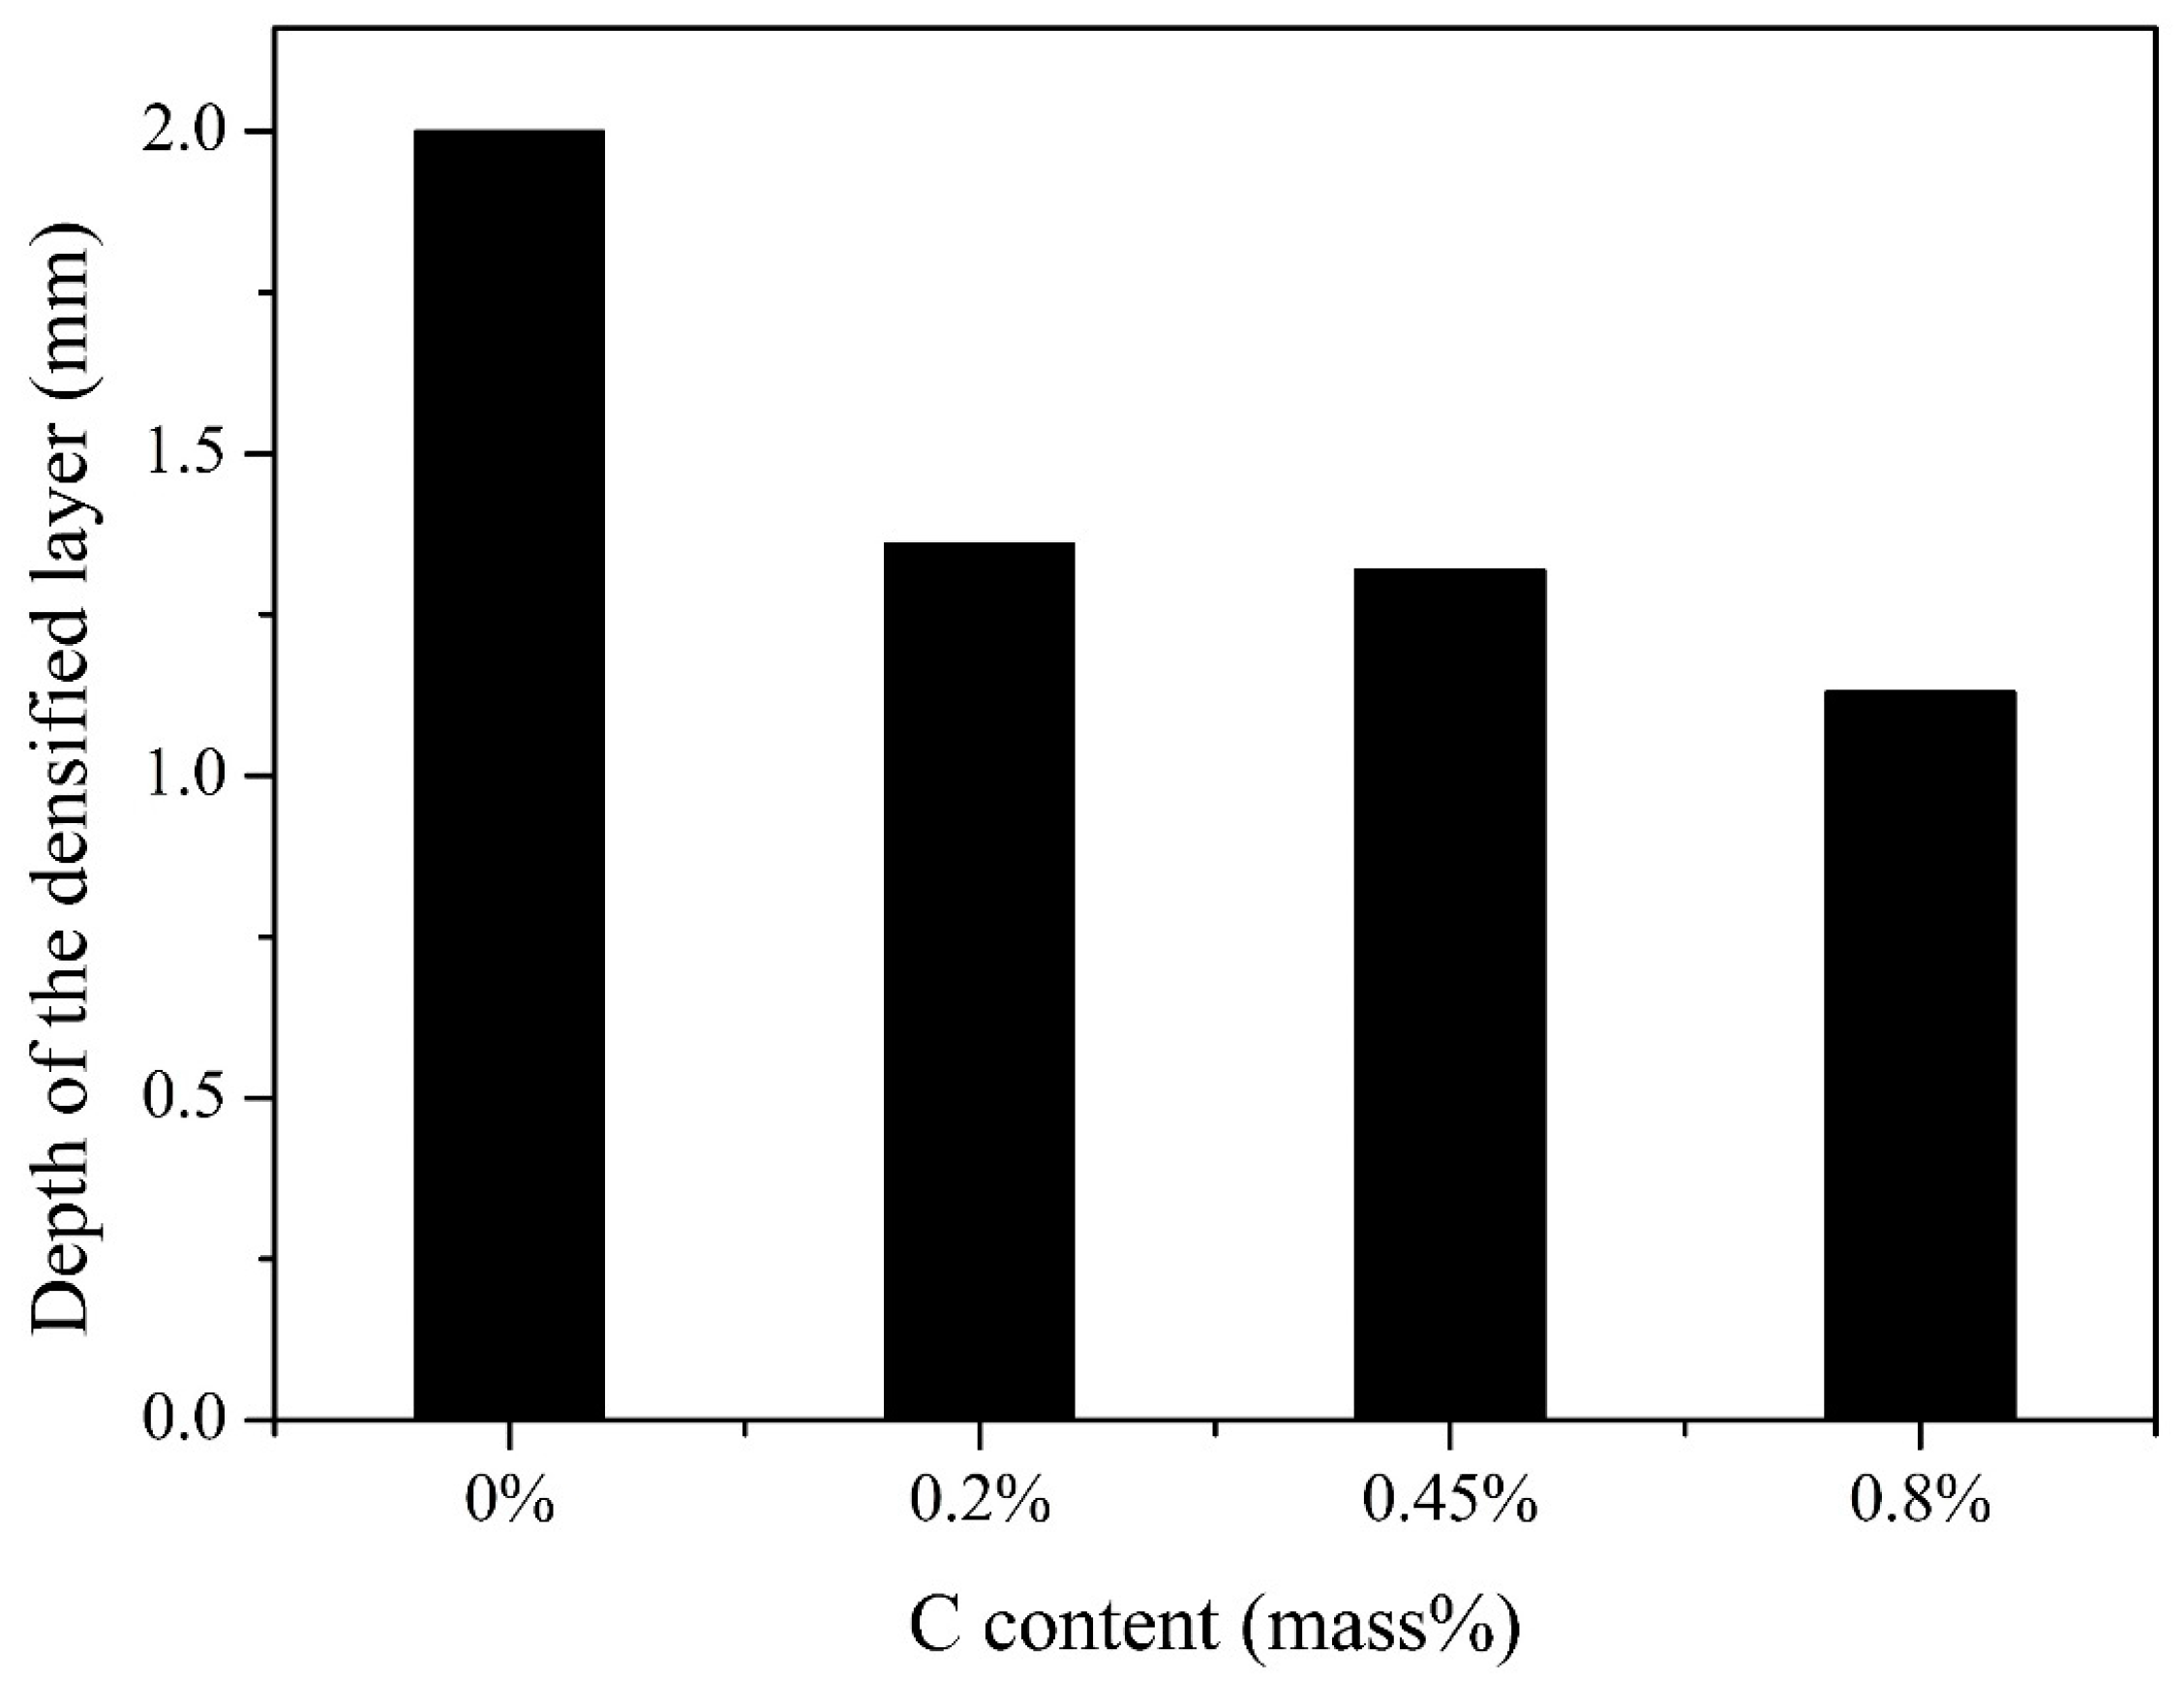
In this work, the variation of carbon content has little effect on the theoretical full density of the PM material. Therefore, the theoretical full densities are around 7.8 g/cm3 in 0 C, 0.2 C, 0.45 C, and 0.8 C specimens. The densification effect is obtained when the surface density is larger than 7.5 g/cm3, i.e., the porosity is less than 3.84%. Figure 4 shows the depth of the densified layer of all samples, and indicates that the densified layer depth of 0 C is 2 mm, which is the thickest. As the carbon content increases, the depths of 0.2 C, 0.45 C, and 0.8 C are 1.36 mm, 1.32 mm, and 1.13 mm, respectively.
3.2. Micro-Hardness Analysis
Figure 5 shows the microhardness distributions on the cross-section in the surface layer with different carbon contents. The hardness values at a distance of 8 mm from the surface can represent the hardness level of the matrix of the specimens. In Figure 5, it is shown that the hardness of the matrix increases with the increase of the carbon content. At the same time, the hardness of the densified areas of 0 C and 0.2 C are nearly the same, indicating that the same rolling condition can increase the hardness of the densified layer in 0 C and obtain the same level of densification with 0.2 C. When the carbon content of the samples increases to 0.45 wt. % and 0.8 wt. %, it shows higher hardness in the densified layer because the hardness of the matrix has reached a higher level. The highest hardness is 340 HV0.1 in the densified layer of 0.8 C.
3.3. Roughness Analysis
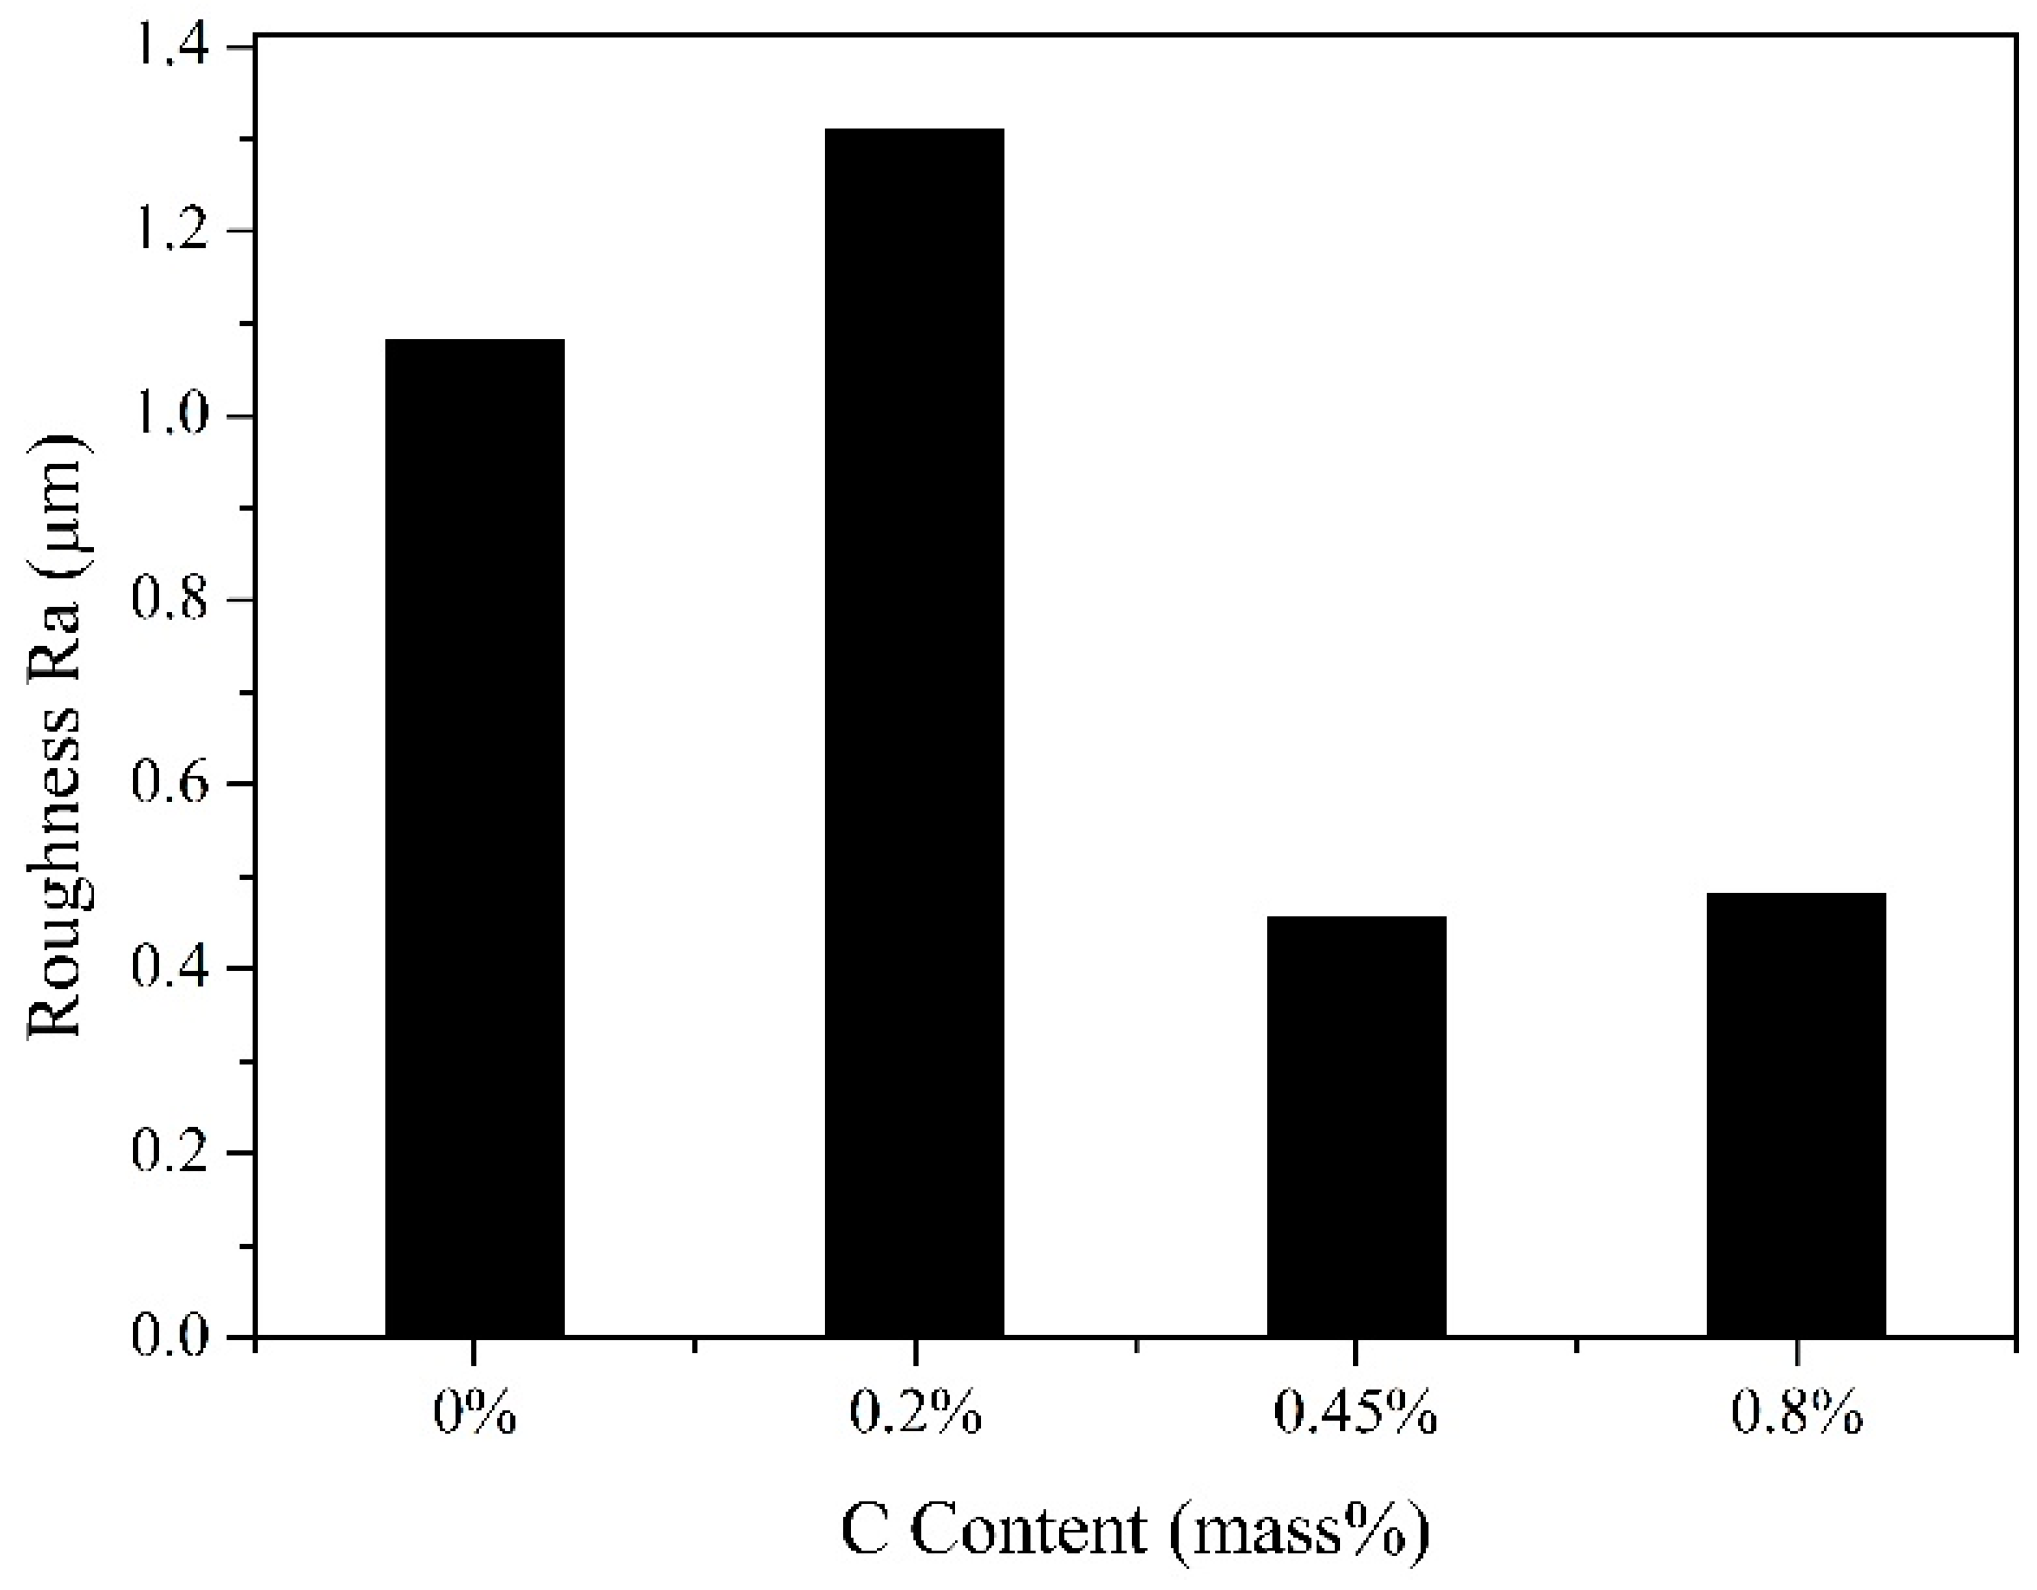
Sven Bengtsson et al. showed that the surface roughness of surface-densified parts is better than that of shaved parts [17]. Figure 6 shows the comparison of tooth flank roughness in 0 C, 0.2 C, 0.45 C, and 0.8 C specimens. It can be seen that the roughness levels of 0.45 C and 0.8 C reach 0.5 μm, which is only half that of the 0 C and 0.2 C samples.
3.4. Metallographs and SEM Analysis
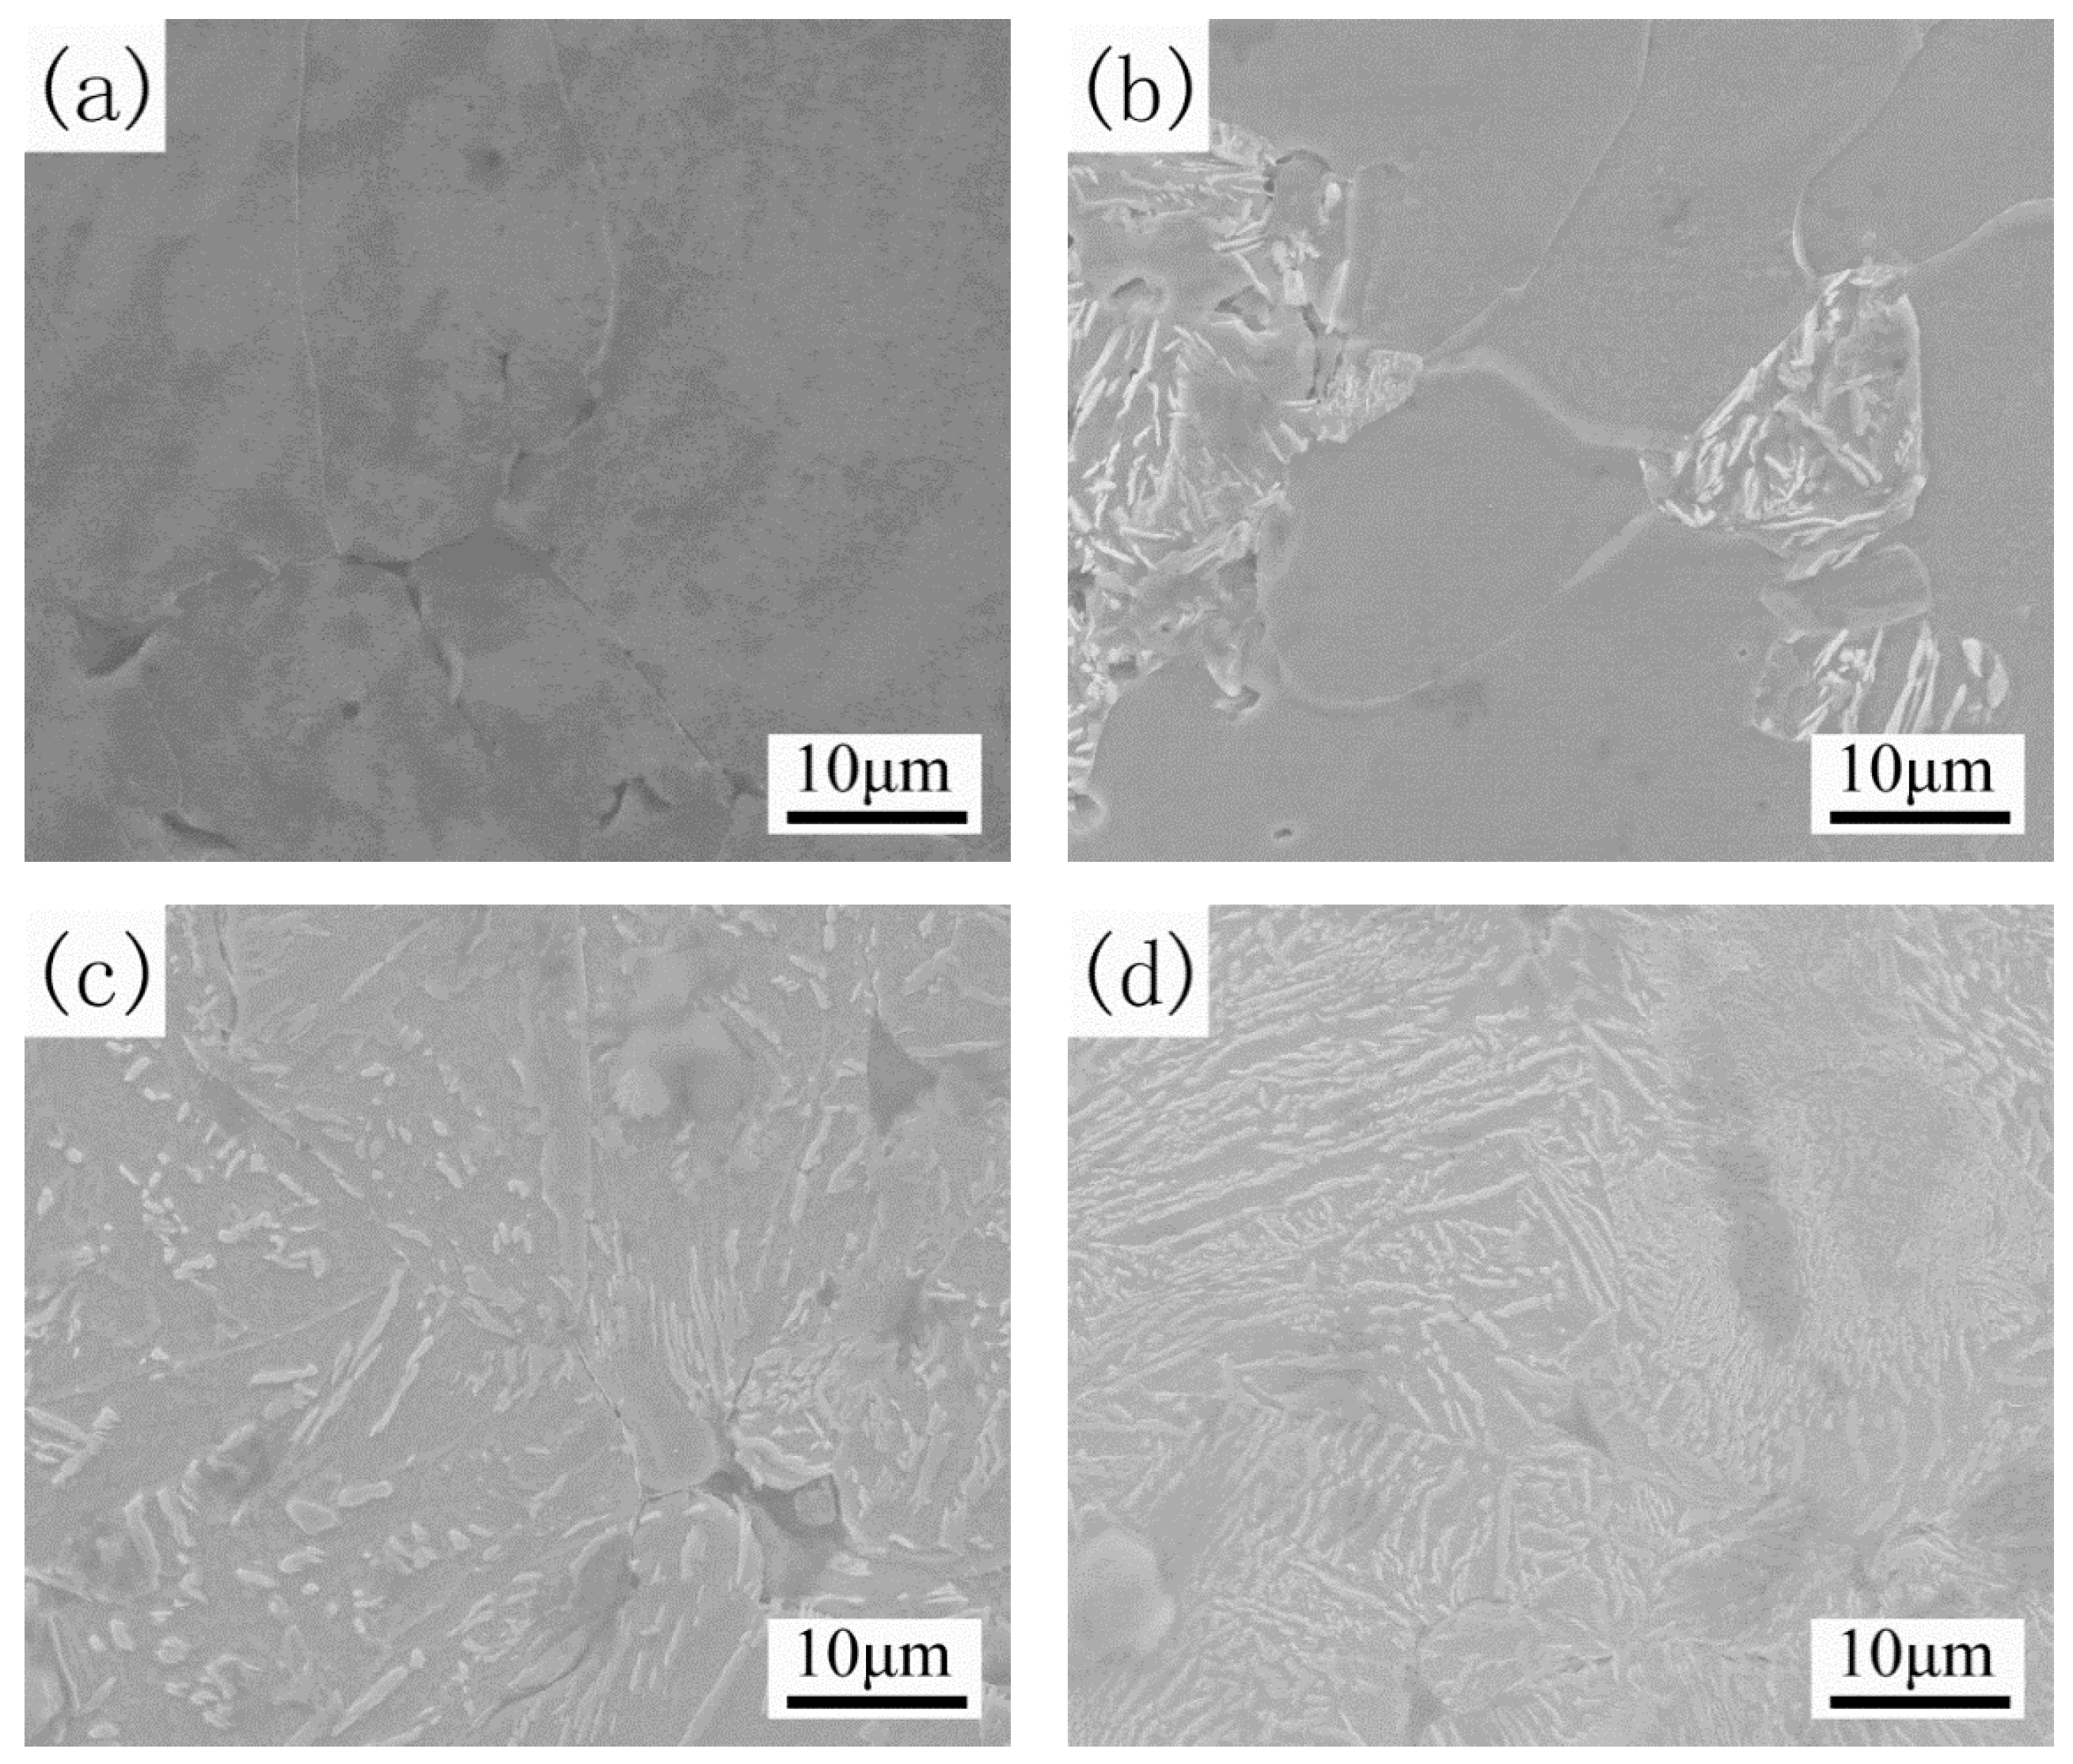
Figure 7 shows the metallographs of the densified layer of the specimens. Figure 8 shows the SEM images of the densified layer of the specimens. From Figure 7a, it can be seen that the structure of 0 C is fully ferrite. The black region is the pores left by copper melting during sintering, and the reason for the formation of darker areas in the ferrite grains is the solid solution of copper. Comparing between Figure 7b–d, it is noted that lamellar pearlite appears in the material with the increase of carbon content. The structure of 0.2 C and 0.45 C is ferrite + pearlite and the structure of 0.8 C is fully pearlite.
There is no carbide in the 0 C specimens in Figure 8a. When the carbon content increases, the proportion of pearlite gradually increases, as shown in Figure 8b–d. Comparing Figure 8b–d, it can be observed that the carbide layer is finer in the specimens with higher carbon content. The carbide lamella has been formed with a regular directional arrangement and the interlamellar spacing is approximately 500 nm on average in Figure 8d.
As can be seen from the SEM images of these four dense layers, the pores are compressed and closed under the rolling process, forming tiny elongated holes and/or triangular holes. The 0.2 C sample has the most apparent boundaries between pearlite and ferrite. The microstructures of 0 C and 0.8 C are uniform compared with those of 0.2 C and 0.45 C.
3.5. Friction Performance Analysis
In order to investigate the effect of carbon content on the wear resistance of the PM materials, we use nano-scratch experiments to characterize the densified layer area of 0 C, 0.45 C, and 0.8 C specimens. The tests use constant loading mode and the scratch load is 10 mN. The radius of the diamond ball tip is 2 μm. The scratch speed is 0.6 mm/min. The scratch length is 0.5 mm. The scratch process can be divided into three stages. In the first stage, the sample is pre-scratched under a scanning load of 0.5 mN. The surface morphology of the samples can be obtained after pre-scratching. In the second stage, the constant scratch load is used to scratch through the surface of the samples and obtain the transverse force–displacement curve. According to this curve, the relationship between friction and displacement can be calculated. In the final stage, the instrument uses the scanning load to measure the change of residual depth with displacement.
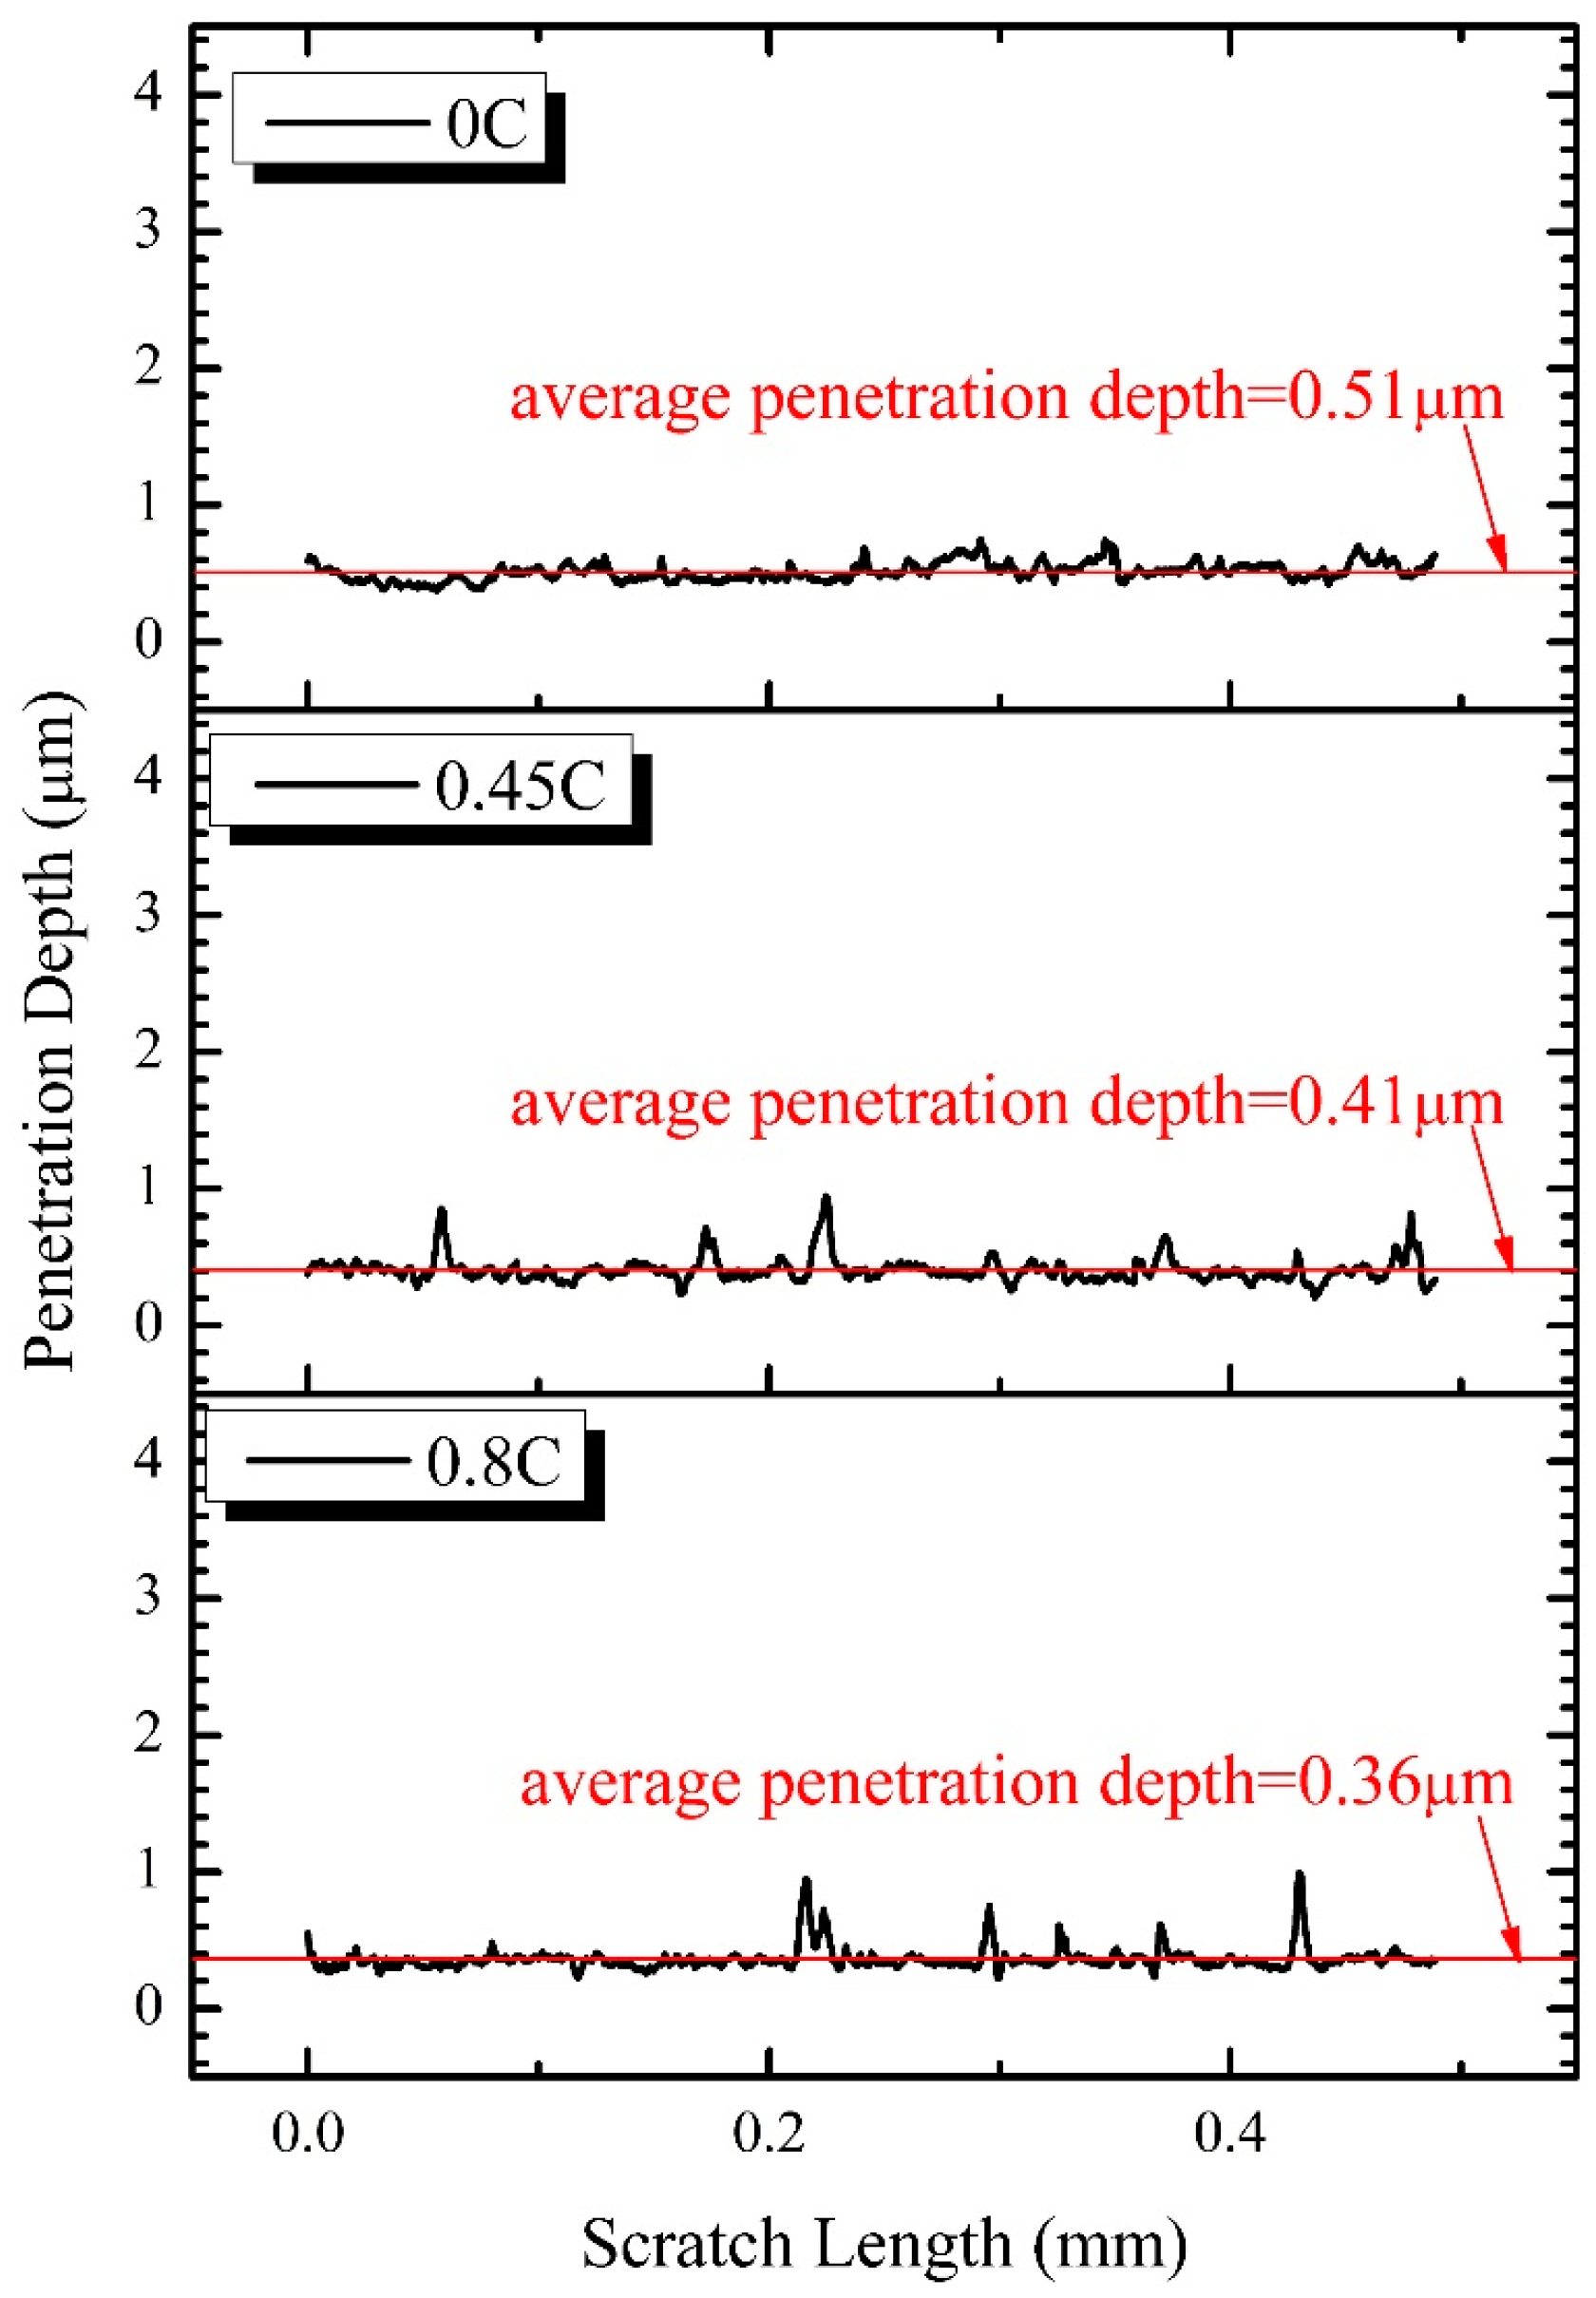
Figure 9 shows the variation of penetration depth with scratch length in different specimens. With the increase of carbon content, the average penetration depth in the densified layer decreases, indicating that the addition of carbon improves the hardness of the material, and the deformation resistance ability is enhanced. Therefore, the wear resistance is improved. The penetration depth curve in 0 C is smoother than others, and the peaks in the curves of 0.45 C and 0.8 C represent the pores which formed on the cross-section of the materials.
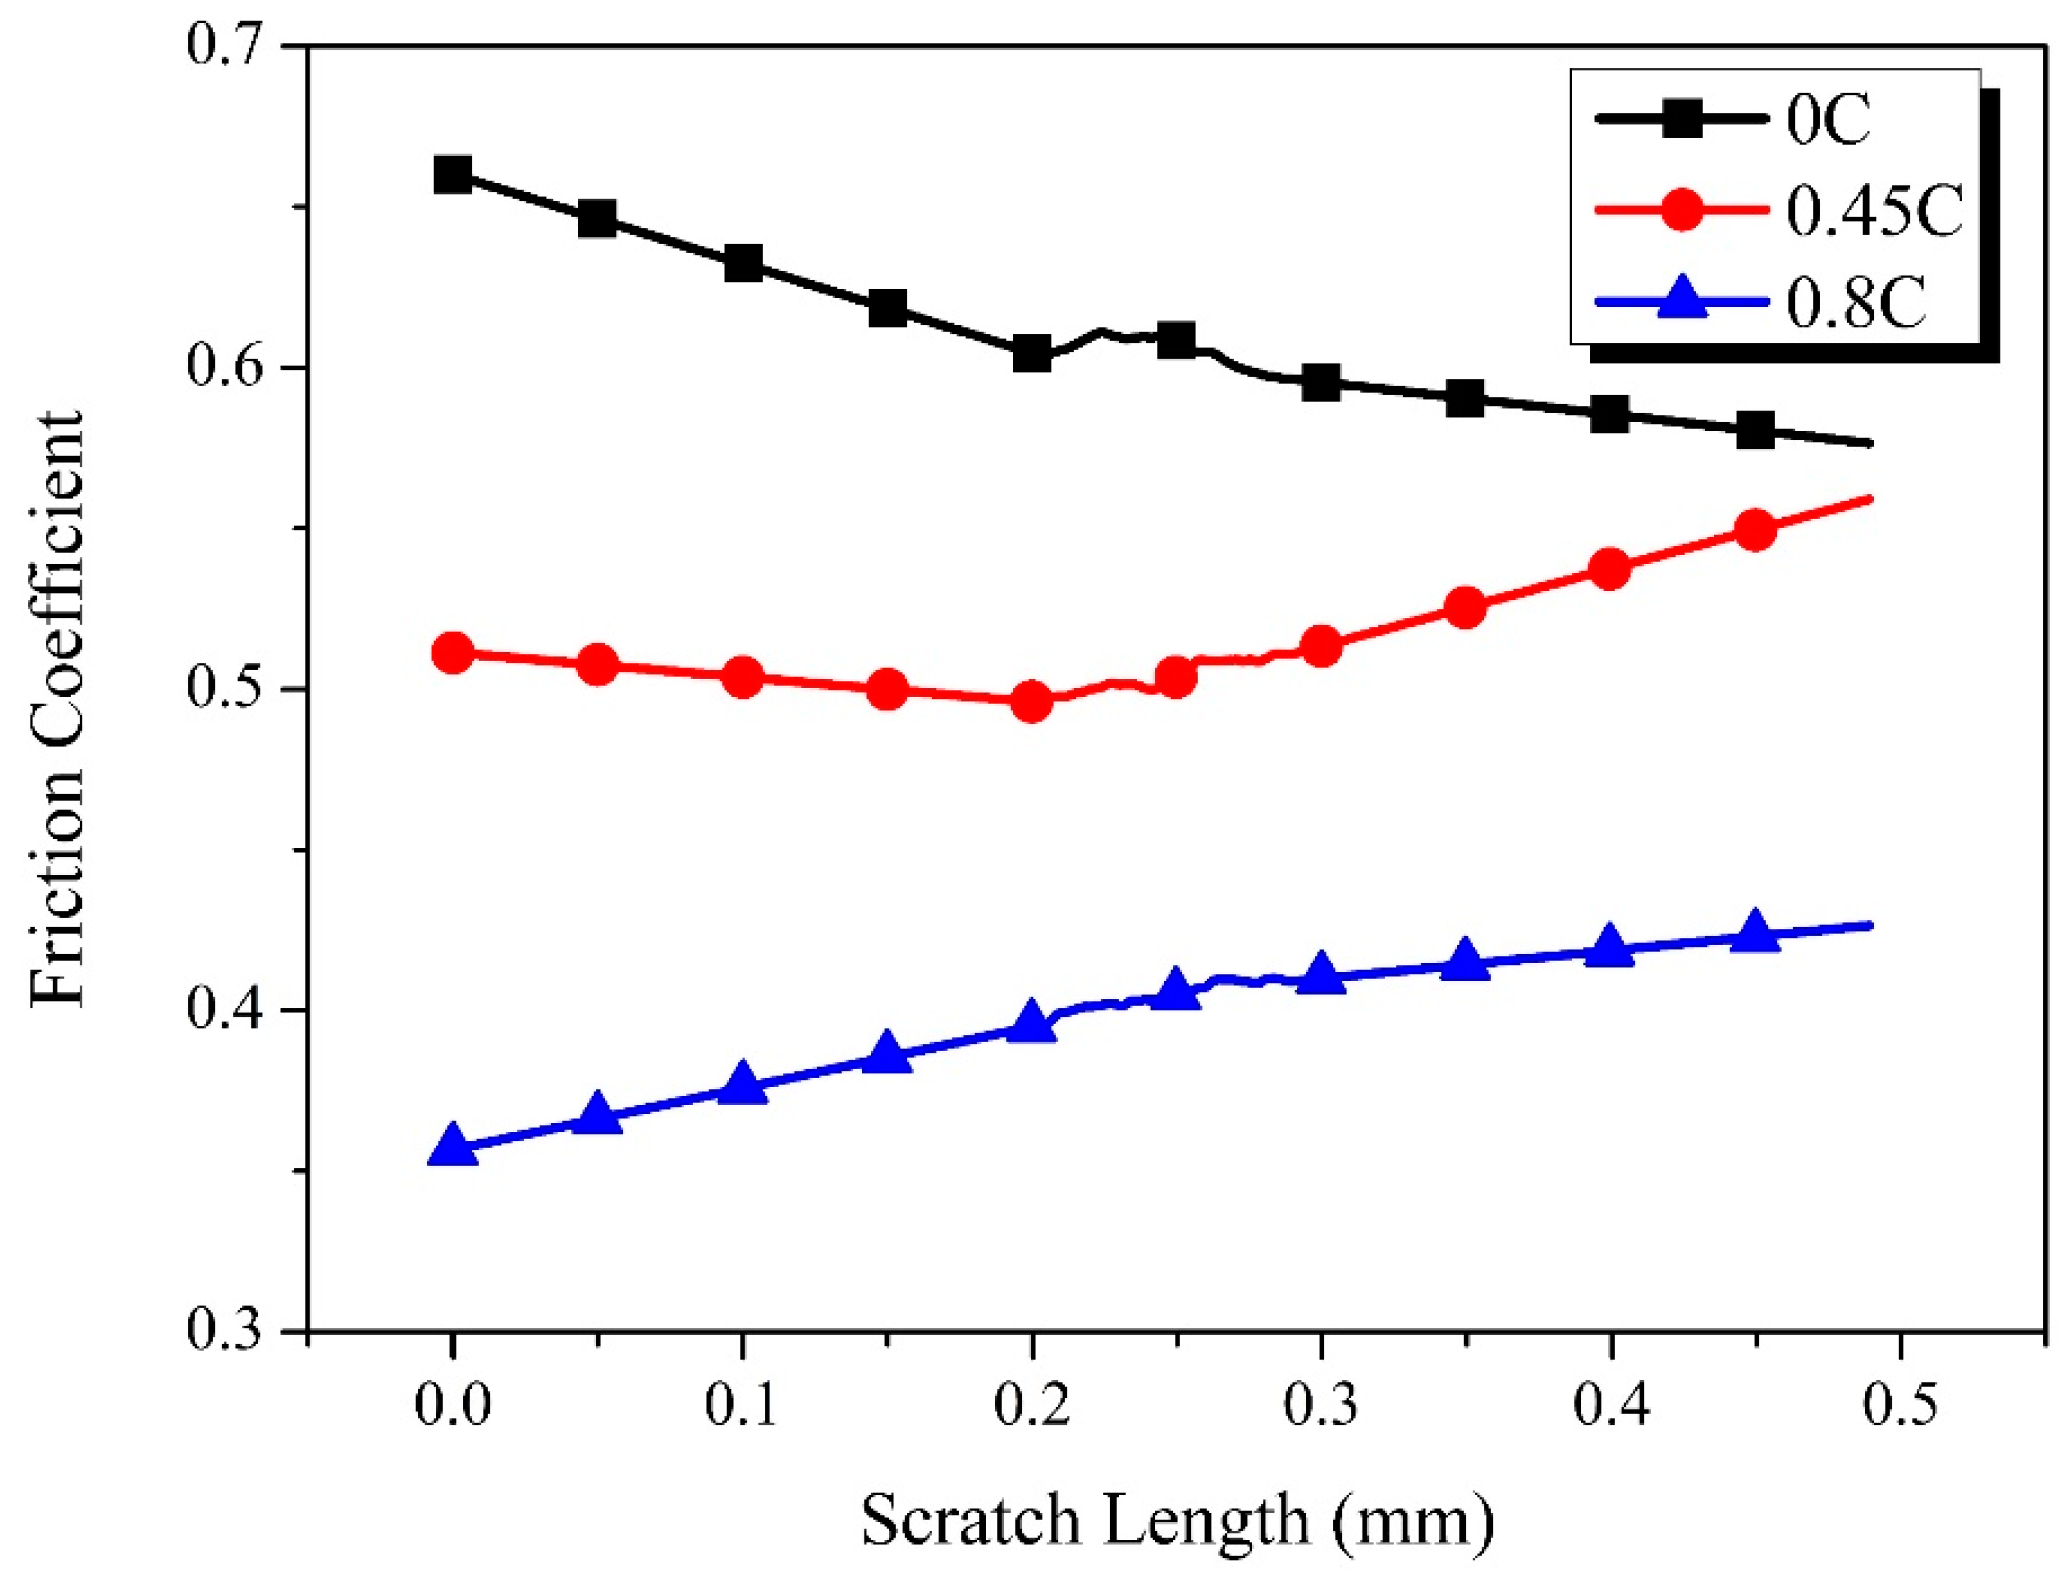
Figure 10 shows variation of the friction coefficient with scratch length in different specimens. The friction coefficient in 0 C shows the declining trend from the surface to the center. On the contrary, the friction coefficient of 0.45 C falls first and then rises starting from 0.25 mm, while the friction coefficient of 0.8 C shows an entirely rising trend in the densified layer. It can be seen from Figure 10 that the overall level of the friction coefficient of the sample density zone decreases with the increase of carbon content. The average value of the friction coefficient of 0.8 C reaches 0.4, which is the lowest of all the specimens, and that of 0.45 C and 0 C is more than 0.5 and 0.6, respectively.
4. Discussion
Pores are affected by both hydrostatic pressure and shear stress in the rolling densification process. Pores are not only compressed by hydrostatic pressure, but also easily elongated and closed by shear deformation. The maximum shear stress appears on the sub-surface rather than on the surface [9]. Therefore, the initial plastic deformation happens in the sub-surface area. Due to the overall small deformation resistance of the 0 C and 0.2 C samples, both the sub-surface and the outermost surface have severe plastic deformation during the rolling process. However, under the same rolling conditions, the deformable sub-surface in the 0.45 C and 0.8 C samples is preferentially densified, while the outermost surface does not reach the same densification as the sub-surface after rolling. This indicates that the increase of carbon content will worsen the effect of rolling compaction on density. The distribution of the density in the dense area is more unstable and non-uniform with a high carbon content.
In the published work from Bengtsson, the depth of the densified layer in samples with 0.25 wt. % carbon content is 1.3 mm [15], and is at the same level as the depth in this work. When the carbon content increases in the samples, the material microstructure changes (from ferrite to pearlite), resulting in the effect of rolling treatment. Therefore, the yield strength rises and the deformation resistance ability is enhanced. In the same rolling condition, specimens with different materials will show different densification behaviors.
The hardness fluctuation in the dense layer is related to the densification state of the samples. The highest hardness of 0.8 C occurred at about 0.6 mm from the surface, where the porosity is at a low state. In 0.45 C, hardness and density have the same trend of fluctuations. In 0 C and 0.2 C, hardness at a distance of 0.4–0.5 mm from the surface has a slight increase, and at the same time there is a decrease in porosity at this position. The reason for this phenomenon is that the existence of internal pores in the material leads to increasing indentation deformation and then decreasing hardness. In addition, the hardness changing rates in the densified layer decline with the increase of the carbon content. This means that the same rolling process is highly efficient in samples with low carbon content.
In Bengtsson’s work, the roughness of the rolled gears with 0.3 wt. % carbon content is Ra1.13, which is lower than that of the shaved reference gear [17] but significantly higher than that of the 0.45 C and 0.8 C samples. Therefore, the rolling process provides a good surface condition for the part and can even be used as the final step in part machining. Furthermore, a high carbon content can lead to better surface roughness.
The friction coefficient of the rolled material with a high carbon content is lower, which is mainly due to the increase of the carbide lubrication. This indicates that the addition of carbon improves the friction performance of the densified layer in PM parts and is conducive to extending the service life of parts in actual working situations. The surface-densified layer, with relatively high hardness, could hinder crack initiation and propagation on and under the surface and enhance the wear properties of the PM material [6].
It has to be pointed out that the roughness should have been obtained via scratch results, but the data obtained from the scratch test in this work gives the penetration depth and transverse force but does not include the roughness. This will be improved in future research.
In future research, the friction and wear behaviors of the surface-densified material need to be further studied via sliding wear tests. We can then investigate the effect of the carbon content on the wear resistance of the surface-densified PM material through wear rate, the morphologies of the worn surface, and the chemical composition of the wear debris. As a result, the wear mechanism could then be researched.
Furthermore, residual stress is an important property generated by the rolling process, which controls fatigue and the corrosion performance of materials. We would like to conduct residual compressive stress measurements using an X-ray stress analyzer on the surface of rolling samples in future research. This will indicate the performance of different carbon content materials after rolling.
5. Conclusions
The influence of carbon content on the surface rolling performance of PM materials was investigated. The results reveal that the porosity, hardness, roughness, and friction performance of surface rolled parts have different trends with different carbon contents.
For the samples with 0 wt. % carbon content, an excellent and stable porosity distribution in a 2-mm-thick dense layer region was observed; however, the hardness at the surface was the lowest (due to the lower hardness of the ferrite itself, even if the sample has high densification) and the wear resistance and friction performance of 0 C performed worst in this work.
As the carbon content increases, the porosity distribution has a fluctuation in the region above 0.7 mm from the surface and the dense layer depth shows a decline in the 0.2 C samples. However, the hardness value of 0.2 C is similar to that of 0 C because of the rising porosity. For the 0.45 C samples, the porosity is slightly higher than that of 0.2 C, and therefore the maximum hardness of 0.45 C—about 280 HV0.1—is about 20% higher than the maximum hardness of 0.2 C—about 230 HV0.1—in the surface region. Meanwhile, the roughness, wear resistance, and friction performance were also improved.
When the carbon content is 0.8 wt. %, the hardness reaches 340 HV0.1 while the roughness is close to Ra0.5 and the friction coefficient is the lowest, about 0.35 approaching the surface. The microstructure is uniform fine pearlite lamellae in 0.8 C. However, the depth of the densified layer is 1.13 mm, which is thinner than the others, and meets the requirements for powder metallurgy parts such as gears used in the auto industry.
Taking into account the application of surface-densified parts and the results obtained from this work, high carbon content provides high strength and good performance in surface rolling densification.
Acknowledgments
This work was funded by the “Morning Star” project supported by the Science and Technological Commission of Shanghai. Contribution and encouragement to this work from Wei Lu is greatly appreciated and acknowledged.
Author Contributions
Biao Yan and Jingguang Peng conceived and designed the experiments; Yan Zhao, Di Chen, and Dekai Li performed the experiments; Yan Zhao analyzed the data; Yan Zhao and Jingguang Peng wrote the paper; Biao Yan revised the manuscript. All authors discussed and approved the final manuscript.
Conflicts of Interest
The authors declare no conflict of interest.
References
- Chen, D.; Li, D.; Peng, J.; Wang, T.; Yan, B.; Lu, W. The effect of rolling temperature on the microstructure and mechanical properties of surface-densified powder metallurgy Fe-based gears prepared by the surface rolling process. Metals 2017, 7, 420. [Google Scholar] [CrossRef]
- Capus, J. Industry roadmap update from MPIF. Met. Powder Rep. 2012, 67, 10–11. [Google Scholar] [CrossRef]
- Takemasu, T.; Koide, T.; Shinbutsu, T.; Sasaki, H.; Takeda, Y.; Nishida, S. Effect of surface rolling on load bearing capacity of pre-alloyed sintered steel gears with different densities. Procedia Eng. 2014, 81, 334–339. [Google Scholar] [CrossRef]
- Lee, J.G.; Lim, C.H.; Kim, H.S.; Hong, S.J.; Kim, M.T.; Kang, B.C.; Park, D.K.; Lee, M.K.; Rhee, C.K. Highly dense steel components prepared by magnetic pulsed compaction of iron-based powders. Powder Technol. 2012, 228, 254–257. [Google Scholar] [CrossRef]
- Shanmugasundaram, D.; Chandramouli, R.; Kandavel, T.K. Cold and hot deformation and densification studies on sintered Fe-C-Cr-Ni low alloy P/M steels. Int. J. Adv. Manuf. Technol. 2009, 41, 8–15. [Google Scholar] [CrossRef]
- Liu, X.; Xiao, Z.Y.; Guan, H.J.; Zhang, W.; Li, F.L. Friction and wear behaviours of surface densified powder metallurgy Fe-2Cu-0.6C material. Powder Metall. 2016, 59, 329–334. [Google Scholar] [CrossRef]
- Takemasu, T.; Koide, T.; Takeda, Y.; Kamimura, D.; Nakamoto, M. Properties of densification by surface rolling and load bearing capacity of 1.5Cr-0.2Mo high density sintered steel rollers and gears. J. Solid Mech. Mater. Eng. 2011, 5, 825–837. [Google Scholar] [CrossRef]
- Ibrahim, A.M.; Bishop, D.P.; Kipouros, G.J. Effect of swaging and rolling post sintering treatments on the corrosion behaviour of alumix 321 PM alloy. Powder Technol. 2017, 320, 89–98. [Google Scholar] [CrossRef]
- Lawcock, R. Rolling-contact fatigue of surface-densified gears. Int. J. Powder Metall. 2006, 42, 17–29. [Google Scholar] [CrossRef]
- Forden, L.; Bengtsson, S.; Bergstrom, M. Comparison of high performance PM gears manufactured by conventional and warm compaction and surface densification. Powder Metall. 2005, 48, 10–12. [Google Scholar] [CrossRef]
- Whittaker, D. PM structural parts move to higher density and performance. Powder Metall. 2007, 50, 99–105. [Google Scholar] [CrossRef]
- Liu, X.; Xiao, Z.Y.; Guan, H.J.; Zhang, W. Experimental study on the surface densification of Fe-2Cu-0.6C powder metallurgy material. Mater. Manuf. Process. 2016, 31, 1621–1627. [Google Scholar] [CrossRef]
- Yu, Y.; Linnea, F. Surface densification-an effective way to improve the performance of sintered gears. Powder Metall. Technol. 2005, 23, 62–74. [Google Scholar] [CrossRef]
- Jones, P.; Buckley-Golder, K.; Lawcock, R.; Shivanath, R. Densification strategies for high endurance pm components. Int. J. Powder Metall. 1997, 33, 37–44. [Google Scholar] [CrossRef]
- Bengtsson, S.; Dizdar, S.; Svensson, M. Material aspects of selectively densified transmission gears. In Proceedings of the 2000 Powder Metallurgy World Congress, Kyoto, Japan, 12–16 November 2000. [Google Scholar]
- Peng, J.G.; Zhao, Y.; Chen, D.; Li, K.D.; Lu, W.; Yan, B.A. Effect of surface densification on the microstructure and mechanical properties of powder metallurgical gears by using a surface rolling process. Materials 2016, 9, 846. [Google Scholar] [CrossRef] [PubMed]
- Bengtsson, S.; Fordén, L.; Dizdar, S.; Johansson, P. Surface densified P/M transmission gear. In Proceedings of the 2001 International Conference on “Power Transmission Components. Advances in High Performance Powder Metallurgy Applications”, Ypsilanti, MI, USA, 16–17 October 2001. [Google Scholar]
Figure 1.
Photographs of samples and the cutting after rolling.

Figure 2.
Schematic view of the experimental apparatus.
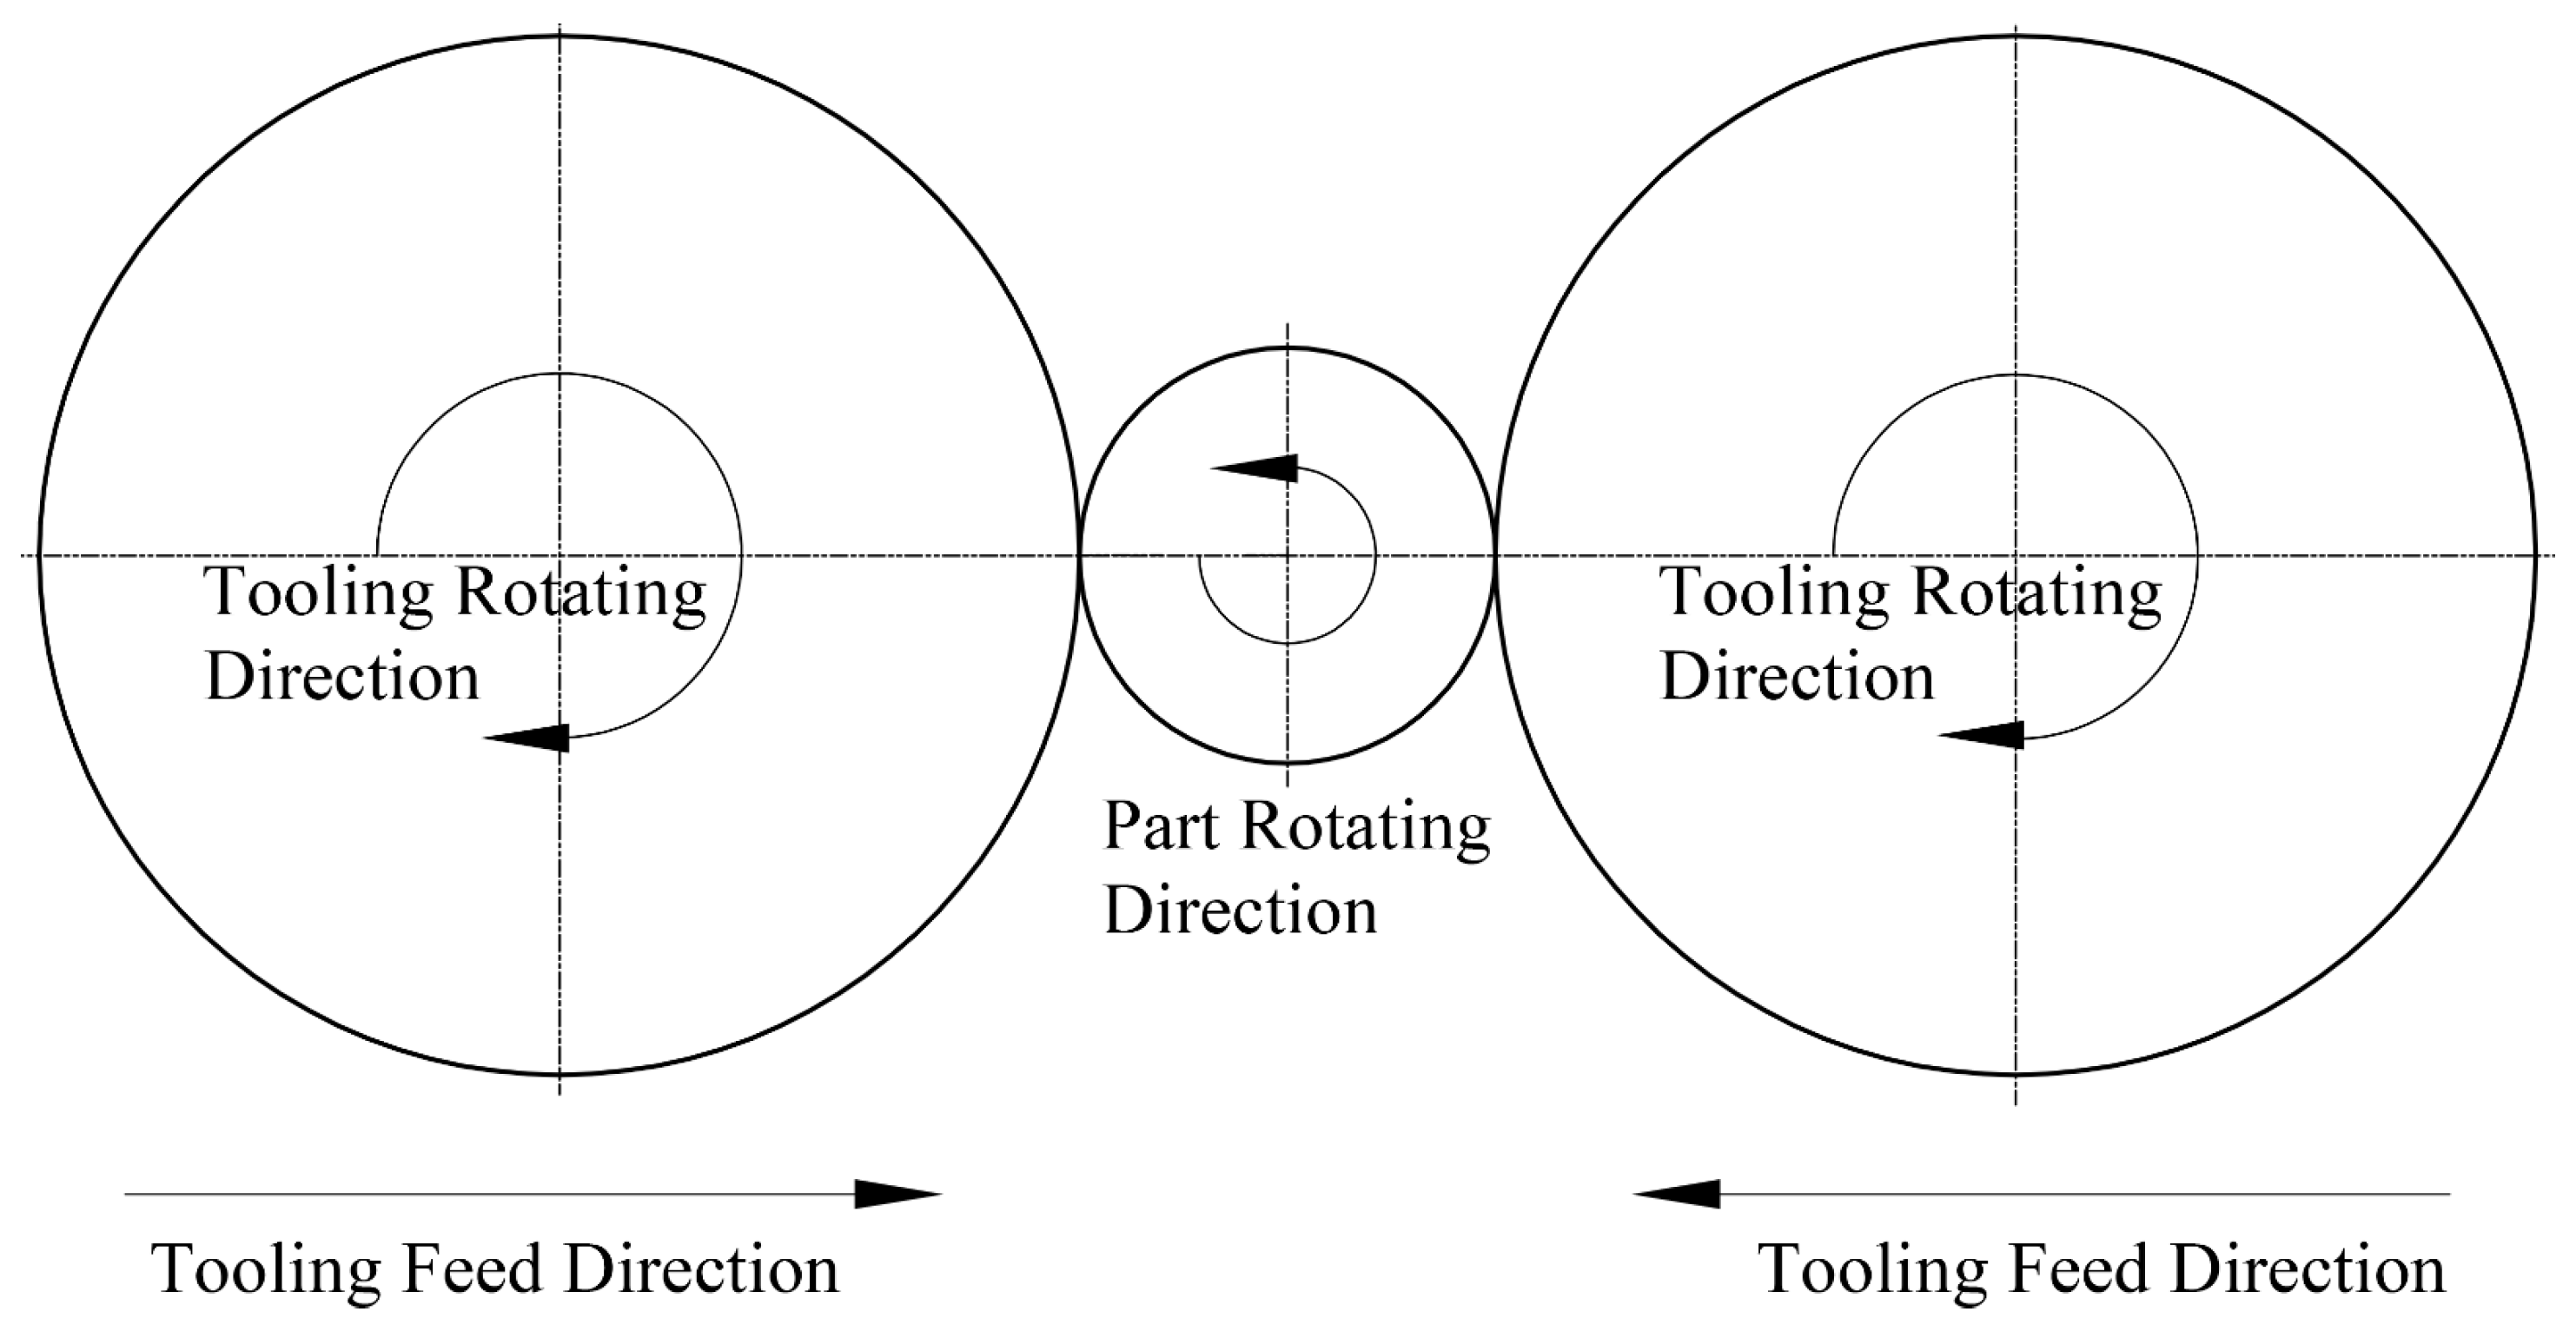
Figure 3.
Porosity distribution on the cross-section in the surface layer.
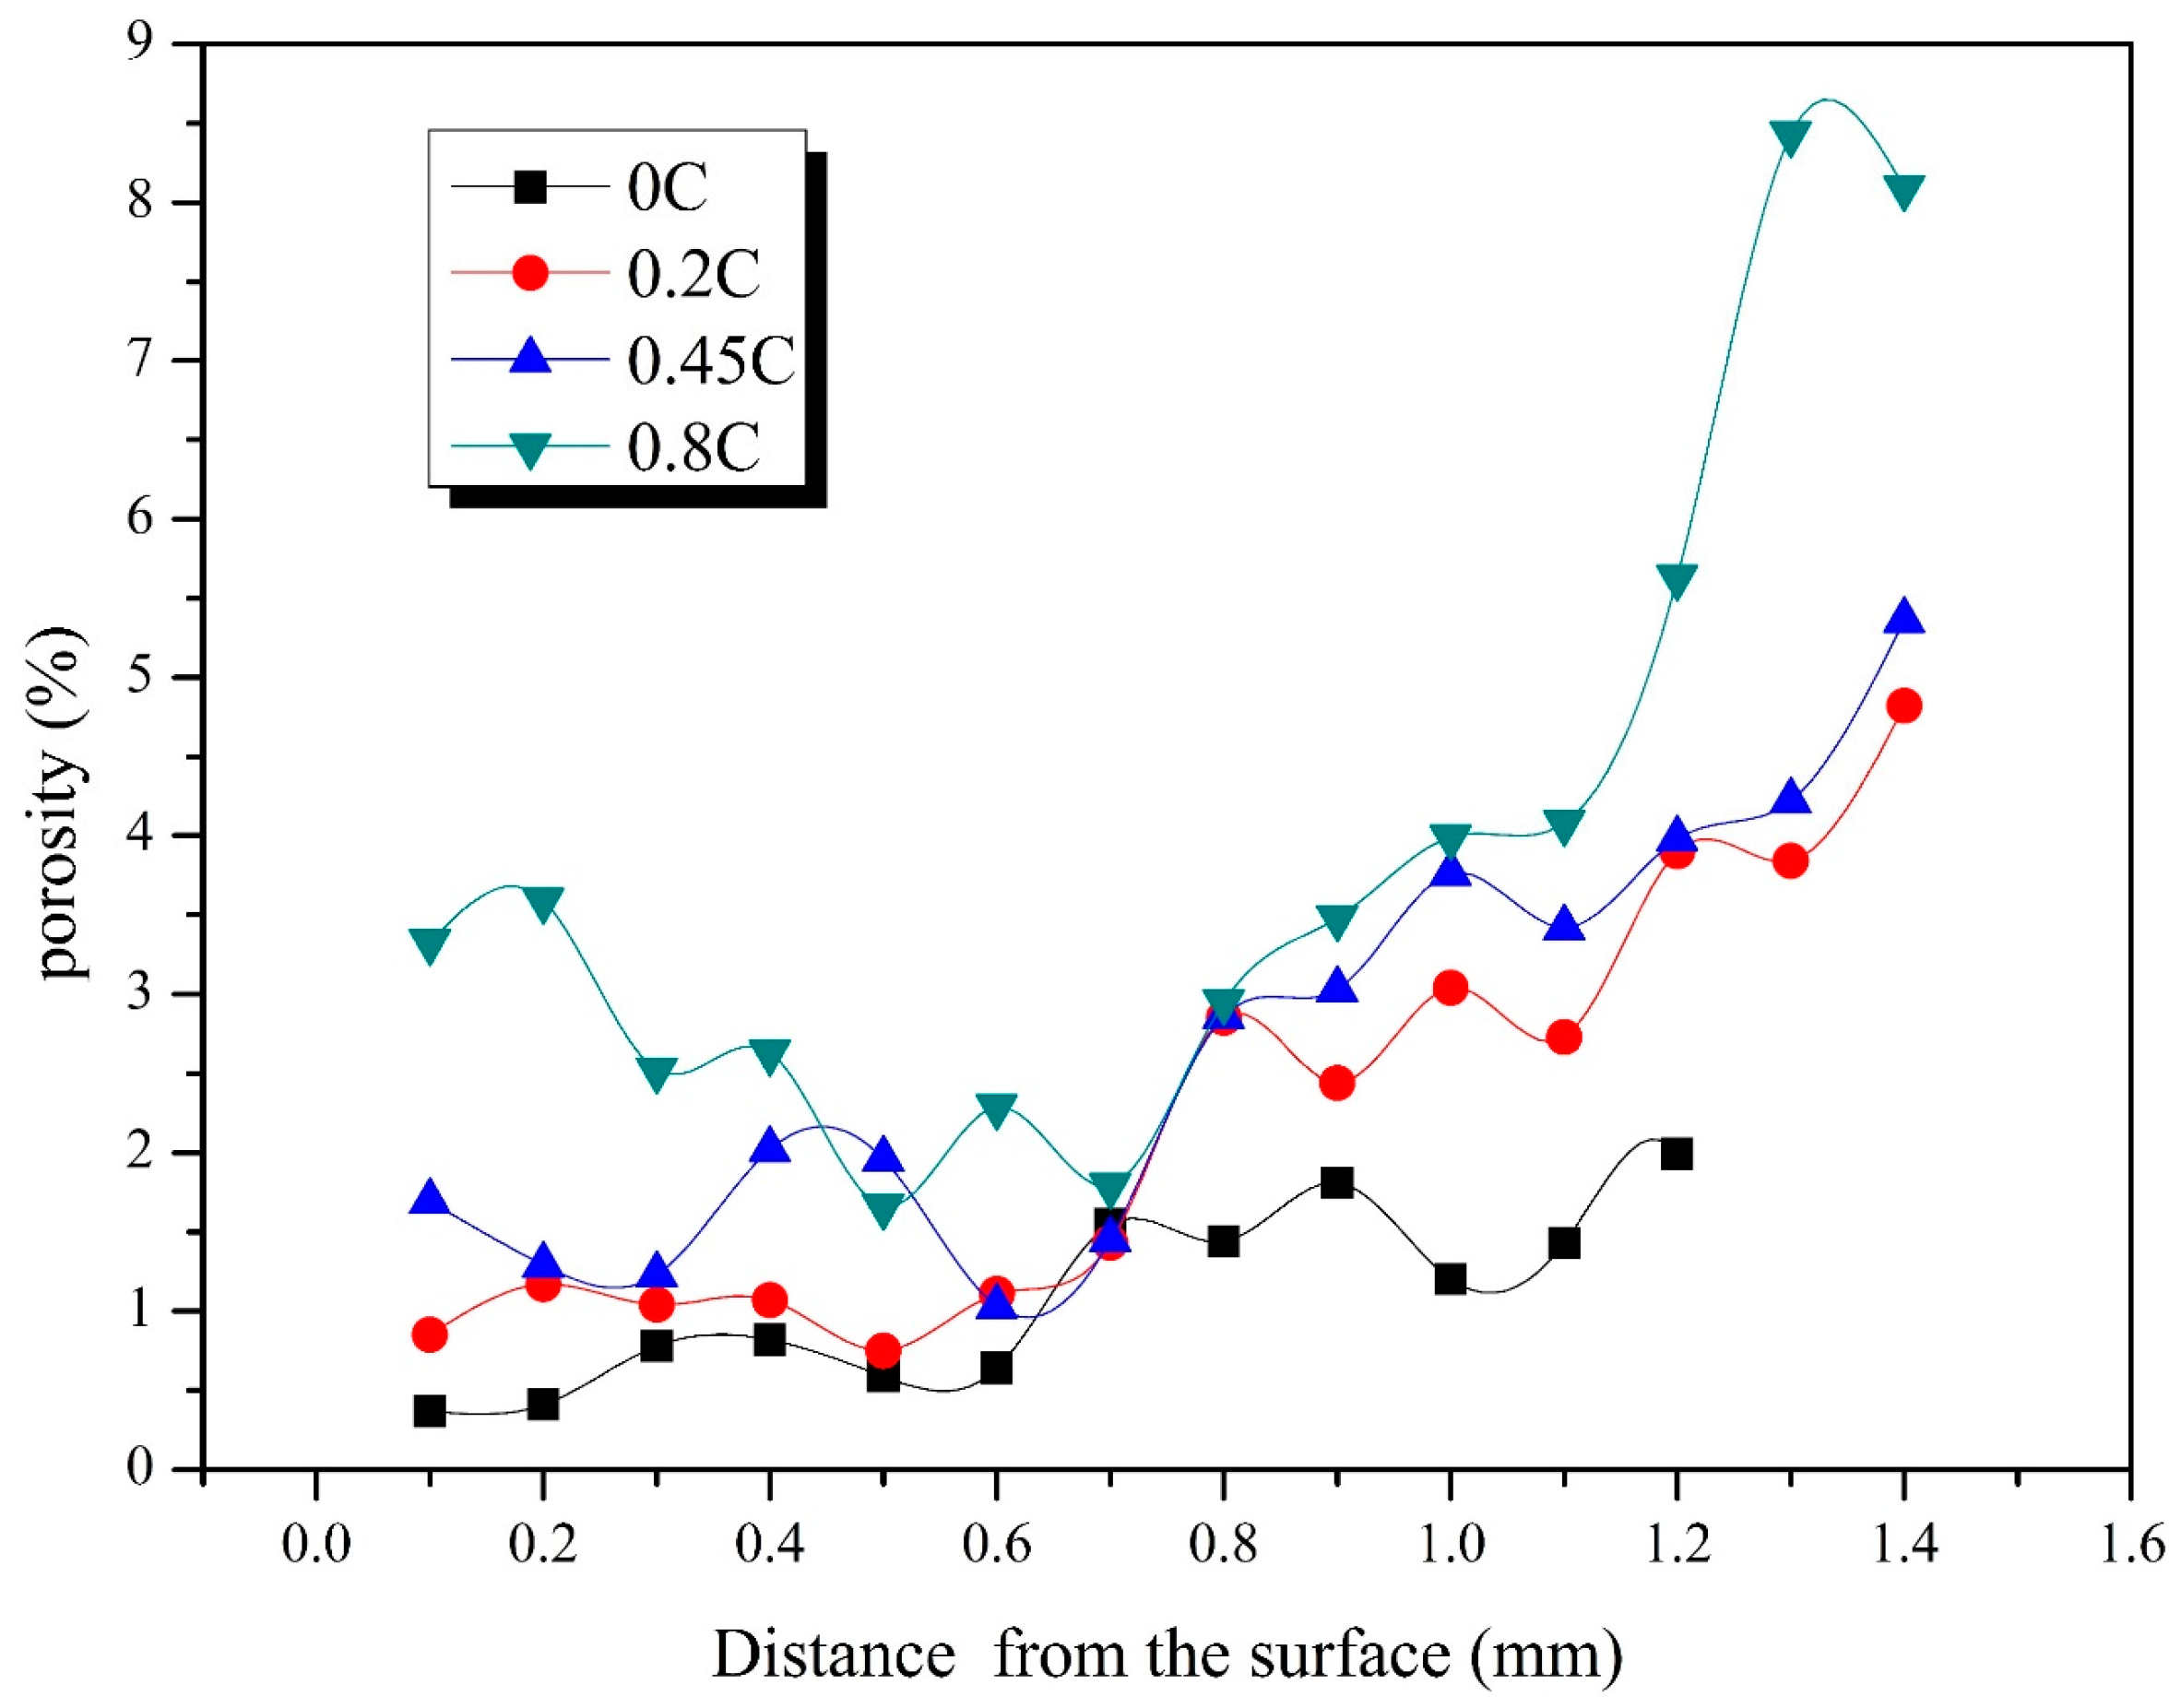
Figure 4.
Comparison of depth of the densified layer.

Figure 5.
Micro-hardness distributions on the cross-section in the surface layer.
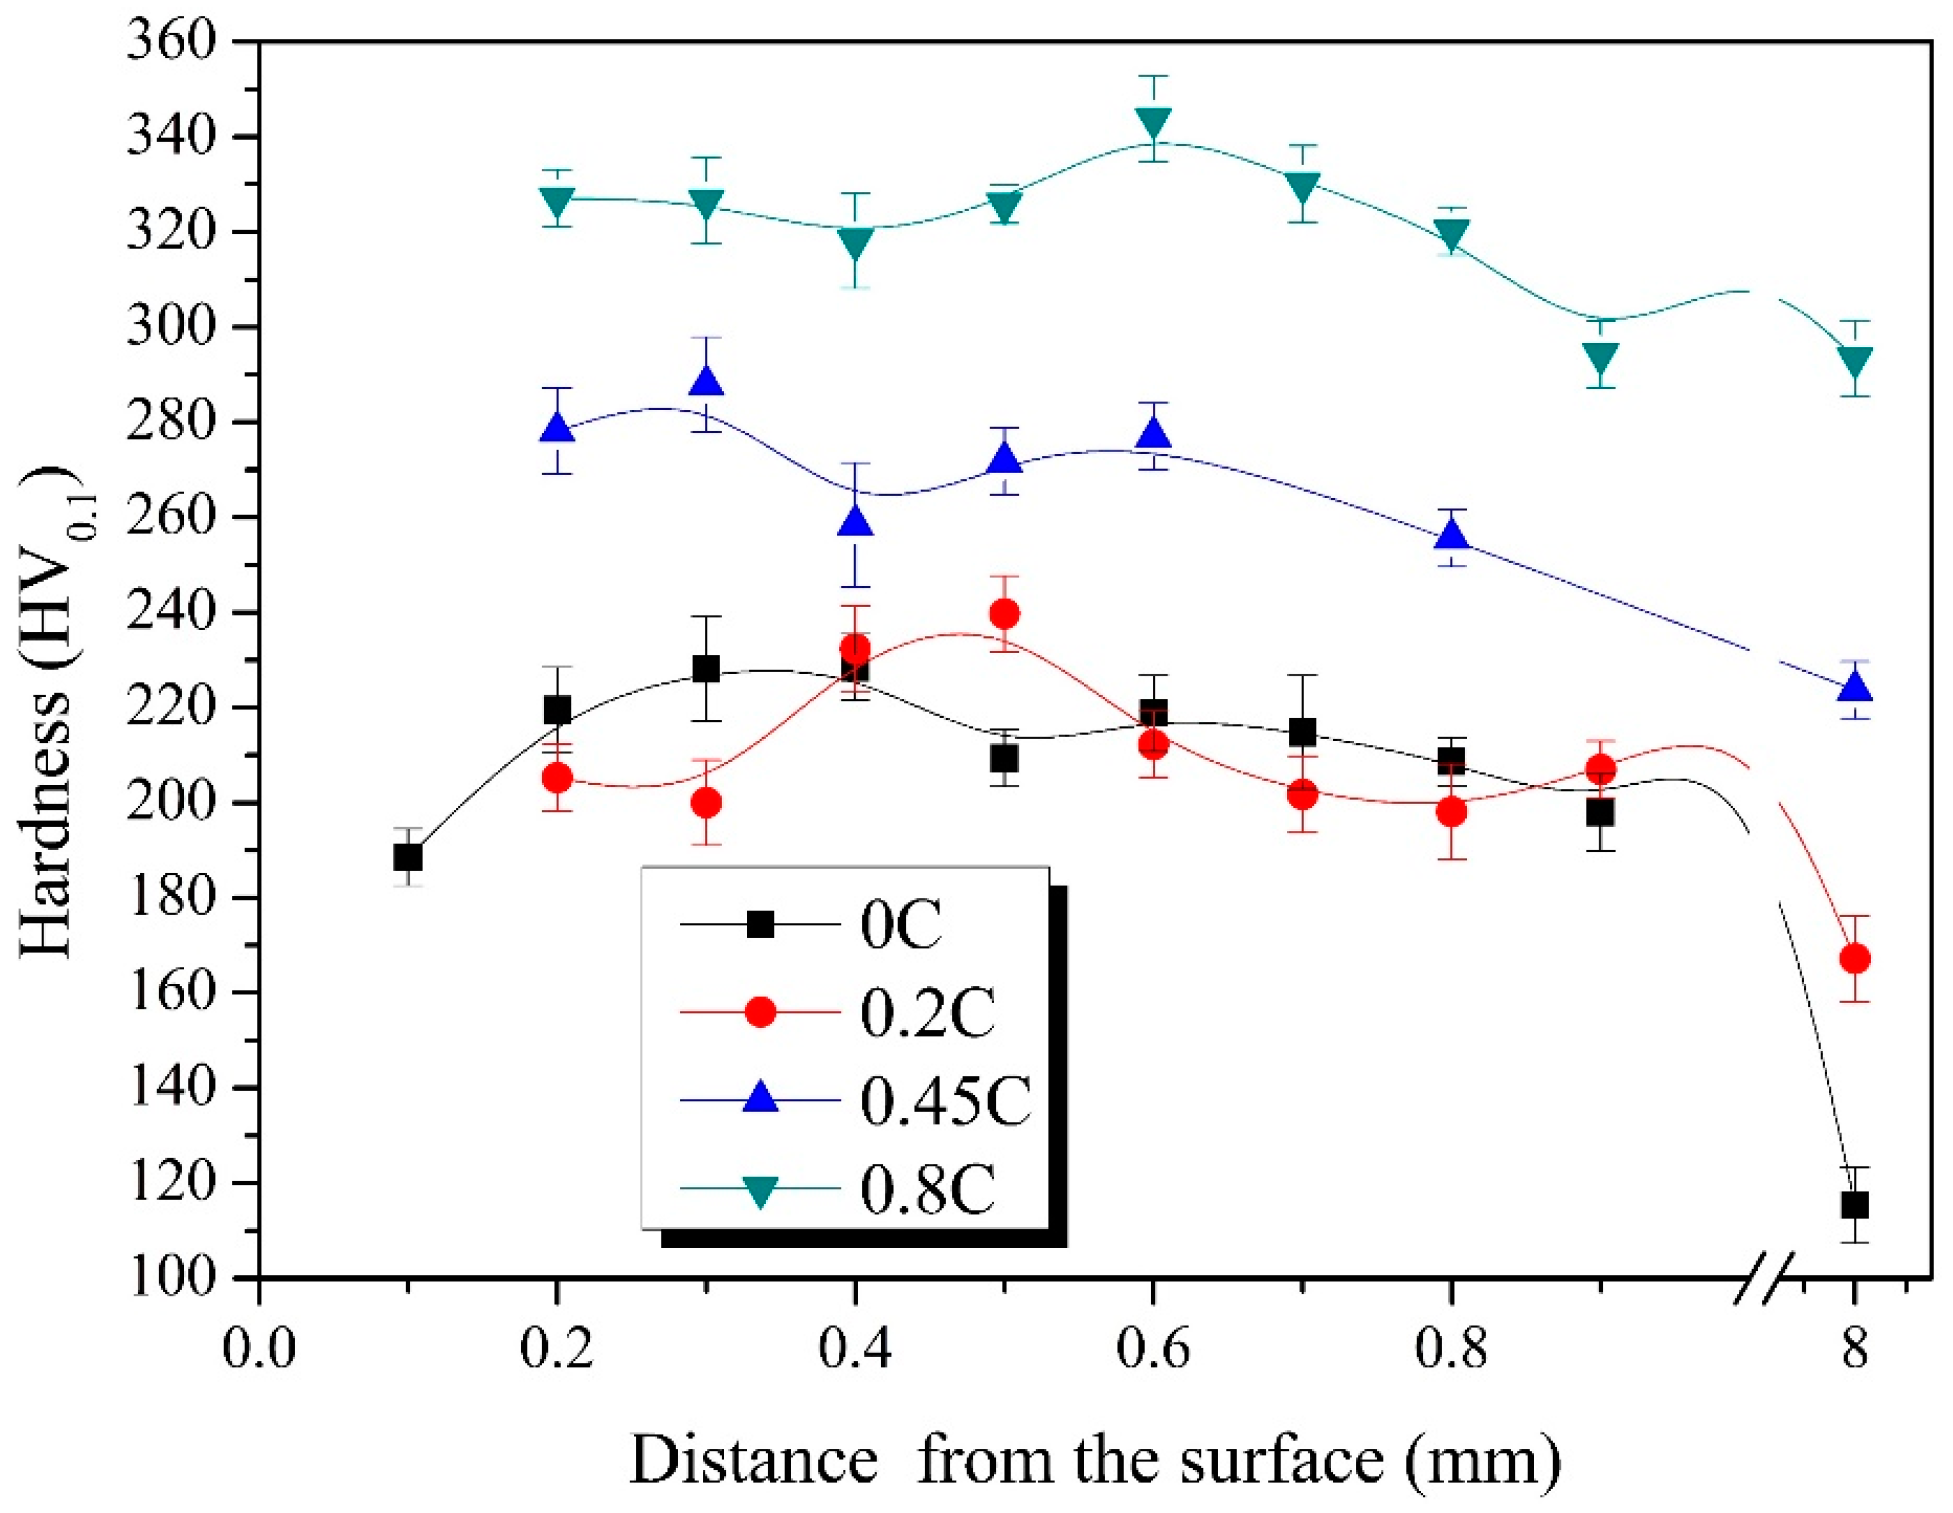
Figure 6.
Comparison of tooth flank roughness in materials with different carbon content.

Figure 7.
Metallographs of the densified layer in specimens of (a) 0 C; (b) 0.2 C; (c) 0.45 C; and (d) 0.8 C.
Figure 7.
Metallographs of the densified layer in specimens of (a) 0 C; (b) 0.2 C; (c) 0.45 C; and (d) 0.8 C.
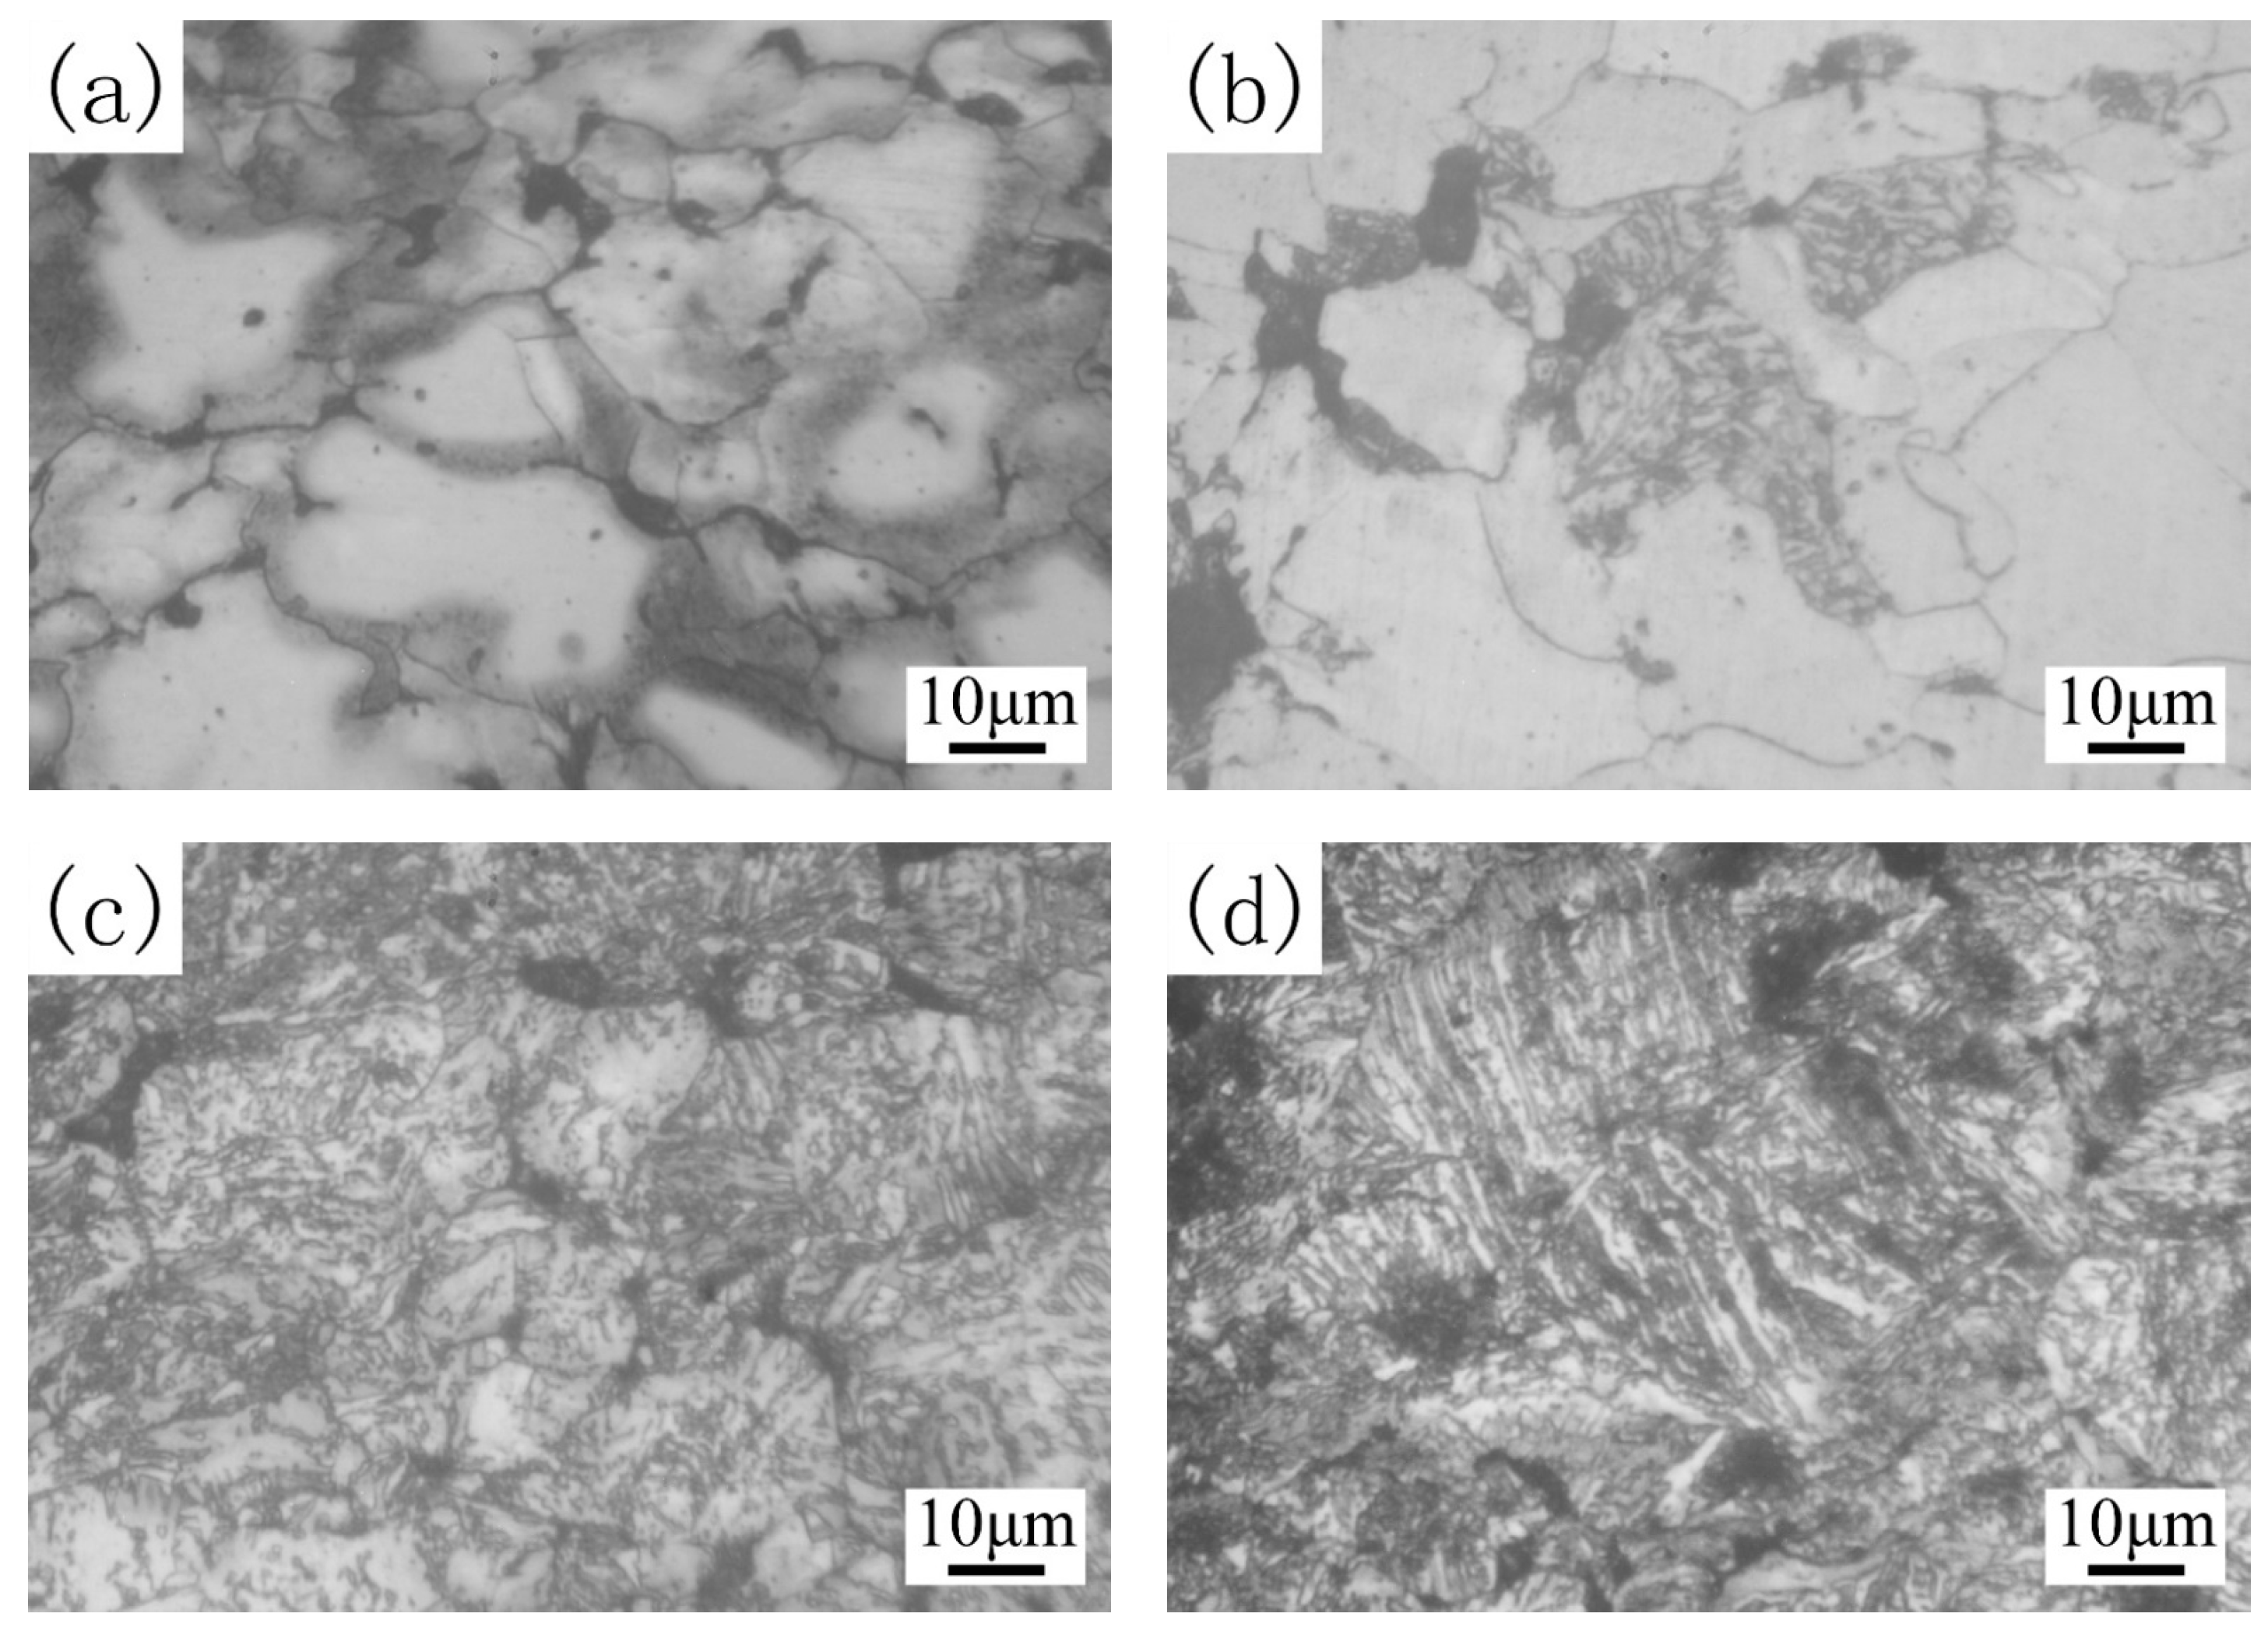
Figure 8.
SEM images of the densified layer in specimens of (a) 0 C; (b) 0.2 C; (c) 0.45 C; and (d) 0.8 C.
Figure 8.
SEM images of the densified layer in specimens of (a) 0 C; (b) 0.2 C; (c) 0.45 C; and (d) 0.8 C.

Figure 9.
Variation of penetration depth with scratch length.

Figure 10.
Variation of friction coefficient with scratch length.


Table 1.
Chemical composition (mass %) of powder metallurgy (PM) material.
| Specimen | Astaloy85Mo | Graphite | Cu |
|---|---|---|---|
| 0 C | Bal. | - | 1.4 |
| 0.2 C | 0.2 | 1.4 | |
| 0.45 C | 0.45 | 1.4 | |
| 0.8 C | 0.8 | 1.4 |
© 2018 by the authors. Licensee MDPI, Basel, Switzerland. This article is an open access article distributed under the terms and conditions of the Creative Commons Attribution (CC BY) license (http://creativecommons.org/licenses/by/4.0/).
Share and Cite
MDPI and ACS Style
Zhao, Y.; Chen, D.; Li, D.; Peng, J.; Yan, B. Effect of Carbon Content on the Properties of Iron-Based Powder Metallurgical Parts Produced by the Surface Rolling Process. Metals 2018, 8, 91. https://doi.org/10.3390/met8020091
AMA Style
Zhao Y, Chen D, Li D, Peng J, Yan B. Effect of Carbon Content on the Properties of Iron-Based Powder Metallurgical Parts Produced by the Surface Rolling Process. Metals. 2018; 8(2):91. https://doi.org/10.3390/met8020091
Chicago/Turabian StyleZhao, Yan, Di Chen, Dekai Li, Jingguang Peng, and Biao Yan. 2018. "Effect of Carbon Content on the Properties of Iron-Based Powder Metallurgical Parts Produced by the Surface Rolling Process" Metals 8, no. 2: 91. https://doi.org/10.3390/met8020091
Note that from the first issue of 2016, this journal uses article numbers instead of page numbers. See further details here.