Tribological Behavior of Nano-Sized SiCp/7075 Composite Parts Formed by Semisolid Processing

1
School of Materials Science and Engineering, Harbin Institute of Technology, Harbin 150001, China
2
School of Mechatronics Engineering, Harbin Institute of Technology, Harbin 150001, China
*
Author to whom correspondence should be addressed.
Metals 2018, 8(3), 148; https://doi.org/10.3390/met8030148
Submission received: 26 December 2017
/
Revised: 18 January 2018
/
Accepted: 17 February 2018
/
Published: 25 February 2018
(This article belongs to the Special Issue Semi-Solid Processing of Alloys and Composites)
Abstract
:The tribological behavior of the rheoformed and thixoformed nano-sized SiCp/7075 composite parts is investigated. The semisolid stirring temperature has a little influence on the friction coefficient and wear resistance of the rheoformed composite parts. As for the thixoformed composite parts, the average value of the steady-state coefficient of friction increases firstly and then decreases with increasing reheating temperature. Higher wear resistance is achieved at a reheating temperature of 580 °C. The average value of the steady-state friction coefficient of the rheoformed composite parts varies from 0.37 to 0.45 upon applied loads of from 20 to 50 N. Weight loss increases slightly upon an increase of applied load from 20 to 40 N. An applied load of 50 N leads to a significant increase of the weight loss. The wear rate decreases firstly and then increases with increasing applied load. As for the thixoformed composite part, the average value of the steady-state friction coefficient and the weight loss decreased with an increasing applied load. However, the wear rate decreases firstly with increasing applied load and then increases. As for the rheoformed composite part, the average value of the steady-state friction coefficient decreases firstly and then increases a little with increasing sliding velocity. Weight loss and wear rate show a first increase and a followed decrease with increasing sliding velocity. As for the thixoformed composite part, the average value of the steady-state friction coefficient shows a decrease with increasing sliding velocity. Weight loss and wear rate exhibit, at first, an increase, and then a decrease with increasing sliding velocity. The average friction coefficient varies from 0.4 to 0.44 with increasing volume fraction of SiC. Weight loss and wear rate decrease with increasing volume fraction of SiC. An increase in dislocation density around the nano-sized SiC particles and the mismatch of the coefficient of thermal expansion (CTE) between 7075 matrix and nano-sized SiC particles during solidification improve the wear resistance of the composite. The dominant wear mechanisms of the rheoformed and thixoformed composite parts are adhesive wear, abrasive wear and delamination wear.
1. Introduction
Particle reinforced aluminum matrix composite (PRAMC) has received much attention because of their improved specific strength and modulus, good wear resistance, and modified thermal properties [1,2,3,4]. Wear behavior is an important evaluation parameter of the PRAMC. A large amount of research has been focused on tribological behavior (or wear behavior) of the PRAMC. Abdollahi et al. [5] investigated dry sliding tribological behavior of Al2024-5 wt. % B4C nanocomposite fabricated by mechanical milling and hot extrusion and found that mechanical milling and adding B4C increased the wear resistance of the nanocomposite. Kumar et al. [6] reported dry sliding wear behavior of stir cast AA6061-T6/AlNp composite and developed a regression model predicting wear rate. The results showed that wear rate of cast AA6061/AlNp composite decreased with an increase in the mass fraction of AlN particles, and the regression model could predict wear rate at a 95% confidence level. SiCp/Al-Cu matrix composites were produced by the direct squeeze casting (i.e., liquid aluminum melt is infiltrated into a preform of SiC particles under pressure) method, and their dry sliding properties were examined [7]. It was concluded that the friction coefficient decreased with increasing applied load and sliding velocity. Abrasive wear properties of SiC reinforced aluminum matrix composite produced by compocasting (i.e., casting of a stirred mixture of liquid aluminum and SiC particles) were studied [8]. The results revealed that the matrix hardness had a strong influence on the dry sliding wear behavior of the composite, and the lowest wear rate occurred in the composite with the lowest matrix hardness. Tribological behavior of composites with different aluminum matrix fabricated by squeeze cast was reported [9]. The results revealed that the matrix alloy had no remarkable influence on the tribological performance of the composites at low test loads less than 3 N.
Semisolid processing (SSP) has been widely used in automotive and 3C fields since it was developed by M. C. Flemings and his coworker [10,11,12]. Two typical technical routes such as rheoforming and thixoforming are included in SSP [13,14,15,16,17]. Rheoforming involves direct forming of semisolid slurries with spheroidal solid grains and liquid phase. In thixoforming process, semisolid billet obtained via solidifying semisolid slurries undergoes reheating and forming. SSP has shown an apparent advantage in dispersing the ceramic reinforcements of composite [18,19]. It was illustrated that SSP was suitable for fabricating PRAMC [20,21]. Therefore, some research has focused on wear properties of the PRAMC fabricated by SSP. Mazahery and Shabani [22] investigated the wear behavior of the sol-gel coated B4C particle reinforced A356 matrix composites and concluded that the wear rate of the composites reinforced with coated B4C was less than that of the matrix alloy and decreased with increasing volume fraction of B4C particles. The research results of wear behavior of the rheocasted SiCp/Al metal matrix composites (MMC) showed that the wear rate of the 11% SiC MMC was higher than that of the 50% SiC MMC [23]. The A356/Al2O3 metal matrix composites were fabricated by conventional stirring and semisolid processing [24]. It was concluded that the volume loss of the composites fabricated by semisolid processing was lower than that of the composites fabricated by conventional casting. The friction and wear of the aluminum alloy reinforced by TiO2 particles fabricated by semisolid stirring was mentioned by Sarajan [25]. The results showed that accumulated volume loss was significantly higher when wear debris was removed by camel brush during dry sliding wear.
The aluminum matrix composite (AMC), reinforced with nano-sized ceramics, has received much attention due to high temperature creep resistance and fatigue life [26,27,28,29]. However, research on the wear behavior of the AMC reinforced with nano-sized ceramic particles was little reported. Therefore, the present study aims to investigate the wear behavior of nano-sized SiCp/7075 composite parts formed by SSP and find the influence laws of the process parameters such as the volume fraction of SiC particles, and the applied load and sliding velocity on the wear behavior of the nanocomposite parts.
2. Materials and Methods
2.1. Fabrication of the Rheoformed and Thixoformed Nanocomposite Parts
Wrought 7075 aluminum alloys are used as matrix material of the composite. Its chemical composition content contained 6.0 wt. % Zn, 2.3 wt. % Mg, 1.56 wt. % Cu, 0.26 Si wt. %, 0.27 wt. % Mn, 0.17 wt. % Cr, 0.03 wt. % Ti and balance of Al. Nano-sized SiC particles with an normalized average size of 80 nm supplied by Xuzhou Jiechuang New Materials Co. Ltd of China (Xuzhou, China) are used as reinforcement of the composite [30]. The solidus of 546 °C and liquidus of 637 °C temperatures were achieved by using the Differential Thermal Analyzer (DTA) (Mettler Toledo, Zurich, Switerland) [30]. DTA data were converted into DSC (differential scanning calorimetry) data and then gave a curve of solid fraction vs temperature by integrating the DSC data. The semisolid slurry of nano-sized SiCp/7075 (this denotes 7075 aluminum matrix composite reinforced by nano-sized SiC particles) composite was fabricated by ultrasonic-assisted semisolid stirring (UASS) method [30,31]. 7075 aluminum alloy was melt and held for 10 min at 650 °C. The nano-sized SiC particles were added into the melt. The melt with added nano-sized SiC particles was treated for 10 min via a ultrasonic device with a 2 kw power at a frequency of 20 kHz. Then the 7075 melt was cooled down while stirring to the required semisolid temperatures and stirred isothermally for the required times in order to obtain semisolid slurries. The required temperatures and times were shown in Table 1. Some of the semisolid slurries were directly used as rheoforming the cylinder parts of the composite. The other semisolid slurries were rheoformed into a cylindrical semisolid billet with a diameter of 70 mm and height of 58 mm. These cylindrical semisolid billets were reheated to given semisolid temperatures, soaked and then used as thixoforming cylinder parts (Table 1).
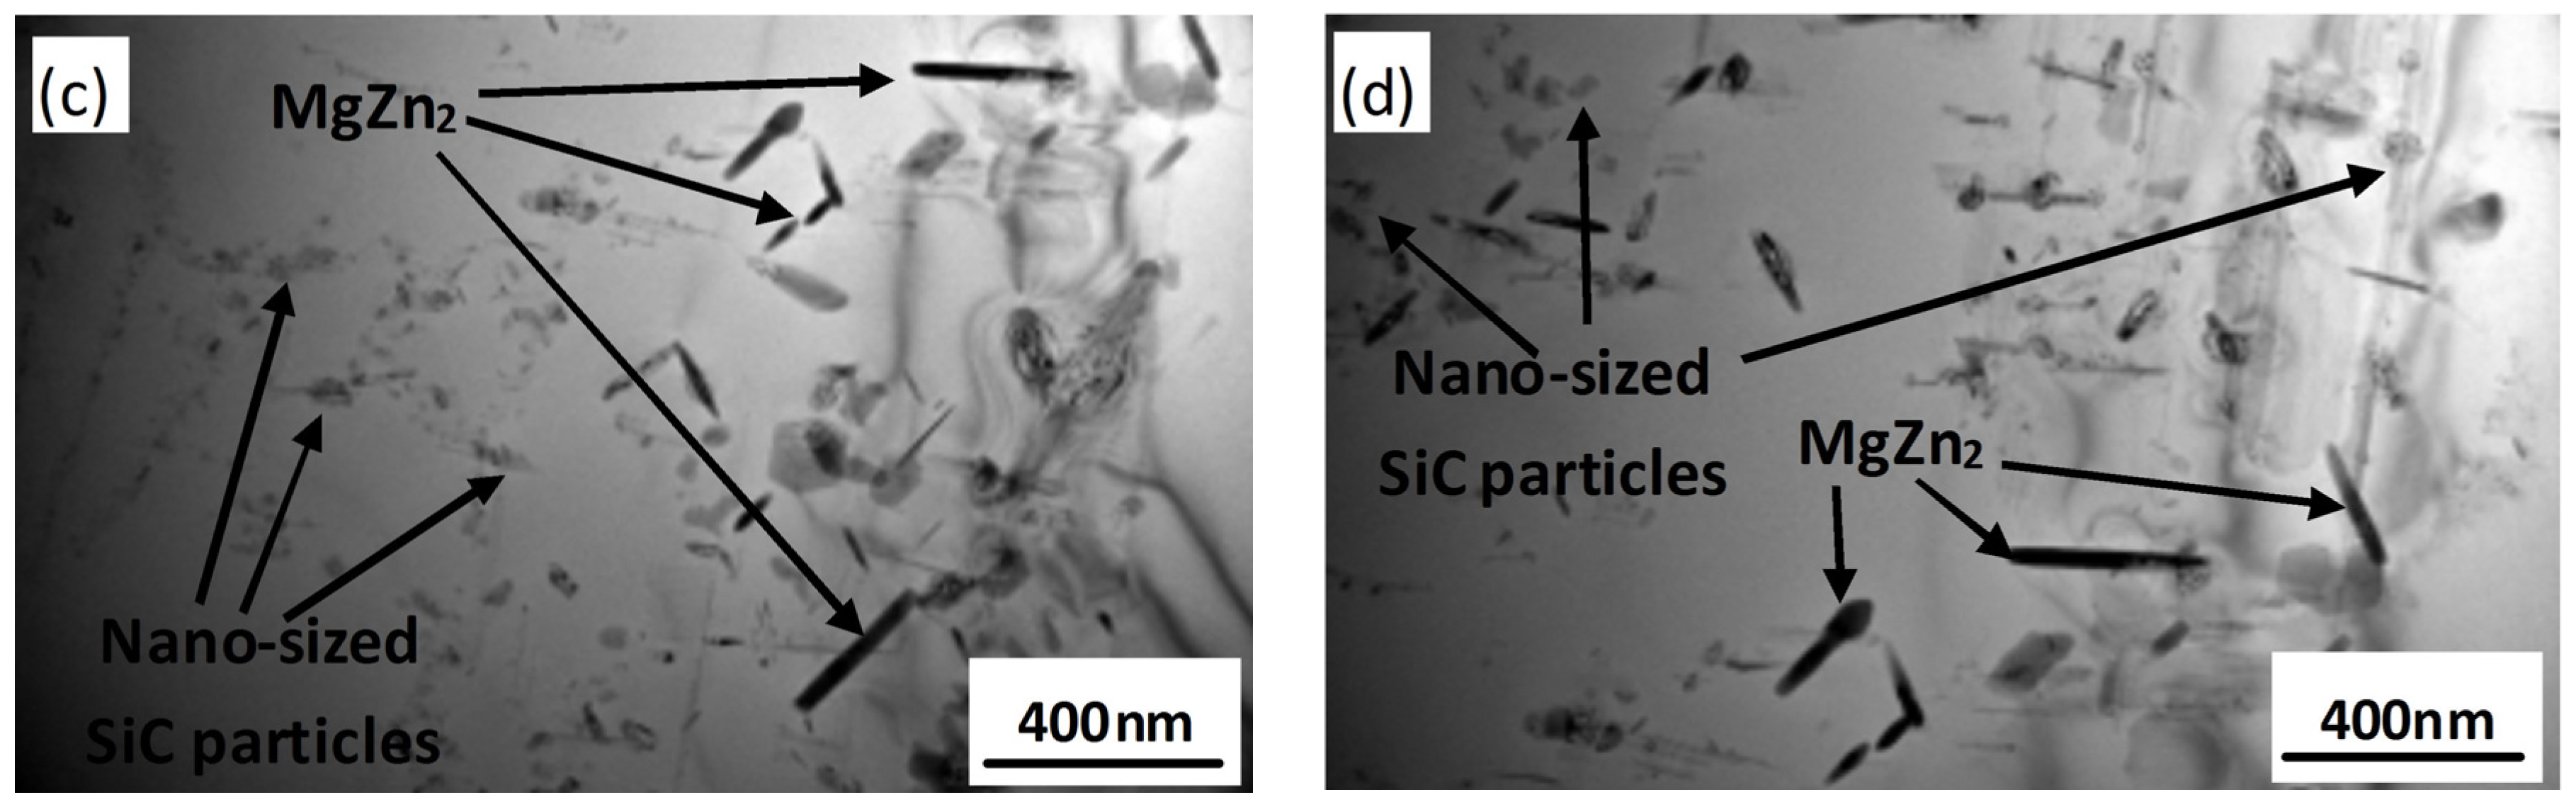
In the rheoforming process, a die was firstly preheated to 300 °C and then the semisolid slurries were carried into the die cavity. The upper die moved downwards and kept closed with lower die. The semisolid slurries were filled into the die cavity and rheoformed into the final composite cylinder part under a pressure of 398 MPa. In the thixoforming process, the reheated semisolid billet was carried into the die cavity with a preheated termperature of 400 °C. Then the upper die moved down and kept closed with the lower die. The reheated semisolid billet was filled into the die cavity and thixoformed into the final composite cylinder part under a pressure of 398 MPa. For the rheoformed cylinder parts, the process parameters included the semisolid stirring temperatures of 615, 620, 625 and 628 °C (corresponding to solid fractions of 0.46, 0.35, 0.30, 0.23 [30]), the stirring time of 20 min, the ultrasonic treatment time of 10 min and the volume fractions of 0, 0.5, 1.0, 1.5 and 2%. For the thixoformed cylindrical parts, the process parameters involved the semisolid stirring of 620 °C, the stirring time of 20 min, the ultrasonic treatment time of 10 min, the soaking time of 20 min, the volume fractions of 1.5% and reheating temperatures of 580, 590, 600 and 610 °C. The micrograph of the rheoformed and thixoformed parts were presented in Figure 1. As shown in Figure 1, the solid grains of the rheoformed composite cylinder part exhibited smaller deformation along flowing direction as compared to the thixoformed composite part. The TEM (transmission electron microscope) images of the rheoformed and thixoformed parts exhibited a uniform distribution of nano-sized SiC particles in the 7075 alloy matrix. It was attribited to double effect of the acoustic and cavitation created by ultrasonic wave and controllable viscosity of semisolid slurry [31,32]. In addition, it can be noted that needlelike second phase η-MgZn2 existed in the microstructure of the rheoformed and thixoformed composite parts.
2.2. Dry Sliding Wear Tests of the Rheoformed and Thixoformed Parts
The dry sliding wear tests were carried out on a pin-on-disc wear-testing apparatus. The disc was made from GCr15 steel (Chinese National Standard GB/T18254-2016), which exhibited good quenching degree and high hardness (HRC 62) due to containing a large amount of chromium element [33]. Its chemical composition content contained 0.95–1.05 wt. % C, 0.25–0.45 wt. % Mn, 0.15–0.35 wt. % Si, 1.4–1.65 wt. % Cr, less than 0.02 wt. % S, less than 0.025 wt. % P, less than 0.1 wt. % Mo, less than 0.25 wt. % Ni, less than 0.25 wt. % Cu and balance of iron. After the rheoformed and thixoformed cylindrical parts were formed, they were machined into the samples with dimensions of ф9 × 20 mm for the dry sliding wear tests. The diameter of the disc was 100 mm. The radius of the contact track of the dry slide samples used for their experiments was 27 mm. The Ra values of the sample and disc were 3.2 μm. Seven dry sliding wear tests were performed in these experiments, as shown in Table 1.The sample has the same section area (i.e., same contact area between pin sample and wear disc) so that applying force has the same effect of applying force per unit area. All the samples were performed under a wear distance of 1000 m. All dry sliding tests were performed under unidirectional sliding. 2.7 g/cm3 was used as the density value of the 7075 aluminum alloy samples in order to calculate the wear volume. The density of the composite sample was determined by Archimedes drainage in order to calculate the wear volume of the composite sample. The density values of the composite sample with 0.5, 1.0, 1.5 and 2% SiC were 2.712, 2.716, 2.721 and 2.726 g/cm3.
At the end of each wear test, the surface of the disc was washed by alcohol. The samples were weighed carefully and the weight loss was recorded and used as calculating wear rate of the composite parts. In order to investigate the surface morphology of worn samples and the wear mechanism, the worn surface was examined by scanning electron microscopy (SEM) (FEI, Hillsboro, OR, USA) with an energy dispersive X-ray spectrometer (EDS) (FEI, Hillsboro, OR, USA).
3. Results and Discussion
3.1. Influence of Semisolid Stirring Temperature on Tribological Behavior of Rheoformed Composite Parts
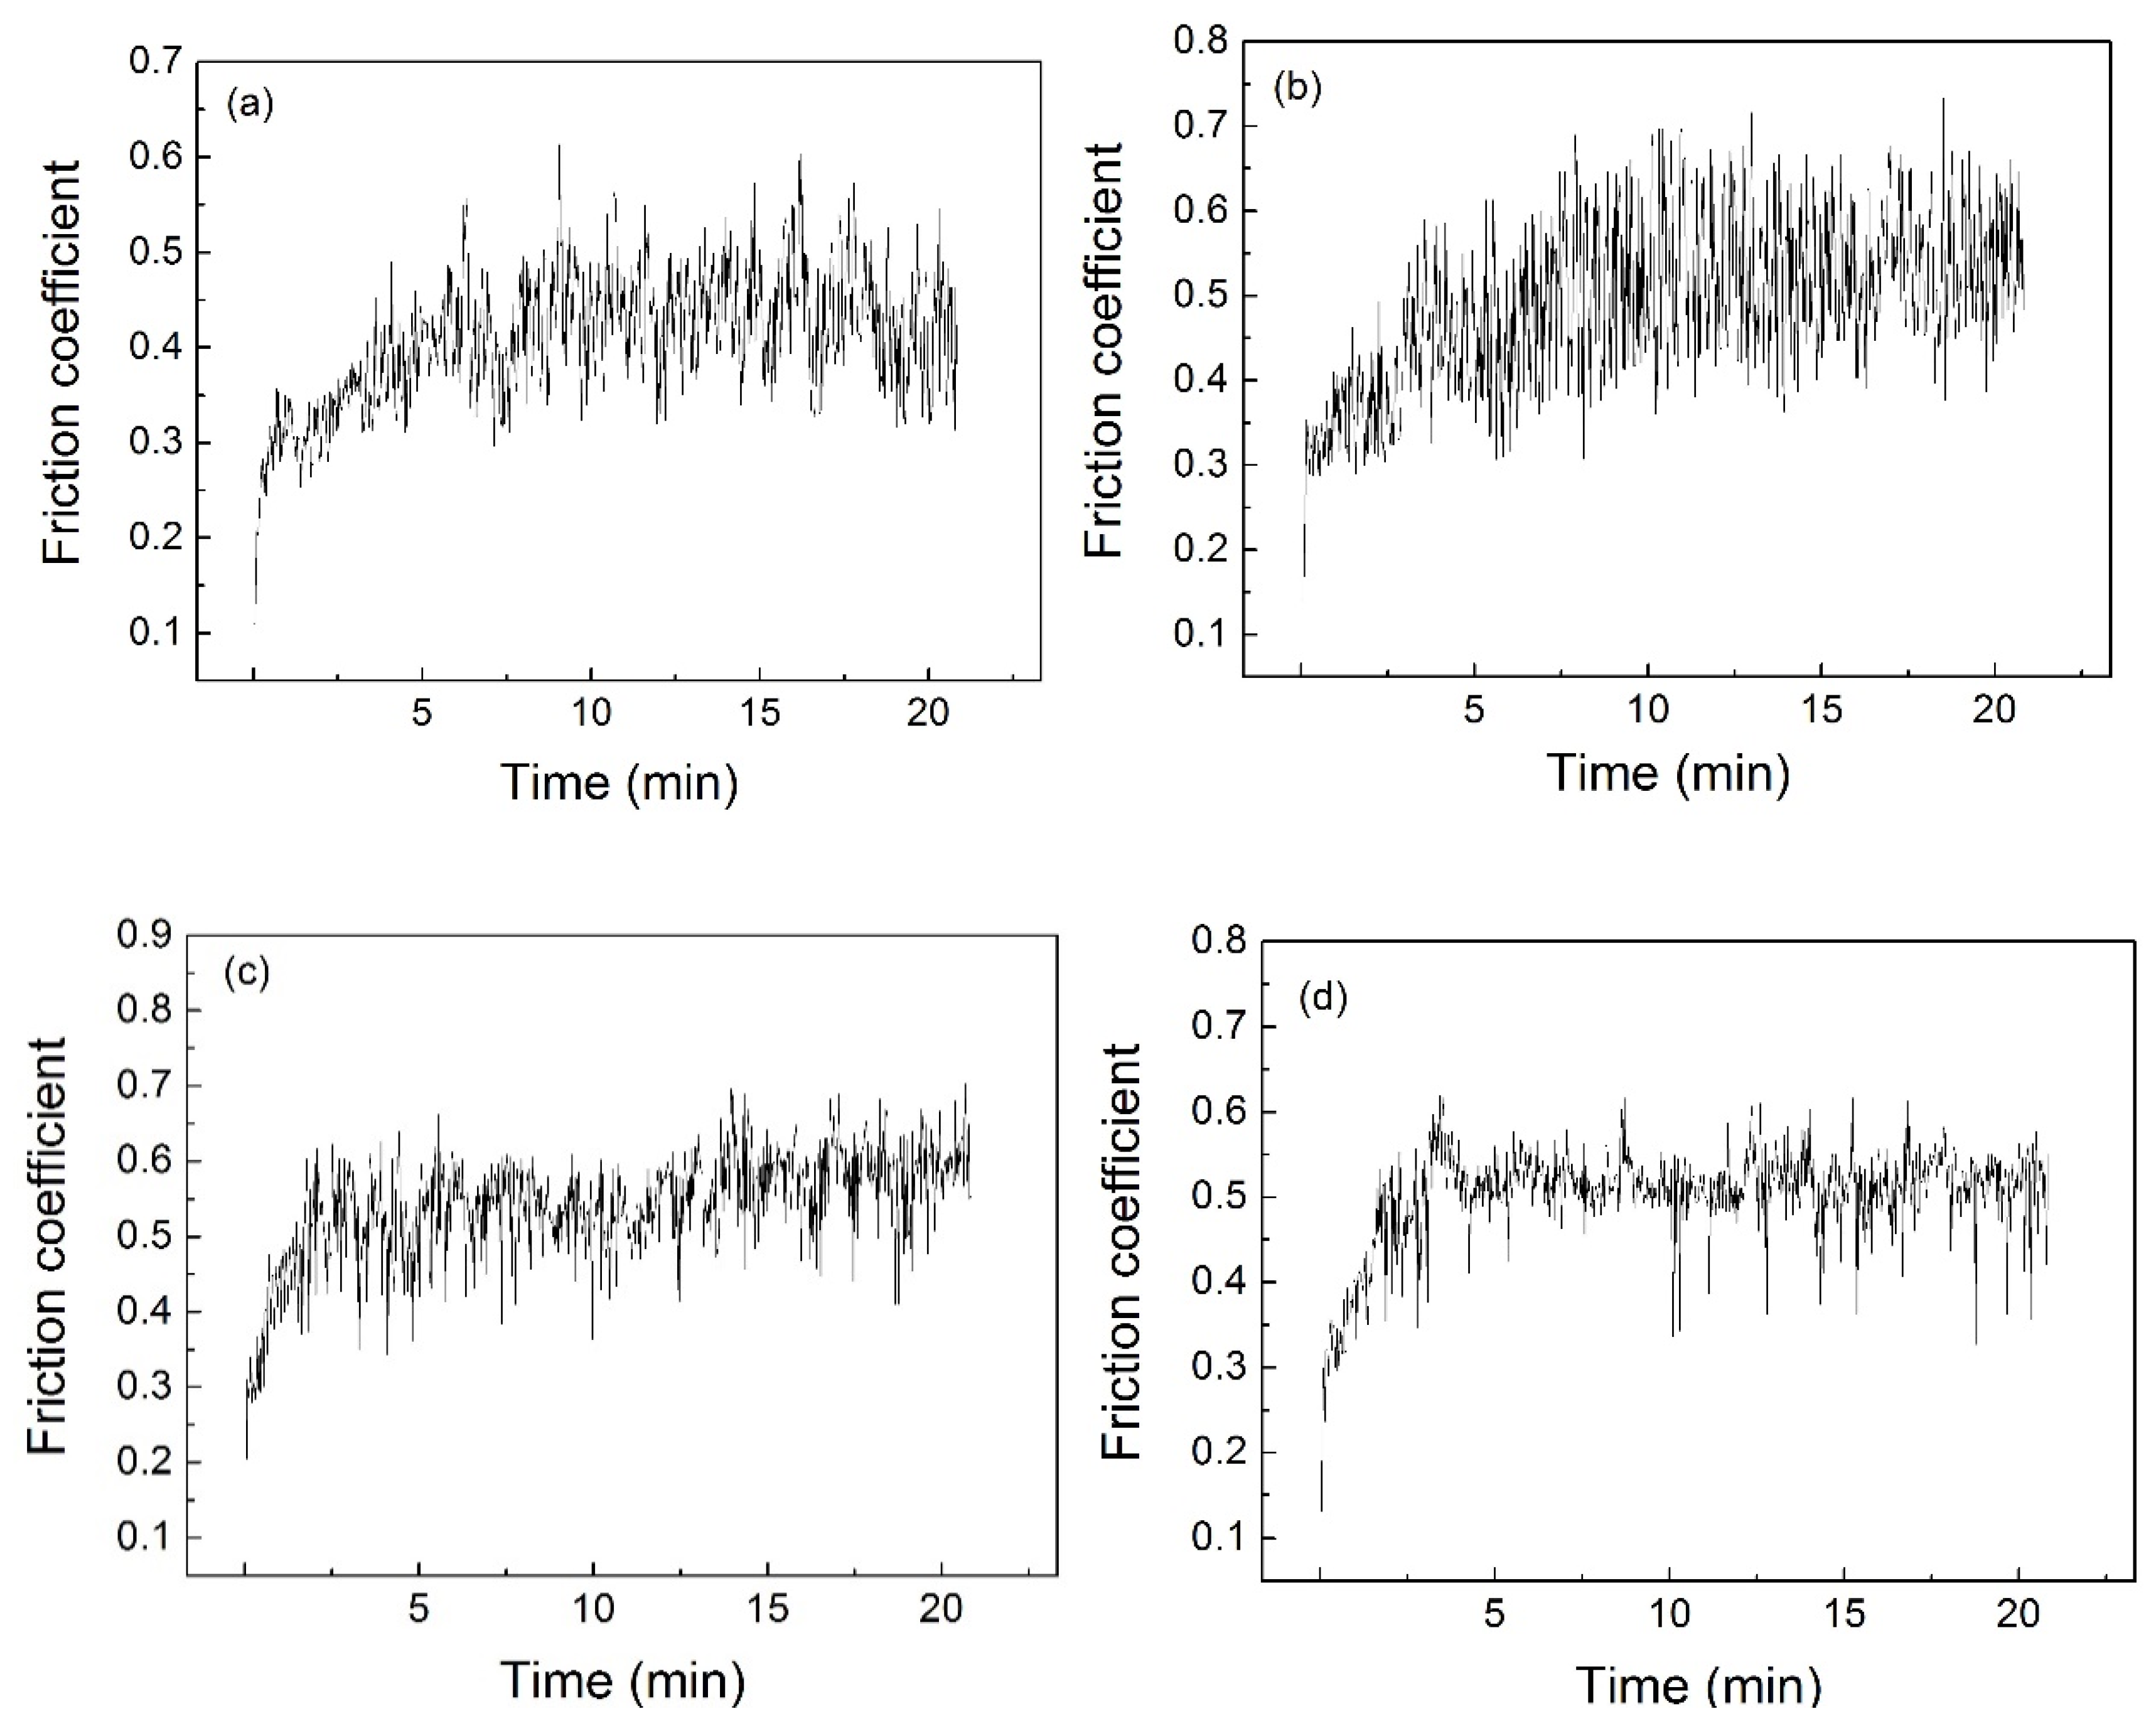
Figure 2 shows friction coefficient, weight loss, and wear rate of the rheoformed composite parts at different semisolid stirring temperatures. As indicated in Figure 2a–d, friction coefficient of the rheoformed composite parts at different semisolid stirring temperatures firstly increased significantly and then kept a fluctuation with increasing wear time. After the running-in period, the average value of the steady-state coefficient of friction was calculated as can be seen in Figure 2e. It is noticed that average value of friction coefficient varies from 0.42 to 0.46. It illustrates that semisolid stirring temperature has a little influence on friction of the rheoformed composite parts. As shown in Figure 2f, the weight loss varies from 2.84 × 10⁻³ g to 3.15 × 10⁻³ g. The wear rate was determined as defined by Equation (1):
in which W is the wear volume (mm3 ), FN is the applied load (N), and S is the sliding distance (m), as reported by Zhang and Wang [34]. Wear rate is determined according to the data of weight loss (Figure 2g).
The wear rate of the rheoformed composite part at different semisolid stirring temperatures varies from 3.48 × 10⁻⁵ to 3.86 × 10⁻⁵ mm3/m·N. Stirring temperature affects the solid fraction of semisolid slurries and further determines the deformation degree of solid grains rheoforming process. However, the deformation degree of solid grain during the rheoforming is obviously lower than that of thixoformed parts. Hence, the results of Figure 2f,g illustrate that semisolid stirring temperature has a little effect on the wear resistance of the rheoformed composite parts.
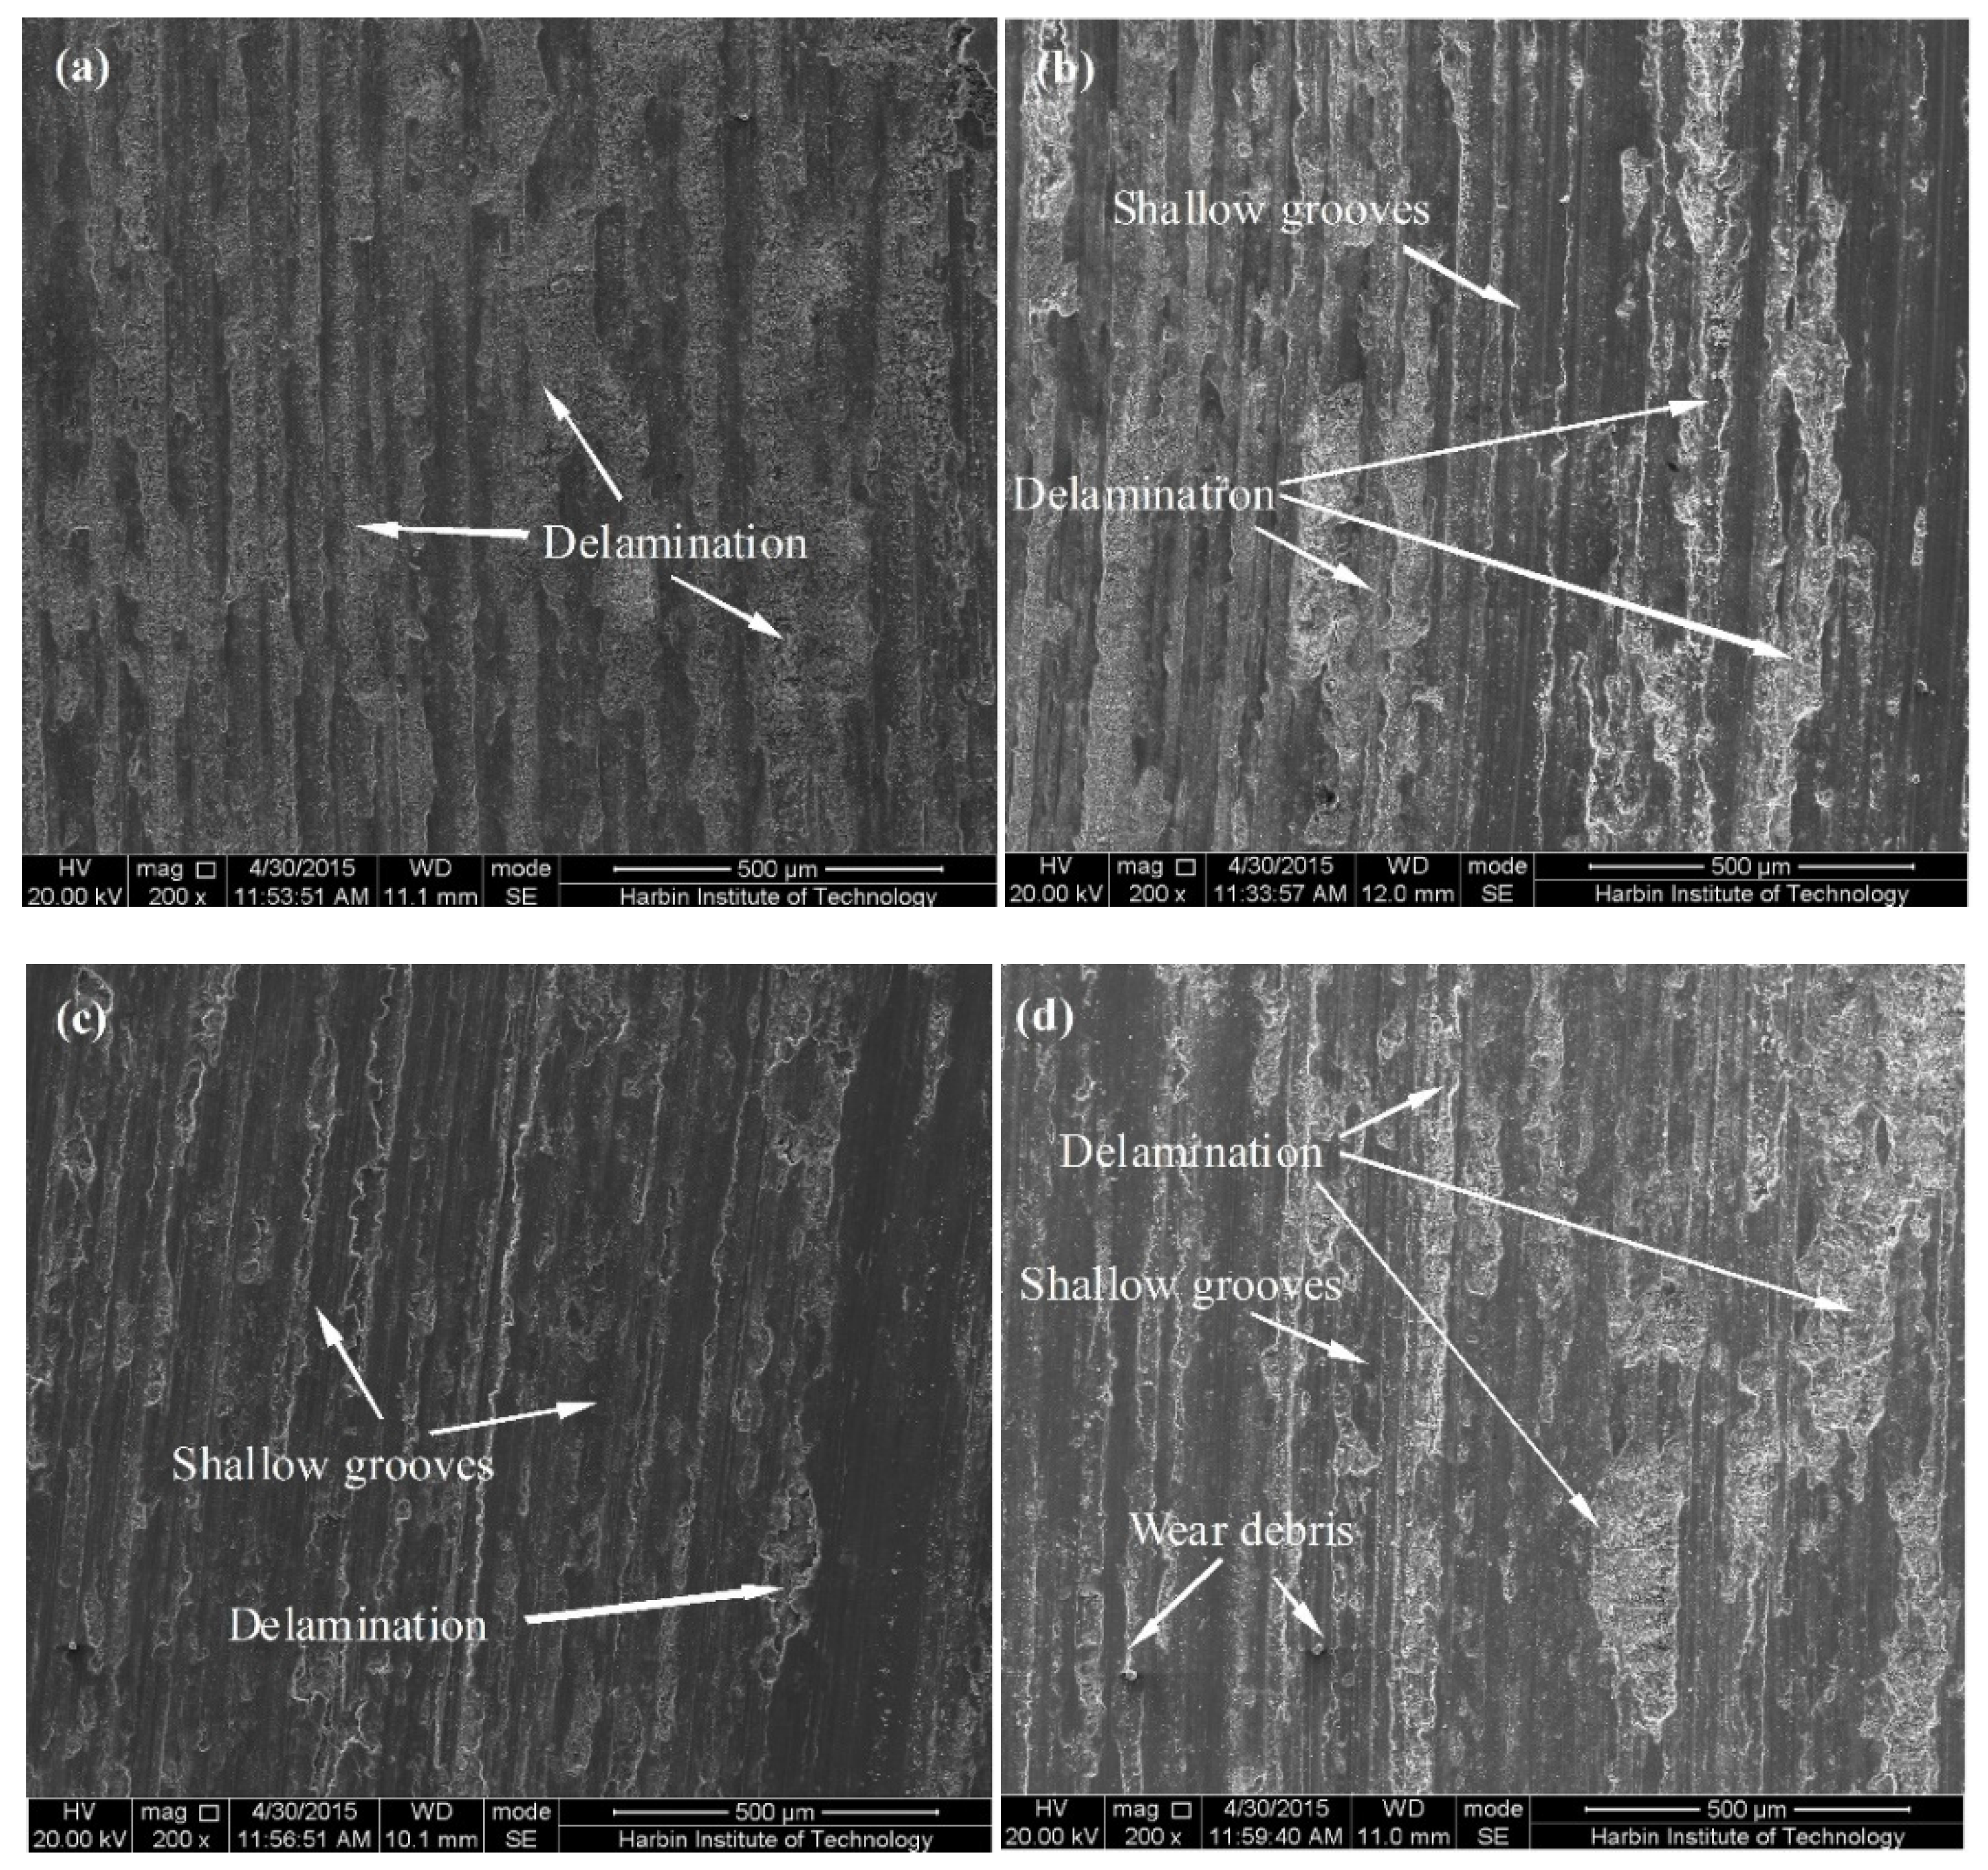
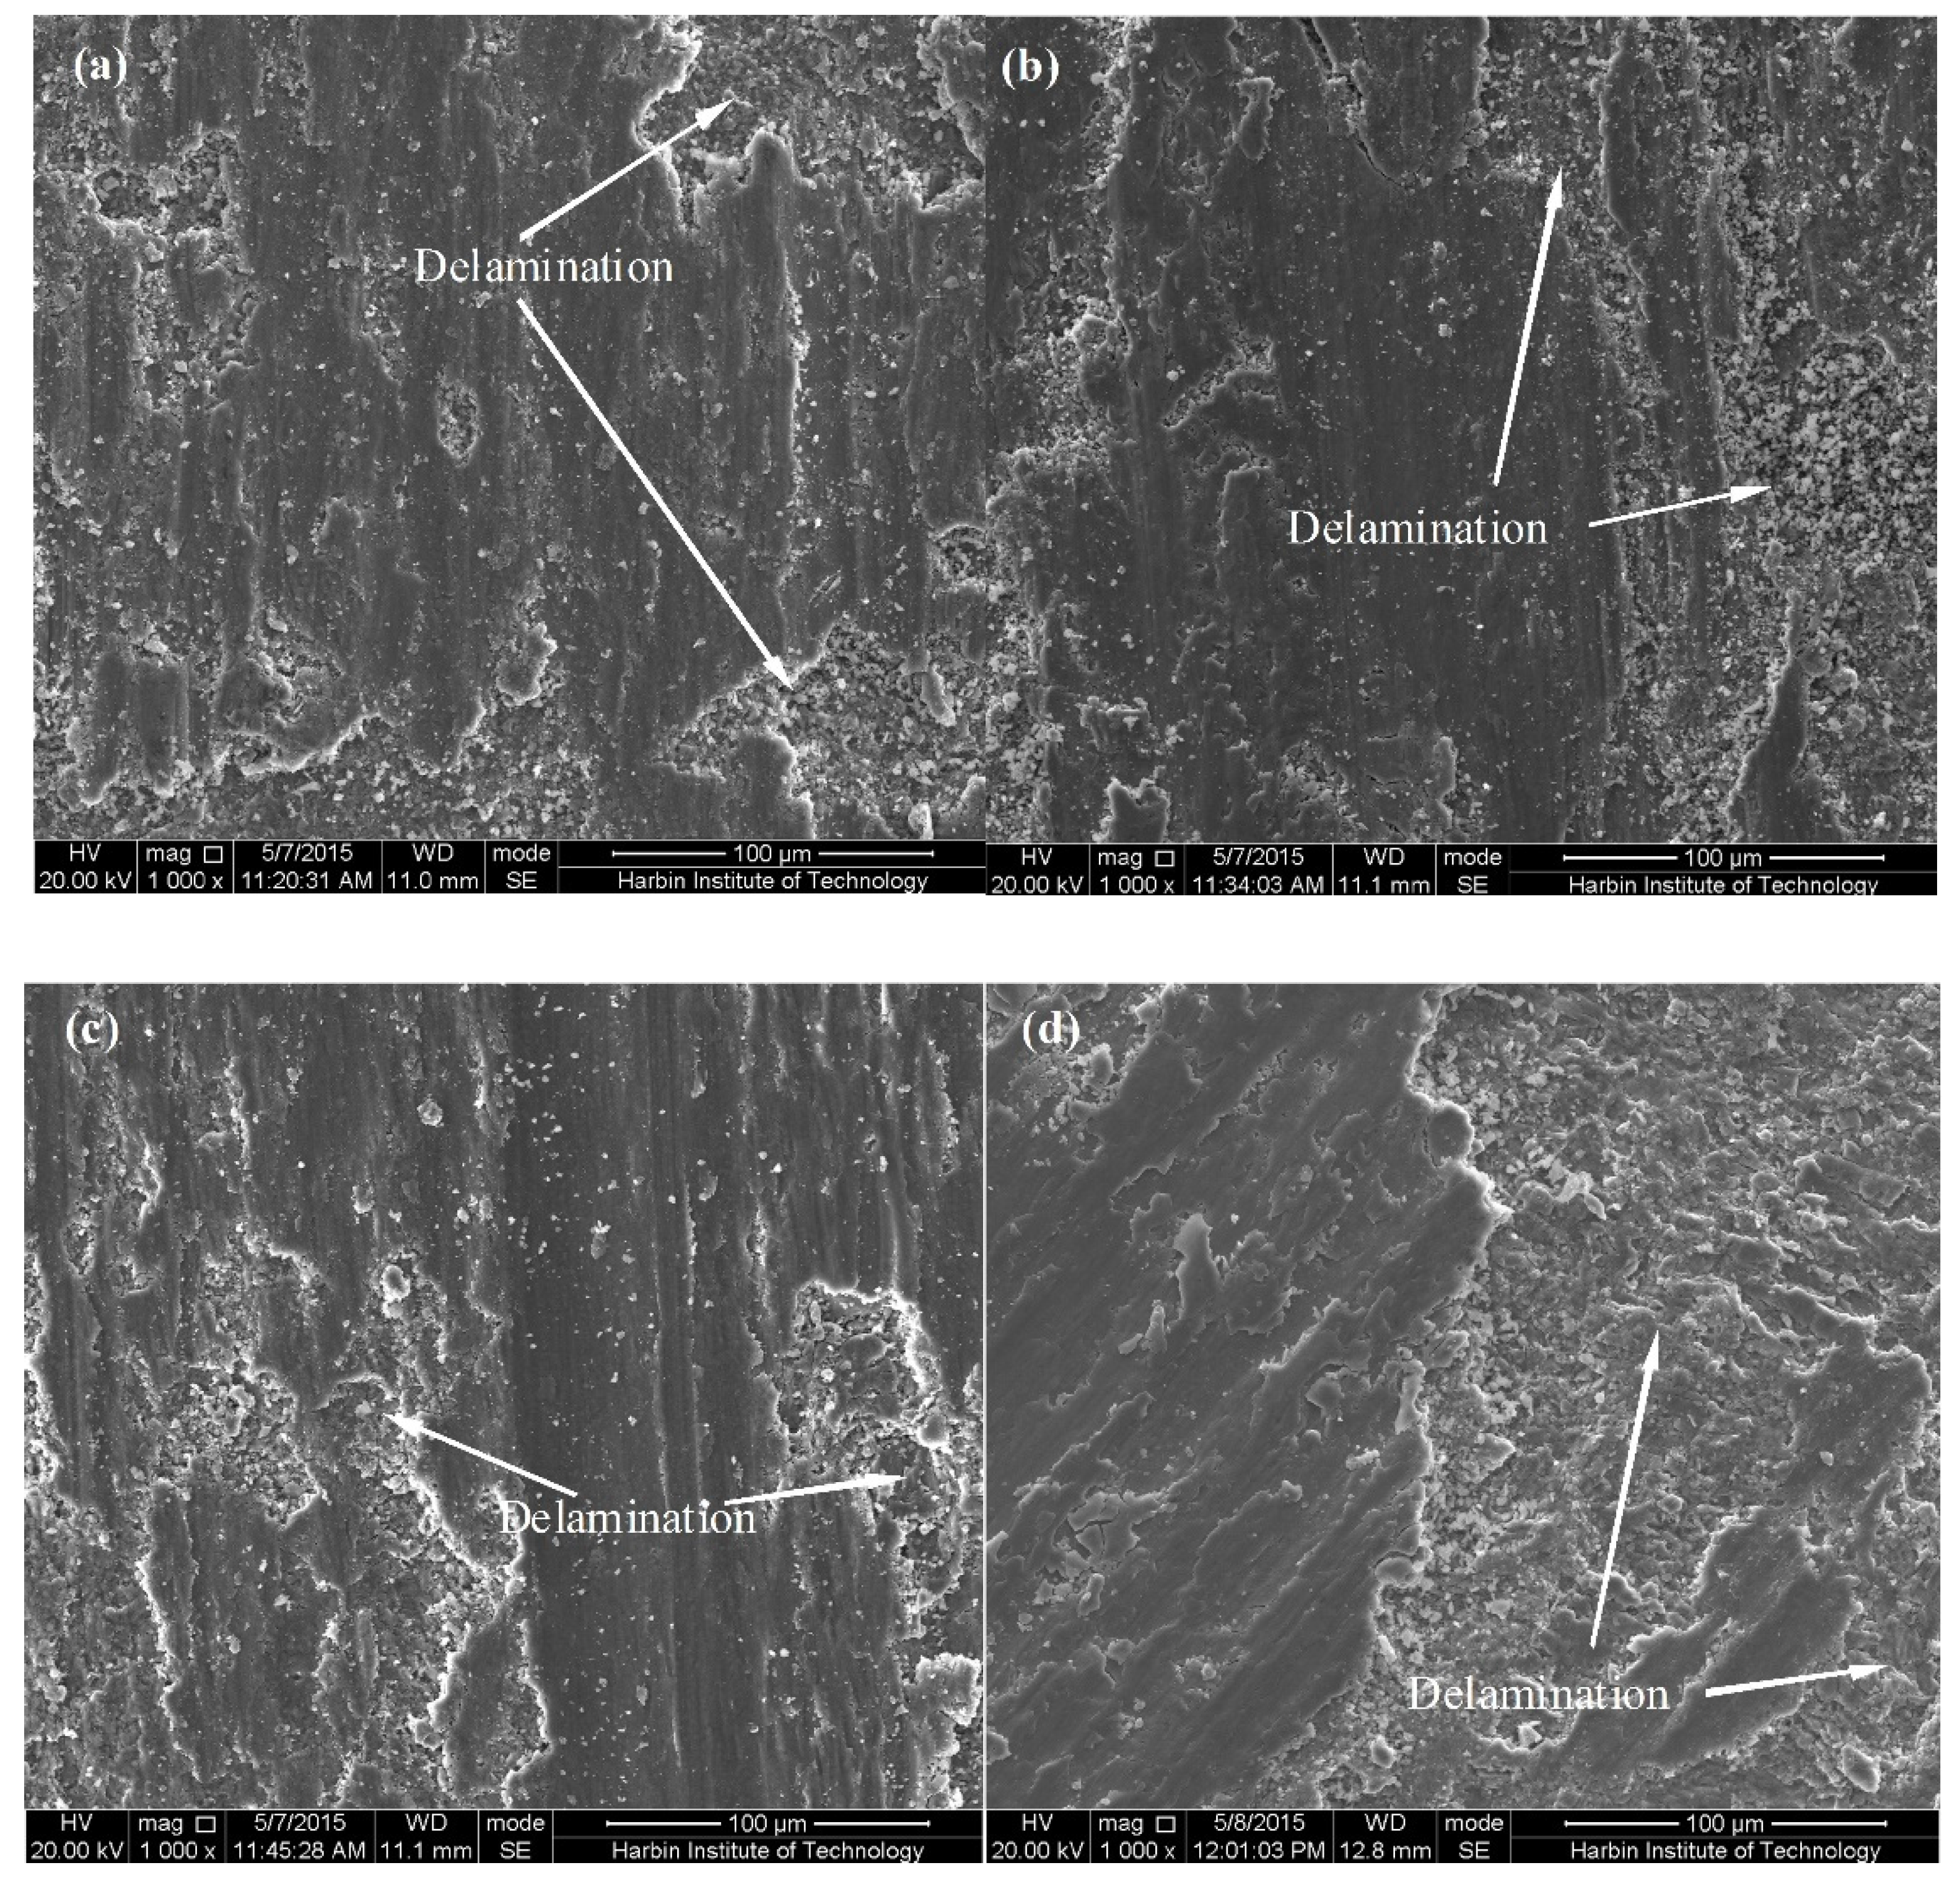
Figure 3 gives secondary electron (SE) images of the rheoformed composite parts at different semisolid stirring temperatures. As indicated in Figure 3, the delamination and shallow grooves are found in the microstructure of worn surface. Cracks are propagated in both transverse and longitudinal directions due to higher shear force on the sliding surfaces. It led to the loss of material from the worn surface in the form of flakes, as reported by Kumar [6]. In addition, some wear debris was found in the surface microstrucutre of the sample when semisolid stirring temperature was 628 °C (Figure 3d). It illustrates that abrasive wear also plays a role in the wear process of the composite.
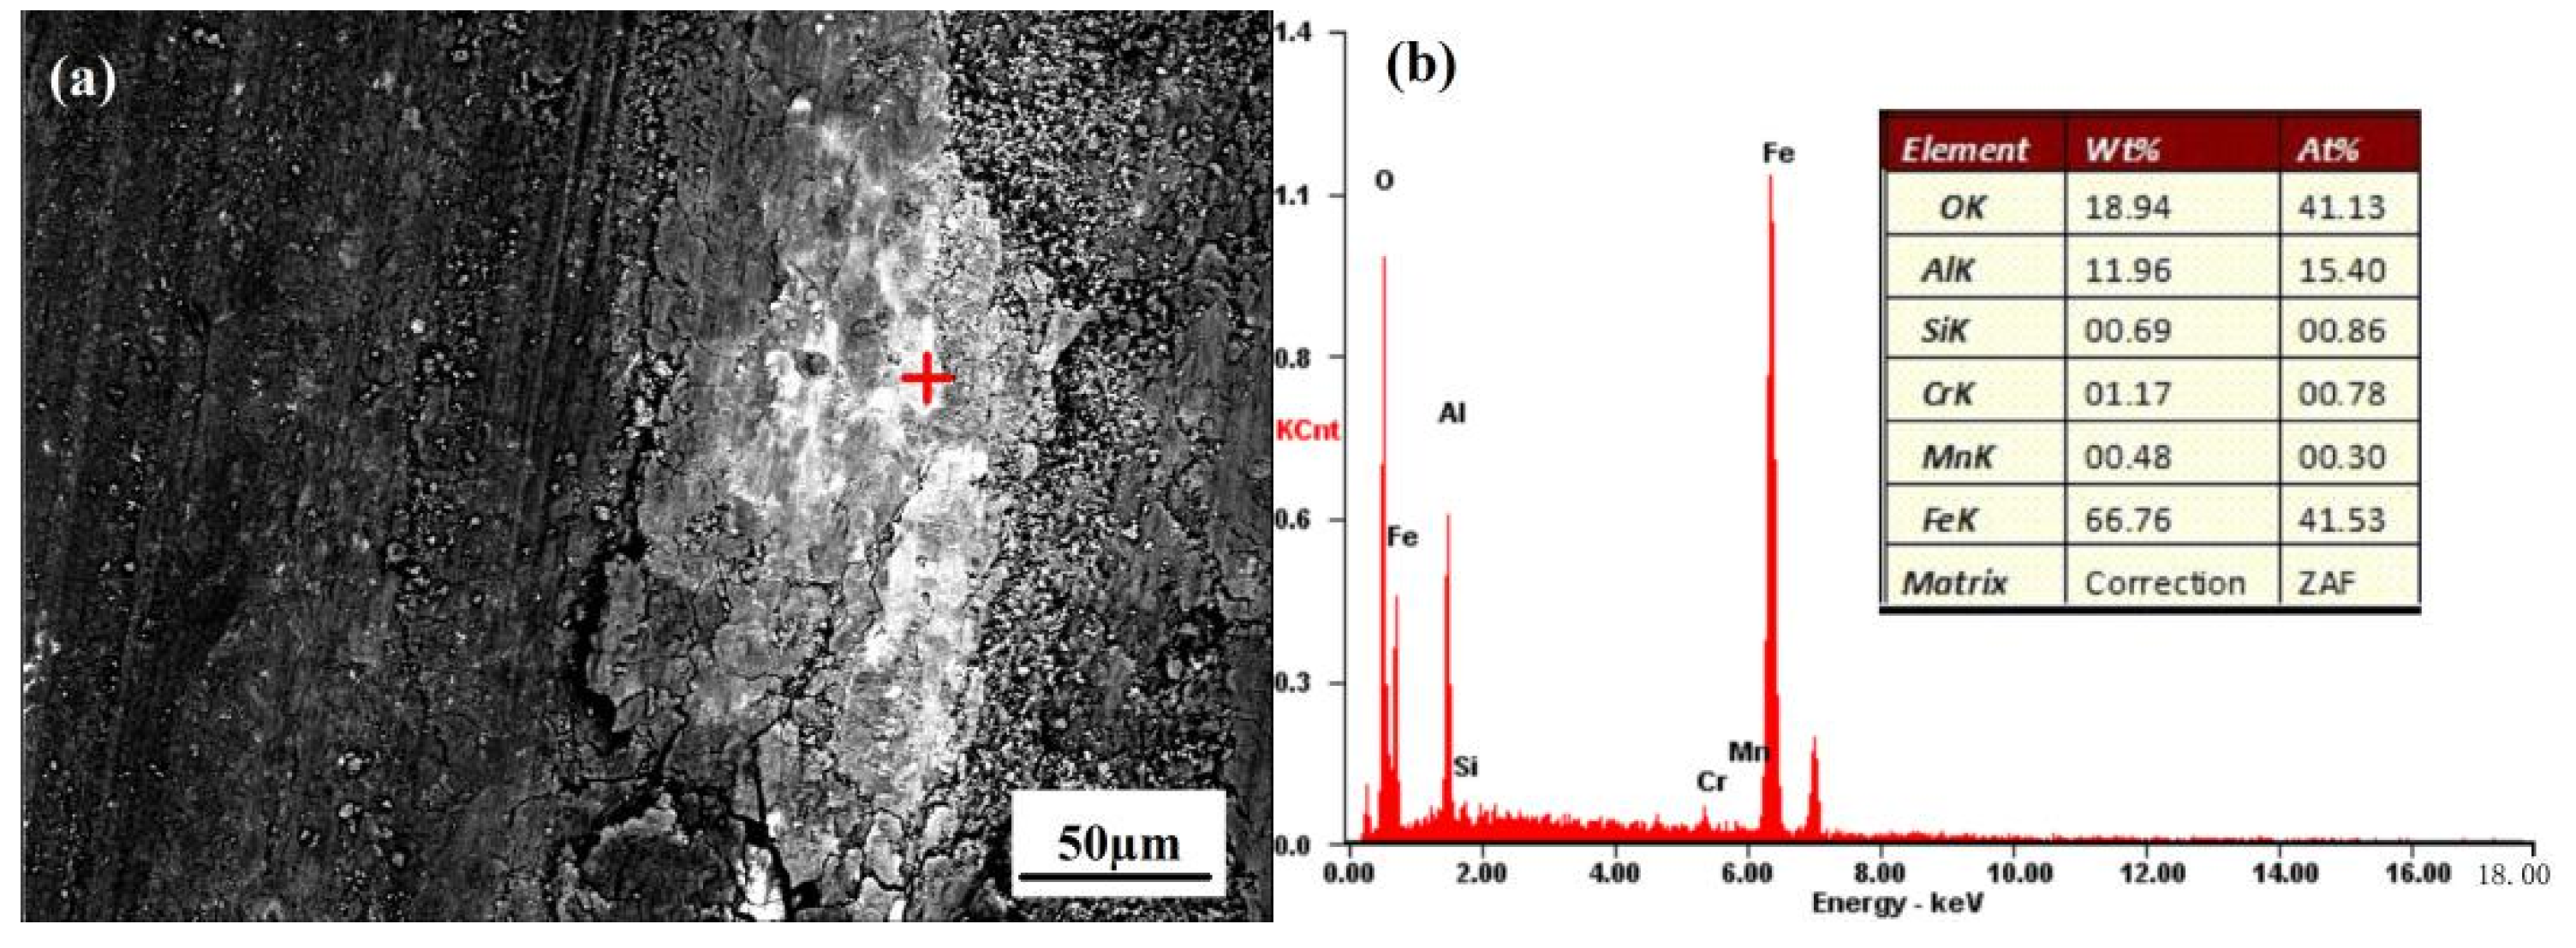
Energy dispersive X-ray (EDX) analysis revealed that some Fe and Cr elements occurred in the microstructure of the sample’s surface (Figure 4). It illustrates also that wear debris of the disc made from GCr15 steel was retained on the surface of the composite sample, indicating the occurrence of abrasive wear.
Present oxygen element is due to the fact that wear test was done in an air environment, as reported by Sarajan [25]. Hence, the dominant wear mechanisms of the rheoformed composite parts at different semisolid stirring temperatures involve adhesive wear, abrasive wear and delamination wear.
3.2. Influence of Reheating Temperature on Tribological Behavior of Thixoformed Composite parts
Figure 5 exhibits friction coefficient, weight loss and wear rate of the thixoformed composite parts at different reheating temperatures. The curves of friction coefficient vs time reveal that friction coefficient increases firstly and then keeps a fluctuation with increasing time (Figure 5a–d). The average value of friction coefficient increases firstly and then decreases with increasing reheating temperature. When reheating temperature increases from 580 to 600 °C, the average friction coefficient increases from 0.41 to 0.54. As can be seen in Figure 5e, the average value of the steady state coefficient of friction decreases to from 0.54 to 0.50 upon a further increase from 600 to 610 °C. Weight loss and wear rate of the thixoformed composite part at reheating temperature of 580 °C are lower than those of the thixoformed composite parts at reheating temperatures of 590, 600 and 610 °C (Figure 5f,g). It indicates highest wear resistance was achieved in the thixoformed composite part at the reheating temperature of 580 °C.
Plastic deformation of solid grains occurs severely because of low liquid phase fraction. It led to occurrence of more dislocations in solid grains. These dislocations can improve wear resistance of the thixoformed composite parts at 580 °C. When reheating temperature is elevated to a reheating temperature above 590 °C, the plastic deformation of solid grains decreases due to more liquid phase, leading to decreased dislocations. Therefore, the weight loss and wear rate change slightly when reheating temperatures are 590, 600 and 610 °C. In addition, it can be noticed that the weight loss and wear rate of the thixoformed composite parts at 590, 600 and 610 °C are close to those of the rheoformed composite parts (Figure 2 and Figure 5).
Delamination, shallow grooves, craters and wear debris were found in the microstructure of worn surface (Figure 6). It illustrates that wear mechanisms of the thixoformed composite parts belong to delamination wear, abrasive wear and adhesive wear.
3.3. Influence of Applied Load on Tribological Behavior of the Rheoformed and Thixoformed Composite Parts
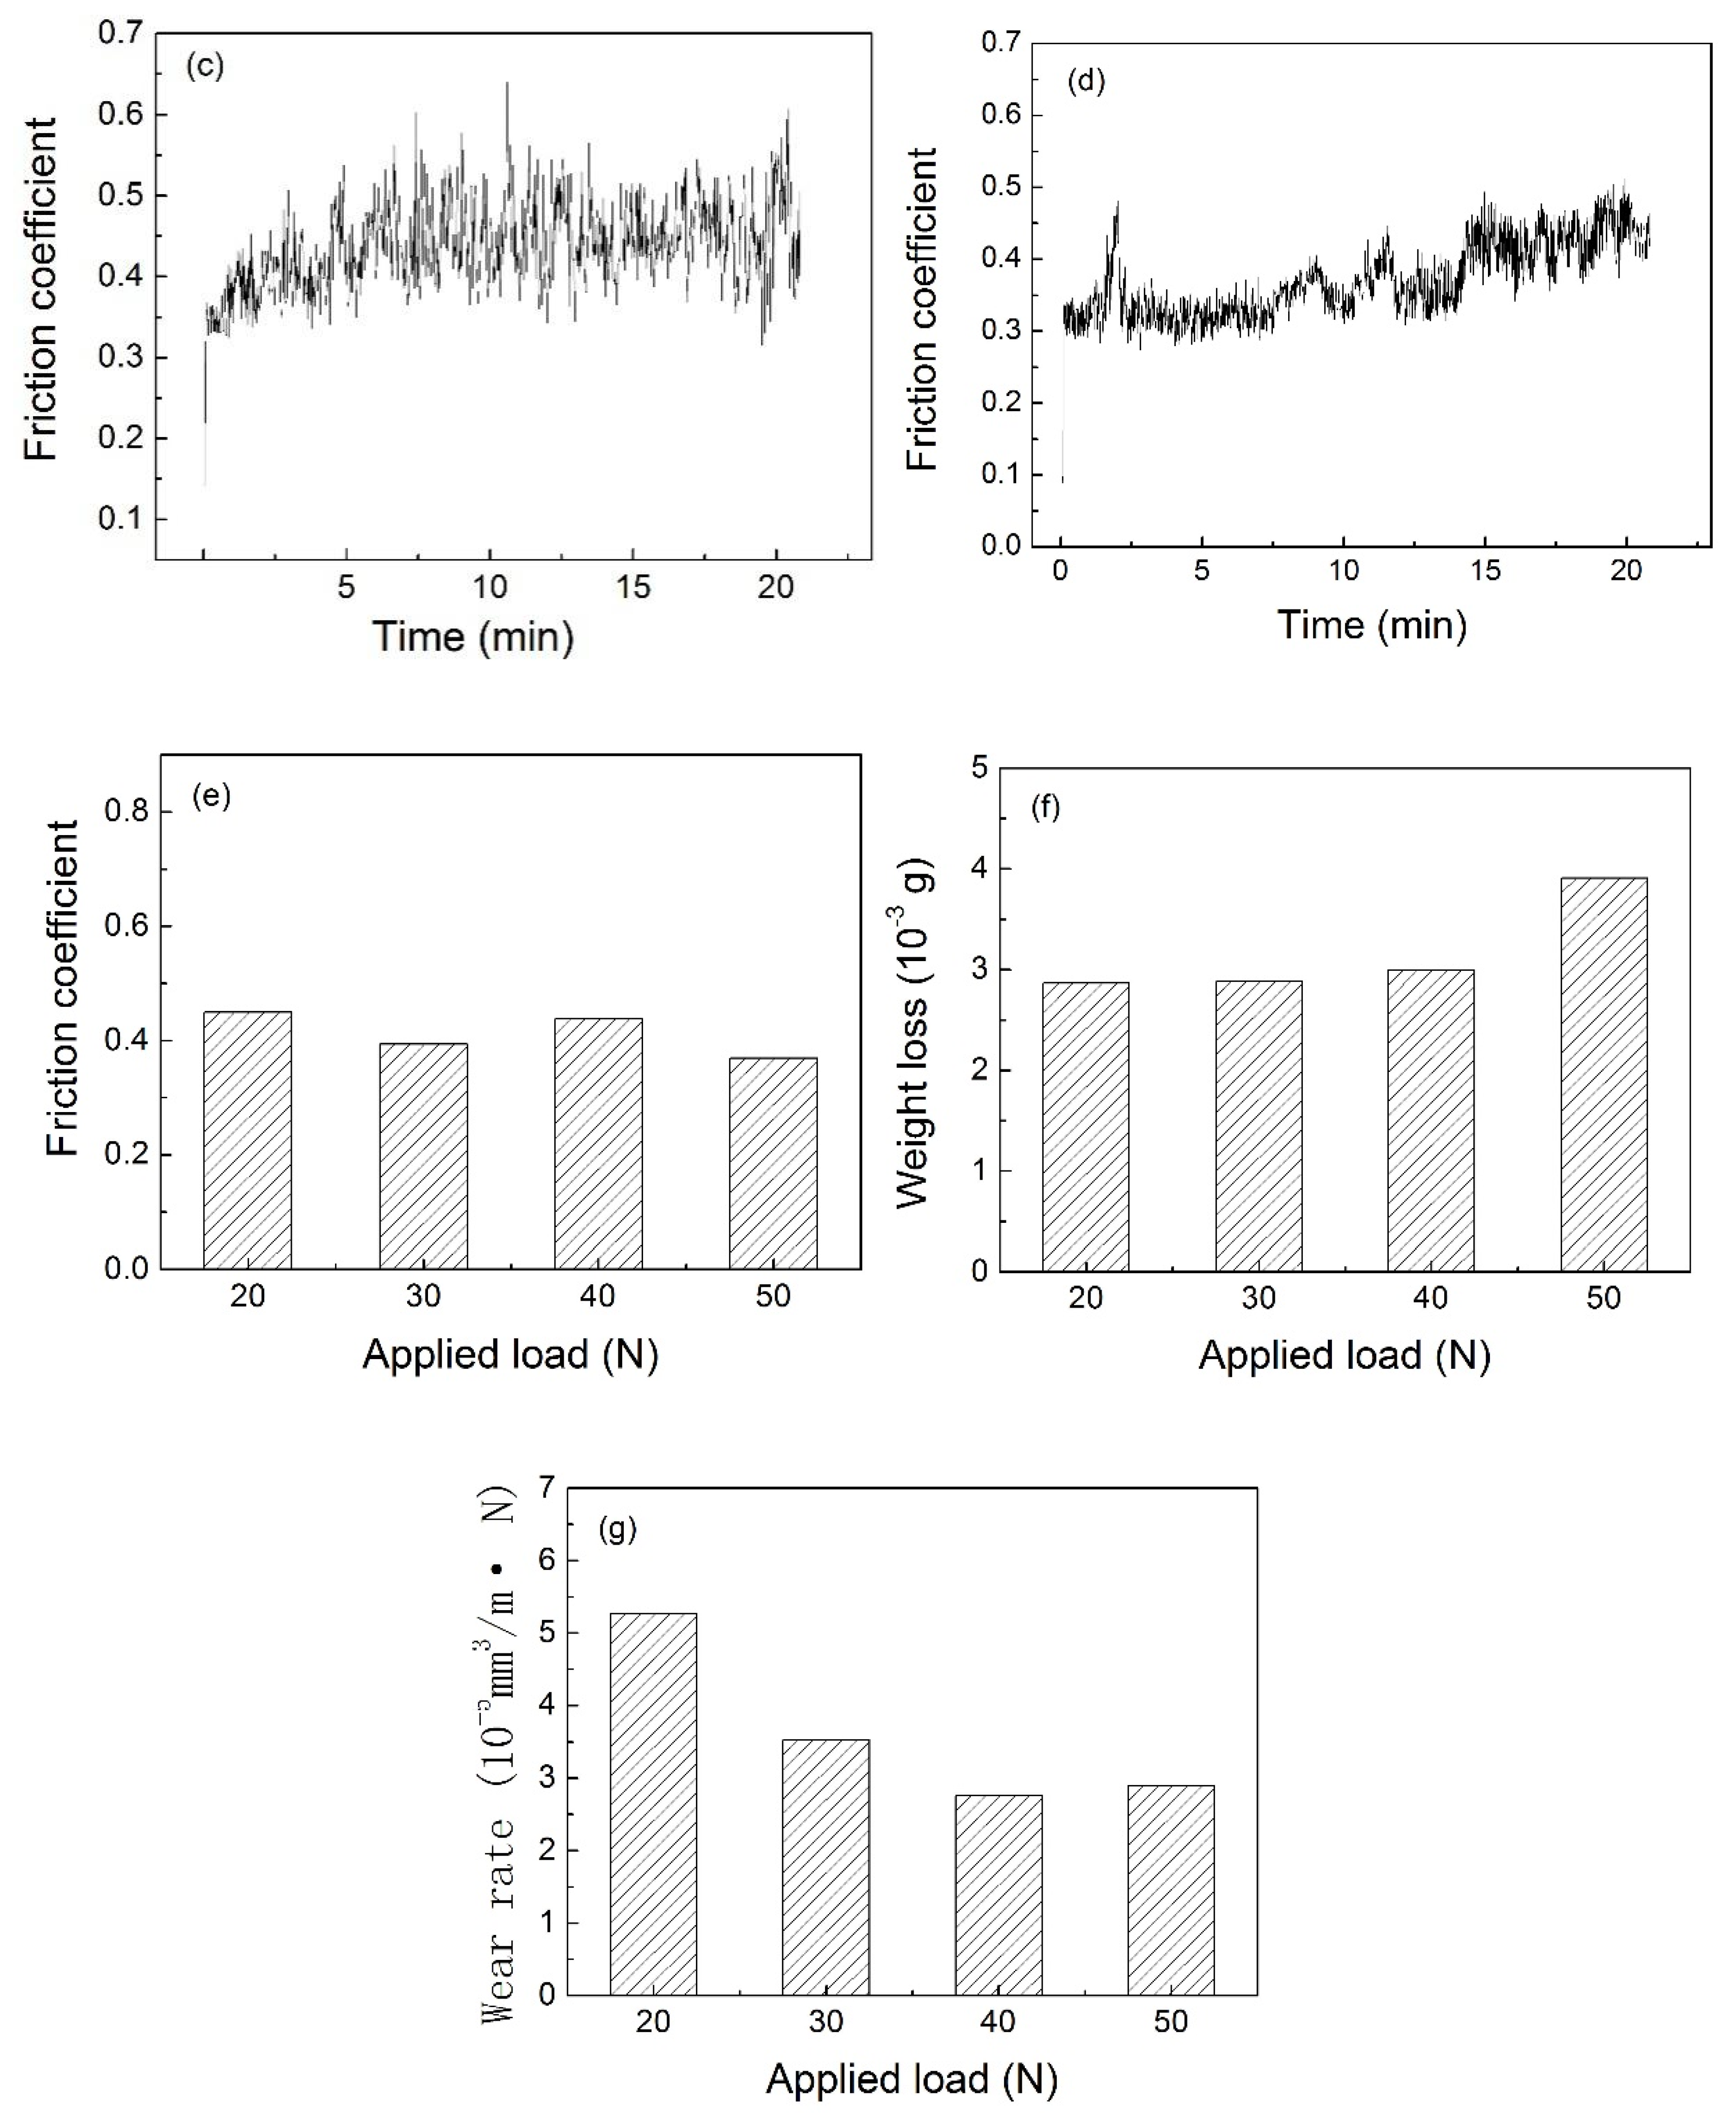
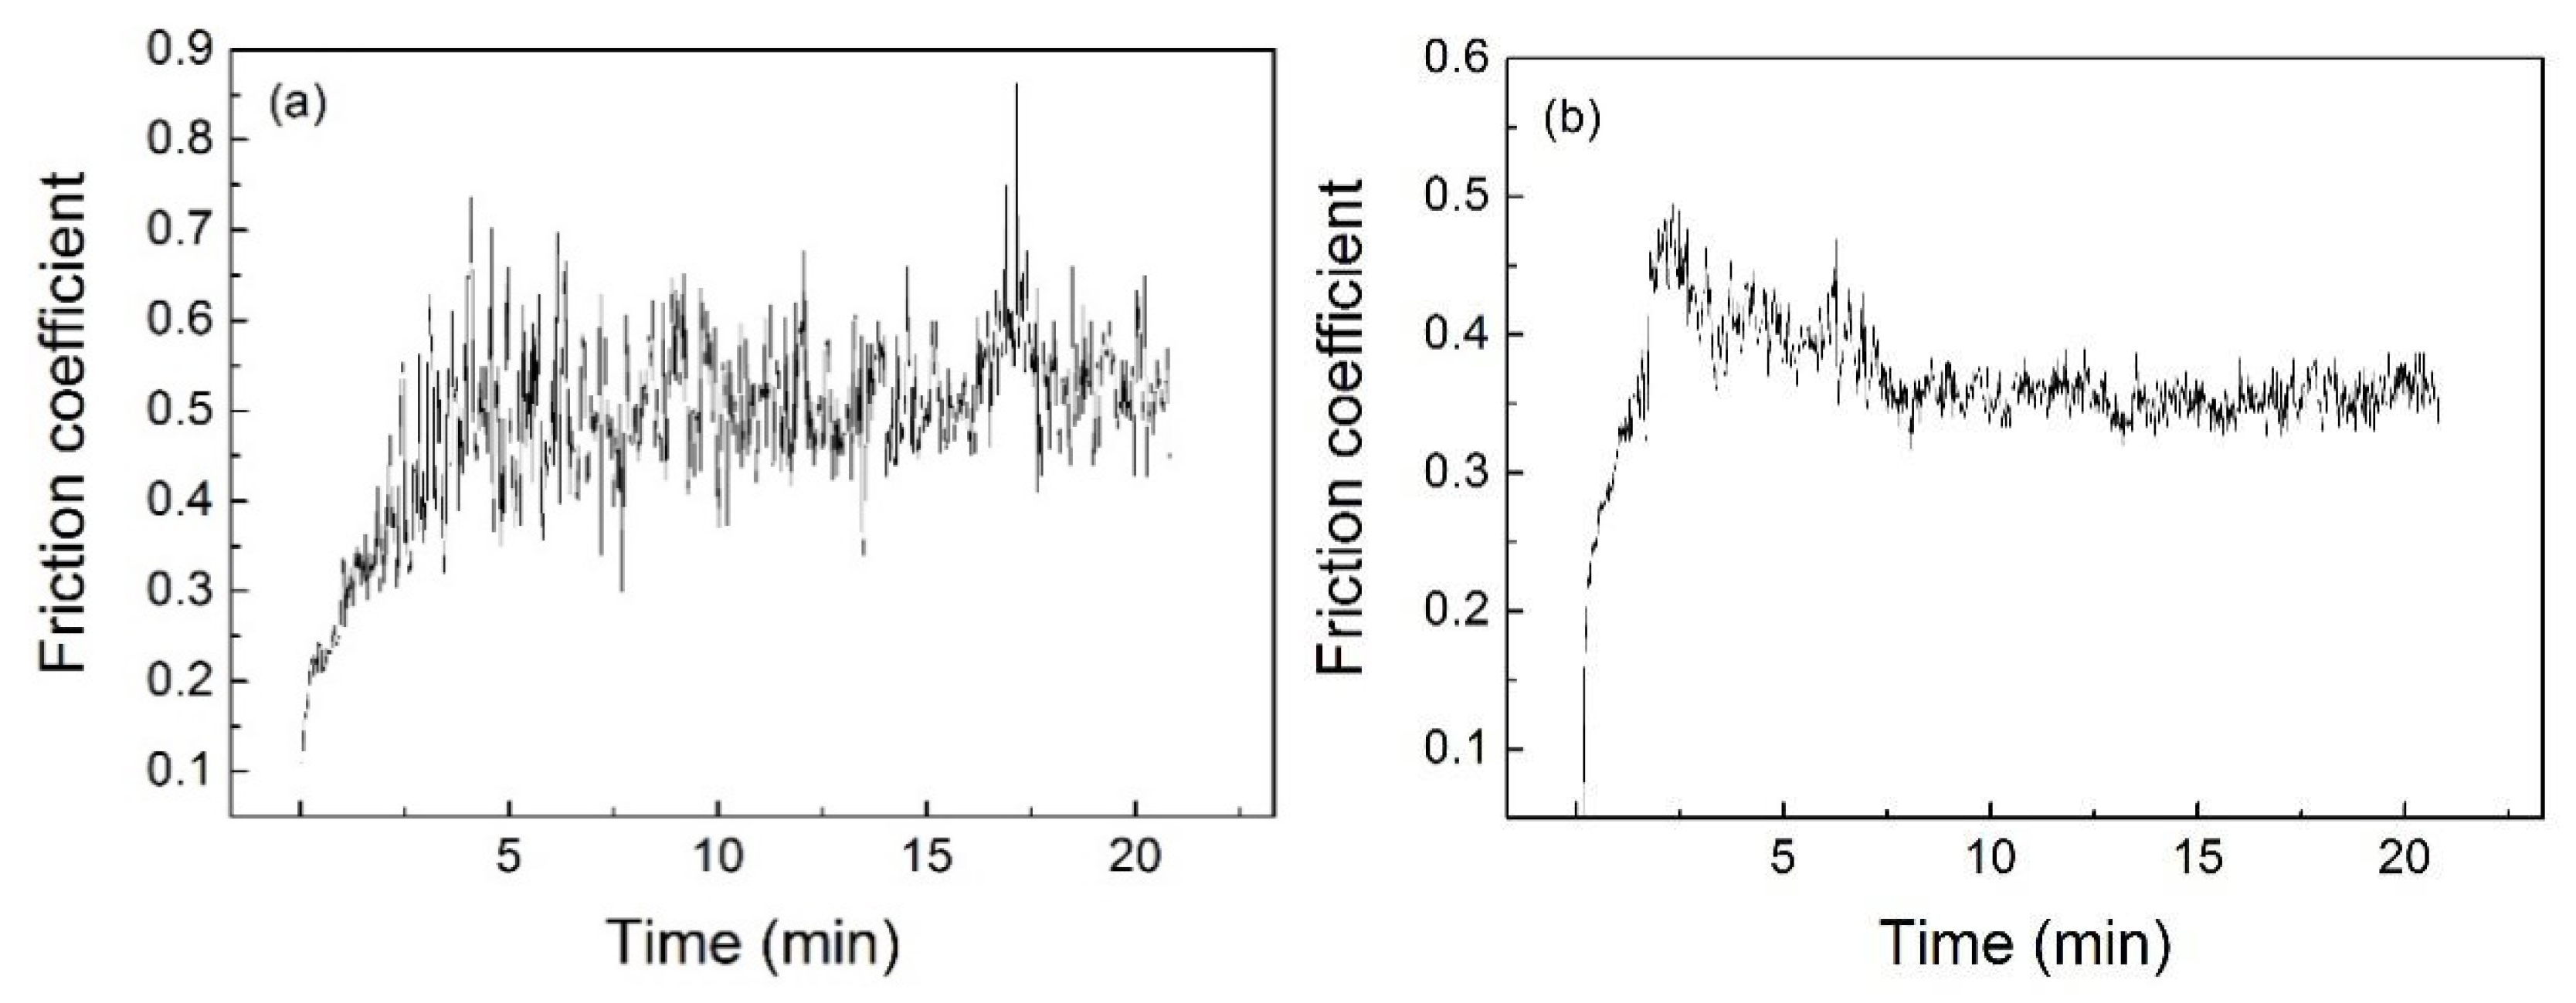
Friction coefficient, weight loss and wear rate of the rheoformed composite parts presented in Figure 7. Friction coefficient exhibits firstly a significant increase and then a fluctuation with increasing time (Figure 7a–c). Before 5min, friction coefficient shows firstly a significant increase and then fluctuation with increasing time. After 5 min, the friction coefficient exhibits a fluctuation again. The friction coefficient shows a significant increase and fluctuation with increasing time before 5 min. However, it is noted that friction coefficient increase slightly with increasing time after 5 min (Figure 7d). The average friction coefficient varies from 0.37 to 0.45 upon applied loads of from 20 to 50 N. As for applied load of 50 N, the average friction coefficient exhibited the lowest value of 0.37 (Figure 7e). The results achieved by Onat [7] revealed that friction coefficient decreased with increasing applied load. This result is almost consistent with the results achieved by Onat [7], except for the 40 N applied load. This work shows a decrease of friction coefficient upon an increase of applied load from 20 to 30 N. However, average friction coefficient increases with an increase of applied load from 30 to 40 N. Average friction coefficient exhibited a decrease with an increase of applied load from 40 to 50 N again. This may be due to different selected range of applied load. For research of Onat [7], the selected range of applied load is a range from 5 to 15 N. However, this selected range of applied load is from 20 to 50 N. Weight loss increases a little upon an increase of applied load from 20 to 40 N. However, when applied load reached to 50 N, the weight loss increased significantly (Figure 7f).
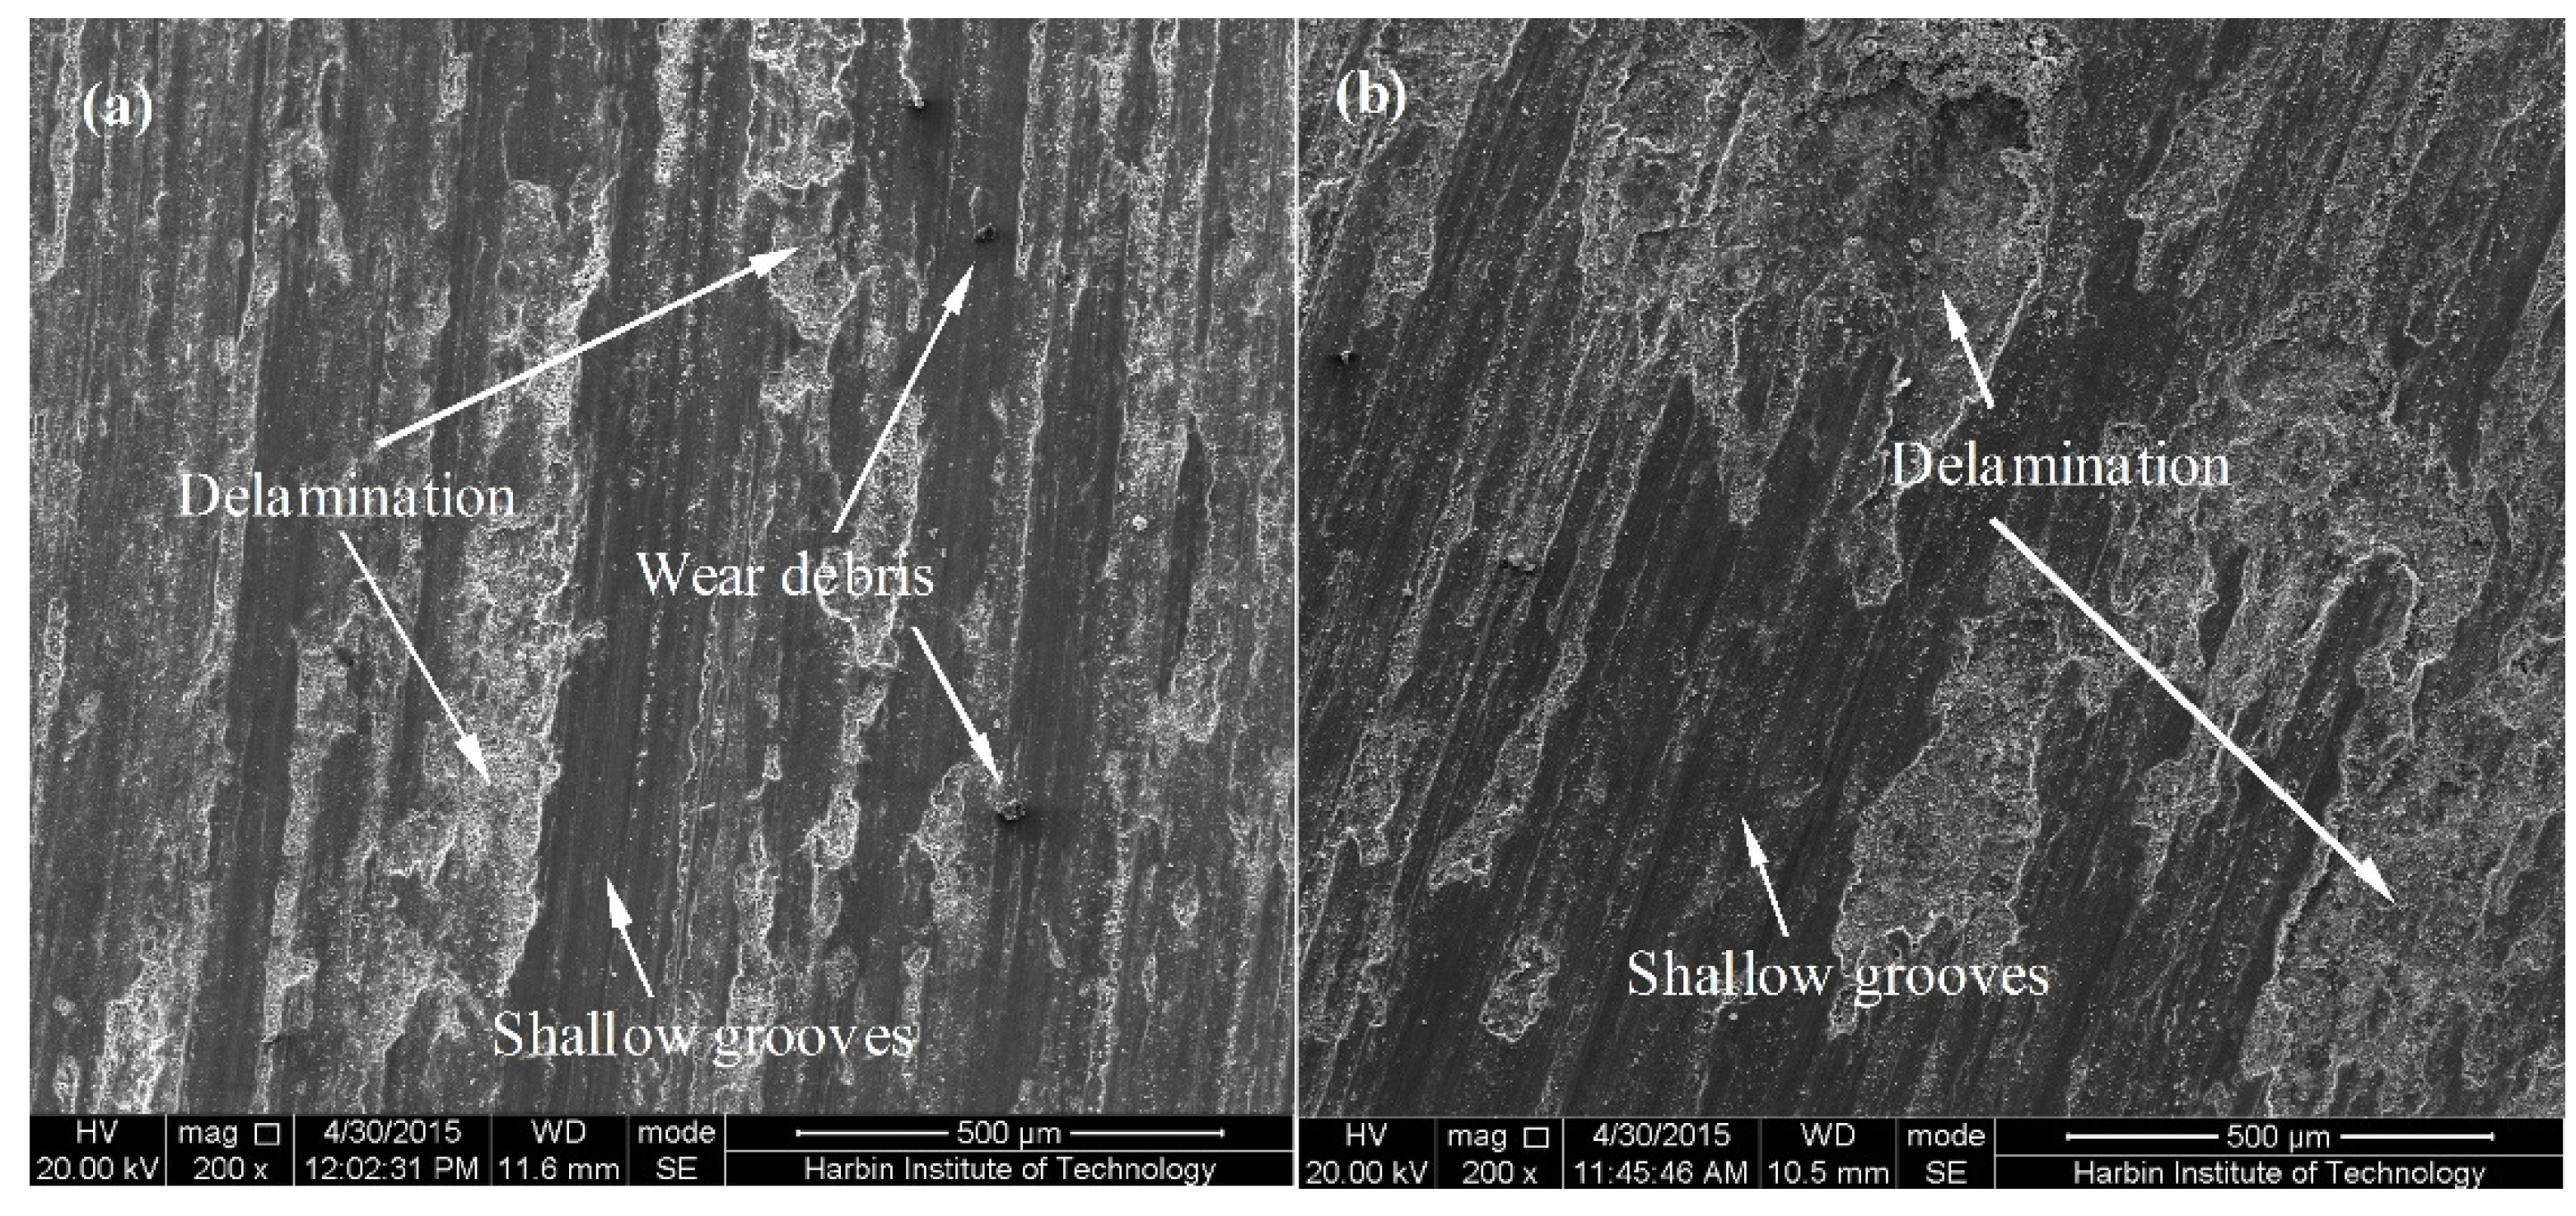
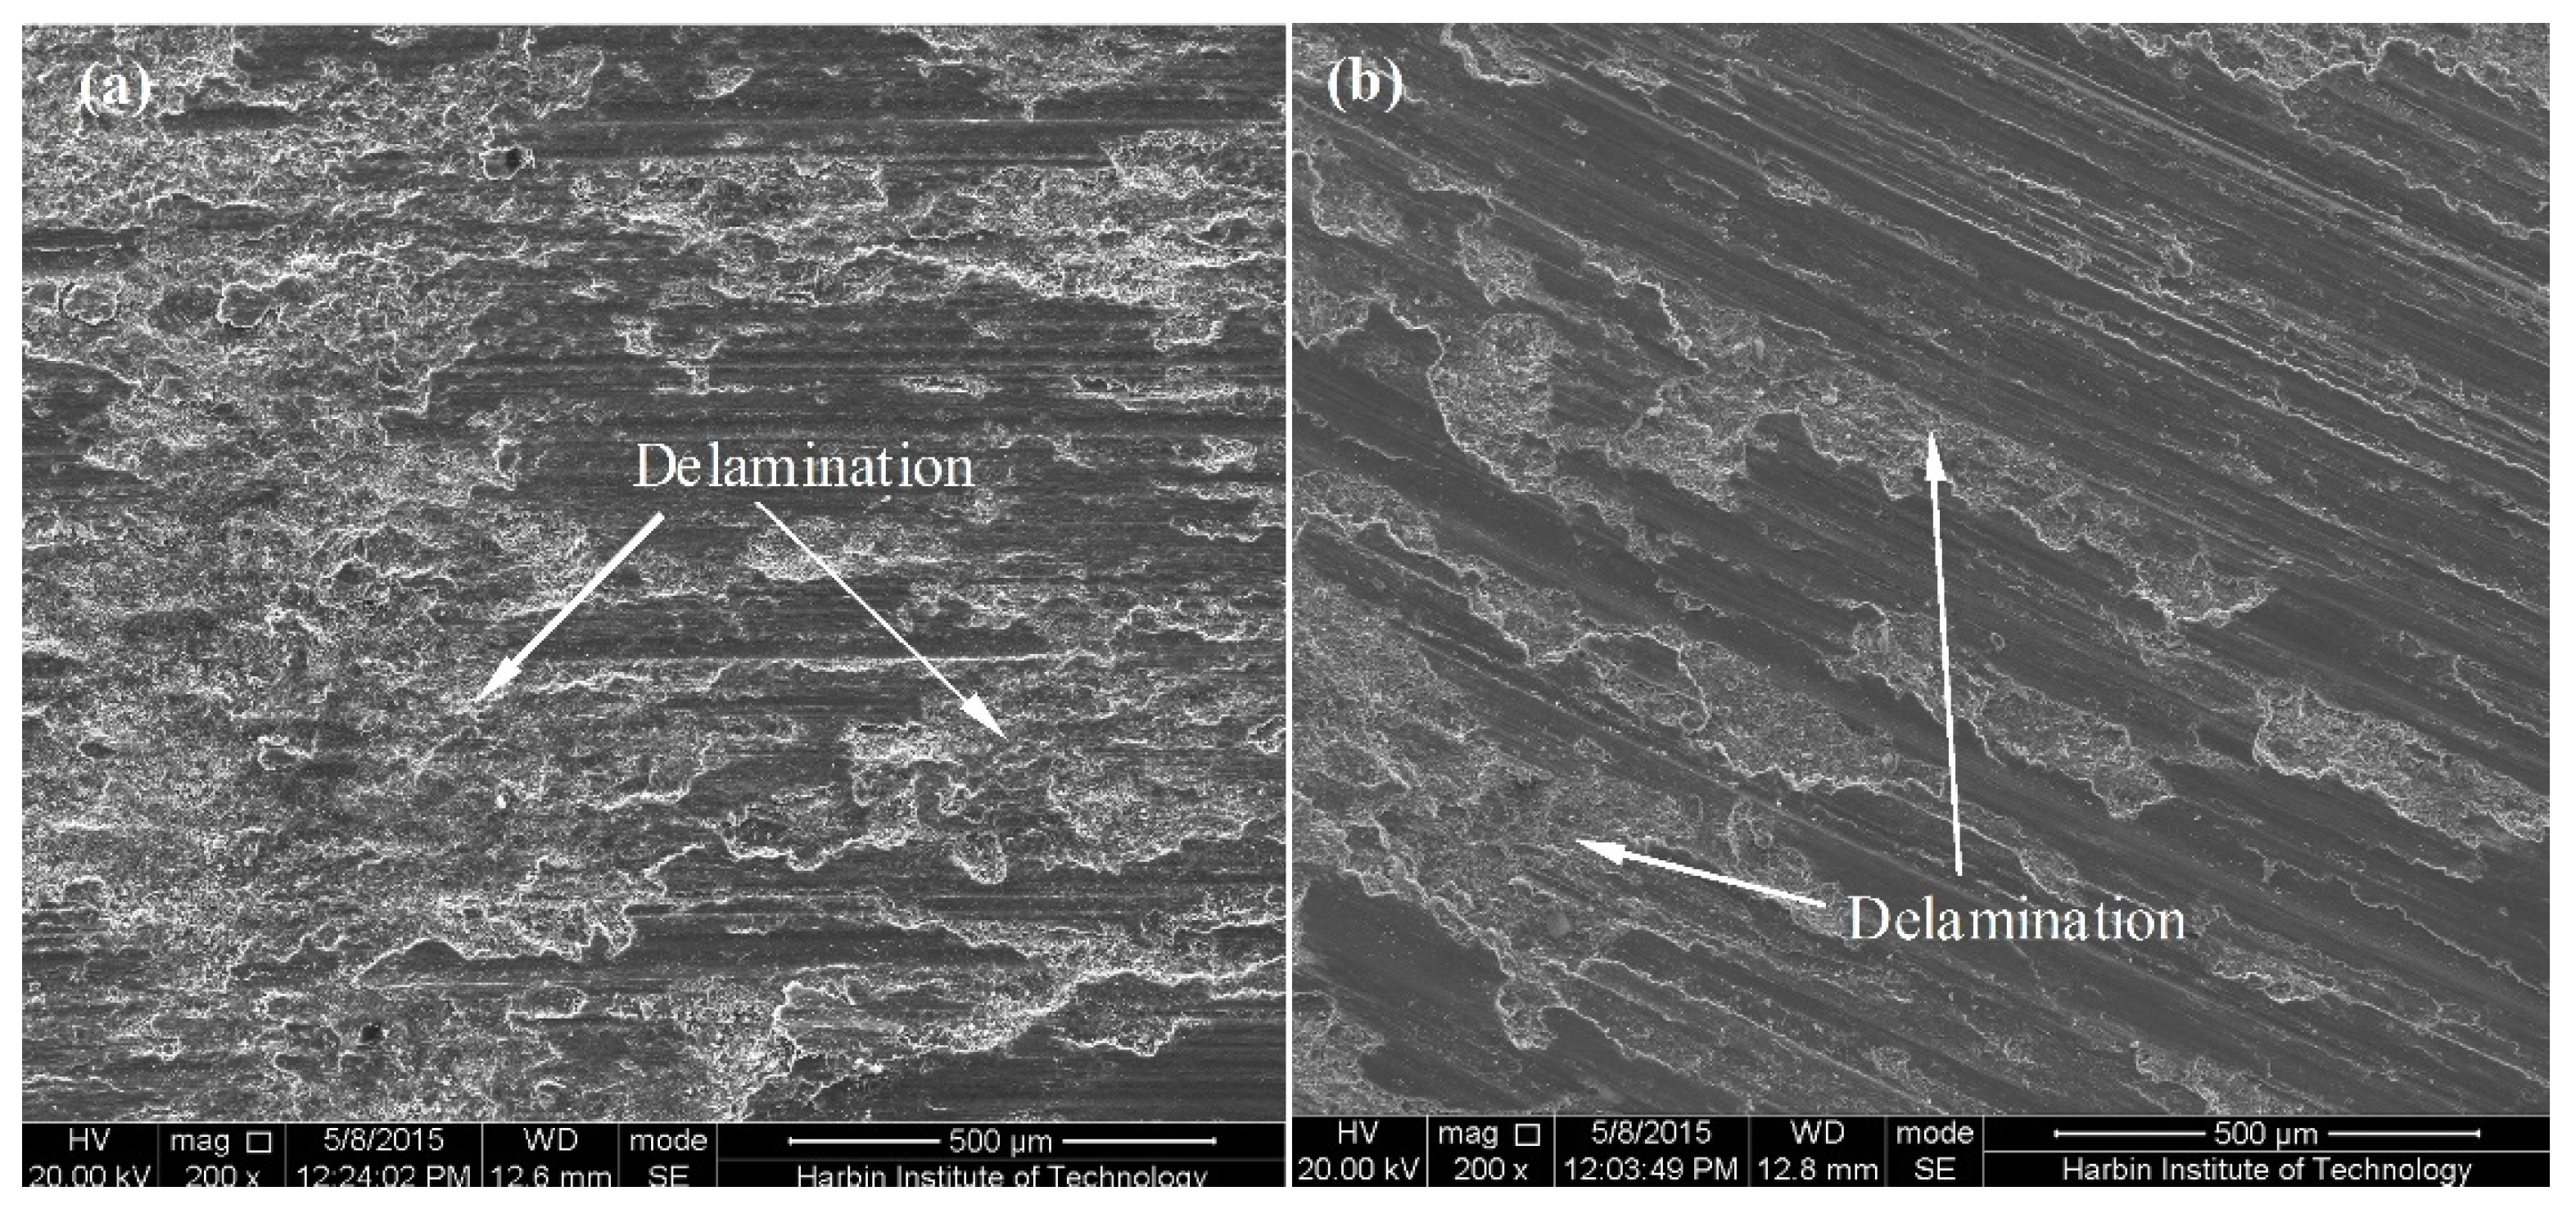
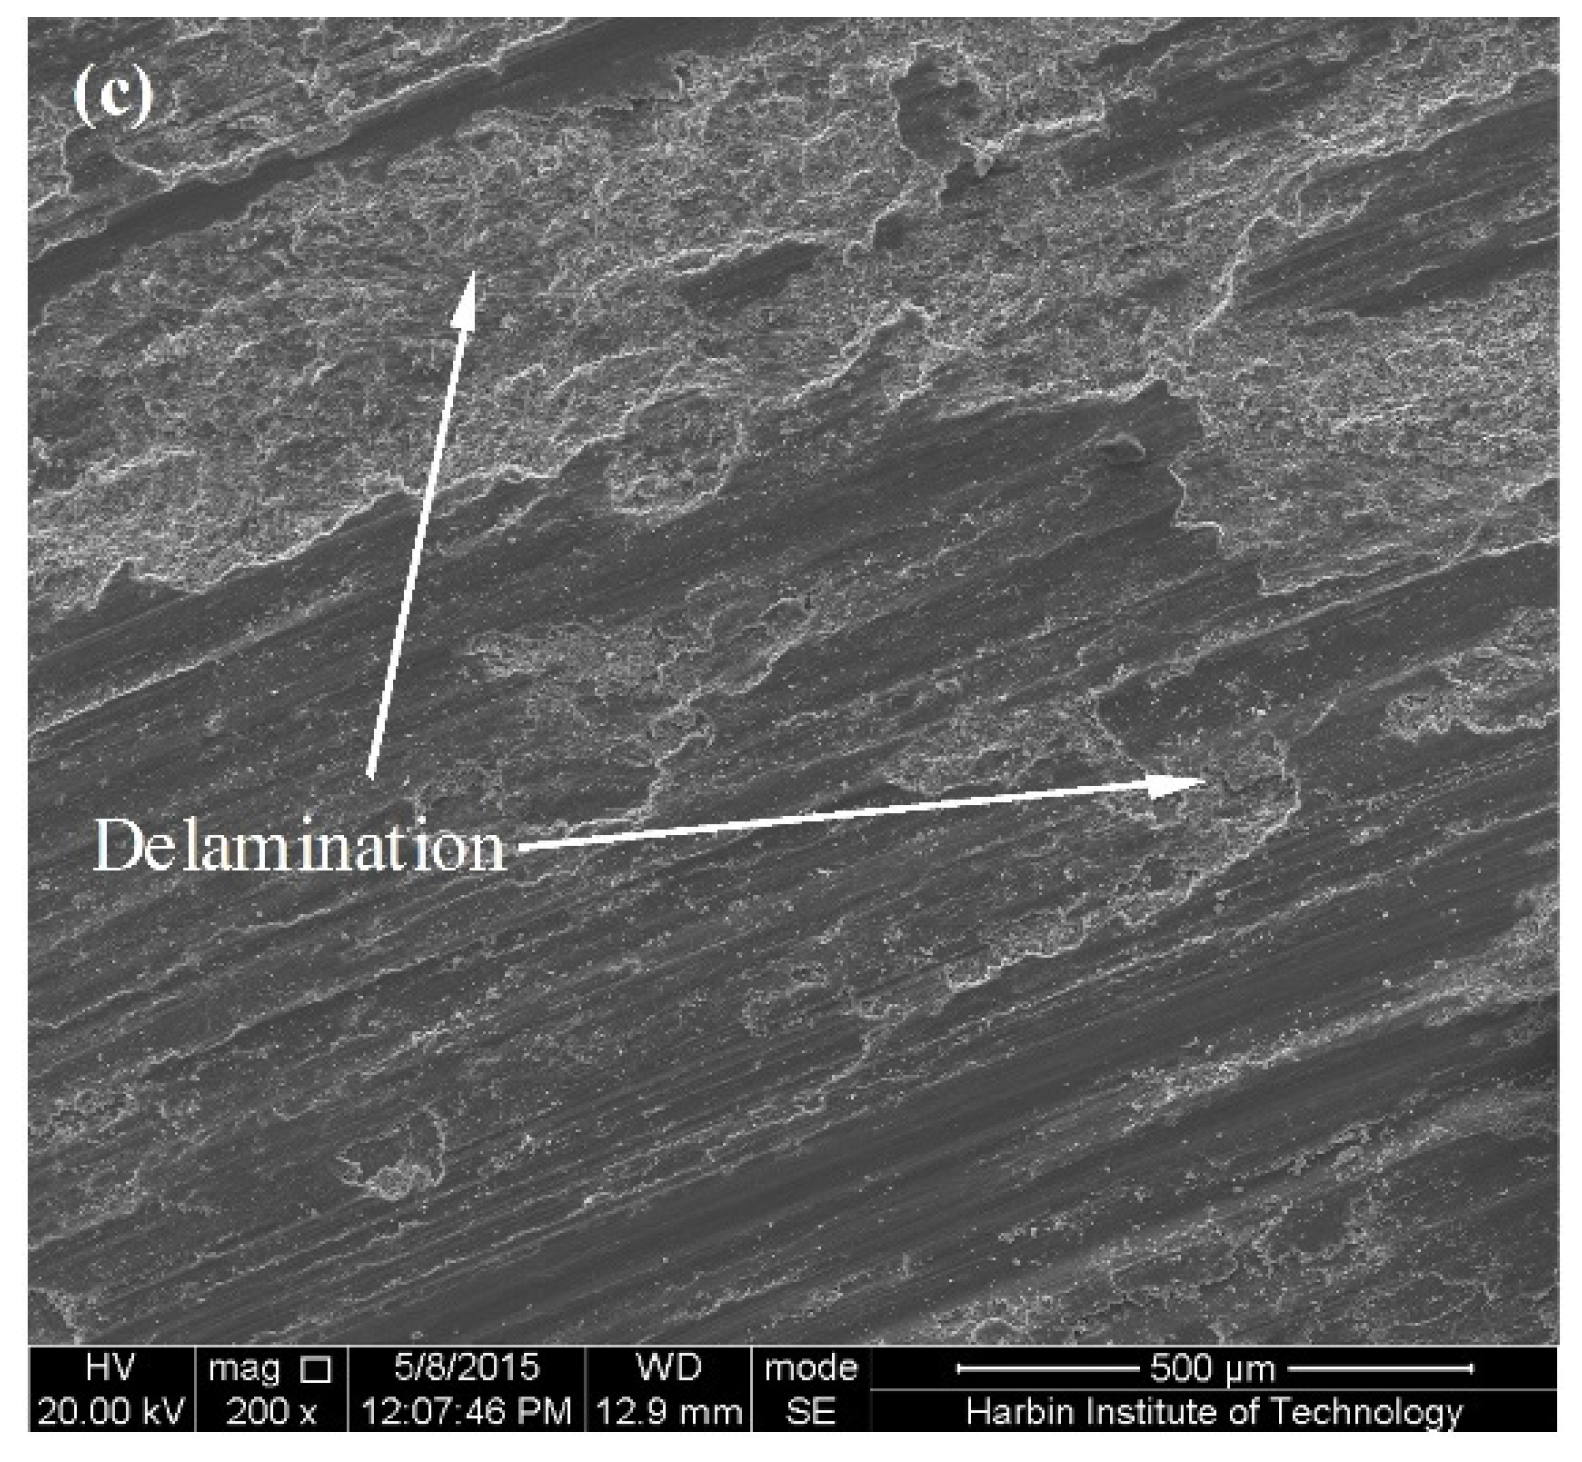
Wear rate exhibited a first decrease and then a slight increase with increasing applied load (Figure 7g). The surface microstructure is characterized by delamination, wear debris, and shallow grooves (Figure 8). It indicates that wear mechanisms depend on delamination wear, abrasive wear and adhesive wear. Especially, a large area of delamination was noted in the microstructure, indicating a dominant delamination wear.
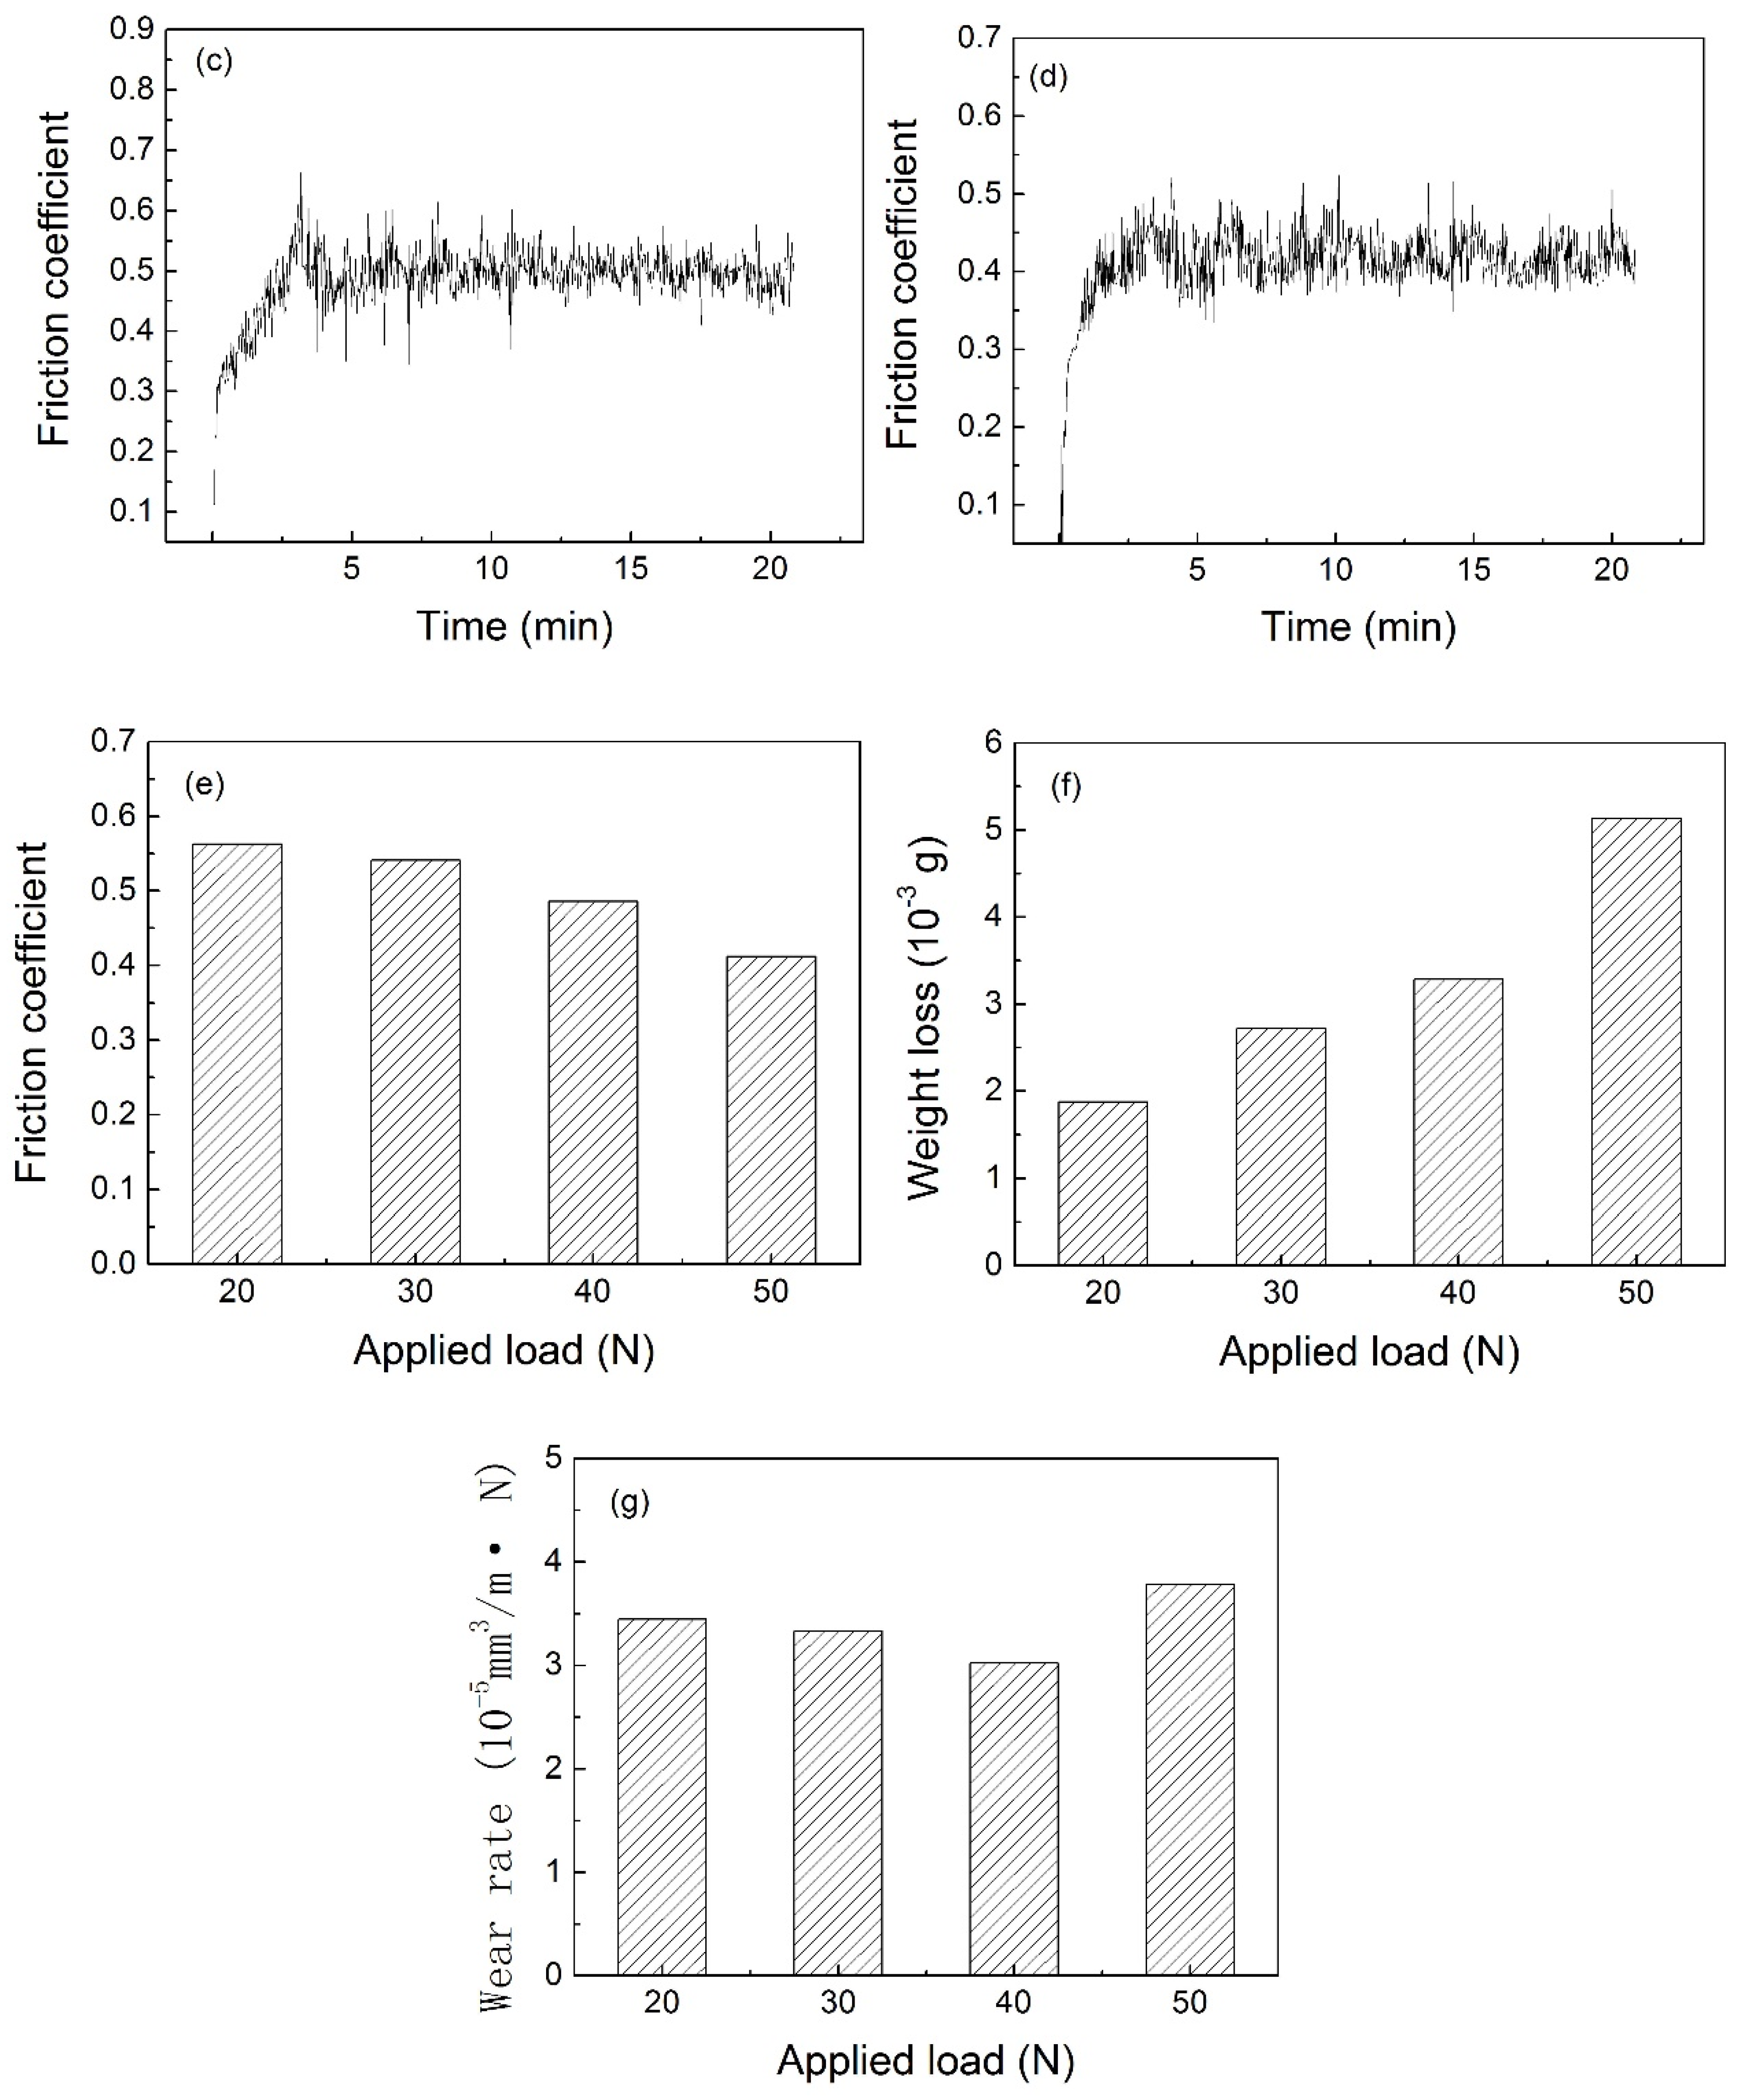
Friction coefficient, weight loss and wear rate of the thixoformed composite part are present in Figure 9. A similar law to the rheoformed composite parts that friction coefficient increases significantly and keeps fluctuation is found in the curves of friction coefficient vs time (Figure 9a–d). The average friction coefficient decreased with increasing applied load (Figure 9e). This result is in agreement with the results achieved by Onat [7] and Zhang and Wang [34]. Weight loss increases with increasing applied load as shown in Figure 9f. It is an agreement with the results obtained by Nartarajan et al. [35].
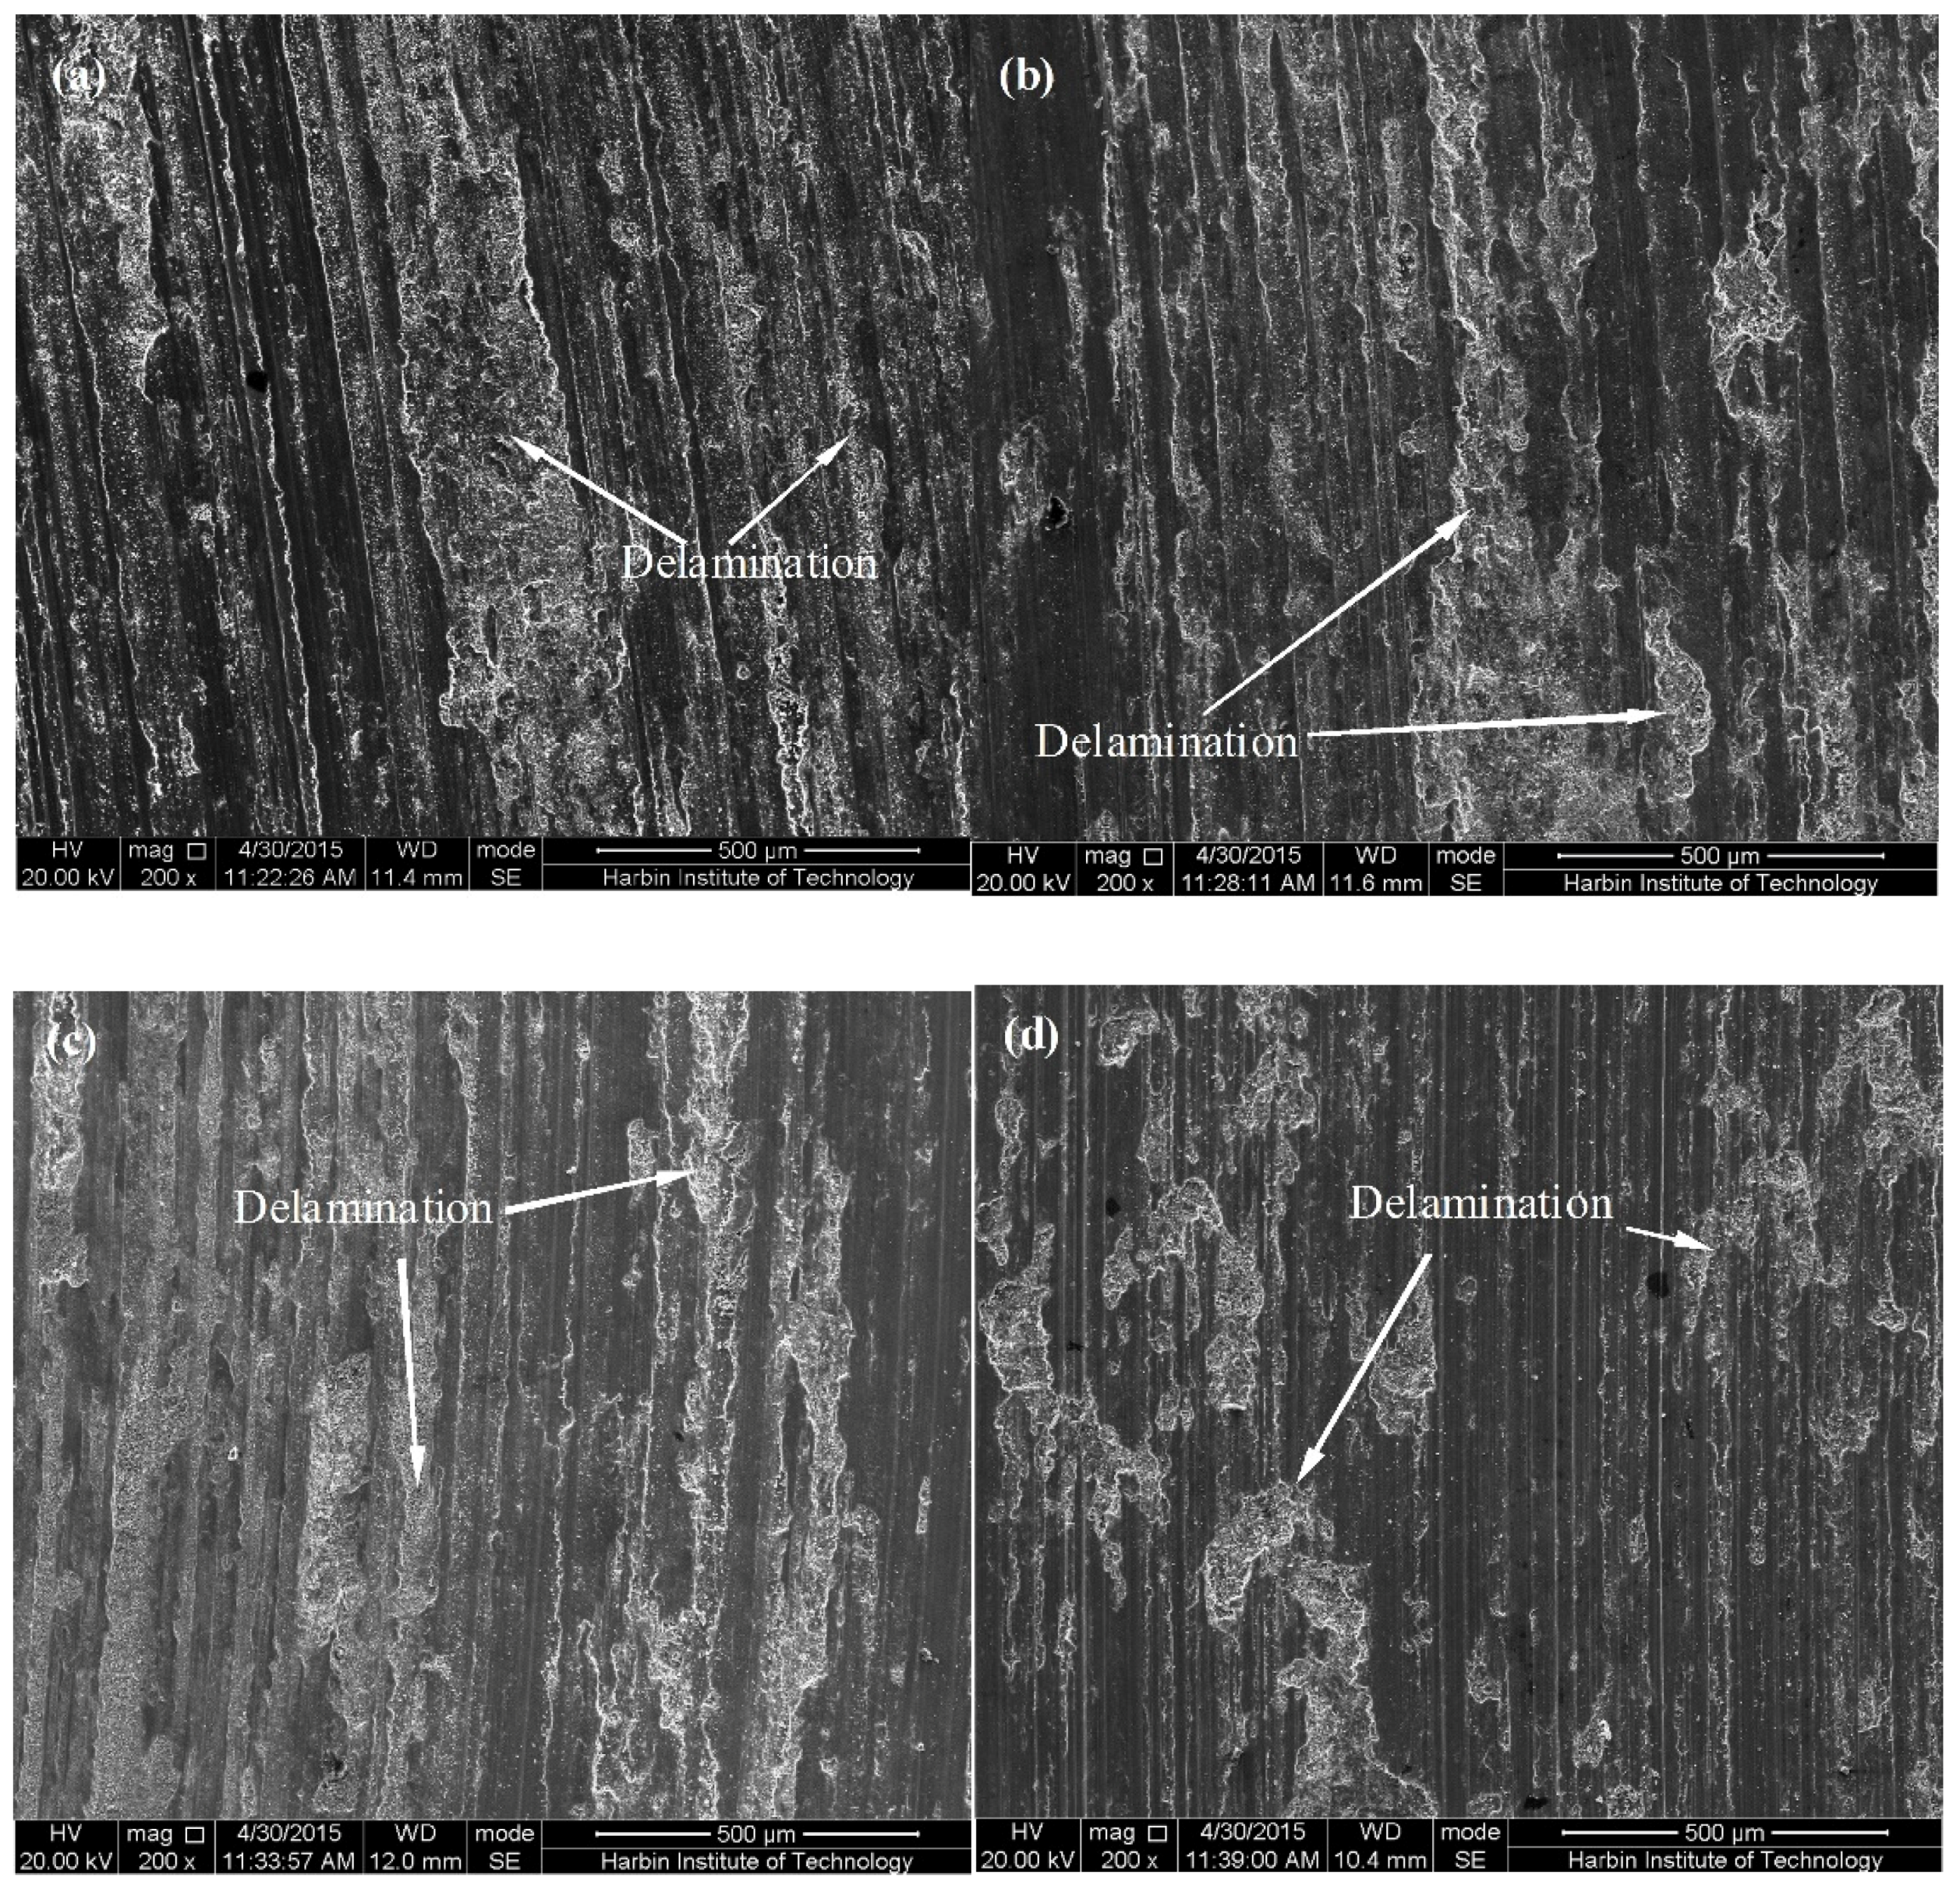
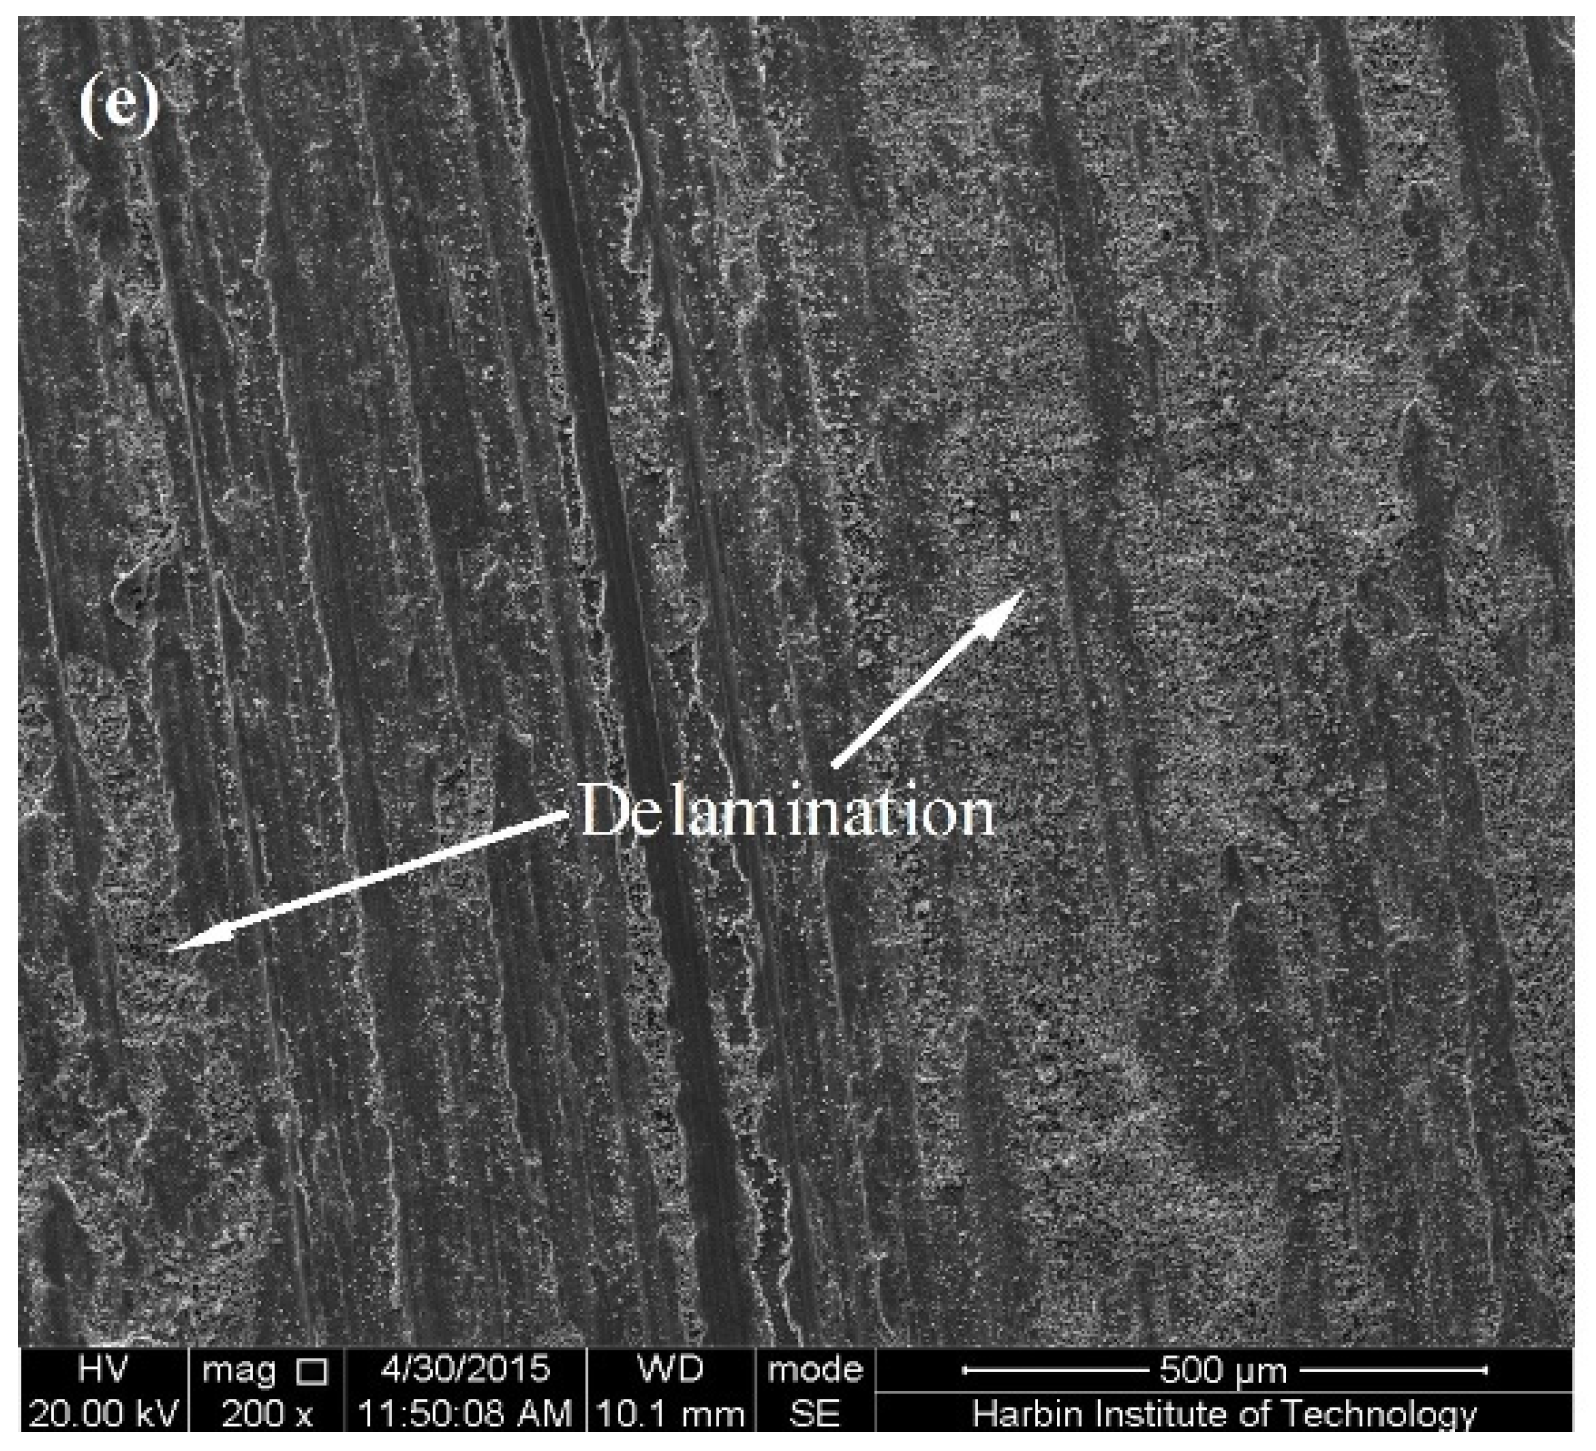
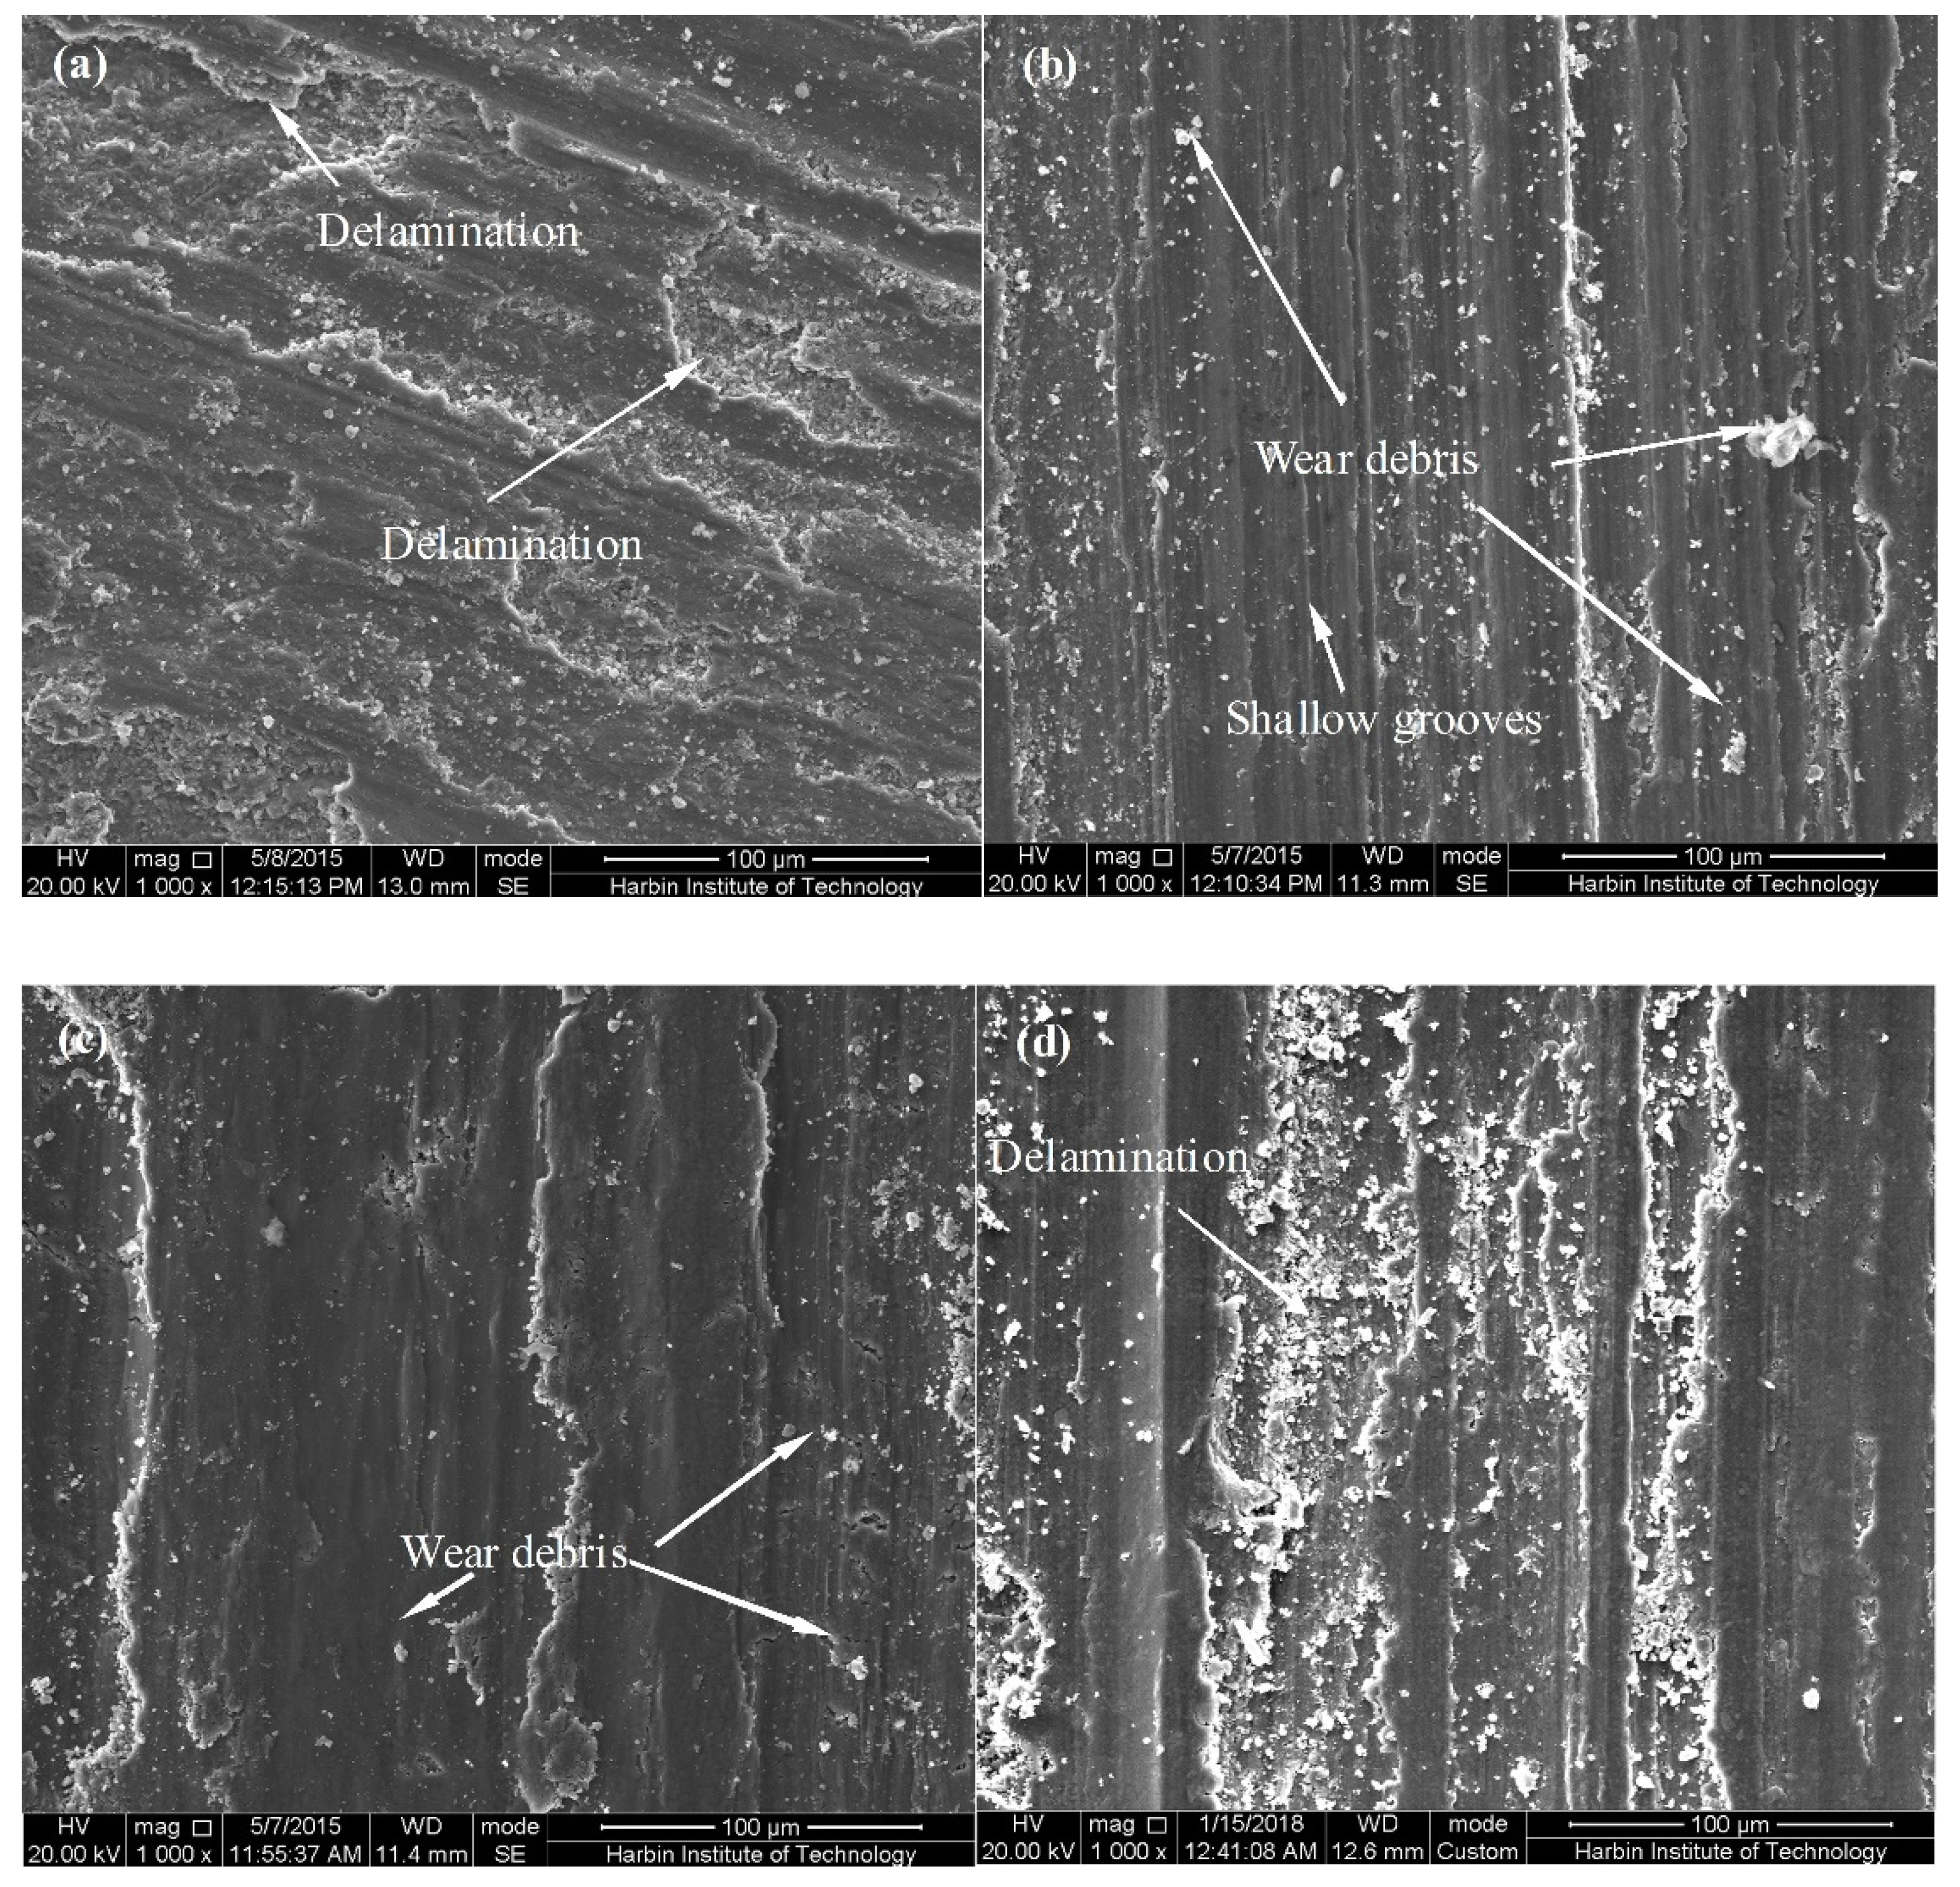
However, the wear rate does not keep the similar law to weight loss with an increase of applied load. As to wear rate, it firstly keeps a decrease and then increases with increasing applied load. This change in trend is in agreement with the rheoformed composite parts as shown in Figure 9g. Delamination is a dominant characteristic of the surface morphology of the worn sample (Figure 10). It illustrates that wear mechanism of the thixoformed composite under different applied load belongs to delamination wear. In addition, it can be noticed that the delamination area firstly decreases and then significantly increases with increasing load. It is consistent with the change law of the wear rate. Especially at an applied load of 50 N, the delamination area increases significantly, indicating a large weight loss. This is the main reason for increase of the wear rate.
3.4. Influence of Sliding Velocity on Tribological Behavior of the Rheoformed and Thixoformed Composite Parts
Friction coefficient, weight loss, and wear rate of the rheoformed composite parts at different sliding velocities are displayed in Figure 11. When sliding velocity is 0.8 m/s, friction coefficient shows a significant increase and a followed fluctuation with increasing time (Figure 11a), which is similar to those of above mentioned rheoformed and thixoformed composite parts. However, an increase of from 0.8 to 1.2 m/s led to an obvious change. As shown in Figure 11b, three stages such as significant increase, significant decrease, and fluctuation were found in the curve of friction coefficient vs time.
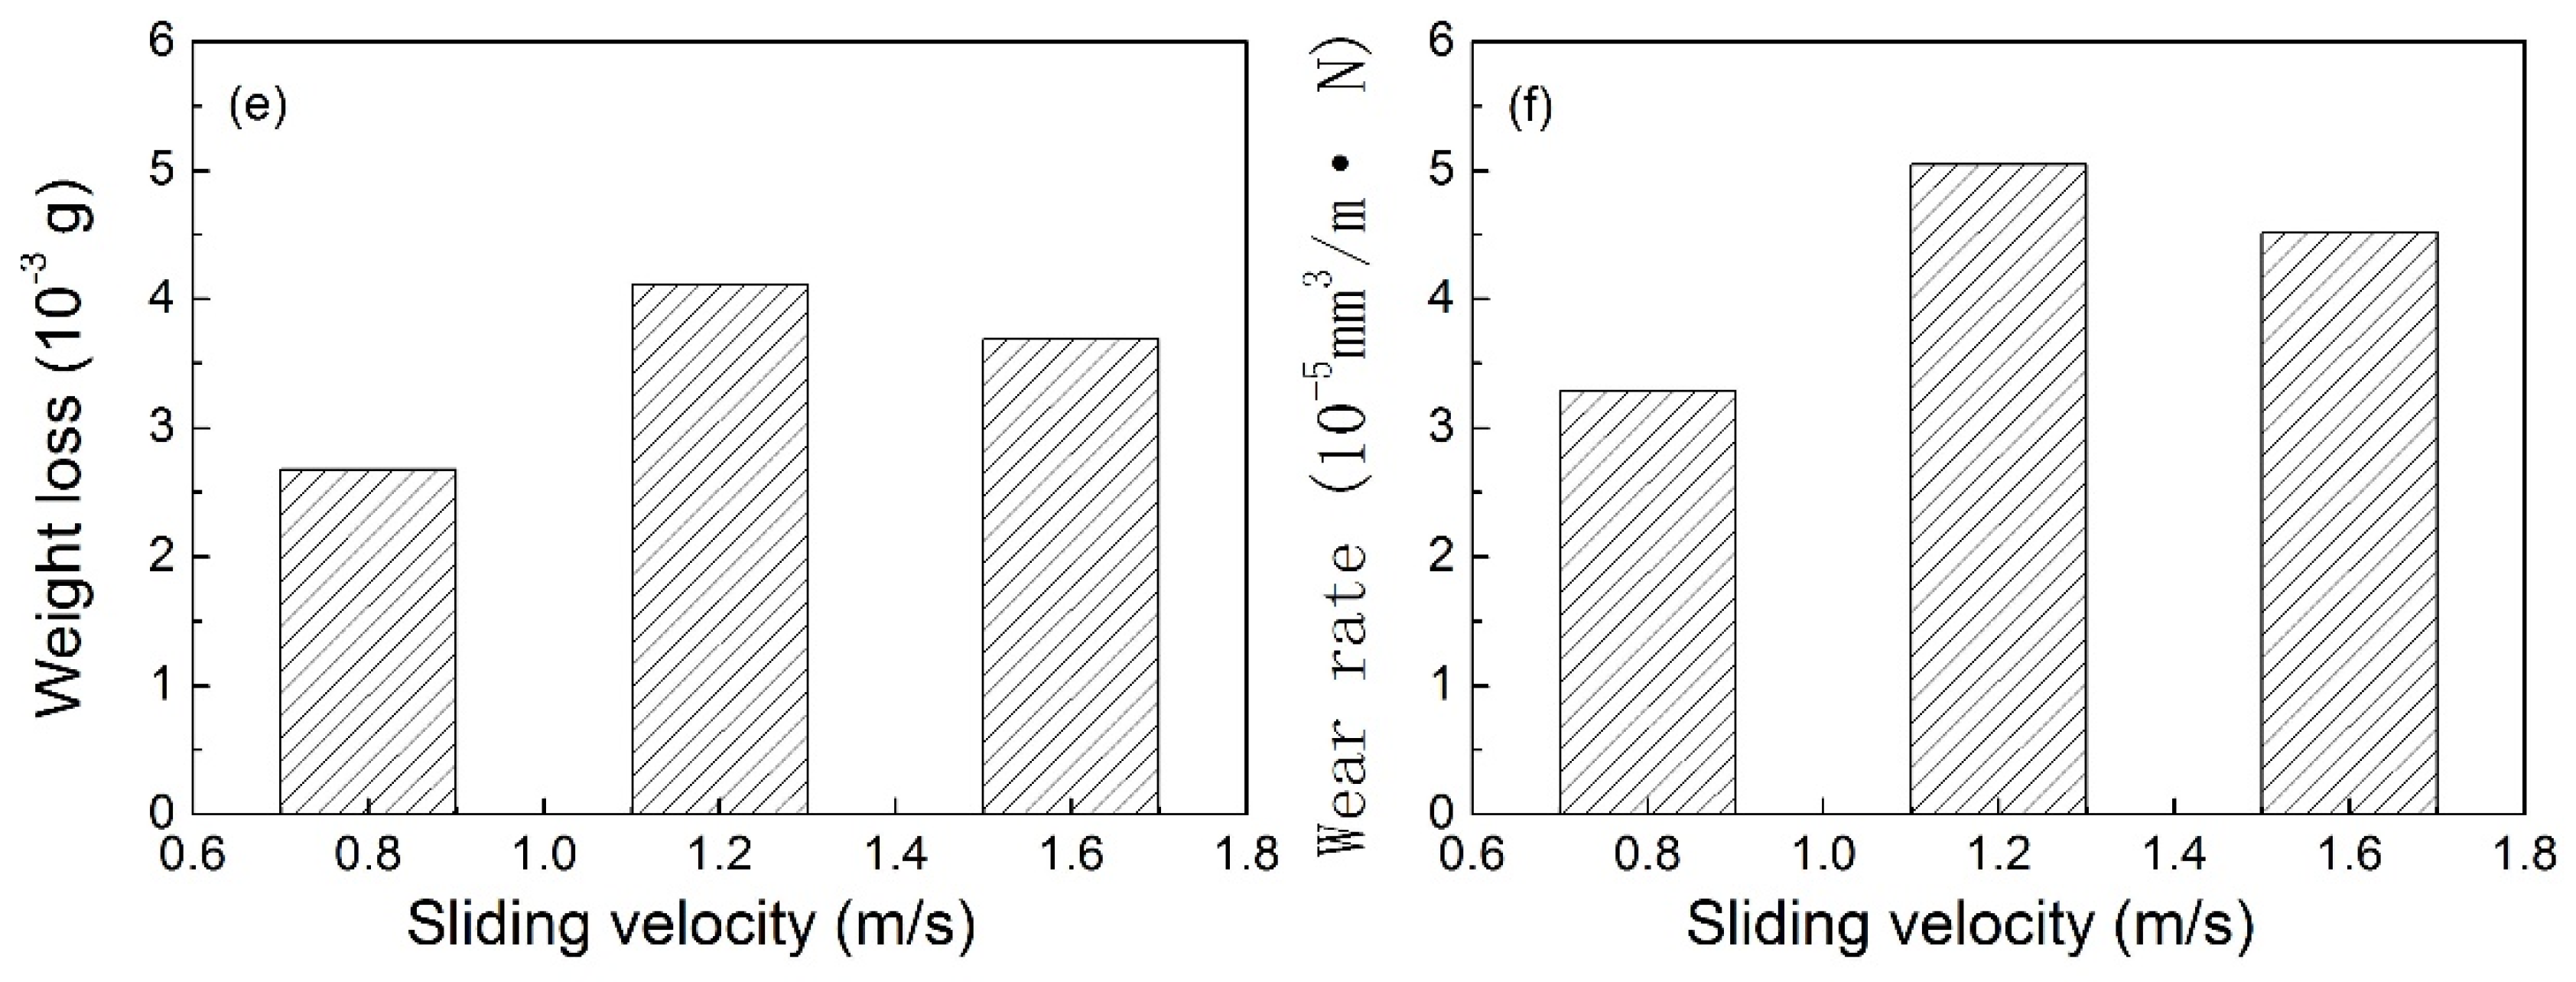
A peak value of friction coefficient presented in the curve. The curve of friction coefficient vs time at a sliding velocity of 1.6 m/s exhibits a different change from those at 1.2 m/s (Figure 11c). Friction coefficient shows a significant increase and then enters a fluctuation stage with increasing time. A little difference is its fluctuation extent is lower as compared with the curve at 0.8 m/s. Average friction coefficient firstly decreases and then increases a little with increasing sliding velocity (Figure 11d). Weight loss shows a first increase and then a followed decrease with increasing sliding velocity (Figure 11e). Wear rate exhibits a similar law to weight loss upon an increase of sliding velocity (Figure 11f). Delamination and shallow grooves were also found in the worn surface microstructure, indicating an adhesive wear and delamination wear (Figure 12).
Figure 13 depicts friction coefficient, weight loss, and wear rate of the thixoformed composite parts at different sliding velocities. A law of a significant increase and a fluctuation with increasing time was shown. A little difference among them is the fluctuation extents at 1.2 and 1.6 m/s are lower than that at 0.8 m/s. Average friction coefficient shows a decrease with increasing sliding velocity. This work shows a disagreement with the results obtained by Nartarajan et al. [35]. It may be due to effect of the different material sample and disc. Weight loss and wear rate exhibit a first increase and a decrease with increasing sliding velocity. Delamination and wear debris were found the worn surface microstructure (Figure 14), indicating delamination wear and adhesive wear play a role in the wear process of the thixoformed composite parts at different sliding velocities.
3.5. Influence of Volume Fraction of SiC Particle on Tribological Behavior of the Rheoformed and Thixoformed Composite Parts
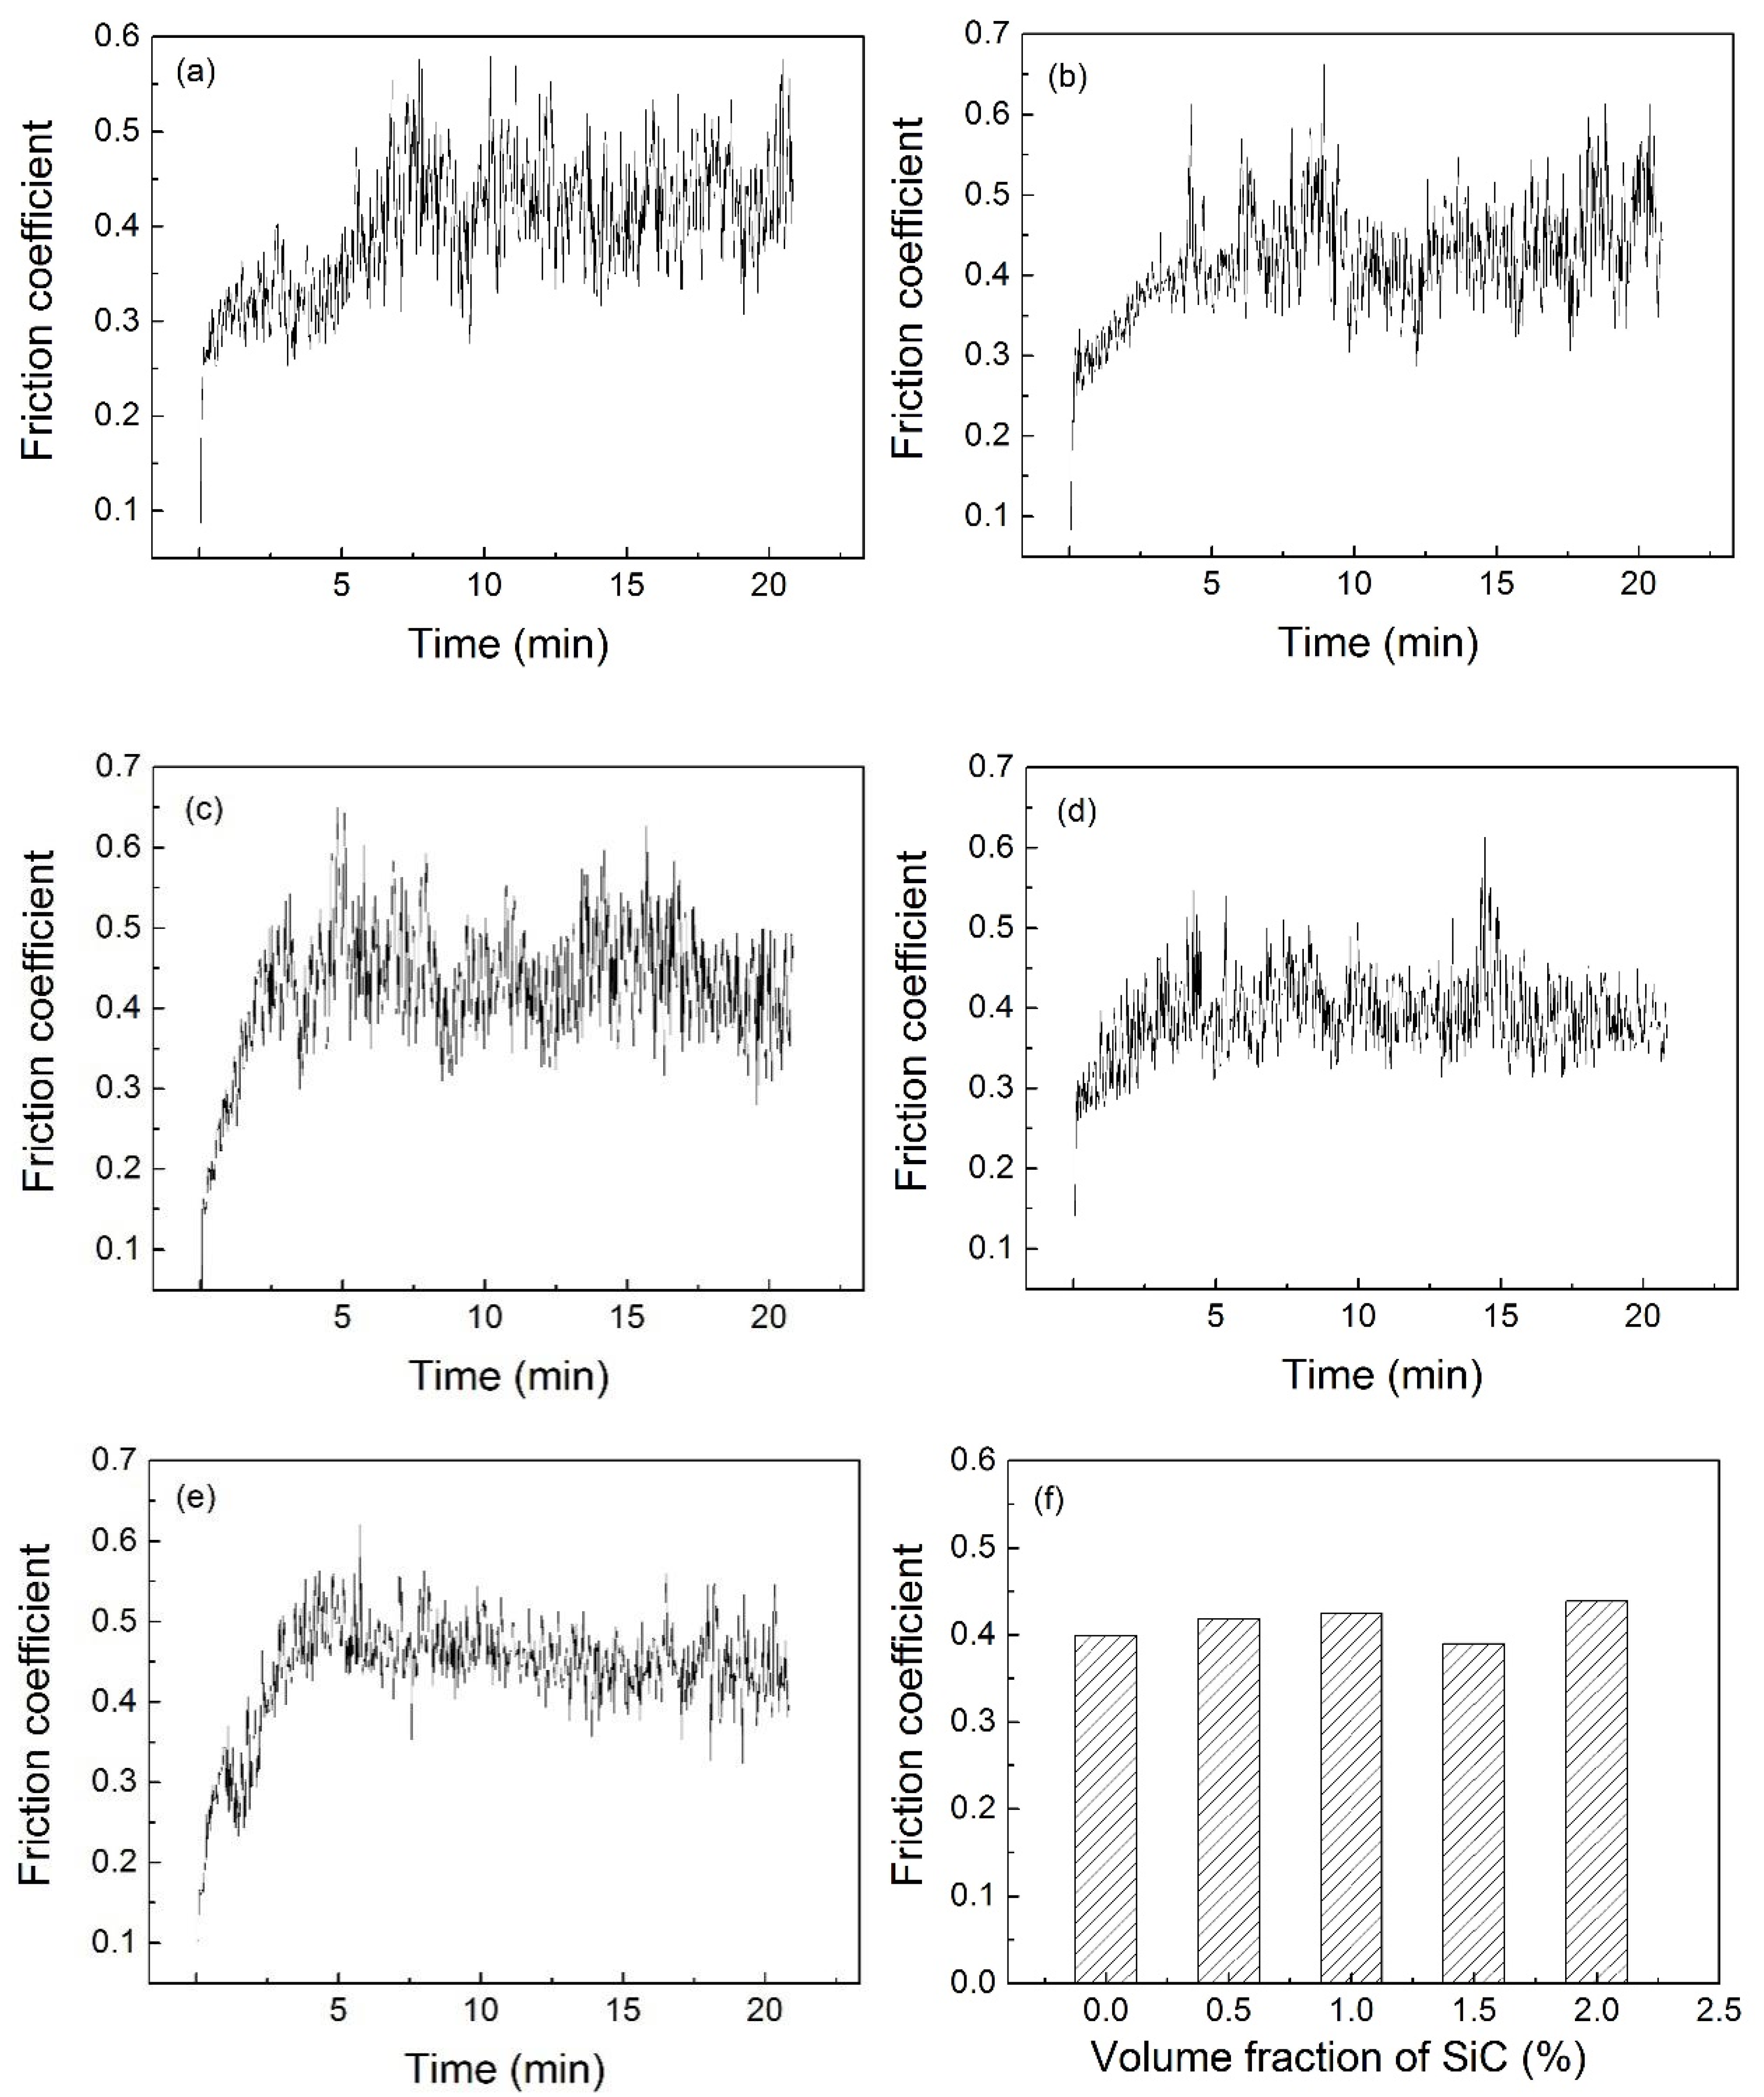
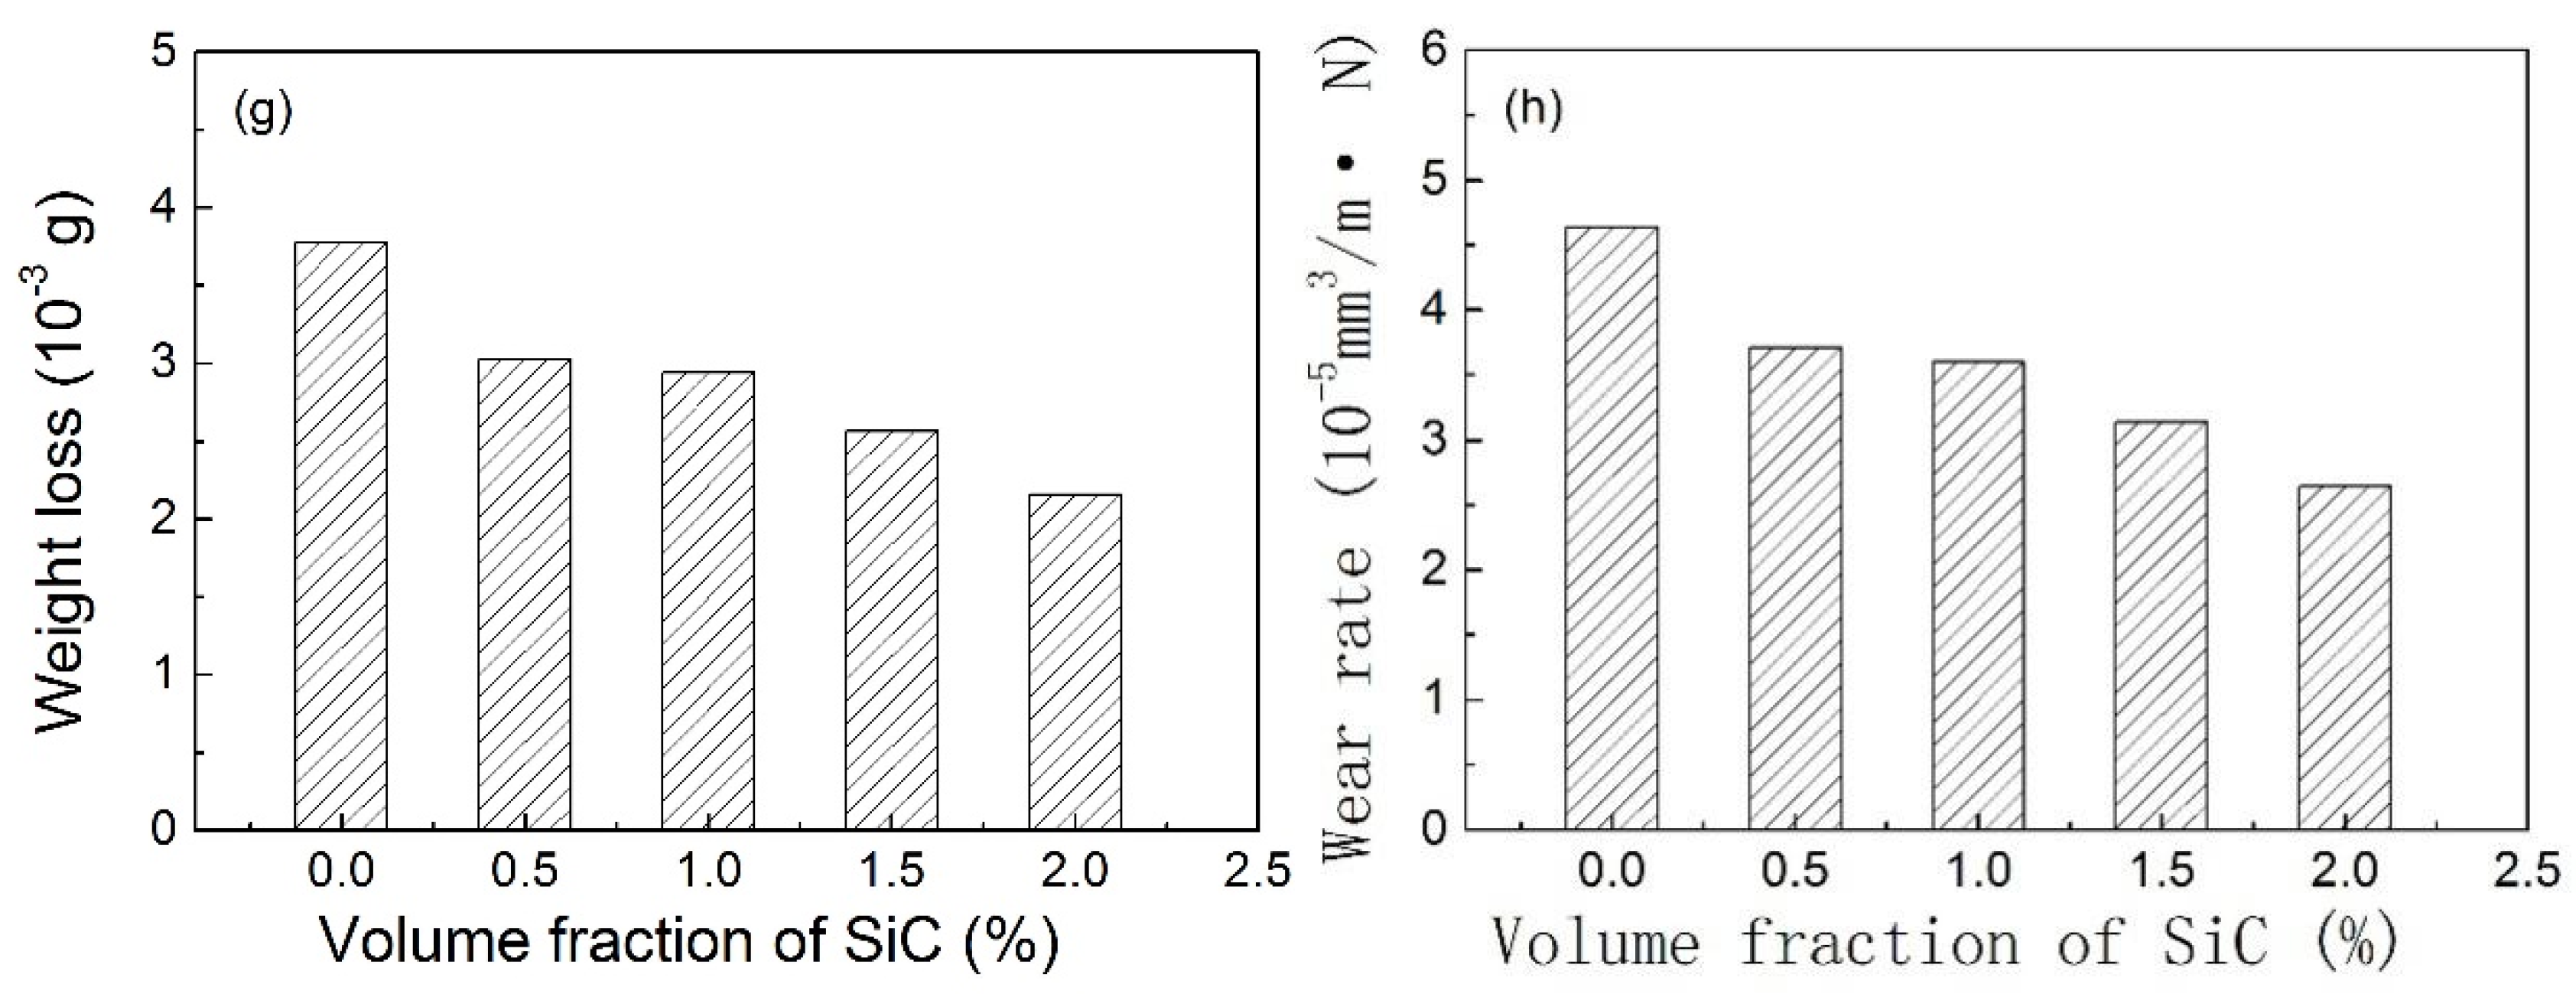
Figure 15 represents friction coefficient, weight loss, and wear rate of the rheoformed composite parts with different volume fraction of SiC particles. It is noted that friction coefficient also undergoes a significant increase and a fluctuation with increasing time (Figure 15a–e). It illustrates that the friction coefficient of the matrix 7075 aluminum alloy has a similar change law with those of the composite. The average friction coefficient varies from 0.4 to 0.44, and no obvious law is found in the curve of average friction coefficient with increasing volume fraction of SiC particles (Figure 15f). However, weight loss and wear rate decrease with increasing volume fraction of SiC particles (Figure 15g,h). The weight loss and wear rate of the matrix 7075 aluminum alloy are 3.78 × 10⁻³ g and 4.63 × 10⁻⁵ cm3/m·N, respectively. Upon an addition of 2% nano-sized SiC particles, the weight loss and wear rate reach 2.16 × 10⁻³ g and 2.64 × 10⁻⁵ mm3/m·N, respectively. The decrease extents are 42.8 and 43.0%, respectively. It illustrates that addition of nano-sized SiC particles can improve significantly the wear resistance of the composite parts. This work is consistent with the results presented in the A356/Al2O3 metal matrix composites by Alhawari et al. [24] and the stir cast AA6061-T6/AlNp composite, as reported by Kumar et al. [6]. The addition of nano-sized SiC particles with low coefficient of thermal expansion (CTE) into the alloy matrix with higher coefficient of thermal expansion led to mismatch of CTE of the composite, as mentioned by Kumar et al. [6] and Zhong et al. [36].
This contributes to the improved strength and wear resistance of the composite. An increase in the volume fraction of nano-sized SiC particles leads to an increase in dislocation density around the nano-sized SiC particles during solidification, as reported by Gutam and Srivastant [37]. The interaction between nano-sized SiC particles and dislocations also improves the wear resistance of the composite, as reported by Kumar et al. [6]. Delamination and shallow grooves were found in the worn surface microstructure (Figure 16). This shows that wear mechanisms depend mainly on delamination wear and adhesive wear.
4. Conclusions
(1) The curves of the friction coefficient vs time exhibit a significant increase and a followed fluctuation with increasing time. As for the rheoformed composite part at the different semisolid stirring temperature, the average value of the steady-state friction coefficient varies from 0.42 to 0.46. This semisolid stirring temperature has a little influence on the friction and wear resistance of the rheoformed composite parts. As for the thixoformed composite parts, the average value of the steady-state friction coefficient increases firstly and then decreases with an increase in the reheating temperature. When the reheating temperature increases from 580 to 600 °C, the average value of steady-state friction coefficient increases from 0.41 to 0.54. The average value of the steady-state friction coefficient decreases to from 0.54 to 0.50 upon a further increase from 600 to 610 °C. The best wear resistance was achieved in the thixoformed composite part at a reheating temperature of 580 °C. The dominant wear mechanisms of the rheoformed and thixoformed composite parts involve adhesive wear, abrasive wear and delamination wear.
(2) As for the rheoformed composite part, the average value of the steady-state friction coefficient varies from 0.37 to 0.45 upon the applied loads of from 20 to 50 N. The weight loss increases slightly upon an increase of applied load from 20 to 40 N. However, it was noted that the weight loss increase significantly when the applied load reached 50 N. The wear rate decreases obviously and then slightly increases with the increasing applied load. Delamination, wear debris, and shallow grooves indicate wear mechanisms depend on delamination wear, abrasive wear, and adhesive wear. As for the thixoformed composite part, the average value of the steady-state friction coefficient decreased with the increasing applied load. Weight loss decreased with the increasing applied load. However, the wear rate firstly decreases with the increasing applied load and then increases.
(3) As for the rheoformed composite part, the average value of the steady-state friction coefficient firstly decreases and then increases a little with the increasing sliding velocity. Weight loss and wear rate show, at first, an increase and followed by a decrease with regard to the increasing sliding velocity. As for the thixoformed composite part, the average value of the steady-state friction coefficient shows a decrease with increasing sliding velocity. Weight loss and wear rate exhibit, at first, an increase and a then decrease with the increasing sliding velocity. Adhesive wear and delamination wear are the dominant wear mechanisms of the rheoformed and thixoformed composite parts at different sliding velocities.
(4) The average value of the steady-state friction coefficient varies from 0.4 to 0.44 and no obvious law is found in the curve of the friction coefficient with the increasing volume fraction of the SiC particles. However, weight loss and wear rate decrease with the increasing volume fraction of the SiC particles. The wear resistance of the composite parts was improved significantly due to the addition of the nano-sized SiC particles. An increase in the dislocation density around the nano-sized SiC particles and the mismatch of the coefficient of thermal expansion (CTE) between the 7075 matrix and the nano-sized SiC particles during solidification improved the wear resistance of the composite.
Acknowledgments
This work is supported by the Natural Science Foundation of China (NSFC) under Grant No.51375112.
Author Contributions
Jufu Jiang designed most experiments, analyzed the results and wrote this manuscript. Guanfei Xiao and Yingze Liu performed most experiments. Ying Wang helped analyze the experimental data and gave some constructive suggestions about how to write this manuscript.
Conflicts of Interest
The authors declare no conflicts of interest.
References
- Lee, S.S.; Yeo, J.S.; Hong, S.H.; Yoon, D.J.; Na, K.H. The fabrication process and mechanical properties of SiCp/Al-Si metal matrix composites for automobile air-conditioner compressor piston. J. Mater. Process. Technol. 2001, 113, 202–208. [Google Scholar] [CrossRef]
- Tjong, S.C.; Ma, Z.Y. High-temperature creep behaviour of powder-metallurgy aluminium composites reinforced with SiC particles of various sizes. Compos. Sci. Technol. 1999, 59, 1117–1125. [Google Scholar] [CrossRef]
- Tatar, C.; Özdemir, N. Investigation of thermal conductivity and microstructure of the α-Al2O3 particulate reinforced aluminum composites (Al/Al2O3-MMC) by powder metallurgy method. Phys. B Condens. Matter 2010, 405, 896–899. [Google Scholar] [CrossRef]
- Zhang, Q.; Wu, G.H.; Chen, G.Q.; Jiang, L.T.; Luan, B.F. The thermal expansion and mechanical properties of high reinforcement content SiCp/Al composites fabricated by squeeze casting technology. Compos. Part A 2003, 34, 1023–1027. [Google Scholar] [CrossRef]
- Abdollahi, A.; Alizadeh, A.; Baharvandi, H.R. Dry sliding tribological behavior and mechanical properties of Al2024–5 wt. % B4C nanocomposite produced by mechanical milling and hot extrusion. Mater. Des. 2014, 55, 471–481. [Google Scholar] [CrossRef]
- Kumar, B.A.; Murugan, N.; Dinaharan, I. Dry sliding wear behavior of stir cast AA6061-T6/AlNp composite. Trans. Nonferr. Met. Soc. China 2014, 24, 2785–2795. [Google Scholar] [CrossRef]
- Onat, A. Mechanical and dry sliding wear properties of silicon carbide particulate reinforced aluminium-copper alloy matrix composites produced by direct squeeze casting method. J. Alloy. Compd. 2010, 489, 119–124. [Google Scholar] [CrossRef]
- Mazahery, A.; Shabani, M.O. Microstructural and abrasive wear properties of SiC reinforced aluminum-based composite produced by compocasting. Trans. Nonferr. Met. Soc. China 2013, 23, 1905–1914. [Google Scholar] [CrossRef]
- Mindivan, H.; Kayali, E.S.; Cimenoglu, H. Tribological behavior of squeeze cast aluminum matrix composites. Wear 2008, 265, 645–654. [Google Scholar] [CrossRef]
- Spencer, D.B. Rheology of liquid-solid mixtures of lead-tin. Ph.D. Thesis, Massachusetts Institute of Technology, Cambridge, MA, USA, 1971. [Google Scholar]
- Spencer, D.B.; Mehrabian, R.; Flemings, M.C. Rheological behavior of Sn-15 pct Pb in the crystallization range. Metall. Trans. B 1972, 3, 1925–1932. [Google Scholar] [CrossRef]
- Flemings, M.C. Behavior of metal alloys in the semisolid state. J. Metall. Trans. B 1991, 22A, 957–981. [Google Scholar] [CrossRef]
- Guan, R.G.; Zhaom, Z.Y.; Zhang, H.; Lian, C.; Lee, C.S.; Liu, C.M. Microstructure evolution and properties of Mg-3Sn-1Mn (wt. %) alloy strip processed by semisolid rheo-rolling. J. Mater. Process. Technol. 2012, 212, 1430–1436. [Google Scholar] [CrossRef]
- Guan, R.G.; Zhao, Z.Y.; Lee, C.S.; Zhang, Q.S.; Liu, C.M. Effect of wavelike sloping plate rheocasting on microstructures of hypereutectic Al-18 pct Si-5 pct Fe alloys. Metall. Trans. B 2012, 43, 337–343. [Google Scholar] [CrossRef]
- Bolouri, A.; Kang, C.G. Characteristics of thixoformed A356 aluminum thin plates with microchannels. Mater. Charact. 2013, 82, 86–96. [Google Scholar] [CrossRef]
- Chayong, S.; Atkinson, H.V.; Kapranos, P. Thixoforming 7075 aluminium alloys. Mater. Sci. Eng. A 2005, 390, 3–12. [Google Scholar] [CrossRef]
- Birol, Y. Comparison of thixoformability of AA6082 reheated from the as-cast and extruded states. J. Alloy. Compd. 2008, 461, 132–138. [Google Scholar] [CrossRef]
- Guan, L.N.; Geng, L.; Zhang, H.W.; Huang, L.J. Effects of stirring parameters on microstructure and tensile properties of (ABOw + SiCp)/6061Al composites fabricated by semi-solid stirring technique. Trans. Nonferr. Met. Soc. China 2011, 21, s274–s279. [Google Scholar] [CrossRef]
- Cheng, F.L.; Chen, T.J.; Qi, Y.S.; Zhang, S.Q.; Yao, P. Effects of solution treatment on microstructure and mechanical properties of thixoformed Mg2Sip/AM60B composite. J. Alloy. Compd. 2015, 636, 48–60. [Google Scholar] [CrossRef]
- Kang, C.G.; Youn, S.W. Mechanical properties of particulate reinforced metal matrix composites by electromagnetic and mechanical stirring and reheating process for thixoforming. J. Mater. Process. Technol. 2004, 147, 10–22. [Google Scholar] [CrossRef]
- Zhang, H.W.; Geng, L.; Guan, L.N.; Huang, L.J. Effects of SiC particle pretreatment and stirring parameters on the microstructure and mechanical properties of SiCp/Al-6.8Mg composites fabricated by semi-solid stirring technique. Mater. Sci. Eng. A 2010, 528, 513–518. [Google Scholar] [CrossRef]
- Mazahery, A.; Shabani, M.O. Tribological behaviour of semisolid–semisolid compocast Al-Si matrix composites reinforced with TiB2 coated B4C particulates. Ceram. Int. 2012, 38, 1887–1895. [Google Scholar] [CrossRef]
- Curle, U.A.; Ivanchev, L. Wear of semi-solid rheocast SiCp/Al metal matrix composites. Trans. Nonferr. Met. Soc. China 2010, 20, s852–s856. [Google Scholar] [CrossRef]
- Alhawari, K.S.; Omar, M.Z.; Ghazali, M.J.; Salleh, M.S.; Mohammed, M.N. Wear properties of A356/Al2O3 metal matrix composites produced by semisolid processing. Procedia Eng. 2013, 68, 186–192. [Google Scholar] [CrossRef]
- Sarajan, Z. Friction and wear of aluminum alloy reinforced by TiO2 particles. Strength Mater. 2013, 45, 221–230. [Google Scholar] [CrossRef]
- Koli, D.K.; Agnihotri, G.; Purohit, R. A review on properties, behaviour and processing methods for Al-nano Al2O3 composites. Procedia Mater. Sci. 2014, 6, 567–589. [Google Scholar] [CrossRef]
- Mazahery, A.; Shabani, M.O. Characterization of cast A356 alloy reinforced with nano SiC composites. Trans. Nonferr. Met. Soc. China 2012, 22, 275–280. [Google Scholar] [CrossRef]
- Mazahery, A.; Abdizadeh, H.; Baharvandi, H.R. Development of high-performance A356/nano-Al2O3 composites. Mater. Sci. Eng. A 2009, 518, 61–64. [Google Scholar] [CrossRef]
- Sajjadi, S.A.; Parizi, M.T.; Ezatpour, H.R.; Sedghi, A. Fabrication of A356 composite reinforced with micro and nano Al2O3 particles by a developed compocasting method and study of its properties. J. Alloy. Compd. 2012, 511, 226–231. [Google Scholar] [CrossRef]
- Jiang, J.F.; Wang, Y. Microstructure and mechanical properties of the semisolid slurries and rheoformed component of nano-sized SiC/7075 aluminum matrix composite prepared by ultrasonic-assisted semisolid stirring. Mater. Sci. Eng. A 2015, 639, 350–358. [Google Scholar] [CrossRef]
- Jiang, J.F.; Wang, Y. Microstructure and mechanical properties of the rheoformed cylindrical part of 7075 aluminum matrix composite reinforced with nano-sized SiC particles. Mater. Des. 2015, 79, 32–41. [Google Scholar] [CrossRef]
- Jiang, J.F.; Wang, Y.; Nie, X.; Xiao, G.F. Microstructure evolution of semisolid billet of nano-sized SiCp/7075 aluminum matrix composite during partial remelting process. Mater. Des. 2016, 96, 36–43. [Google Scholar] [CrossRef]
- Standarization Administration of the People’s Republic China. High-Carbon Chromium Bearing Steel; PRC National Standard GB/T18254-2016; Standarization Administration of the People’s Republic China: Beijing, China, 2016.
- Zhang, S.Y.; Wang, F.P. Comparison of friction and wear performances of brake material dry sliding against two aluminum matrix composites reinforced with different SiC particles. J. Mater. Process. Technol. 2007, 182, 122–127. [Google Scholar] [CrossRef]
- Natarajan, N.; Vijayarangan, S.; Rajendran, I. Wear behaviour of A356/25SiCp aluminium matrix composites sliding against automobile friction material. Wear 2006, 261, 812–822. [Google Scholar] [CrossRef]
- Zhong, X.L.; Wong, W.L.E.; Gupta, M. Enhancing strength and ductility of magnesium by integrating it with aluminum nanoparticles. Acta Mater. 2007, 55, 6338–6344. [Google Scholar] [CrossRef]
- Gutam, M.; Srivastant, T.S. Interrelationship between matrix microhardness and ultimate tensile strength of discontinuous particulate-reinforced aluminum alloy composites. Mater. Lett. 2001, 51, 255–261. [Google Scholar]
Figure 1.
Micrographs of the rheoformed and thixoformed nanocomposite parts. (a) metallograph of the rheoformed at a stirring temperature of 620 °C (b) metallograph of the thixoformed at a remelting temperature of 590 °C. (c) TEM image of the rheoformed part (d) TEM image of the thixoformed part.
Figure 1.
Micrographs of the rheoformed and thixoformed nanocomposite parts. (a) metallograph of the rheoformed at a stirring temperature of 620 °C (b) metallograph of the thixoformed at a remelting temperature of 590 °C. (c) TEM image of the rheoformed part (d) TEM image of the thixoformed part.
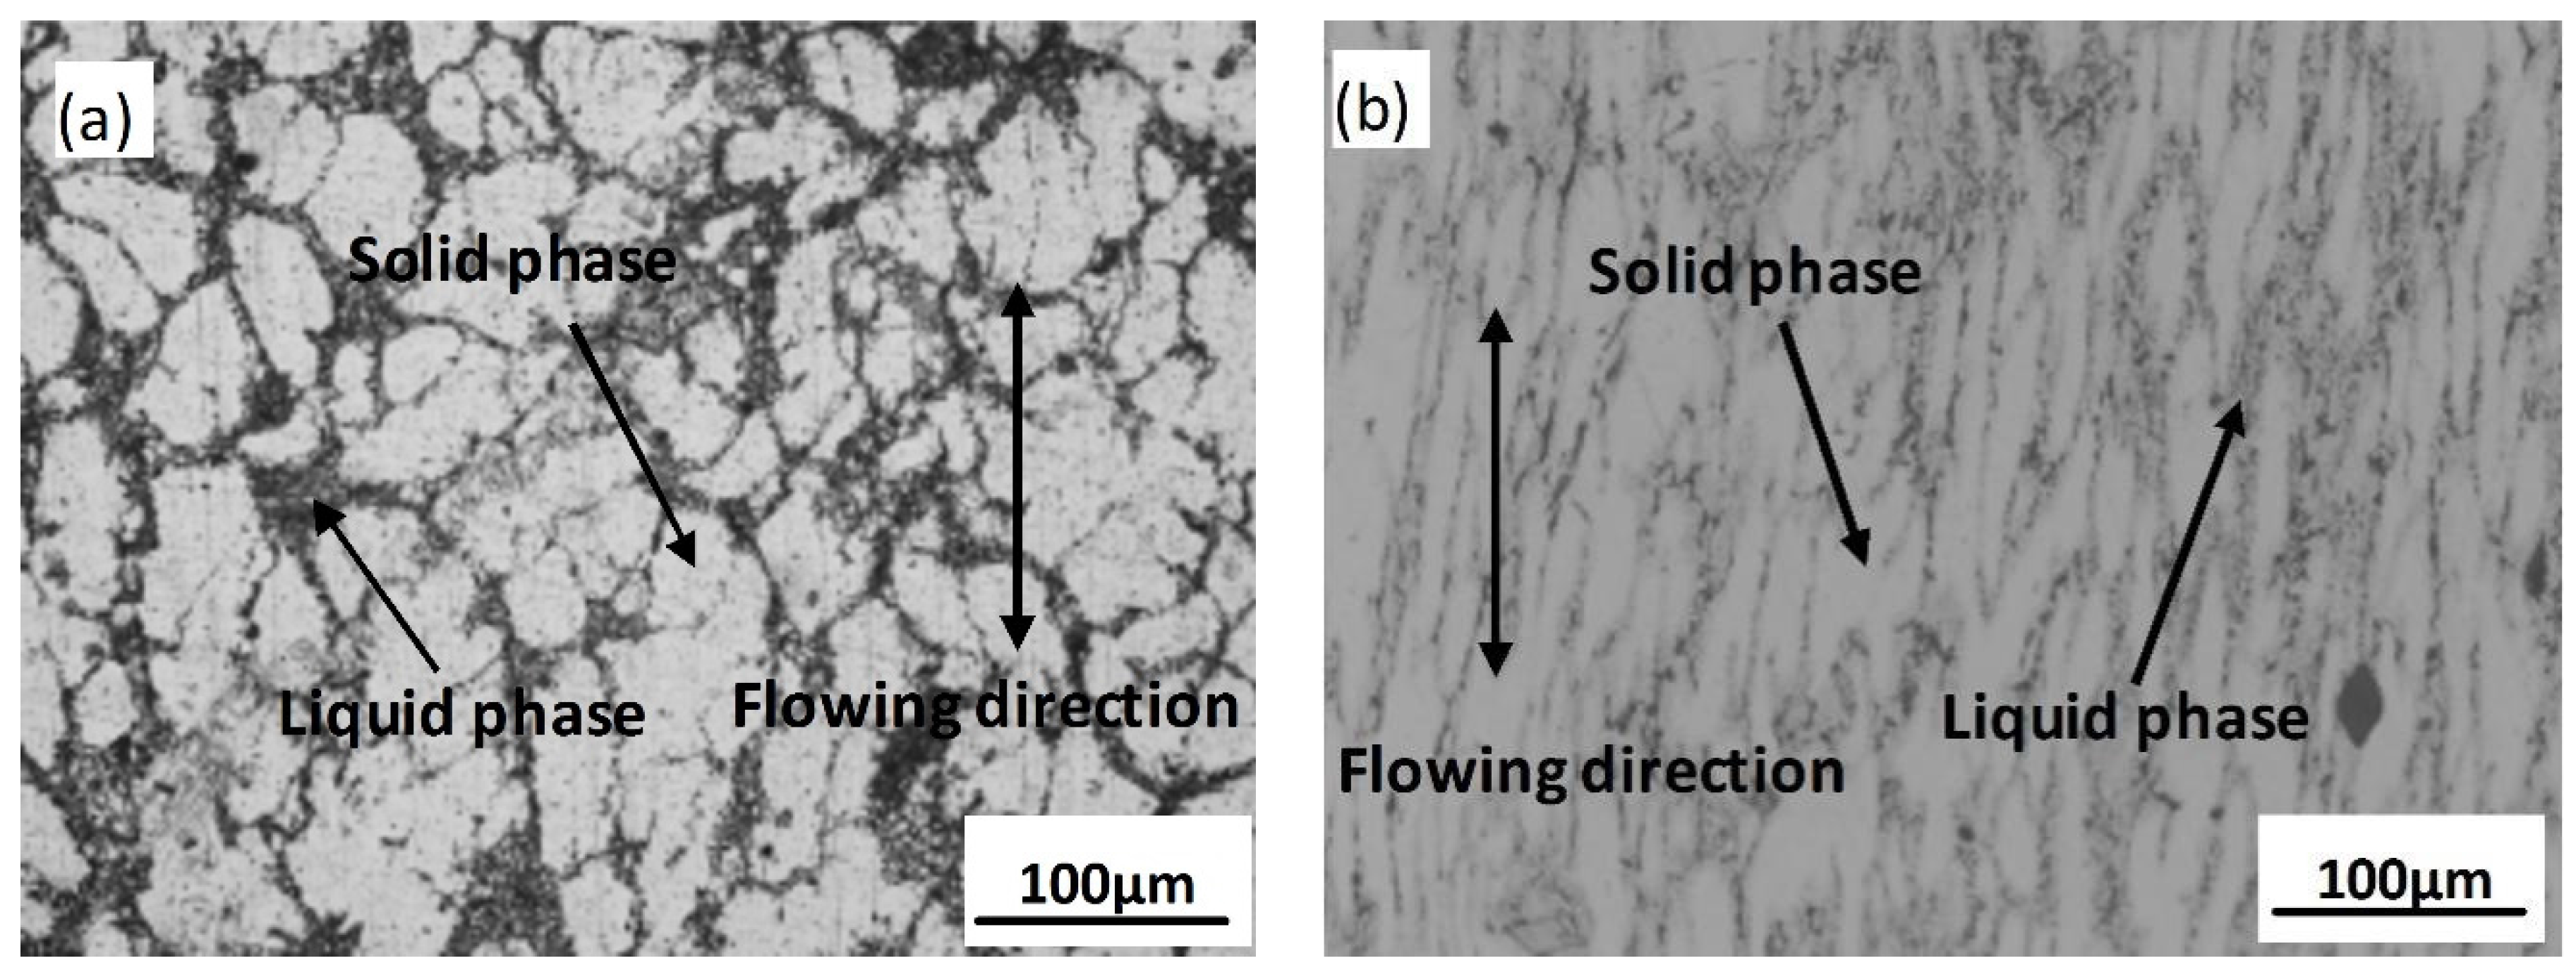

Figure 2.
Friction coefficient, weight loss and wear rate of the rheoformed composite parts at different semisolid stirring temperatures: (a) friction coefficient at 615 °C, (b) friction coefficient at 620 °C, (c) friction coefficient at 625 °C, (d) friction coefficient at 628 °C, (e) average friction coefficient, (f) weight loss and (g) wear rate.
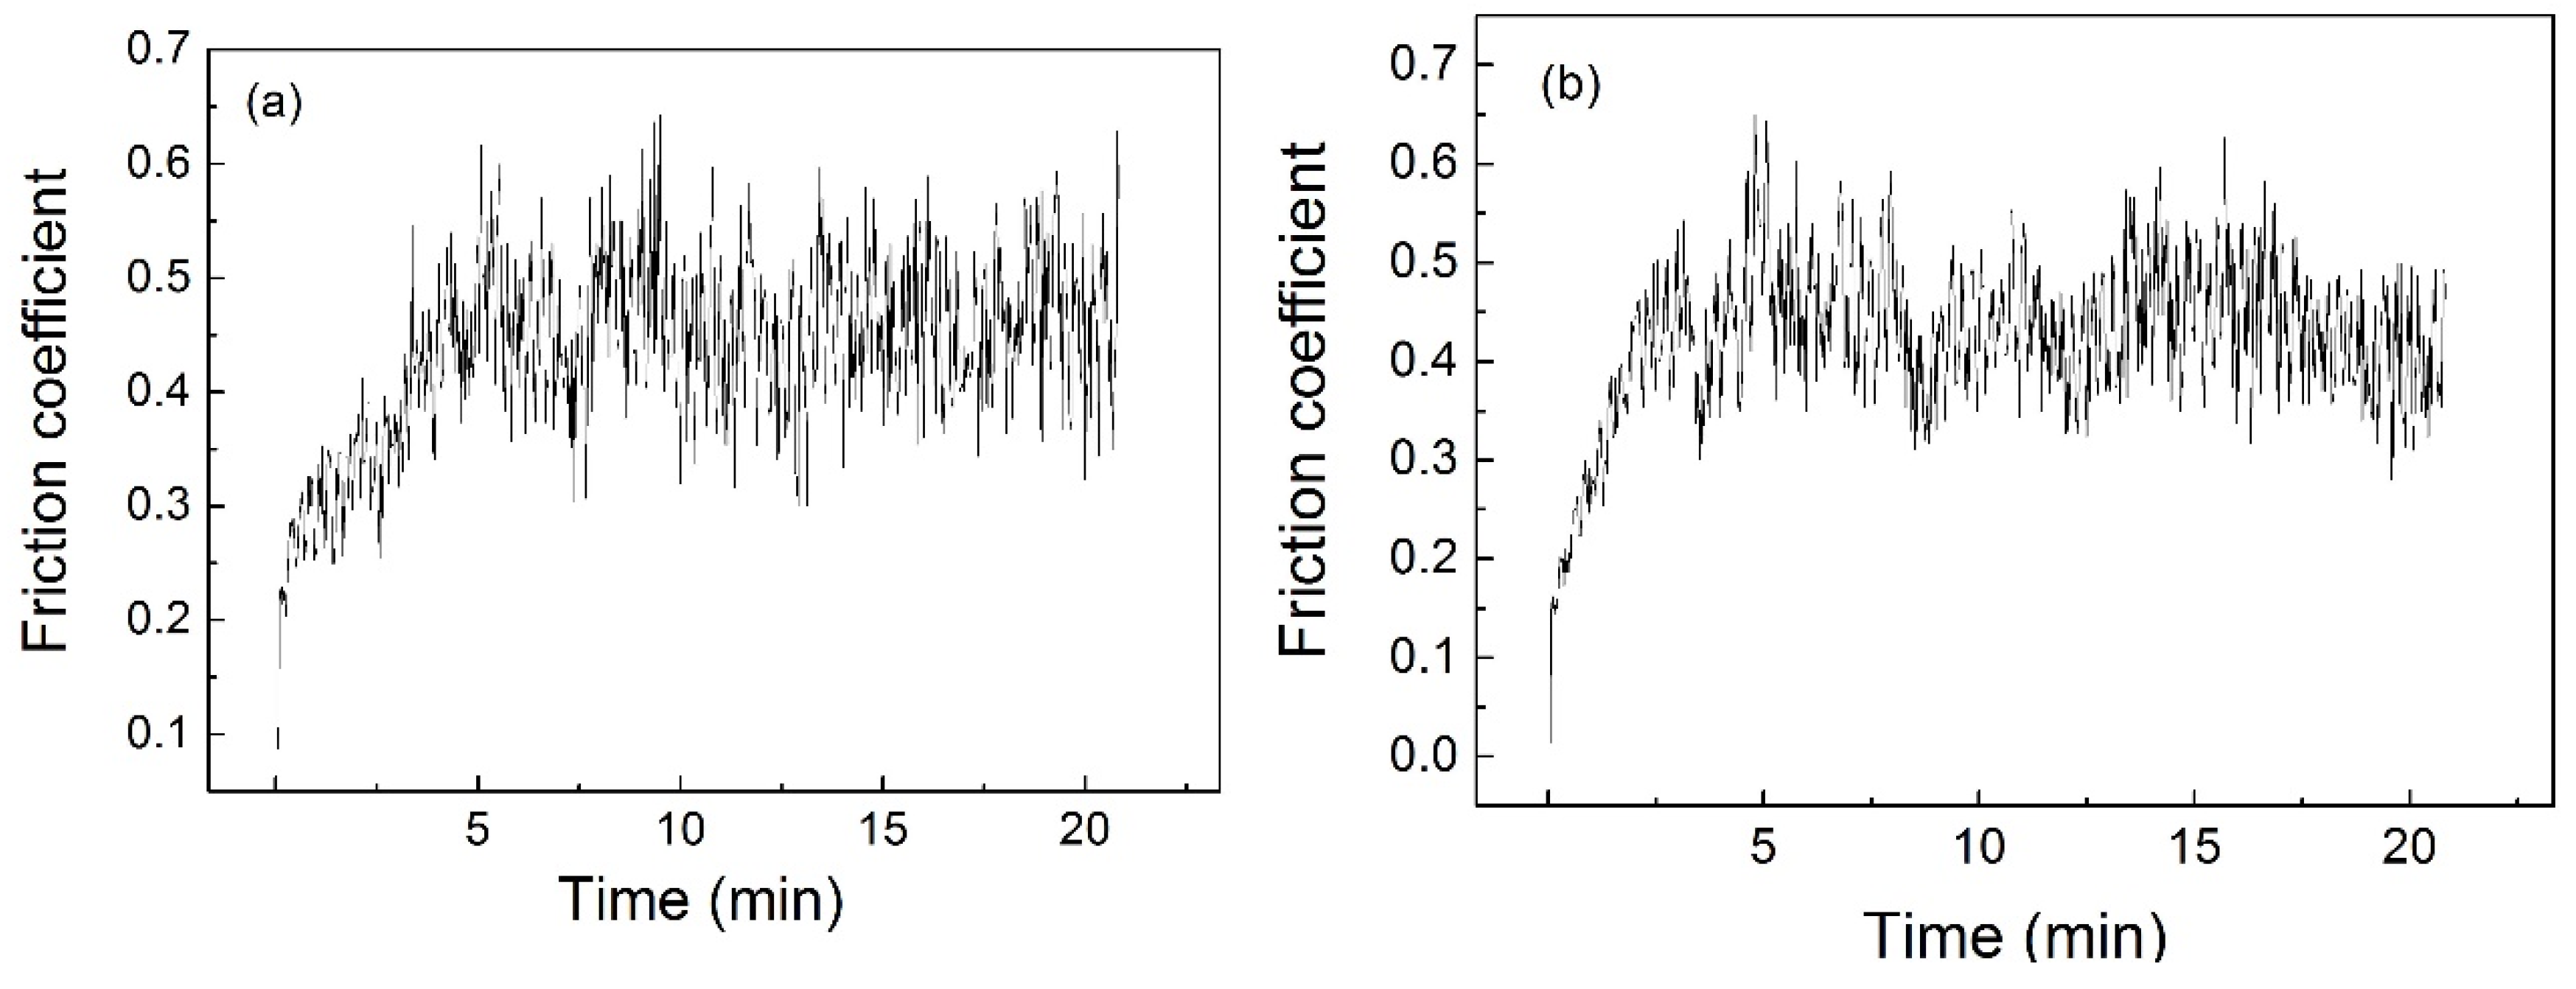
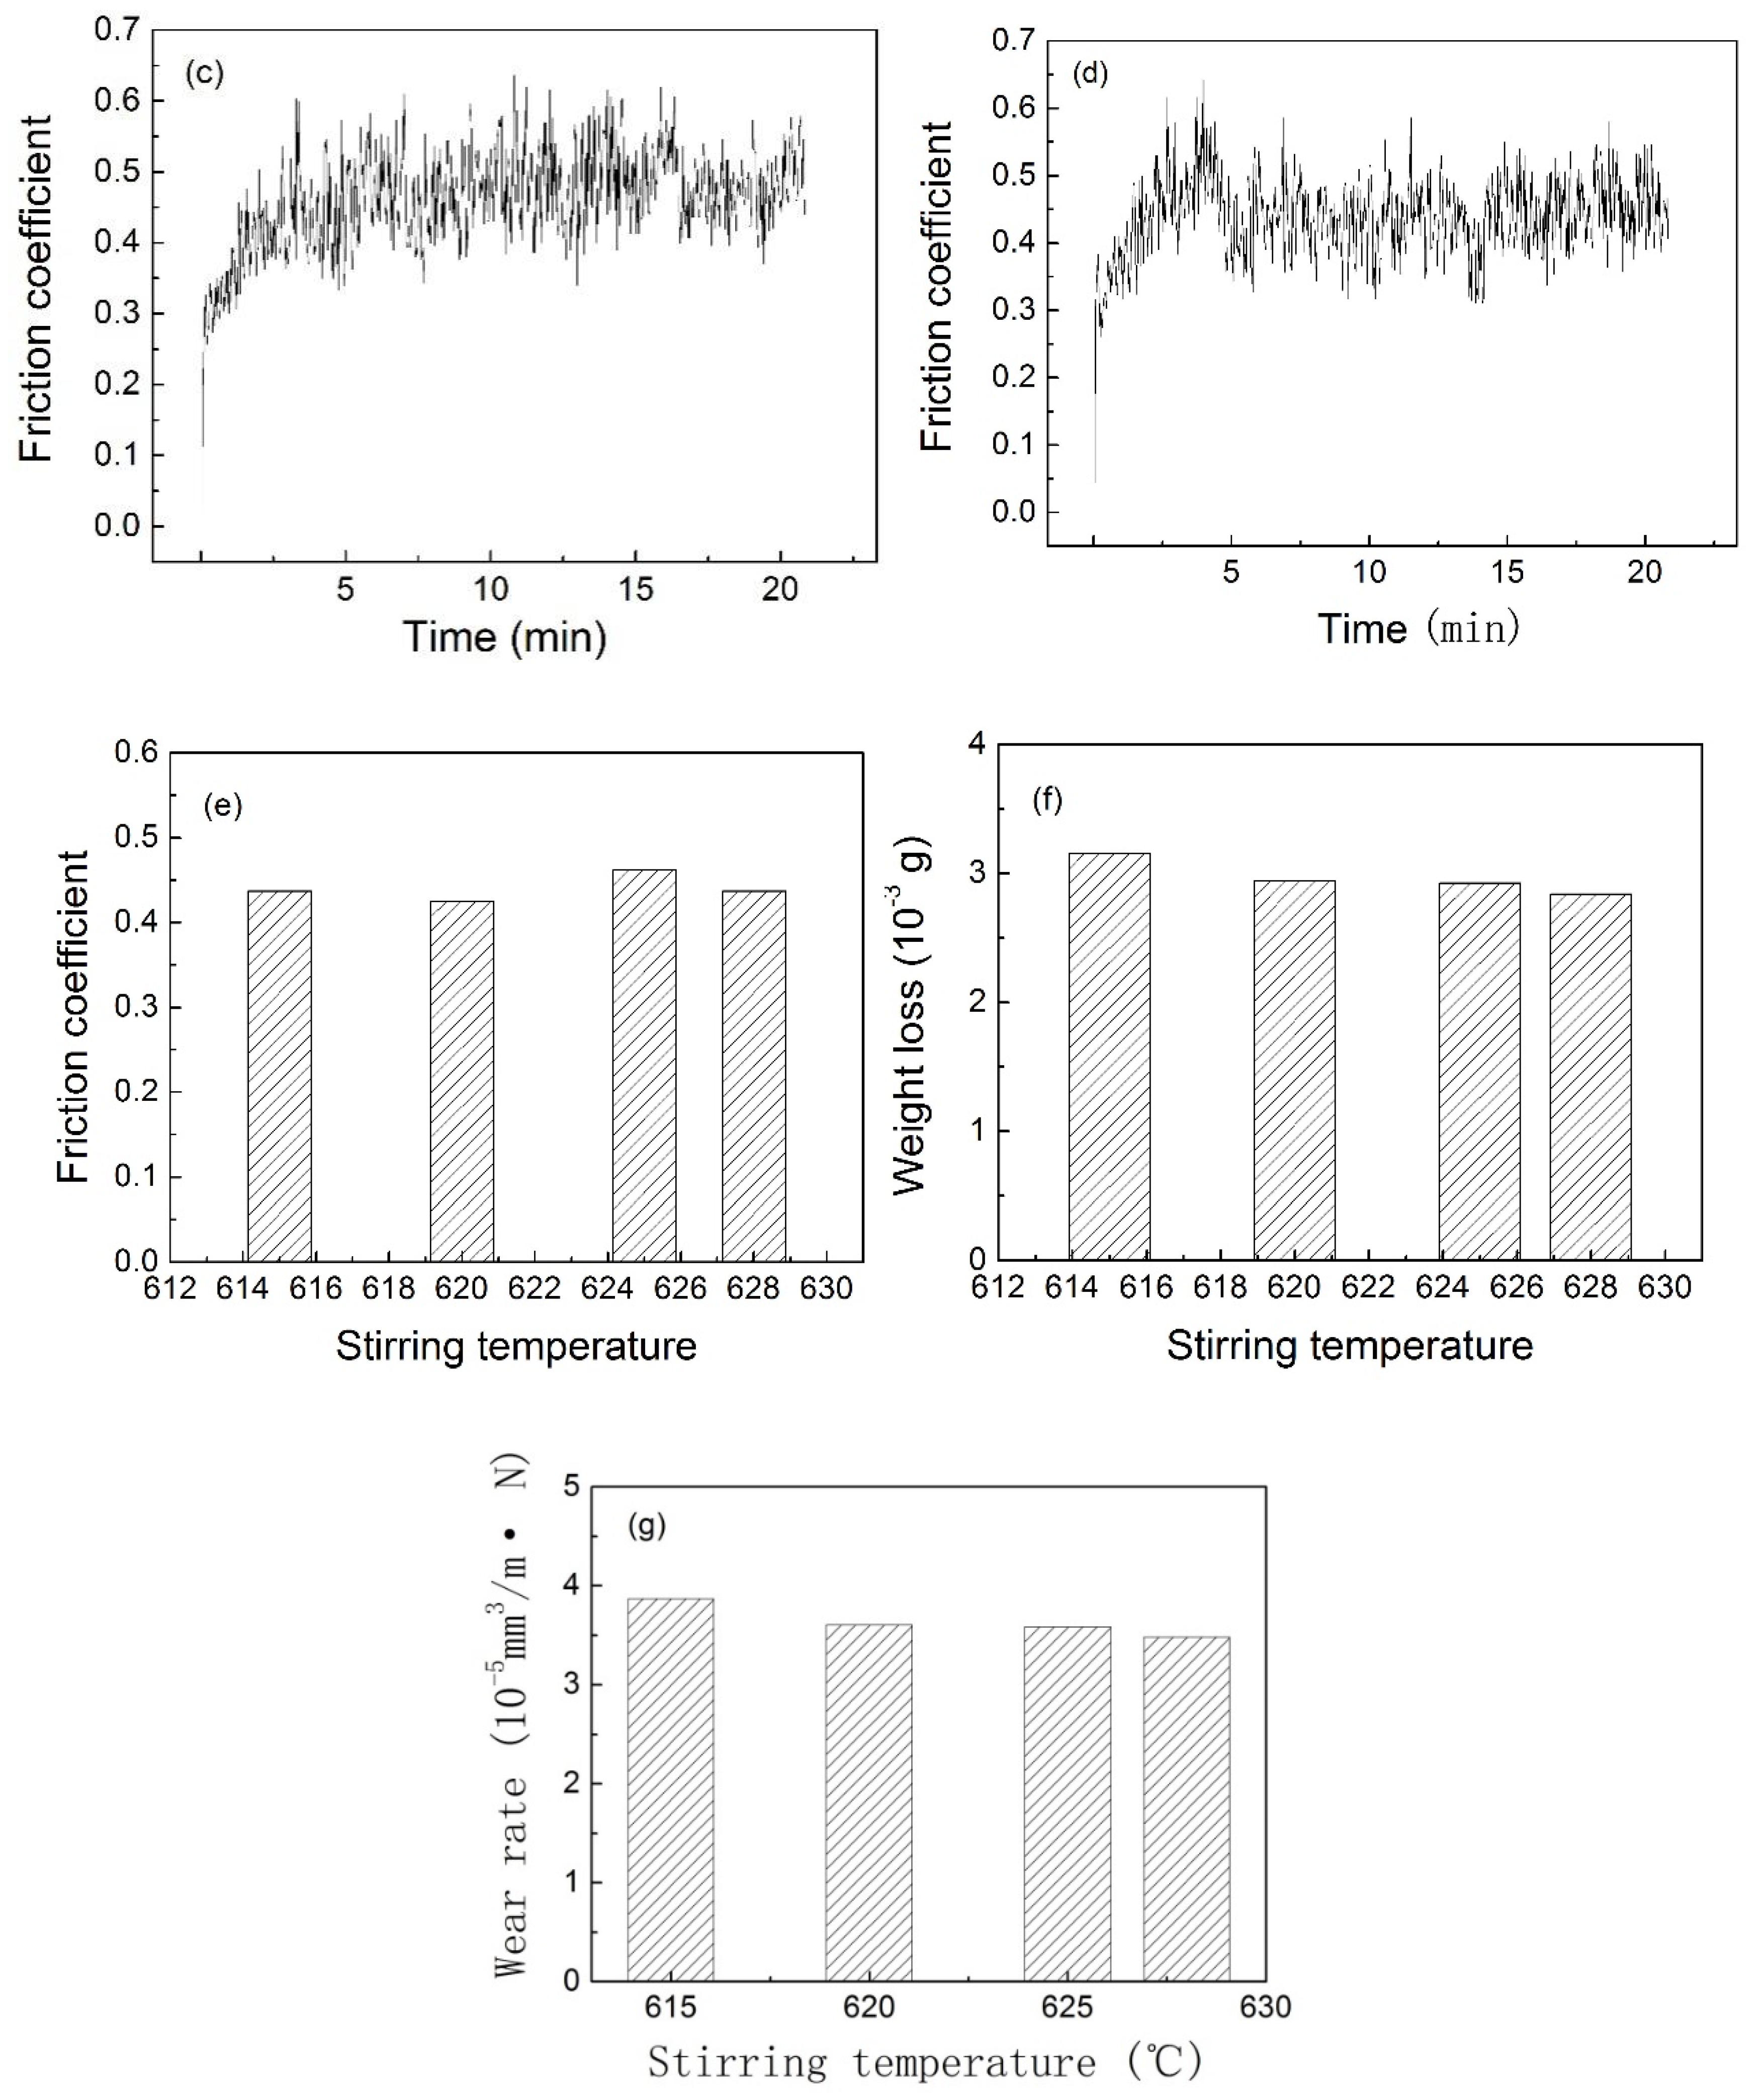
Figure 3.
SEM images showing the worn surface morphology of the rheoformed composite parts at different semisolid stirring temperatures: (a) 615 °C, (b) 620 °C, (c) 625 °C and (d) 628 °C.
Figure 3.
SEM images showing the worn surface morphology of the rheoformed composite parts at different semisolid stirring temperatures: (a) 615 °C, (b) 620 °C, (c) 625 °C and (d) 628 °C.

Figure 4.
Energy dispersive X-ray (EDX) analysis of the rheoformed composite parts at a semisolid stirring temperature of 620 °C: (a) SEM micrograph and (b) distribution of elements.
Figure 4.
Energy dispersive X-ray (EDX) analysis of the rheoformed composite parts at a semisolid stirring temperature of 620 °C: (a) SEM micrograph and (b) distribution of elements.

Figure 5.
Friction coefficient, weight loss and wear rate of the thixoformed composite parts at different reheating temperatures: (a) friction coefficient at 580 °C, (b) friction coefficient at 590 °C, (c) friction coefficient at 600 °C, (d) friction coefficient at 610 °C, (e) average friction coefficient, (f) weight loss and (g) wear rate.

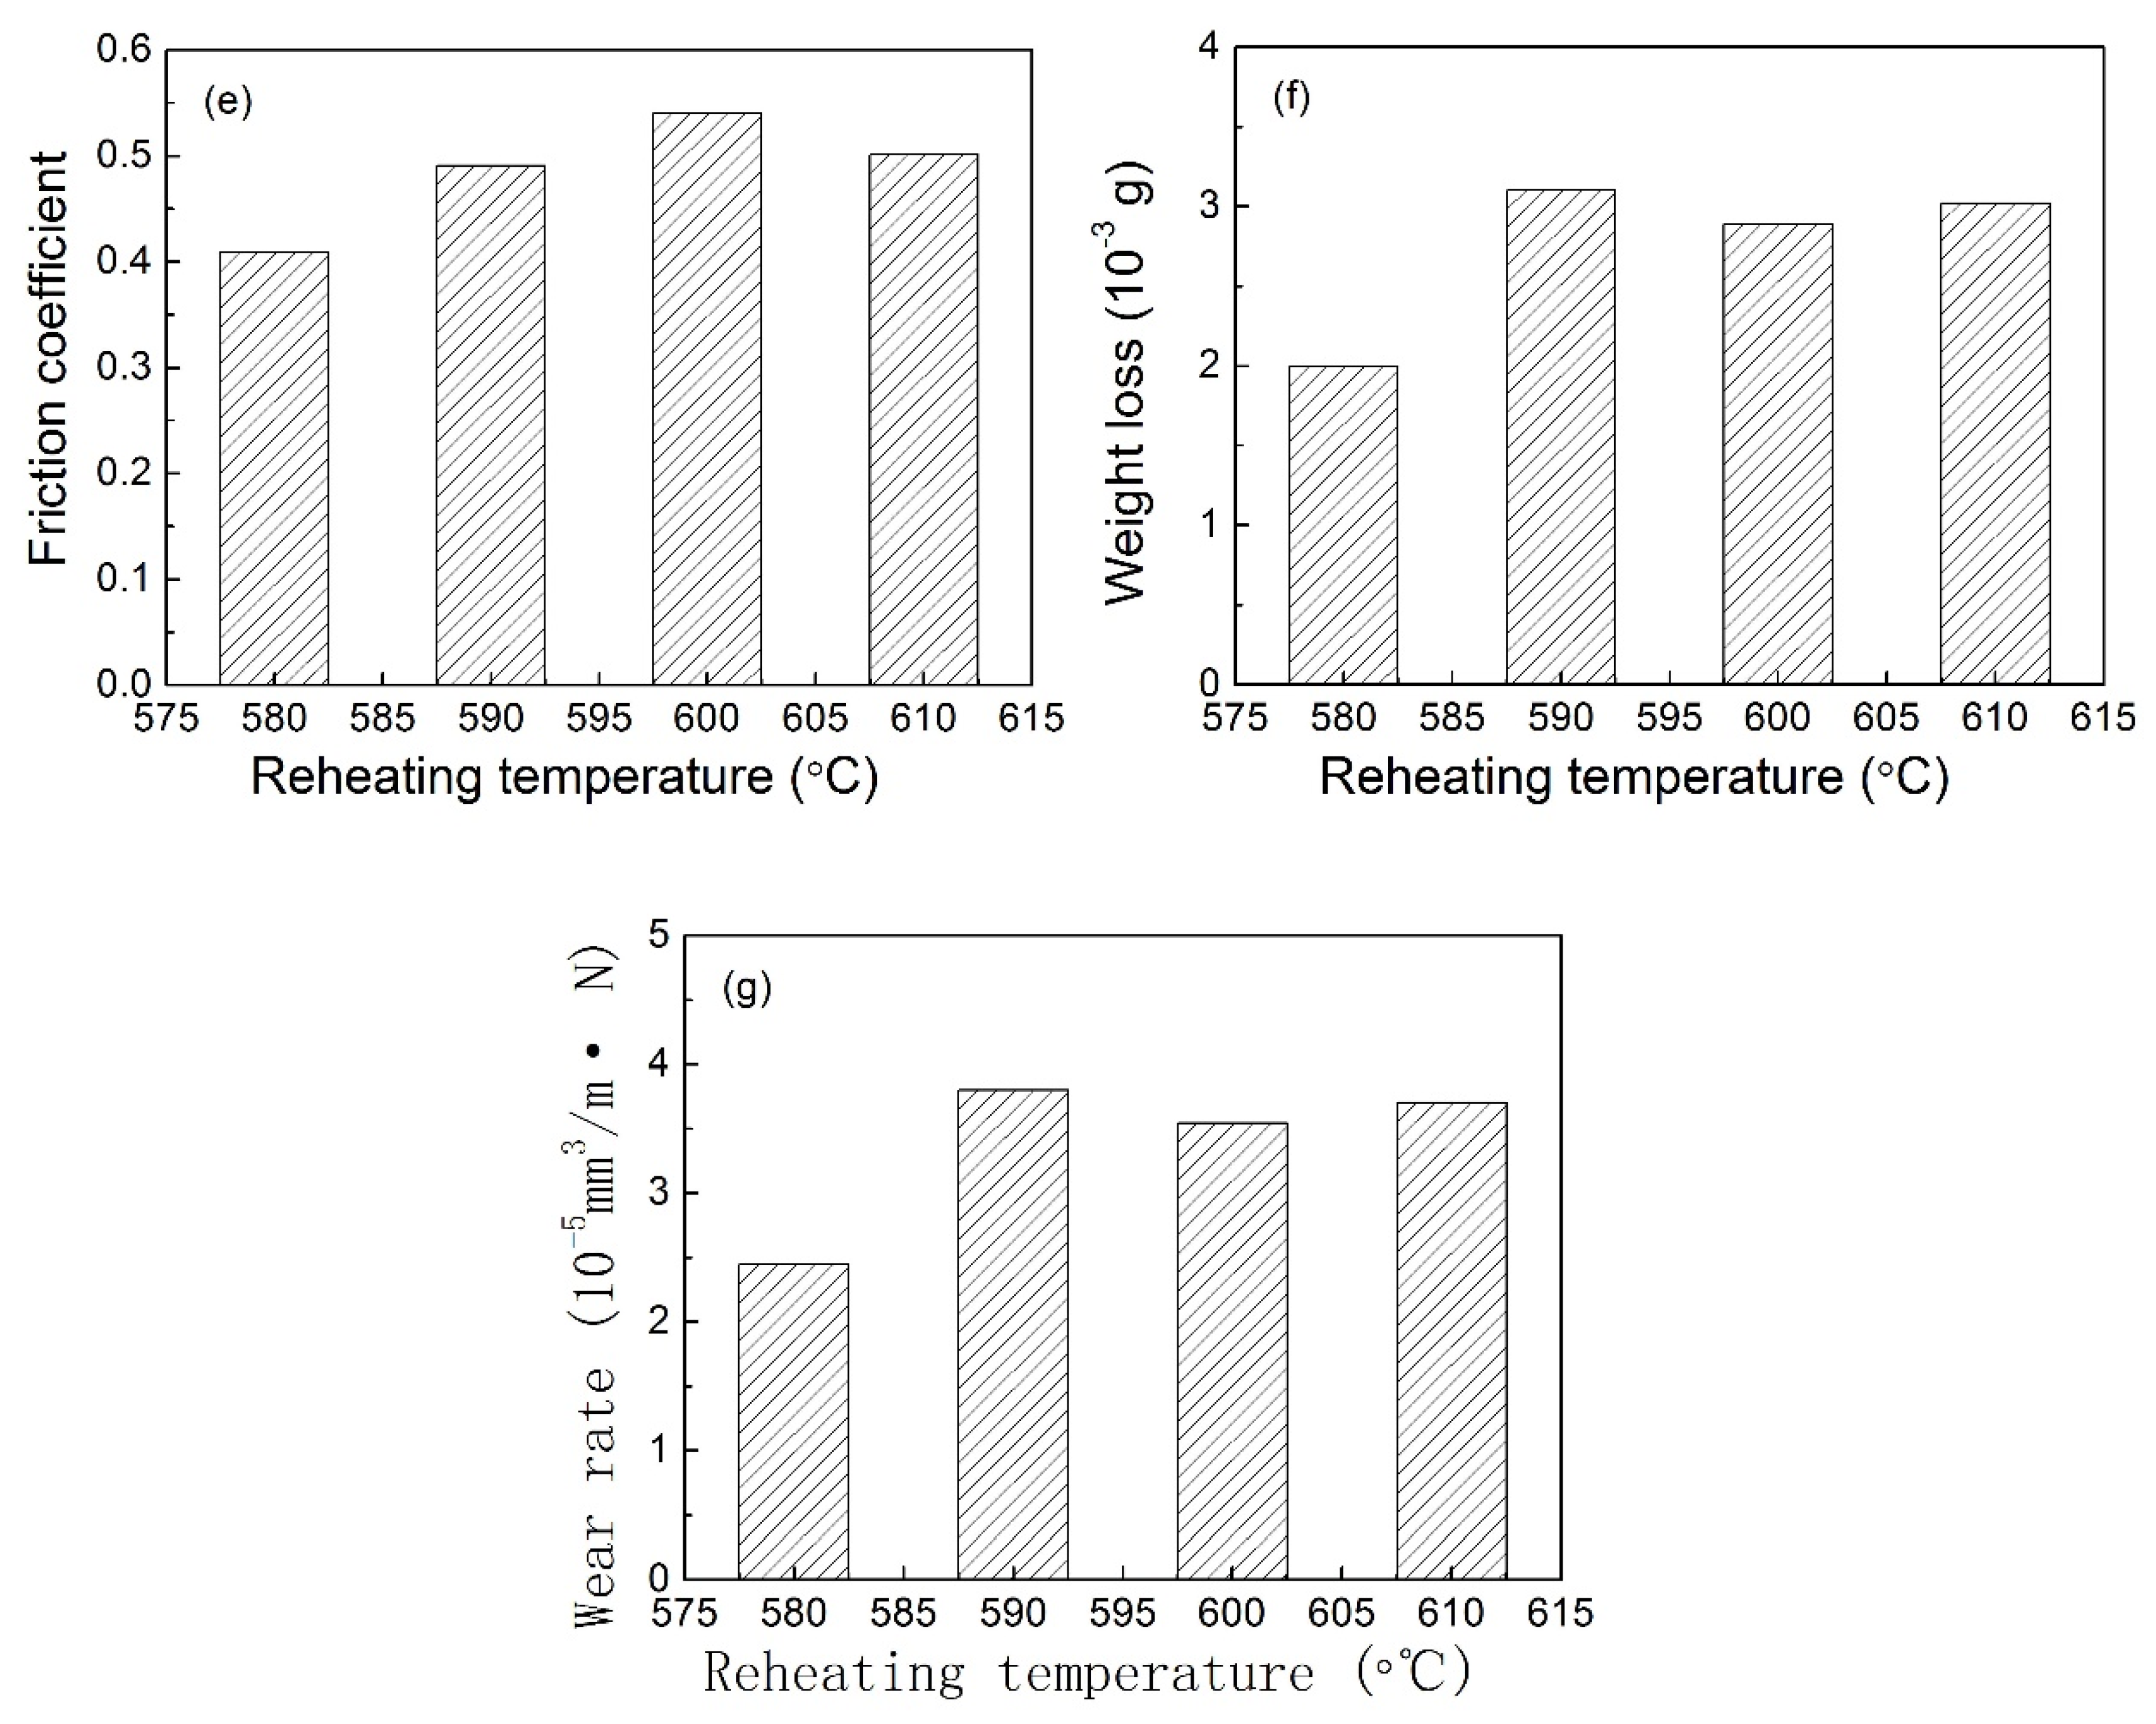
Figure 6.
Worn surface morphology of the thixoformed composite parts at different reheating temperatures: (a) 580 °C, (b) 590 °C, (c) 600 °C and (d) 610 °C.
Figure 6.
Worn surface morphology of the thixoformed composite parts at different reheating temperatures: (a) 580 °C, (b) 590 °C, (c) 600 °C and (d) 610 °C.

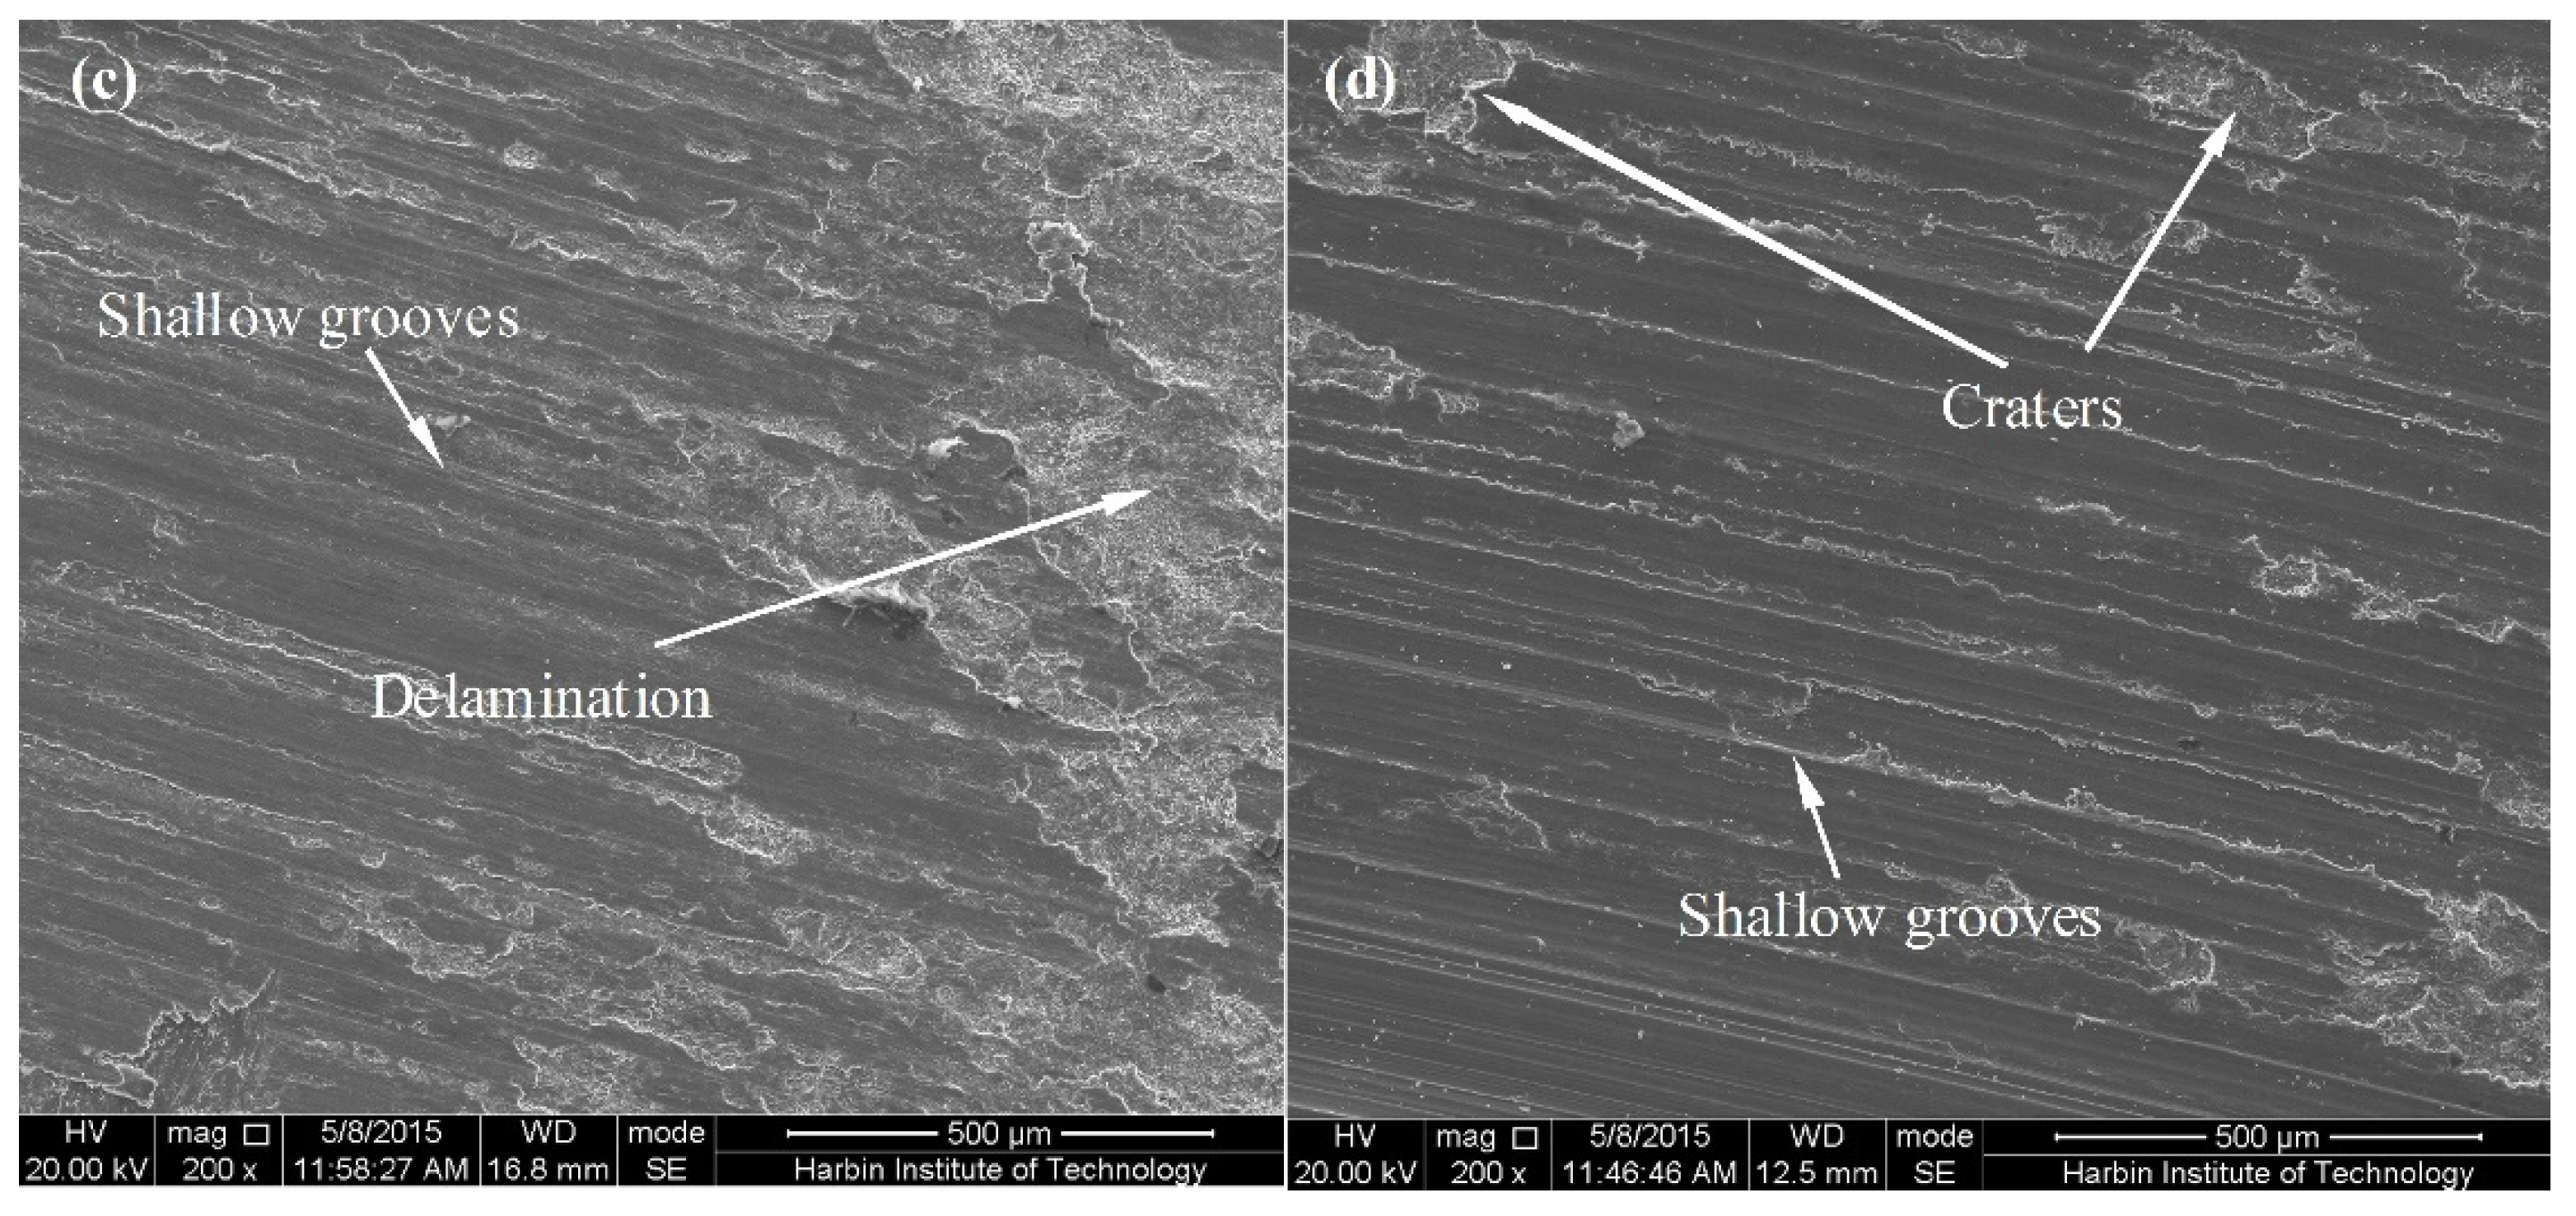
Figure 7.
Friction coefficient, weight loss and wear rate of the rheoformed composite parts at different applied load: (a) friction coefficient at 20 N, (b) friction coefficient at 30 N, (c) friction coefficient at 40 N, (d) friction coefficient at 50 N, (e) average friction coefficient, (f) weight loss and (g) wear rate.
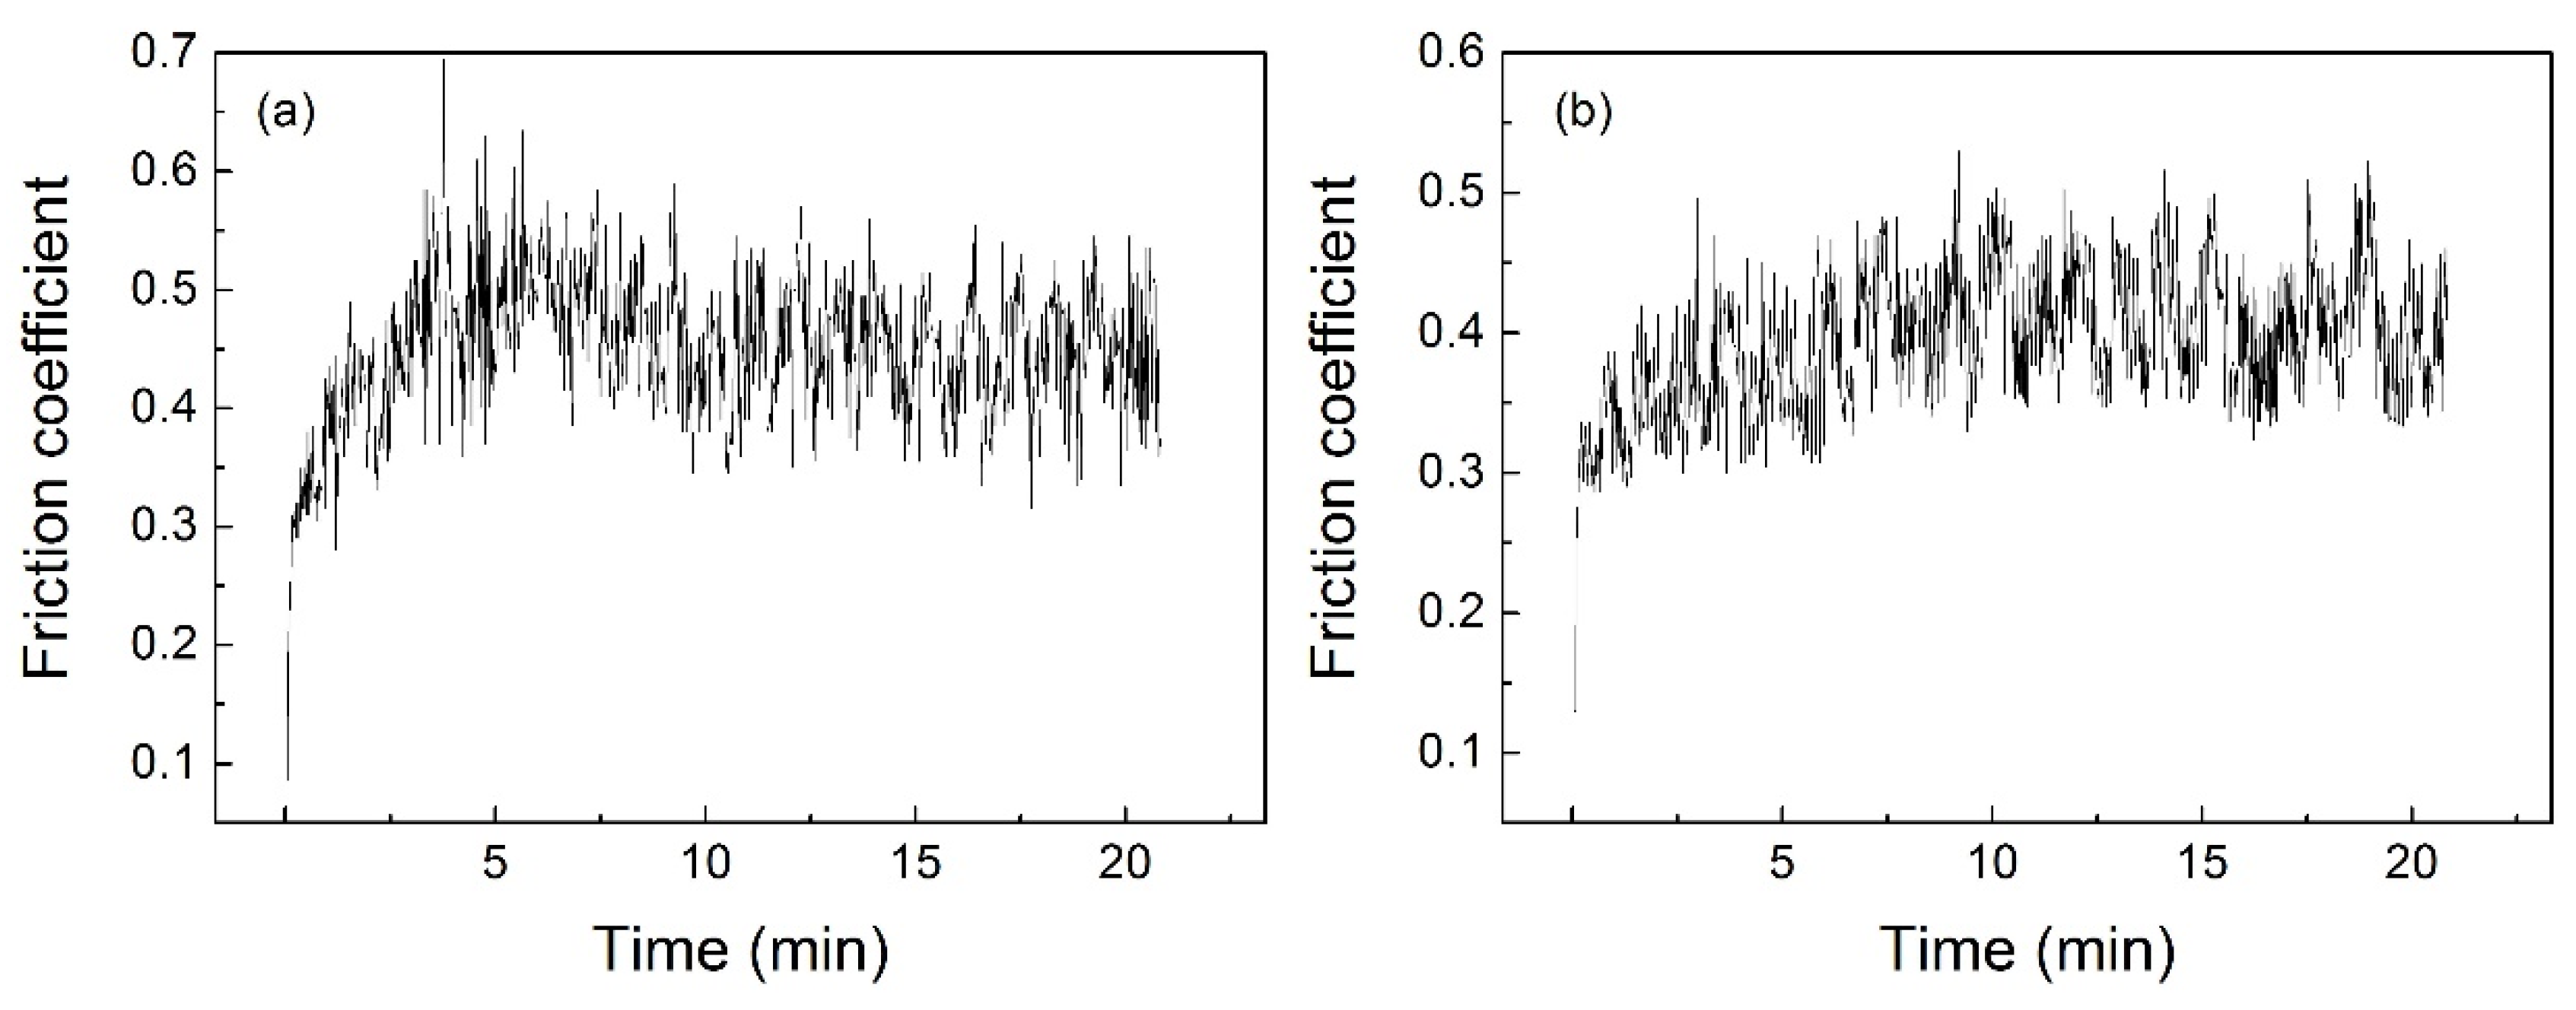

Figure 8.
Worn surface morphology of the rheoformed composite parts at different applied load: (a) 20 N, (b) 30 N, (c) 40 N and (d) 50 N.
Figure 8.
Worn surface morphology of the rheoformed composite parts at different applied load: (a) 20 N, (b) 30 N, (c) 40 N and (d) 50 N.

Figure 9.
Friction coefficient, weight loss and wear rate of the thixoformed composite parts at different applied load: (a) friction coefficient at 20 N, (b) friction coefficient at 30 N, (c) friction coefficient at 40 N, (d) friction coefficient at 50 N, (e) average friction coefficient, (f) weight loss and (g) wear rate.
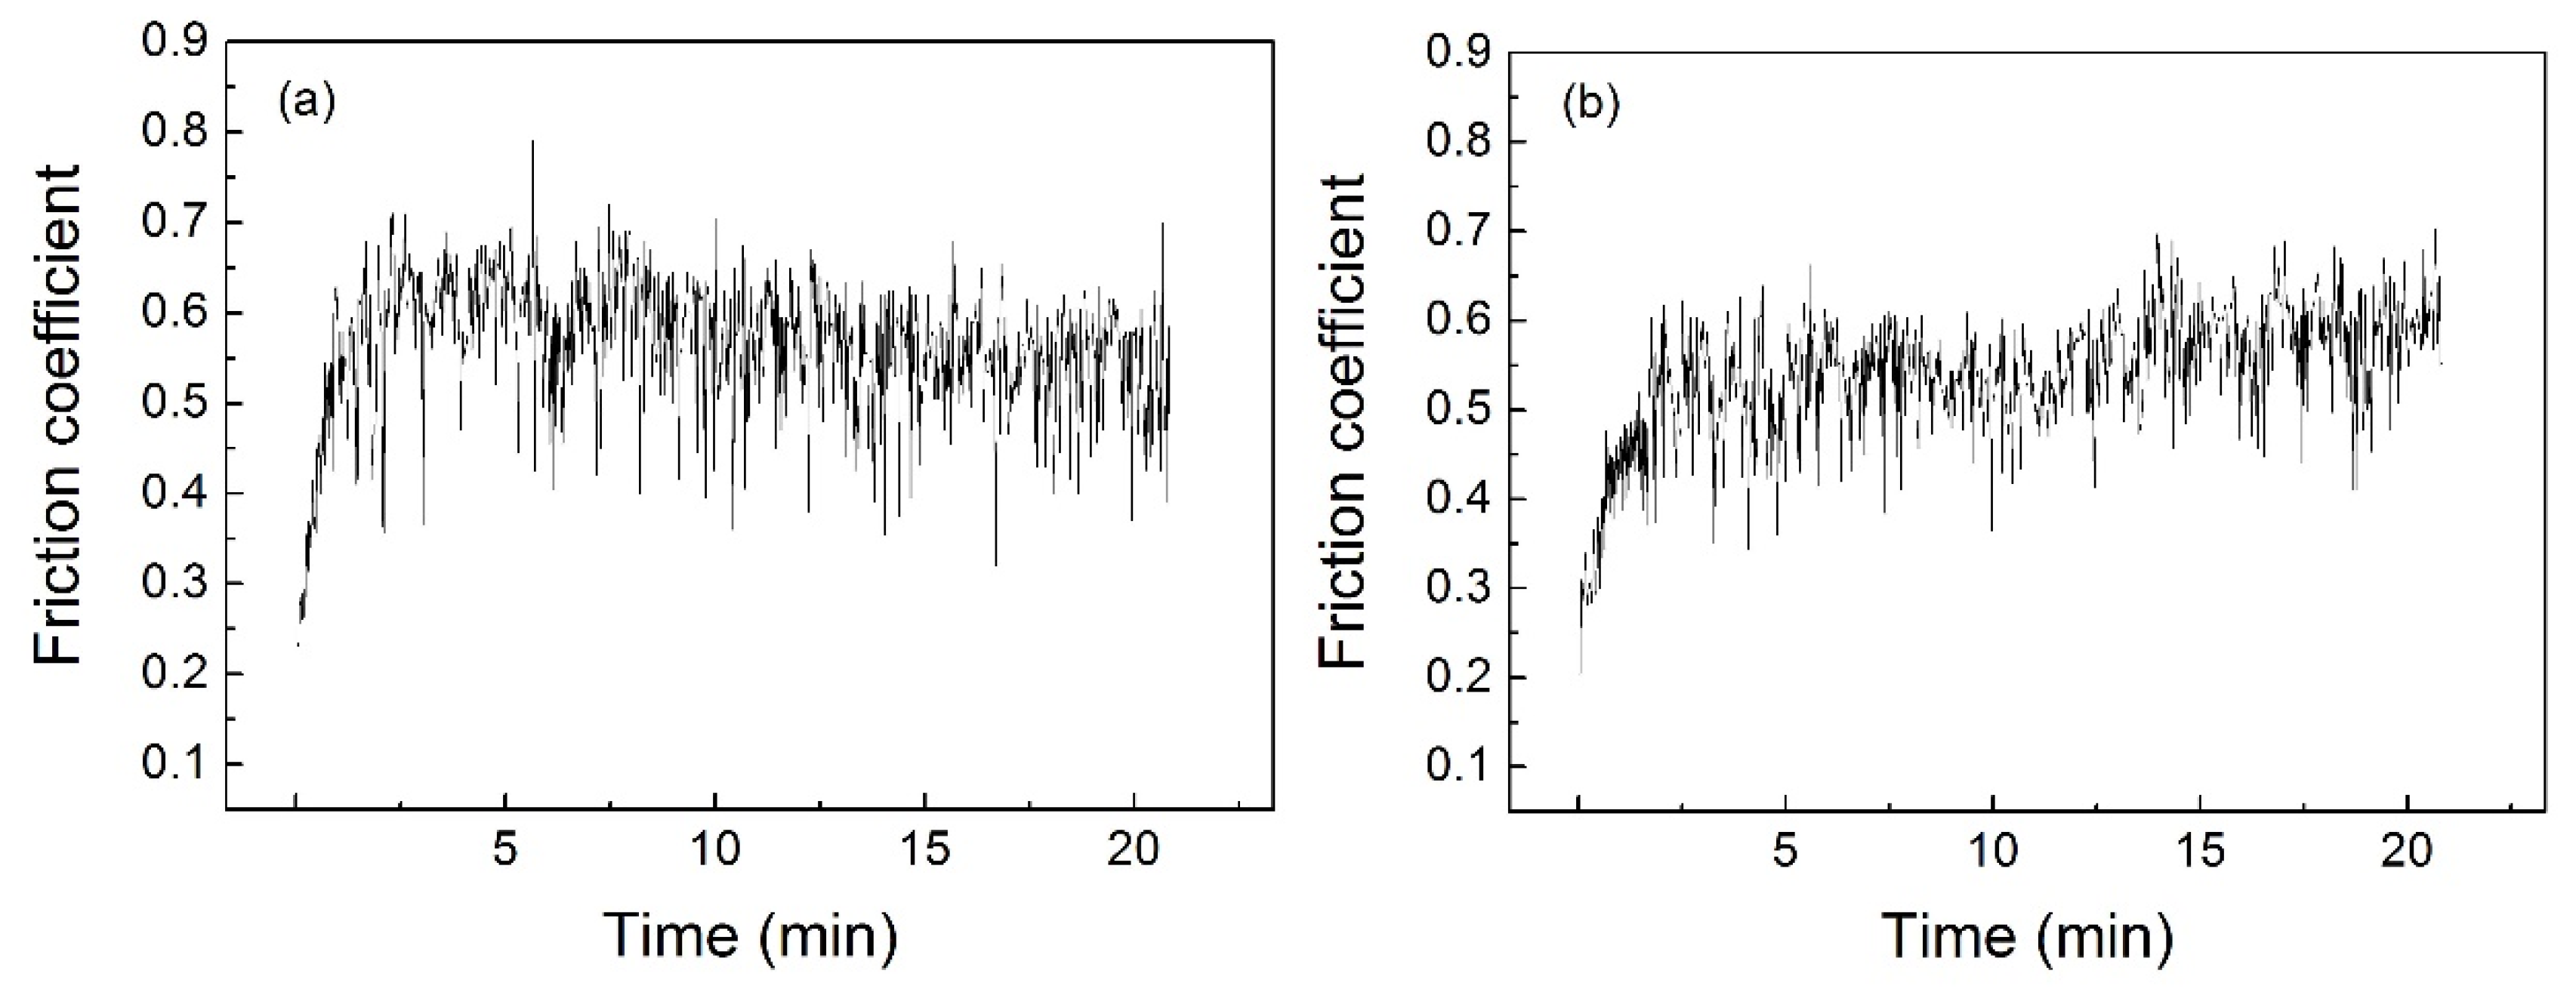

Figure 10.
Worn surface morphology of the thixoformed composite parts at different applied load: (a) 20 N, (b) 30 N, (c) 40 N and (d) 50 N.
Figure 10.
Worn surface morphology of the thixoformed composite parts at different applied load: (a) 20 N, (b) 30 N, (c) 40 N and (d) 50 N.

Figure 11.
Friction coefficient, weight loss and wear rate of the rheoformed composite parts at different sliding velocity: (a) friction coefficient at 0.8 m/s, (b) friction coefficient at 1.2 m/s, (c) friction coefficient at 1.6 m/s, (d) average friction coefficient, (e) weight loss and (f) wear rate.

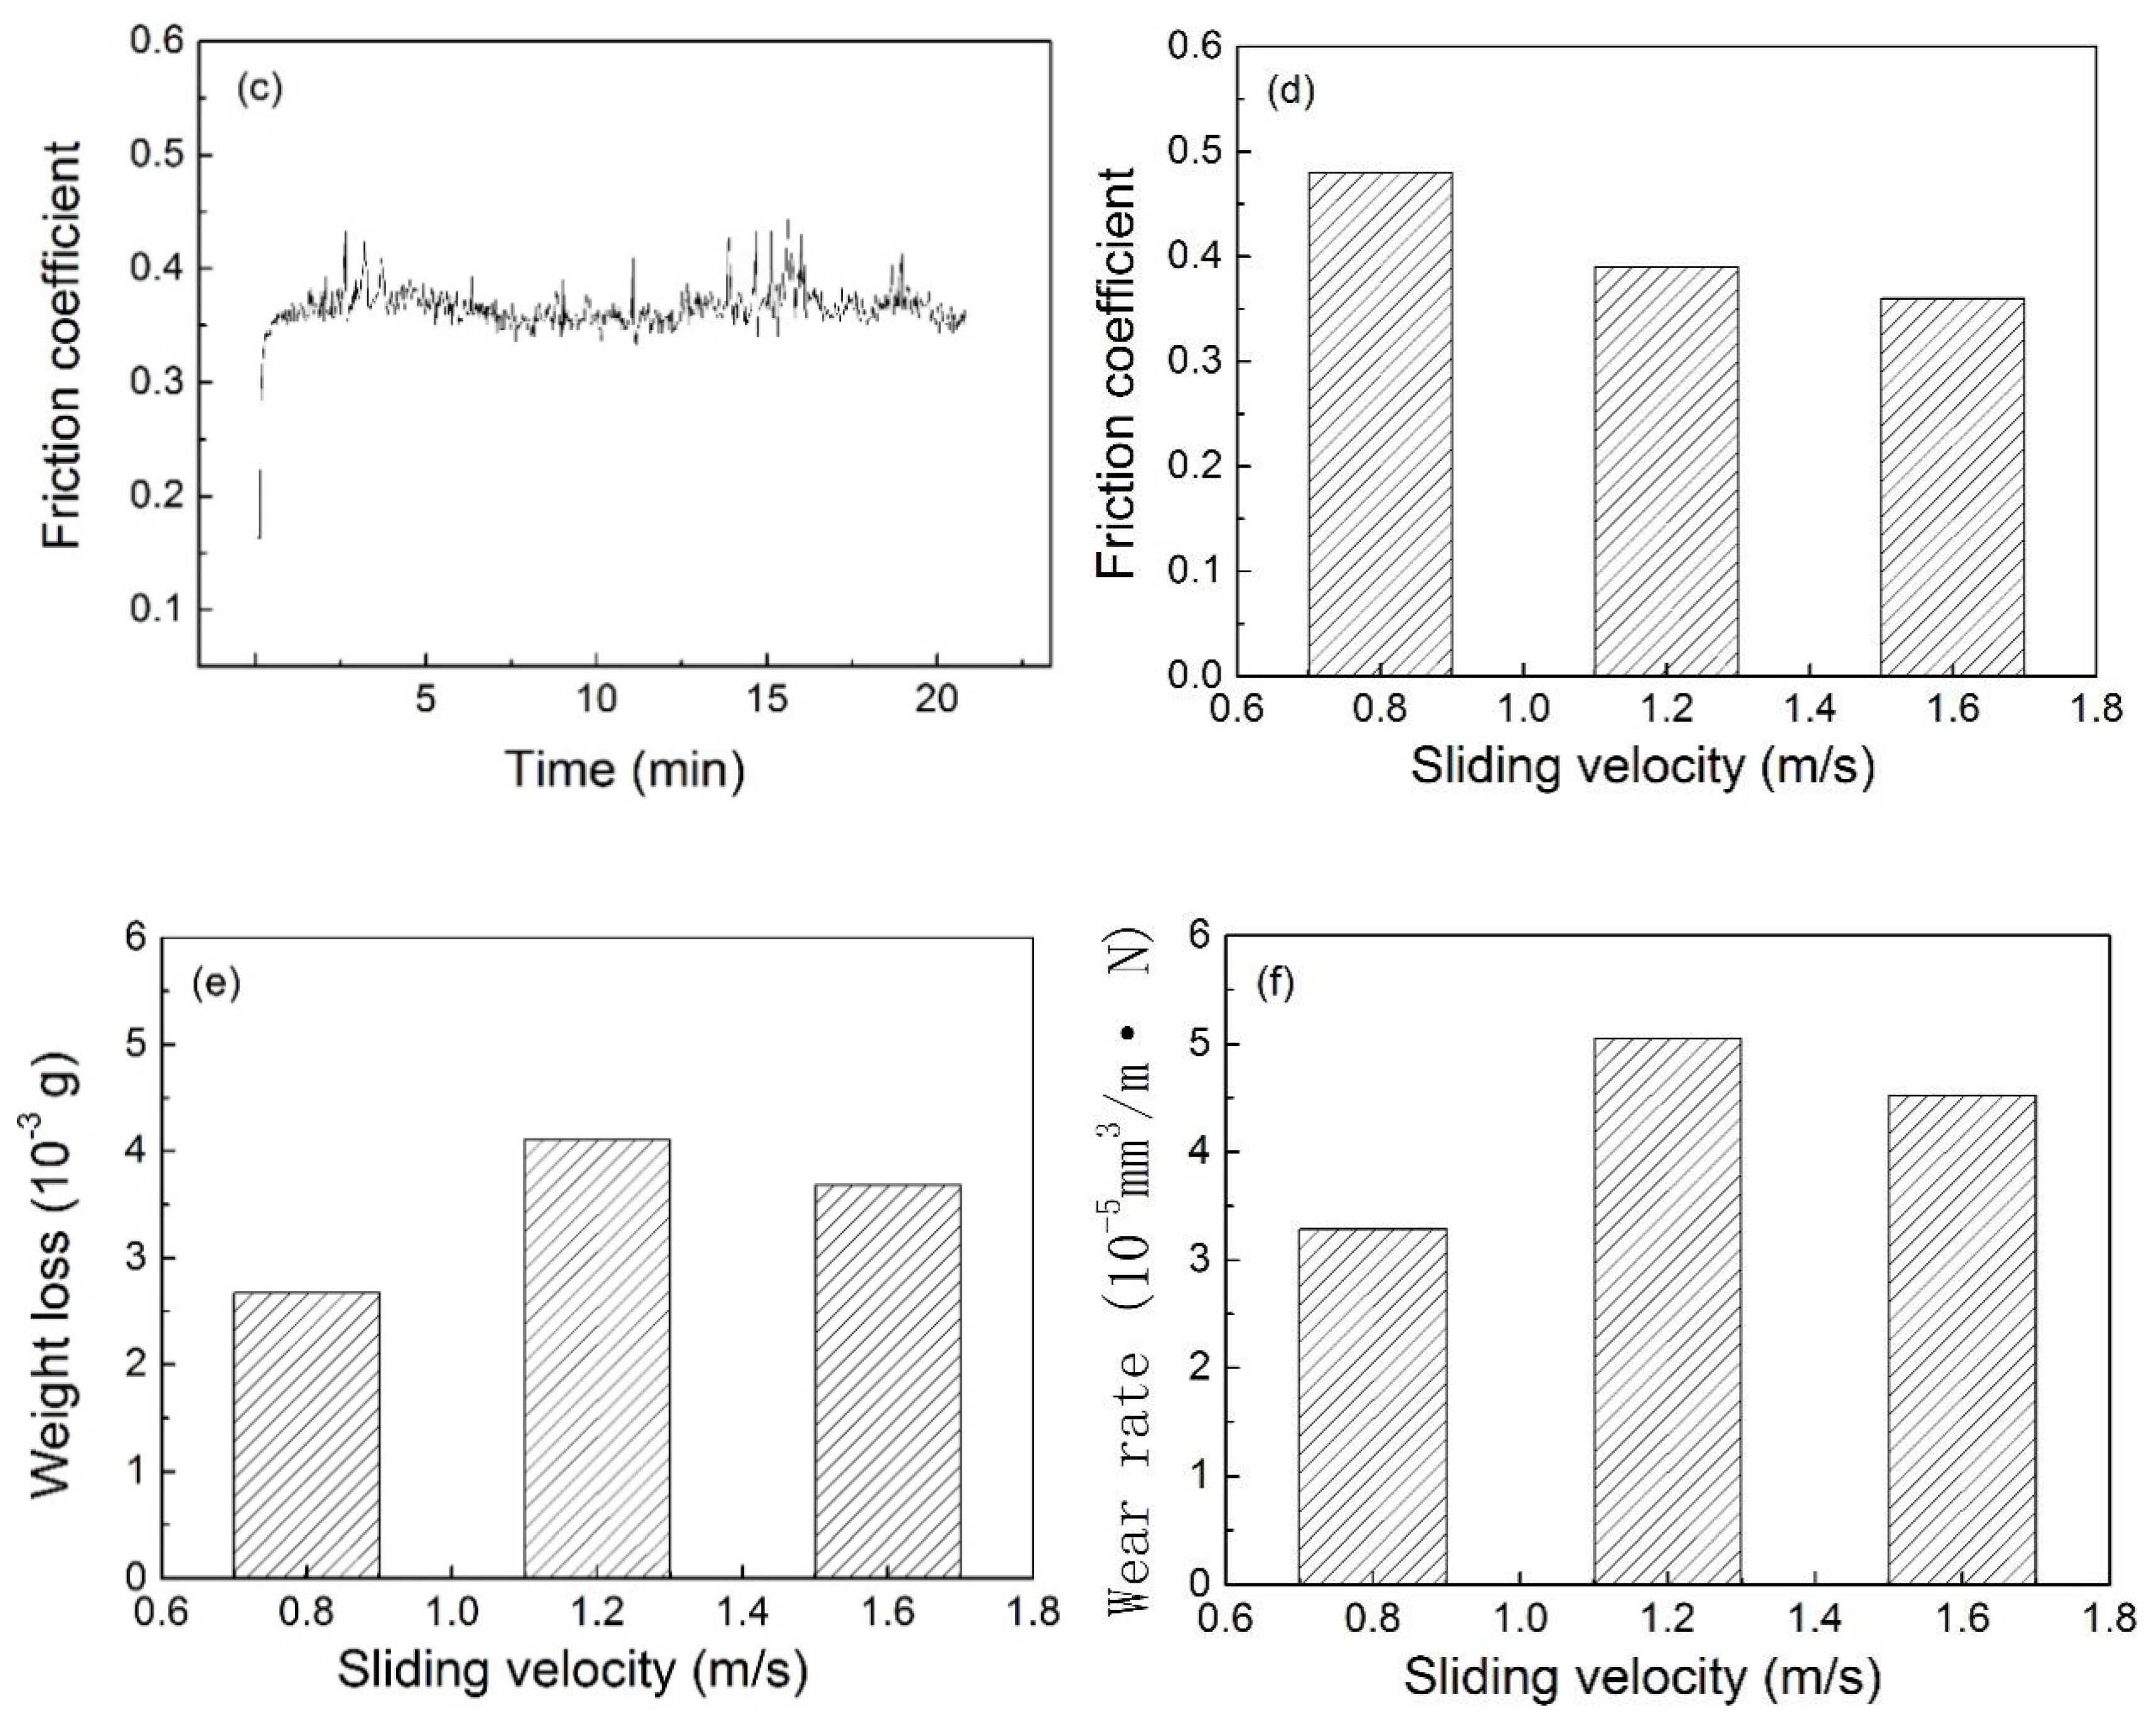
Figure 12.
Worn surface morphology of the rheoformed composite parts at different sliding velocities: (a) 0.8 m/s, (b) 1.2 m/s and (c) 1.6 m/s.
Figure 12.
Worn surface morphology of the rheoformed composite parts at different sliding velocities: (a) 0.8 m/s, (b) 1.2 m/s and (c) 1.6 m/s.


Figure 13.
Friction coefficient, weight loss and wear rate of the thixoformed composite parts at different sliding velocities: (a) friction coefficient at 0.8 m/s, (b) friction coefficient at 1.2 m/s, (c) friction coefficient at 1.6 m/s, (d) average friction coefficient, (e) weight loss and (f) wear rate.
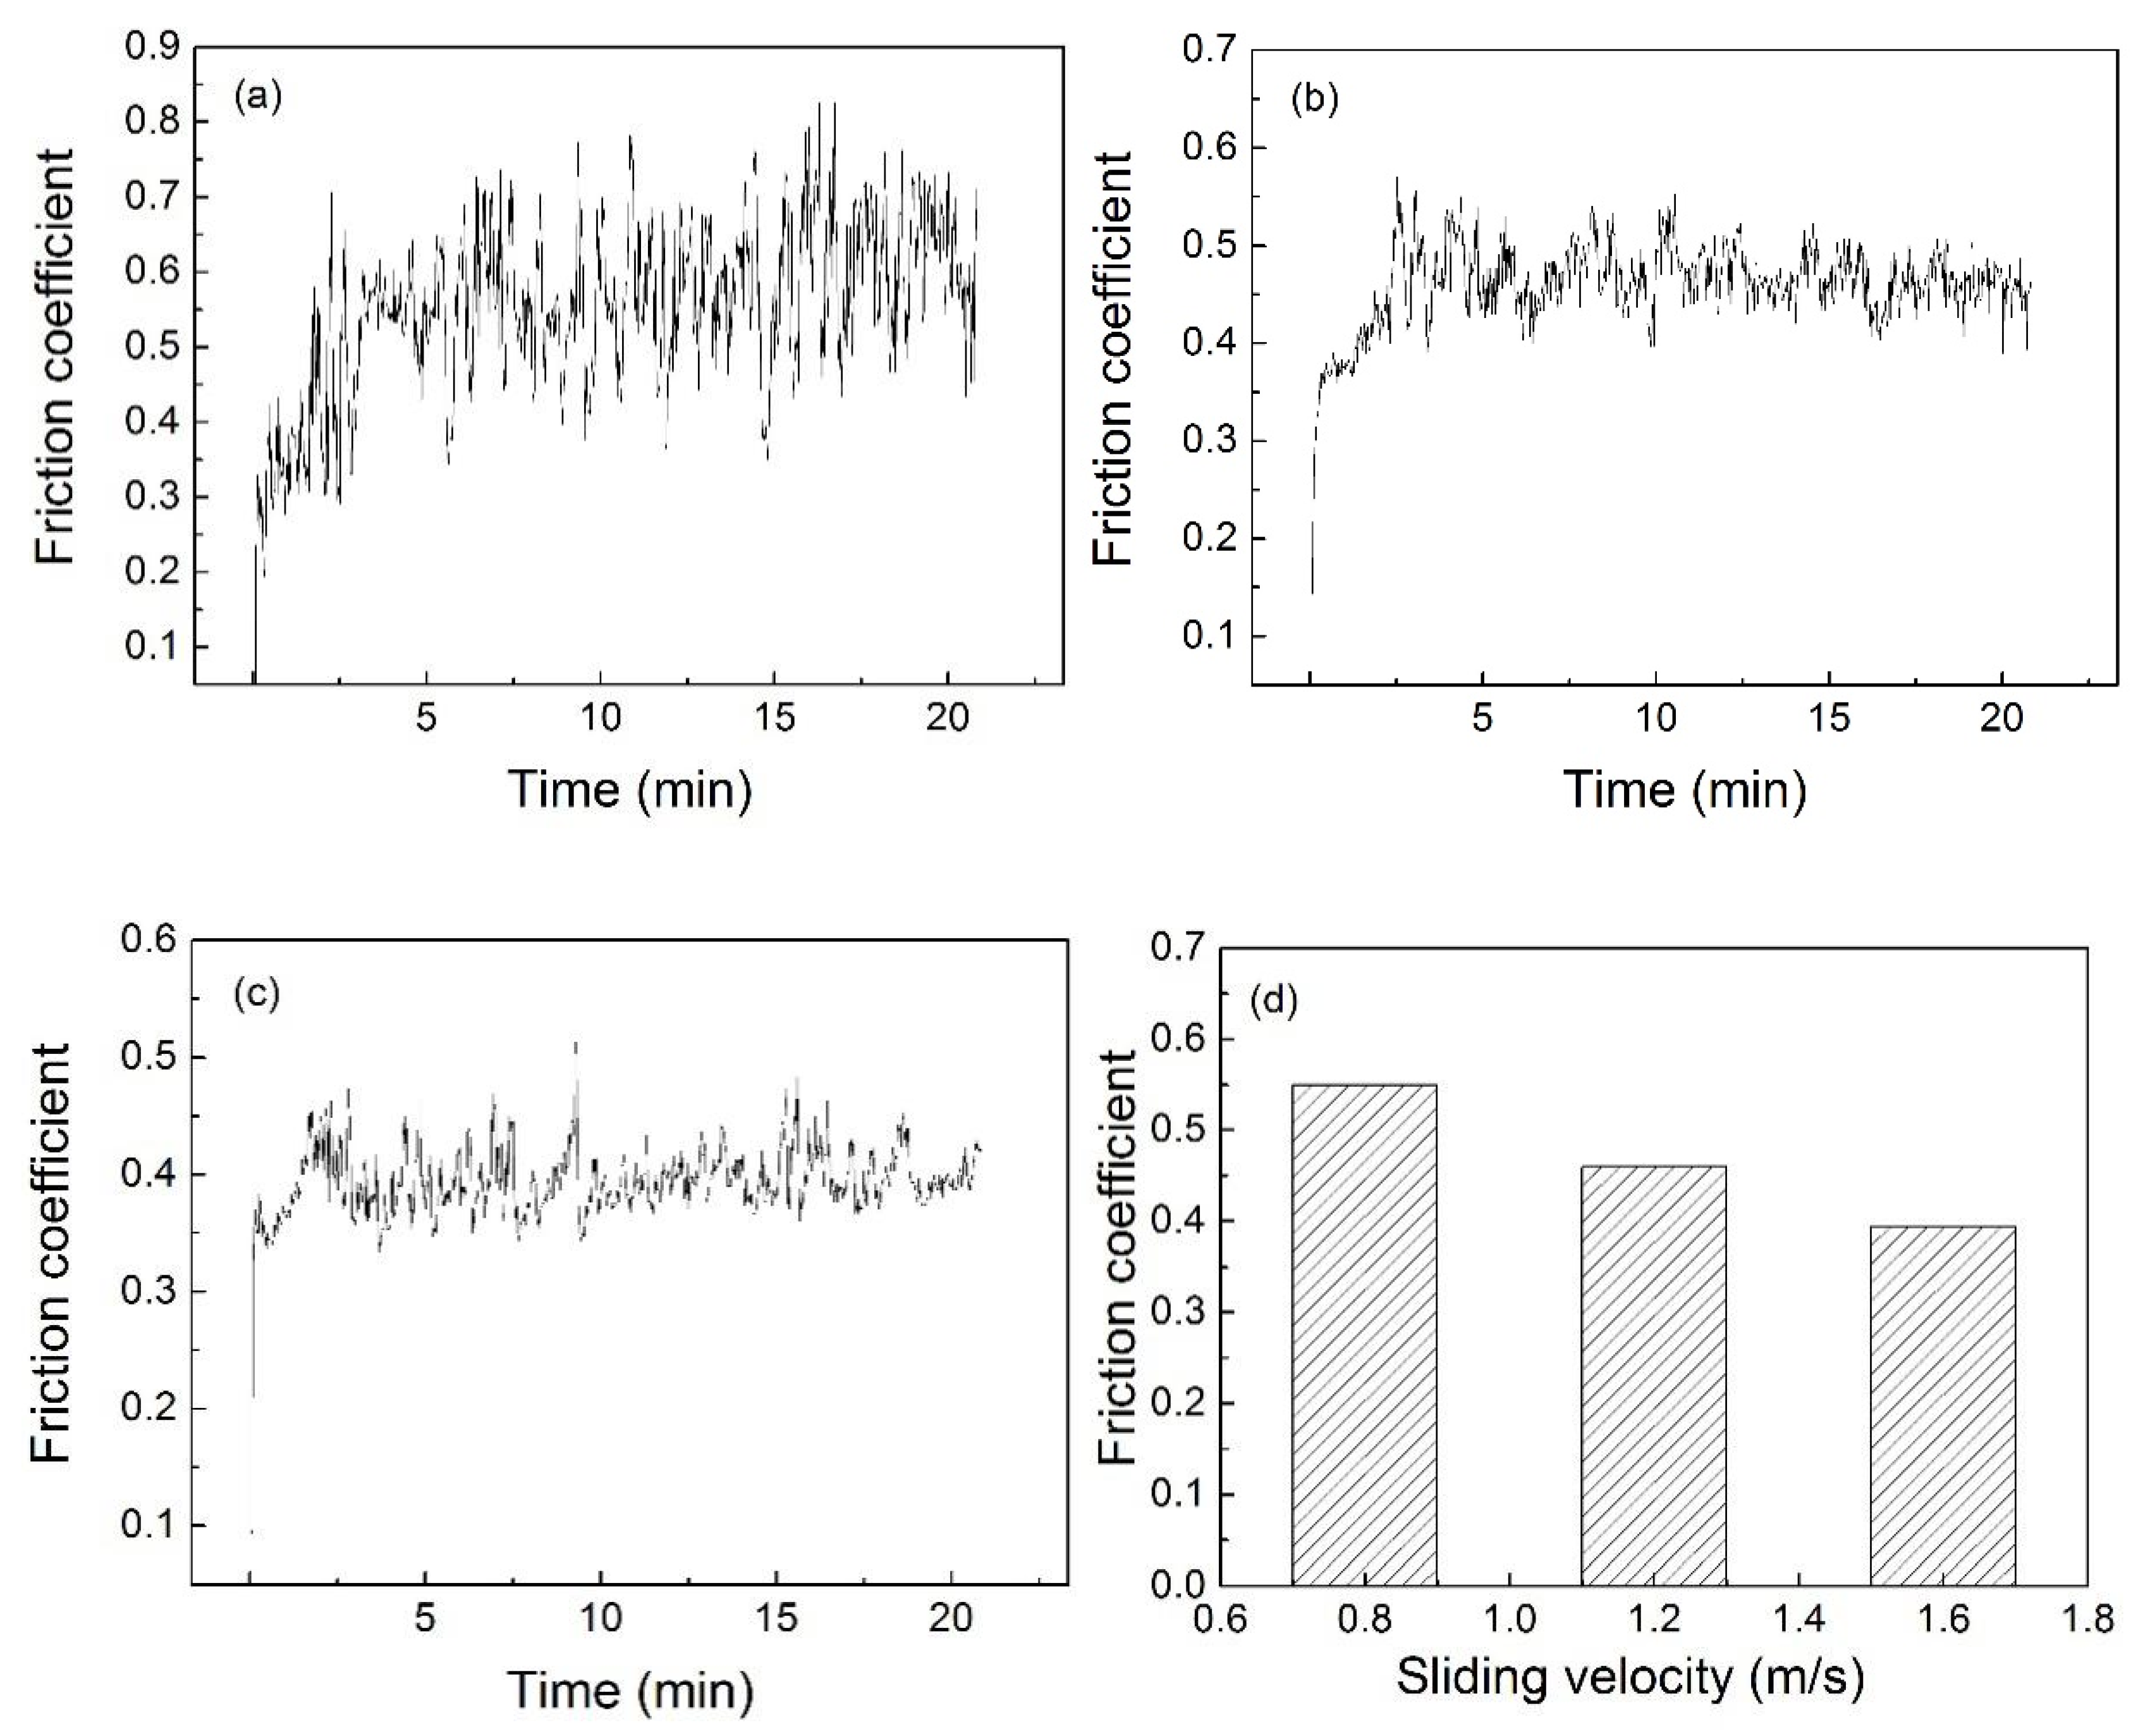

Figure 14.
Worn surface morphology of the thixoformed composite parts at different sliding velocities: (a) 0.8 m/s, (b) 1.2 m/s and (c) 1.6 m/s.
Figure 14.
Worn surface morphology of the thixoformed composite parts at different sliding velocities: (a) 0.8 m/s, (b) 1.2 m/s and (c) 1.6 m/s.
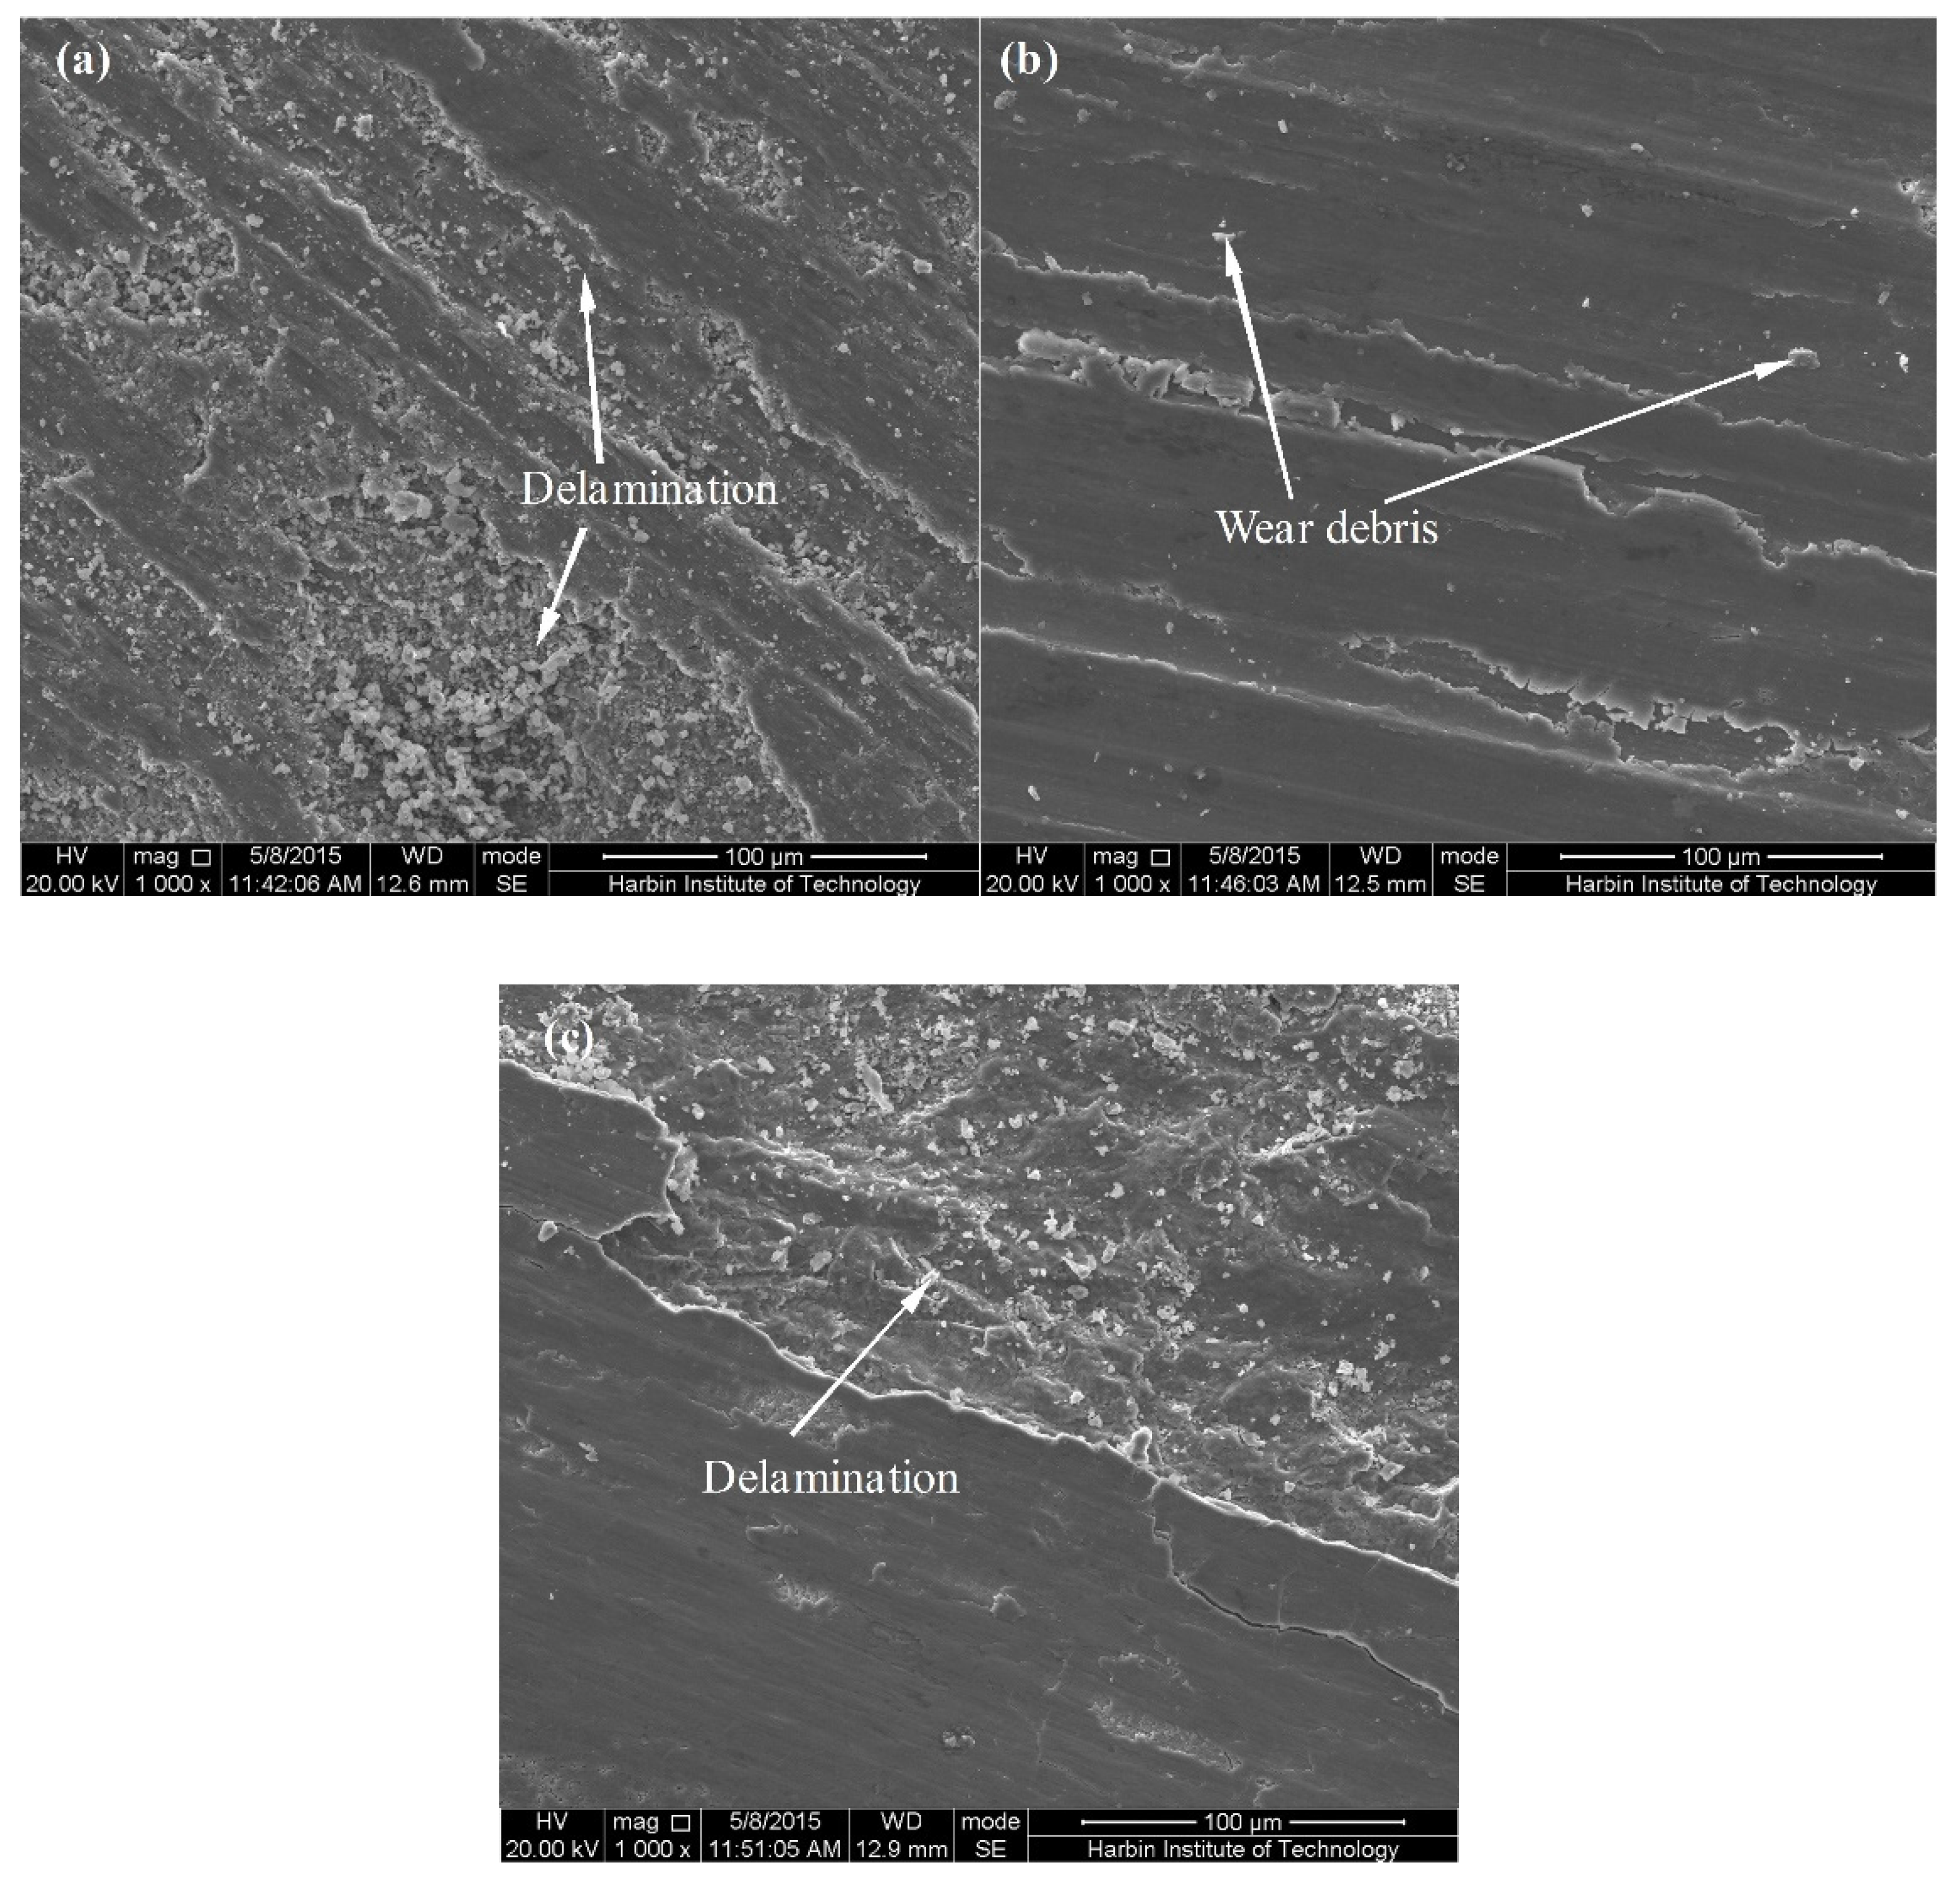
Figure 15.
Friction coefficient, weight loss and wear rate of the rheoformed composite parts with different volume fraction of SiC particles: (a) 0, (b) 0.5%, (c) 1.0%, (d) 1.5%, (e) 2.0%, (f) average friction coefficient, (g) weight loss and (h) wear rate.
Figure 15.
Friction coefficient, weight loss and wear rate of the rheoformed composite parts with different volume fraction of SiC particles: (a) 0, (b) 0.5%, (c) 1.0%, (d) 1.5%, (e) 2.0%, (f) average friction coefficient, (g) weight loss and (h) wear rate.


Figure 16.
Worn surface morphology of the rheoformed composite parts with different volume fraction of SiC particles: (a) 0, (b) 0.5%, (c) 1.0%, (d) 1.5% and (e) 2.0%.
Figure 16.
Worn surface morphology of the rheoformed composite parts with different volume fraction of SiC particles: (a) 0, (b) 0.5%, (c) 1.0%, (d) 1.5% and (e) 2.0%.

Table 1.
Experimental procedures of dry sliding wear tests of nano-sized SiCp/7075 composite parts fabricated by rheoforming and thixoforming.
Table 1.
Experimental procedures of dry sliding wear tests of nano-sized SiCp/7075 composite parts fabricated by rheoforming and thixoforming.
| Experimental Serial Number | Fraction of SiC Particles (%) | Wear Velocity (m/s) | Stirring Temperature (°C) | Remelting Temperature (°C) | Applied Load (N) | Status |
|---|---|---|---|---|---|---|
| 1 | 1 | 0.8 | 615 | - | 30 | Rheoformed |
| 2 | 1 | 0.8 | 620 | - | 30 | Rheoformed |
| 3 | 1 | 0.8 | 625 | - | 30 | Rheoformed |
| 4 | 1 | 0.8 | 628 | - | 30 | Rheoformed |
| 5 | 1 | 0.8 | 620 | 580 | 30 | Thixoformed |
| 6 | 1 | 0.8 | 620 | 590 | 30 | Thixoformed |
| 7 | 1 | 0.8 | 620 | 600 | 30 | Thixoformed |
| 8 | 1 | 0.8 | 620 | 610 | 30 | Thixoformed |
| 9 | 1 | 0.8 | 620 | - | 20 | Rheoformed |
| 10 | 1 | 0.8 | 620 | - | 40 | Rheoformed |
| 11 | 1 | 0.8 | 620 | - | 50 | Rheoformed |
| 12 | 1 | 0.8 | - | 600 | 20 | Thixoformed |
| 13 | 1 | 0.8 | - | 600 | 40 | Thixoformed |
| 14 | 1 | 0.8 | - | 600 | 50 | Thixoformed |
| 15 | 1 | 1.2 | 620 | - | 30 | Rheoformed |
| 16 | 1 | 1.6 | 620 | - | 30 | Rheoformed |
| 17 | 1 | 1.2 | 620 | 600 | 30 | Thixoformed |
| 18 | 1 | 1.6 | 620 | 600 | 30 | Thixoformed |
| 19 | 0 | 0.8 | 620 | 600 | 30 | Rheoformed |
| 20 | 0.5 | 0.8 | 620 | 600 | 30 | Rheoformed |
| 21 | 1.5 | 0.8 | 620 | 600 | 30 | Rheoformed |
| 22 | 2 | 0.8 | 620 | 600 | 30 | Rheoformed |
© 2018 by the authors. Licensee MDPI, Basel, Switzerland. This article is an open access article distributed under the terms and conditions of the Creative Commons Attribution (CC BY) license (http://creativecommons.org/licenses/by/4.0/).
Share and Cite
MDPI and ACS Style
Jiang, J.; Xiao, G.; Wang, Y.; Liu, Y. Tribological Behavior of Nano-Sized SiCp/7075 Composite Parts Formed by Semisolid Processing. Metals 2018, 8, 148. https://doi.org/10.3390/met8030148
AMA Style
Jiang J, Xiao G, Wang Y, Liu Y. Tribological Behavior of Nano-Sized SiCp/7075 Composite Parts Formed by Semisolid Processing. Metals. 2018; 8(3):148. https://doi.org/10.3390/met8030148
Chicago/Turabian StyleJiang, Jufu, Guanfei Xiao, Ying Wang, and Yingze Liu. 2018. "Tribological Behavior of Nano-Sized SiCp/7075 Composite Parts Formed by Semisolid Processing" Metals 8, no. 3: 148. https://doi.org/10.3390/met8030148
Note that from the first issue of 2016, this journal uses article numbers instead of page numbers. See further details here.