Compound Formation and Microstructure of As-Cast High Entropy Aluminums
by
 , , ,
, , ,
Jon Mikel Sanchez
1,* ,
,
Iban Vicario
1,
Joseba Albizuri
2,
Teresa Guraya
3,
Natalia E. Koval
4 and
Jose Carlos Garcia
1 1
Department of Foundry and Steel Making, Tecnalia Research & Innovation, 48160 Derio, Spain
2
Department of Mechanical Engineering, Faculty of Engineering of Bilbao, University of the Basque Country, 48013 Bilbao, Spain
3
Department of Mining & Metallurgical Engineering and Materials Science, Faculty of Engineering of Bilbao, University of the Basque Country, 48013 Bilbao, Spain
4
Centro de Física de Materiales CFM/MPC, 20018 San Sebastián, Spain
*
Author to whom correspondence should be addressed.
Metals 2018, 8(3), 167; https://doi.org/10.3390/met8030167
Submission received: 8 February 2018
/
Revised: 2 March 2018
/
Accepted: 6 March 2018
/
Published: 9 March 2018
(This article belongs to the Special Issue Microstructure and Mechanical Properties of Casting Alloys)
Abstract
:The aim of this work is to study the microstructure of four high entropy alloys (HEAs) produced by large scale vacuum die casting. Al40Cu15Mn5Ni5Si20Zn15, Al45Cu15Mn5Fe5Si5Ti5Zn20, Al35Cu5Fe5Mn5Si30V10Zr10, and Al50Ca5Cu5Ni10Si20Ti10 alloys formed a mixture of different structures, containing intermetallic compound (IC) and solid solution (SS) phases. The phases observed in the casting alloys were compared with the equilibrium phases predicted by Thermo-Calc. The measured densities varied from 3.33 g/cm−3 to 5.07 g/cm−3 and microhardness from 437 Hv to 887 Hv. Thus, the microhardness and estimated strength/density ratios are significantly higher than other lightweight high entropy alloys (LWHEAs).
1. Introduction
In 2004, Yeh et al. [1] and Cantor et al. [2] independently published the first papers on high HEAs, defining HEAs as alloys of five or more metallic elements in equimolar or near-equimolar concentrations between 5 and 35%. Their objective was to stabilize a single-phase SS by reducing Gibbs free energy to obtain simple crystal structures instead of brittle ICs. Since then, the HEAs field has evolved quickly and is not only restricted to single-phase SS microstructures. The HEAs have developed into multiphase alloys that are known as complex concentrated alloys (CCAs). The term HEAs remained for the sake of simplicity and will be used throughout the present work. The exceptional properties of HEAs are attributed to the four “core effects”: high entropy, sluggish diffusion, severe lattice distortion, and cocktail effect [3]. These effects are less pronounced in conventional alloys. Recently, about 650 microstructures and the mechanical properties of 400 HEAs were reviewed by Miracle and Senkov [4]. In addition, the mechanical properties of HEAs were compared with commercially engineering alloys, demonstrating potential applications where HEAs outperform conventional alloys [5].
There are three types of approaches for predicting phase formation in HEAs. First, various empirical thermo-physical parameters were proposed following the Hume–Rothery rules [6,7,8,9]. Gao et al. reviewed these parameters concluding that they are efficient in separating single-phase SS from amorphous alloys, but they fail to separate single-phase SS from multiphase microstructures [10]. The second approach is the CALPHAD method, which can accelerate the development of HEAs through phase diagrams and phase stabilities calculated from multicomponent thermodynamic databases [11]. The last method is the first-principles density functional theory (DFT) calculations combined with hybrid Monte Carlo/molecular dynamics (MC/MD) simulations [12,13]. To date, the CALPHAD method can be regarded as the most robust method for HEAs design [14].
Most researchers have focused on HEAs based on transition metal elements, such as Co, Cr, Cu, Fe, Mn, Ni, Ti, and Zr. HEAs have many attractive properties, such as high hardness, good oxidation resistance, high elevated-temperature strength, and good age-softening resistance [14,15,16]. Another well-known family are refractory HEAs [17,18,19,20,21], mainly composed of later transition metal elements such as Mo, Nb, Ta, Ti, V, and W. In spite of possessing competitive mechanical properties and good thermal stability, the high density of these HEAs is prohibitive for the aerospace and automotive sectors. Thus, these alloys will compete with superalloys or technical ceramics in applications where high temperature strength is the major design driver.
On the other hand, LWHEAs have recently attracted more attention for the possibility to reduce the weight in the transport and energy industry. The transport and energy industry depends on the development of new lightweight materials to replace traditional alloys for reducing energy consumption and CO2 emissions, without compromising structural properties and without significantly increasing costs. LWHEAs offers new opportunities to obtain new low cost materials in high temperature or structural applications where lighting is the major design driver. Nevertheless, these alloys have not yet received as much attention as traditional HEAs, only few publications have been focused on phase formation of LWHEAs [22,23,24]. The elements that have been used in the manufacture of LWHEAs are Al, Mg, Ti, Be, Cu, Fe, Li, Mn, Sn, Sc, and Zn. Vacuum melting followed by casting is the main processing technique used in LWHEAs [25]. However, the fabrication of LWHEAs by this technique has some disadvantages due to the large difference between the melting point of the elements, evaporation and oxidation of some of the alloying elements. Furthermore, they usually possess weak liquidity and castability, and significant compositional inhomogeneity, mainly since they contain various elements with high concentrations. As a result, large-scale production of HEAs by casting is limited. However, promising mechanical properties have been reported for LWHEAs, especially related to hardness-density ratio. Youssef et al. studied Al20Li20Mg10Sc20Ti30 alloy. High hardness (591 Hv) and moderate density (2.7 g/cm3) were reported [26]. The strength value was estimated according to the Tabor relation, thus Al20Li20Mg10Sc20Ti30 is comparable in strength/density values to ceramic materials such as SiC, but with greater toughness and ductility. Then, Li et al. studied Mgx(AlCuMnZn)1−x system, and they reported densities from 2.2 g/cm3 to 4.3 g/cm3, high hardness (178–429 HV) and high compression strength (400–500 MPa) [27]. In the same system, MgMnAlZnCu alloy exhibited high hardness (431–467 Hv) and high compression strength (428–450 MPa), the strains were from 3.3% to 5.5% [28]. The Al-Li-Mg-(Zn,Cu,Sn) system exhibited densities below 4.54 g/cm3 and a relatively high compression strength (>500 MPa). The best properties of the system were reported to Al80Li5Mg5Zn5Cu5 alloy with a yield strength of 488 MPa and plastic deformation of 18% [23]. To date, Al20Be20Fe10Si15Ti35 alloy has the best hardness to density ratio of 3.9 g/cm3 and 911 Hv. The estimated strength is 2976 MPa, which is superior to those of traditional structural materials [29].
Hence, Al40Cu15Mn5Ni5Si20Zn15, Al45Cu15Fe5Mn5Si5Ti5Zn20, Al35Cu5Fe5Mn5Si30V10Zr10 and Al50Ca5Cu5Ni10Si20Ti10 alloys were manufactured by a large-scale vacuum die casting process, obtaining parts up to approximately 4 kg. The alloys were designed following the CALPHAD method to obtain multiphase microstructures (SS + ICs) to exceed the strength, wear behavior, and the performance of Al alloys in high temperature applications. For this, low melting point elements such as Mg, Li, and Sn were not used. Furthermore, expensive or scarce elements—such as Be and Sc—were avoided.
2. Materials and Methods
The raw elements with a minimum purity of 99.5 wt. % were melted and merged in an alumina crucible in an electric vacuum induction furnace model VIM (CONSARC, Rancocas, NJ, USA). Before melting, a minimum chamber vacuum of 0.071 mbar was achieved and a protective Ar gas atmosphere was introduced to prevent oxidation reactions during melting, with a chamber pressure of 400 mbar. Al and Si were placed at the bottom of the crucible to guarantee a bath base where the other elements were dissolved. They were added to the Al-rich molten alloy from highest to lowest melting point. The process was carried out at a melting temperature below 800 °C. Finally, the molten alloy was poured and solidified into a metal die inside the furnace at a temperature near 760 °C. After the metal was solidified, the furnace was depressurized and the ingots were extracted from the mold. Target compositions in at. % are represented in Table 1.
Specimens of approximately 80 mm (length) × 80 mm (width) × 140 mm (thickness) were obtained from the as-cast material. The samples of each alloy were cut from the ingots and prepared according to standard metallographic procedures by hot mounting in conductive resin, grinding, and polishing. The microstructure, the different regions and the averaged overall chemical composition of each sample were investigated by a scanning electron microscope (SEM), equipped with an energy dispersive X-ray spectrometry (EDS) model JSM-5910LV (JEOL, Croissy-sur-Seine, France). The X-ray diffraction (XRD) equipment used to characterize the crystal structures of the alloys was a model D8 ADVANCE (BRUKER, Karlsruhe, Germany), with Cu Kα radiation, operated at 40 kV and 30 mA, the diffraction diagrams were measured at the diffraction angle (2θ) range from 10° to 90° with a step size of 0.01°, and 1.8 s/step. The powder diffraction file (PDF) database 2008 was applied for phase identification. The Vickers microhardness was measured using an FM-700 model (FUTURE-TECH, Kawasaki, Japan) under the load of 0.1 kg with a holding time of 10 s. At least 10 individual measurements were made and the mean values are presented. The software Thermo-Calc (v. 2017b, Thermo-Calc Software AB, Stockholm, Sweden) [30] in conjunction with the TCAL5 thermodynamic database was used for calculations of the equilibrium phases as a function of temperature. Finally, the measurement of density was conducted using the Archimedes method.
3. Results and Discussion
3.1. Equilibrium Phase Diagram of the Alloys
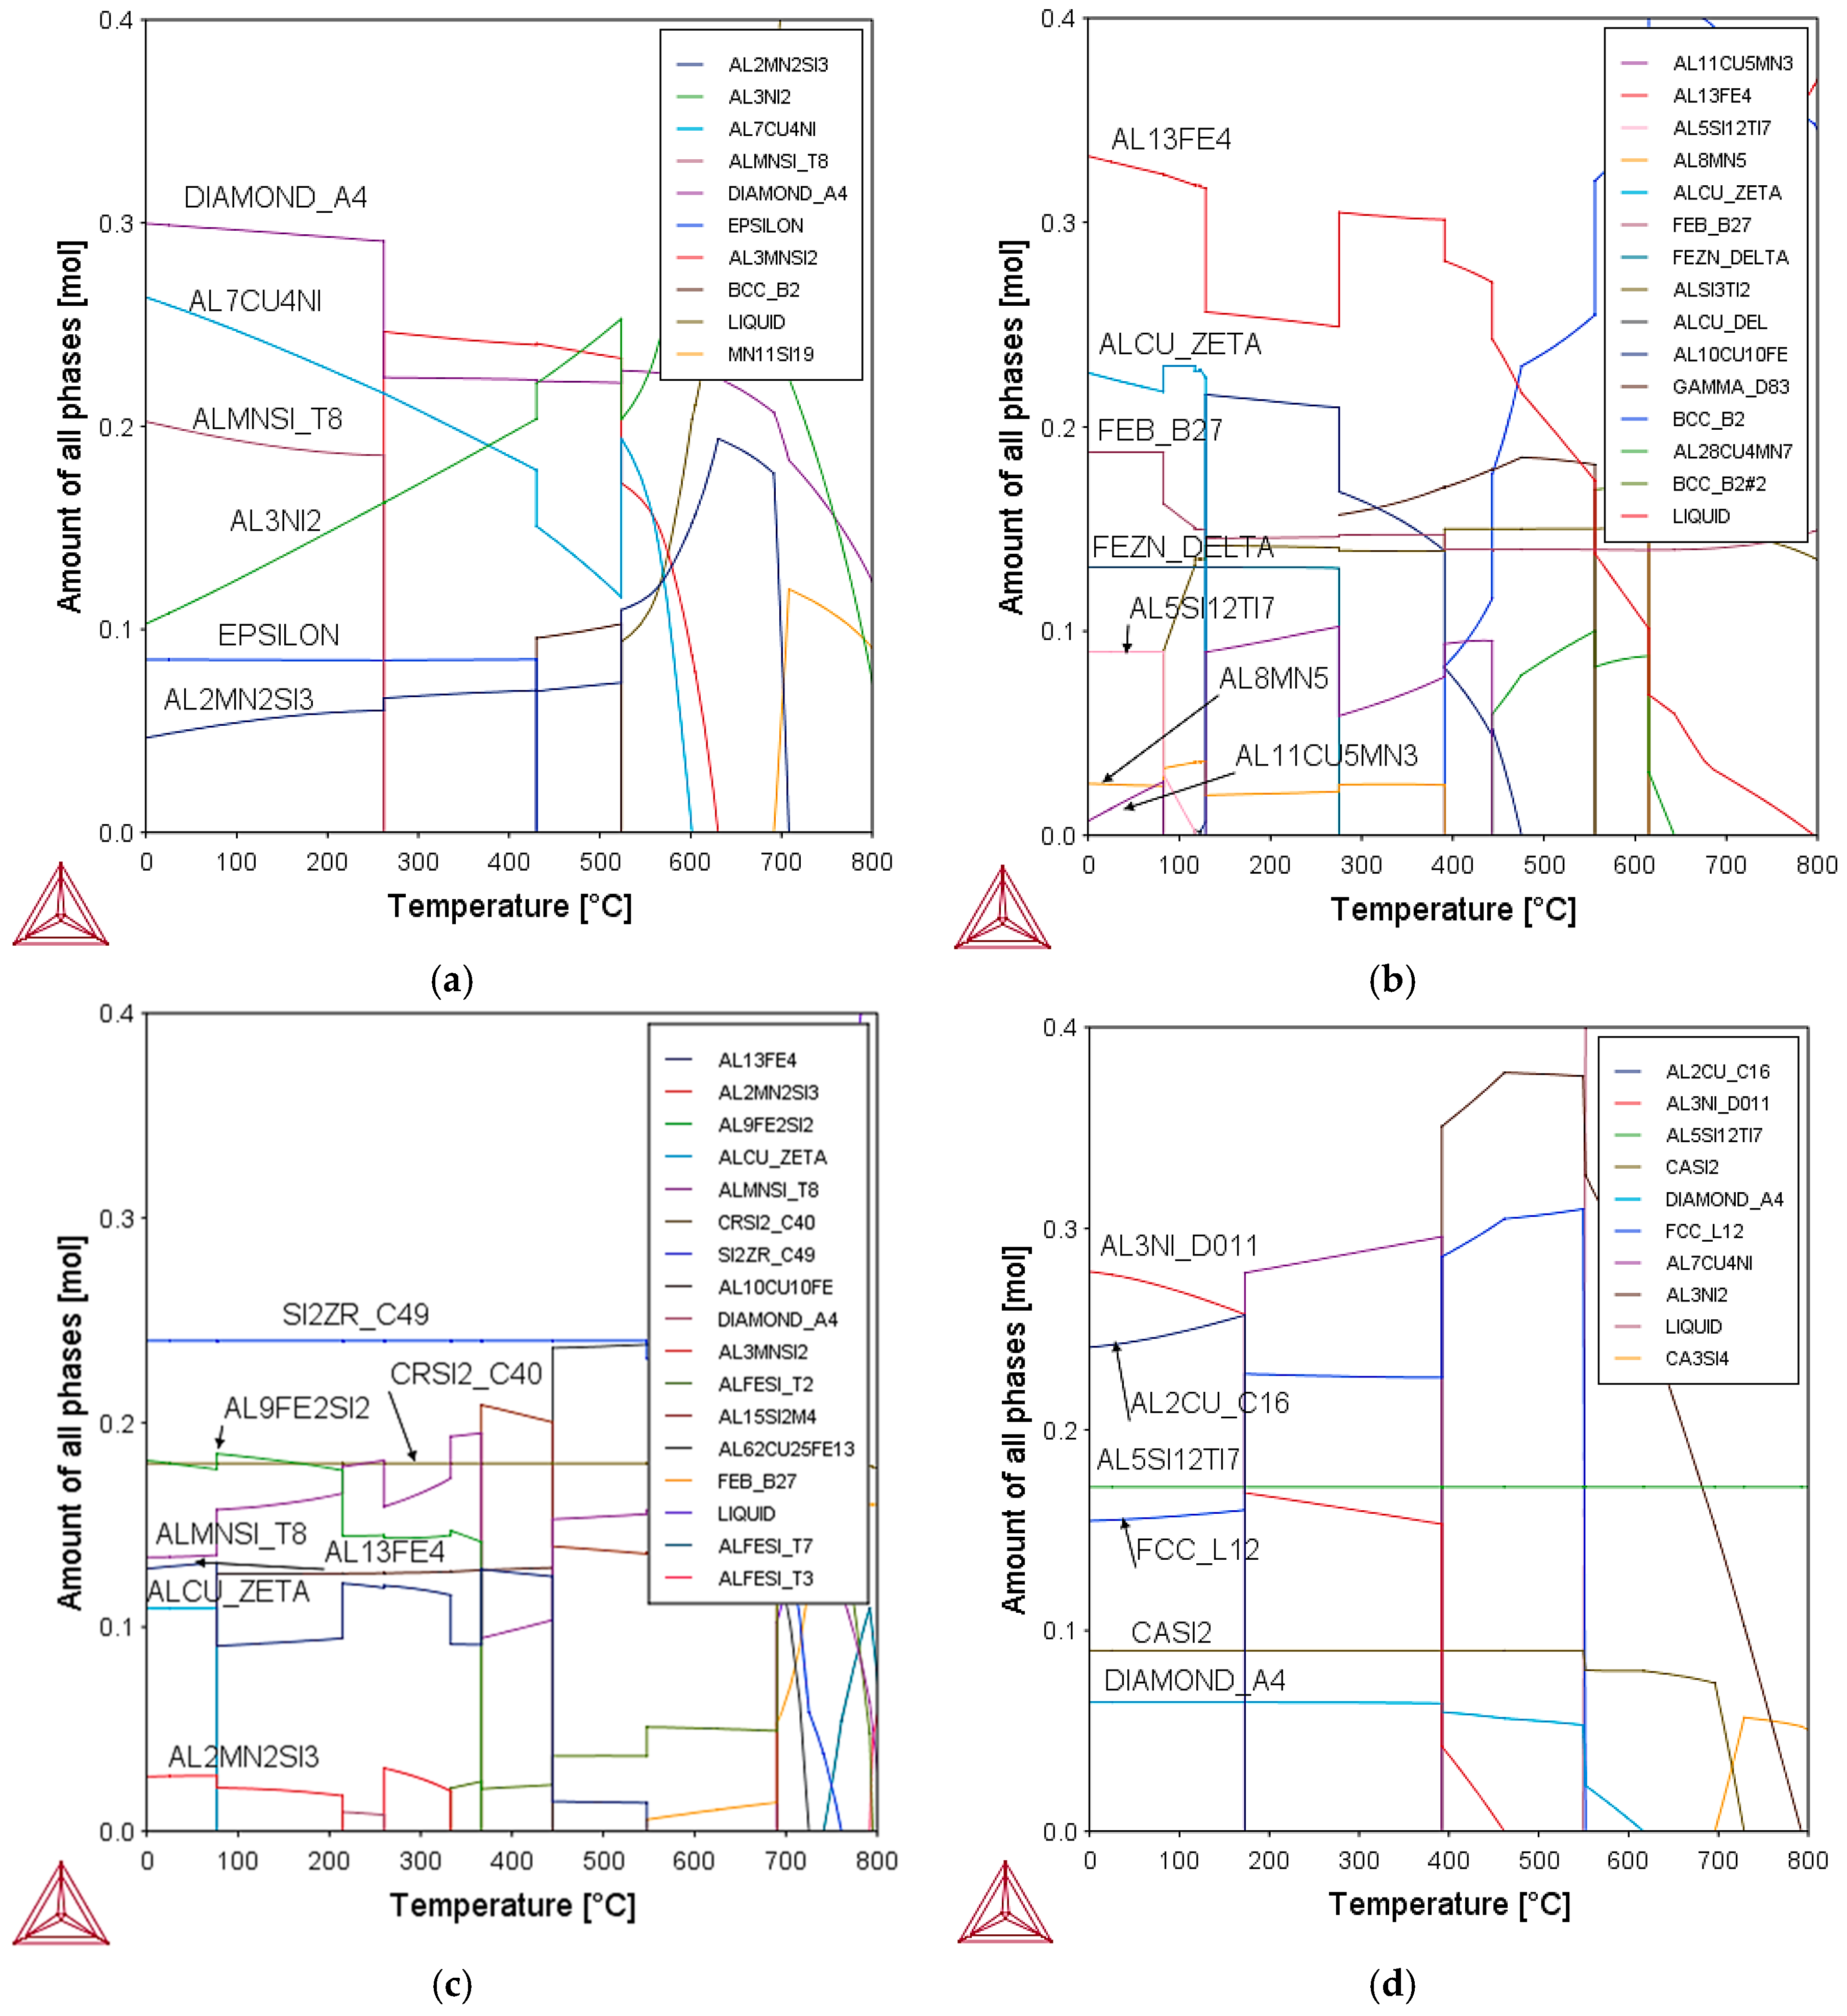
The TCAL5 database is used for calculations of the equilibrium diagrams in Figure 1. This database was previously used with reasonable success [22]. For simplification, only labels of the equilibrium phases at room temperature (RT) were added to the diagrams, the rest of the phases can be found in the legend. Some of the phases at RT appear repeatedly in the equilibrium diagrams. These phases are τ8-AlMnSi (in HEAl-1 and HEAl-3), Diamond (A4) (in HEAl-1 and HEAl-4), Al13Fe4 (in HEAl-2 and HEAl-3), Al5Si12Ti7 (in HEAl-2 and HEAl-4) and finally θ-AlCu (in HEAl-2 and HEAl-3).
In Table 2, the phases predicted by Thermo-Calc at RT were summarized with the detailed description of their phase constitution.
3.2. Microstructure of the Cast Samples
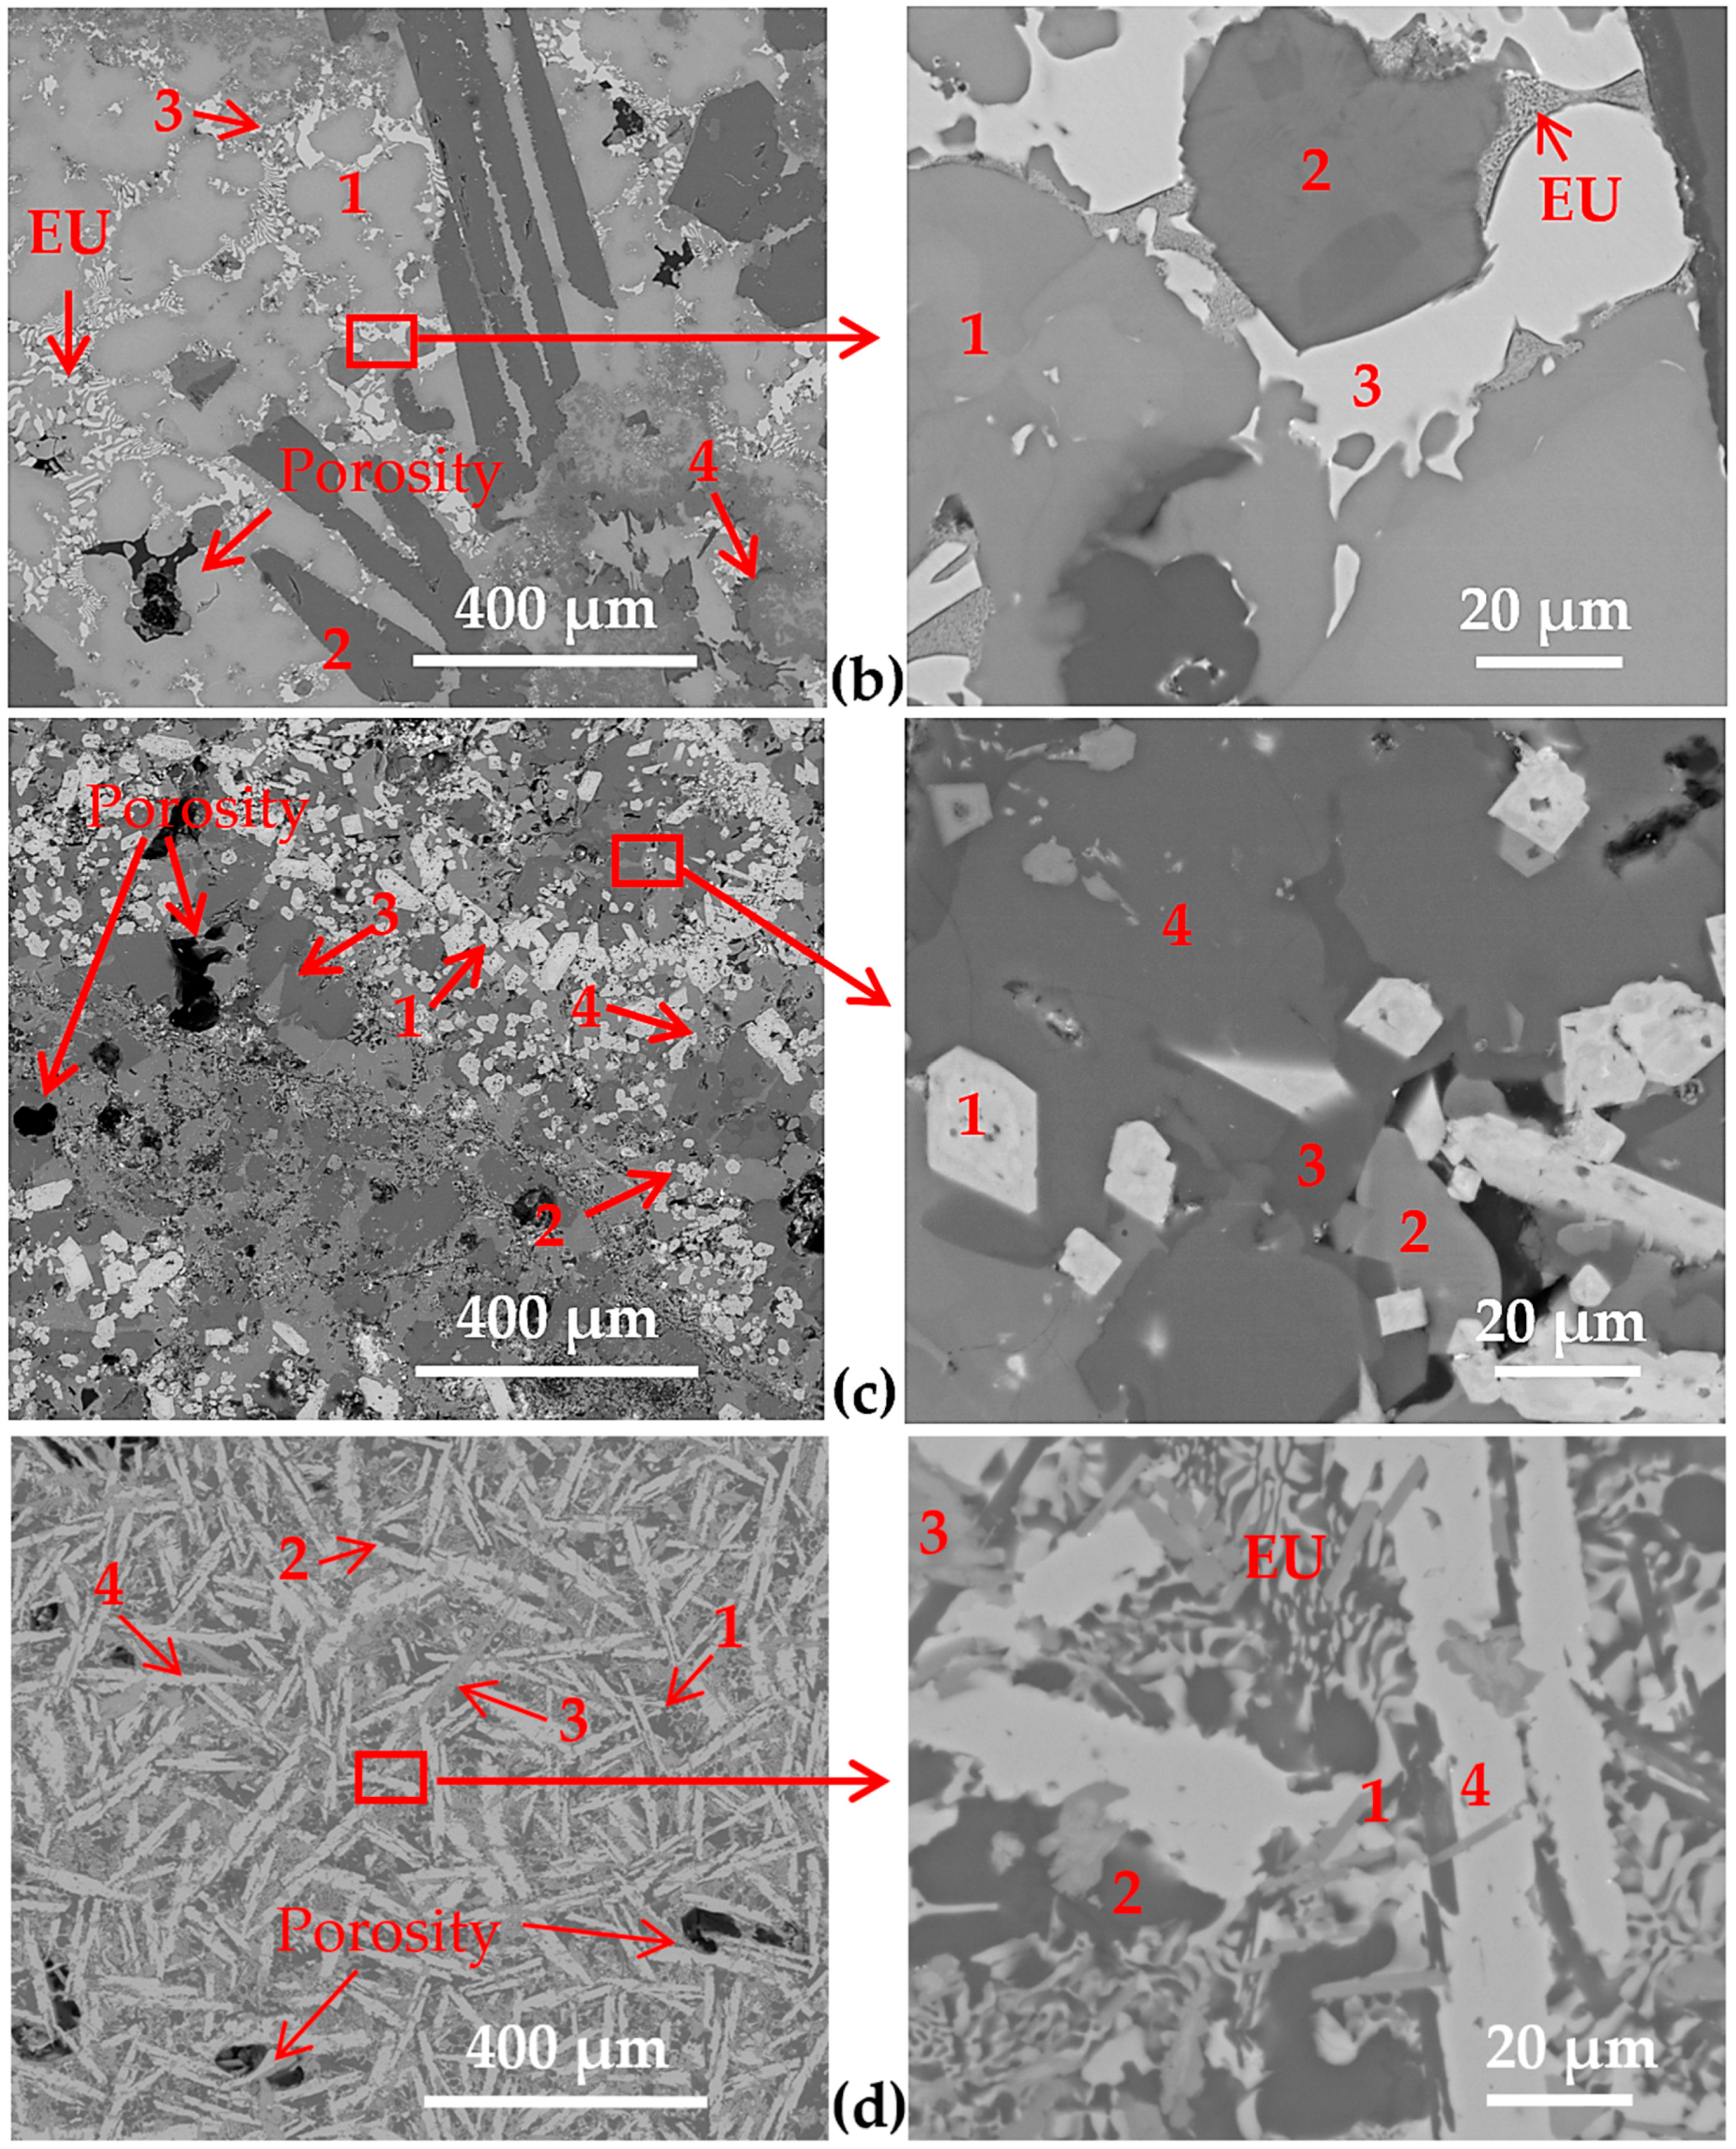
The SEM images in Figure 2 confirm a heterogeneous microstructure of the different alloys. The microstructure of HEAl-1 in Figure 2a shows a needle-shaped intermetallic clustered phase with a rich composition in Al, Cu, and Ni. Region 2 is inside the intermetallic net, filling the gaps as the last solidifying phase, this region is rich in Al and Zn. Regions 3 and 4 are rich in Al, Si, and Mn. Region 4 has blocky morphology and precipitates surrounding Region 1 and Region 5 (Si-rich). There is porosity in the areas where the intermetallic phases form a net that avoid the precipitates from filling the interdendritic areas. Moreover, there is a eutectic precipitation of Region 3 and Region 4 with plate-body and labyrinth-like intermetallic in the interdendritic areas. Finally, there are AlZn(Cu) precipitates in the remaining space. Ni combines with Al and forms Al3[Ni,Cu]2 compound instead of Al3Ni, because an appreciable amount of copper is dissolved in the phase. This Cu absorption modifies the needle-like shape of Al3Ni compounds to a more desirable clustered structure. In HEAl-2 (Figure 2b), we can observe large Al(Si,Fe)-rich region (Region 2), that precipitate before the AlCu(Zn) matrix (Region 1). Around these two regions, Zn-richness (Region 3) can be observed, with a eutectic zone in the interdendritic area composed by a matrix (Region 1) and precipitates (Region 3), marked as EU in Figure 2c. Ti-rich region (Region 4) is not homogeneously distributed in the localized regions of the microstructure. In HEAl-3 (Figure 2c), Region 1 is well distributed over the matrix and it is composed by Si, Zr, and V. The matrix is composed of Al, Si, Fe, and Zr (Region 2) in near equimolar composition. Region 3 is rich in Al and Si, surrounded by Al-Cu-rich region (Region 4). In HEAl-4 (Figure 2d), the matrix is a very fine Al-rich SS (Region 2) with a small amount of Si. Region 4 is Al-Cu-Ni-rich region with a needle-shaped morphology that is distributed along the matrix. The Ca-rich (Region 1) and Si-rich (Region 3) regions are well distributed among the needles. The eutectic area, marked as EU in Figure 2d is composed of Al-rich matrix and Al3[Ni,Cu]2 precipitates.
The elemental composition of the different regions was measured by SEM + EDS. The overall compositions of every sample and each region composition are described in Table 3. The results obtained by SEM/EDS have been added only for qualitative comparison and must not be taken quantitatively because of the higher uncertainty of the method.
To ensure good liquidity and castability of the molten alloys, the temperature reached up to 800 °C during the process. Thus, elements with low boiling point such as Ca and Zn tend to evaporate, as can be observed by comparing target compositions (Table 1) and overall compositions (Table 3). In the case of Ti in HEAl-4, the low percentage of Ti in the final composition is related to its oxidation, since drosses were observed.
3.3. Phase Composition
According to previous sections, a multiphase character can be observed for the studied alloys, which is proven by the results of XRD measurements in Figure 3, Figure 4, Figure 5 and Figure 6. All the patterns present low diffraction peaks that cannot be indexed, due to the presence of low concentration impurities or the formation of oxides during the melting process which cannot be identified by SEM + EDS.
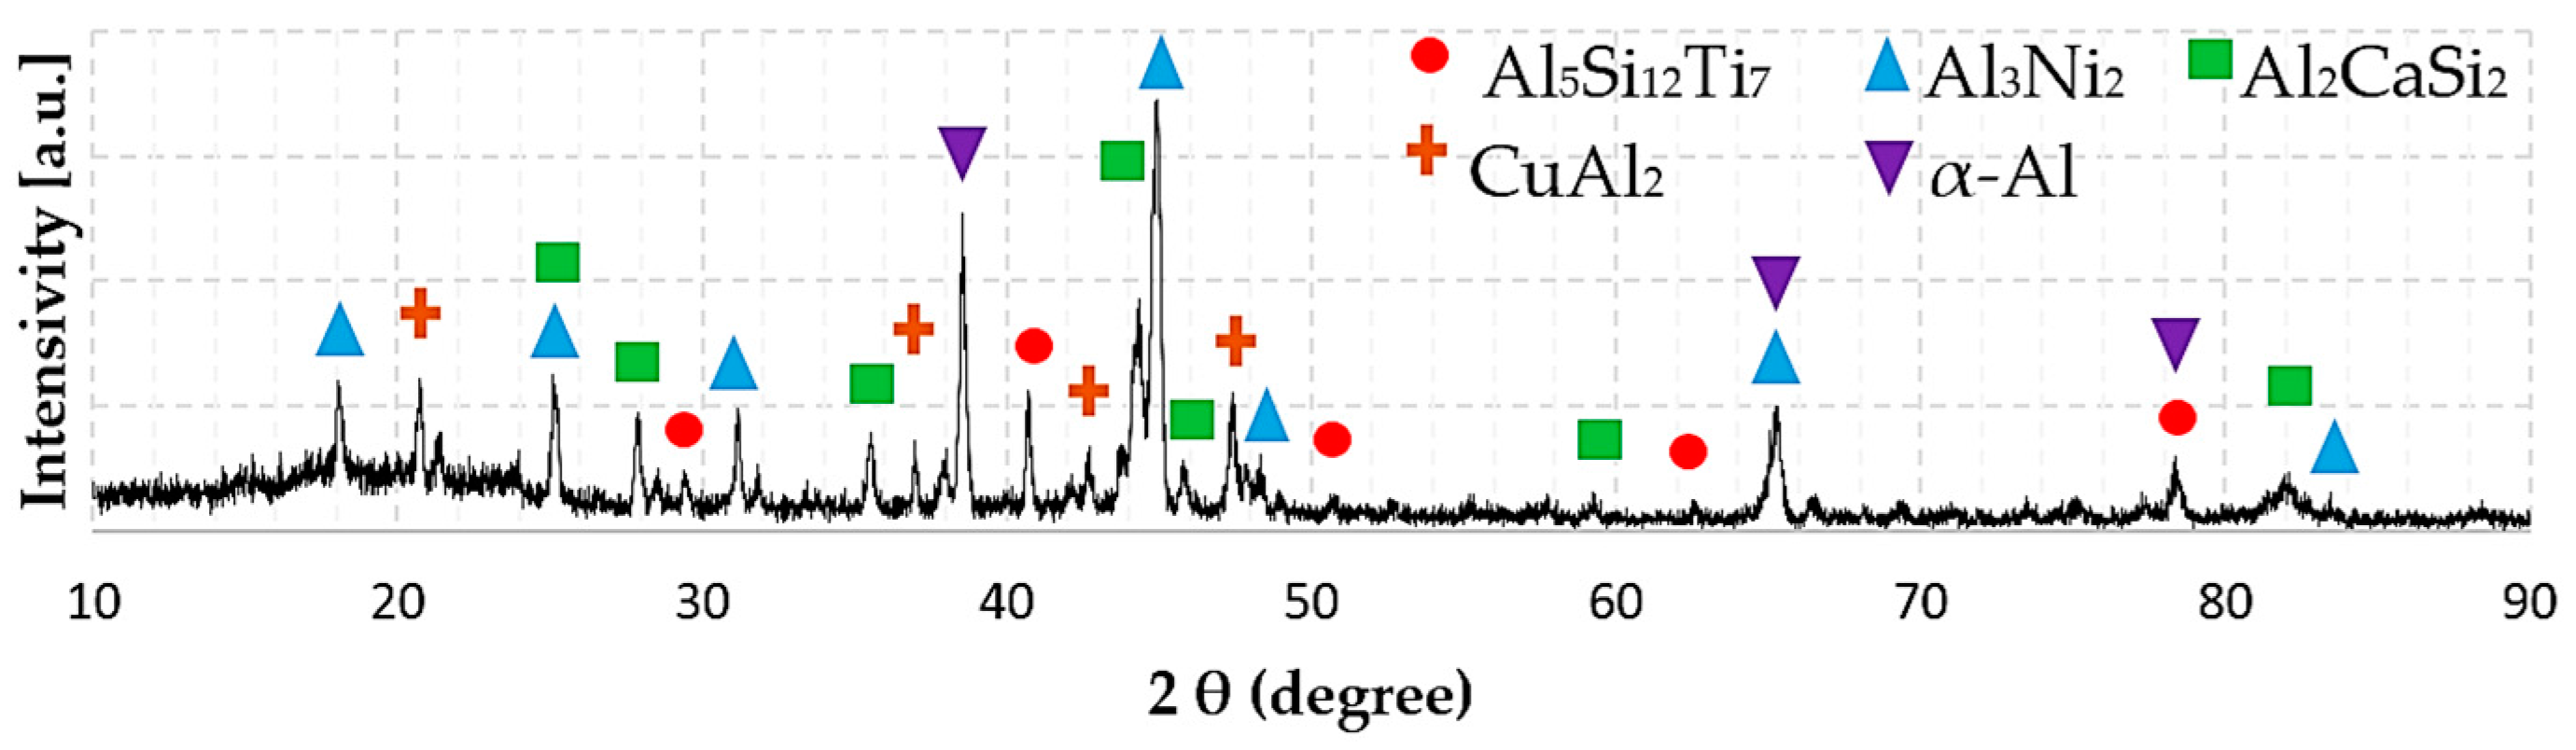
The major crystallographic information is summarized and correlated with the result obtained by Thermo-Calc in Table 4. In HEAl-1 (Figure 3), all the phases predicted by Thermo-Calc were observed with the exception of Epsilon phase. In HEAl-2 (Figure 4), six phases fit well with the predictions made by Thermo-Calc, but FeB (B27) phase was not observed. In HEAl-3 (Figure 5), Thermo-Calc simulations and XRD measurements are completely consistent. In HEAl-4 (Figure 6), Diamond (A4) phase was not observed in the diffraction diagram. The results obtained by XRD suggested the formation of Al3Ni2 instead of Al3Ni (D011), which is qualitatively consistent with the chemical composition of Region 4 in Table 3. In addition, Al3Ni (D011) does not admit Cu in the microstructure (Table 2). The predicted CaSi2 tetragonal phase was not observed in the XRD pattern and the peaks correspond to Al2CaSi2 hexagonal lattice. This phase agrees qualitatively with the chemical composition of Region 1 (Table 3).
3.4. Microhardness of the Samples
The manufactured alloys exhibit very high microhardness, only Al20Be20Fe10Si15Ti35 [29] with 911 Hv exceeds the values of HEAl-1, HEAl-2, and HEAl-3 alloys. However, Be is not used in this study since it is listed as a Class A EPA carcinogen [31]. Table 5 shows the mean microhardness value with the standard deviation and the density of the studied alloys. The standard deviation of the microhardness is very large in HEAl-1, because Al3Ni2 which is the main phase (Region 1 in Figure 2a), has very high hardness of 887–898 Hv [32] comparing with the rest of phases in the microstructure. According to the Tabor relation [33], the Vickers hardness divided by 3 should approximate the yield strength. Values estimated by this way are also given in Table 5. Although HEAl-4 has the lowest hardness, the estimated strength–density ratio is still higher than alloy Ti-6Al-4V (265 MPa/g·cm−3), which is the most widely used titanium alloy.
4. Conclusions
In the present work, the microstructure, phase compositions, and microhardness of Al40Cu15Mn5Ni5Si20Zn15, Al45Cu15Fe5Mn5Si5Ti5Zn20, Al35Cu5Fe5Mn5Si30V10Zr10 and Al50Ca5Cu5Ni10Si20Ti10 alloys manufactured by large scale casting route were studied. The following conclusions were drawn:
- The LWHEAs have been made by traditional casting on a scale never done before (~4 kg). Our results suggested that LWHEAs with high strength and high hardness, as well as good liquidity and castability, can be adapted to large-scale industrial production. The non-equimolar character of alloys with a high Al composition has allowed it.
- The comparison between the experimental and Thermo-Calc results, demonstrates the applicability of TCAL5 database in simulating the microstructure of Al-based LWHEAs. Whereas the formation of phases in HEAl-1, HEAl-2, and HEAl-3 alloys correspond to the phases predicted by Thermo-Calc, the formation of phases in HEAl-4 corresponds only partially to the predicted ones.
- Although Al is the major element, none of the microstructures present the typical dendritic microstructure of as-cast traditional Al alloys, consisting on α-Al phase matrix with eutectics or precipitates. Al is well-distributed over the whole alloy, forming different microstructures with the rest of elements.
- In the context of current developments in LWHEAs, the obtained results provide an approach to the development of new alloys. New LWHEAs can provide a combination of low density and microstructures reinforced with ICs that could increase wear, strength, and performance at high temperatures. The obtained results in terms of hardness and density reflect the advantage of these new alloys over traditional lightweight alloys.
Acknowledgments
This work has been partially funded by the Basque Government through the project Elkartek: KK-2017/00007.
Author Contributions
Jon Mikel Sanchez and Iban Vicario performed the experiments; Jon Mikel Sanchez, Iban Vicario, Jose Carlos Garcia, Joseba Albizuri, Maria Teresa Guraya, and Natalia E. Koval analyzed the data; Jon Mikel Sanchez wrote the paper; Iban Vicario supervised the work.
Conflicts of Interest
The authors declare no conflict of interest.
References
- Yeh, J.W.; Chen, S.K.; Lin, S.J.; Gan, J.Y.; Chin, T.S.; Shun, T.T.; Tsau, C.H.; Chang, S.Y. Nanostructured high-entropy alloys with multiple principal elements: Novel alloy design concepts and outcomes. Adv. Eng. Mater. 2004, 6, 299–303. [Google Scholar] [CrossRef]
- Cantor, B.; Chang, I.T.H.; Knight, P.; Vincent, A.J.B. Microstructural development in equiatomic multicomponent alloys. Mater. Sci. Eng. A 2004, 375–377, 213–218. [Google Scholar] [CrossRef]
- Tsai, M.-H.; Yeh, J.-W. High-Entropy Alloys: A Critical Review. Mater. Res. Lett. 2014, 23, 107–123. [Google Scholar] [CrossRef]
- Miracle, D.B.; Senkov, O.N. A critical review of high entropy alloys and related concepts. Acta Mater. 2017, 122, 448–511. [Google Scholar] [CrossRef]
- Gorsse, S.; Miracle, D.B.; Senkov, O.N. Mapping the world of complex concentrated alloys. Acta Mater. 2017, 135, 177–187. [Google Scholar] [CrossRef]
- Yang, X.; Zhang, Y. Prediction of high-entropy stabilized solid-solution in multi-component alloys. Mater. Chem. Phys. 2012, 132, 233–238. [Google Scholar] [CrossRef]
- Zhang, Y.; Zhou, Y.J.; Lin, J.P.; Chen, G.L.; Liaw, P.K. Solid-solution phase formation rules for multi-component alloys. Adv. Eng. Mater. 2008, 10, 534–538. [Google Scholar] [CrossRef]
- Guo, S. Phase selection rules for cast high entropy alloys: An overview. Mater. Sci. Technol. 2015, 31, 1223–1230. [Google Scholar] [CrossRef]
- Guo, S.; Ng, C.; Lu, J.; Liu, C.T. Effect of valence electron concentration on stability of fcc or bcc phase in high entropy alloys. J. Appl. Phys. 2011, 109. [Google Scholar] [CrossRef]
- Gao, M.C.; Zhang, C.; Gao, P.; Zhang, F.; Ouyang, L.Z.; Widom, M.; Hawk, J.A. Thermodynamics of concentrated solid solution alloys. Curr. Opin. Solid State Mater. Sci. 2017, 21, 238–251. [Google Scholar] [CrossRef]
- Zhang, F.; Zhang, C.; Chen, S.L.; Zhu, J.; Cao, W.S.; Kattner, U.R. An understanding of high entropy alloys from phase diagram calculations. Calphad Comput. Coupling Phase Diagr. Thermochem. 2014, 45, 1–10. [Google Scholar] [CrossRef]
- Tian, F.; Varga, L.K.; Chen, N.; Delczeg, L.; Vitos, L. Ab initio investigation of high-entropy alloys of 3D elements. Phys. Rev. B Condens. Matter Mater. Phys. 2013, 87. [Google Scholar] [CrossRef]
- Liu, Z.; Lei, Y.; Gray, C.; Wang, G. Examination of Solid-Solution Phase Formation Rules for High Entropy Alloys from Atomistic Monte Carlo Simulations. JOM 2015, 67, 2364–2374. [Google Scholar] [CrossRef]
- Gao, M.C.; Liaw, P.K.; Yeh, J.-W.; Zhang, Y. High-Entropy Alloys: Fundamentals and Applications; Springer: Cham, Switzerland, 2016; ISBN 9783319270135. [Google Scholar]
- Miracle, D.B.; Miller, J.D.; Senkov, O.N.; Woodward, C.; Uchic, M.D.; Tiley, J. Exploration and development of high entropy alloys for structural applications. Entropy 2014, 16, 494–525. [Google Scholar] [CrossRef]
- Zhang, Y.; Zuo, T.T.; Tang, Z.; Gao, M.C.; Dahmen, K.A.; Liaw, P.K.; Lu, Z.P. Microstructures and properties of high-entropy alloys. Prog. Mater. Sci. 2014, 61, 1–93. [Google Scholar] [CrossRef]
- Senkov, O.N.; Jensen, J.K.; Pilchak, A.L.; Miracle, D.B.; Fraser, H.L. Compositional variation effects on the microstructure and properties of a refractory high-entropy superalloy AlMo0.5NbTa0.5TiZr. Mater. Des. 2018, 139, 498–511. [Google Scholar] [CrossRef]
- Senkov, O.N.; Senkova, S.V.; Woodward, C.; Miracle, D.B. Low-density, refractory multi-principal element alloys of the Cr-Nb-Ti-V-Zr system: Microstructure and phase analysis. Acta Mater. 2013, 61, 1545–1557. [Google Scholar] [CrossRef]
- Del Grosso, M.F.; Bozzolo, G.; Mosca, H.O. Determination of the transition to the high entropy regime for alloys of refractory elements. J. Alloys Compd. 2012, 534, 25–31. [Google Scholar] [CrossRef]
- Mu, Y.; Liu, H.; Liu, Y.; Zhang, X.; Jiang, Y.; Dong, T. An ab initio and experimental studies of the structure, mechanical parameters and state density on the refractory high-entropy alloy systems. J. Alloys Compd. 2017, 714, 668–680. [Google Scholar] [CrossRef]
- Stepanov, N.D.; Shaysultanov, D.G.; Salishchev, G.A.; Tikhonovsky, M.A. Structure and mechanical properties of a light-weight AlNbTiV high entropy alloy. Mater. Lett. 2015, 142, 153–155. [Google Scholar] [CrossRef]
- Sun, W.; Huang, X.; Luo, A.A. Phase formations in low density high entropy alloys. Calphad Comput. Coupling Phase Diagr. Thermochem. 2017, 56, 19–28. [Google Scholar] [CrossRef]
- Yang, X.; Chen, S.Y.; Cotton, J.D.; Zhang, Y. Phase Stability of Low-Density, Multiprincipal Component Alloys Containing Aluminum, Magnesium, and Lithium. JOM 2014, 66, 2009–2020. [Google Scholar] [CrossRef]
- Feng, R.; Gao, M.; Lee, C.; Mathes, M.; Zuo, T.; Chen, S.; Hawk, J.; Zhang, Y.; Liaw, P. Design of Light-Weight High-Entropy Alloys. Entropy 2016, 18, 333. [Google Scholar] [CrossRef]
- Kumar, A.; Gupta, M. An Insight into Evolution of Light Weight High Entropy Alloys: A Review. Metals 2016, 6, 199. [Google Scholar] [CrossRef]
- Youssef, K.M.; Zaddach, A.J.; Niu, C.; Irving, D.L.; Koch, C.C. A Novel Low-Density, High-Hardness, High-entropy Alloy with Close-packed Single-phase Nanocrystalline Structures. Mater. Res. Lett. 2015, 3, 95–99. [Google Scholar] [CrossRef]
- Li, R.; Gao, J.C.; Fan, K. Study to Microstructure and Mechanical Properties of Mg Containing High Entropy Alloys. Mater. Sci. Forum 2010, 650, 265–271. [Google Scholar] [CrossRef]
- Li, R.; Gao, J.-C.; Fan, K. Microstructure and mechanical properties of MgMnAlZnCu high entropy alloy cooling in three conditions. Mater. Sci. Forum 2011, 686, 235–241. [Google Scholar] [CrossRef]
- Tseng, K.; Yang, Y.; Juan, C.; Chin, T.; Tsai, C.; Yeh, J. A light-weight high-entropy alloy Al20Be20Fe10Si15Ti35. Sci. China Technol. Sci. 2017, 841, 18–23. [Google Scholar] [CrossRef]
- Andersson, J.O.; Helander, T.; Höglund, L.; Shi, P.; Sundman, B. Thermo-Calc & DICTRA, computational tools for materials science. Calphad Comput. Coupling Phase Diagr. Thermochem. 2002, 26, 273–312. [Google Scholar] [CrossRef]
- Taylor, T.P.; Ding, M.; Ehler, D.S.; Foreman, T.M.; Kaszuba, J.P.; Sauer, N.N. Beryllium in the environment: A review. J. Environ. Sci. Heal. Part A Toxic/Hazard. Subst. Environ. Eng. 2003, 38, 439–469. [Google Scholar] [CrossRef]
- Krasnowski, M.; Gierlotka, S.; Kulik, T. Nanocrystalline Al3Ni2 alloy with high hardness produced by mechanical alloying and high-pressure hot-pressing consolidation. Intermetallics 2013, 42, 35–40. [Google Scholar] [CrossRef]
- Tabor, D. The physical meaning of indentation and scratch hardness. Br. J. Appl. Phys. 1956, 7, 159–166. [Google Scholar] [CrossRef]
Figure 1.
Calculated phase diagrams of the manufactured alloys (a) HEAl-1; (b) HEAl-2; (c) HEAl-3; and (d) HEAl-4; using Thermo-Calc software with TCAL5 database.
Figure 1.
Calculated phase diagrams of the manufactured alloys (a) HEAl-1; (b) HEAl-2; (c) HEAl-3; and (d) HEAl-4; using Thermo-Calc software with TCAL5 database.

Figure 2.
SEM images of the cast alloys: (a) HEAl-1; (b) HEAl-2; (c) HEAl-3; (d) HEAl-4. The eutectic zones are marked as EU.
Figure 2.
SEM images of the cast alloys: (a) HEAl-1; (b) HEAl-2; (c) HEAl-3; (d) HEAl-4. The eutectic zones are marked as EU.
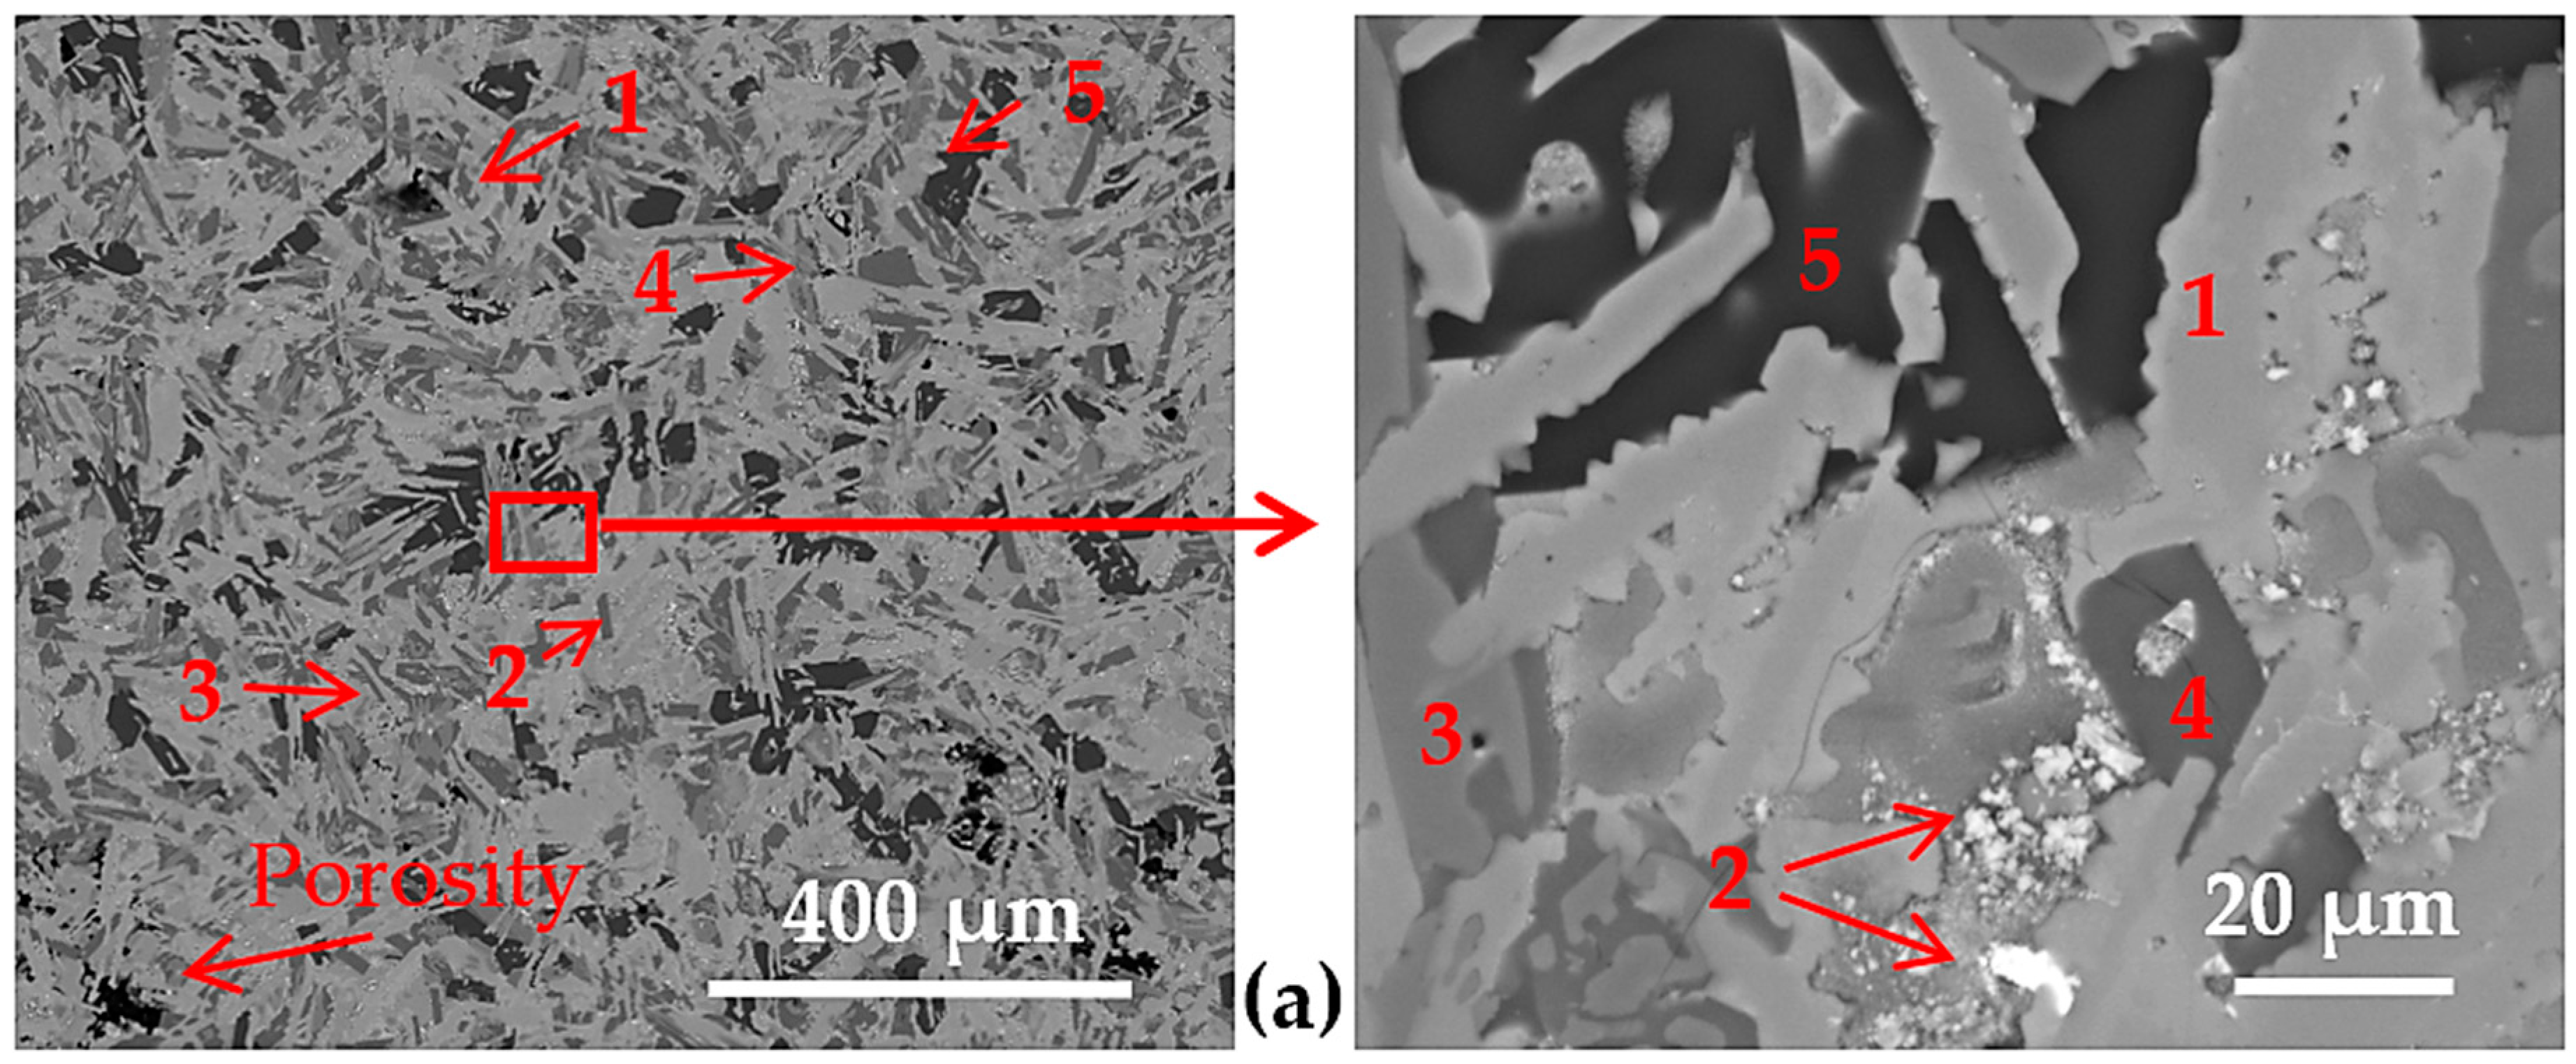

Figure 3.
XRD diffraction diagram of the cast Al40Cu15Mn5Ni5Si20Zn15 alloy (HEAl-1).
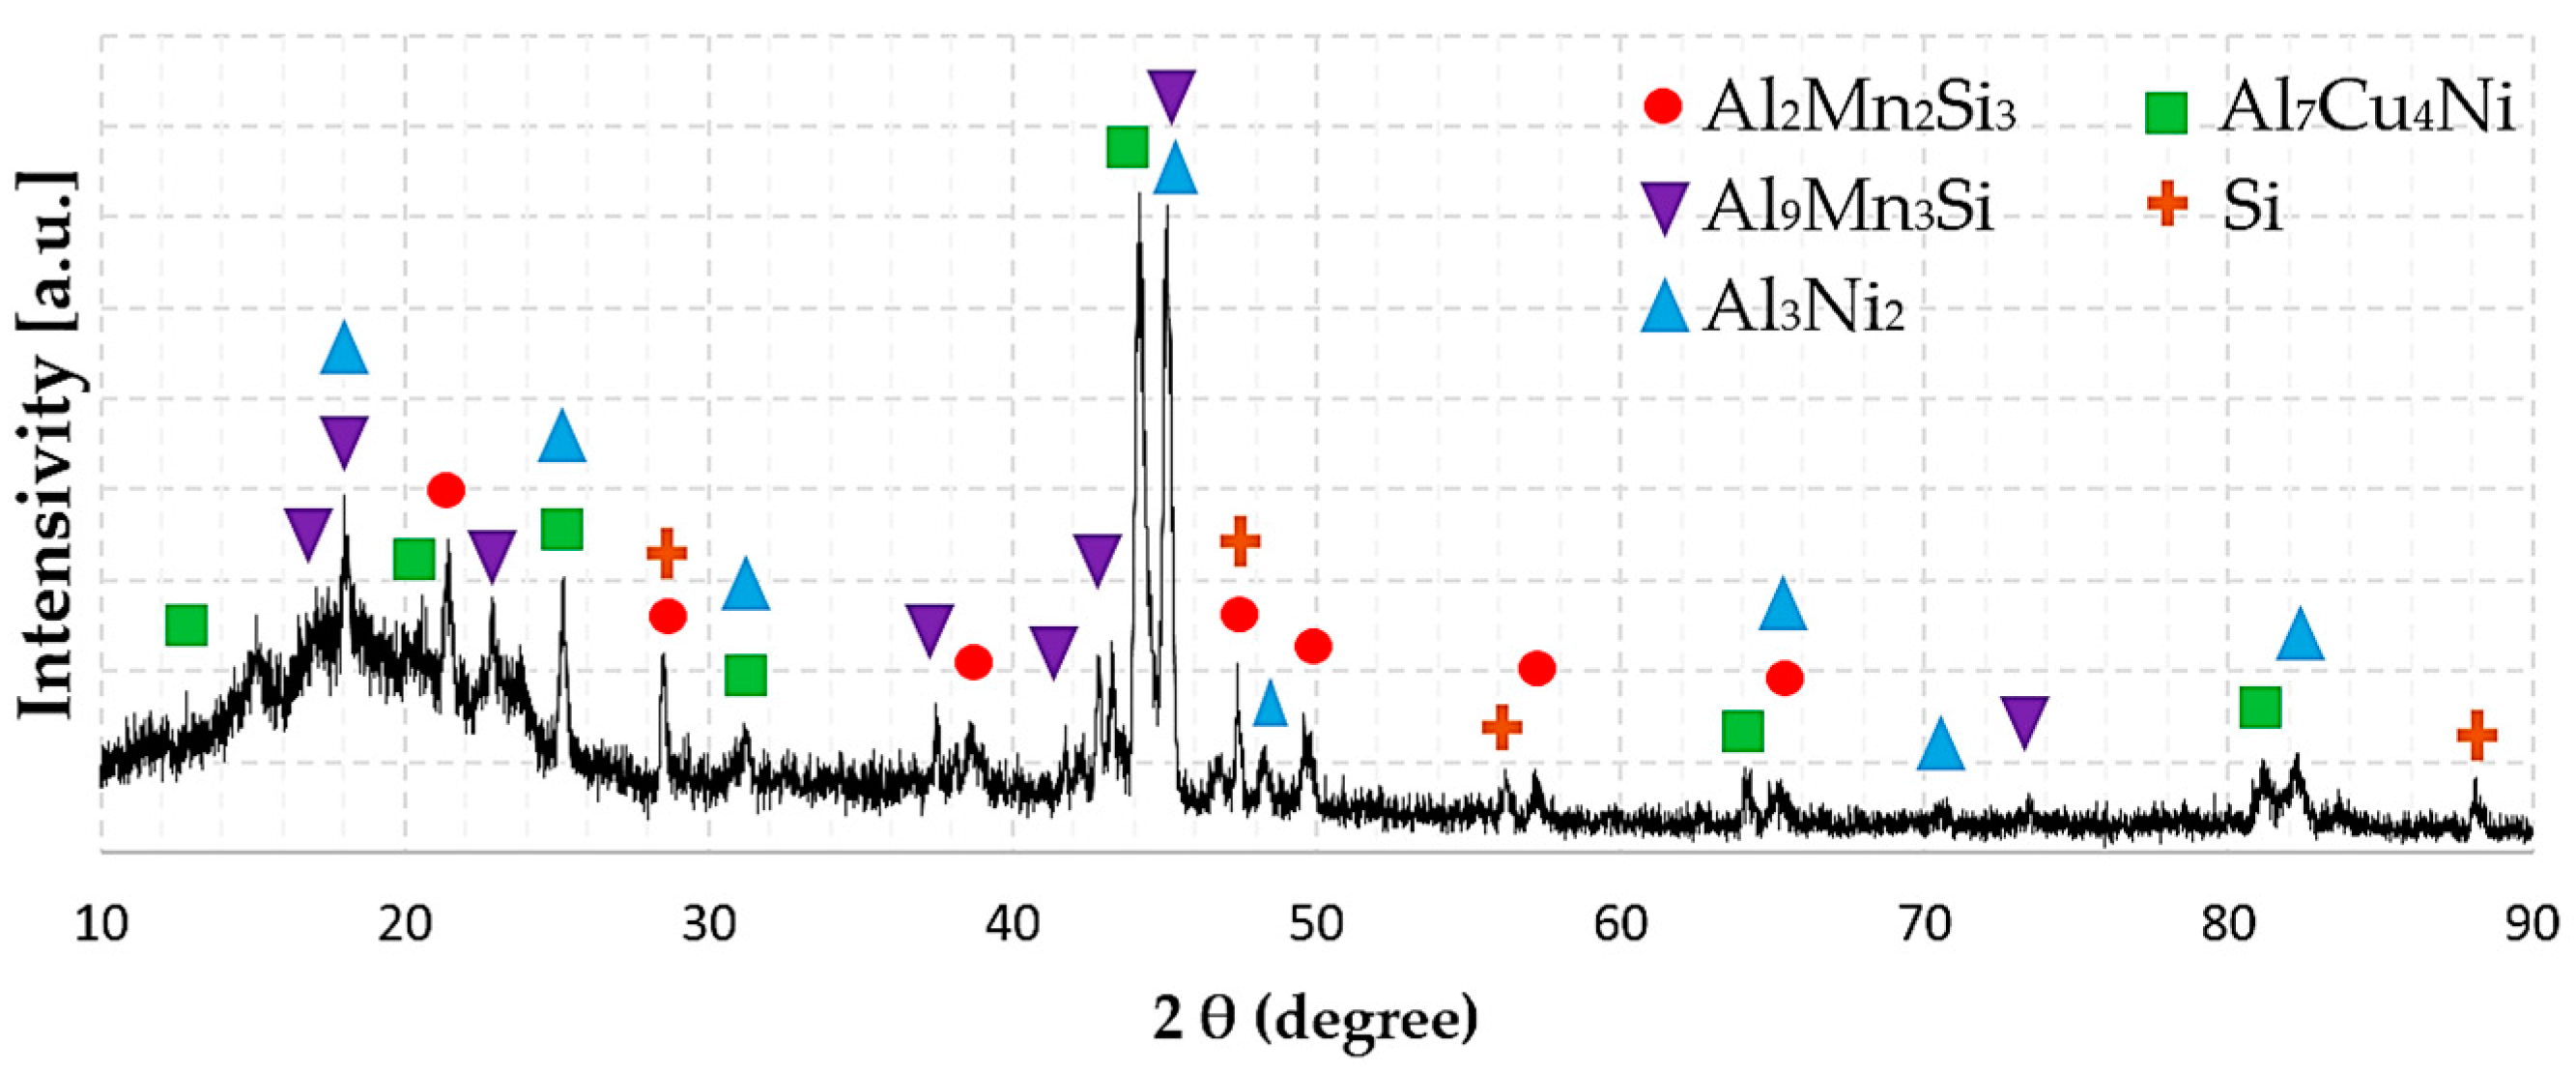
Figure 4.
XRD diffraction diagram of the cast Al45Cu15Mn3Fe5Si5Ti5Zn20 alloy (HEAl-2).
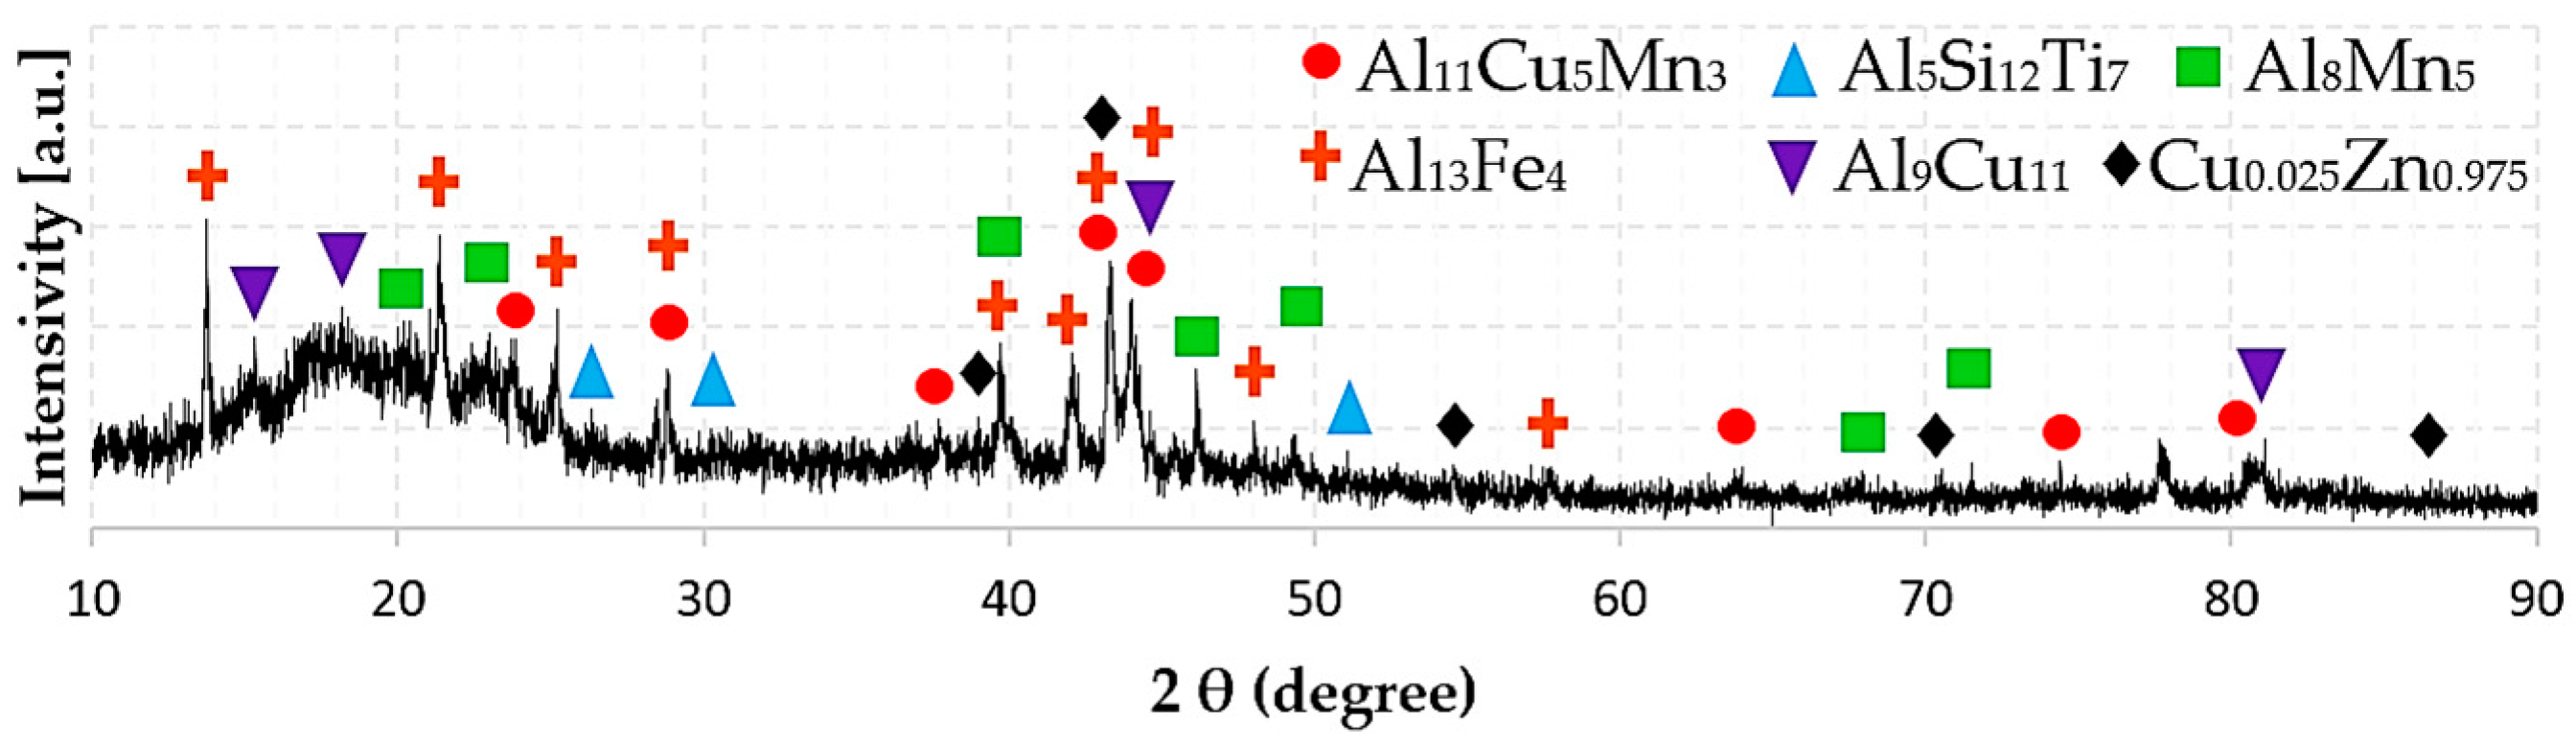
Figure 5.
XRD diffraction diagram of the cast Al35Cu5Fe5Mn5Si30V10Zr10 alloy (HEAl-3).
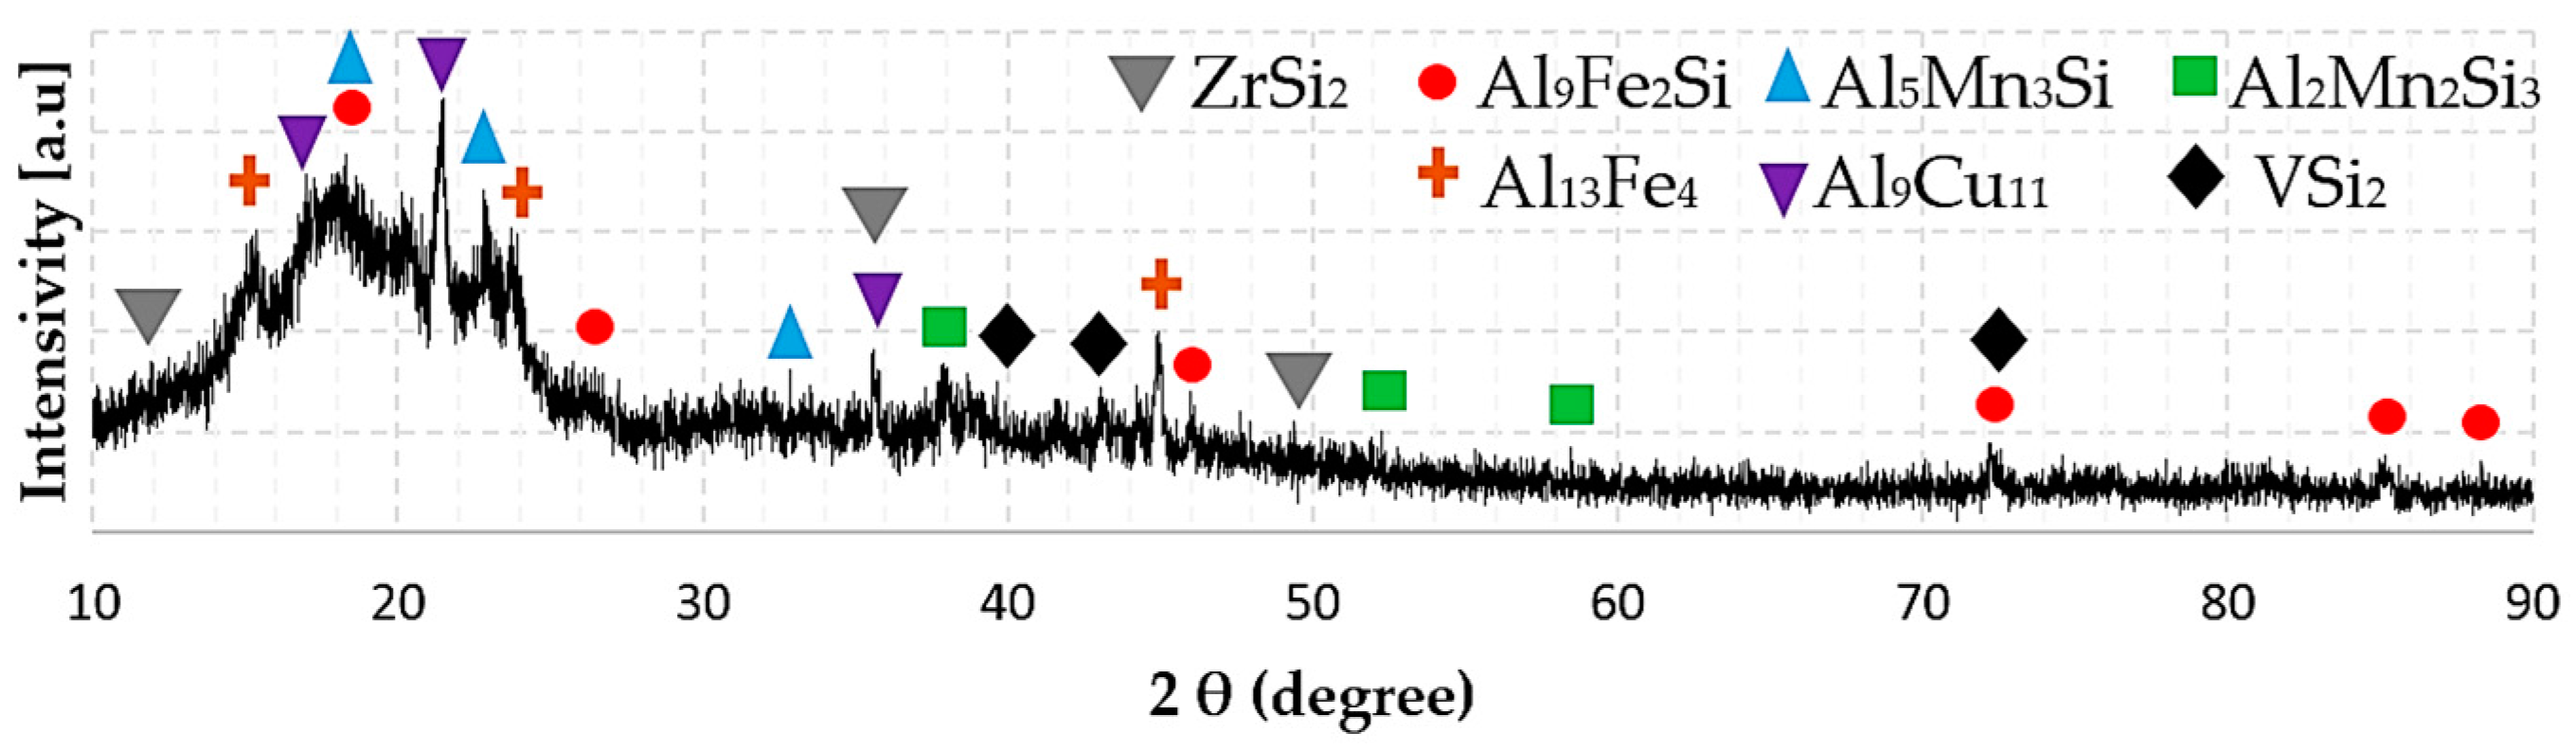
Figure 6.
XRD diffraction diagram of the cast Al50Ca5Cu5Ni10Si20Ti10 alloy (HEAl-4).


Table 1.
Target compositions of the manufactured alloys.
| Alloy | Al | Cu | Si | Mn | Zn | Ni | Fe | Ti | Ca | Zr | V |
|---|---|---|---|---|---|---|---|---|---|---|---|
| HEAl-1 | 40 | 15 | 20 | 5 | 15 | 5 | -- | -- | -- | -- | -- |
| HEAl-2 | 45 | 15 | 5 | 5 | 20 | -- | 5 | 5 | -- | -- | -- |
| HEAl-3 | 35 | 5 | 30 | 5 | -- | -- | 5 | -- | -- | 10 | 10 |
| HEAl-4 | 50 | 5 | 20 | -- | -- | 10 | -- | 10 | 5 | -- | -- |
Table 2.
Phases predicted and phase constitution, using of Thermo-Calc software with TCAL5 database.
Table 2.
Phases predicted and phase constitution, using of Thermo-Calc software with TCAL5 database.
| Alloy | Phase | Phase Constitution |
|---|---|---|
| HEAl-1 | Al2Mn2Si3 | (Al)2 (Mn)2 (Si)3 |
| Al3Ni2 | (Al,Si,Zn)3 (Al,Cu,Ni)2 (Ni,VA)1 | |
| Al7Cu4Ni | (Al)1 (Cu,Ni,VA)1 | |
| τ8-AlMnSi | (Al)6 (Mn)3 (Al,Mn,Si)3 (Al,Si)1 | |
| Diamond (A4) | (Al,Si,Zn) | |
| Epsilon | (Cu,Mn,Zn)1 | |
| HEAl-2 | Al11Cu5Mn3 | (Al)11 (Mn)3 (Cu)5 |
| Al13Fe4 | (Al,Cu)0.63 (Fe,Mn,Zn)0.23 (Al,Si,VA,Zn)0.14 | |
| Al5Si12Ti7 | (Al,Si)0.21 (Si)0.5 (Ti)0.29 | |
| Al8Mn5 | (Al,Zn)12 (Mn)5 (Al,Cu,Mn,Si)9 | |
| θ-AlCu | (Al)9 (Cu,Fe)11 | |
| FeB (B27) | (Fe,Mn,Ti)1 (Al,Si,Zn)1 | |
| δ-FeZn | (Fe)0.06 (Al,Cu,Fe,Mn,Si,Zn)0.18 (Zn)0.53 (Zn)0.24 | |
| HEAl-3 | Al13Fe4 | (Al,Cu)0.63 (Fe,Mn)0.23 (Al,Si,VA)0.14 |
| Al2Mn2Si3 | (Al)2 (Mn)2 (Si)3 | |
| Al9Fe2Si2 | (Al)0.6 (Fe)0.15 (Si)0.1 (Al,Si)0.15 | |
| θ-AlCu | (Al)9 (Cu,Fe)11 | |
| τ8-AlMnSi | (Al)6 (Mn)3 (Al,Mn,Si)3 (Al,Si)1 | |
| CrSi2 (C40) | (Si,V)1 (Al,Si)2 | |
| SI2Zr (C49) | (Si)2 (Zr)1 | |
| HEAl-4 | Al2Cu (C16) | (Al,Ni)2 (Al,Cu,Ni,Si)1 |
| Al3Ni (D011) | (Al,Ni)0.75 (Ni)0.25 | |
| Al5Si12Ti7 | (Al,Si)0.21 (Si)0.5 (Ti)0.29 | |
| CaSi2 | (Ca)0.33 (Si)0.67 | |
| Diamond (A4) | (Al, Si, Zn) | |
| FCC (L12) | (Al,Ca,Cu,Ni,Si,Ti)0.75 (Al,Ca,Cu,Ni,Si,Ti)0.25 (VA)1 |
Table 3.
Chemical composition of the regions and overall compositions in at. %.
| Alloy | Region | Al | Cu | Si | Mn | Zn | Ni | Fe | Ti | Ca | Zr | V |
|---|---|---|---|---|---|---|---|---|---|---|---|---|
| HEAl-1 | 1 | 57 | 11 | 5 | -- | -- | 27 | -- | -- | -- | -- | -- |
| 2 | 48 | 6 | -- | -- | 46 | -- | -- | -- | -- | -- | -- | |
| 3 | 25 | -- | 42 | 33 | -- | -- | -- | -- | -- | -- | -- | |
| 4 | 62 | 3 | 17 | 16 | 2 | -- | -- | -- | -- | -- | -- | |
| 5 | -- | 2 | 98 | -- | -- | -- | -- | -- | -- | -- | -- | |
| overall | 36 | 12 | 34 | 6 | 7 | 5 | -- | -- | -- | -- | -- | |
| HEAl-2 | 1 | 42 | 42 | -- | -- | 15 | -- | 1 | -- | -- | -- | -- |
| 2 | 52 | 3 | 16 | 7 | 3 | -- | 19 | -- | -- | -- | -- | |
| 3 | 7 | 22 | -- | -- | 71 | -- | -- | -- | -- | -- | -- | |
| 4 | 5 | 2 | -- | -- | 2 | -- | -- | 91 | -- | -- | -- | |
| overall | 38 | 15 | 16 | 4 | 10 | -- | 6 | 11 | -- | -- | -- | |
| HEAl-3 | 1 | -- | -- | 51 | 3 | -- | -- | -- | -- | -- | 21 | 25 |
| 2 | 26 | -- | 32 | 7 | -- | -- | 13 | -- | -- | 20 | 2 | |
| 3 | 66 | 3 | 15 | 8 | -- | -- | 8 | -- | -- | -- | -- | |
| 4 | 62 | 26 | 7 | 3 | -- | -- | 1 | -- | -- | -- | 1 | |
| overall | 38 | 6 | 32 | 5 | -- | -- | 5 | -- | -- | 8 | 6 | |
| HEAl-4 | 1 | 34 | 1 | 49 | -- | -- | 1 | -- | -- | 15 | -- | -- |
| 2 | 91 | 5 | 4 | -- | -- | -- | -- | -- | -- | -- | -- | |
| 3 | 13 | -- | 60 | -- | -- | -- | -- | 27 | -- | -- | -- | |
| 4 | 59 | 13 | 2 | -- | -- | 26 | -- | -- | -- | -- | -- | |
| overall | 56 | 7 | 21 | -- | -- | 7 | -- | 4 | 5 | -- | -- |
Table 4.
List of phases detected by XRD, space group and their lattice parameters correlated to predicted phases by Thermo-Calc.
Table 4.
List of phases detected by XRD, space group and their lattice parameters correlated to predicted phases by Thermo-Calc.
| Alloy | Phase | Space Group | Lattice Parameter (Å) | Thermo-Calc |
|---|---|---|---|---|
| HEAl-1 | Al2Mn2Si3 | P6 (174) | a = b = 9.61, c = 3.56 | Al2Mn2Si3 |
| Al3Ni2 | Pm1 (164) | a = b = 4.06, c = 4.90 | Al3Ni2 | |
| Al7Cu4Ni | Rm (166) | a = b = 4.10, c = 4.00 | Al7Cu4Ni | |
| Al9Mn3Si | P63/mmc (194) | a = b = 7.51, c = 7.74 | τ8-AlMnSi | |
| Si | Fdm (227) | a = b = c = 5.43 | Diamond (A4) | |
| HEAl-2 | Al11Cu5Mn3 | P (0) | a = 12.10, b = 24.08, c = 19.20 | Al11Cu5Mn3 |
| Al13Fe4 | C2/m (12) | a = 15.49, b = 8.08, c = 12.47 | Al13Fe4 | |
| Al5Si12Ti7 | I41/amd (141) | a = b = 3.57, c = 27.15 | Al5Si12Ti7 | |
| Al8Mn5 | Rm (166) | a = b = 12.64, c =15.85 | Al8Mn5 | |
| Al9Cu11 | Imm2 (44) | a = 4.09, b = 7.03, c = 9.98 | θ-AlCu | |
| Cu0.025Zn0.975 | P63/mmc (194) | a = 12.1, b = 24.08, c = 19.20 | δ-FeZn | |
| HEAl-3 | Al13Fe4 | C2/m (12) | a = 15.49, b = 8.08, c = 12.47 | Al13Fe4 |
| Al2Mn2Si3 | P6 (174) | a = b = 9.61, c = 3.56 | Al2Mn2Si3 | |
| Al9Fe2Si | C2/c (15) | a = 20.80, b = 6.16, c = 6.15 | Al9Fe2Si | |
| Al9Cu11 | Imm2 (44) | a = 4.09, b = 7.03, c = 9.98 | θ-AlCu | |
| Al9Mn3Si | P63/mmc (194) | a = b = 7.51, c = 7.74 | τ8-AlMnSi | |
| VSi2 | P6222 (180) | a = b = 4.57, c = 6.37 | CrSi2 (C40) | |
| ZrSi2 | Cmcm (63) | a = 3.71, b = 14.73, c = 3.66 | Si2Zr (C49) | |
| HEAl-4 | CuAl2 | I4/mcm (140) | a = b = 6.07, c = 4.89 | Al2Cu (C16) |
| Al3Ni2 | Pm1 (164) | a = b = 4.06, c = 4.90 | Al3Ni (D011) | |
| Al5Si12Ti7 | I41/amd (141) | a = b = 3.57, c = 27.15 | Al5Si12Ti7 | |
| Al2CaSi2 | Pm1 (164) | a = b = 4.13, c = 7.14 | CaSi2 | |
| α-Al | Fmm (225) | a = b = c = 4.05 | FCC (L12) |
Table 5.
Microhardness, density, estimated yield strength, and strength/density ratio of the manufactured alloys.
Table 5.
Microhardness, density, estimated yield strength, and strength/density ratio of the manufactured alloys.
| Alloy | Hardness (Hv) | Density (g/cm3) | σy (Mpa) | σy/Density (MPa/g·cm−3) |
|---|---|---|---|---|
| HEAl-1 | 887 ± 273 | 4.08 | 2900 | 711 |
| HEAl-2 | 744 ± 134 | 5.07 | 2432 | 480 |
| HEAl-3 | 751 ± 54 | 3.96 | 2455 | 620 |
| HEAl-4 | 437 ± 88 | 3.33 | 1429 | 429 |
© 2018 by the authors. Licensee MDPI, Basel, Switzerland. This article is an open access article distributed under the terms and conditions of the Creative Commons Attribution (CC BY) license (http://creativecommons.org/licenses/by/4.0/).
Share and Cite
MDPI and ACS Style
Sanchez, J.M.; Vicario, I.; Albizuri, J.; Guraya, T.; Koval, N.E.; Garcia, J.C. Compound Formation and Microstructure of As-Cast High Entropy Aluminums. Metals 2018, 8, 167. https://doi.org/10.3390/met8030167
AMA Style
Sanchez JM, Vicario I, Albizuri J, Guraya T, Koval NE, Garcia JC. Compound Formation and Microstructure of As-Cast High Entropy Aluminums. Metals. 2018; 8(3):167. https://doi.org/10.3390/met8030167
Chicago/Turabian StyleSanchez, Jon Mikel, Iban Vicario, Joseba Albizuri, Teresa Guraya, Natalia E. Koval, and Jose Carlos Garcia. 2018. "Compound Formation and Microstructure of As-Cast High Entropy Aluminums" Metals 8, no. 3: 167. https://doi.org/10.3390/met8030167
Note that from the first issue of 2016, this journal uses article numbers instead of page numbers. See further details here.