Article

Microstructural Characteristics and m23c6 Precipitate Behavior of the Course-Grained Heat-Affected Zone of T23 Steel without Post-Weld Heat Treatment

1
Department of Hybrid Materials & Machining Technology, Graduate School of Convergence Science, Pusan National University, Busan 46241, Korea
2
Department of Material Science and Engineering, Pusan National University, Busan 46241, Korea
3
Corporate R&D Institute, Doosan Heavy Industries, Changwon 642-792, Korea
4
Department of Chemical and Biomolecular Engineering, Pusan National University, Busan 46241, Korea
*
Author to whom correspondence should be addressed.
Metals 2018, 8(3), 170; https://doi.org/10.3390/met8030170
Submission received: 10 December 2017 / Revised: 28 February 2018 / Accepted: 8 March 2018 / Published: 9 March 2018
(This article belongs to the Special Issue Science, Characterization and Technology of Joining and Welding)

Abstract

:
The microstructural characteristics of a simulated heat-affected zone (HAZ) in SA213-T23 (2.25Cr-1.6W steel) used for boiler tubes employed in thermal power plants were investigated using nital, alkaline sodium picrate, and Murakami’s etchants. In order to investigate the microstructure formation process of the HAZ in the welding process, simulated HAZ specimens were fabricated at intervals of 100 °C for peak temperatures between 950 and 1350 °C, and the microstructural features and precipitate behavior at various peak temperatures were observed. The alkaline-sodium-picrate-etched microstructures exhibited a black dot or band, which was not observed in the natal-etched microstructure. As the temperature increased from 950 to 1350 °C, the black dot and band became wider and thicker. Experimental analyses using an electron probe micro-analyzer, electron backscatter diffraction, and transmission electron microscopy revealed the appearance of austenite in the black dot region at a peak temperature of 950 °C; its amount increased up to a peak temperature of 1050 °C and thereafter decreased as the peak temperature further increased. The amount of M23C6 decreased with an increase in peak temperature. Based on these results, we investigated the behaviors of austenite and M23C6 as functions of the peak temperature.

Graphical Abstract

1. Introduction

Ultra-supercritical (USC) power plants are being operated under increasing pressure and high-temperature conditions to reduce fuel costs, environmental pollutants, and greenhouse gas emissions. SA213-T22 (2.25Cr-1Mo steel), a conventional boiler tube material used in water-wall tubes in power plants, should be thickened for high-temperature and high-pressure applications [1,2]. However, if the tube becomes thicker than the ones commercially used, the construction costs will increase owing to the change in boiler design and the increase in the number of welding passes [3,4,5,6]. Furthermore, there is an increased risk of thermal stress and welding defects during the operation of the power plant.
Therefore, SA213-T23 (2.25Cr-1.6W steel), which has superior high-temperature creep properties compared to the existing material SA213-T22 (2.25Cr-1Mo steel), was developed. In order to enhance the high-temperature creep strength, T23 was developed by adding tungsten (1.6%) instead of reducing the molybdenum (0.2%) content compared to T22; additionally, vanadium, niobium, and boron were added [7,8,9,10,11].
However, in the case of T23, reheat cracking has been reported during post-weld heat treatment (PWHT) to mitigate the residual stress in the weld metal [12,13,14,15,16,17,18,19,20]. Low alloy Cr-Mo steel is known to have a high risk of reheat cracking [21,22,23], which is typically due to the intergranular cracks developing in the weld metal or heat-affected zone (HAZ) during PWHT or high-temperature service [18,19]. Reheat cracking is also known as stress-relaxation cracking because the cracks develop during the process of relieving the residual stresses [24]. The reheat cracking phenomenon in low-alloy Cr-Mo steels occurs when the plastic deformation when stress relaxation, rather than being strengthened transgranular, is concentrated along the weakened grain boundary [22,23,24]. The transgranular strengthening can be attributed to precipitation strengthening by fine and uniformly distributed precipitates [18,19,20]. The grain boundary is weakened due to the formations of a depleted zone [15,16,17] and coarse precipitates [18,19,20] and due to the segregation of tramp elements [22,23,24,25,26,27].
T23 is also reported to be susceptible to reheat cracking because the transgranular is strengthened and the grain boundary is weakened. The transgranular strengthening of T23 is attributed to the homogeneous transgranular precipitation of a fine metal carbide containing the alloying elements V and Nb [15,16,17]. The grain boundary weakening is attributed to the precipitation of an incoherent intergranular carbide M3C at the boundaries [8,9], the grain boundary segregation of the Al and P elements [15,16], and the Cr- and W-depleted zones formed by the M3C and M23C6 carbides of Fe, Cr, and W in the grain boundaries [16,17]. Therefore, it can be observed that the reheat crack of SA213-T23 is closely related to the nature of the precipitate.
Studies to identify the causes of the reheat cracks in T23 have been based only on an analysis of the microstructure of the coarse-grained HAZ (CGHAZ) after PWHT. However, it is necessary to analyze the microstructural features of CGHAZ before PWHT in order to understand the root cause of crack initiation in this material. In particular, it is necessary to characterize the types and distribution of the grain boundaries and intergranular precipitates that can cause reheat cracking, and analyze precipitate behavior and phase transformation of the matrix during the formation of the HAZ via the welding thermal cycle.
Therefore, in order to investigate the microstructure formation process of the HAZ in the welding process, simulated HAZ specimens were fabricated at intervals of 100 °C for peak temperatures between 950 and 1350 °C, and the microstructural features and precipitate behavior at various peak temperatures were observed. The microstructures were analyzed using various etching solutions such as nital, alkaline sodium picrate, and Murakami’s etchant and observed under an optical microscope in order to develop a method to easily identify the behavior of the precipitates and the change in grain size. Further verifications were performed using characterization methods such as transmission electron microscopy (TEM), electron probe micro-analyzer (EPMA), and electron backscatter diffraction (EBSD).

2. Materials and Methods

Table 1 presents the chemical composition of the SA213-T23 (2.25Cr-1.6W) material used in this study. Chemical composition was analyzed using an optical emission spectrometer (LAB LAVM 10, SPECTRO Analytical Instruments GmbH, Kleve, Germany).
In actual welding, it is difficult to evaluate the microstructure characteristics because the HAZ is a narrow region owing to various thermal cycles. Therefore, the simulated HAZ was fabricated by using Gleeble 3500 (Dynamic Systems Inc., New York, NY, USA) thermal cycle simulator and the microstructure was observed. The thermal cycle of the HAZ was determined using the Sysweld software 9.5 (ESI, Paris, France) for the simulation of welding analysis.
Figure 1 shows the thermal cycle curve of the HAZ according to the distance along the fusion line when gas tungsten arc welding is applied to the tube material with a thickness of 6 mm with the heat input of 16 kJ/cm. Using Gleeble 3500 thermal cycle simulator, the HAZ was simulated at intervals of 100 °C from the peak temperature of 950 °C (temperature above the AC3 point) to the peak temperature of 1350 °C (CGHAZ temperature) using the thermal cycle curve calculated using Sysweld software. The validation of the thermal profile has been verified with a thermocouple.
The microstructure of the simulated HAZ was observed by etching with nital etchant (2 mL HNO3, 50 mL methanol) and alkaline sodium picrate etchant (2 g picric acid, 25 g NaOH, 100 mL Boiled water). Murakami etchant (10 g K3Fe(CN)4, 10 g NaOH, 100 mL water) was used to observe the distribution of the precipitates. Prior γ etchant (54 g NaOH, 5.4 g picric acid, 2–3 drops glycerol, 200 mL boiled water + 2 mL HNO3, 50 mL methanol) was used to observe grain size.
The phase analysis of the simulated HAZ at various peak temperatures was performed using an electron probe micro-analyzer (EPMA) (JXA-8530F, JEOL, Tokyo, Japan) and electron backscatter diffraction (EBSD) (SUPRA40VP, Carl Zeiss, Oberkochen, Germany), and the equilibrium diagram was constructed using Thermo-Calc TCF.6 software to analyze the experimental results. For the precipitation analysis, precipitates were extracted via the carbon replica method, and image observation, energy-dispersive X-ray spectroscopy (EDS), and diffraction pattern analysis were performed using a field-emission transmission electron microscope (FE-TEM) (TALOS F200X, FEI, Hillsboro, OR, USA). Using the image analysis program Image-Pro Plus (Ver.4.5.0.29, MEDIA CYBERNETICS, Rockville, MD, USA), the precipitate size distribution at various peak temperatures was measured using Murakami-etched optical microscope photographs.

3. Results

3.1. Microstructure Evolution of the Base Metal

Figure 2 shows the microstructure of the base metal (2.25Cr-1.6W steel) using various etching methods. Figure 2a,d show the optical and scanning electron microscope (SEM) microstructures obtained using nital etching. Figure 2b,e show the optical and SEM microstructures obtained using alkaline sodium picrate etching. Figure 2c shows the optical microstructure obtained using Murakami etchant. In order to compare the differences between nital and alkaline sodium picrate etching, the microstructure was observed after nital etching, and it was subsequently finely polished. Afterward, alkaline sodium picrate etching was performed to observe the same position as that observed in nital etching, and the differences in the microstructures owing to etching were compared. The nital-etched microstructure in Figure 2a,d shows grain boundaries appearing as prior austenite grain boundaries, and precipitates in the prior austenite grain boundaries and fine precipitates in transgranular are observed. In the alkaline-sodium-picrate-etched microstructure in Figure 2b,e, the grain boundaries appear as austenite grain boundaries as in the case of nital etching. The precipitates are visible in the prior austenite grain boundaries, but the precipitates in transgranular are not visible. However, the matrix is observed to be monochromatic in nital etching in Figure 2a, whereas the matrix is observed to be in two colors—ivory and brown—in alkaline sodium picrate etching in Figure 2b. In alkaline sodium picrate, the average hardness of the ivory color phase was 207.4 Hv0.01 and the average hardness of the brown color phase was 191.7 Hv0.01. The base material of the 2.25Cr-1.6W steel (SA213-T23) is generally known to consist of tempered martensite, bainite, and M23C6 carbide in the grain boundary [28,29,30]. Therefore, the ivory color phase of relatively high hardness is considered tempered martensite, and the brown color phase of relatively low hardness is considered bainite. In the case of nital etching, the optical microstructure in Figure 2a exhibits a monochromatic color, whereas the SEM microstructure in Figure 2d exhibits a height difference between the two colored parts in Figure 2b. This is because tempered martensite has a higher hardness than bainite, so bainite is reduced more during polishing. Thus, it is considered that the bainite part was reduced more than the tempered martensite part in nital etching. Murakami etching illustrated in Figure 2e is an etching technique for carbide etching, and it is possible to observe the distribution of precipitates in the optical microscope before SEM observation. Thus, the appearance of the precipitates in the grain boundaries and the transgranular can be observed.
Figure 3 shows the result of composition analysis using EPMA for the phase analysis of the base metal. The precipitates where the alloying elements of C, W, and Cr are concentrated in a point shape according to the prior austenite grain boundary can be observed.
The results of TEM analysis of the precipitates using carbon replica method are shown in Figure 4 to analyze the precipitate in the transgranular and grain boundary. In the TEM photographs, Figure 4a,b, a coarse precipitate of rectangular or rhombic shape is observed at the prior austenite grain boundary, and fine precipitates are observed in the transgranular. From the pattern analysis, it can be concluded that the coarse precipitate of Y1 is the M23C6 carbide of [011] FCC, and the circular fine precipitate within the grain of Y2 is the MC carbide of [001] FCC. From the EPMA results in Figure 3, the M of M23C6 carbide is the Fe, Cr, and W alloy elements. As MC is approximately 50 nm or less, it is considered that V, W, and Nb were not detected in the EPMA analysis.

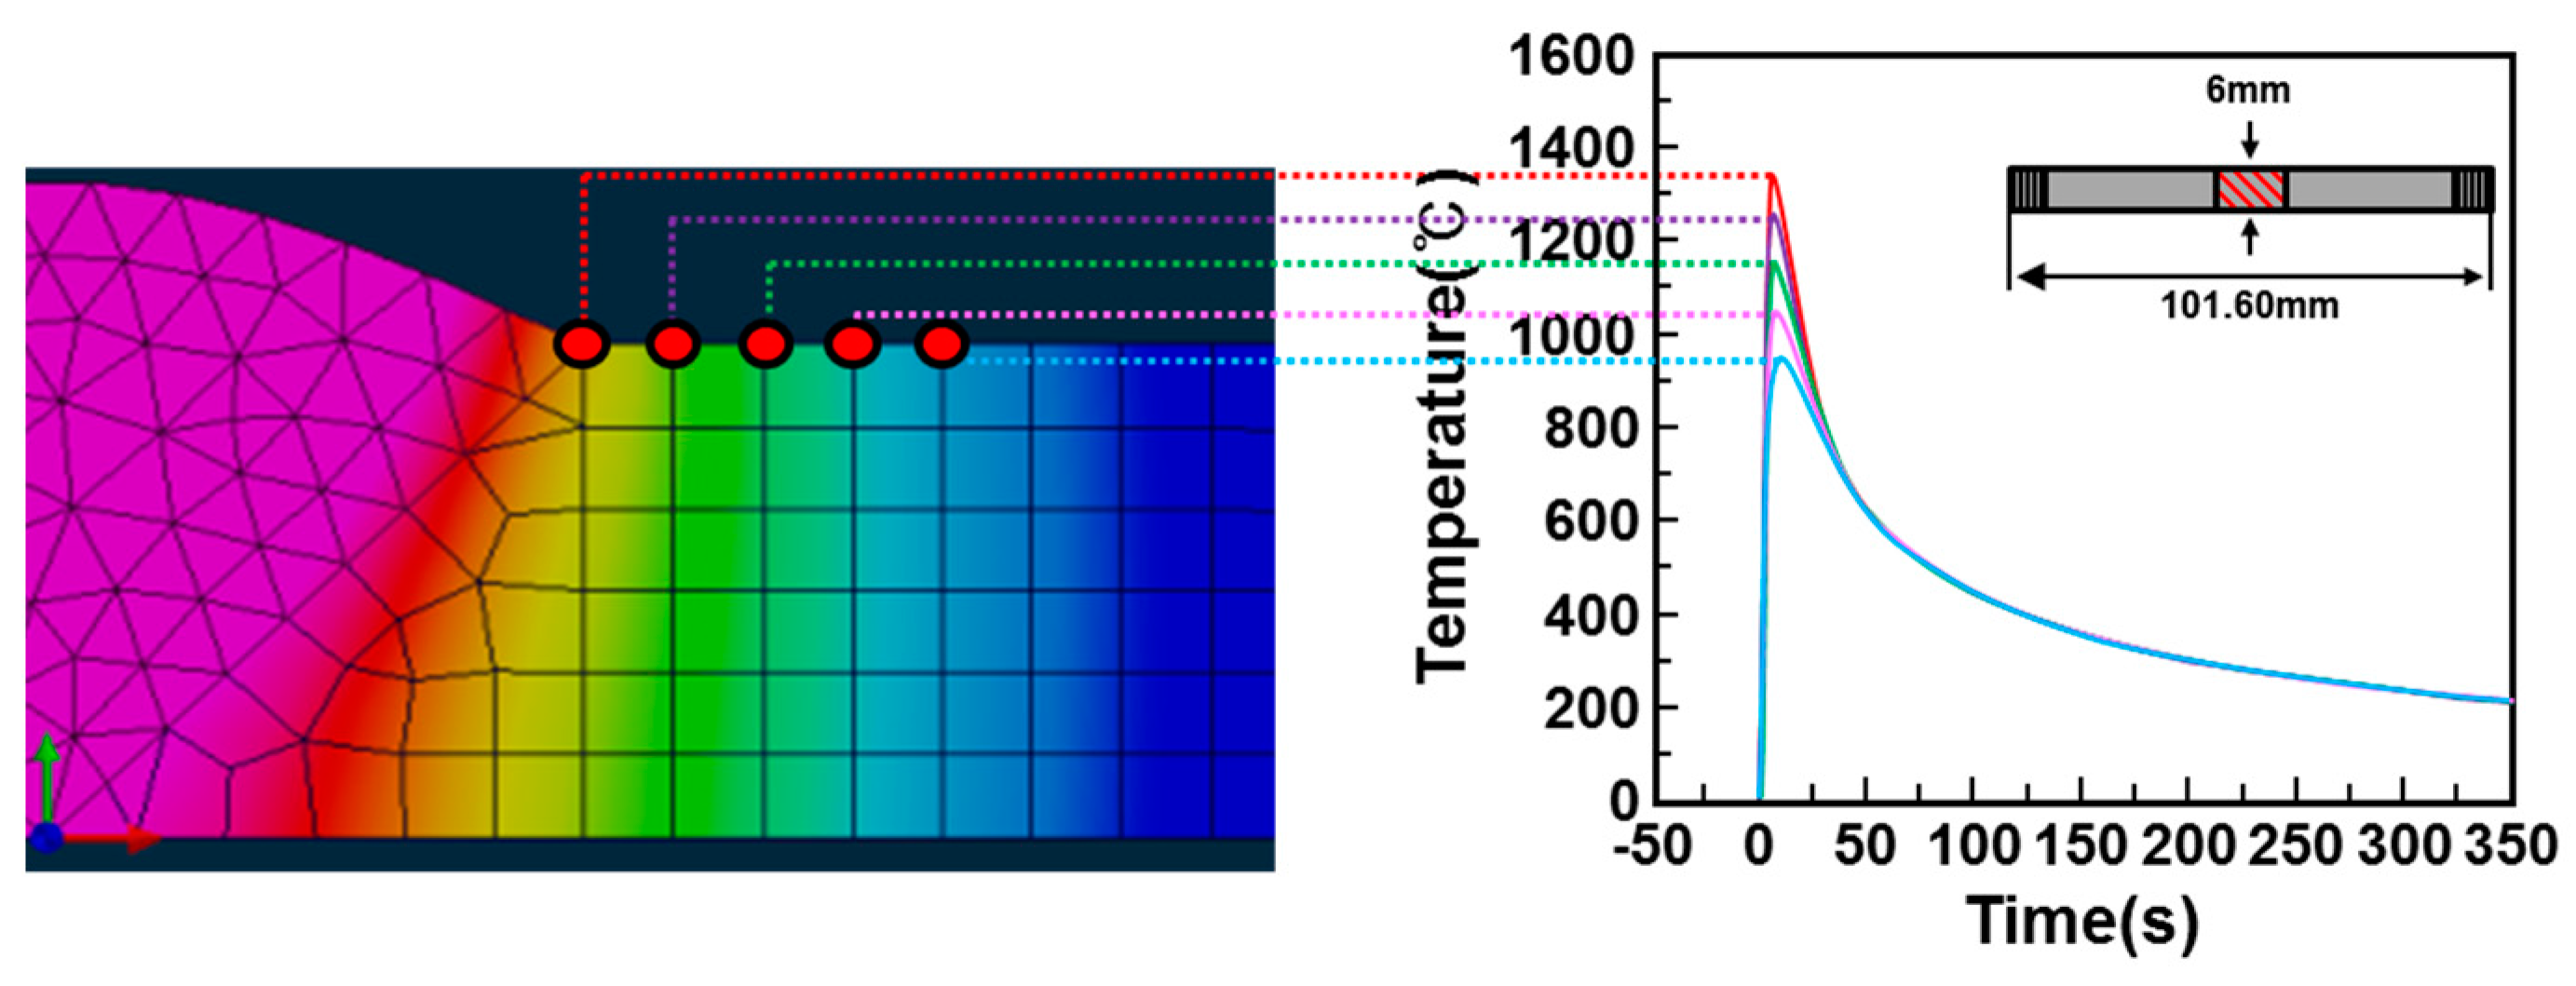
3.2. Microstructure Evolution of the Simulated HAZ at Various Peak Temperatures

Figure 5 shows the optical microstructure of the HAZ at various peak temperatures (950–1350 °C) using nital, alkaline sodium picrate, Murakami, and prior γ etching. Similar to Figure 2, the observation positions of the microstructure with nital and alkaline etching were observed again. First, a change in microstructure was observed with nital etching as the peak temperature increased. It can be observed that, as the peak temperature increased from 950 to 1350 °C, the former austenite grain size (marked with an arrow) gradually increased. Grain size increase was clearly observed in the prior-γ-etched microstructure. Further, as the peak temperature increased from 1150 to 1350 °C, a lath shape in the matrix was observed. The microstructure in the case of alkaline sodium picrate etching shows that, as the temperature increased from 950 to 1350 °C, the prior austenite grain size gradually increased, similar to nital etching. Notably, a black dot or band (marked with an arrow) other than the prior austenite grain boundary was observed. As the temperature increased from 950 to 1350 °C, it became thicker and changed from a black dotted line to a black band. This phenomenon was observed only in alkaline sodium picrate etching, but not nital etching. With Murakami etching, it was observed that, as the peak temperature increased, the point-shaped precipitates in the prior austenite grain boundary decreased. Precipitates were observed up to 1150 °C, but hardly observed at temperatures above 1250 °C. Figure 2 shows that the grain boundary precipitates appearing in Murakami etching were M23C6. The reason for the disappearance of the M23C6 carbide with the increase in temperature from 950 to 1350 °C appears to be related to the dissolution of precipitates.
Figure 6 shows the SEM photograph of nital etching and alkaline sodium picrate etching at various peak temperatures (950–1350 °C). The observed position was the same as in Figure 5, and the black band that appeared in alkaline sodium picrate etching was mainly examined. The SEM photographs (marked with an arrow) of nital etching at the peak temperature of 950 °C exhibited white spherical precipitates. Precipitates were not observed in the prior austenite grain boundary, and the precipitates were present in a lined form in the transgranular. The precipitate size increased at the peak temperature of 1050 °C, but precipitates gradually dimmed at the peak temperature of 1150 °C and disappeared above the peak temperature of 1250 °C. The SEM photographs (marked with an arrow) of alkaline sodium picrate etching at the peak temperature of 950 °C exhibited white spherical precipitates and holes around the precipitates. At the peak temperature of 1050 °C, the hole size became larger and the precipitate size at the center of the hole became smaller. At the peak temperature of 1150 °C, the precipitate disappeared and only a hole was observed. Further, at the peak temperature of 1250 °C, a black band region did not appear in the SEM photograph as in the case of nital etching. In alkaline sodium picrate etching at 1350 °C, a black band was apparent in the optical microstructure, shown in Figure 5, but black bands are not easily observed in the SEM microstructure in Figure 6. These results indicate that the precipitate was dissolved and the black band appeared in the region where the precipitate was present. The black band was observed only in alkaline sodium picrate etching, but not in nital and Murakami etching.
Figure 7 shows the result of EPMA composition mapping to observe the changes of the phase composition at various peak temperatures. The black dot (band) was the region where C, W, and Cr elements were concentrated. As the peak temperature increased, the C, W, and Cr elements gradually diffused. It can be observed that the alloy composition was similar to M23C6, which is the intergranular precipitate of the base material (Figure 3). This is because the M23C6 precipitates composed of C, W, and Cr elements dissolved in the matrix as the peak temperature increased, but the C, W, and Cr elements did not dissolve completely in the matrix owing to insufficient dissolution time of the welding heat cycle conditions. W and Cr are considered to be partially dissolved.
In order to analyze the phase identification of the partially dissolved black dot or band, EBSD analysis was conducted at each peak temperature, and the results are shown in Figure 8. Alkaline etching was performed on the EBSD specimens to observe the same position as that corresponding to the EBSD results.
In the EBSD phase map at the peak temperature of 950 °C, a black dot region existed as M23C6 and gamma or as iron. M23C6 and gamma existed alone or together. In the EBSD phase map, iron (gamma) is an austenite, and iron (alpha) of the matrix could be ferrite (BCC), bainite (BCC), or martensite (BCT), but it is considered to be bainite or martensite based on the CCT diagram of T23 and hardness (270 Hv). Therefore, based on the SEM photographs (the alkaline-sodium-picrate-etched microstructure) at the peak temperature of 950 °C (Figure 6), the precipitate was M23C6, and the hole around the M23C6 or the lone hole was austenite or martensite. Similarly, at the peak temperature of 1050 °C, M23C6 and iron (gamma) were present alone or together in the black dot region, or iron (alpha) existed. However, compared to the peak temperature of 950 °C, the amount of M23C6 decreased and that of iron (gamma) increased. At the peak temperature of 1150 °C, the amount of M23C6 and austenite decreased in the black dot region. At the peak temperatures of 1250 and 1350 °C, the black band region was almost iron (alpha) without M23C6 and gamma. The black dots had different directions in the inverse pole figure. It can be observed that a microstructure of lath shape appeared beyond the peak temperature of 1150 °C.
In the EBSD analysis, austenite appeared at the peak temperature of 950 °C, and the amount increased at the peak temperature of 1050 °C and thereafter decreased as the peak temperature increased. M23C6 decreased with the increase in peak temperature. At the peak temperatures of 950, 1050, and 1150 °C, M23C6 and iron (gamma) were present alone or together in the black dot region, or iron (alpha) existed. However, at the peak temperatures of 1250 and 1350 °C, the black band was almost iron (alpha) without either of them.
Figure 9 shows the result of TEM analysis of a thin film at the peak temperatures of 1050 °C in order to analyze the microstructure of the phase identification of austenite and M23C6 in EBSD. Rectangular precipitates can be observed in the BF image of Figure 9a, and an elliptical phase can be observed around the rectangular precipitate. This is similar to the shape of the precipitate and the hole around the precipitate in the SEM photograph (alkaline-sodium-picrate-etched microstructure) at the peak temperature of 950 °C of Figure 6. In order to analyze the phase of the rectangular precipitate and elliptical phase, the diffraction pattern of the X1 region was analyzed. In the diffraction pattern analysis, the precipitate was M23C6 and the phase around the precipitate was austenite. The diffraction pattern analysis of the X2 region in the matrix exhibited the BCC structure. As the lath shape was not observed, the matrix was regarded as plate-like bainite. In the EDS line analysis of the Y1 region in Figure 9d, Cr, C, and W were concentrated in M23C6 as shown in the EPMA analysis, and these elements gradually decreased from M23C6 to austenite and the matrix. It is believed that the M23C6 alloying elements such as C, W, and Cr were diffused as M23C6 dissolved in the matrix.

4. Discussion

4.1. Correlation between Peak Temperature and Grain Size

Figure 5 shows that the precipitation gradually decreased and the prior austenite grain size increased with the increase in peak temperature (950–1350 °C). In the results of Figure 2, Figure 3, Figure 4, Figure 5, Figure 6, Figure 7 and Figure 8, the M23C6 precipitates of base metal were observed to dissolve with the increase in peak temperature. In order to investigate the dissolution of M23C6 as the peak temperature increased, the equilibrium diagram of the phase volume fraction was calculated using Thermo-Calc TCF.6 software (Thermo-Calc Software, Stockholm, Sweden). Figure 10 shows the result of Thermo-Calc TCF.6 calculation for T23 steel using an Fe-based alloy database. The phases shown in Figure 10a are austenite and ferrite phases, and the precipitates are M6C, M23C6, MC (V-W rich), and MC (Nb rich) phases. T23 (2.25Cr-1.6W) is a steel with excellent hardenability. It transforms into bainite (BCC) or martensite (BCT) without transformation into ferrite (BCC) when cooling in the austenite region [8]. The M6C precipitate is a high-temperature stable phase and is not formed during tempering at the time of fabrication. It is known that M23C6 phase transforms into the M6C phase during the long-term operation (400–600 °C) of a power plant [31].
Therefore, an equilibrium diagram without the M6C phase was constructed, and the result is shown in Figure 10b. In Figure 10b, it can be observed that M23C6 was a stable region at a temperature lower than 800 °C. The behavior of M23C6 in the thermal cycle at the peak temperature of 950 °C was predicted, and when heated above 800 °C, the M23C6 phase transformed into an austenite matrix. It can also be deduced that, when cooled from 950 to 800 °C, it was dissolved in the austenite matrix. The reason for the presence of carbide at the peak temperature of 950 °C is that the coarse carbides (particle size: 0.91 µm) among the precipitates present in the base metal were partially dissolved because they did not have sufficient time for full dissolution at the peak temperature of 950 °C.
As the peak temperature increased from 950 to 1350 °C, the M23C6 dissolution accelerated because the holding time was longer than that above 800 °C and the diffusion of carbon increased with temperature. Therefore, precipitation decreased as the peak temperature increased from 950 to 1350 °C.
According to Zener’s theory of the relationship between precipitate and grain growth, the grain boundary migration is suppressed when the precipitate is coarse particle, high volume fraction, and uniform distribution [32,33,34]. In order to investigate the correlation among size, fraction, and distribution of the precipitates and grain size, the precipitate size was measured quantitatively with the increase in peak temperature using a Murakami etching photograph. Figure 11 shows the distribution of precipitate size according to the increase in peak temperature (950–1350 °C). In the size distribution of carbide particles shown in Figure 11, as the peak temperature increased, the amount of precipitate decreased and the particle size became finer. Therefore, the grain size increased with the increase in peak temperature because the driving force of the grain boundary migration was increased as the peak temperature increased, and the pinning effect was reduced owing to the dissolution of the precipitates, which interfered with the grain boundary migration.

4.2. Correlation between Carbide Dissolution and Austenite Formation

In order to investigate the reason for the appearance of the black dot or band region as austenite (FCC) at the peak temperature of 1050 °C but as a matrix (BCC) at the peak temperature of 1350 °C, the following analysis was performed.
Figure 12 shows the result of EPMA line analysis by enlarging the black dot or band regions at the peak temperatures of 1050 and 1350 °C. In the preceding analysis, the alloying elements of the black dot at 1050 °C identified as austenite were as follows: C: 0.6–1.0%; W: 3–4%; Cr: 7–12%. Further, the alloying elements of the black band at 1350 °C identified as BCC were as follows: C: 0.2–0.3%; W: 2–3%; Cr: 2–3%. It can be observed that the black dot region at the peak temperature of 1050 °C had a higher alloying element of C, W, and Cr than the black band region at the peak temperature of 1350 °C. This is because, as illustrated in Figure 10, the dissolution of M23C6 was further accelerated and the diffusion of the alloying elements was higher at 1050 °C than at 1350 °C.
The stabilization region of the phase depending on the alloy composition is shown in Figure 13 in the Schaeffler diagram modified according to H. Schneider [35]. In the Schaeffler diagram modified according to H. Schneider, the alloy component (C: 0.6–1.0%; W: 3–4%; Cr: 7–12%) of the black dot at the peak temperature of 1050 °C was either the austenite or the austenite + martensite region. Moreover, the alloy component (C: 0.12–0.29%; Cr: 2.3–3.2%; W: 1.8–2.9%) of the black band at the peak temperature of 1350 °C was the martensite region.
Therefore, austenite appeared in the black dot region at the peak temperature of 1050 °C because the concentration of C, W, and Cr was high owing to the low diffusion of the M23C6 alloying element. However, the black band region at the peak temperature of 1350 °C had a lower concentration of C, W, and Cr than the black dot region at the peak temperature of 1050 °C owing to the high diffusion of the M23C6 alloying element in the former as compared to the latter. Consequently, the black band at the peak temperature of 1350 °C had a greater concentration of C, W, and Cr compared to the matrix, but C, W, and Cr were not sufficiently concentrated for austenite to appear.
The reason for the decrease of M23C6 and the formation of austenite and its subsequent decrease with the increase in the peak temperature is shown in Figure 14 with a schematic diagram. The alloying elements of M23C6 were C, W, and Cr, and the dissolution of M23C6 increased as the peak temperature increased. In the equilibrium diagram, M23C6 should be completely dissolved at over 800 °C, but it was almost dissolved in the peak temperature range of 1250–1350 °C by the thermal cycle of rapid heating and quenching. Subsequently, the C, W, and Cr alloying elements of M23C6 did not completely diffuse to the matrix and created concentrated regions. As the peak temperature increased, the diffusion of C, W, and Cr increased and the concentration of C, W, and Cr decreased. Therefore, when the concentrations of C, W, and Cr were high, austenite was stable. However, as the peak temperature increased, the alloying component region where the austenite was stable moved to the alloy component region where the martensite was stable.

5. Conclusions

The microstructural features and precipitate behaviors of CGHAZ (before PWHT) in SA213-T23 (2.25Cr-1.6W) material were analyzed. The findings are summarized as follows:
(1)
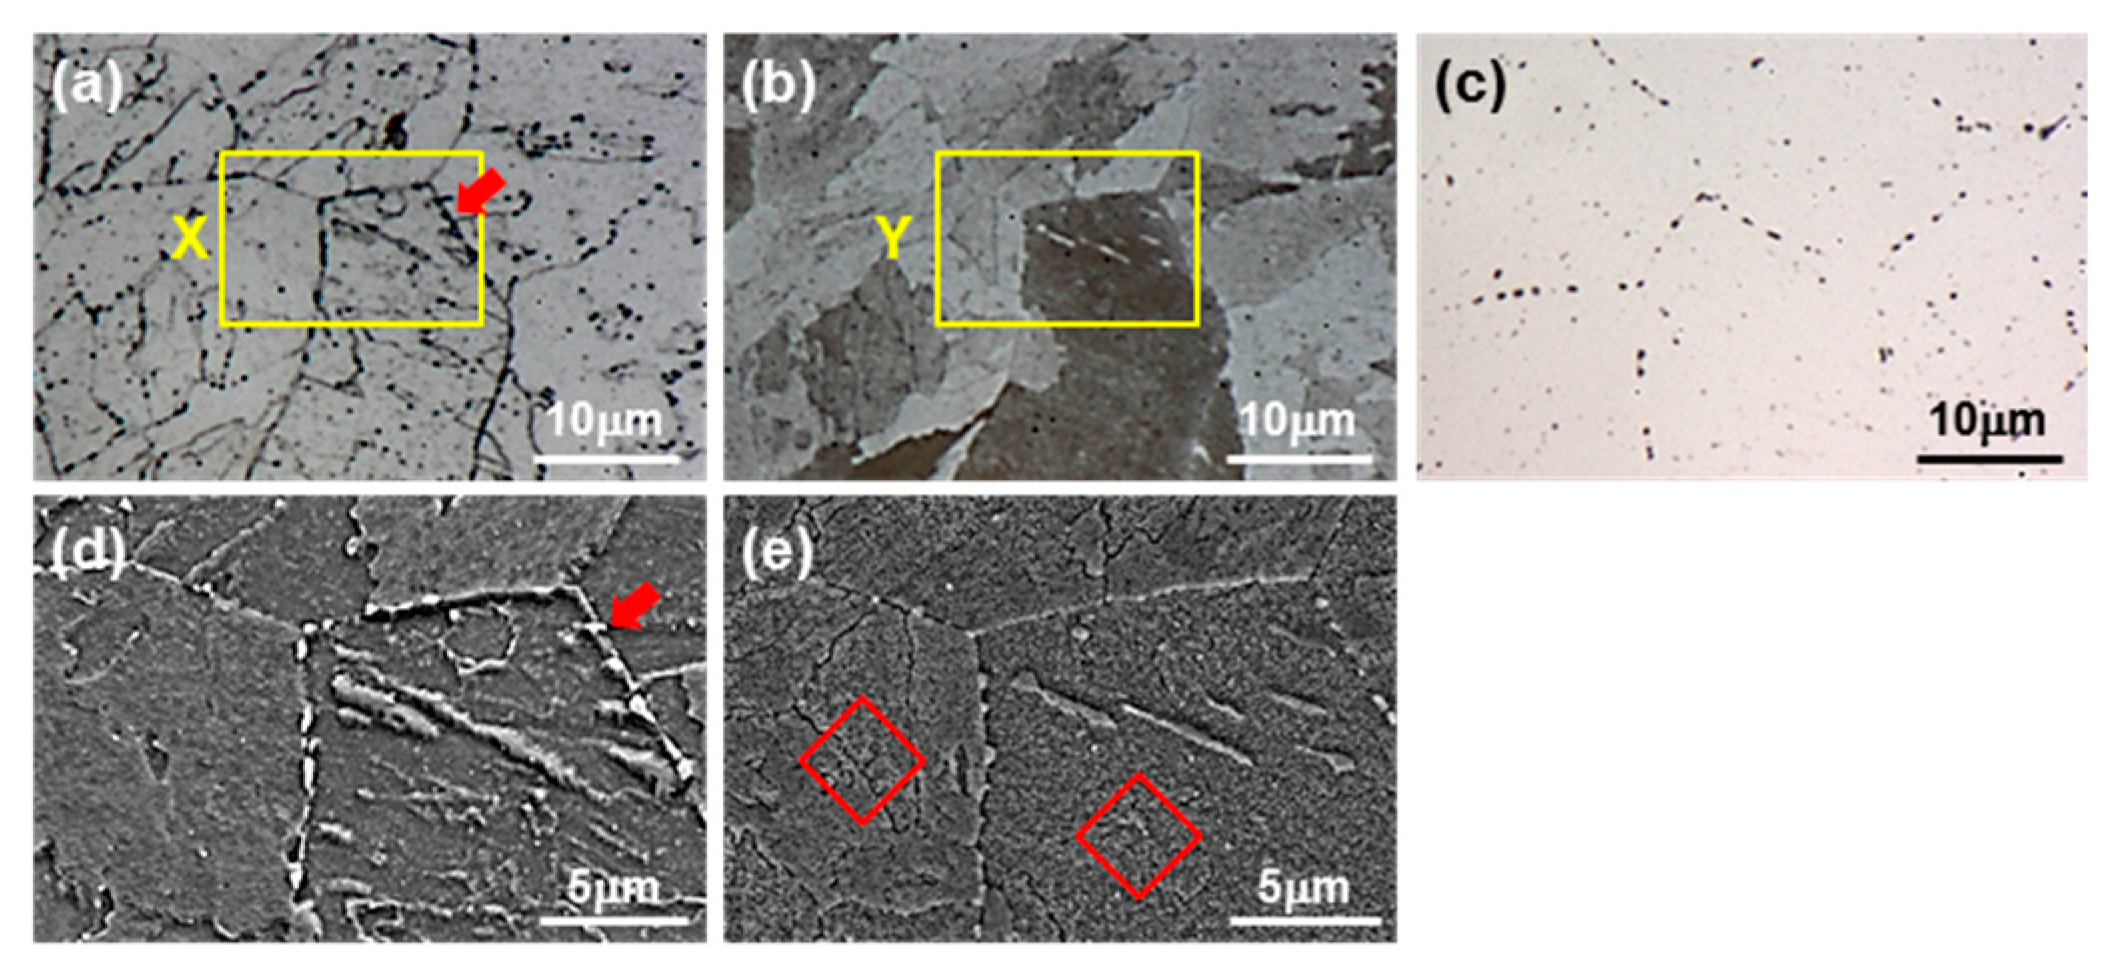
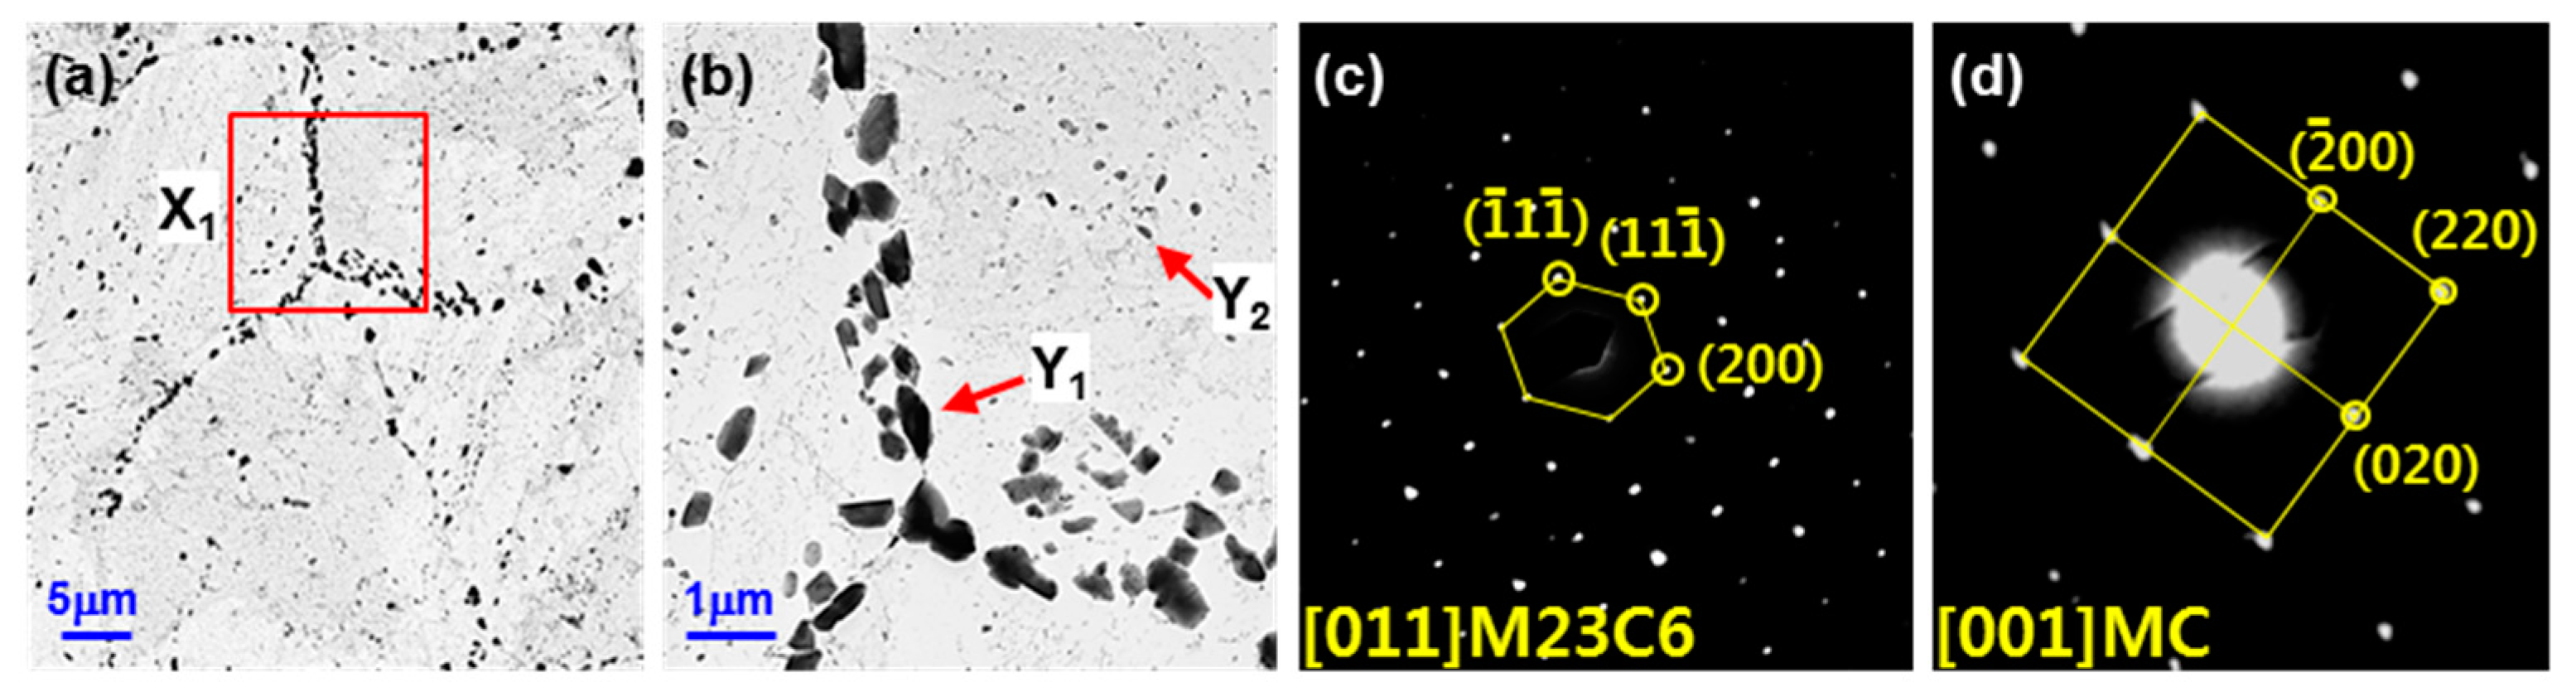
When the base metal of T23 was etched with alkaline sodium picrate, the ivory color obtained could be identified as tempered martensite and the brown color obtained was identified as bainite. In the case of Murakami etching, carbide was observed, and the grain boundary precipitate was M23C6 and the transgranular precipitate was MC.
(2)
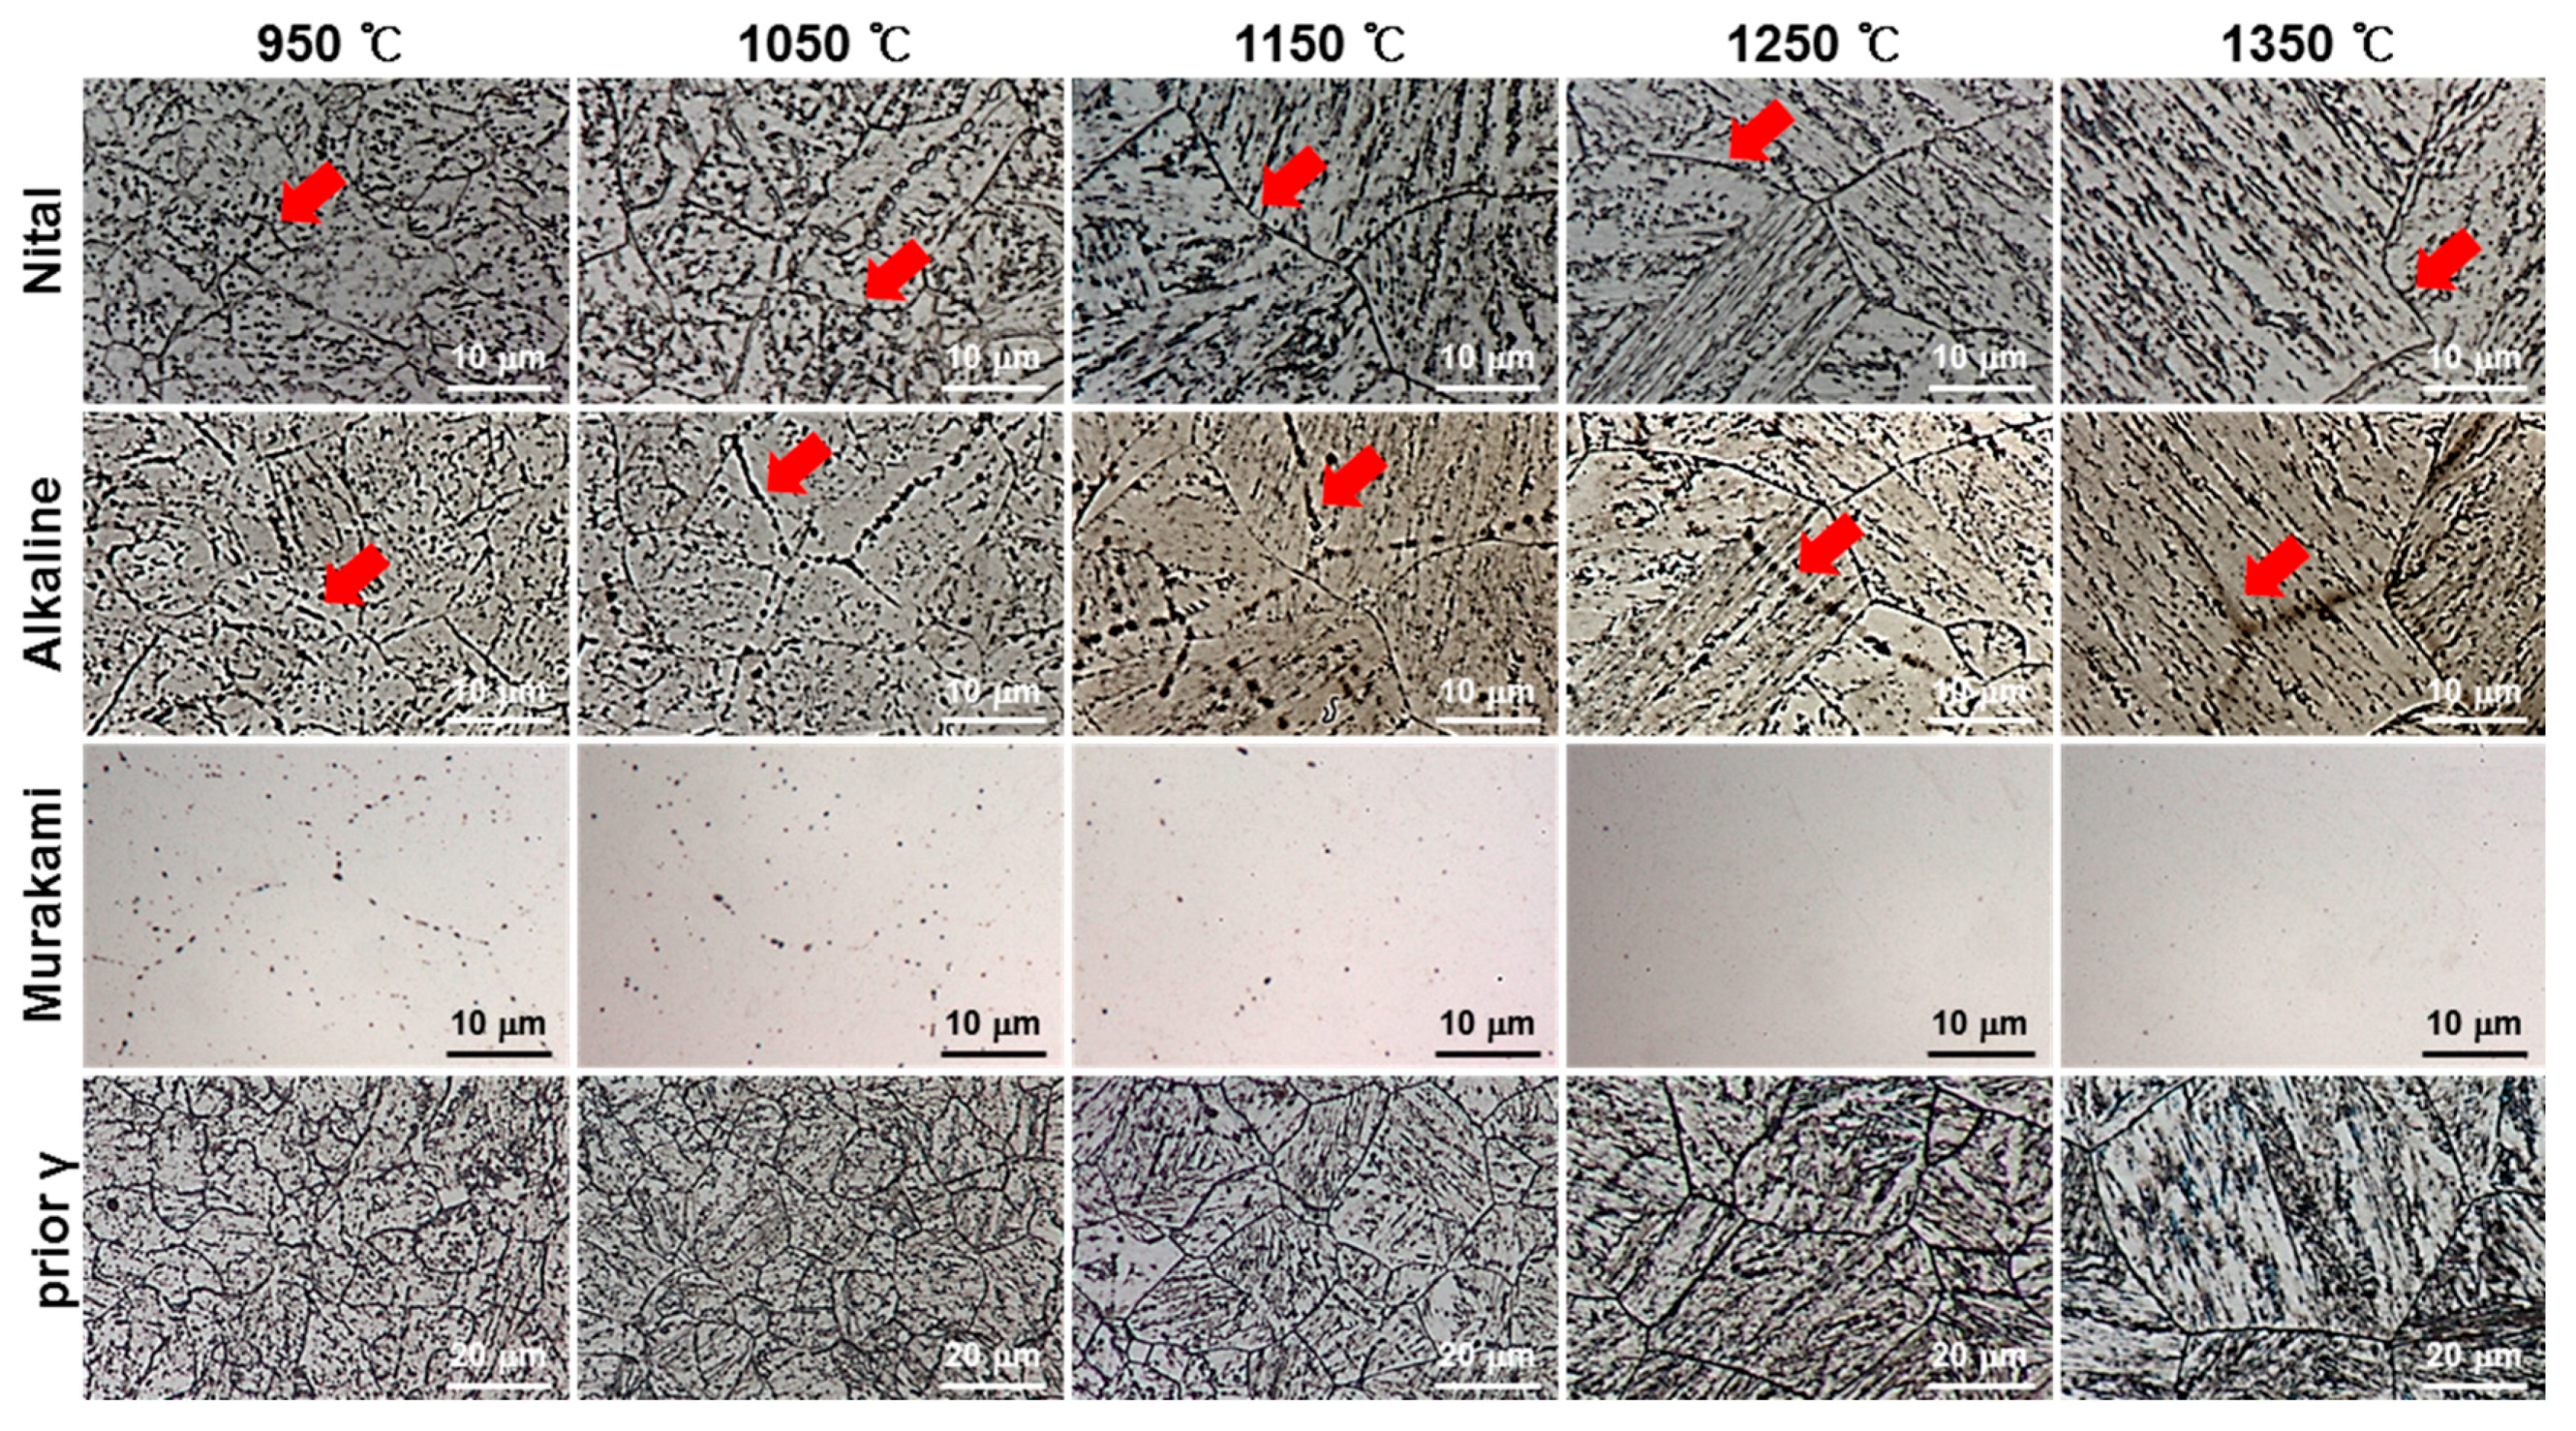
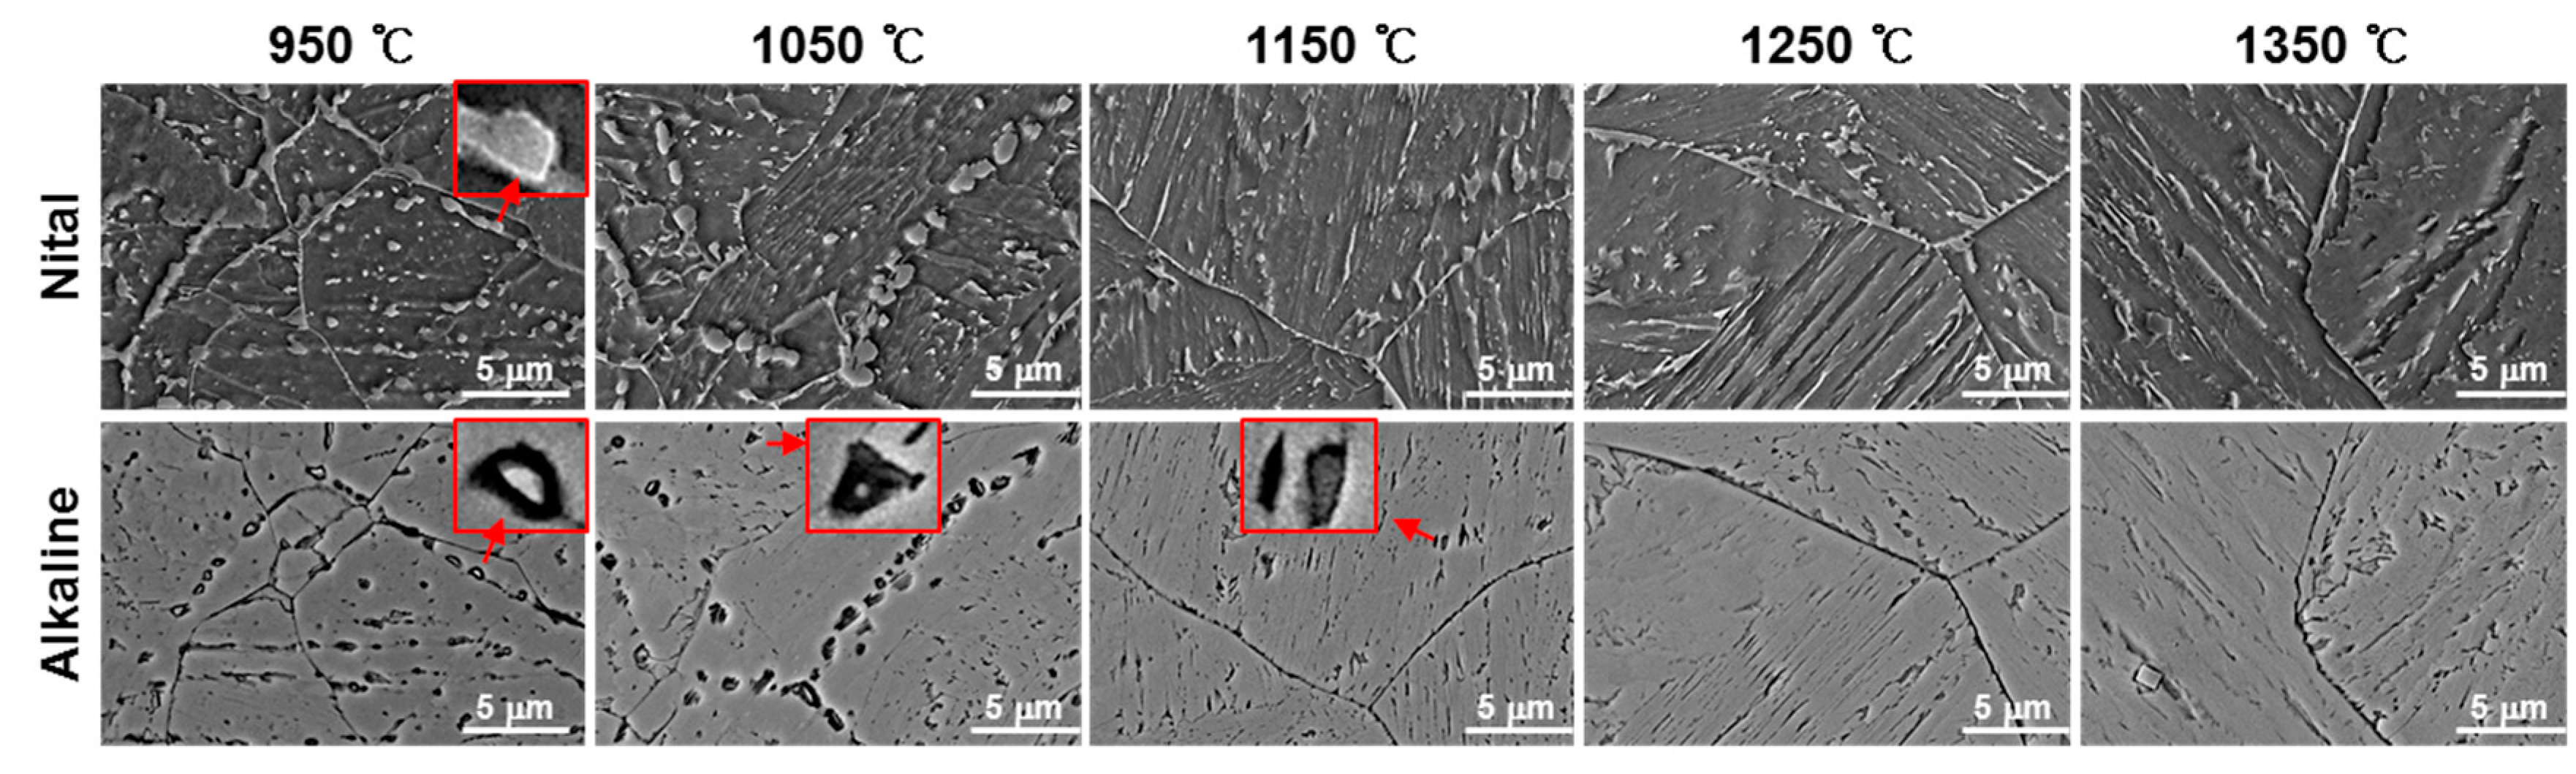
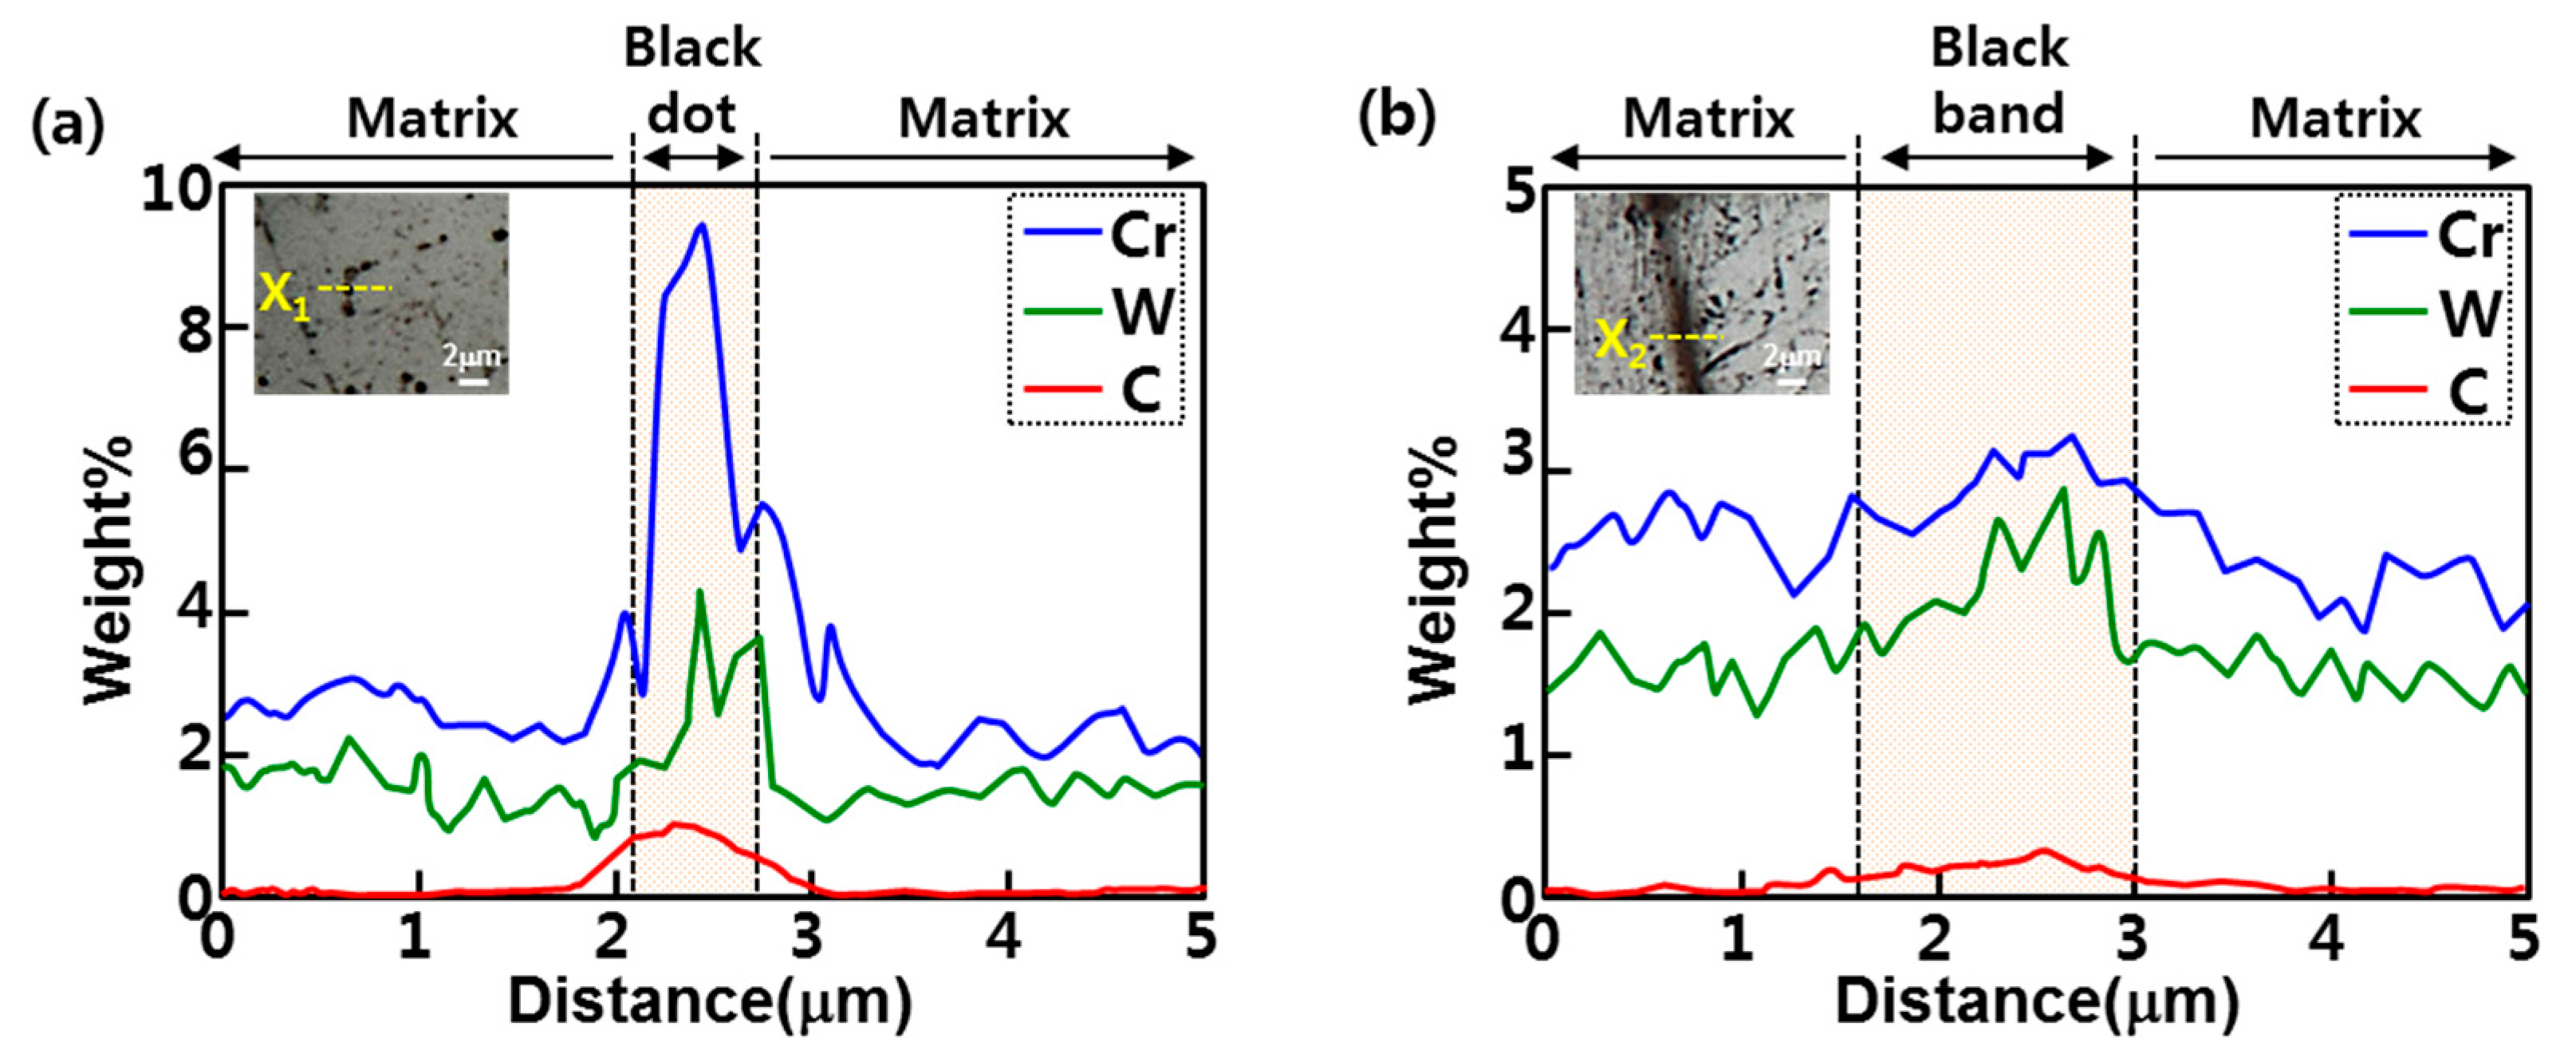
In order to investigate the microstructure formation process of CGHAZ, the microstructure of the simulated HAZ at various peak temperatures (950–1350 °C) was observed by etching separately with alkaline sodium picrate and nital. Alkaline-sodium-picrate-etched microstructures exhibited a black dot or band, which was not observed in the nital-etched microstructure. The black dot or band had a transgranular distribution, regardless of the nature of the prior austenite grain boundary. As the temperature increased from 950 to 1350 °C, the black dot became wider and thicker and turned into black bands.
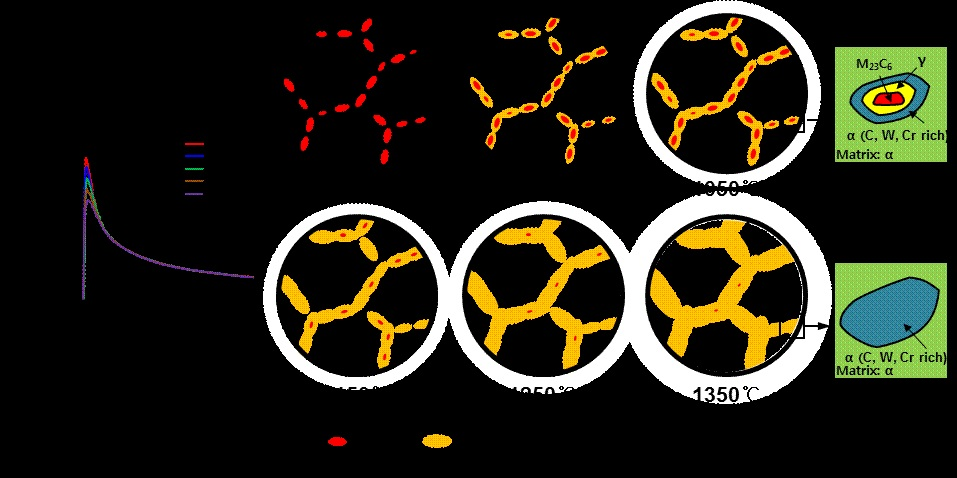
(3)
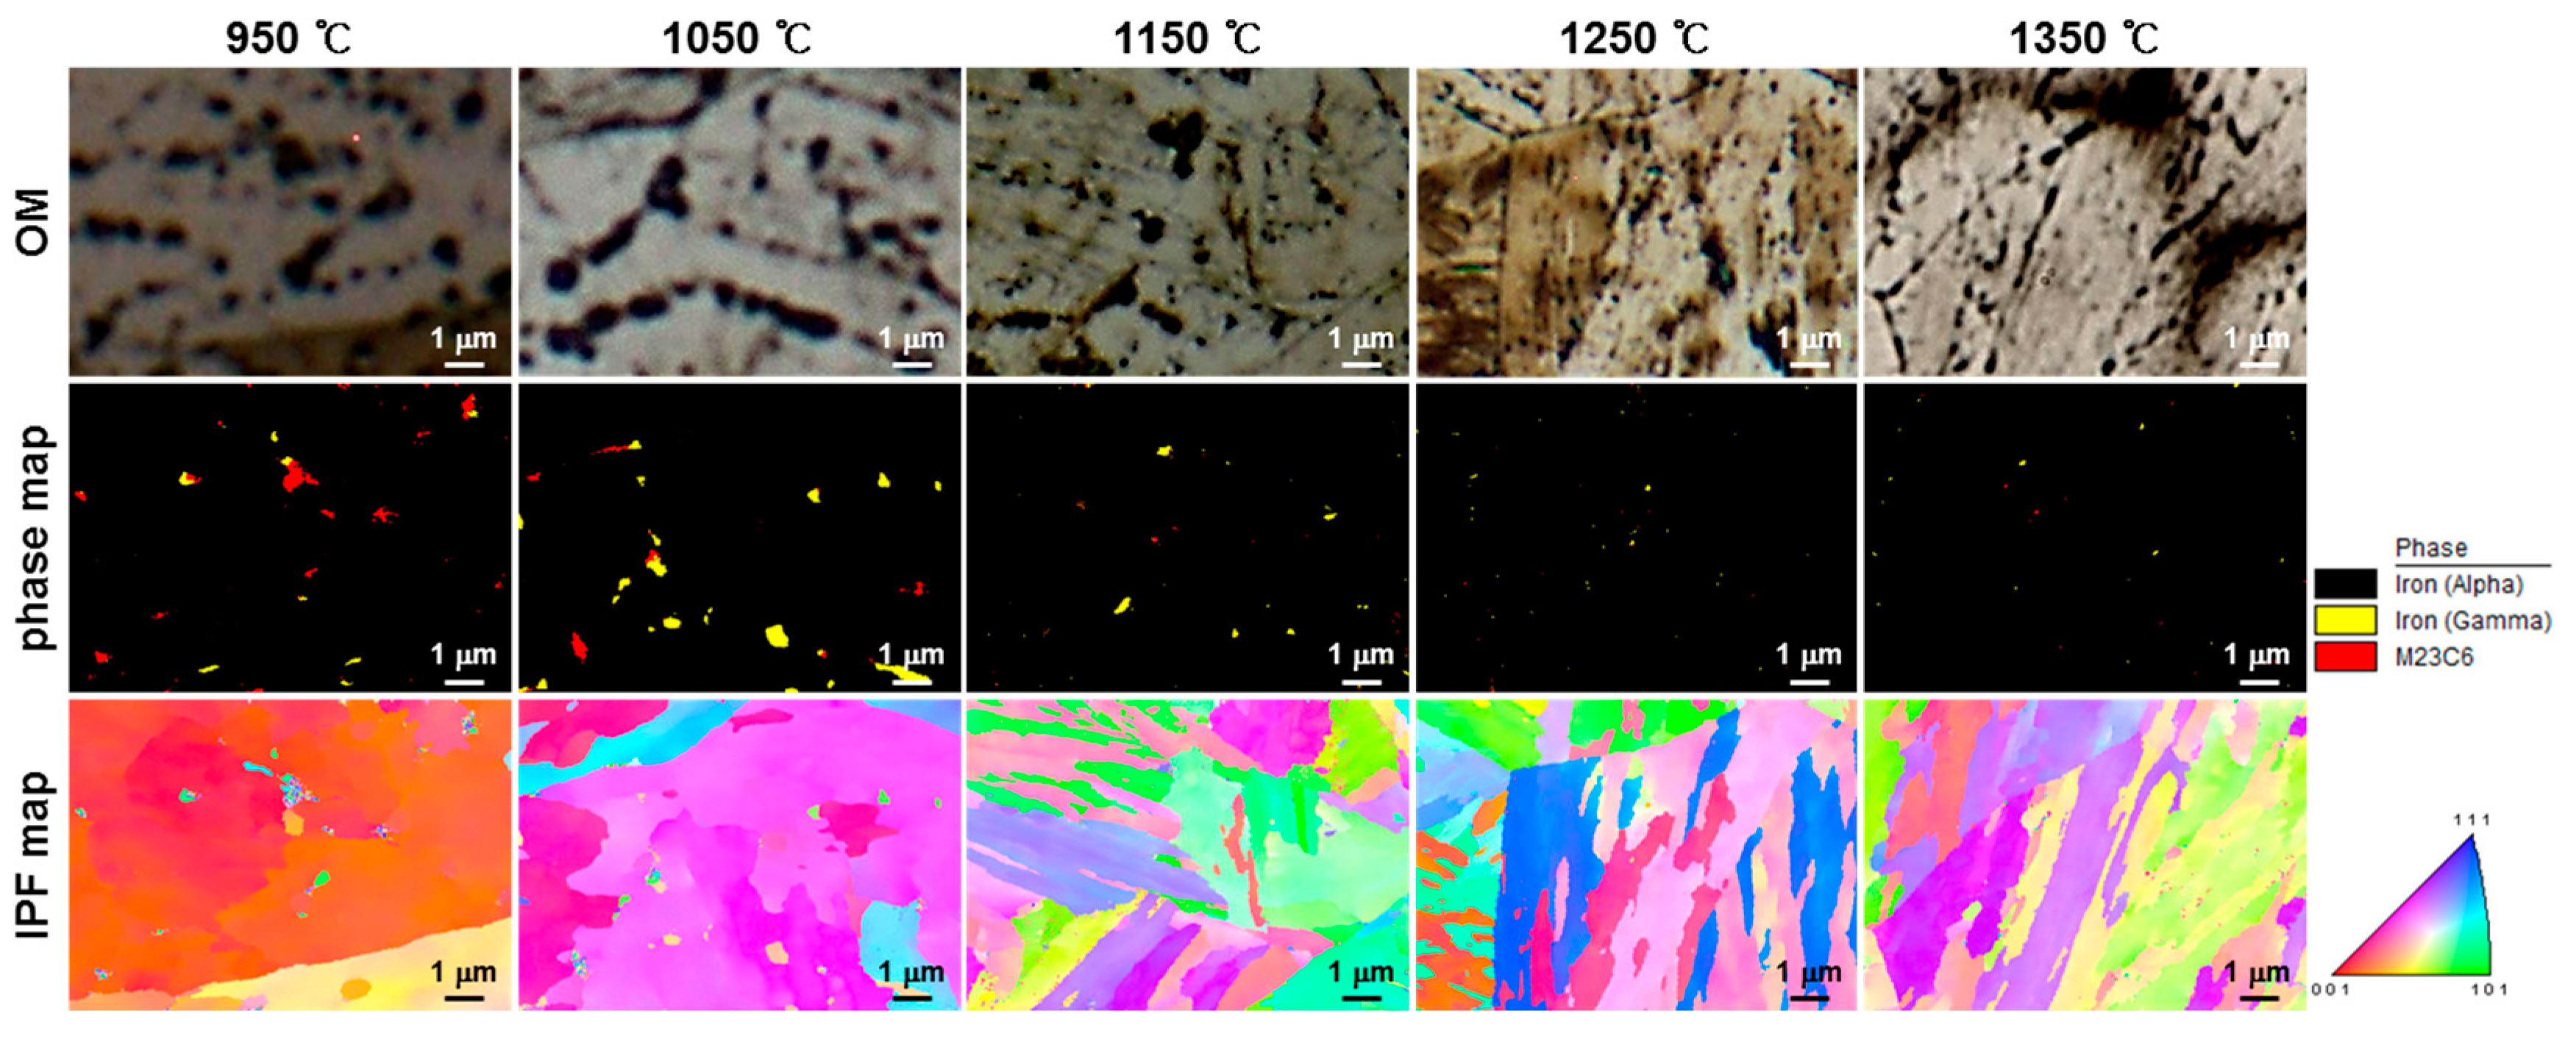
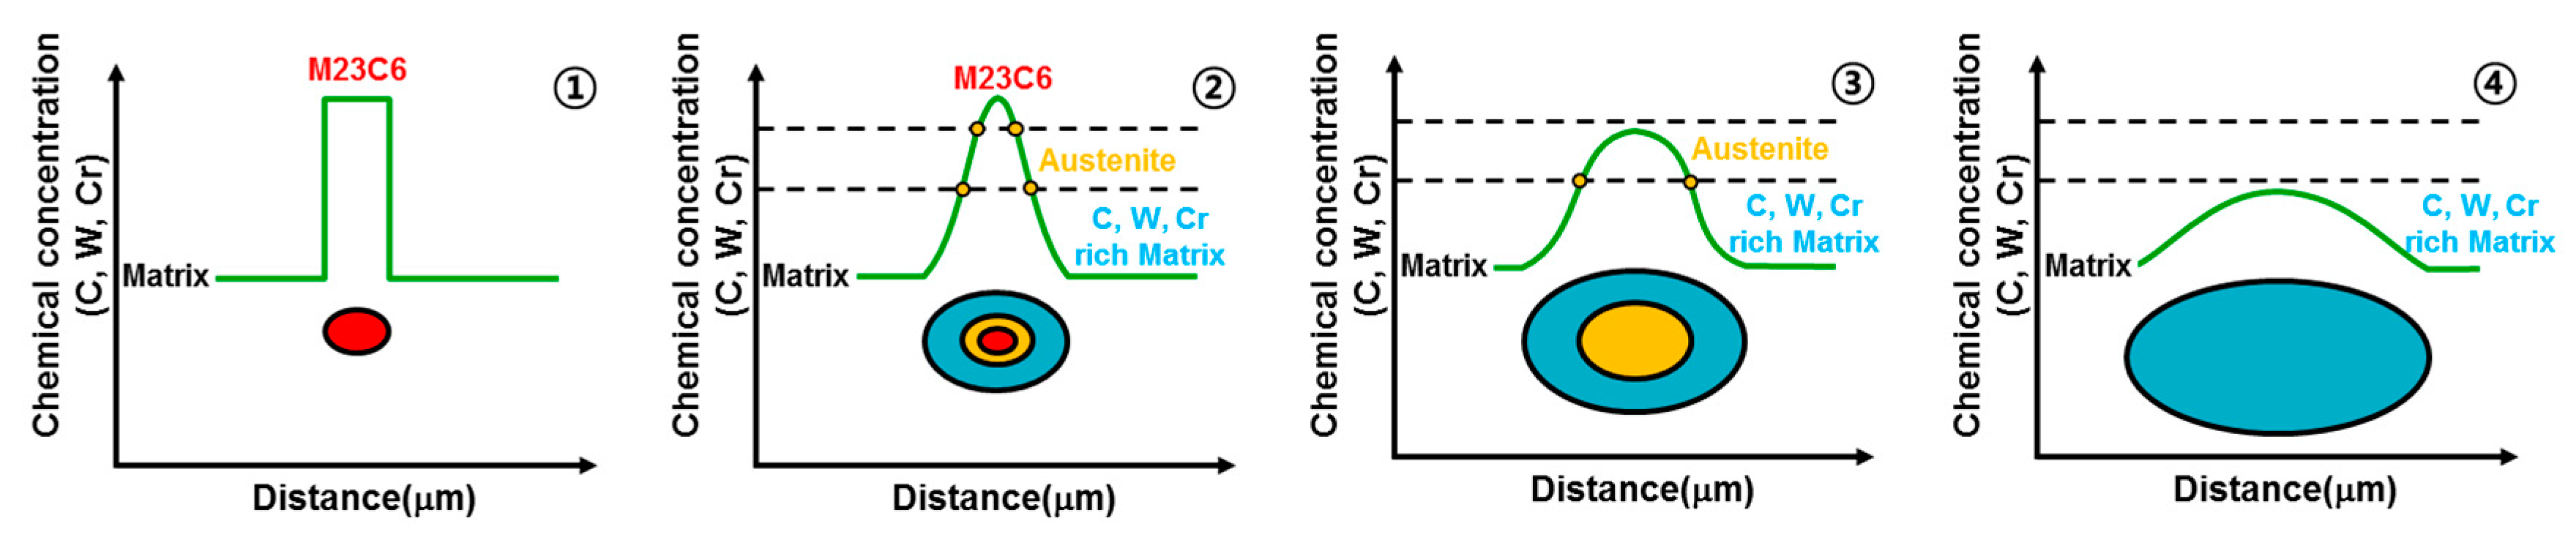
Rectangular M23C6 precipitate was present at the center of the black dot with the size of a few micrometers at the peak temperatures of 950 and 1050 °C, and austenite was present around the precipitates. As the peak temperature increased (1150–1350 °C), the M23C6 and austenite decreased, and the martensite phase, which is the same as the matrix, increased in the black band region.
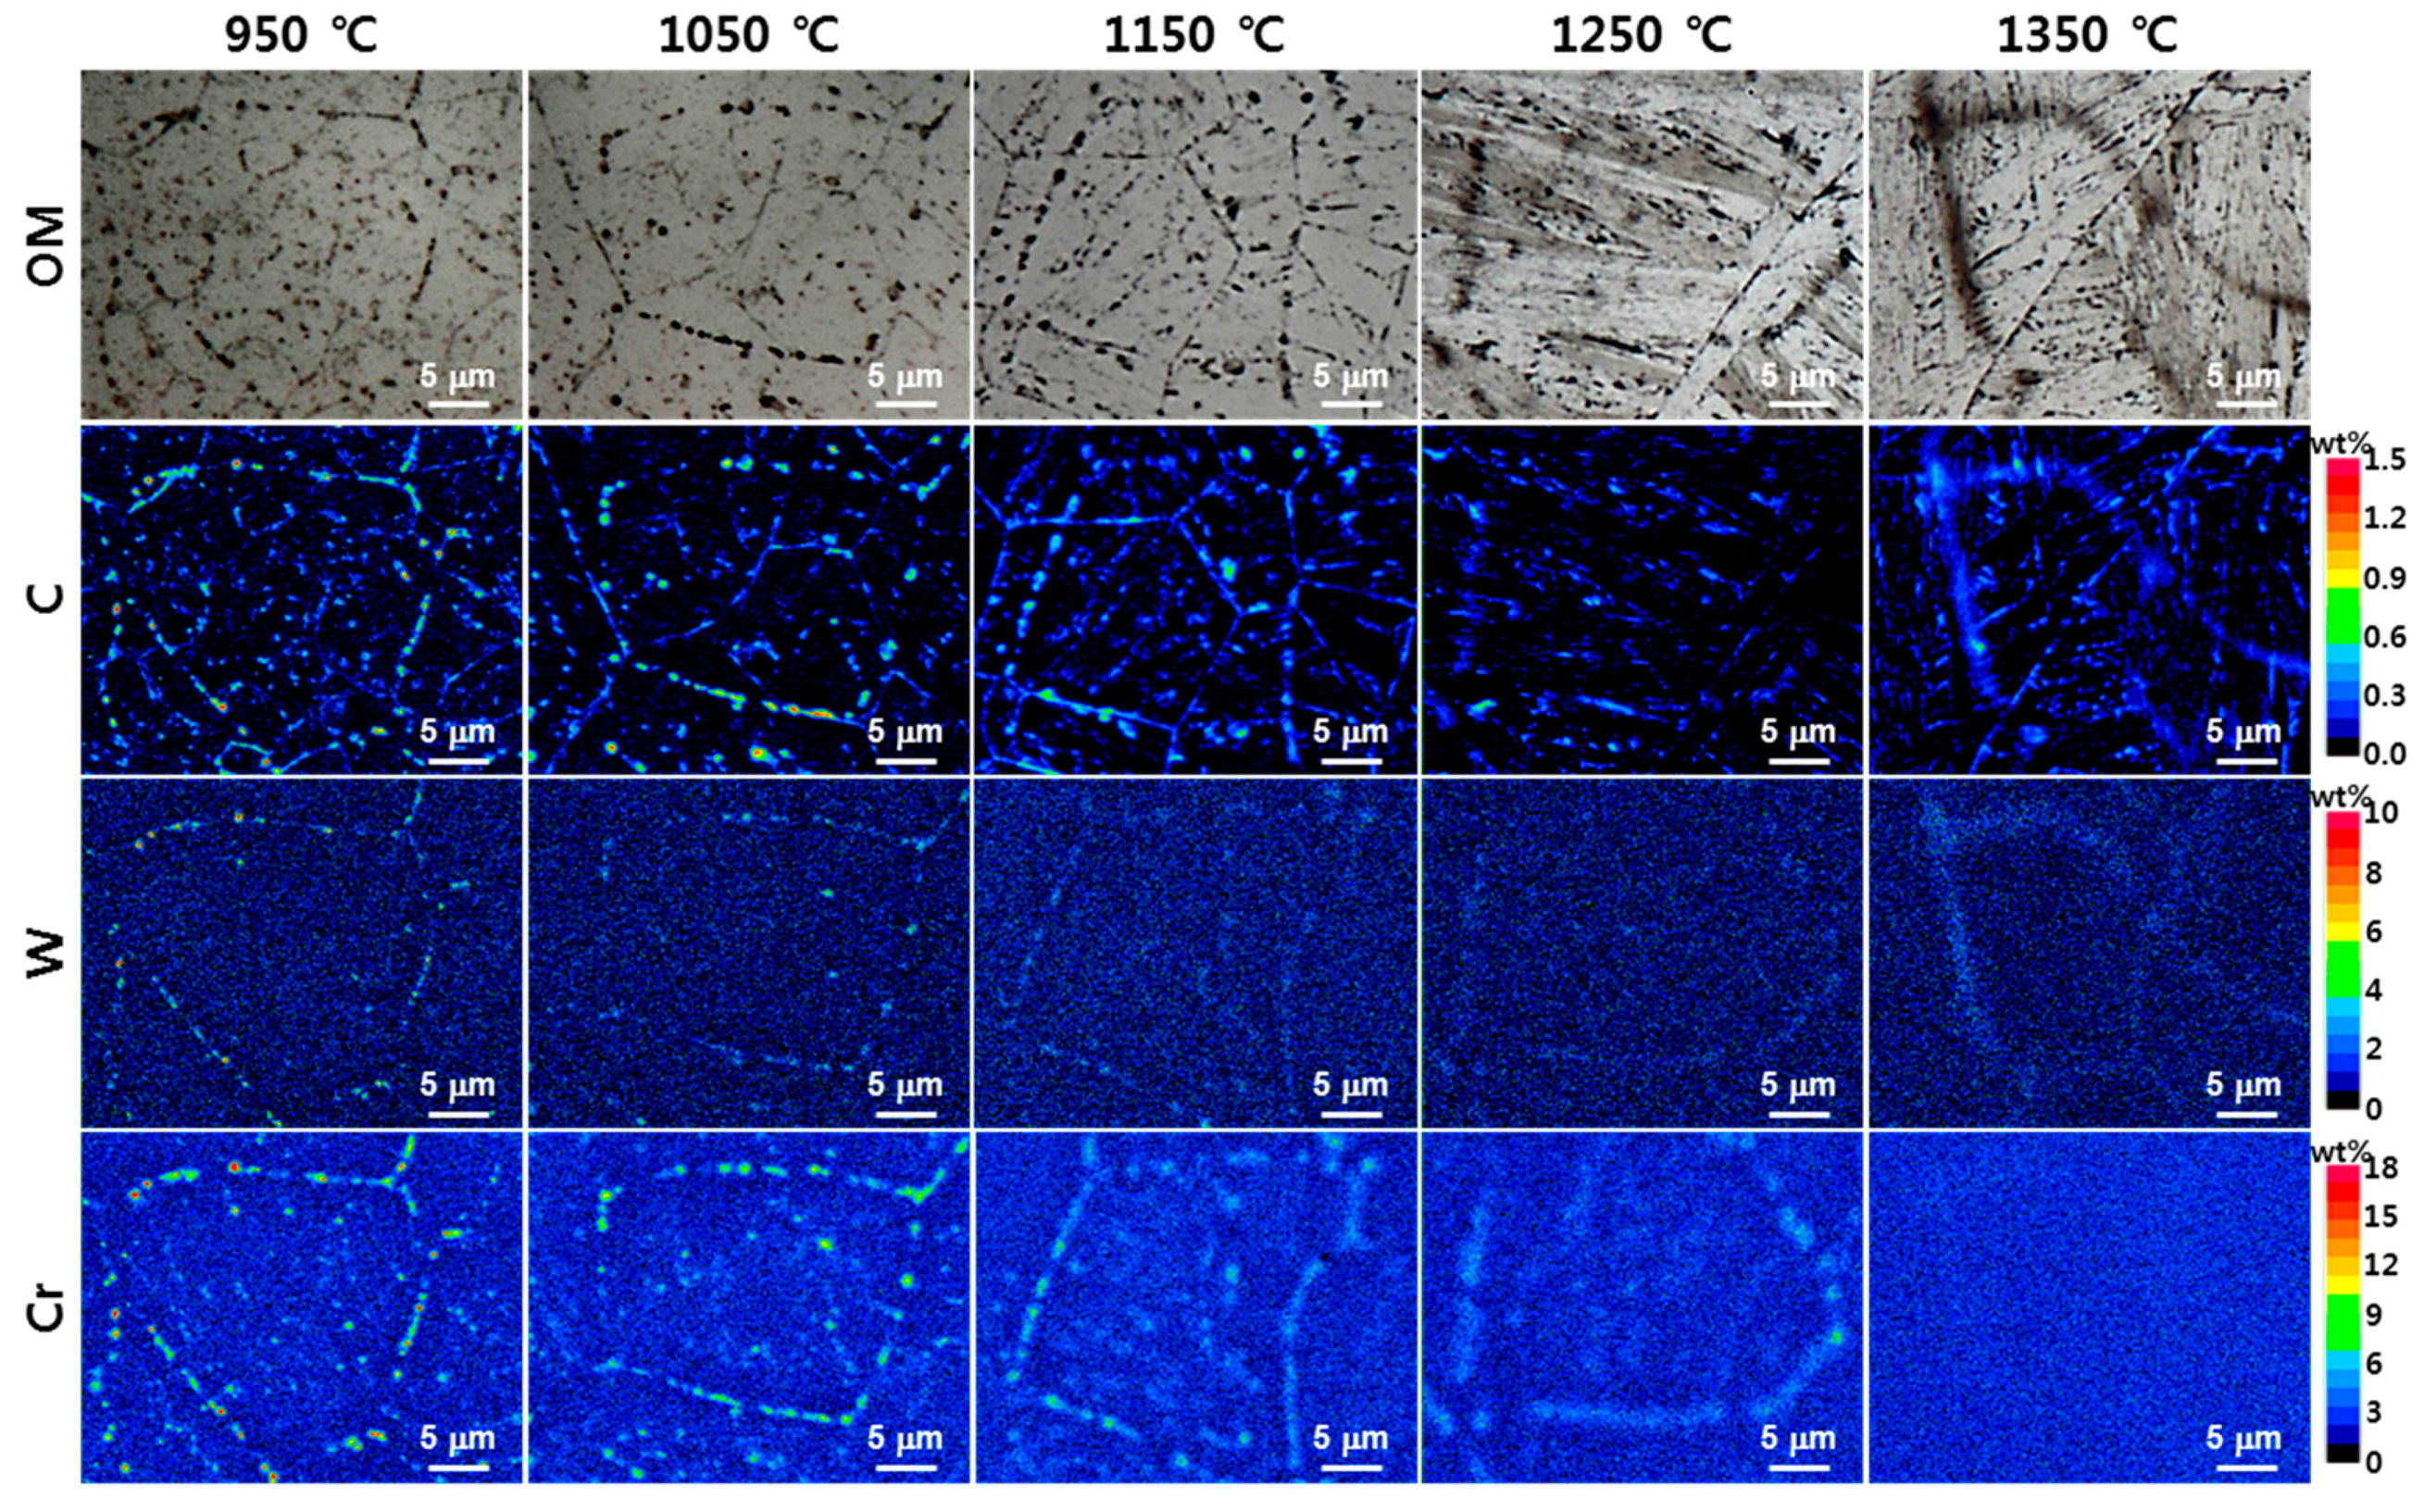
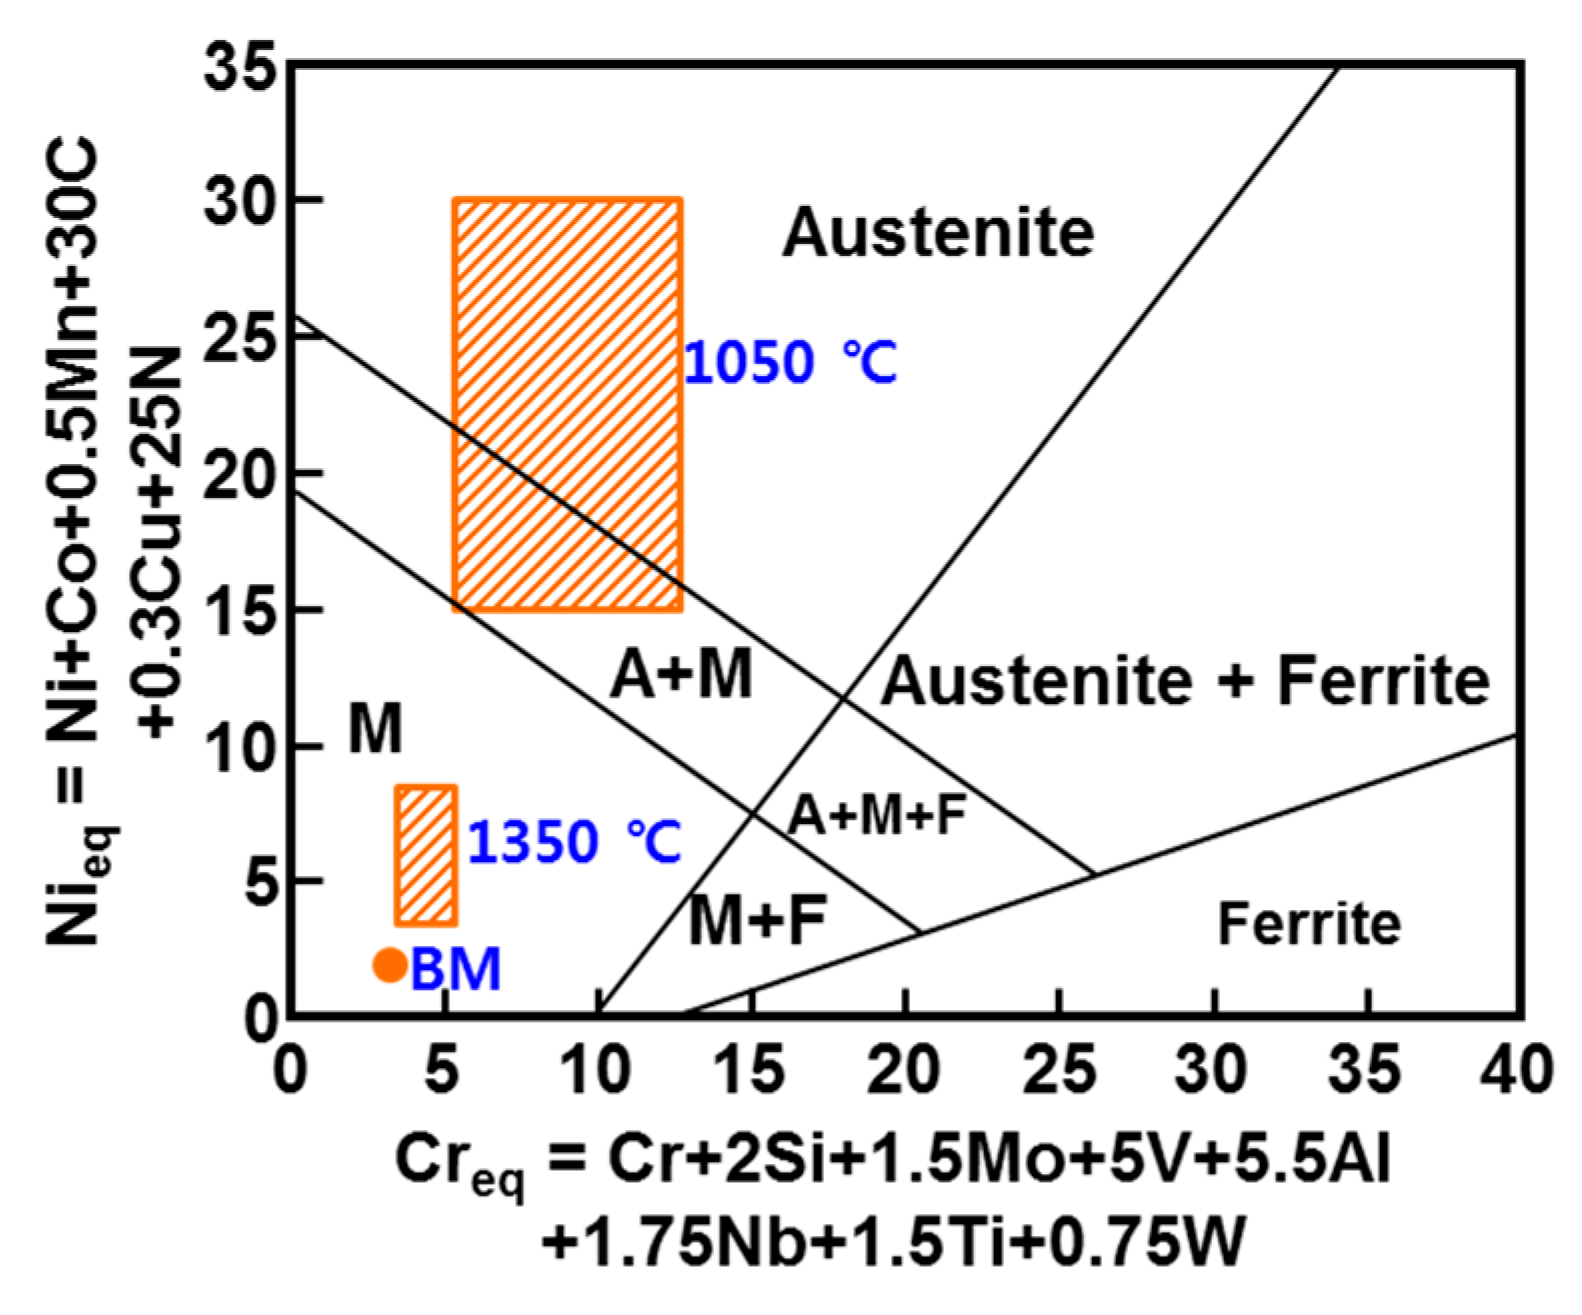
(4)
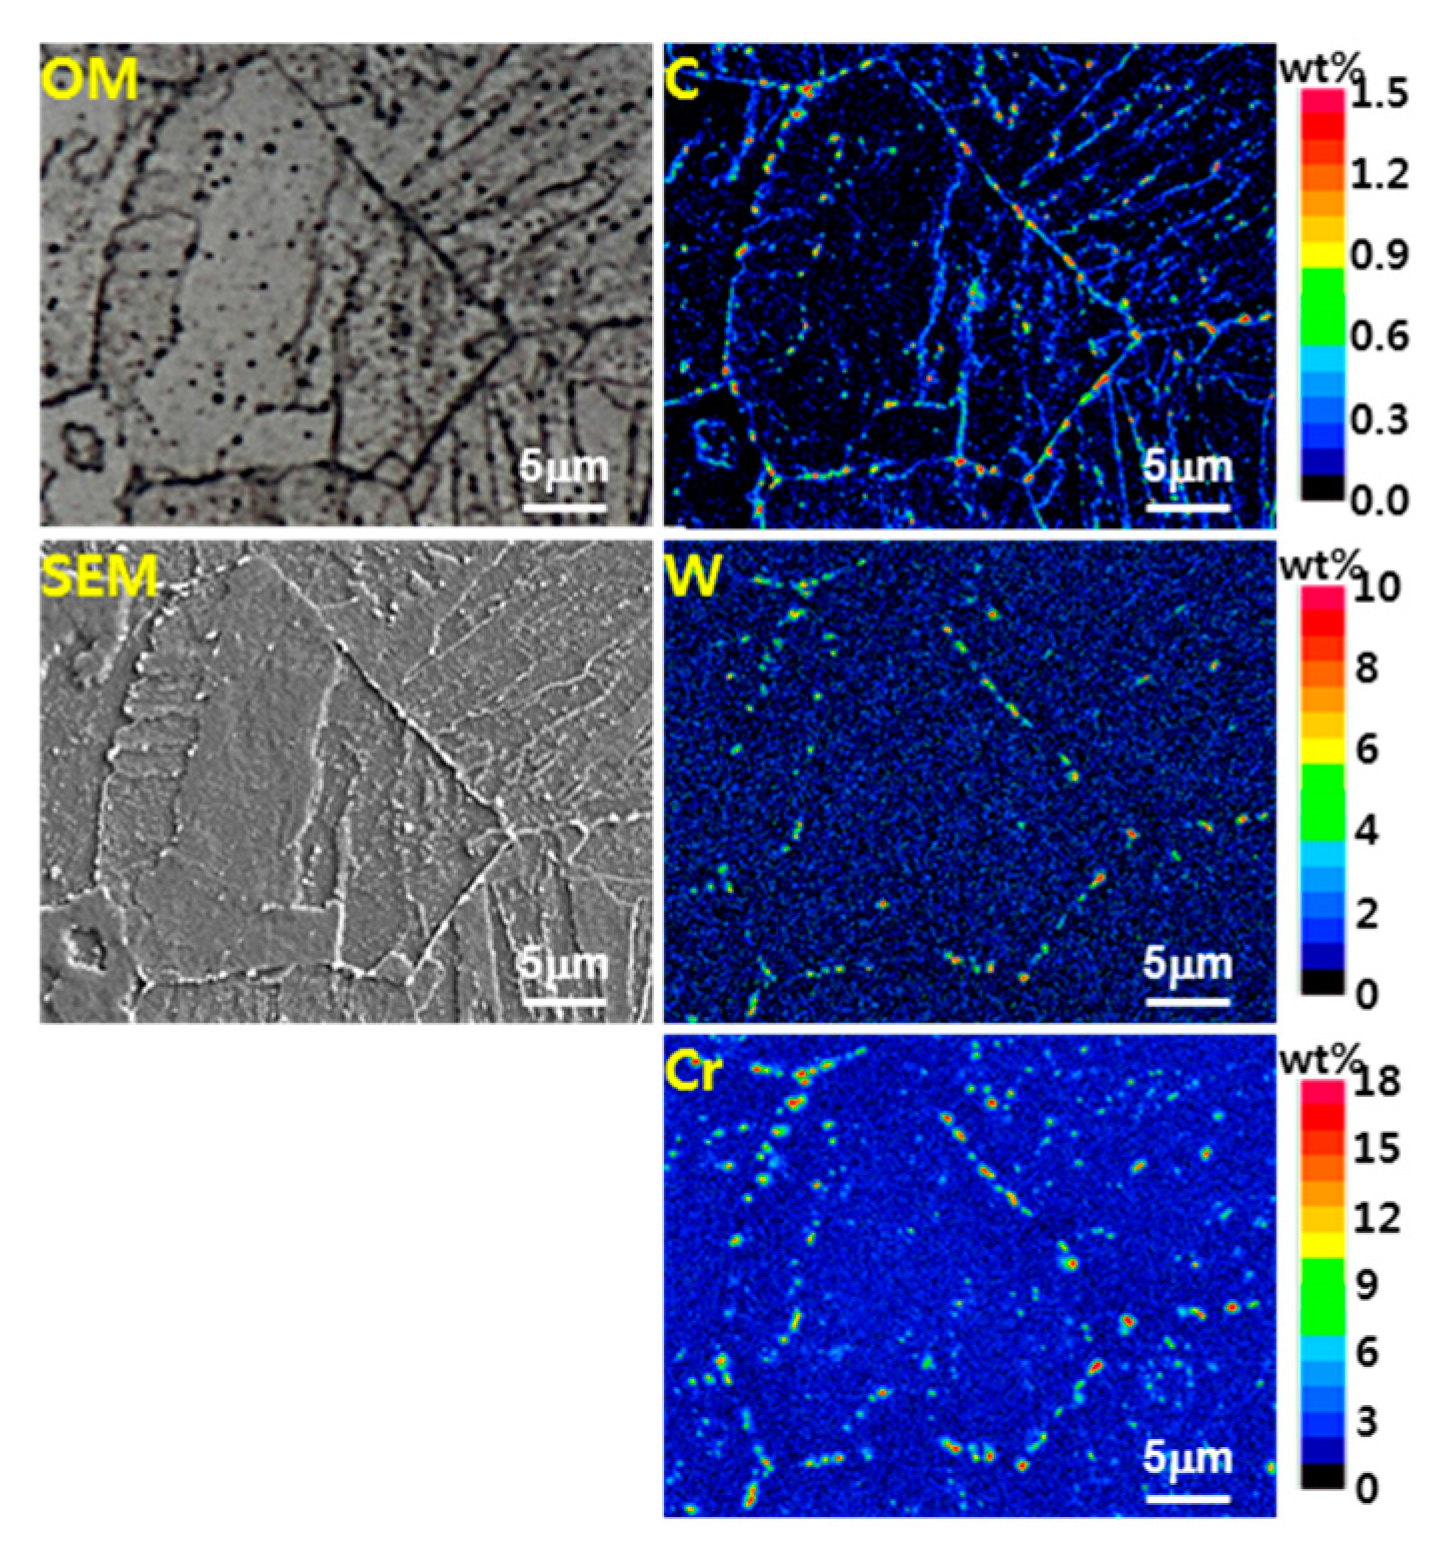
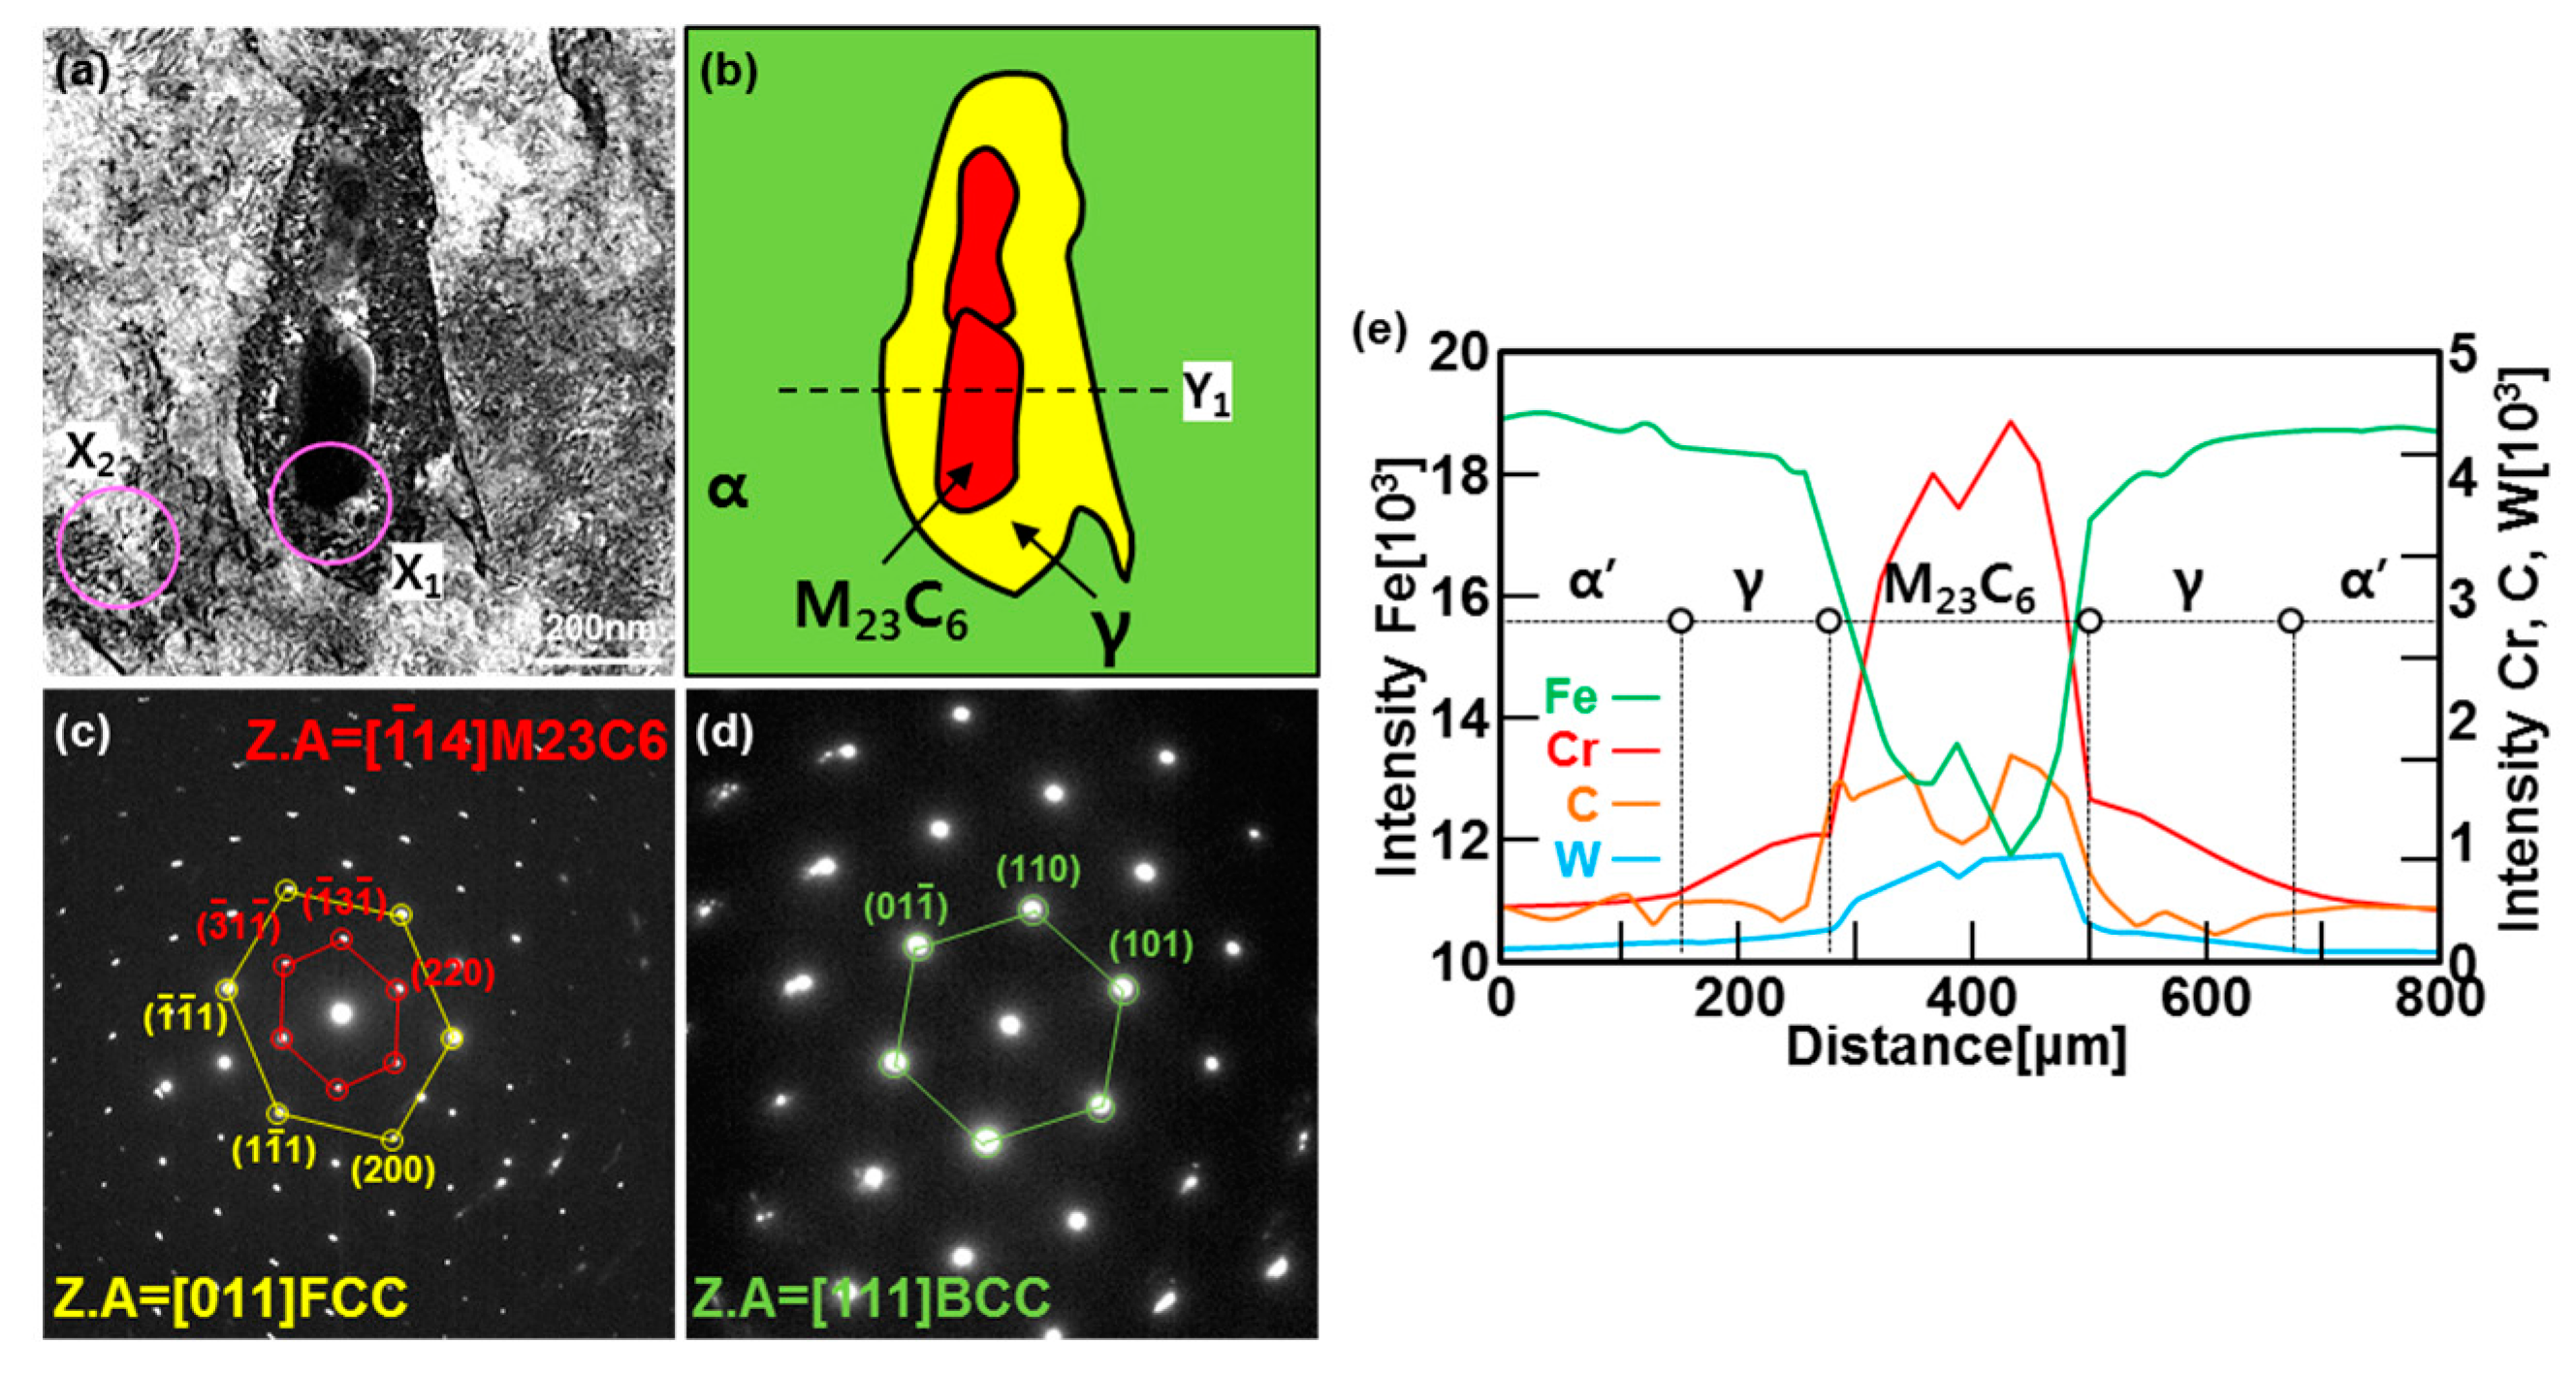
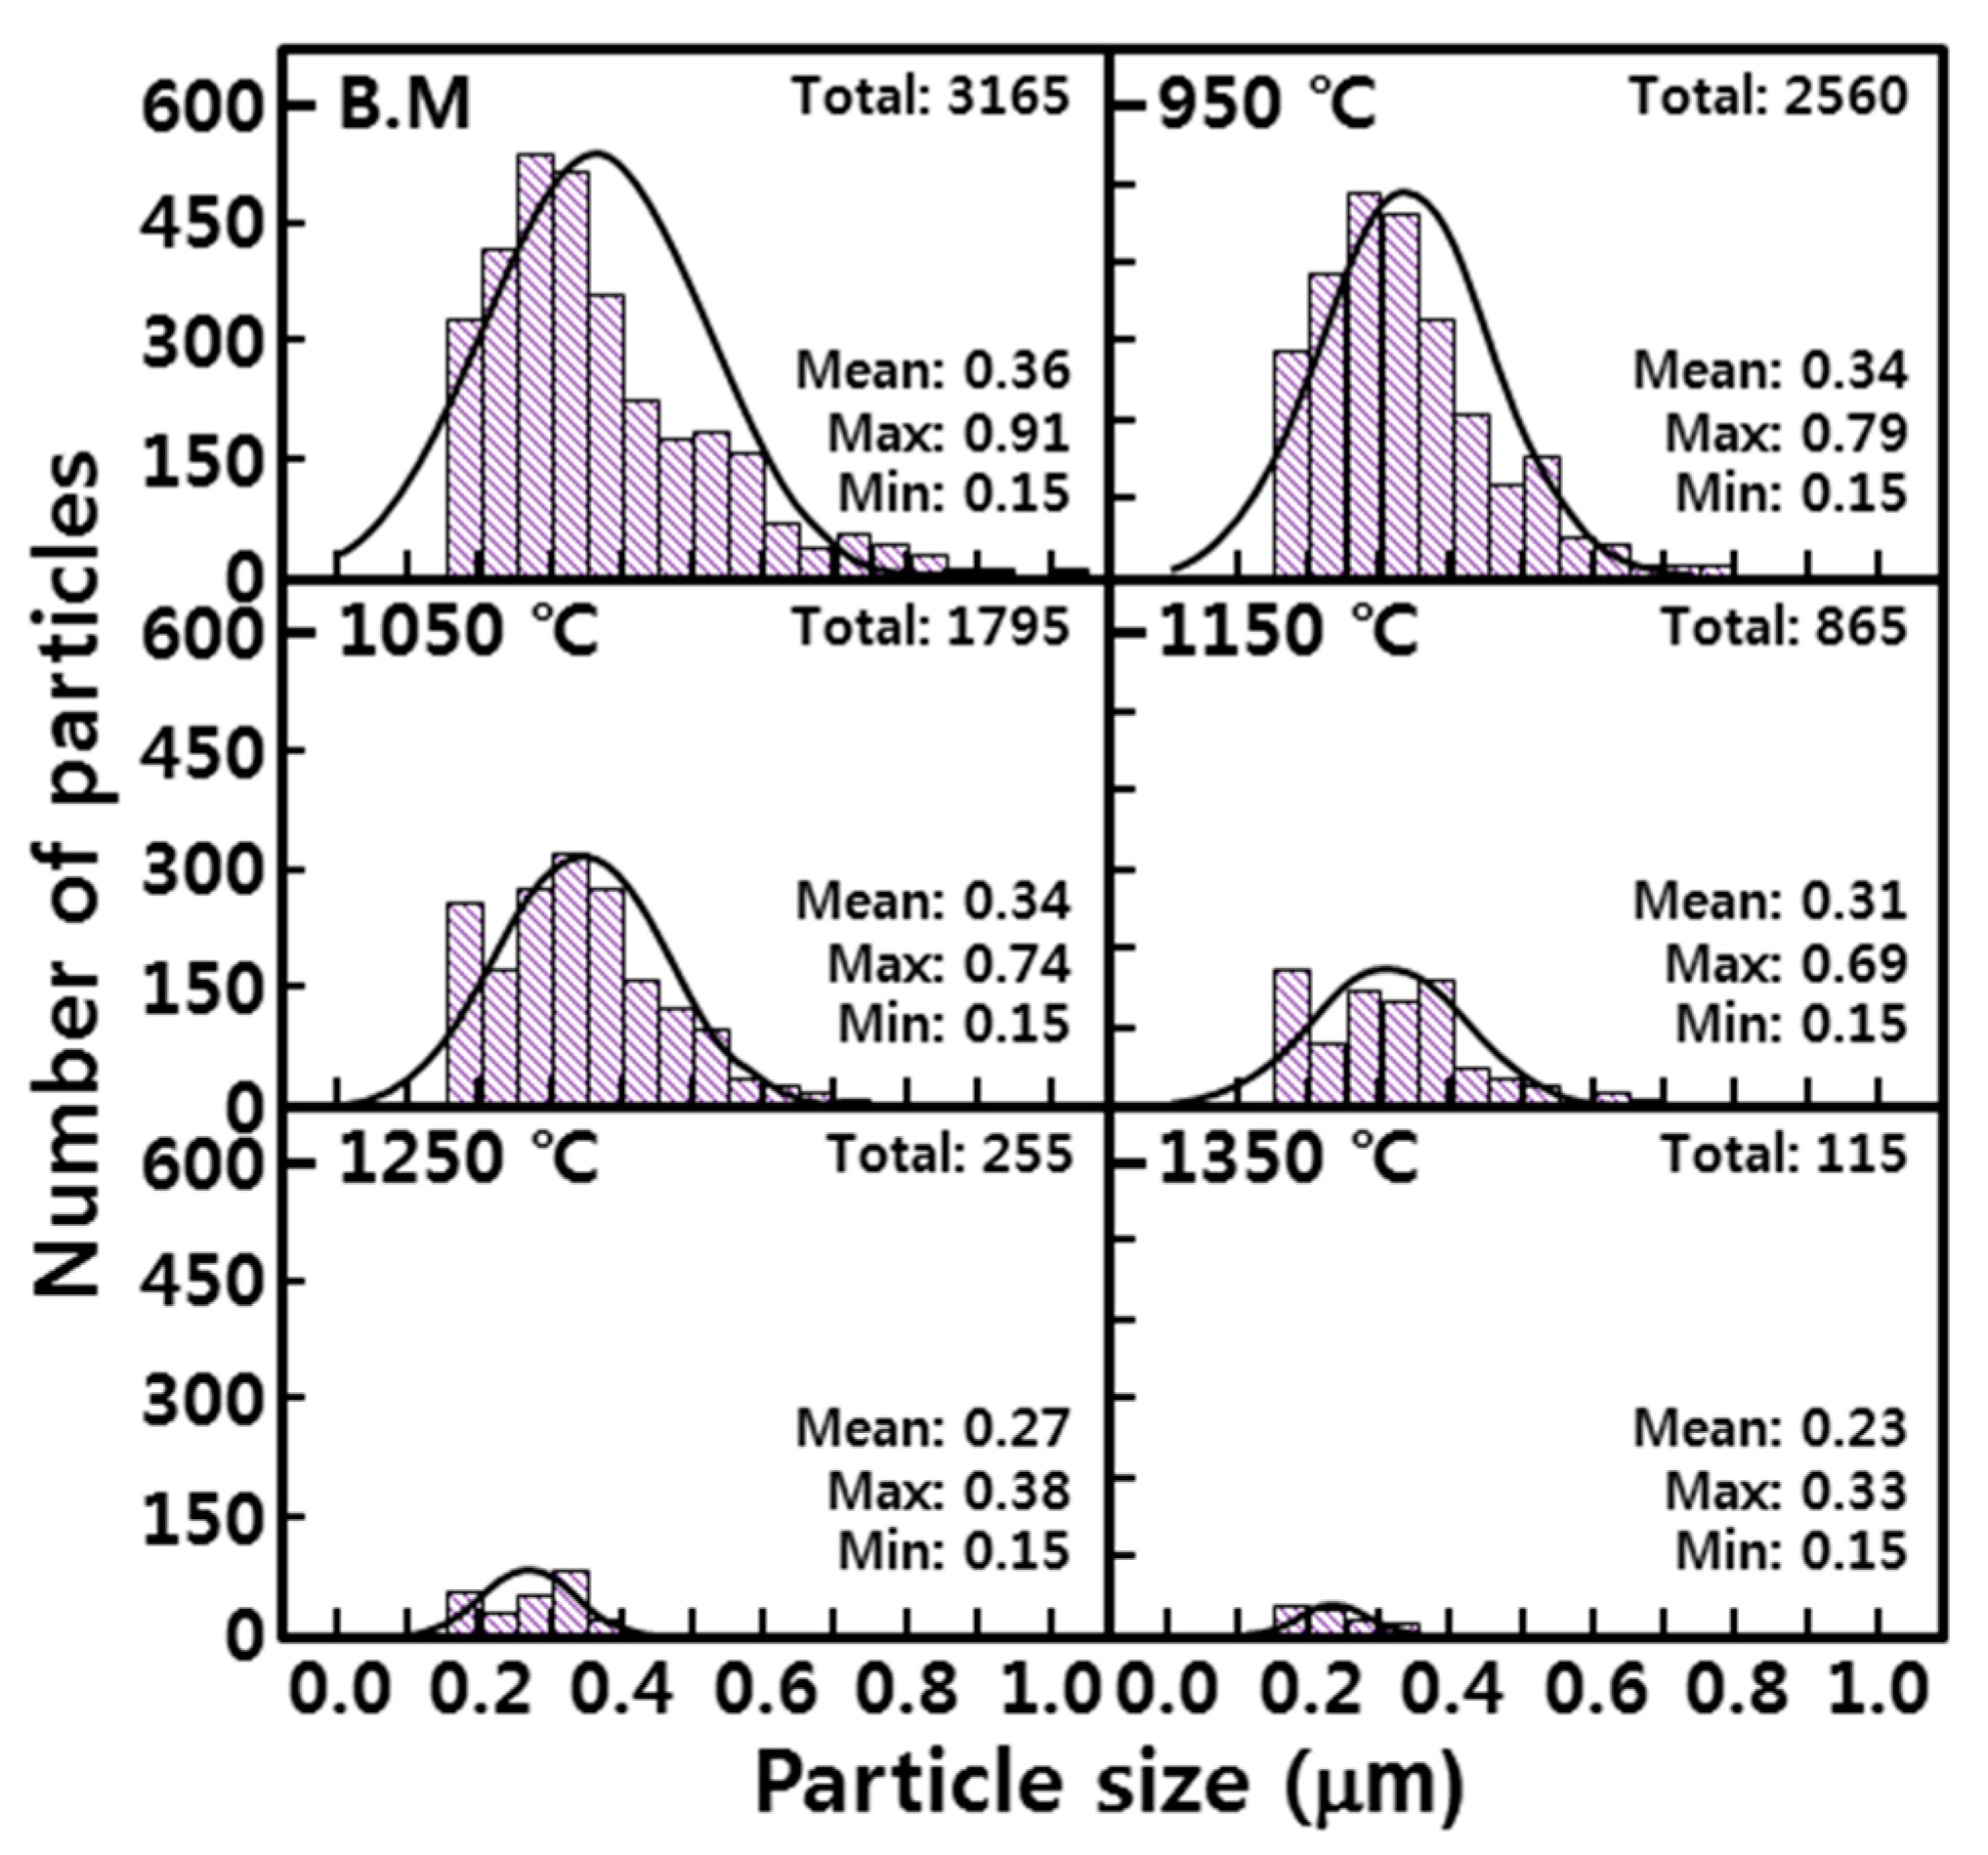
In the EPMA analysis, the M23C6 (C-, W-, and Cr-rich phases) precipitate of the prior austenite grain boundary in the base metal gradually dissolved with the increase in peak temperature (950–1350 °C). Therefore, it was observed that C, W, and Cr, which are the main alloying elements of M23C6, gradually diffused into the matrix. Therefore, the M23C6 with a size less than 1 µm in the base metal changed to a black dot that was coarser than the M23C6 in the base material when the peak temperature increased to 950 and 1050 °C. As the peak temperature increased from 1050 to 1350 °C, the M23C6 carbide changed into a thick black band because M23C6 (C, W-, and Cr-rich phases) gradually dissolved and diffused into the matrix. According to the amount of M23C6 diffusion, the Schaeffler diagram showed that the alloying component of the black dot (C: 0.6–1.0%; W: 3–4%; Cr: 7–12%) at the peak temperature of 1050 °C was the austenite region and that the alloy component of the black band (C: 0.2–0.3%; W: 2–3%; Cr: 2–3%) at the peak temperature of 1350 °C was the martensite region.
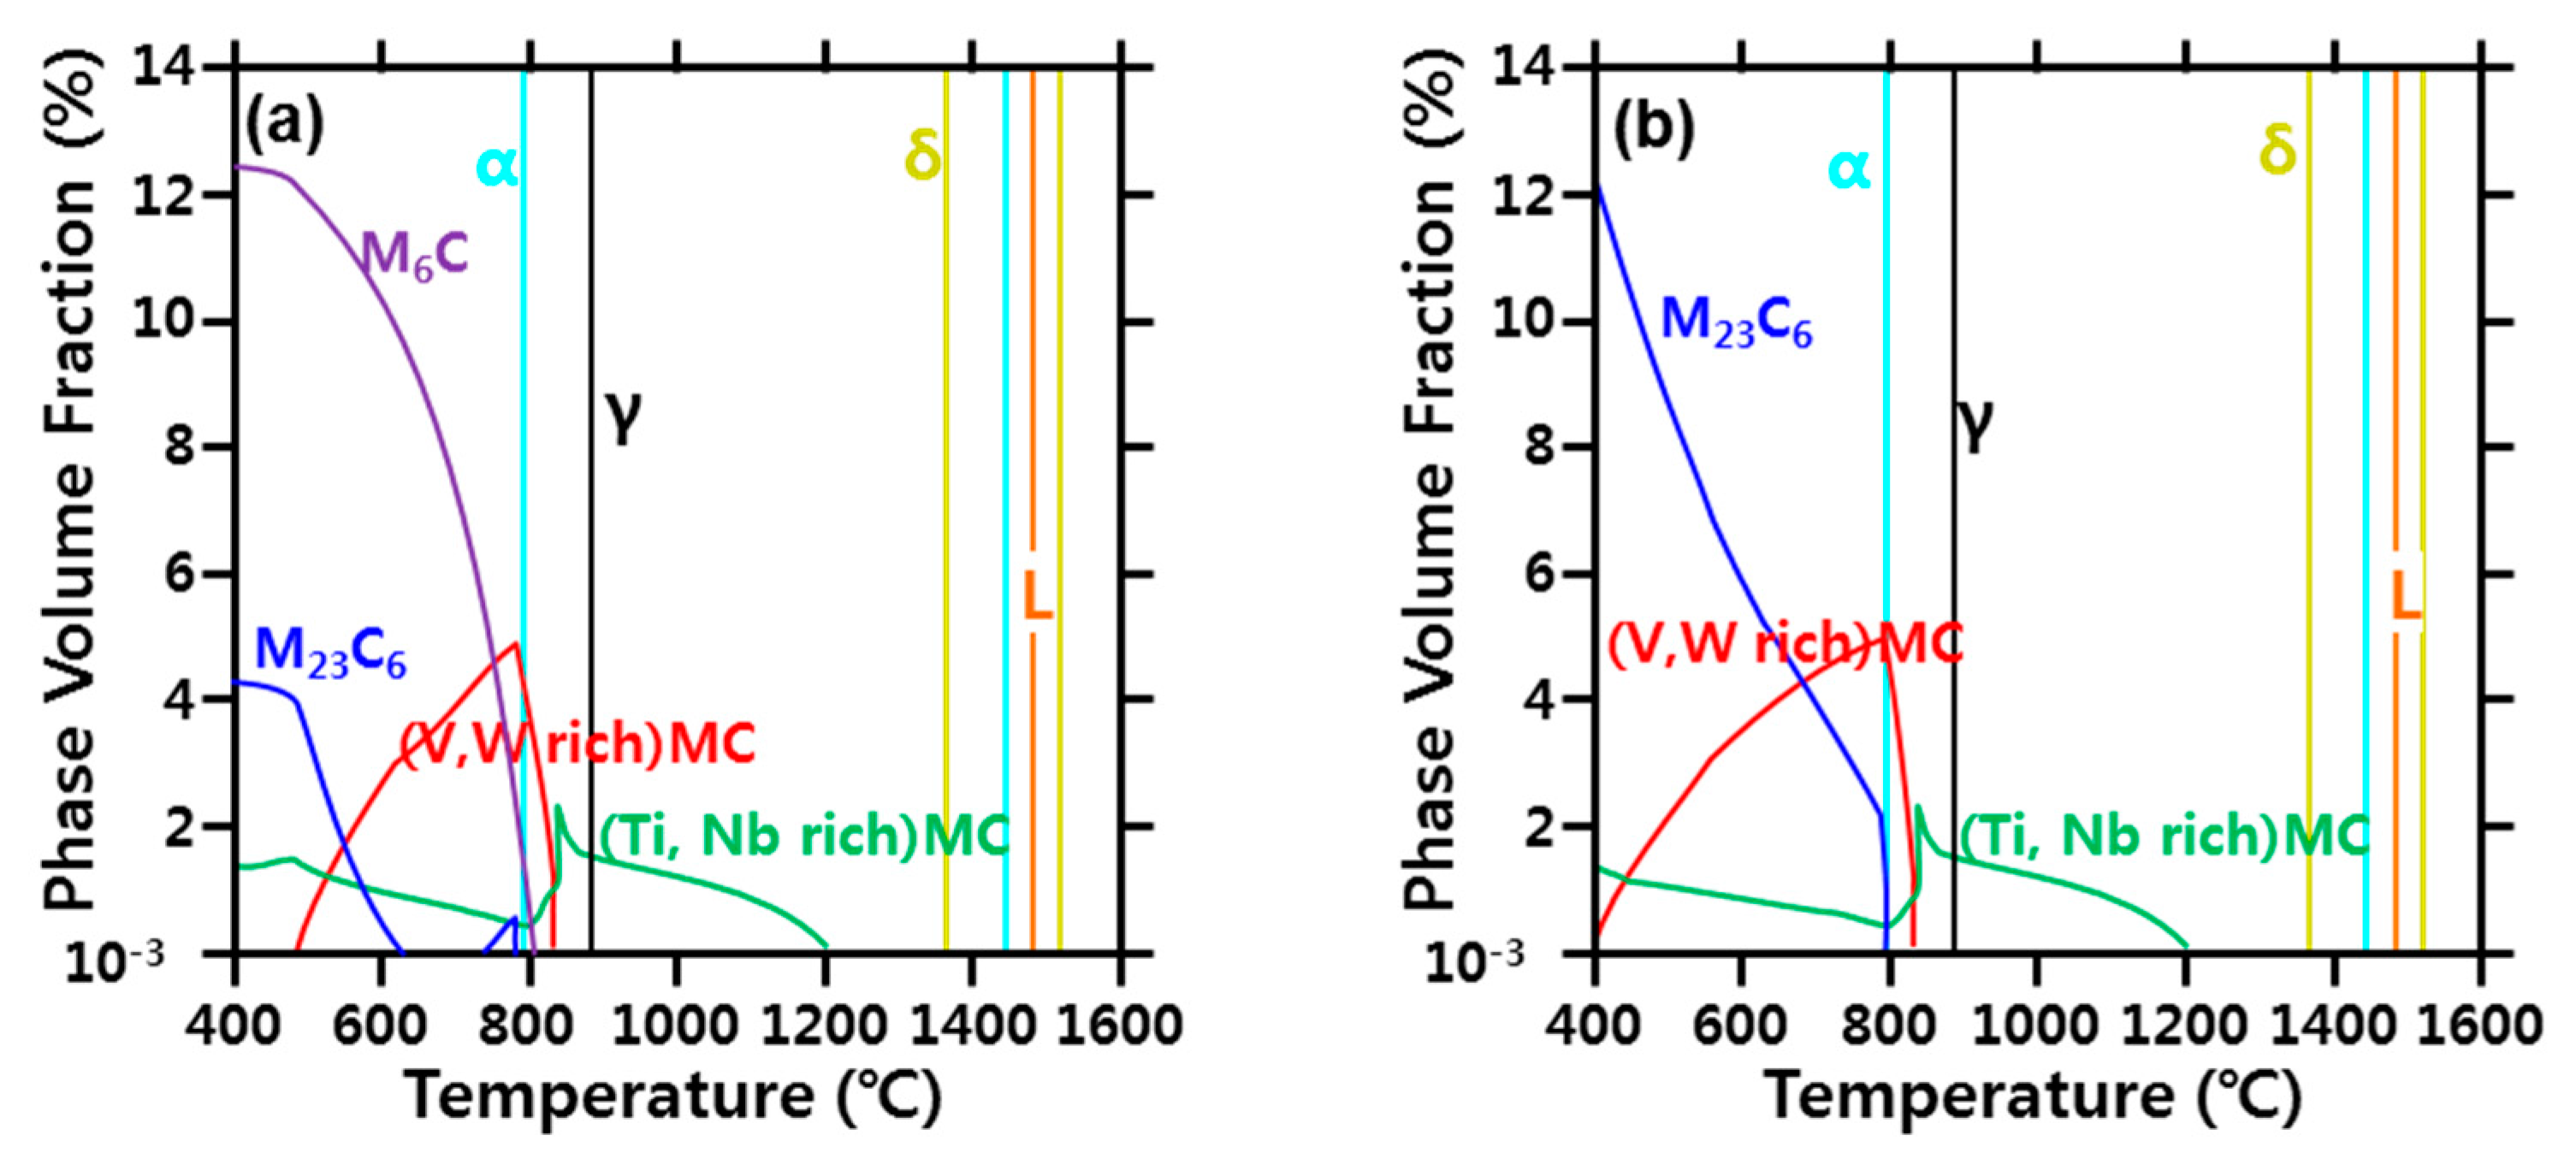
(5)
In the calculation using Thermo-Calc, the M23C6 carbide (C-, W-, and Cr-rich phases) was stable at 800 °C or less. M23C6 dissolved above 800 °C, and the size and volume fraction of the M23C6 carbide decreased rapidly as the peak temperature increased (950–1350 °C). Therefore, it was concluded that the austenite grain size increased because the precipitates that interfered with grain boundary migration decreased.
As a preliminary study of reheat cracking, the main purpose of this study is to show that C, W, and Cr segregations exist in the CGHAZ due to the carbide of the base metal. The segregation zone of CGHAZ was found to precipitate M7C3 and M23C6 during PWHT, which confirmed that it affected reheat cracking. Therefore, while this first paper investigates the mechanism by which segregation is generated in the CGHAZ, a second paper will present the effect of segregation of the CGHAZ on reheat cracking.

Acknowledgments

This research was supported by the Global Frontier Program through the Global Frontier Hybrid Interface Materials (GFHIM) of the National Research Foundation of Korea (NRF) funded by the Ministry of Science, ICT & Future Planning (No. 2013M3A6B1078869) and the Brain Korea 21 Plus project.

Author Contributions

Seong-Hyeong Lee, Hye-Sung Na, Kyong-Woon Lee, Youngson Choe, and Chung-Yun Kang conceived and designed the experiments; Seong-Hyeong Lee and Hye-Sung Na performed the experiments; Seong-Hyeong Lee and Chung-Yun Kang analyzed the data; Seong-Hyeong Lee wrote this paper.

Conflicts of Interest

The founding sponsors had no role in the design of the study; in the collection, analyses, or interpretation of data; in the writing of the manuscript; or in the decision to publish the results.

References

  1. Klueh, R.; Nelson, A. Ferritic/martensitic steels for next-generation reactors. J. Nucl. Mater. 2007, 371, 37–52. [Google Scholar] [CrossRef]
  2. Bendick, W.; Gabrel, J.; Hahn, B.; Vandenberghe, B. New low alloy heat resistant ferritic steels T/P23 and T/P24 for power plant application. Int. J. Press. Vessels Pip. 2007, 84, 13–20. [Google Scholar] [CrossRef]
  3. Viswanathan, R.; Bakker, W. Materials for Ultra Supercritical Fossil Power Plants; EPRI Report No. TR-114750; Elsevier: Amsterdam, The Netherlands, 2000. [Google Scholar]
  4. Dhooge, A.; Vekeman, J. New generation 21/4Cr steels T/P 23 and T/P 24 weldability and high temperature properties. Weld. World 2005, 49, 75–93. [Google Scholar] [CrossRef]
  5. Evans, G. The effect of heat input on the microstructure and properties of C-Mn all-weld-metal deposits. Weld. J. 1982, 61, 125–132. [Google Scholar]
  6. Dixon, B.; Hakansson, K. Effects of welding parameters on weld zone toughness and hardness in 690 MPa steel. Weld. J. 1995, 74, 122S–132S. [Google Scholar]
  7. Haarmann, K.; Kottmann, G.; Vaillant, J. The T23/24 Book; Vallourec & Mannesmann Tubes: Houston, TX, USA, 2000. [Google Scholar]
  8. Nawrocki, J.; Dupont, J.; Robino, C.V.; Marder, A. The Stress-Relief Cracking Susceptibility of a New Ferritic Steel-Part I: Single-Pass Heat-Affected Zone Simulations; Sandia National Labs.: Albuquerque, NM, USA; Livermore, CA, USA, 1999. [Google Scholar]
  9. Nawrocki, J.; Dupont, J.; Robino, C.; Puskar, J.; Marder, A. The mechanism of stress-relief cracking in a ferritic alloy steel. Weld. J. N. Y. 2003, 82, 25S–35S. [Google Scholar]
  10. Masuyama, F.; Yokoyama, T.; Sawaragi, Y.; Iseda, A. Service Exposure and Reliability Improvement: Nuclear, Fossil, and Petrochemical Plants; The American Society of Mechanical Engineers (ASME): New York, NY, USA, 1994. [Google Scholar]
  11. Jiménez, J.A.; Carsí, M.; Ruano, O.A. Effect of rhenium on the microstructure and mechanical behavior of Fe–2.25 Cr–1.6 W–0.25 V-0.1 C bainitic steels. J. Mater. Sci. Technol. 2017, 33, 1487–1493. [Google Scholar] [CrossRef]
  12. Di Gianfrancesco, A. Materials for Ultra-Supercritical and Advanced Ultra-Supercritical Power Plants; Woodhead Publishing: Cambridge, UK, 2016. [Google Scholar]
  13. Wang, B.; Xue, X.; Feng, Z.Y.; An, F.Q.; Zheng, R.L.; Bo, Z.; Yong, Q.J.; Xiao, L. Research on water wall tubes and welded joints of 1000 MW USC tower boiler. In Proceedings of the 7th International Conference on Advances in Materials Technology for Fossil Power Plants, Waikoloa, HI, USA, 22–25 October 2013. [Google Scholar]
  14. Viswanathan, R. Advances in materials technology for fossil power plants. In Proceedings of the Fifth International Conference, Marco Island, FL, USA, 3–5 October 2007. [Google Scholar]
  15. Heo, N.; Chang, J.; Kim, S.-J. Elevated temperature intergranular cracking in heat-resistant steels. Mater. Sci. Eng. A 2013, 559, 665–677. [Google Scholar] [CrossRef]
  16. Park, K.; Kim, S.; Chang, J.; Lee, C. Post-weld heat treatment cracking susceptibility of T23 weld metals for fossil fuel applications. Mater. Des. 2012, 34, 699–706. [Google Scholar] [CrossRef]
  17. Chang, J.; Kim, B.; Heo, N. Stress relief cracking on the weld of T/P 23 steel. Procedia Eng. 2011, 10, 734–739. [Google Scholar] [CrossRef]
  18. Heo, N.; Chang, J.; Yoo, K.; Lee, J.; Kim, J. The mechanism of elevated temperature intergranular cracking in heat-resistant alloys. Mater. Sci. Eng. A 2011, 528, 2678–2685. [Google Scholar] [CrossRef]
  19. Chang, J.; Heo, N.; Lee, C. Intergranular cracking susceptibility of 2.25 Cr1. 3W and 9Cr1MoVNb weld metals at elevated temperatures. Met. Mater. Int. 2010, 16, 981–985. [Google Scholar] [CrossRef]
  20. Chang, J.; Heo, N.; Lee, C. Effects of mo addition on intergranular cracking behavior of 2.25 CrW (P23) weld metal at elevated temperatures. Met. Mater. Int. 2011, 17, 131–135. [Google Scholar] [CrossRef]
  21. Bang, H.-S.; Kim, J.-M. Proposed specimen for reheating cracking susceptibility and mechanical behaviour assessment in 2.25 Cr–1Mo steel pressure vessel weld joint. Sci. Technol. Weld. Join. 2001. [Google Scholar] [CrossRef]
  22. TAMAKI koreaki. Reheat cracking of Cr-Mo steels. J. Jpn. Weld. Soc. 2003, 72, 193–200. [Google Scholar]
  23. Lundin, C.; Kelley, S.; Menon, R.; Kruse, B. Stress rupture behavior of postweld heat treated 2. 25 Cr-1 Mo steel weld metal. Weld. Res. Counc. Bull. 1986, 315, 1–66. [Google Scholar]
  24. Hippsley, C.; Knott, J.; Edwards, B. A study of stress relief cracking in 214 Cr 1 mo steel—II. The effects of multi-component segregation. Acta Metall. 1982, 30, 641–654. [Google Scholar] [CrossRef]
  25. Shin, J.; McMahon, C. Mechanisms of stress relief cracking in a ferritic steel. Acta Metall. 1984, 32, 1535–1552. [Google Scholar] [CrossRef]
  26. Hippsley, C.; Knott, J.; Edwards, B. A study of stress relief cracking in 214Cr 1 Mo steel—I. The effects of P segregation. Acta Metall. 1980, 28, 869–885. [Google Scholar] [CrossRef]
  27. Balaguer, J.; Wang, Z.; Nippes, E. Stress-relief cracking of a copper-containing HSLA steel. Weld. J. 1989, 68, 121–131. [Google Scholar]
  28. Vaillant, J.; Vandenberghe, B.; Hahn, B.; Heuser, H.; Jochum, C. T/P23, 24, 911 and 92: New grades for advanced coal-fired power plants—properties and experience. Int. J. Press. Vessels Pip. 2008, 85, 38–46. [Google Scholar] [CrossRef]
  29. Zieliński, A.; Golański, G.; Sroka, M.; Skupień, P. Microstructure and mechanical properties of the T23 steel after long-term ageing at elevated temperature. Mater. High Temp. 2016, 33, 154–163. [Google Scholar] [CrossRef]
  30. Orr, J.; Robertson, D.G. Low alloy steels–the foundation of the power generation industry. In Proceedings of the 2nd International ECCC Conference, Creep & Fracture in High Temperature Components-Design & Life Assessment, Zurich, Switzerland, 21–23 April 2009; pp. 585–598. [Google Scholar]
  31. Wang, X.; Li, Y.; Li, H.; Lin, S.; Ren, Y. Effect of long-term aging on the microstructure and mechanical properties of T23 steel weld metal without post-weld heat treatment. J. Mater. Process. Technol. 2018, 252, 618–627. [Google Scholar] [CrossRef]
  32. Manohar, P.A.; Ferry, M.; Chandra, T. Five decades of the zener equation. ISIJ Int. 1998, 38, 913–924. [Google Scholar] [CrossRef]
  33. Wang, Y.; Ding, M.; Zheng, Y.; Liu, S.; Wang, W.; Zhang, Z. Finite-element thermal analysis and grain growth behavior of HAZ on argon tungsten-Arc welding of 443 stainless steel. Metals 2016, 6, 77. [Google Scholar] [CrossRef]
  34. Du, Z.; Xiao, S.; Liu, J.; Lv, S.; Xu, L.; Kong, F.; Chen, Y. Hot deformation behavior of Ti-3.5 Al-5Mo-6V-3Cr-2Sn-0.5 Fe alloy in α + β field. Metals 2015, 5, 216–227. [Google Scholar] [CrossRef]
  35. Onoro, J. Martensite microstructure of 9–12% Cr steels weld metals. J. Mater. Process. Technol. 2006, 180, 137–142. [Google Scholar] [CrossRef]
Figure 1. Schematic illustration of simulated various heat-affected zone (HAZ) thermal cycle and geometry of sample.
Metals 08 00170 g001
Figure 2. Optical and SEM microstructure of the base metal. (a,d) nital etchant, (b,e) alkaline sodium picrate etchant, and (c) Murakami etchant. (d,e) SEM micrograph at the region denoted as X, Y in (a,b).
Metals 08 00170 g002
Figure 3. Electron probe micro-analyzer (EPMA) mapping results showing the distribution of elements in the base metal.
Metals 08 00170 g003
Figure 4. (a) TEM micrograph of the base metal at the region denoted as X1. (b) An enlarged portion of (a). (c,d) Diffraction patterns at the regions denoted as Y1 and Y2.
Metals 08 00170 g004
Figure 5. Optical microstructure with various etchants (nital, alkaline sodium picrate, Murakami, and prior γ) and various peak temperatures.
Metals 08 00170 g005
Figure 6. SEM microstructure with various etchants (nital, alkaline sodium picrate) and various peak temperatures.
Metals 08 00170 g006
Figure 7. EPMA mapping results showing distribution of element at various peak temperatures.
Metals 08 00170 g007
Figure 8. EBSD results at various peak temperatures.
Metals 08 00170 g008
Figure 9. (a) TEM micrograph and (b) schematic illustration of 1050 °C. (c,d) Diffraction patterns at the regions denoted as X1 and X2. (e) EDX line-scan result of Y1 across particle.
Metals 08 00170 g009
Figure 10. Phase diagram of the SA213-T23 (2.25Cr-1.6W) material calculated using Thermo-calc TCF.6: (a) with the precipitation of M6C carbide and (b) without the precipitation of M6C carbide.
Metals 08 00170 g010
Figure 11. Carbides particles size distribution: the base metal and at 950, 1050, 1150, 1250, and 1350 °C.
Metals 08 00170 g011
Figure 12. EPMA line results showing distribution of elements at (a) 1050 °C and (b) 1350 °C.
Metals 08 00170 g012
Figure 13. Schaeffler diagram modified according to H. Schneider.
Metals 08 00170 g013
Figure 14. Schematic illustration of carbide and austenite behavior.
Metals 08 00170 g014
Table 1. Chemical composition of the T23 steel.
MaterialChemical Composition (atom %)
CSiMnNiCrMoVNbAlTiBWNFe
SA213-T230.070.240.500.112.090.150.220.0280.0180.0420.00171.660.0095Bal

