Short-Cut Method to Assess a Gross Available Energy in a Medium-Load Screw Friction Press
by
 ,
,
A.J. Sánchez Egea
1,* ,
,
N. Deferrari
2, 
G. Abate
2,
D. Martínez Krahmer
2 and 
L.N. López de Lacalle
1
1
Department of Mechanical Engineering, Aeronautics Advanced Manufacturing Center (CFAA), Faculty of Engineering of Bilbao, Alameda de Urquijo s/n, 48013 Bilbao, Spain
2
Centro de Investigación y Desarrollo en Mecánica, Instituto Nacional de Tecnología Industrial INTI, Avenida General Paz 5445, 1650 Miguelete, Provincia de Buenos Aires, Argentina
*
Author to whom correspondence should be addressed.
Metals 2018, 8(3), 173; https://doi.org/10.3390/met8030173
Submission received: 3 January 2018
/
Revised: 8 February 2018
/
Accepted: 9 March 2018
/
Published: 10 March 2018
Abstract
:The present study proposed a rapid method, based on a previous universal compression tests, to estimate the required load capacity to cold forge different specimen quantity in a screw press. Accordingly, experimental and theoretical approach are performed to check new adjustable drive motor of the modified forging machine to achieve a gross available energy to deform the specimens preventing damage of the forging machine. During the forging experiments, two screw friction presses (as-received and modified) are used to validate the theoretical approach. The modified press exhibits an increase of 51% of gross energy and 11% of maximum load capacity compare to the as-received press. This method is used to improve the effective of the forging process avoiding excessive loads that could promote machine failure. Therefore, a low-cost and easy to implement methodology is proposed to determine the energy and load capacity of a screw friction press to forge different specimen quantities with symmetry pattern configurations.

1. Introduction
Forging is a broadly used metal forming process developed during the twelve century, although theoretical frame of this manufacturing process was described at the beginning of twenty century, due to the development of the theory of plastic. Nowadays, forging is still a recurrent manufacturing process in several industrial sectors such as automotive, aerospace, railway, naval, oil, mining and health, where the end products are difficult to make due to the high strength, thinner section and/or large size [1]. Accordinly, four factors are crucial to achieve an efficient forging procedure: specimen to forge [2,3,4,5,6,7], forging dies [8,9,10,11,12], operational parameters [13,14,15,16,17] and the forging device [18,19,20]. Much literature has been published about the first three factors. For instance, the research about the specimen to forge focused on describe how the initial geometries and mechanical properties can affect the performance of the forming process. Hence, a proper design/configuration of the specimen can improve the efficiency of this metal working process and to facilitate the manufacturing expenditure. For example, Radev et al. [2] forged a specimen of revolution with H shape with different configurations to minimize the manufacturing expenses. Whereas, Buijk et al. [3] described two steps to hot forge a specimen with superficial folds, in order to enhance forging capability when forging different geometries. While, Magalhaes et al. [4] assessed an excellent correlation between the end geometries during the experiments compare with the numerical simulation, when drawing copper with a predefine longitudinal defects. Similar findings were assessed in an thermomechanical analysis of a hot drawing process in stainless steel [5], where the thermal softening enhance the forming capabilities by reducing the thermal stresses. Years later, Radev et al. [6] investigated the use of preforms in different specimen’s geometries and the energy required to deform end specimens with and without using preforms. They found that the required energy to forge decrease at least 28% in the worst scenario, when a preform is used. Moreover, Abate and coworkers [7] analyzed how to reduce the flash when an automotive piece (suspension arm) is hot forged. In this sense, they found that preforms with a rectangular section can decreased the initial weight by 14% compare with preforms with a circular section.
Secondly, most of the forging dies are made of tool steel due to the good wear performance in hot forging processes. Accordingly, the literature converged in describe and analyze how different surface treatments can improve the lifespan of the dies. As well, tool’s wear and lateral forces are important variables to analyze with the purpose to enhance the efficiency of the forging commponets. It is well-known that the die’s wear is the main cause of tool failure. However, numerical methods are oftenly used to predict the depth of wear during the process. Abachi et al. [8] used these simulations to validate their experimental measurements, in order to define accurate wear coefficients from the degradation of the surface die when investigating this forging process. Additionally, Bayramoglu et al. [9] described the performance of several surface treatments used to improve the lifespan of hot forging dies. The experimental trials performed in a real production line showed that the coated dies enhance their lifespan, particularly the surfaces coated with cobalt base. Kocanda et al. [10,12] accomplished several forging experiments with non-symmetrical configurations to analyze the flow of the material inside the forging die and the effects of die cavity. A proper design of the die can rise the efficiency of forging for non-symmetrical specimens and minimize lateral forces. Furthermore, the relationship of flash thickness and several geometrical parameters such as internal and external sockets and corner radius is crucial during forging [11]. A novel methodology was outlined to optimize a closed die finish process when forging Nimonic80-A super alloy. Literature regarding to the operational parameters, such as the type of compression load, preheating temperature, the lubrication, the material thickness, the springback effect, the forging temperature among others have been studied in detail. Thermographic devices are commonly used during hot forging processes to establish a correlation between the preheating temperature, the lubrication efficiency and the evolution of the die’s wear at region of greatest mechanical commitment [13]. The influence of the flash thickness, the billet and die temperature, the springback effect and the friction coefficient are crucial parameters to assess an accurate forming. According to this, Equbal et al. [14] stated that the flash thickness and billet temperature were the most significant parameters when forging a complex geometry (spring saddle).Years later, Egea et al. [15] reported the influence of temperature to reduce up to 21% and 12% the springback effect in aluminum and stainless steel respectively. Additionally, Recently, Abate et al. [16] and Del Pozo et al. [17] evaluated the contribution of several operational parameters to estimate the forge load and the energy required to complete forging process in real workpieces. From the results, they recommend functional parameters to reduce the lead time and the tool wear when forging complex geometries.
Nevertheless, less attention has been paid to rearrange of existing equipments/machines through enhancing process capabilities to keep on using them. In particular, Simoes et al. [18] used a numerical approach to estimate the forging load to deform any material. To do that, they attached a load cell in the press machine to record the forming forces in the press. Combined experimental and numerical approaches are also described to estimate the deflections on the forged specimen. Hence, structural and operational parameters are recommended to improve the accuracy and the lifespan during cold-forging [19]. Moreover, the prediction of forging forces and the associated energy during the different forging stages play an important role. In this way, the energy and eccentric load values can be estimated to properly select the press to forge a complex specimen [20]. In short, due to the requirement of use novel material properties, conventional machine needs structural modifications to enhance their capabilities and to record sensitive parameters to accurately forge the desired specimen. Following this research topic, the present study focuses on a rapid method to estimate the gross available energy and the maximum forging load, based on previous calibration with compression trials, to cold-forge different specimen quantity with pattern-symmetry configurations. Subsequently, some structural modification of the press are recommended to enhance the machine’s gross available energy if necessary. Experimental and theoretical approach are performed to check new adjustable drive motor of the modified forging machine to achieve an effective forging capacity to deform the specimens to prevent damages in the machine’s frame.
2. Methodology
Commercial SAE 1010 carbon steel rods (0.08 wt % C, 0.4 wt % Mn, >0.04 wt % P, >0.05 wt % S, balance Fe) were investigated in the present study. The dimensions of the metallic cylindrical bars were 30 mm height and 25.4 mm (one inch) in diameter. All the specimens were faced with a lathe machine to ensure a proper contact between the specimen and die. Firstly, calibration tests were performed with a universal tensile test machine (Shimadzu, model: UH-100 t, Kyoto, Japan) to determine the compression strength of this steel alloy. Several compression tests were carried out to determine the material formability of SAE 1010 carbon steel at room temperature with a constant quasi-static velocity of 0.1 mm/s. Table 1 shows the initial and final height of the specimen when different loads values are applied.
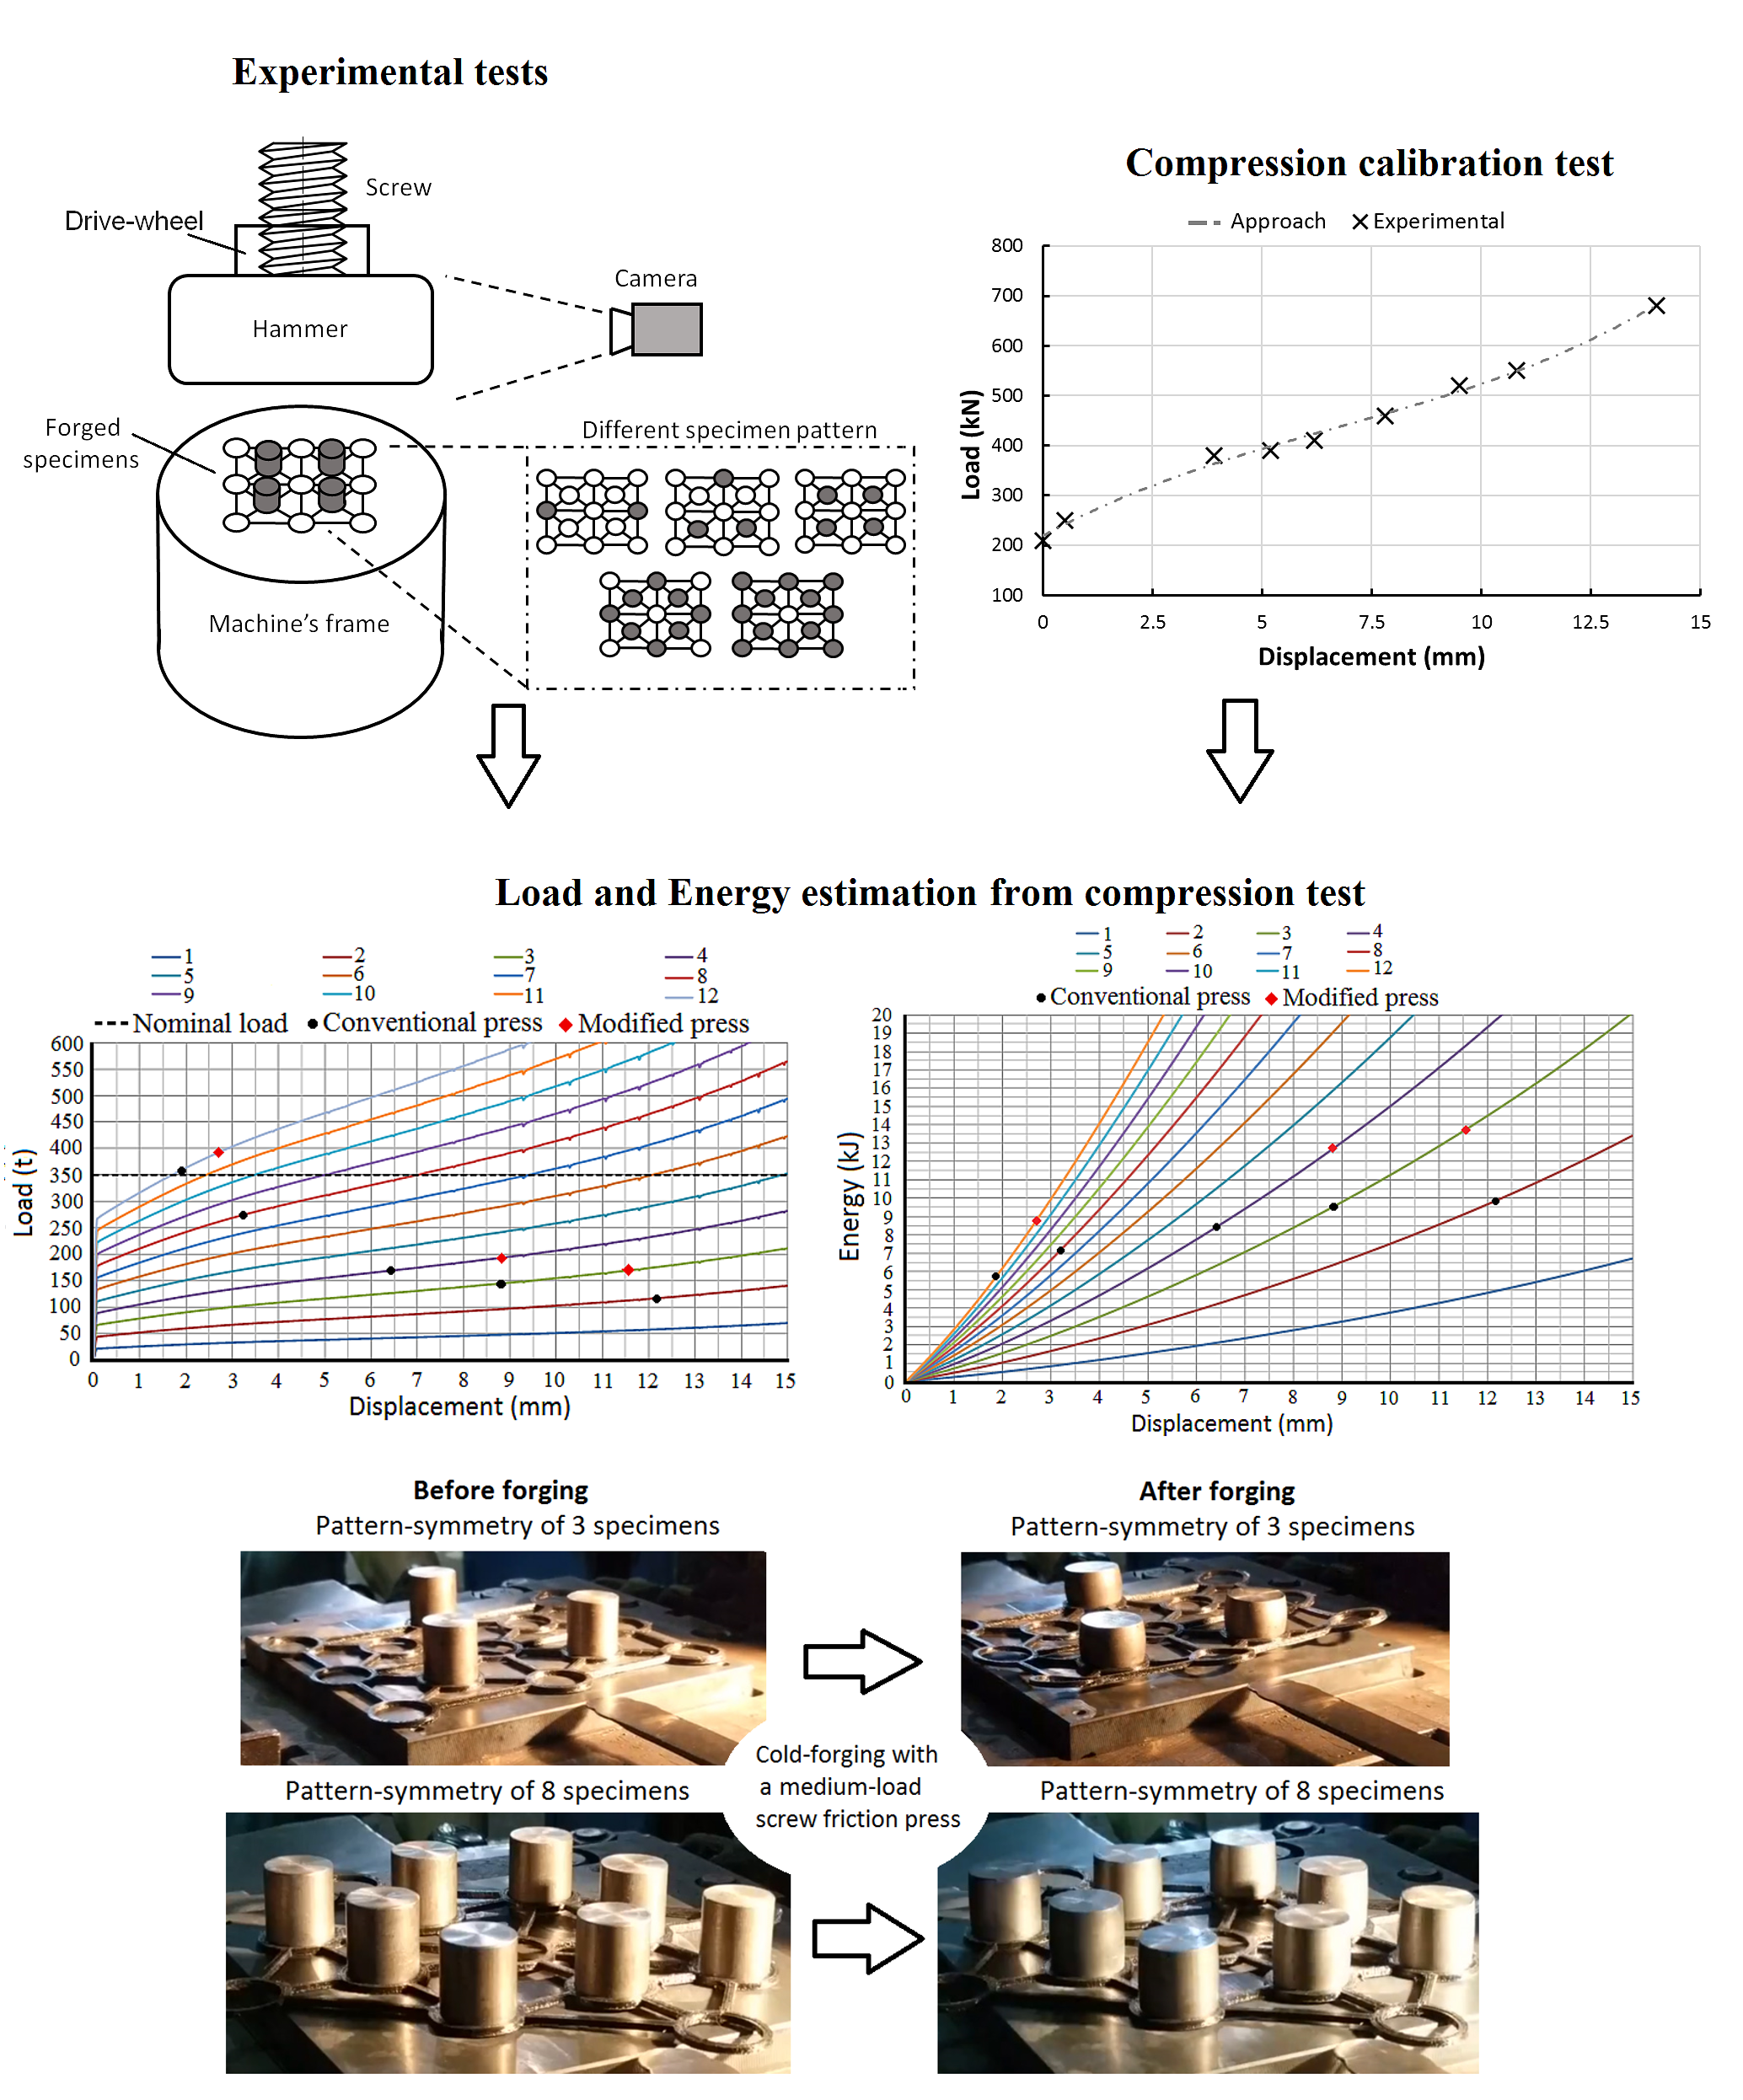
Once it was characterized the material formability at different load values, the software Simufact Forming was calibrated using the experimental results. A 2D axisymmetric analysis was performed with 8-node quadrilateral elements of 0.2 mm size, in total about ten thousand elements were utilized. While the friction coefficient was set as 0.1, this value was taken from the literature [21]. According to MatWeb database for a drawn SAE 1010 carbon steel, the heat transfer coefficient was set as 51.9 kW/mK. Finally, based on the experimental results for a quasi-static strain rate, the software library was employed to select the flow stress curve that properly fits with the experimental results. Accordingly, this software will let us estimate the required force to deform more than one specimen and, accordingly, evaluate the load capacity of the machine to perform an accurate forge. Figure 1 shows the consistency of the experimental and simulation results.
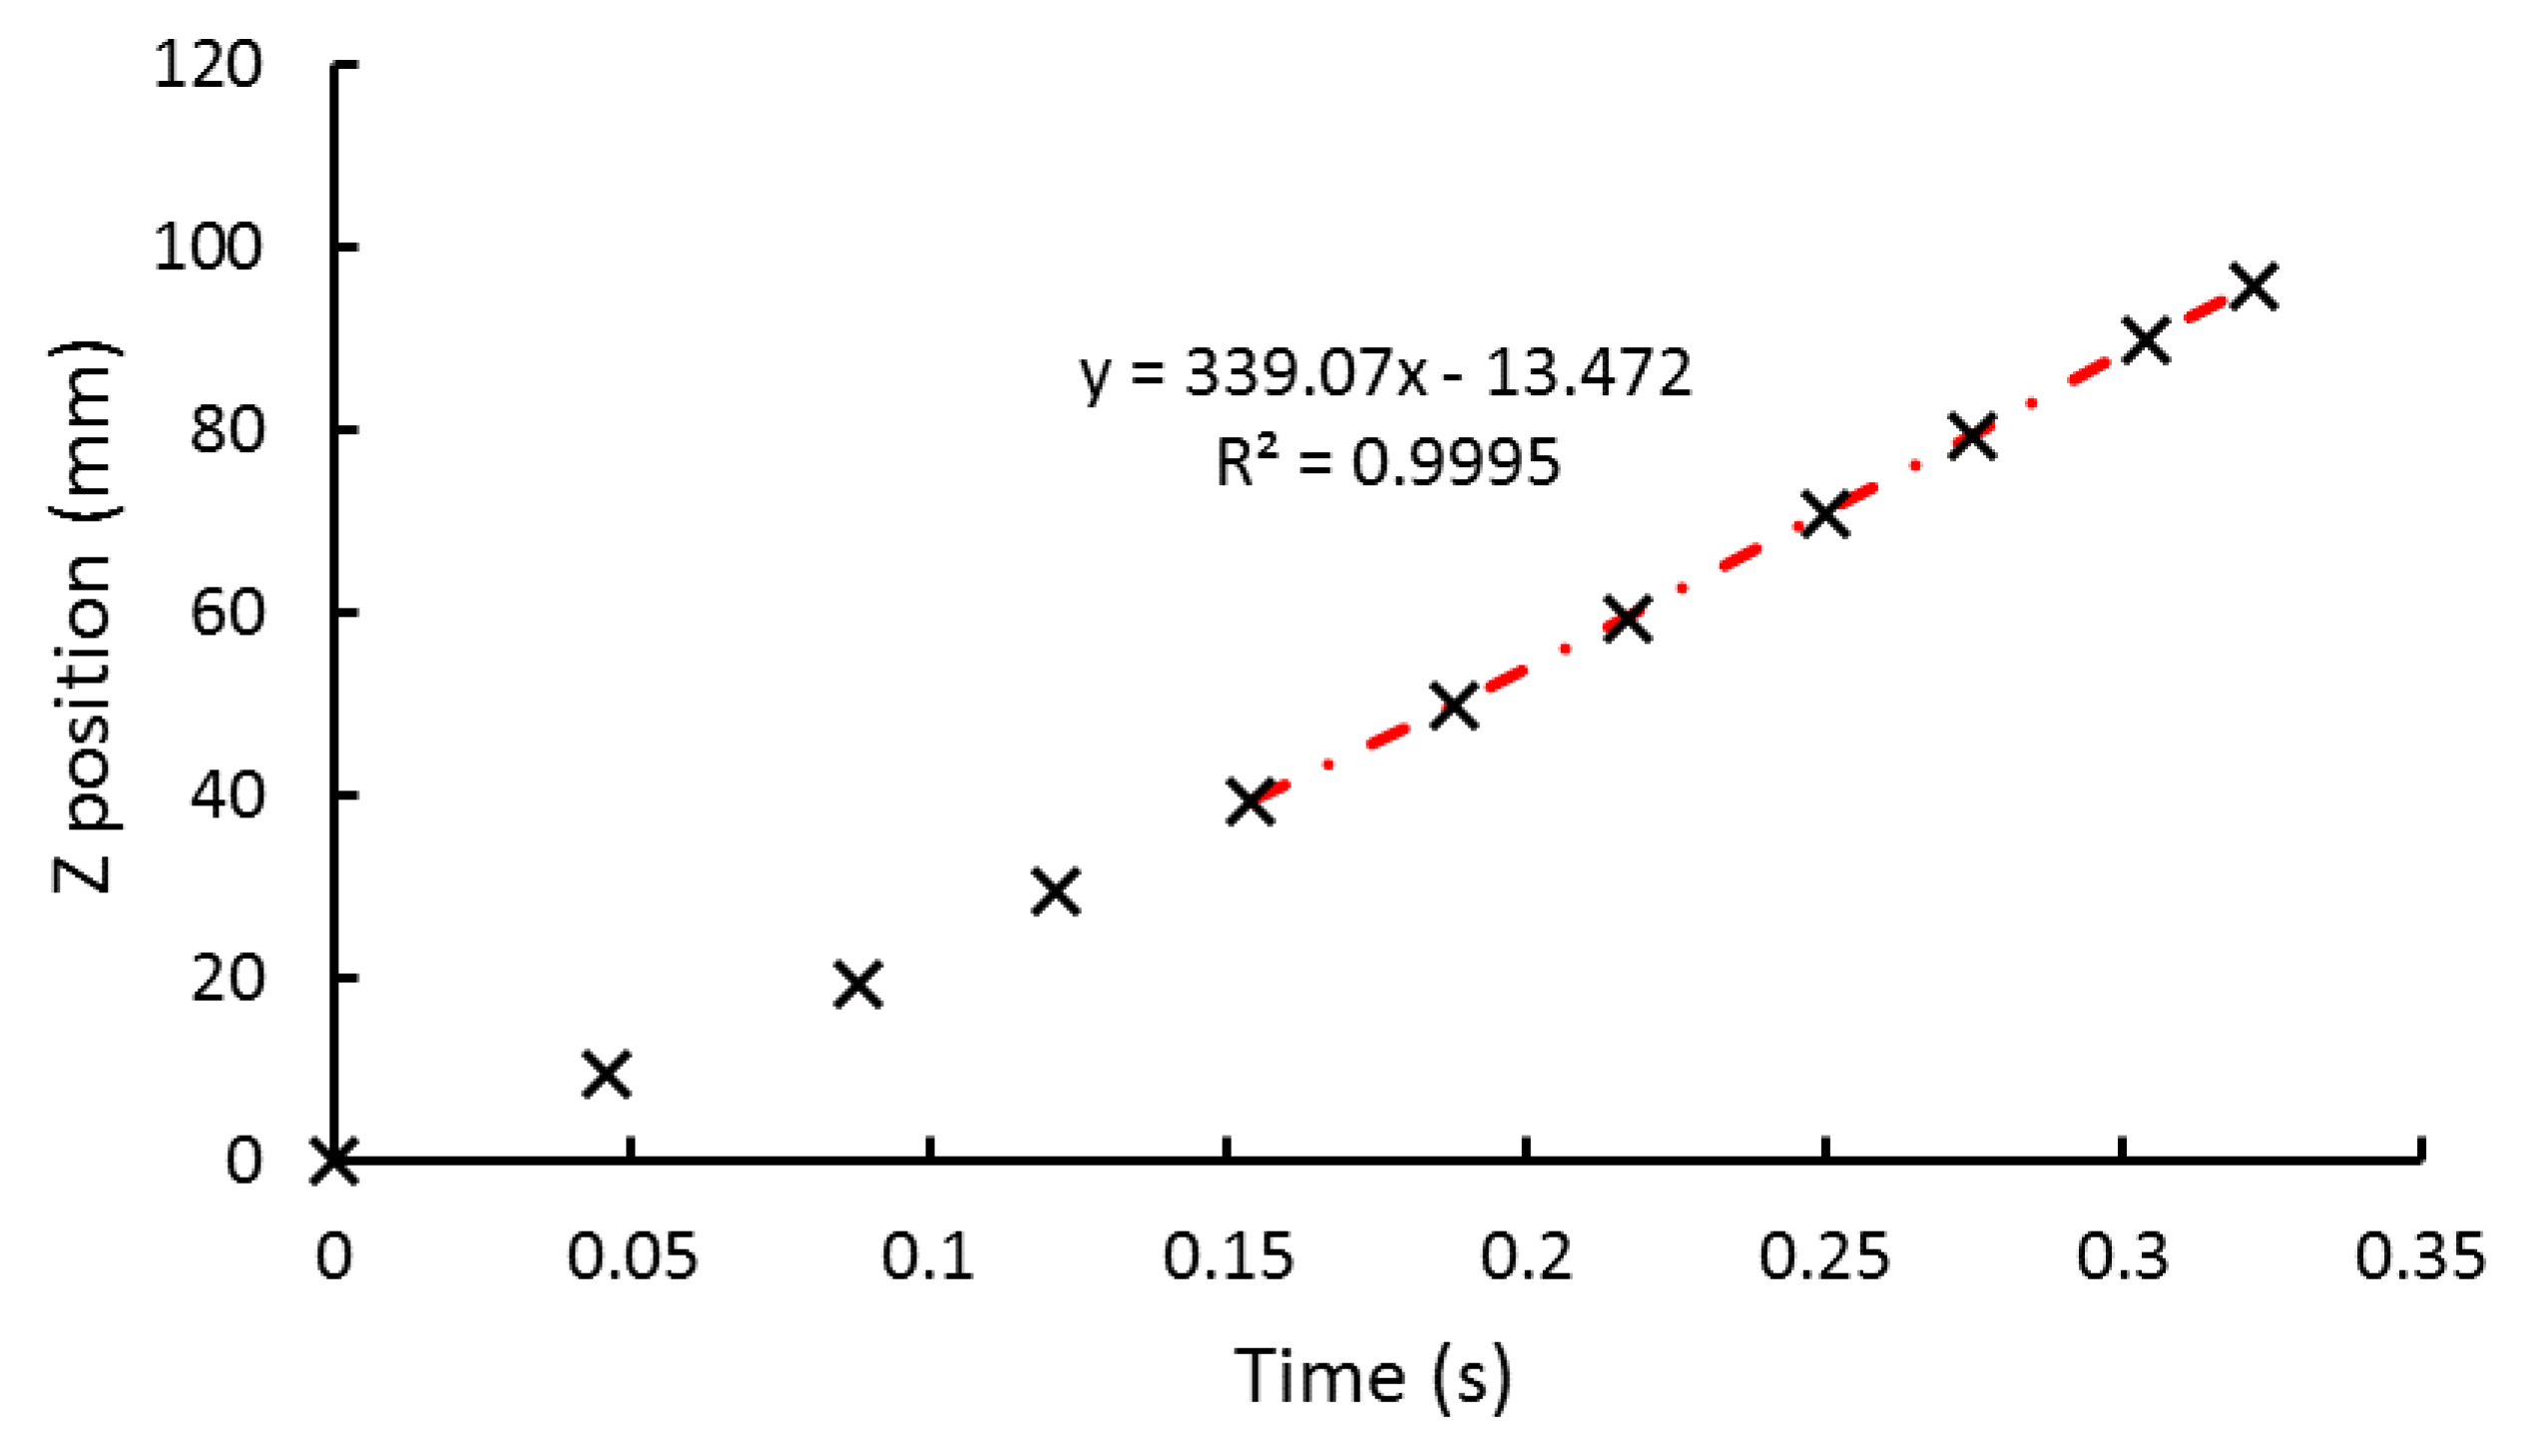
On the other hand, the total energy of the press at the blowing condition was estimated from the rotational speed of the drive-wheel. A high-speed camera, GoPro camera (model Hero4Black, San Mateo, CA, USA) with a shooting configurations of 240 images per second, was used to measure the feed rate of the hammer and, ultimately, the rotational speed of the screw’s lead in the main shaft was computed. Table 2 exhibits the results of the feed rate of the hammer at different z axes positions, where the global coordinate system is located in the center of the lower matrix with the z-axis pointing upwards (parallel to the main machine’s shaft). Furthermore, Figure 2 presents the linear tendency to estimate the feed rate of the hammer, where the least squares method exhibits an excellent match (R = 0.99) for a linear approximation, when the velocity slope keeps constant.
Additionally, several forging experiments were performed with two standard friction screw press (Arrigoni, model: 350, Buenos Aires, Argentina) with a load capacity of 350 t. A structural modification of the initial press (adjustable drive motor) was investigated with the aim to improve the gross available energy. Finally, several pattern and number of specimen 2, 3, 4, 8 and 12 with a predefined symmetry organization were assessed to validate the enhancement of the machine capability. Figure 3 shows the outline of the cold forging experiments with a screw press and the analyzed patterns with symmetry specimens configurations.
Calibration tests were carried out to assess the load-strain relationship during compression trails and, later, numerically approach were done to fit the stress distribution under different loading conditions to validate the experimental results. This numerical approach helps to address the relationship between deformation energy and degree of deformation of the specimen under compression with different load values. The feed rate of the hammer was measured by analyzing digital images taken with the aforementioned high speed camera. A linear ruler was allocated parallel to the hammer travel to determine the linear position associated to every frame and, subsequently, estimate the feed rate right before upsetting the specimen. In this sense, the elastic constant, the frame’s stiffness and the characteristic performance diagrams of the conventional and modified presses can be computed. Regarding to these experiences, a new adjustable drive motor of the modified press were added to increase the machine forming capability. Finally, in both presses, all the experiments were repeated for comparison purposes. Accordingly, the operational parameters of the as-received and the modified screw presses are listed in Table 3.
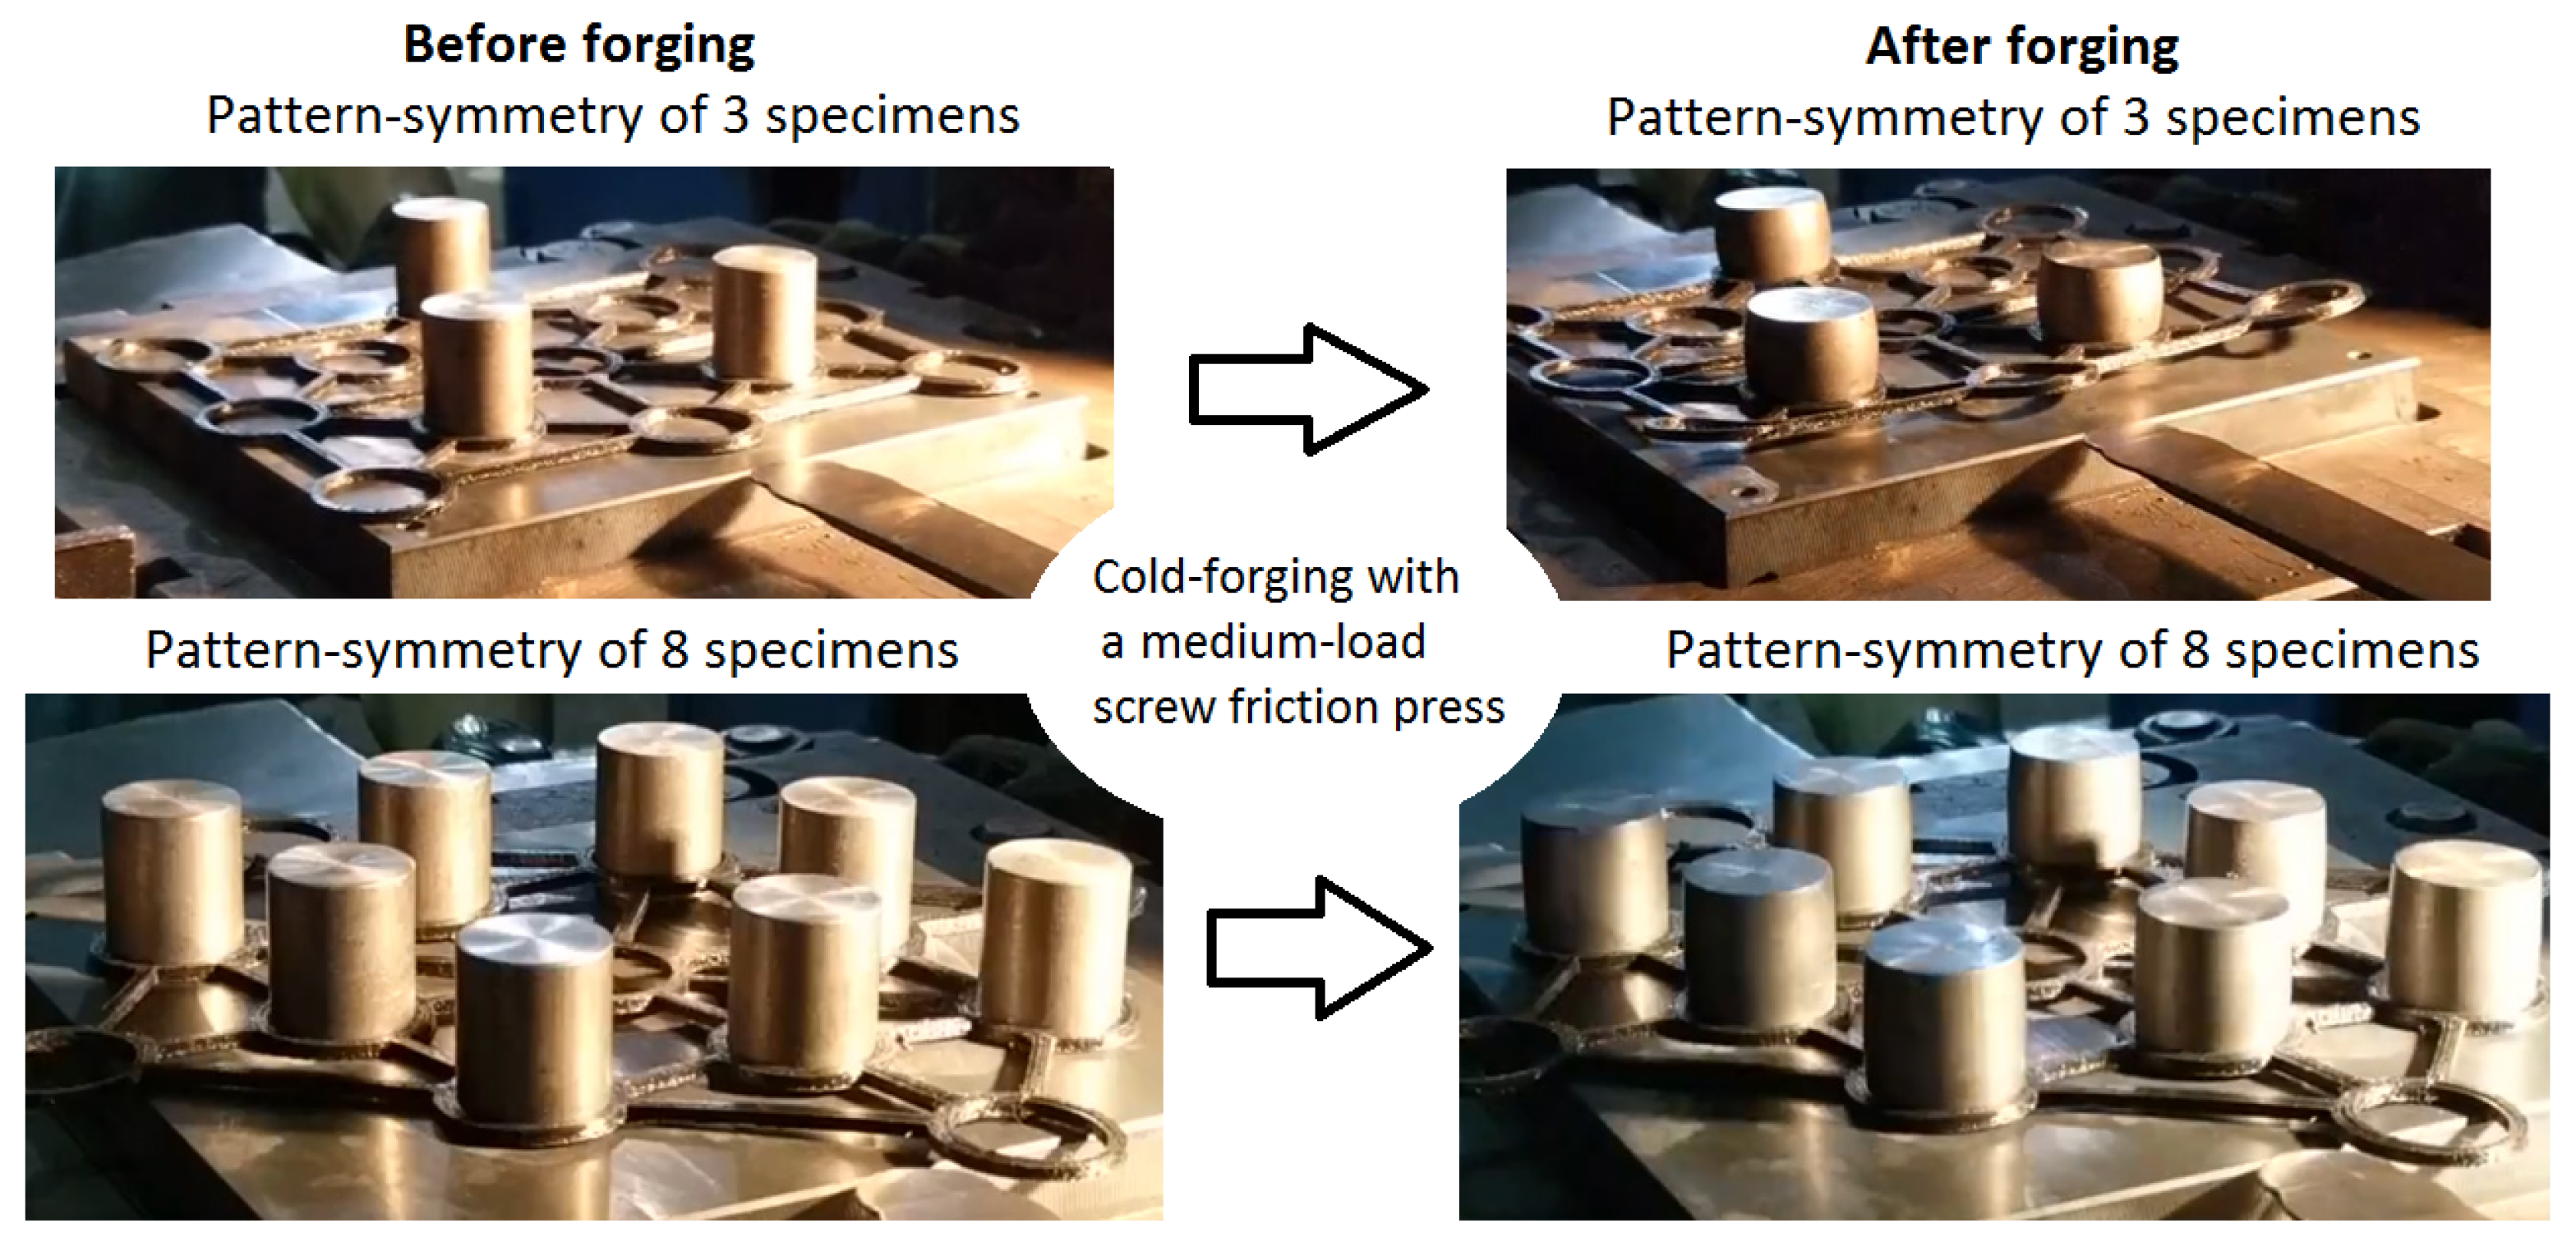
All the forging experiments were performed by professional personal of INTI-Mechanics Center in Argentina. Figure 4 exhibits in-situ forging experiments (before and after the metal forming process) with different pattern-symmetry configurations for the case of 3 and 8 specimens.
3. Results
Experimental forging tests were performed for different specimen quantity and pattern symmetry configurations. It is compared the gross available energy and the maximum load capacity in both screw frictional presses. In particular, a total of 2, 3, 4, 8 and 12 specimens with symmetry configurations were forged, see each pattern symmetry in Figure 3. Table 4 exhibits the degree of deformation () for the maximum load (Load) and the associated energy to deform the specimens () for all the mentioned symmetry-pattern configurations.
Regarding to the output degree of deformation and the calibration diagram of the load versus hammer displacement, the deformation energy and the maximum load for each tests can be assessed. Figure 5 shows the load distribution regarding to the degree of deformation of the specimens. The markers represent the experimental tests recorded during the compression tests, black marker is referred to the screw press, whereas the red marker is referred to the modified frictional press.
The figure shows the curves of load versus displacement obtained from numerical simulation during the compression tests of 1–12 specimens. The horizontal dashed line represents the nominal capacity of the press which is 350 t. The markers exhibit that the modified press is capable of delivering higher loads than the as-received press within the entire range of displacement. Taking in to account these results, it is possible to estimate the structural stiffness of both presses and, consequently, the total energy. To do that, the conservation of energy is defined as follow:
where stands for total energy, is the energy of friction, is the energy absorbed by the machine’s deformation and is the energy of material deformation. As the present study focuses in a cold-forging process with a single hammer blow, the heat energy component is neglected.
The energy of friction is mainly evaluated during the hammer displacement, particularly, the friction of screw in the machine’s shaft. According to the literature [21], the friction between these two machine components is about 15% of the total energy during mild-loads ranges and about 25% of the total energy for loads which are near to the maximum load capacity. As a consequence, the percentage of friction energy can be approach as:
where L stands for the percentage of load used during the compression test and is the maximum percentage load capacity.
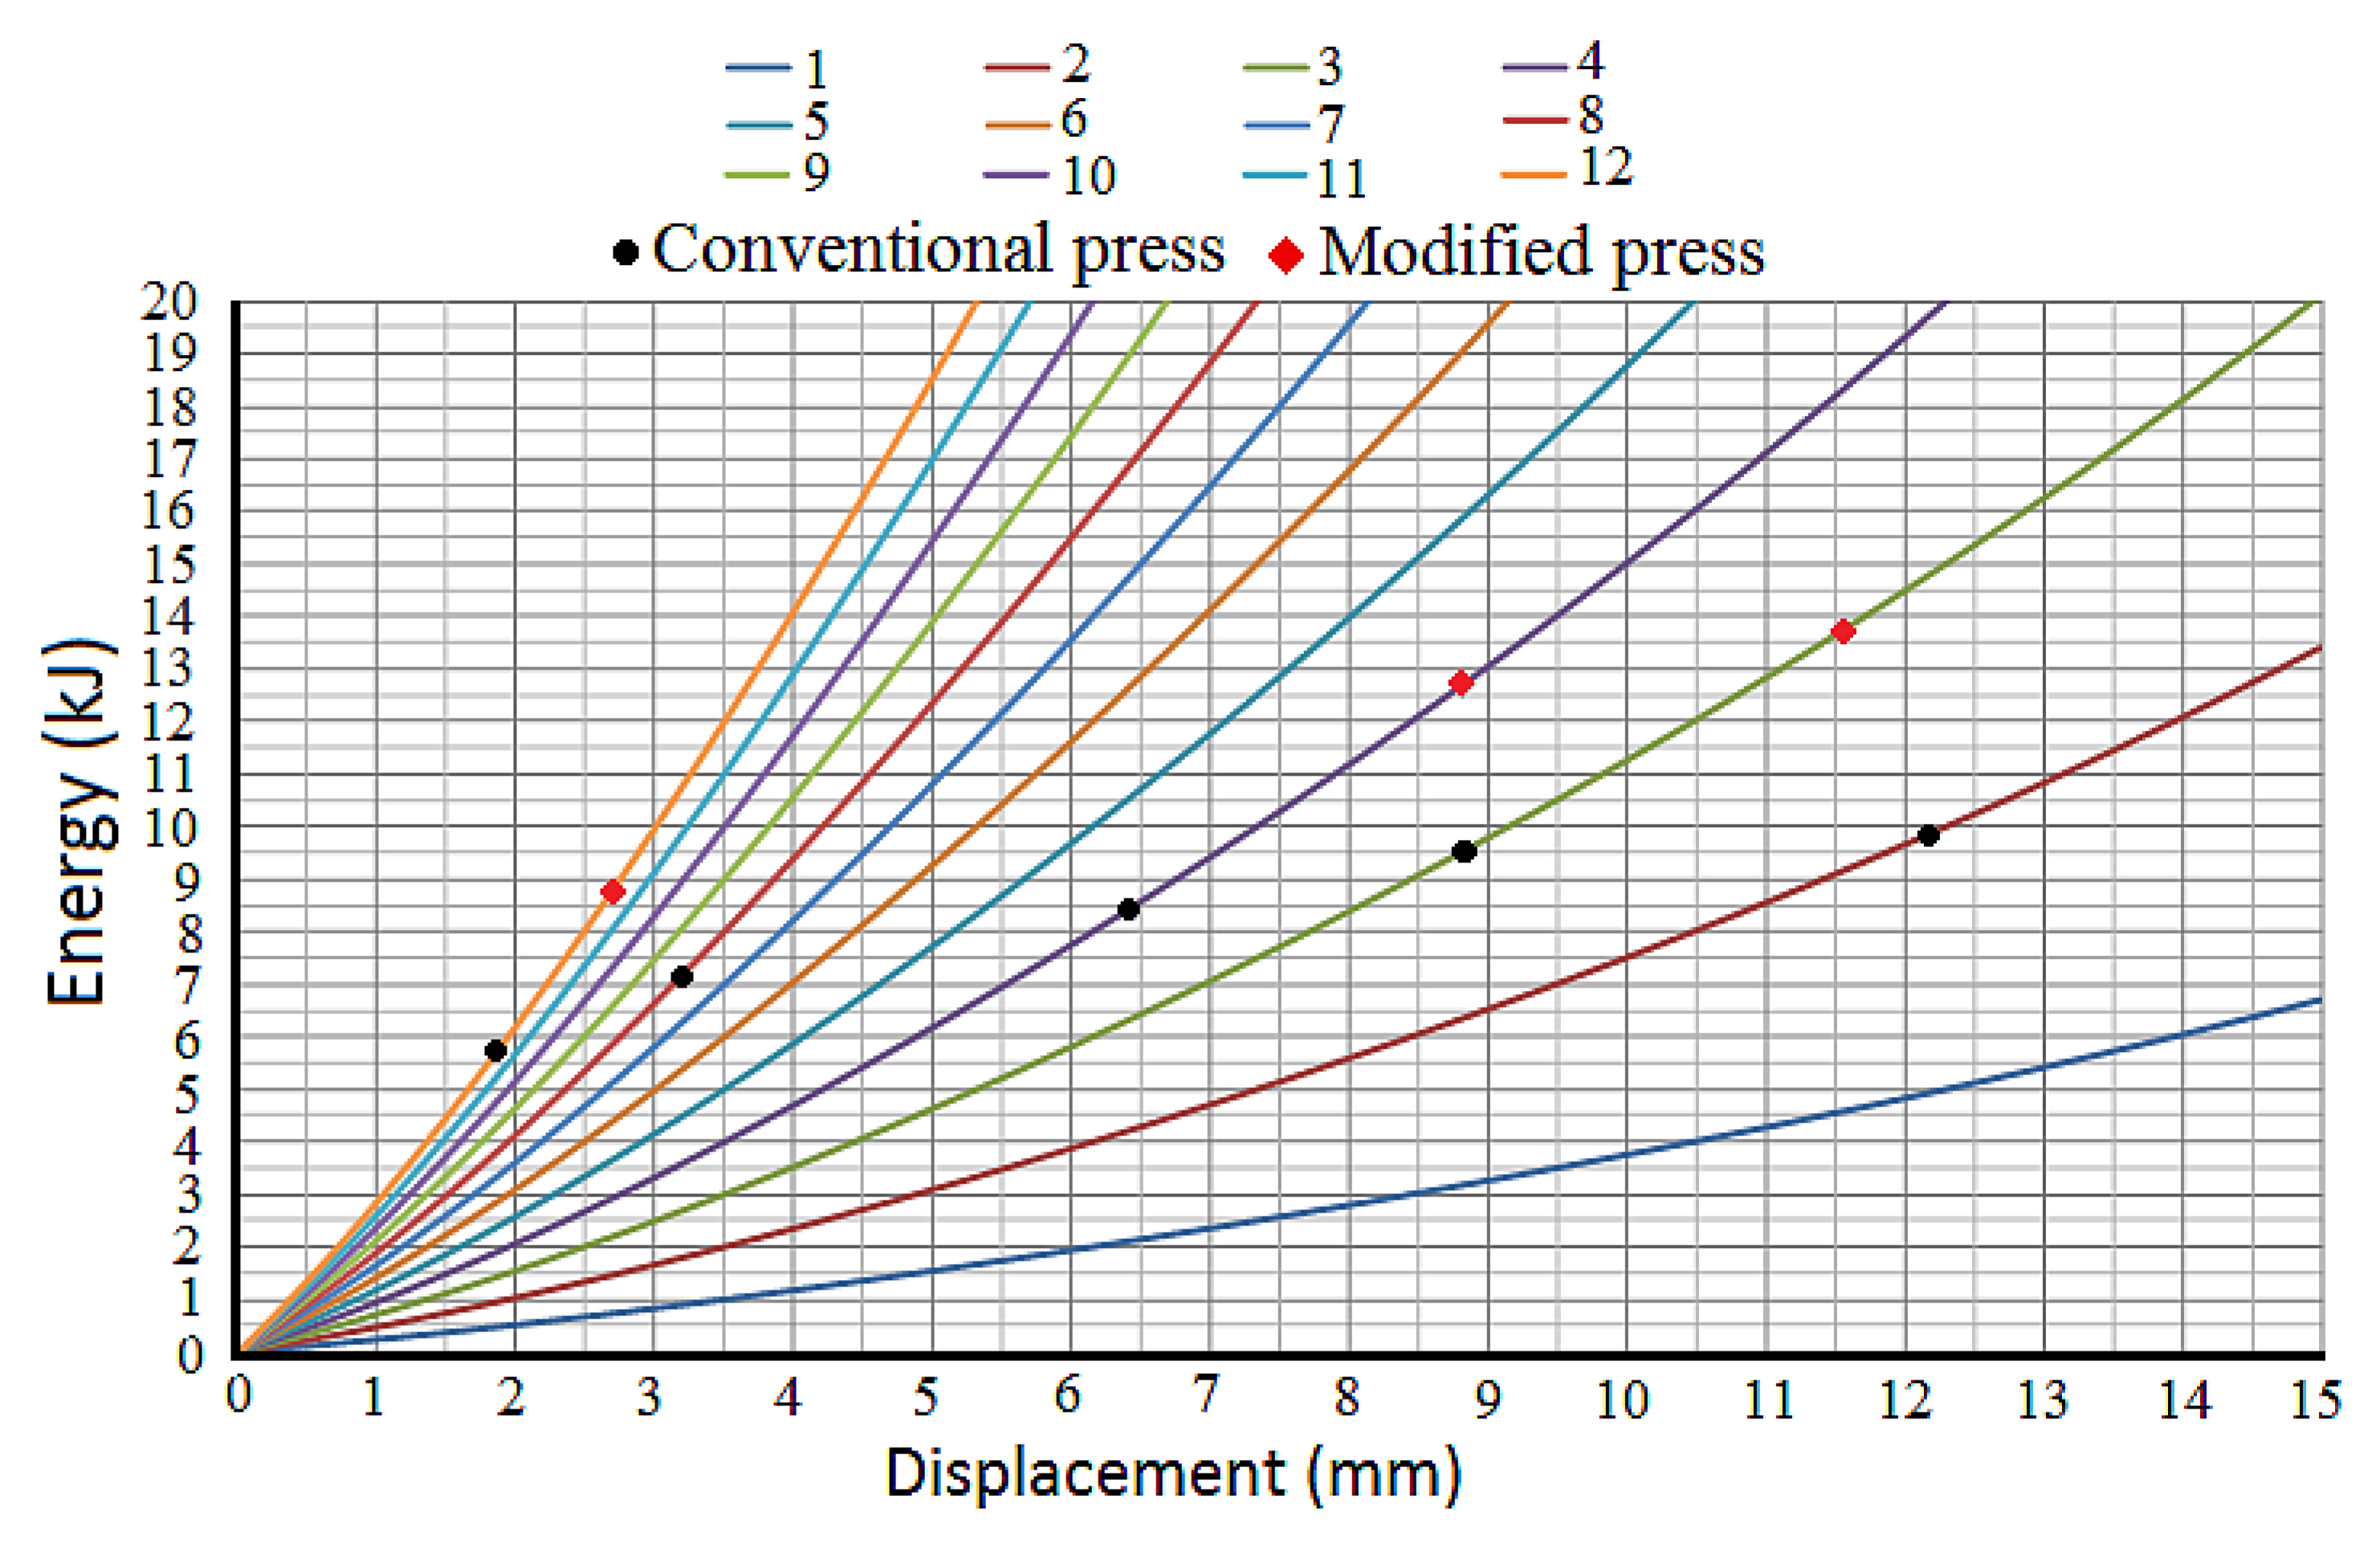
Figure 6 presents the theoretical energy associated to the degree of deformation of the specimens, where each color line defines the multiple compression tests from 1 to 12 specimen’s configurations. Similarly, black and red markers are referred to the conventional the modified screw presses, respectively.
The graph shows the curve of energy versus displacement obtained from numerical simulation during the compression of 1–12 specimens. The modified press is able to deliver greater energies compare with the as-received press along the studied range of displacement. When the hammer blows over the specimen, the energy attributed to the machine absorption can be estimated as the linear elastic approach of the machine behavior. The deflection of the press’s frame was assumed as linear behavior, without considering small displacement between the structural components. Therefore, the machine’s stiffness was measured from the slope of the load versus the machine deflection, which is defined as follow:
where L is the load applied in the compression experiments and C is the machine stiffness.
The energy balance provided by the drive-wheel exceeds the energy needed to deform the material and counteract frictional losses and the energy absorbed by the press frame. In this sense, a proper selection of the forging energy for each configuration will avoid overloads and tool wear that will reduce the lifespan of the press [22]. An excessive energy could promote formation of flash, deformation of the dies or hammer, excessive bouncing of the bundle and early fracture of different components of the press. Replacing the previous terms, the energy balance equation to estimate of the stiffness of the press by linear regression can be assessed according to:
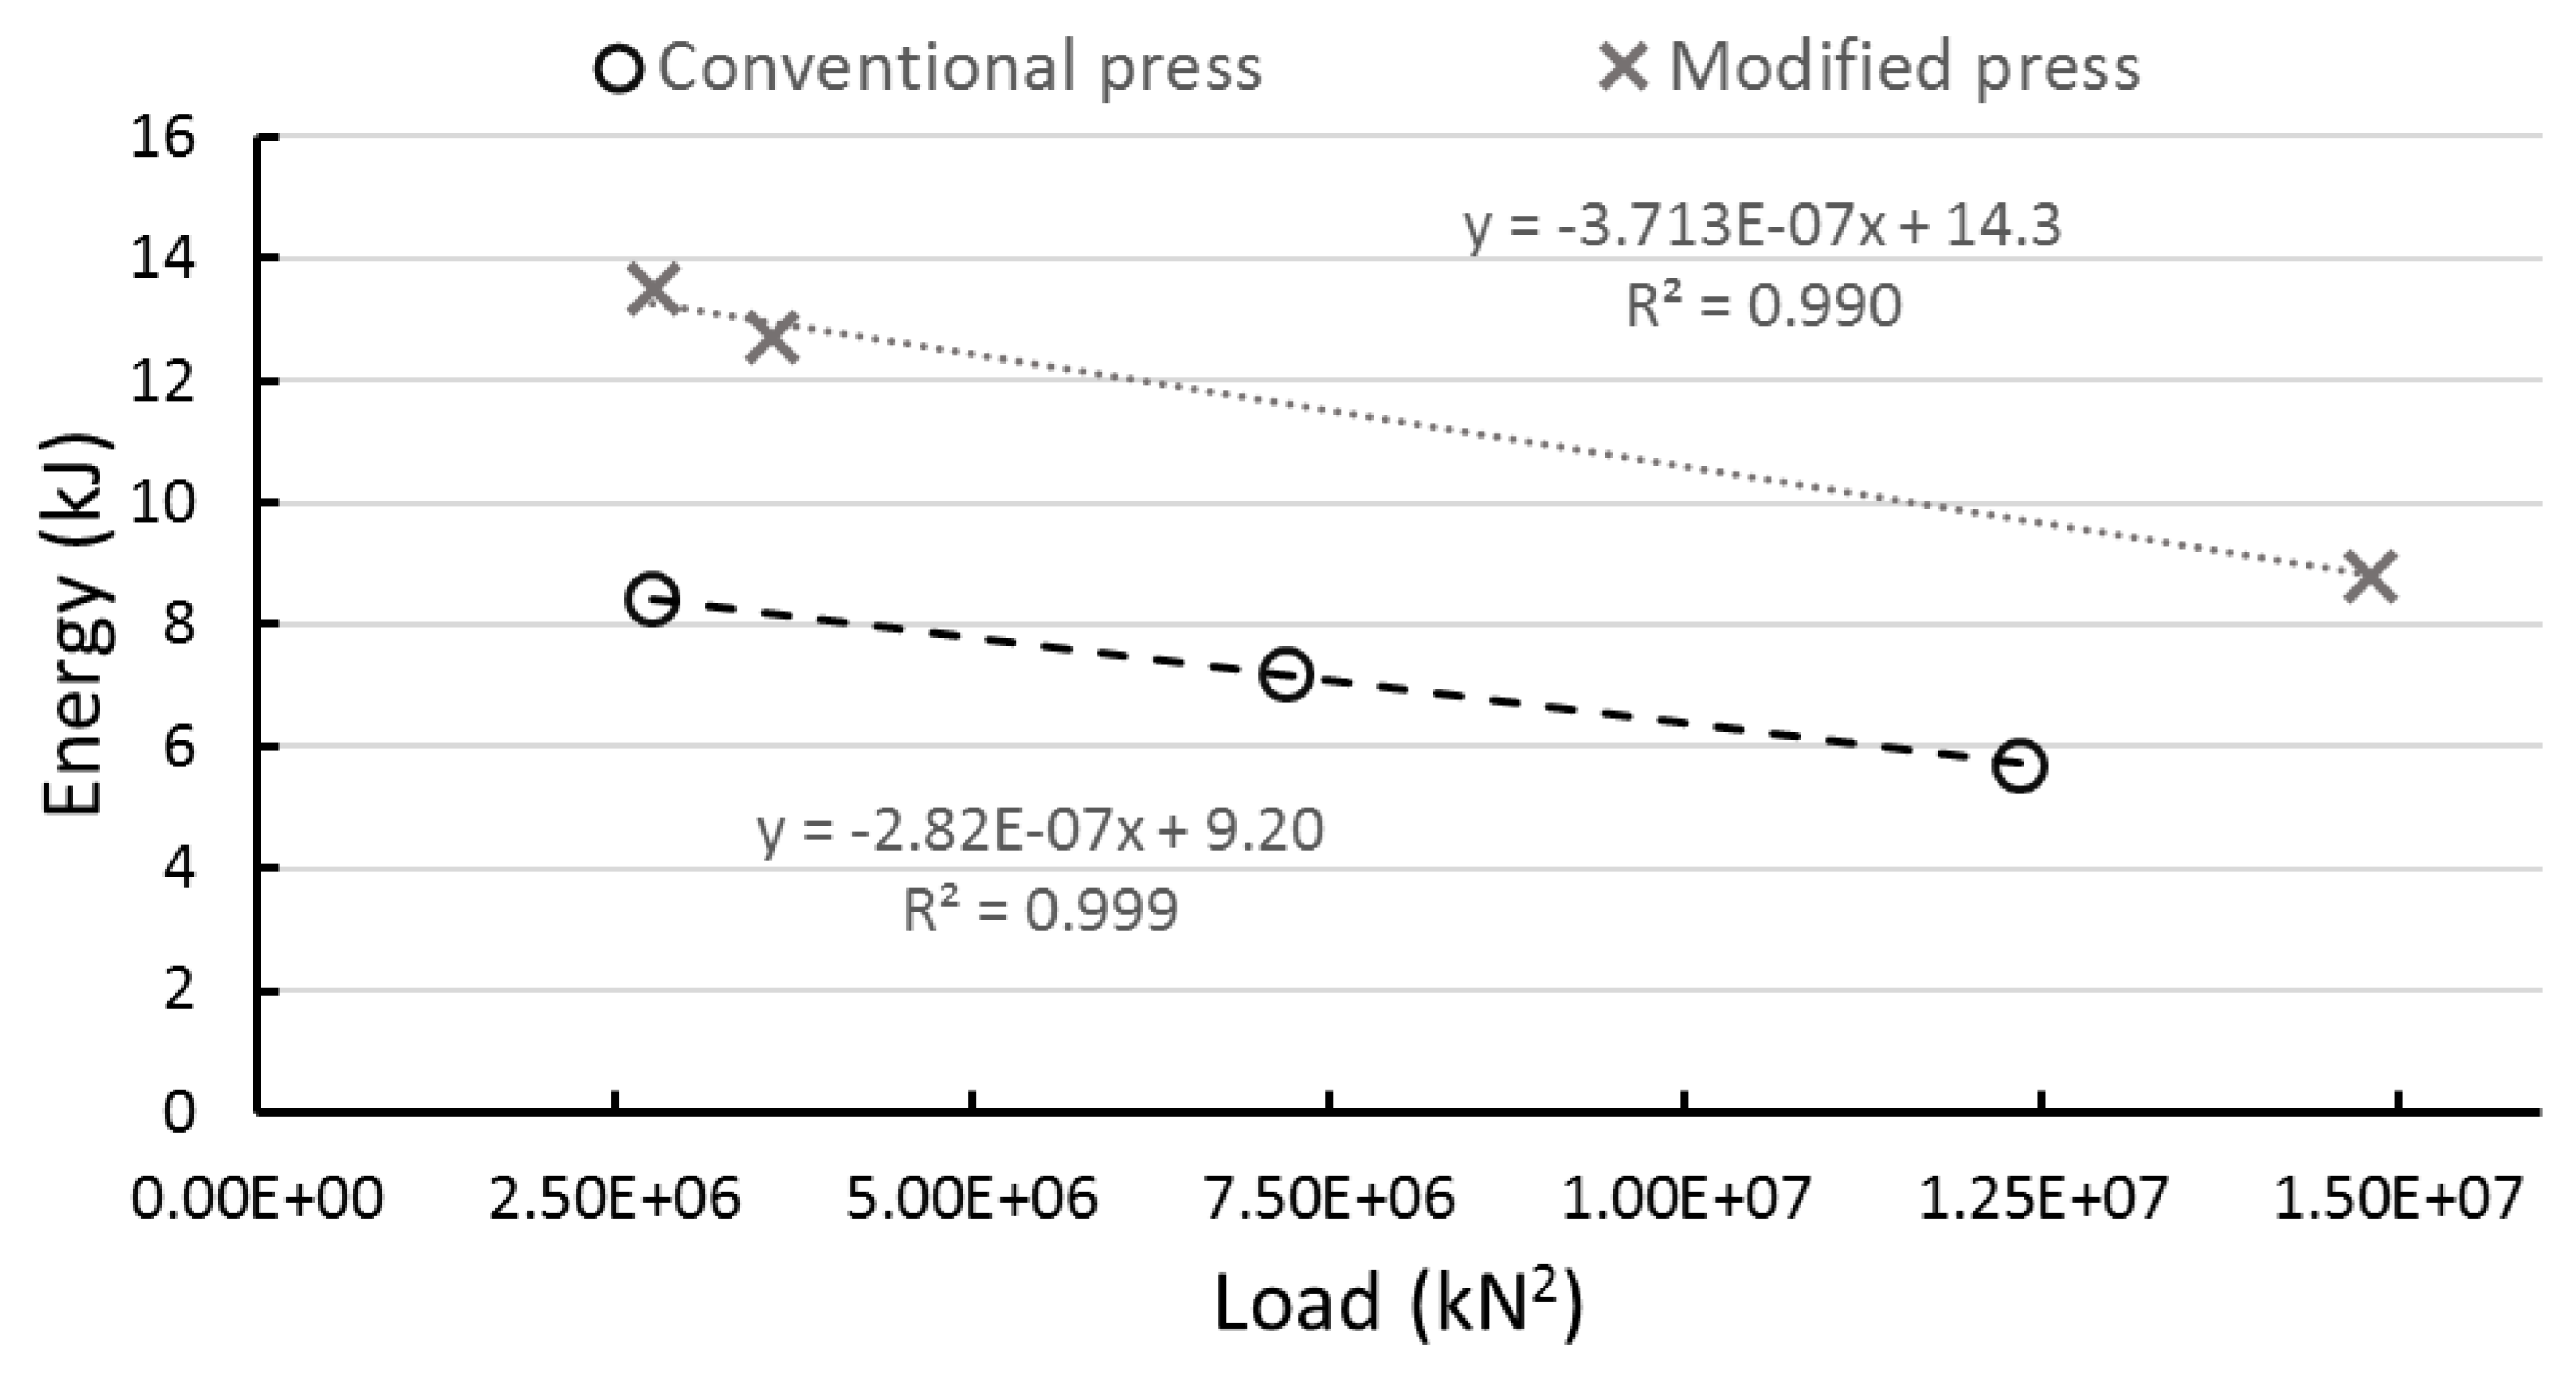
The stiffness tendency was evaluated by assuming only the 3 highest load values, as is shown in Figure 7, to guarantee a proper linear approximation. Table 5 exhibits the stiffness values of the frame and the total energy of the conventional and modified press. An increase of 51% of the gross energy is denoted by comparing the total energy of the as-received press with respect to modified press.
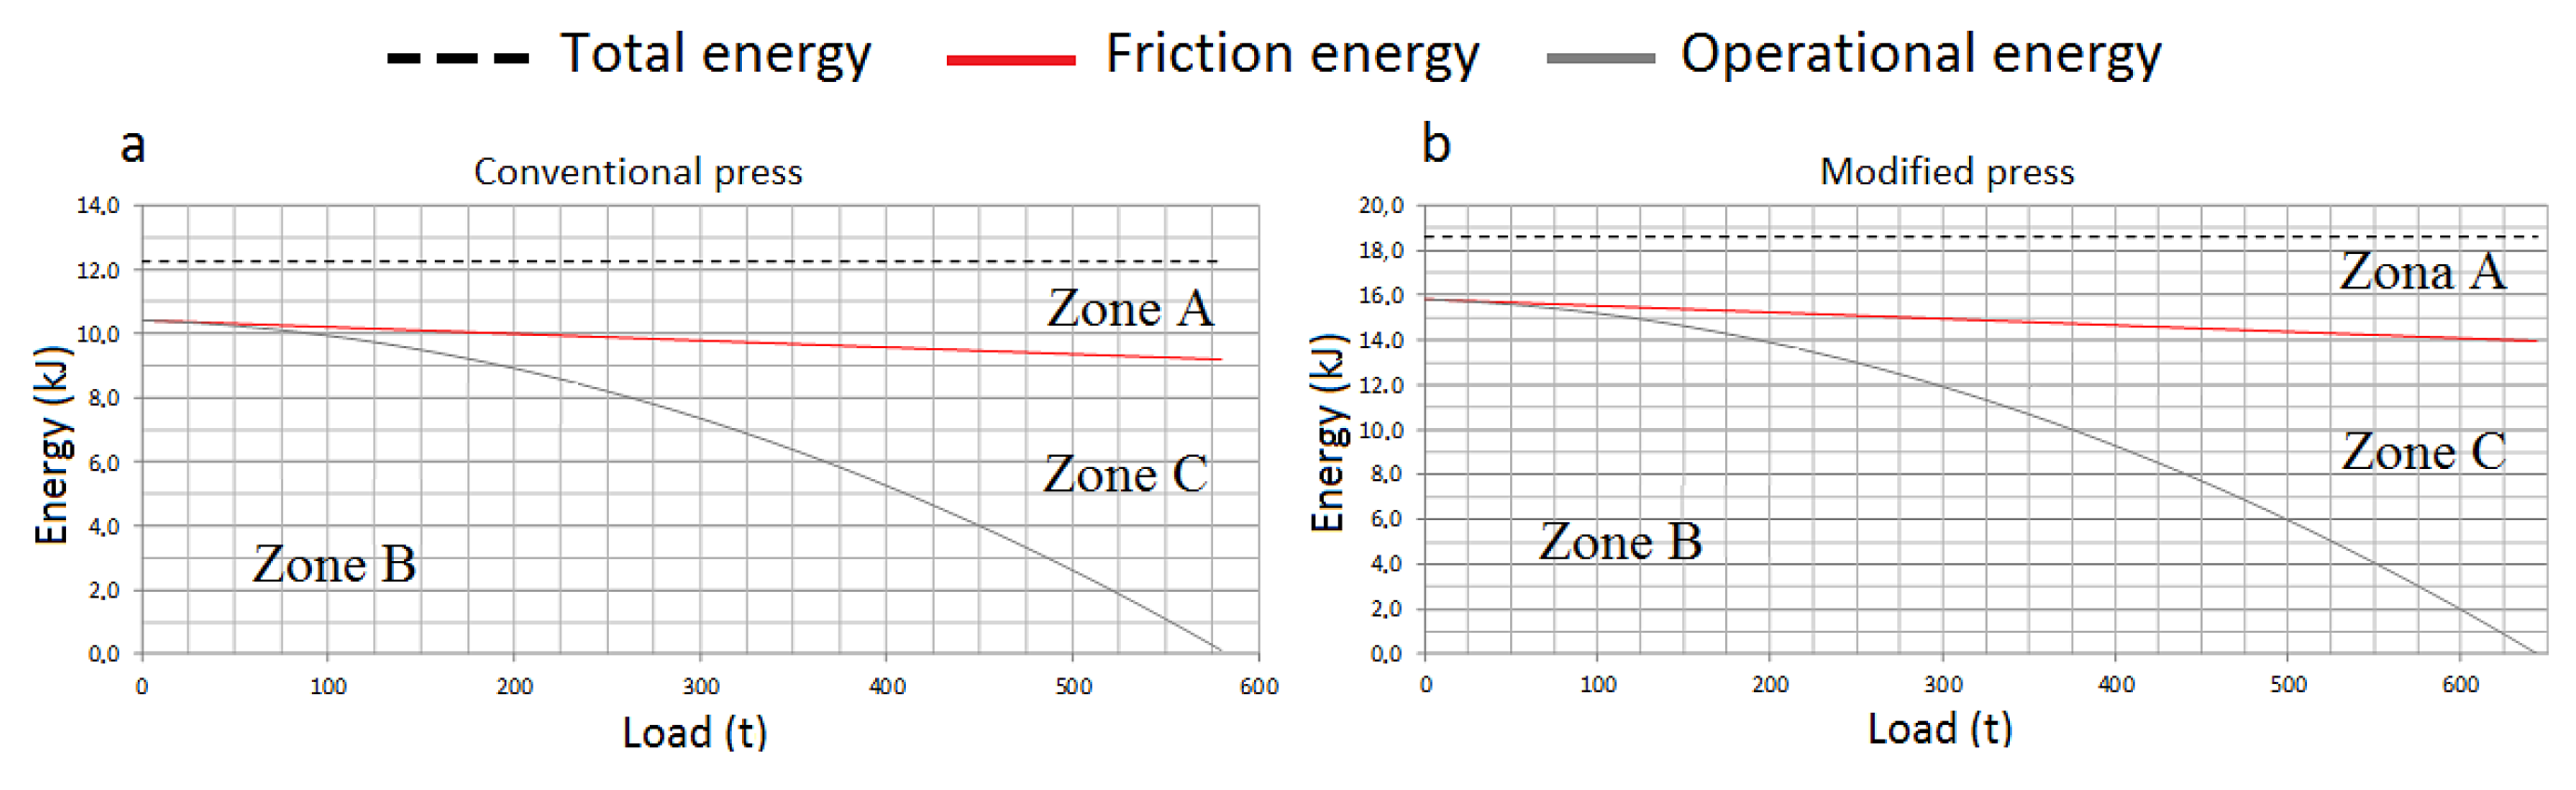
The characteristic diagram of each press allows to identify the energy required to deform the material as a function of the applied load. Therefore, Figure 8 established the operating conditions to deform the specimens without over-demanding the frame and/or the components of the press by reducing the energy absorbed at the impact. The characteristic diagram is divided in 3 different zones delimited by the frictional, operational and total energy curves, in order to address the regions of interest.
Regarding to the operating conditions results, Zone A represents the friction energy losses, the area of this zone is allocated above the friction energy (red line) till the maximum energy capacity (black dashed line). This zone is delimited over the maximum load capacity of the press and, subsequently, cannot satisfactorily forge the specimen. Zone B is represented by the exponential grey line and defined the maximum energy of deformation when the press is forging the specimen using the entire gross energy, therefore, it represents the effective working area of the press. The application of the entire gross available energy is undesirable, because the excess of energy can bring undesired effects such as reduce the lifespan of the machine tools and frame due to excessive press of the specimen’s burr and/or mismatch the thickness in molds without stops, wear of the hammer and molds for matrices with stops and in both cases an excessive rebound of the hammer over the upper plate of the mold. Finally, Zone C is the area allocated between red and grey lines. This zone defines the deformation losses (deflection press energy) of the machine’s frame. It is denoted that, when the necessary load increase, energy is not sufficient to perform a proper forge in a single stroke. In this case, two or more strokes are required, taking into account to limit the energy in the second and the following strokes to avoid the aforementioned undesired situations. Furthermore, the maximum load capacity for the unmodified press is around 580 t, whereas the modified screw press reaches a maximum load capacity of 644 t. Consequently, the maximum load capacity of the modified screw press is enhanced by 11%, thanks to modifications in the drive motor. However, the increase of the maximum load capacity does not imply that the press’s frame can bear such efforts. Particularly, the modified machine reaches higher energy (18.6 kJ) than the conventional press (12.3 kJ), although the increase of the maximum load capacity is not that significant between both machines 644 t over the 580 t. The difference responds to the quadratic increase of the elastic deformation losses, which are function of the load and the lower stiffness values.
In future work, it is considered to implement an small scenario of Industry 4.0 by promoting the computerization of this manufacturing technique. To do that, several devices to monitor crucial parameters for a efficient forging are needed. Particularly, the main idea is to add infrared cameras, load cells and proximity sensors to record some others forging parameters that could interfere during this metal forming process, such as in-plane forces, temperature, flash thickness, structural compliance, springback phenomenon among others. Additionally, other scenarios different that quasi-static regime with a single hammer blow will be assessed to study the machine deflection and the heat energy component contribution when forging bigger geometries. In this sense, a more accurate results and approximations can be withdrawn when this manufacturing process.
4. Conclusions
The present work proposed and validated a economic and rapid method to estimate the nominal forging load in screw friction press based on previous compression tests. In this sense, the relationship between the energy and load capacity in a screw friction presses with different structural modifications is characterized. The main findings can be listed as follow:
- The modified press is able to deliver greater energies compare with the as-received press along the studied range of displacement. Although a proper selection of the forging energy for each configuration is required to avoid overloads and tool wear that will reduce the lifespan of the screw friction press.
- It is recommended the operating conditions to effectively cold-forge specimen quantities from 1 to 12 s without over-demanding the forging press and minimizing the energy absorbed at the hammer’s stroke.
- The proper selection of structural and operational modifications can enhance the machine capability by 51% and 11% of gross available energy and maximum load capacity respectively.
- The possibility to estimate the effective forging load will avoid excessive energy that could promote formation of flash, tool wear and early fracture of structural components of the machine’s frame.
Acknowledgments
This work is supported by the Ministry of Economy and Competitiveness of Spain (reference project: FJCI-2016-29297), Instituto Nacional de Tecnología Industrial (INTI) of Argentina and the Aeronautics Advanced Manufacturing Center (CFAA) of Bilbao.
Author Contributions
Conceptualization: D.O. Martínez Krahmer and L.N. López de Lacalle. Data curation: N. Deferrari, G.R. Abate and A.J. Sánchez Egea. Formal analysis: A.J. Sánchez Egea, D.O. Martínez Krahmer and L.N. López de Lacalle. Funding acquisition: D.O. Martínez Krahmer, A.J. Sánchez Egea and L.N. López de Lacalle. Methodology: G.R. Abate, N. Deferrari and D.O. Martínez Krahmer. Software: N. Deferrari, D.O. Martínez Krahmer and A.J. Sánchez Egea. Supervision: D.O. Martínez Krahmer and L.N. López de Lacalle. Validation: N. Deferrari and A.J. Sánchez Egea. Writing original draft: N. Deferrari, G.R. Abate and A.J. Sánchez Egea. Writing, review and editing: D.O. Martínez Krahmer and L.N. López de Lacalle.
Conflicts of Interest
All the authors who sign this manuscript do not have any conflict of interest to declare.
References
- Black, J.T.; Kohser, R.A. DeGarmo’s Materials and Processes in Manufacturing, 11th ed.; John Wiley and Son: Hoboken, NJ, USA, 2011; ISBN 0470924675. [Google Scholar]
- Radev, R.H.; Tomov, B. Preform design in hot die forging. In Proceedings of the 11th International Scientific Conference on Achievements in Mechanical and Materials Engineering, Gliwice-Zakopane, Poland, 9–12 September 2002; pp. 451–454. [Google Scholar]
- Buijk, A.; Sehgal, H. Simulation based optimization of a hot forging process to avoid a lap using Simufact Forming. In Proceedings of the Congreso 30th SENAFOR, Porto Alegre, Brasil, 10 October 2010. [Google Scholar] [CrossRef]
- Magalhaes, F. Simulaçao numérica da evoluçao de defeitos superficiais durante o processo de recalcamento a frío. In Proceedings of the Anais do Congresso 31th SENAFOR, Porto Alegre, Brasil, 16 December 2011. [Google Scholar]
- Egea, A.J.S.; Rojas, H.A.G.; Celentano, D.J.; Perió, J.J.; Cao, J. Thermomechanical analysis of an electrically assisted wire drawing process. J. Manuf. Sci. Eng. 2017, 139, 111017. [Google Scholar] [CrossRef]
- Radev, R. Numerical investigations regarding necessity of preforming steps for hot closed die forging of axisymmetrical parts. J. Technol. Plast. 2013, 38, 125–130. [Google Scholar]
- Abate, G.; Pérez, D.; Riu, F.A.; Martinez Krahmer, D. Application of numerical simulation to reduce the flash of a hot forged automotive piece. In Proceedings of the PANACM 2015 International Congress, Buenos Aires, Argentina, 27–29 April 2015. [Google Scholar]
- Abachi, S.; Akkok, M.; Gökler, M.I. Wear analysis of hot forging dies. Tribol. Int. 2010, 43, 467–473. [Google Scholar] [CrossRef]
- Bayramoglu, M.; Polat, H.; Geren, N. Cost and performance evaluation of different surface treated dies for hot forging process. J. Mater. Process. Technol. 2008, 205, 394–403. [Google Scholar] [CrossRef]
- Kocanda, A.; Czyewski, P. Experimental and numerical analysis of side forces in a forging die. J. Mech. Eng. 2008, 54, 274–279. [Google Scholar]
- Shahriari, D.; Amiri, A.; Sadeghi, M.H.; Cheraghzadeh, M. Optimal Closed Die Finish Forgings for Nimonic80—A alloy Using FEM Method. Int. J. Mater. Form. 2008, 1, 29–32. [Google Scholar] [CrossRef]
- Kocanda, A.; Czyzewski, P.; Mehdib, K.H. Numerical analysis of lateral forces in a die for turbine blade forging. Arch. Civil Mech. Eng. 2009, 9, 49–54. [Google Scholar] [CrossRef]
- Strasser, H.E. Optimizacao do Processo de Forjamento através de Análise Termográfica. In Proceedings of the 15 th International Forging Conference, SENAFOR, Porto Alegre, Brazil, 5–7 October 2011. [Google Scholar]
- Israr Equbal, M.; Kumar, R.; Shamim, M.; Ohdar, R.K. A grey-based Taguchi method to optimize hot forging process. Procedia Mater. Sci. 2014, 6, 1495–1504. [Google Scholar] [CrossRef]
- Egea, A.J.S.; Rojas, H.A.G.; Celentano, D.J.; Travieso-Rodríguez, J.A.; i Fuentes, J.L. Electroplasticity-assisted bottom bending process. J. Mater. Process. Technol. 2014, 214, 2261–2267. [Google Scholar] [CrossRef]
- Abate, G.; Deferrari, N.; Martinez Krahmer, D.O. Influence of Six Process Variables in a Forged Oil Piping Flange-DOE Analysis, using SIMUFACT Forming. In Proceedings of the Anales del Congresso 37th SENAFOR, Porto Alegre, Brasil, 4–6 October 2017. [Google Scholar]
- Del Pozo, D.; López de Lacalle, L.N.; López, J.M.; Hernández, A. Prediction of press/die deformation for an accurate manufacturing of drawing dies. Int. J. Adv. Manuf. Technol. 2008, 37, 649–656. [Google Scholar] [CrossRef]
- Simoes, D.; Moraes, A.; Schaeffer, L. Simulación Numérica na Predição de Carga de Conformação; Revista Forge: São Paulo, Brazil, 2010. [Google Scholar]
- Krusic, V.; Arentoft, M.; Masera, S.; Pristovsek, A.; Rodica, T. A combined approach to determine workpiece-tool-press deflections and tool loads in multistage cold forging. J. Mater. Process. Technol. 2011, 211, 35–42. [Google Scholar] [CrossRef]
- Zeng, Q.; Jiang, P.; Ren, X. Forging force analysis of truck knuckle and selection of forging equipment. Procedia Eng. 2014, 81, 450–455. [Google Scholar] [CrossRef]
- Altan, T.; Ngaile, G.; Shen, G. Cold and Hot Forging: Fundamentals and Applications; ASM International: Almere, The Netherlands, 2004; ISBN 978-0-87170-805-2. [Google Scholar]
- Jarfors, A.E.W.; Castagne, S.J.; Danno, A.; Zhang, X. Tool wear and life span variations in cold forming operations and their implications in microforming. Technologies 2017, 5, 450–455. [Google Scholar] [CrossRef]
Figure 1.
Experimental and numerical approximation of the compression tests.

Figure 2.
Feed rate estimation of the hammer by linear regression.

Figure 3.
Test configurations for the screw friction press and the pattern symmetry configuration of different specimens quantity.
Figure 3.
Test configurations for the screw friction press and the pattern symmetry configuration of different specimens quantity.
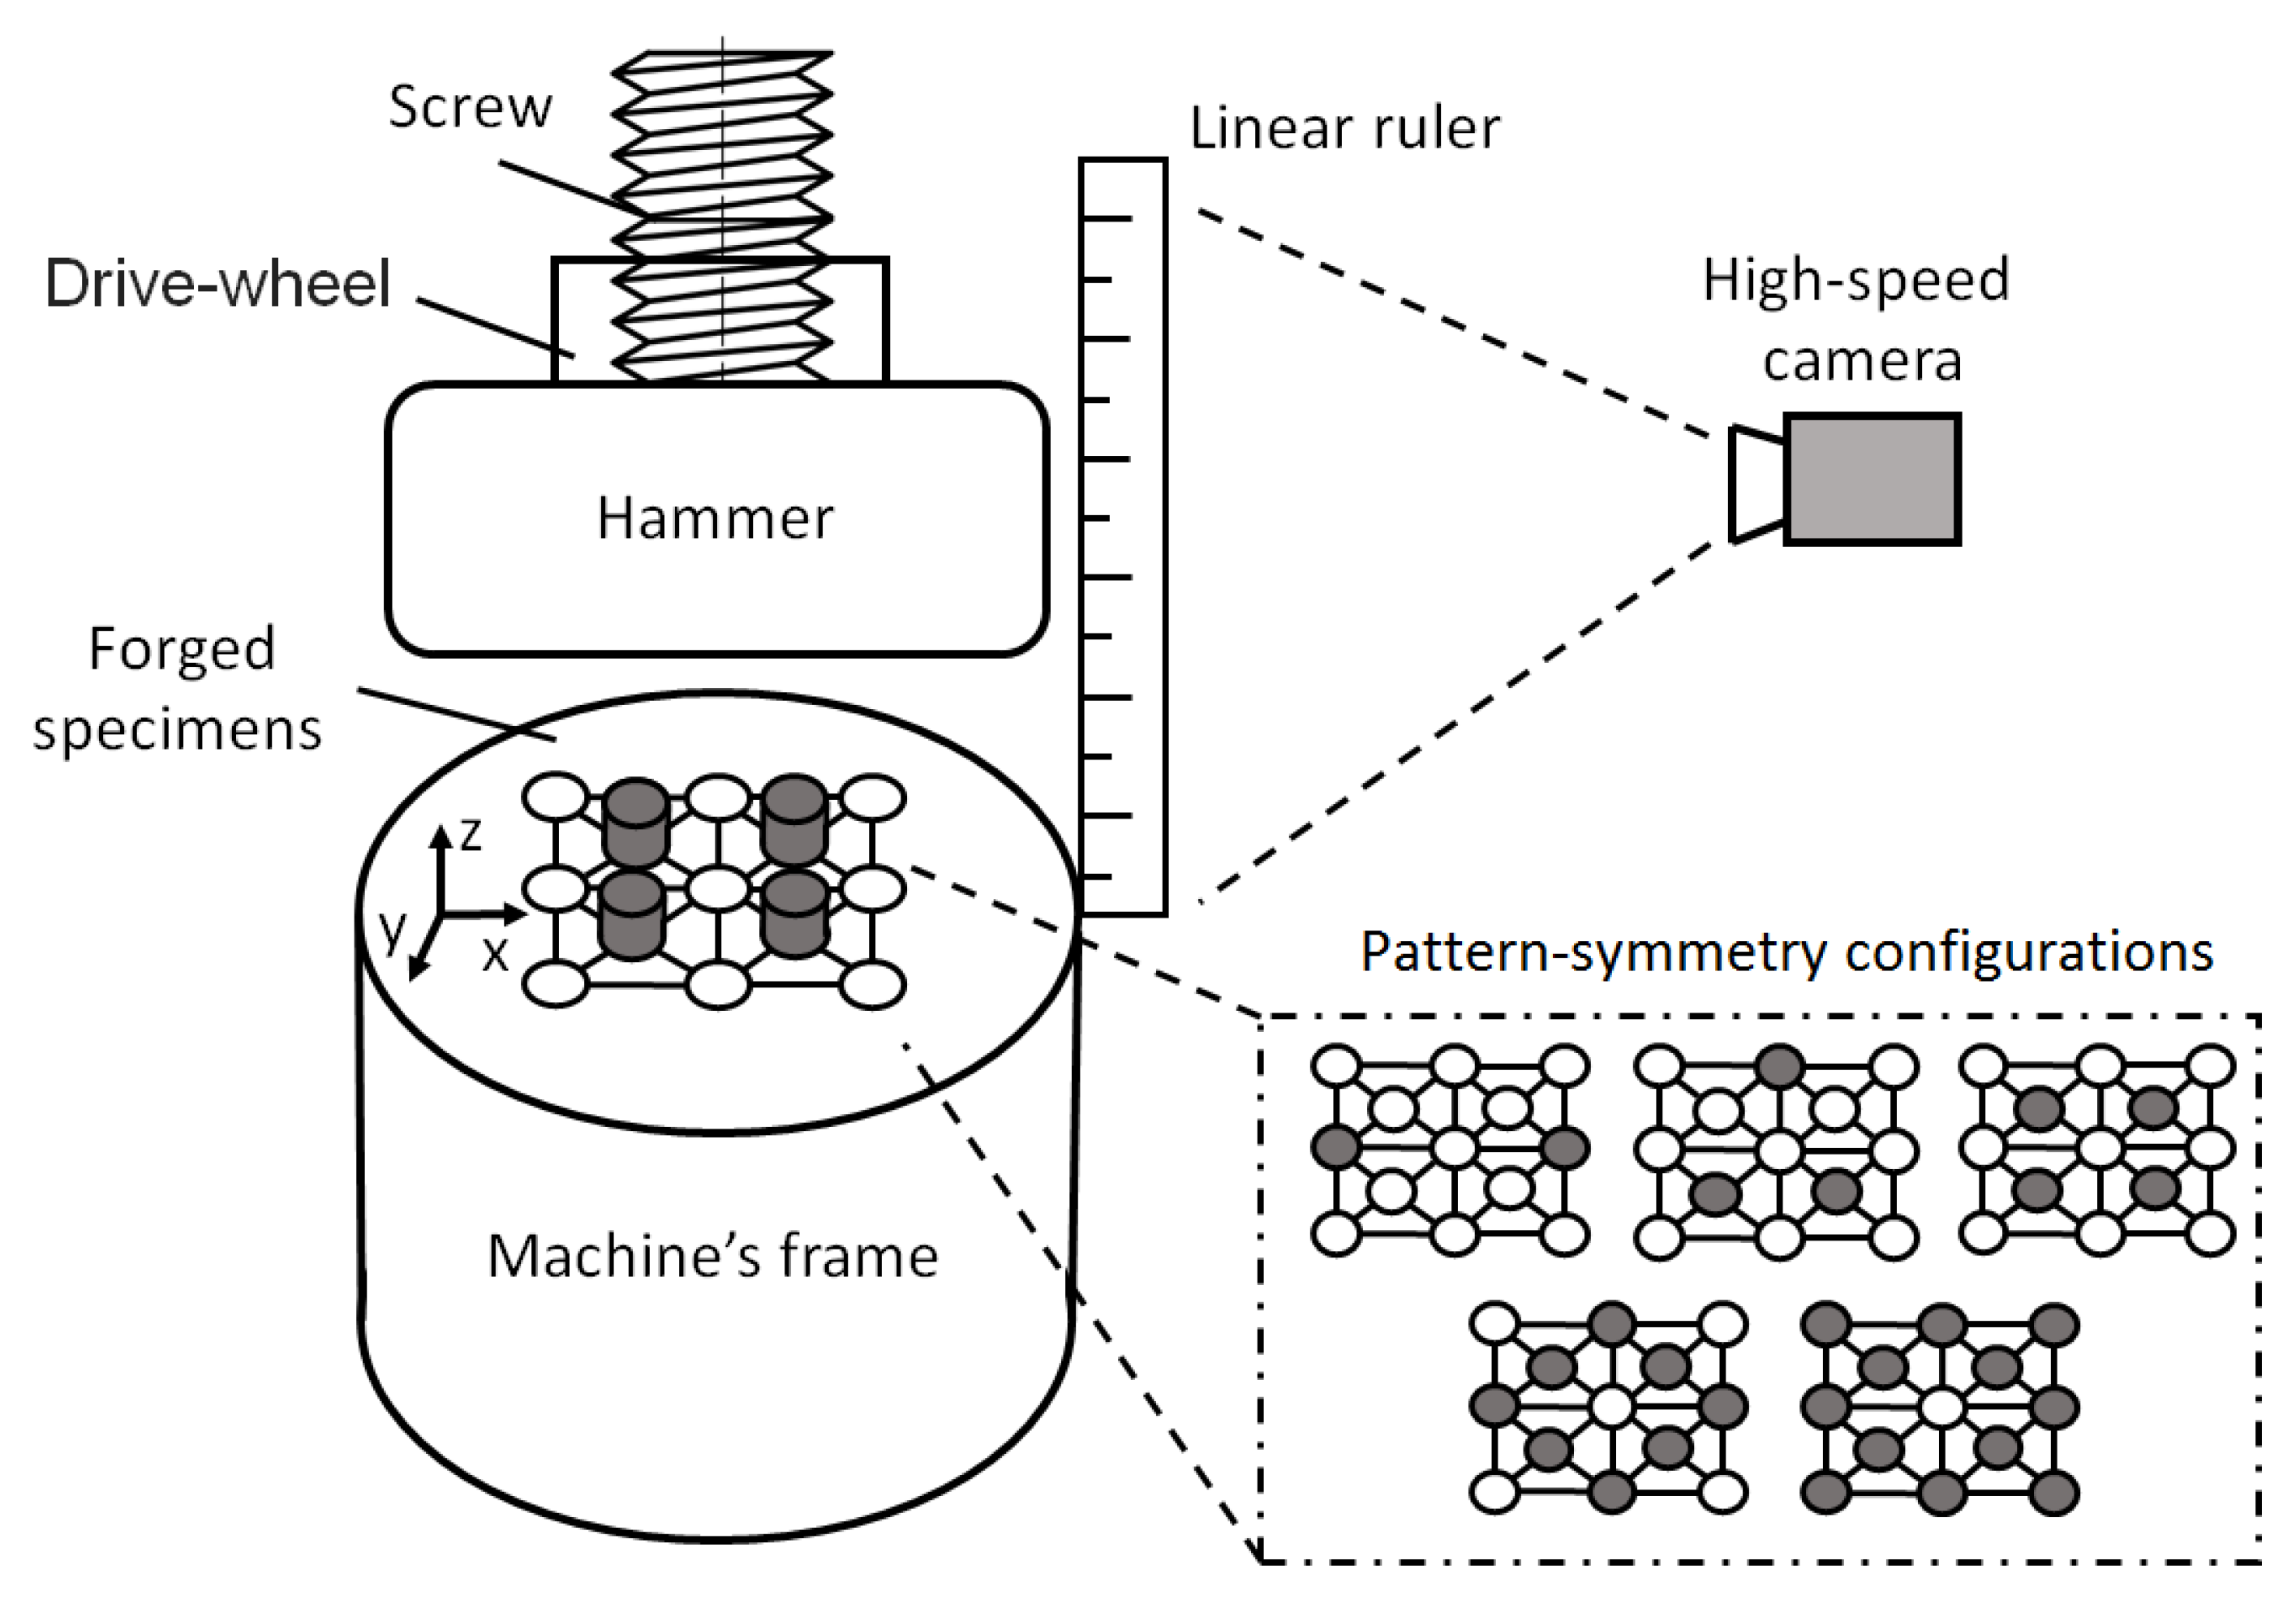
Figure 4.
In-situ cold-forging experiments with different pattern-symmetry configurations and specimens quantity.
Figure 4.
In-situ cold-forging experiments with different pattern-symmetry configurations and specimens quantity.

Figure 5.
Compression load distribution regarding to the degree of deformation for different number of specimens.
Figure 5.
Compression load distribution regarding to the degree of deformation for different number of specimens.
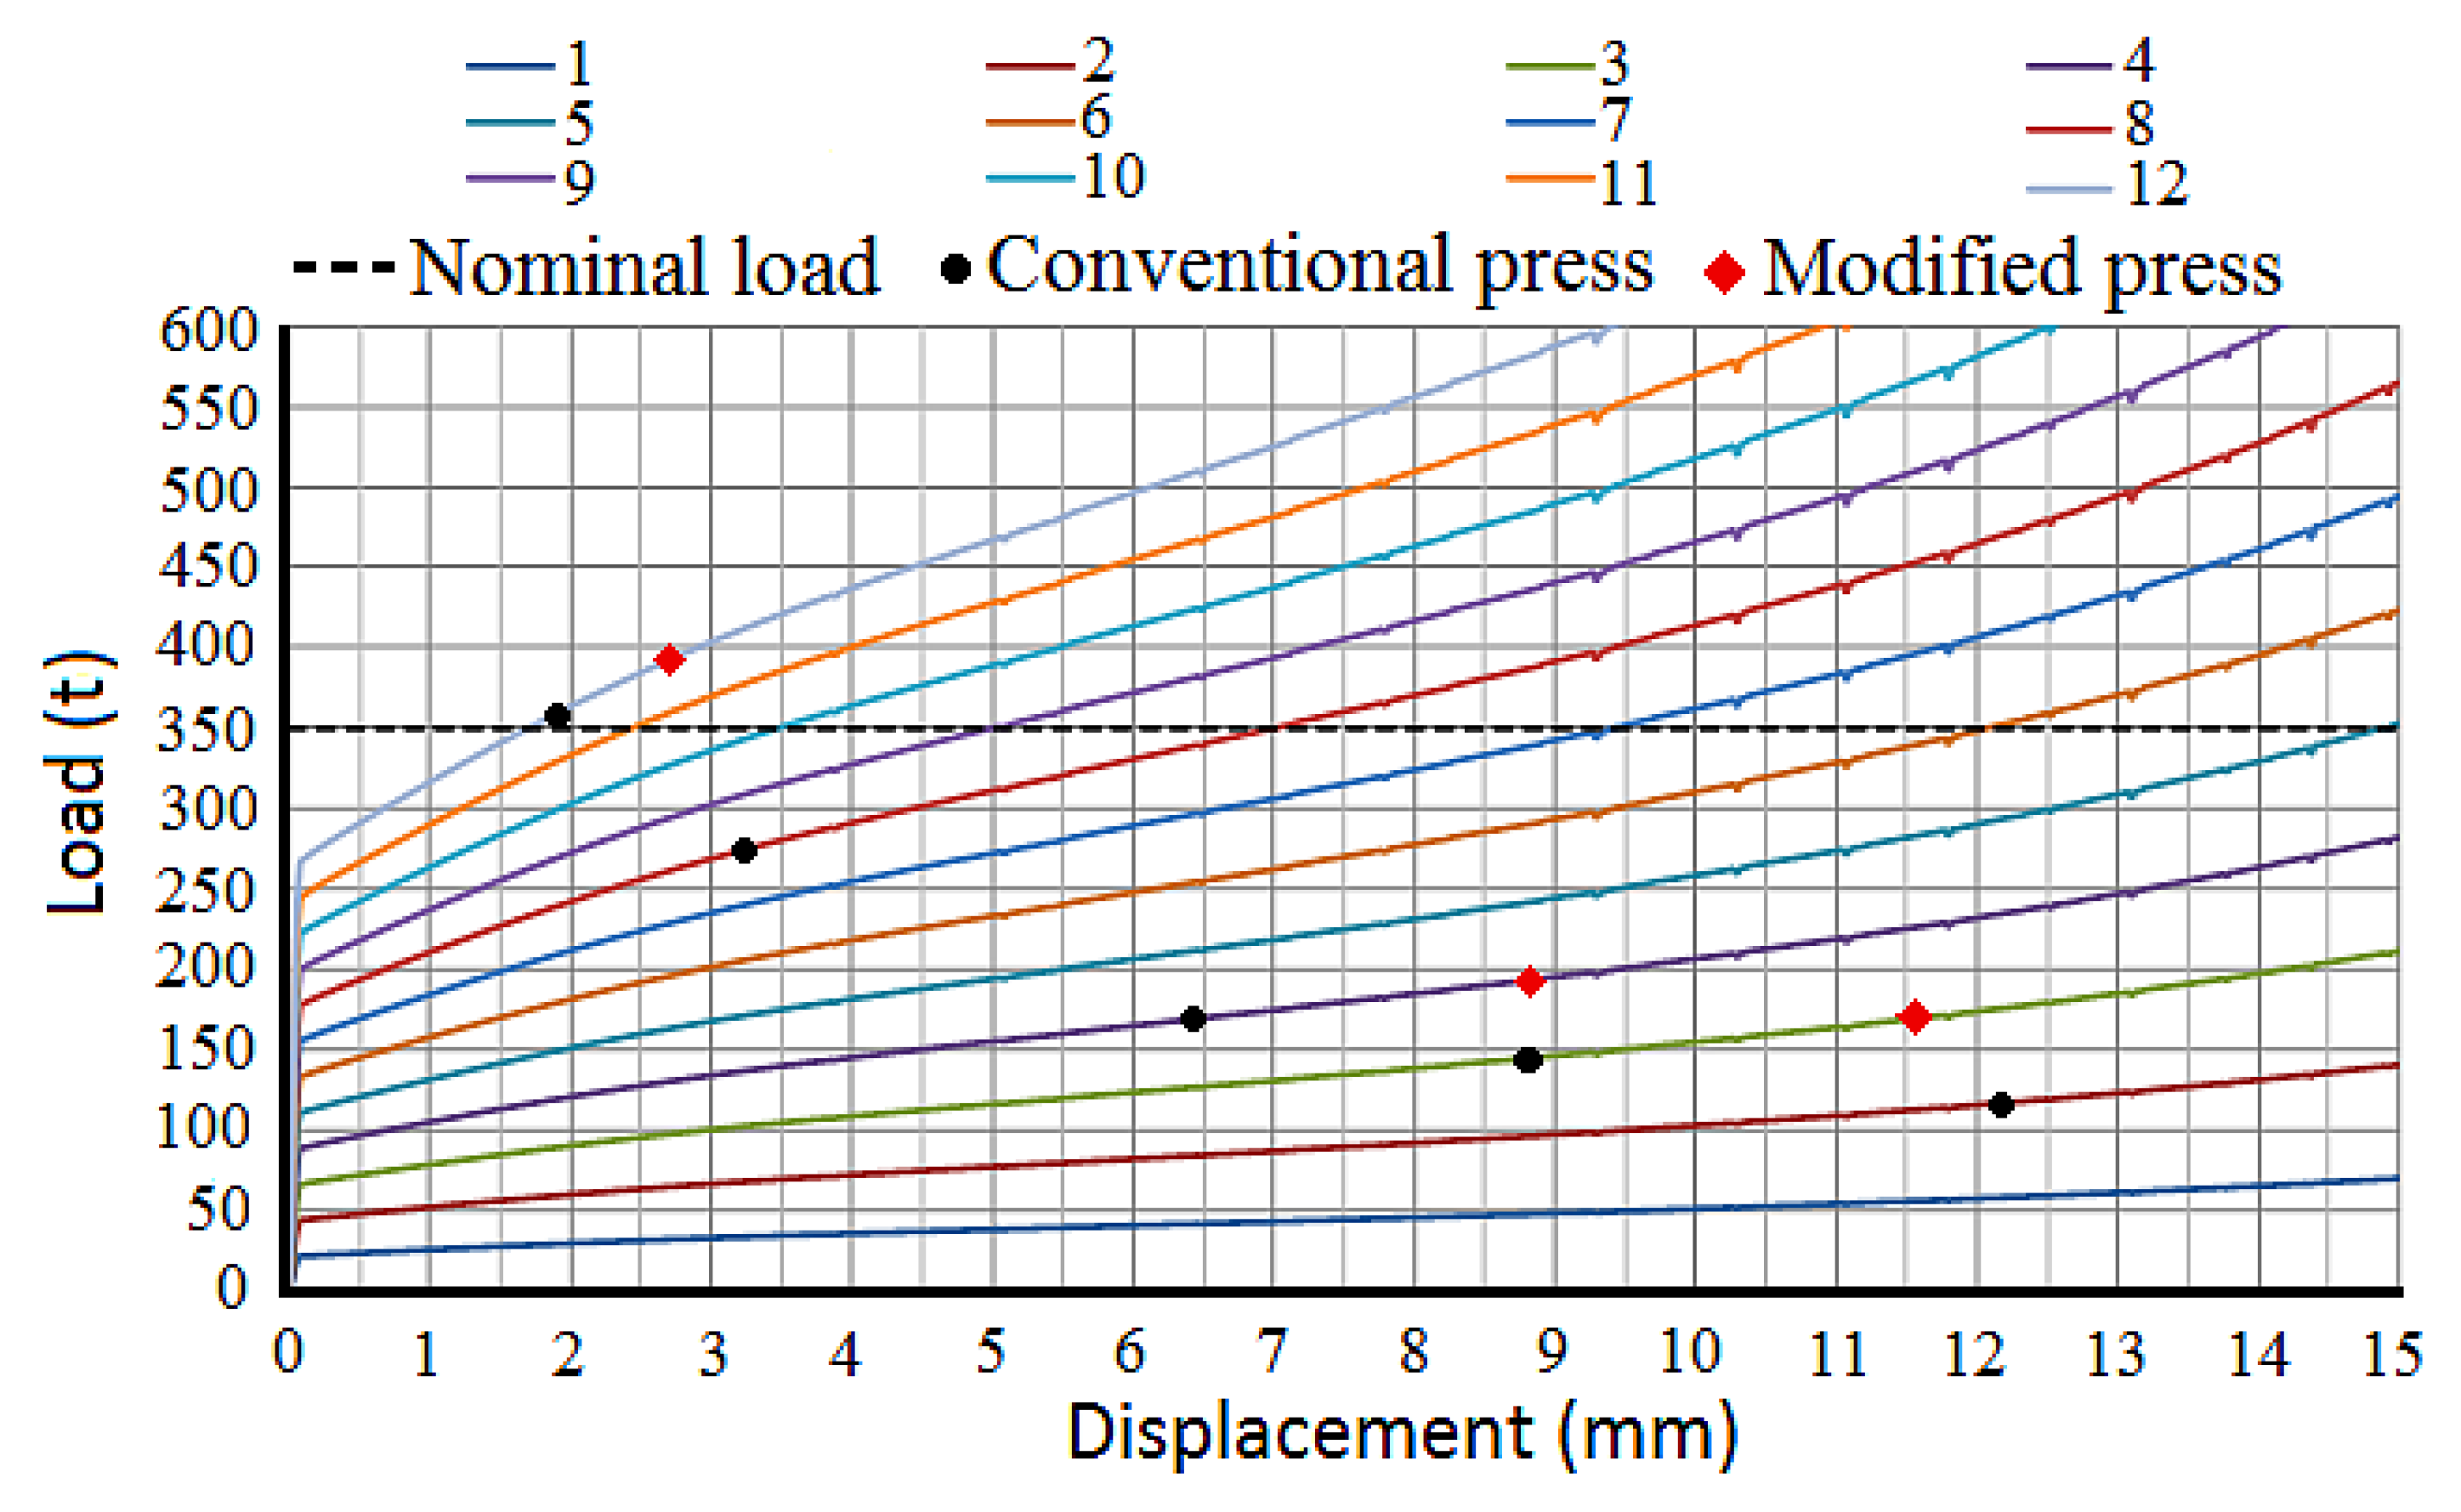
Figure 6.
Energy distribution regarding to the degree of deformation for different number of specimens.
Figure 6.
Energy distribution regarding to the degree of deformation for different number of specimens.

Figure 7.
Adjustment of the stiffness for the conventional and the modified presses.

Figure 8.
Operating conditions to deform the specimens at the conventional (a) and the modified (b) presses.
Figure 8.
Operating conditions to deform the specimens at the conventional (a) and the modified (b) presses.

Table 1.
Compression tests in SAE 1010 carbon steel.
| Specimen | Initial Height (mm) | Final Height (mm) | Load (kN) |
|---|---|---|---|
| 1 | 30.0 | 30.0 | 210.1 |
| 2 | 30.0 | 29.6 | 250.4 |
| 3 | 30.0 | 28.5 | 317.9 |
| 4 | 30.0 | 26.1 | 368.2 |
| 5 | 30.0 | 24.9 | 392.7 |
| 6 | 30.0 | 23.7 | 419.2 |
| 7 | 30.0 | 22.3 | 455.5 |
| 8 | 30.0 | 20.6 | 509.0 |
| 9 | 30.0 | 19.4 | 542.5 |
| 10 | 30.0 | 16.3 | 680.2 |
Table 2.
Feed rate of the hammer at different z axes positions.
| Measurement 1 | Measurement 2 | Measurement 3 | ||||||
|---|---|---|---|---|---|---|---|---|
| (mm) | Frame | (m/s) | (mm) | Frame | (m/s) | (mm) | Frame | (m/s) |
| 0 | 0 | 0 | 0 | 0 | 0 | 0 | 0 | 0 |
| 12 | 14 | 0.206 | 9.5 | 11 | 0.207 | 10.5 | 8 | 0.315 |
| 20 | 22 | 0.217 | 19.5 | 21 | 0.222 | 21 | 16 | 0.315 |
| 32.5 | 33 | 0.235 | 29.5 | 29 | 0.242 | 31 | 23 | 0.322 |
| 40 | 39 | 0.246 | 39.5 | 37 | 0.256 | 41.5 | 31 | 0.322 |
| 48.5 | 45 | 0.258 | 50 | 45 | 0.268 | 52 | 38 | 0.327 |
| 55 | 50 | 0.266 | 59.5 | 52 | 0.278 | 61 | 44 | 0.332 |
| 62 | 55 | 0.274 | 71 | 60 | 0.287 | 71 | 51 | 0.334 |
| 69 | 60 | 0.280 | 79 | 66 | 0.294 | 82 | 58 | 0.338 |
| 72 | 62 | 0.285 | 90 | 73 | 0.301 | 90.5 | 64 | 0.341 |
| - | - | - | 96 | 77 | 0.306 | 101 | 70 | 0.345 |
| - | - | - | - | - | - | 113 | 77 | 0.350 |
| v = 0.327 m/s | v = 0.340 m/s | v = 0.350 m/s | ||||||
| Average velocity = 0.339 ± 0.006 m/s | ||||||||
Table 3.
Characteristic of the conventional and modified screw friction presses.
| Parameter | Conventional Press | Modified Press |
|---|---|---|
| Moment of inertia (kg·m) | 205.6 | 205.6 |
| Hammer linear velocity (m/s) | 0.270 | 0.339 |
| Screw’s lead (mm/rev) | 155 | 155 |
| Rotational speed (rpm) | 104.5 | 131.2 |
| Angular velocity of rotation (rad/s) | 10.94 | 13.74 |
| Steering wheel rotational energy (kJ) | 12.34 | 19.45 |
| Screw rotation energy (kJ) | 0.17 | 0.26 |
| Press translational energy (kJ) | 0.06 | 0.09 |
| Total energy (kJ) | 12.57 | 19.80 |
Table 4.
Forging loads and energy in different symmetry configurations and specimen quantity of SAE 1010.
Table 4.
Forging loads and energy in different symmetry configurations and specimen quantity of SAE 1010.
| As-Received Press | Modified Press | |||||||
|---|---|---|---|---|---|---|---|---|
| Specimen | Load | Load | Load | Load | ||||
| Quantity | (mm) | (kJ) | (t) | (kN) | (mm) | (kJ) | (t) | (kN) |
| 2 | 12.17 | 9.8 | 117.3 | 13,216,626.1 | - | - | - | - |
| 3 | 8.81 | 9.5 | 145.1 | 2,021,478.3 | 11.55 | 13.7 | 169.8 | 2,768,620 |
| 4 | 6.42 | 8.4 | 169.5 | 2,758,548.9 | 8.82 | 12.7 | 193.7 | 3,602,799 |
| 8 | 3.21 | 7.2 | 274.1 | 7,213,650.6 | - | - | - | - |
| 12 | 1.89 | 5.7 | 358.4 | 12,337,291.0 | 2.72 | 8.8 | 392.7 | 14,811,568 |
Table 5.
Estimation of the frame stiffness for both screw presses.
| Parameter | As-Received Press | Modified Press |
|---|---|---|
| Slope (E/L) | −2.82 × 10 | −3.71 × 10 |
| Stiffness (kN/m) | 1780438 | 1430335 |
| Stiffness (t/mm) | 181.7 | 146 |
| Total energy (kJ) | 12.3 | 18.6 |
© 2018 by the authors. Licensee MDPI, Basel, Switzerland. This article is an open access article distributed under the terms and conditions of the Creative Commons Attribution (CC BY) license (http://creativecommons.org/licenses/by/4.0/).
Share and Cite
MDPI and ACS Style
Sánchez Egea, A.J.; Deferrari, N.; Abate, G.; Martínez Krahmer, D.; López de Lacalle, L.N. Short-Cut Method to Assess a Gross Available Energy in a Medium-Load Screw Friction Press. Metals 2018, 8, 173. https://doi.org/10.3390/met8030173
AMA Style
Sánchez Egea AJ, Deferrari N, Abate G, Martínez Krahmer D, López de Lacalle LN. Short-Cut Method to Assess a Gross Available Energy in a Medium-Load Screw Friction Press. Metals. 2018; 8(3):173. https://doi.org/10.3390/met8030173
Chicago/Turabian StyleSánchez Egea, A.J., N. Deferrari, G. Abate, D. Martínez Krahmer, and L.N. López de Lacalle. 2018. "Short-Cut Method to Assess a Gross Available Energy in a Medium-Load Screw Friction Press" Metals 8, no. 3: 173. https://doi.org/10.3390/met8030173
Note that from the first issue of 2016, this journal uses article numbers instead of page numbers. See further details here.