1. Introduction
The application of aluminum alloys to automobile structural and body parts has been attractive from the viewpoint of improving vehicle fuel efficiency [
1]. Aluminum alloys, however, have low formability compared to steels at room temperatures and large springback at room temperature, which limit the widespread use of aluminum alloys in the automotive industry and thus have seen limited use for the production of parts with high shape complexity. For many years, hot forming and warm forming methods have been studied and applied to improve the formability of aluminum alloys. Ismail and Mohamed [
2] reviewed various forming techniques applicable to aluminum alloy sheets. Naka et al. [
3] experimentally investigated the effects of temperature and forming speed on the forming limit of 5083 aluminum alloy sheets with fine grains. Kim et al. [
4] showed that aluminum alloy tubes could be produced by hot-gas forming and that failure during forming could be predicted by a fracture criteria based on the Zener-Hollomon parameter. Rashid et al. [
5] proposed the quick plastic forming, which is a method of stretching magnesium-containing aluminum alloy sheets into intricate shapes as required for automotive body panels. Hot forming has an advantage when fabricating aluminum alloys into complicated shapes with sharp corners and small radii. Unlike hot forming, warm forming does not provide high ductility to the materials because its working temperature range (200 to 400 °C) is lower than that for hot forming (400 to 500 °C). However, warm forming offers a higher formability than cold forming. Another advantage of warm forming over cold forming is that flow-stress level of aluminum alloys during forming is lower at warm temperatures, leading to decrease in springback. Laurent et al. [
6] investigated the mechanical behavior of AA5754-O alloys in warm forming conditions and showed that warm temperature reduces a stress gradient in the cup walls leading to a reduction in springback. Kim et al. [
7] used the finite element analysis and design of experiments together to determine the temperature conditions of the warm forming process that can improve the formability of the aluminum sheet. In general, more material and process parameters are involved in a warm forming process than in a cold forming process because the strength of the material depends on temperature and strain rate, and the coefficient of friction between the die and workpiece varies with temperature. Therefore, in order to predict the deformation behavior and forming limit during warm forming, it is necessary to consider these temperature-dependent parameters when performing forming analyses. There are many papers on aluminum alloys regarding this issue. Takuda et al. [
8] performed numerical simulations of warm deep drawing of aluminum alloy sheets and analyzed the forming limit behavior at elevated temperatures. Li and Ghosh [
9] investigated the uniaxial tensile deformation behaviors of aluminum sheet alloys in the warm forming temperature range and found that uniaxial tensile elongation increased with increasing temperature and decreased with increasing strain rate. Abedrabbo et al. [
10] developed a temperature-dependent anisotropic material model to be used in the finite element analysis for 3003 aluminum alloy sheets. Toros et al. [
11] reviewed recent developments in warm forming of aluminum–magnesium alloys such as the effects of temperature and strain rate on formability. However, research on springback in aluminum alloys at warm temperatures is relatively lacking in both experimental and theoretical aspects. Moon et al. [
12] investigated the effects of tool temperature on the springback of a 1015 aluminum alloy. Keum and Han [
13] conducted draw bending tests on 1050 and 5052 aluminum alloy sheets to measure springback at various forming temperatures and showed that springback decreased, especially at forming temperatures above 150 °C. Yanagimoto and Oyamada [
14] conducted a quasi-isothermal forming experiment using the forming dies with a built-in heater aimed at springback-free warm forming of 6016 aluminum alloy sheets. Kim and Koç [
15] investigated the effect of temperature gradients on springback in warm forming of 5754 aluminum alloy sheets using a thermo-mechanically coupled finite element analysis and qualitatively explained the springback behavior based on the stress distribution on the sheet cross-section after forming.
The sheet metal forming process is usually divided into two steps. First, in the forming step, a sheet blank is plastically deformed to a desired shape using a press die. In that type of forming process, the sheet material is subjected to stretching and bending deformation, which results in a significantly non-uniform stress distribution on the sheet cross-section. In the unloading step after completion of forming, all load constraints are removed, and elastic recovery is generated so that the bending moment generated in the forming step becomes zero. The forming process and resulting springback behavior are generally predicted using numerical methods such as FEM (finite element method) due to the nonlinearity of the product shape and material properties. In that case, if the forming analysis is performed using implicit finite element code, it may take a long time to obtain a converged solution due to the severe nonlinearity of the forming process, or a converged solution may not be obtained if convergence is not achieved. For that reason, explicit finite element codes free of convergence problems have been widely applied in forming analyses, even though the accuracies of the results are lower compared to cases using implicit codes. Makinouchi et al. [
16] investigated the state of explicit sheet metal forming finite element codes used in industries in Europe, Japan and the United States. Narasimhan and Lovell [
17] outlined a coupled explicit-to-implicit finite element method for predicting springback deformations in sheet metal forming processes. However, the use of implicit finite element codes is still preferred for most warm forming analyses because implicit finite element codes are more reliable than explicit codes in solving thermo-mechanically coupled problems such as warm forming. On the other hand, implicit codes have been preferentially used for springback analysis. This is because the stress distribution of the sheet cross-section should be calculated accurately to reliably predict the springback behavior of the sheet. For these reasons, it is desirable to use implicit codes for both forming and springback analyses of warm forming. However, this requires a significant amount of computational time and cost. If springback behavior in warm forming can be more easily predicted, the sheet metal forming processes and die design for achieving the desired shape of the products by warm forming can be conducted more efficiently.
In this study, we propose a functional model that can easily estimate the springback behavior of a warm-formed aluminum alloy part using only the results of the forming analysis. U draw bending tests were experimentally carried out under elevated temperature conditions, and springback behavior was examined. We found a correlation between the stress data predicted by the forming analysis and the measured springbacks. Inspired by the observed correlation, we derived a functional model that can predict springback in warm U draw bending. The proposed functional model is advantageous in use because total analysis time and cost can be saved by omitting the springback analysis after warm forming.
3. Results
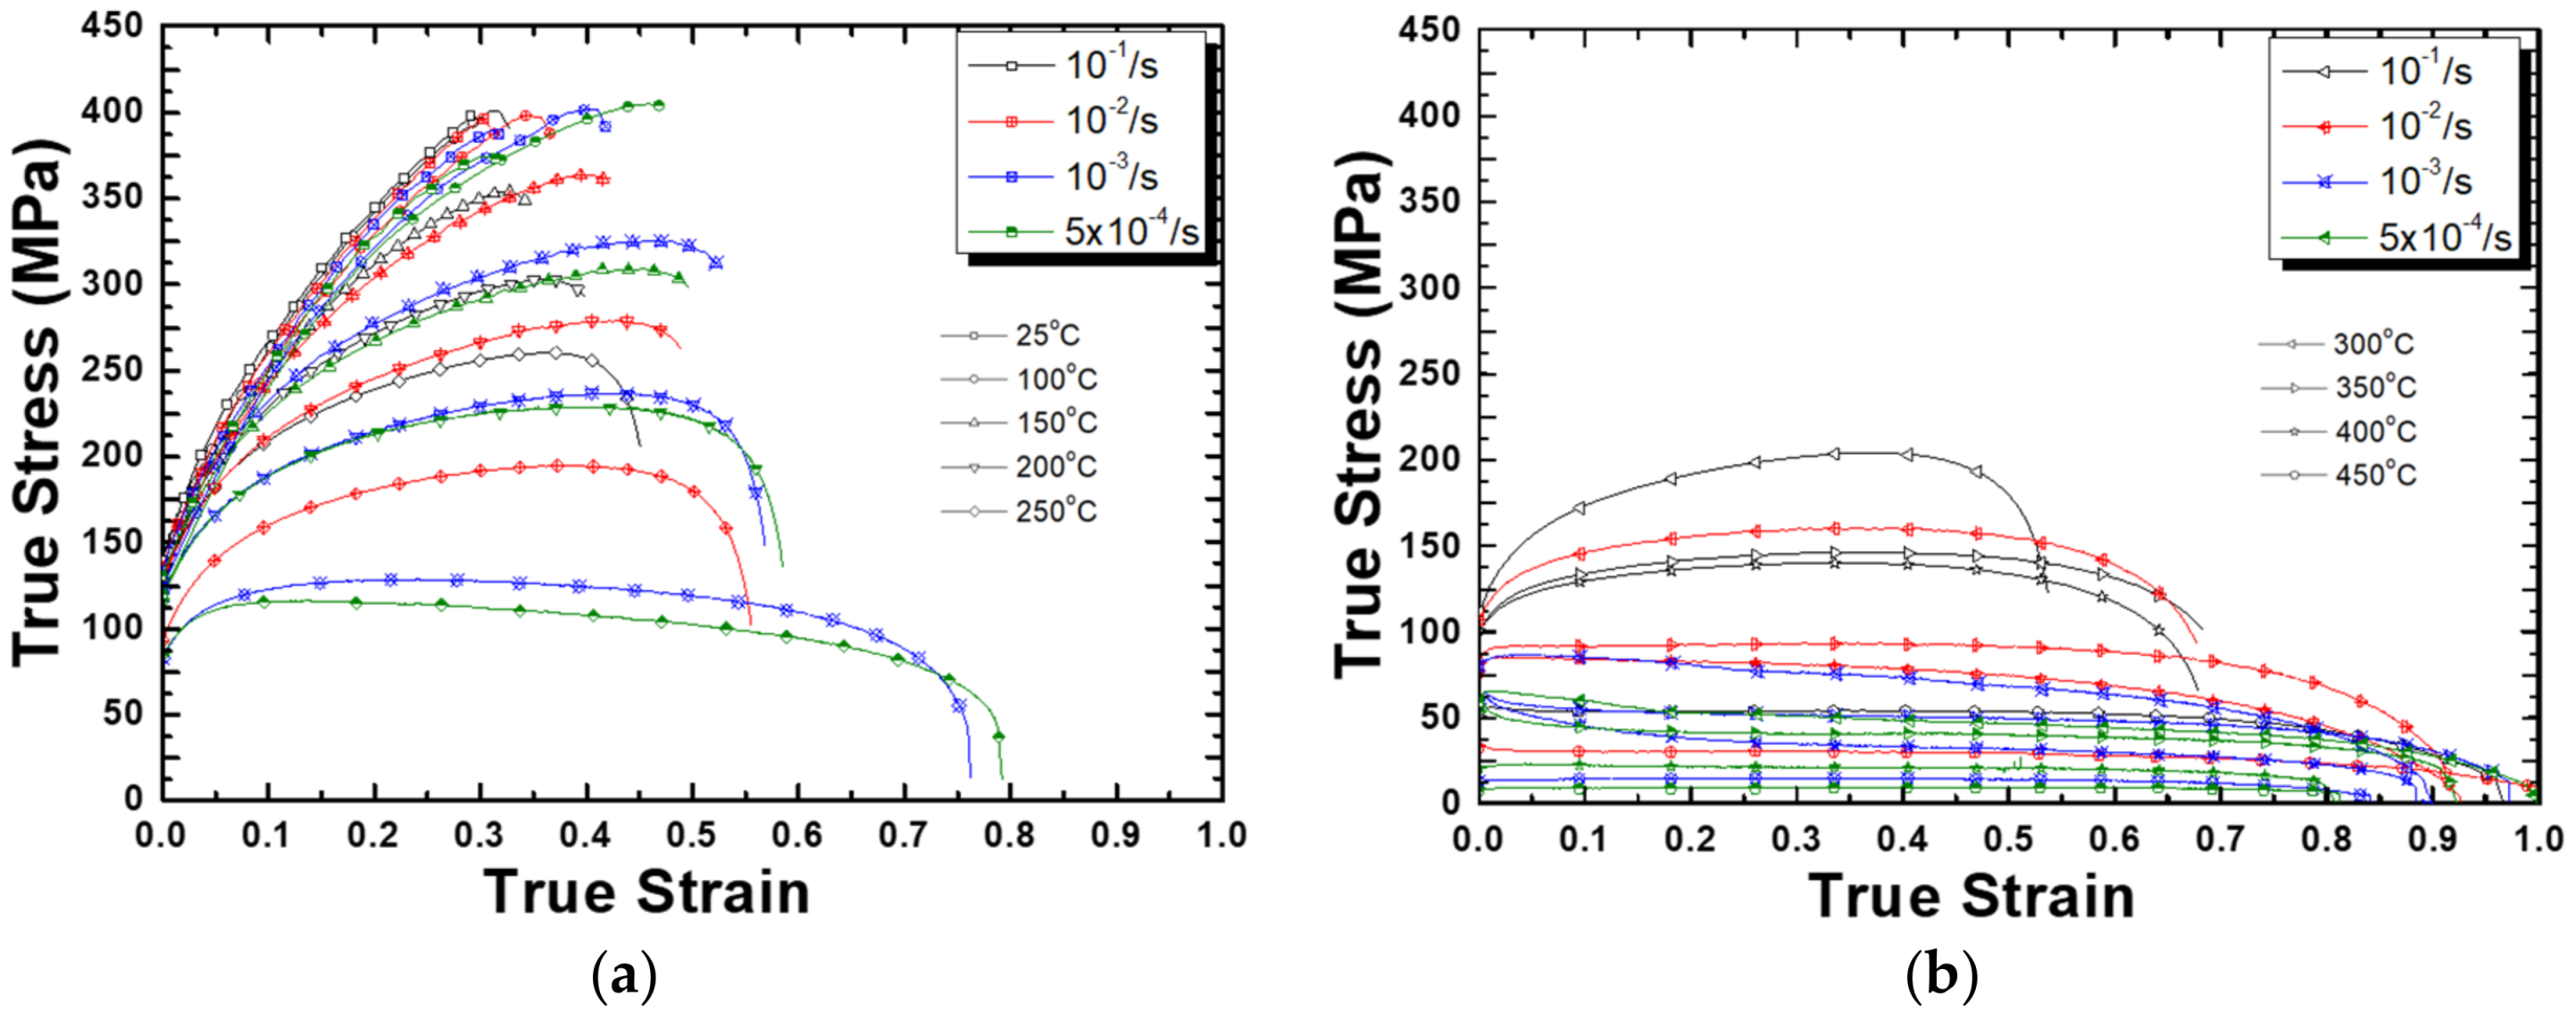
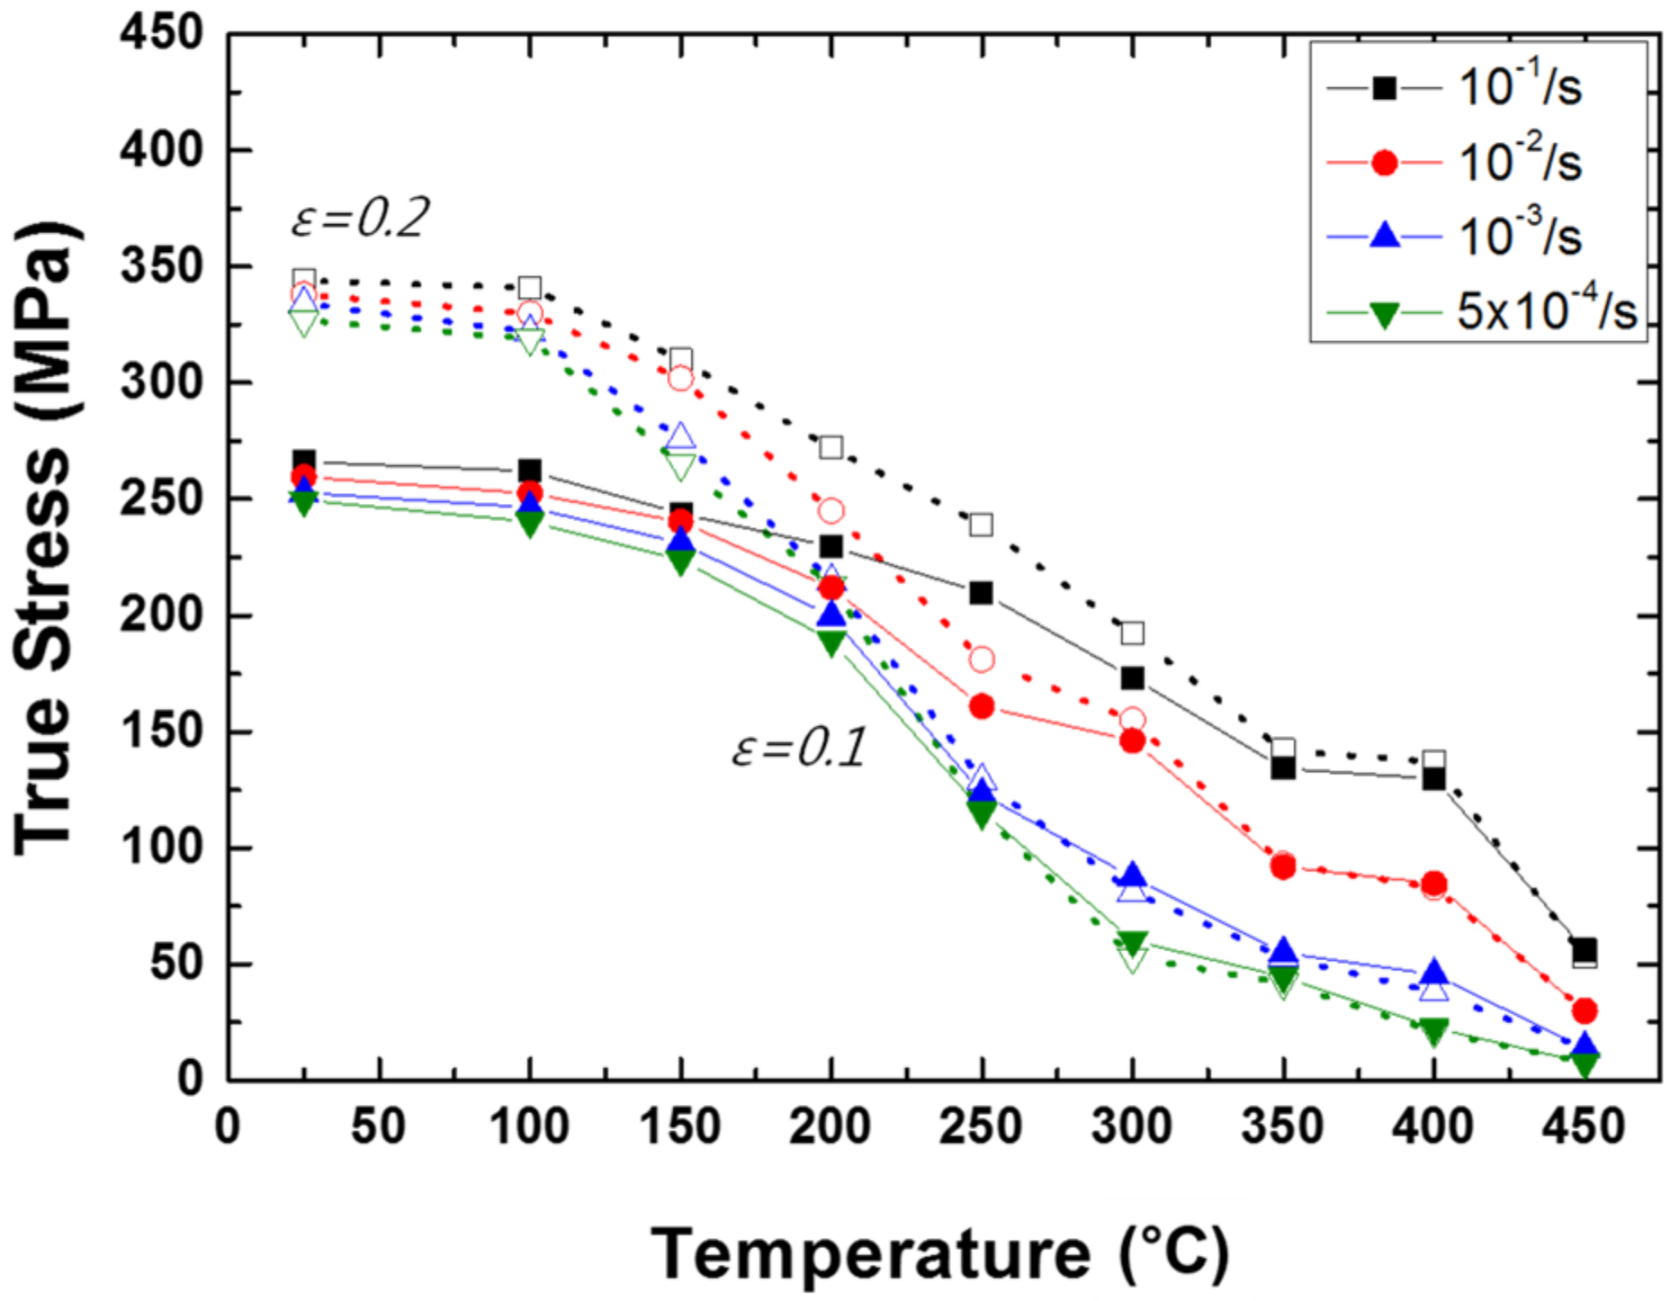
Figure 3 shows the flow stresses of the 5182 alloy as measured from their true stress-true strain curves at two plastic strains of 0.1 and 0.2 as a function of temperature. The flow-stress comparison as a function of temperature was made at strains below 0.2 because at strains above 0.2, fracture occurred at RT. Flow stress decreased with increasing temperature. Flow stress level depended on strain rate. For a given temperature, flow stress increased with increasing strain rate. As temperature increased, the sensitivity of the flow stress to the strain rate increased.
Figure 3 also shows that flow stress depended on strain, at temperatures below 300 °C and at high strain rates. In general, plastic flow stresses of metallic alloys, including aluminum alloys, at constant temperatures can be expressed by [
21]
where σ is the flow stress,
K is a material constant, ε is the strain,
N is the strain hardening exponent,
is the strain rate, and
m is the strain rate sensitivity exponent.
At a given strain, the strain rate,
, can be determined using a relationship of the following form at elevated temperatures [
22]
where
n is the stress exponent (=1/
m),
D is the atomic diffusivity (=
Doexp(−
Q/
RT), where
Do is a pre-exponential factor,
Q is the activation energy for diffusion,
R is the gas constant, and
T is the absolute temperature,
d is the grain size,
p is the grain size exponent, and
A is the material constant. Equation (2) can be rewritten as
where
,
Z is the Zener-Holloman parameter (
Z =
), and
D = DL or
D = Dgb when lattice diffusion (
DL) or grain boundary diffusion (
Dgb) dominate the plastic flow, respectively. The effective diffusion coefficient,
Deff, can be used when both contributions from
DL and
Dgb need to be considered simultaneously, and is defined as [
23]
where
fgb is the fraction of atoms associated with grain boundaries (= πδ
/d, where δ, the width of a grain boundary, is assumed to be 2
b, where
b is the Burger’s vector). In this case, Equation (3) can be modified to
where
Zeff is the effective Zener-Holloman parameter obtained by considering the contributions from both lattice and grain boundary diffusion [
24]. Considering the above, plastic flow stress of an aluminum alloy at elevated temperatures can be generally expressed by
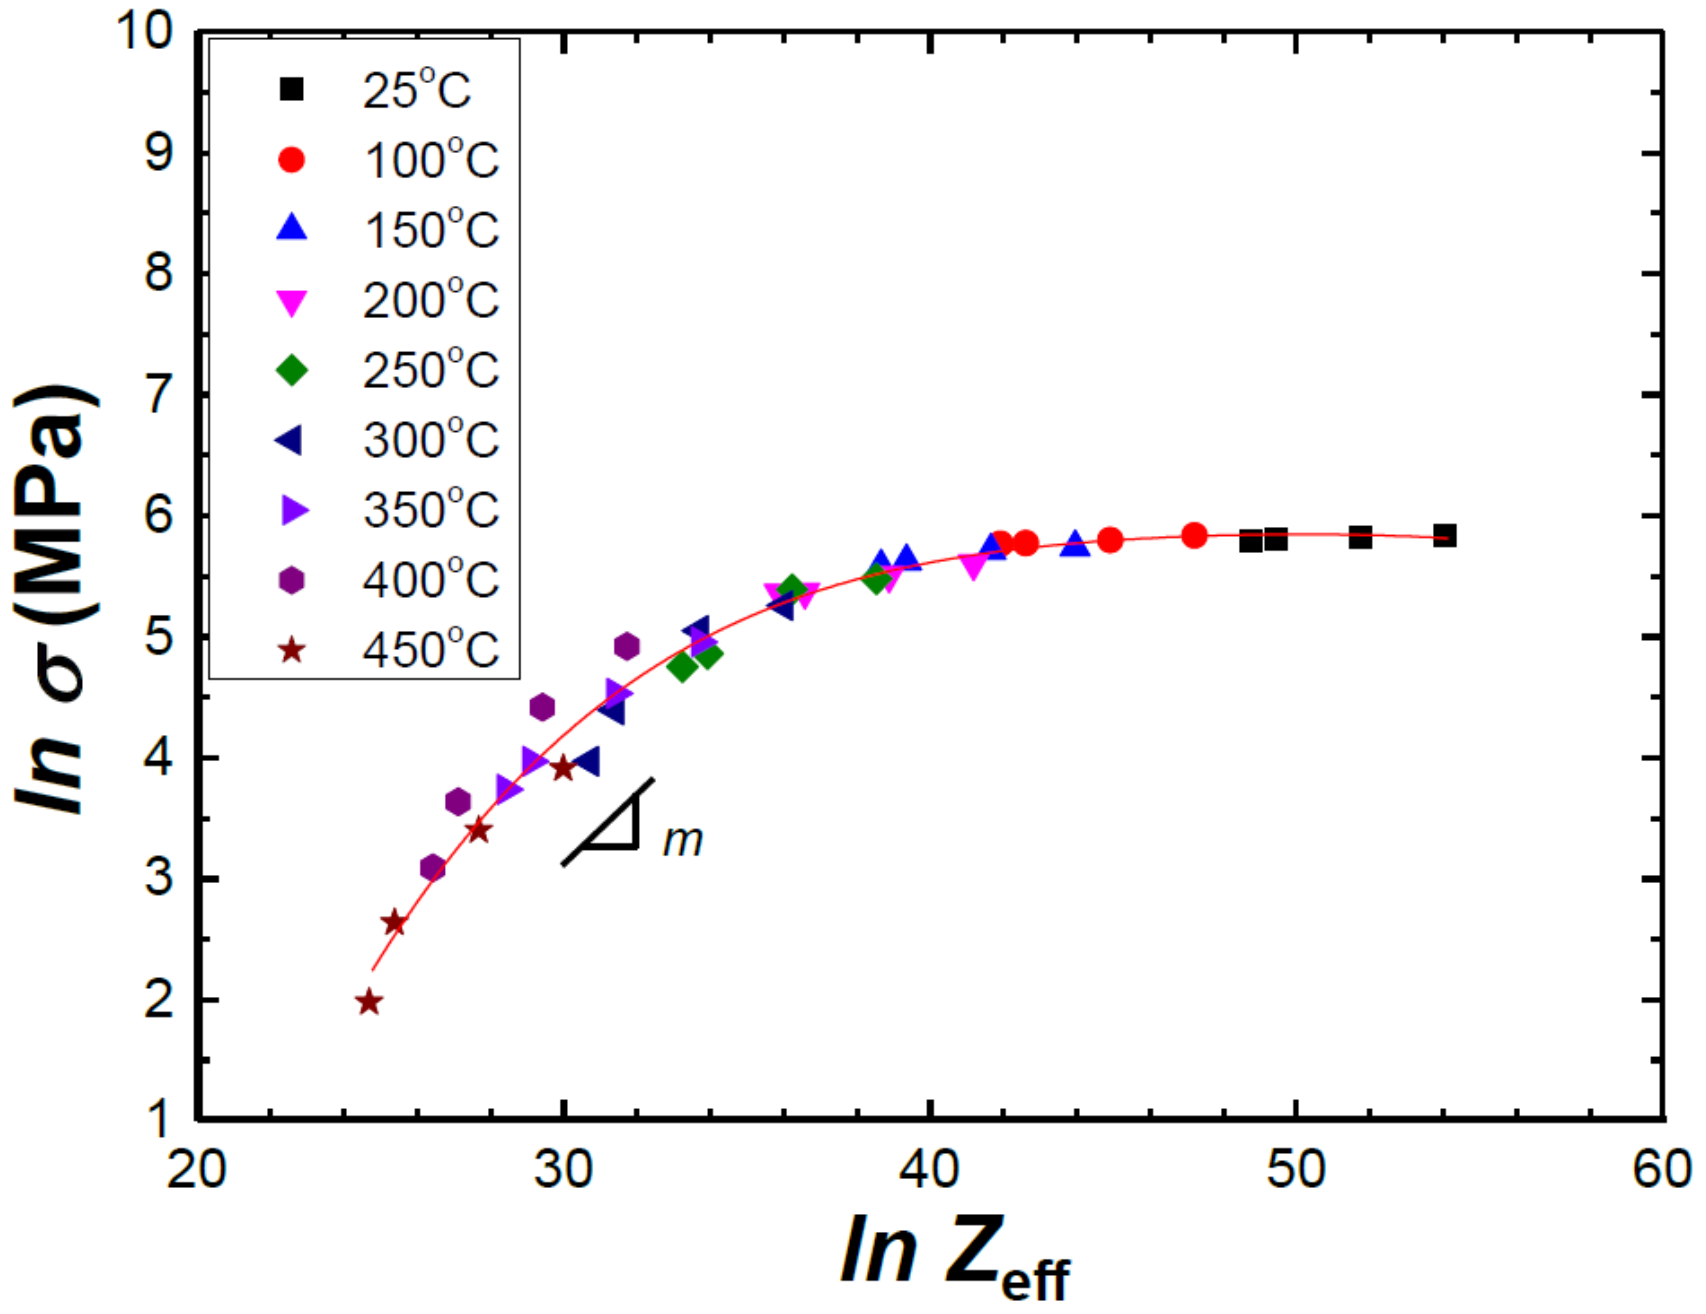
Figure 4 shows a plot of lnσ vs. ln
Zeff for the 5182 alloy for a temperature range between 25 and 450 °C at a given strain of 0.1. The
Zeff values were determined using
QL = 142 kJ/mol and
Qgb = 82 kJ/mol [
23], where
QL and
Qgb are the activation energies for
DL and
Dgb in pure aluminum, respectively.
As seen, the correlation between lnσ and ln
Zeff for the 5182 alloy is good, supporting the validity of Equation (6). The correlation plot shows that lnσ is a nonlinear function of ln
Zeff. As the instantaneous slope that represents the
m value gradually decreased with increasing ln
Zeff, an expression for the relation between lnσ and ln
Zeff was obtained by polynomial curve fitting:
Flow stress can then be expressed by
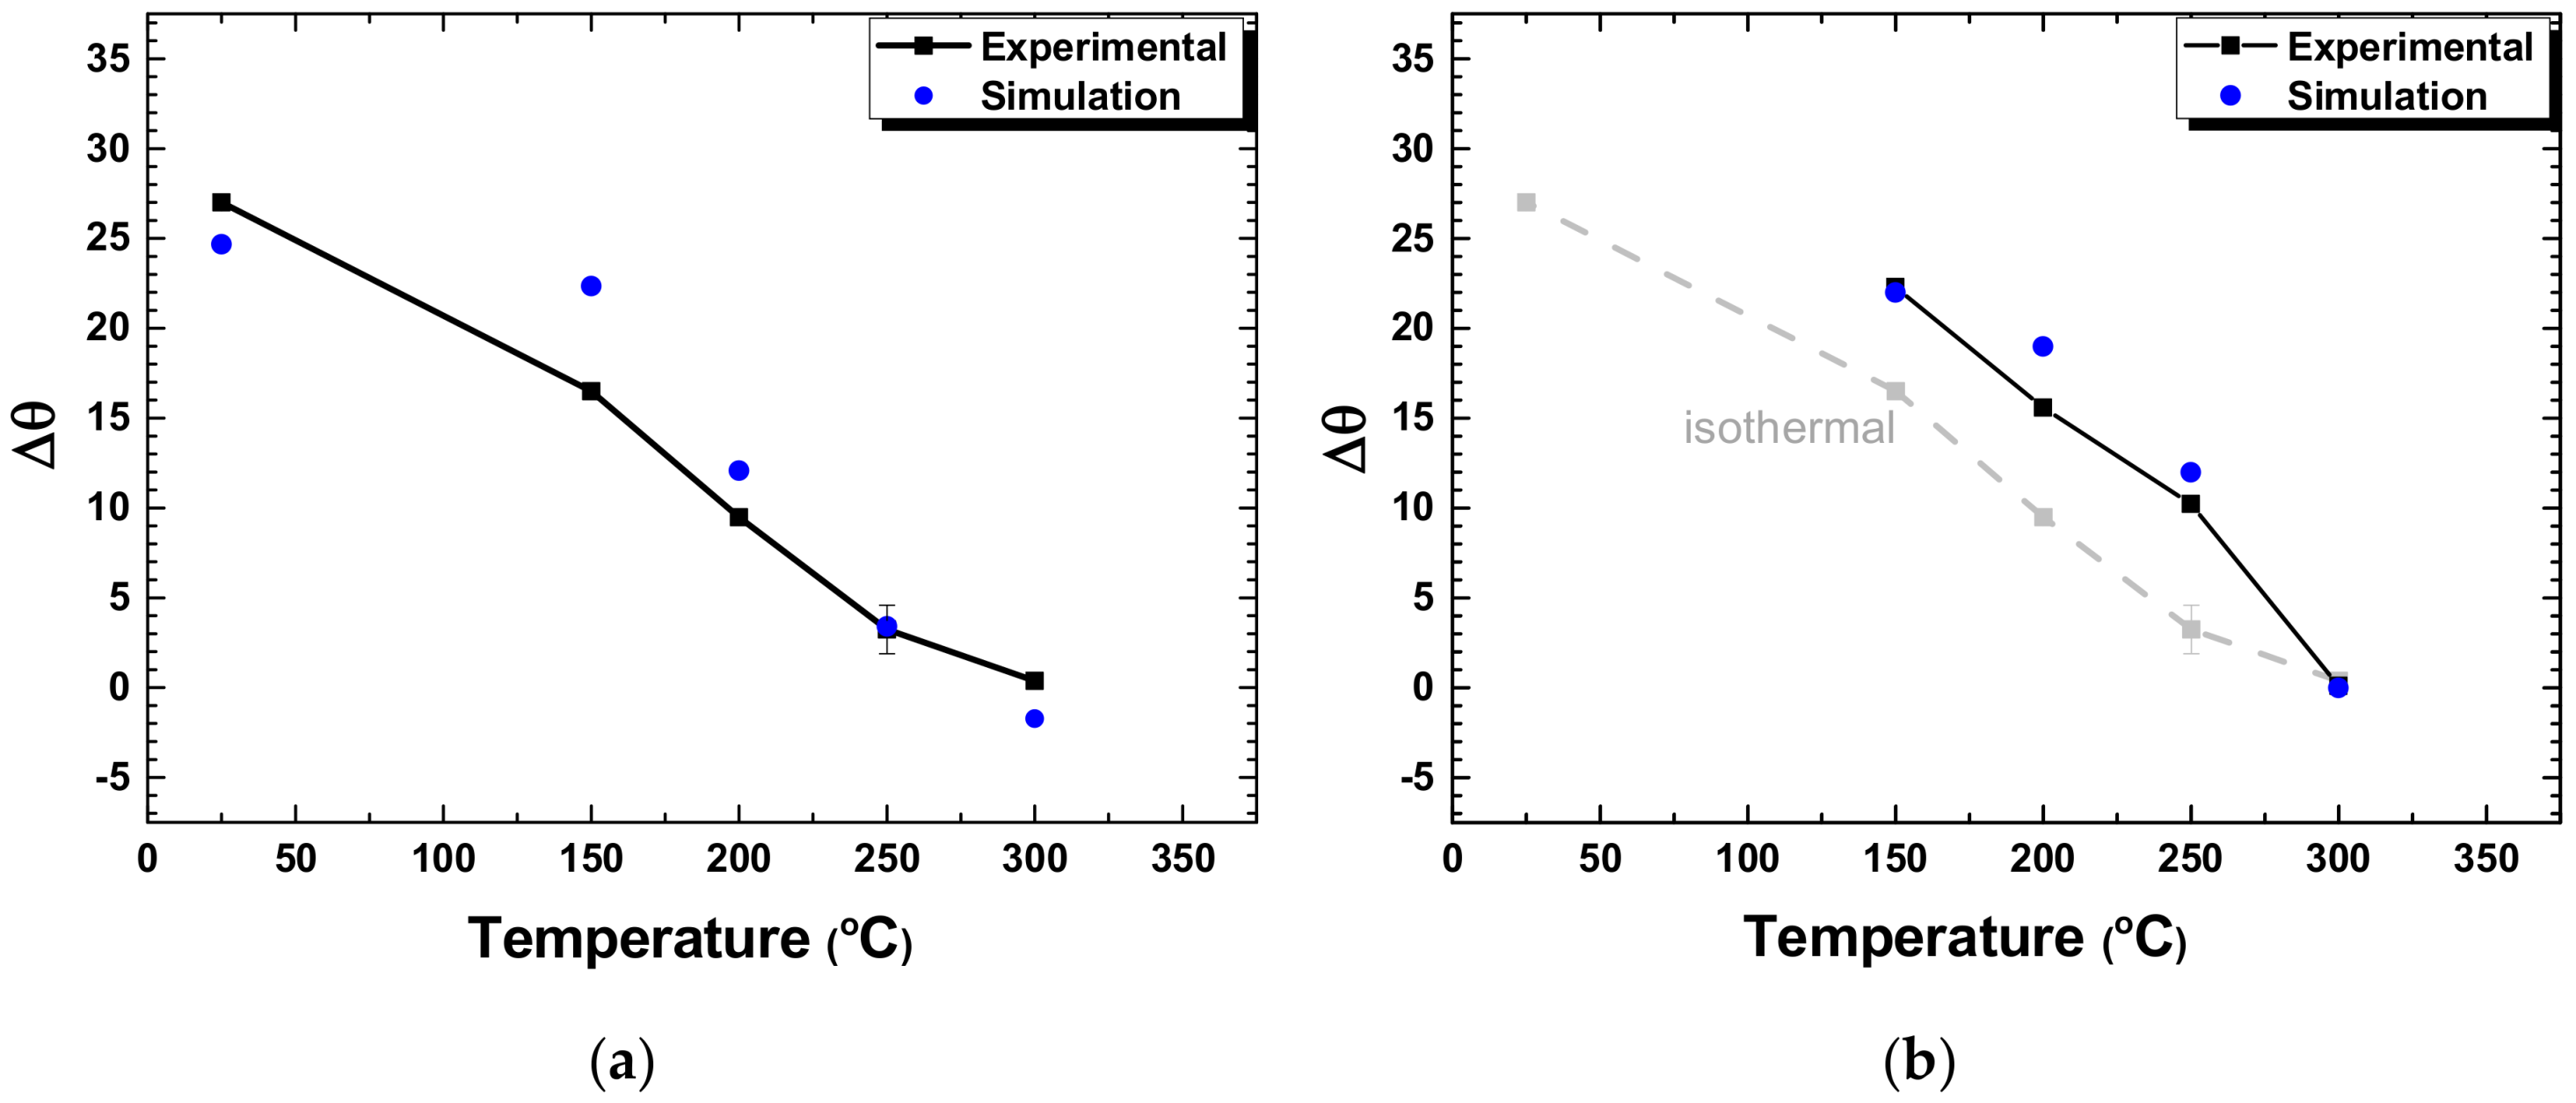
Figure 5a shows the effects of temperature on the experimental values of Δθ under isothermal conditions. As temperature increased, Δθ decreased and became nearly 0 at 300 °C. The elastic energy stored at a specific strain during plastic deformation in the uniaxial tensile testing is equal to 0.5σε = 0.5σ
2/
E, indicating that the amount of springback would decrease with decreasing flow stress and increasing
E. As
E of 5xxx aluminum alloy continues to decrease with increasing temperature [
20], the Δθ value that decreased with increasing temperature should be attributed to the decrease of flow stress with increasing temperature.
Figure 5b shows the effect of temperature on Δθ under non-isothermal conditions, where a trend similar to that noted under isothermal conditions was observed. The amount of springback was relatively large compared to that under isothermal conditions, most likely because the temperature of the material was lower compared to that under the isothermal condition due to the punch cooling under the non-isothermal condition. For both the isothermal and non-isothermal cases, the FEM calculations agreed reasonably well with the experimental results.
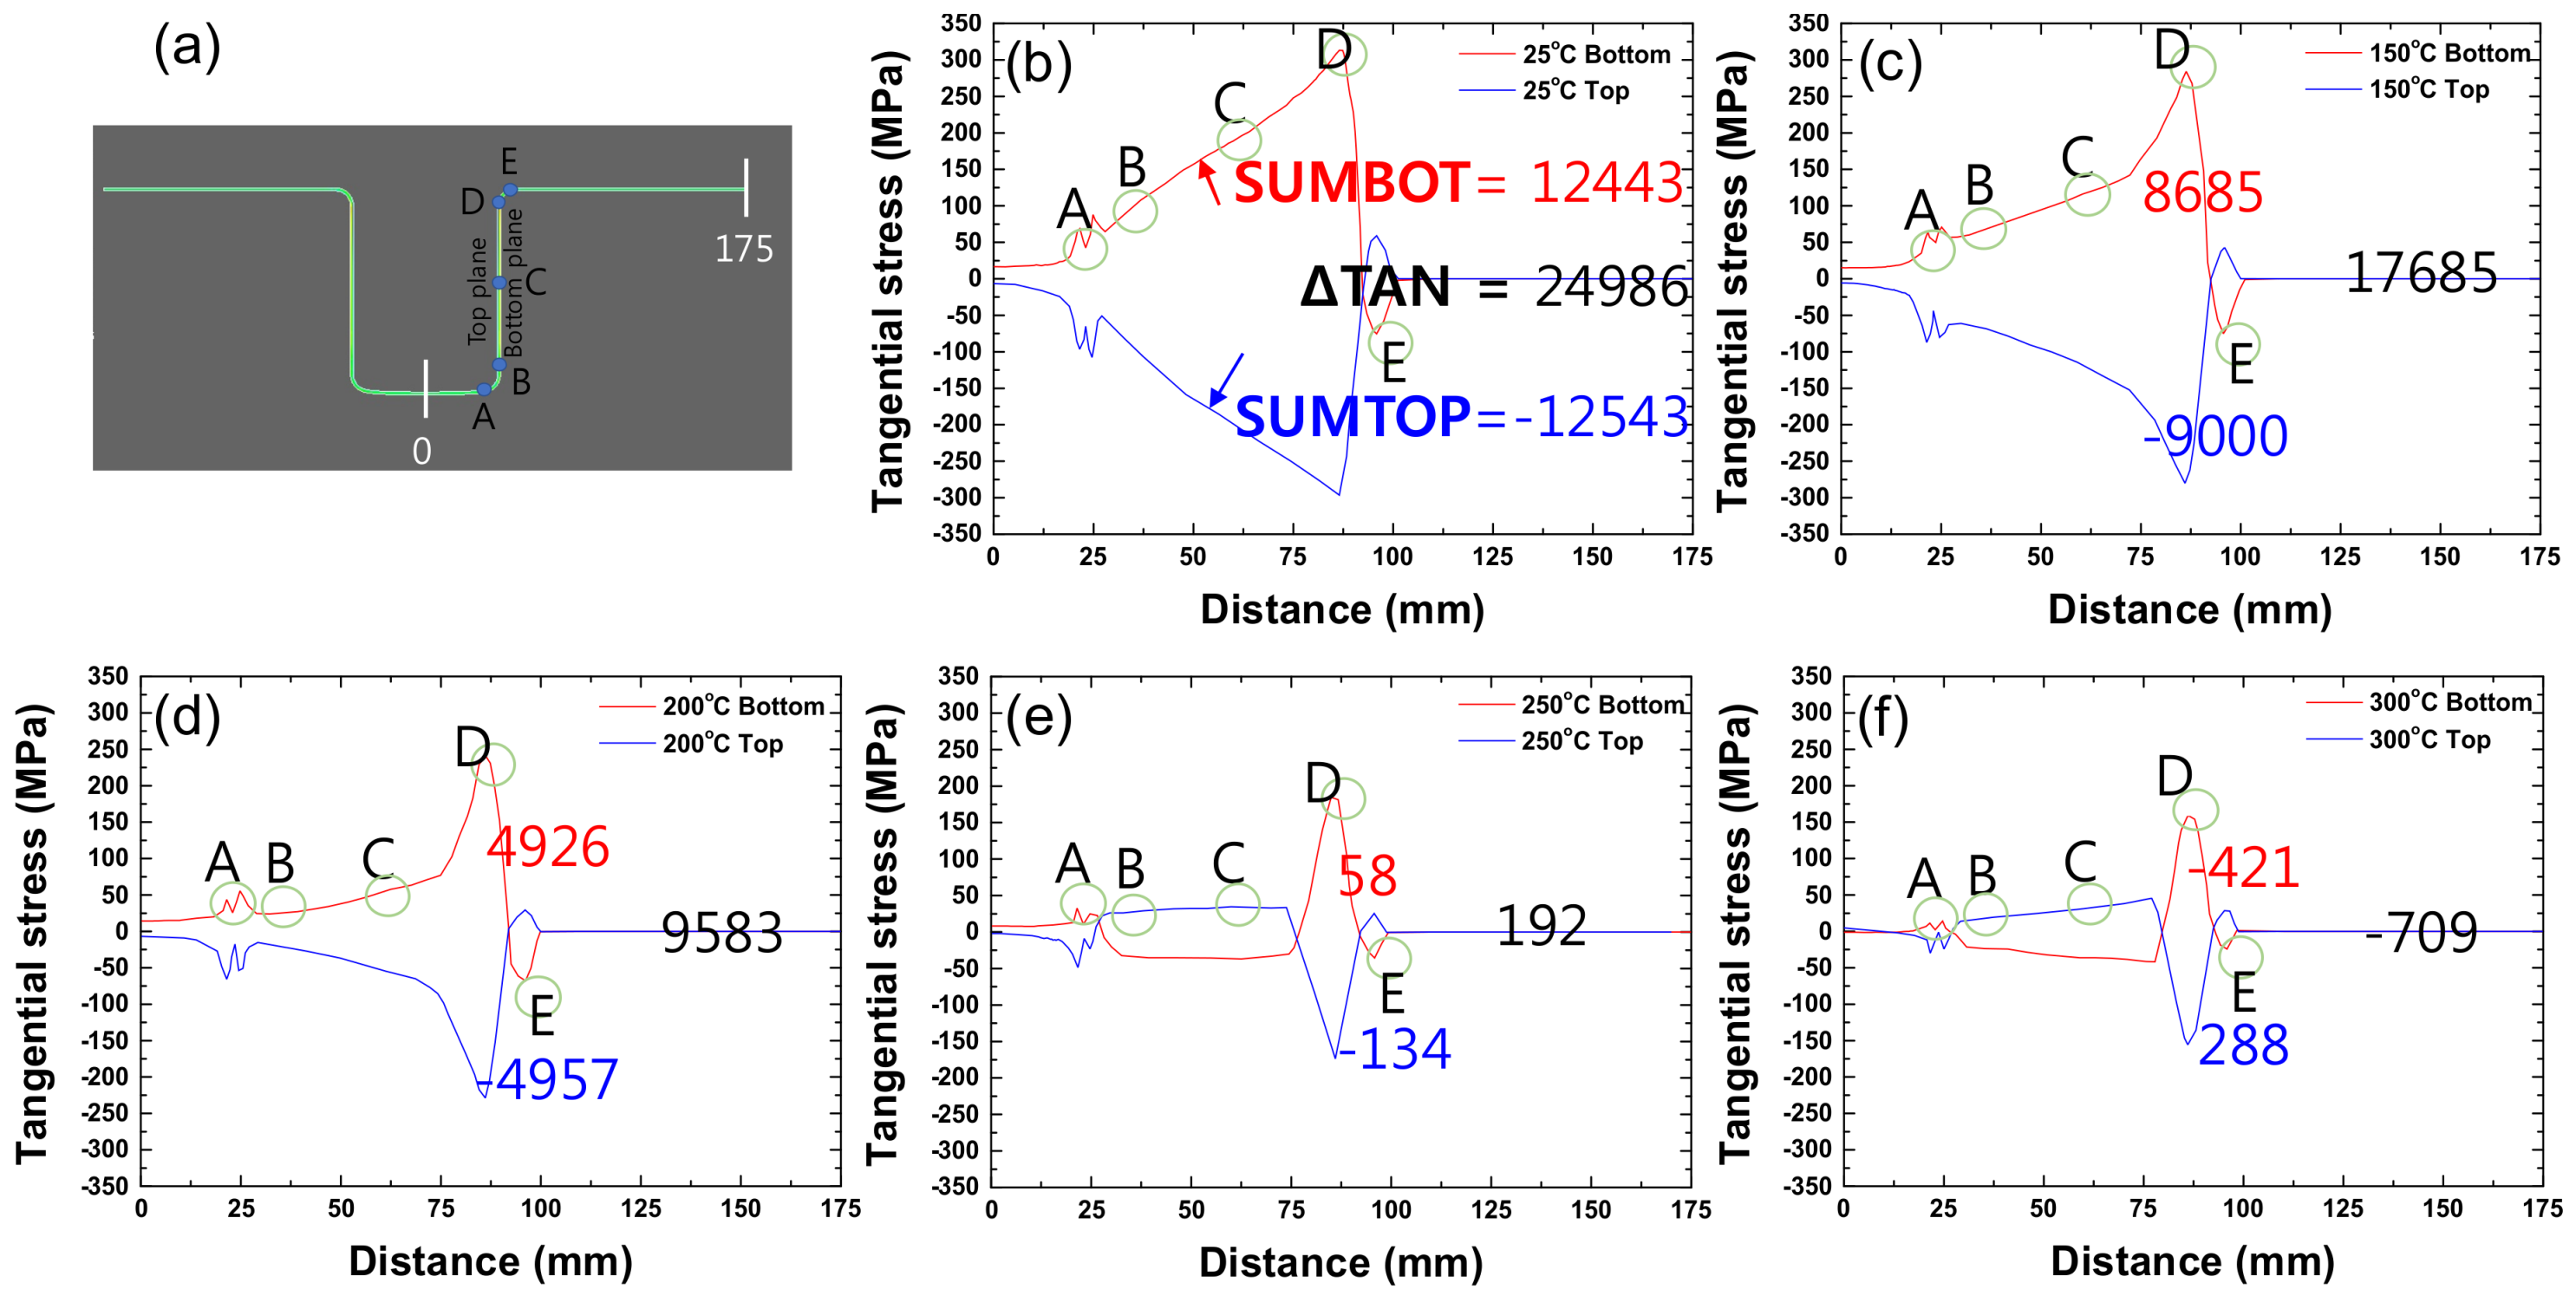
To further investigate the reason for the reduction in springback at elevated temperatures, the distribution of tangential stress (i.e., normal stress near the surface on the cross-section of the sheet) of the part before unloading was examined by defining a local coordinate system in the FEM model. The effects of temperature and punch speed on the values and distribution of tangential stresses during isothermal forming are shown in
Figure 6 and
Figure 7, respectively.
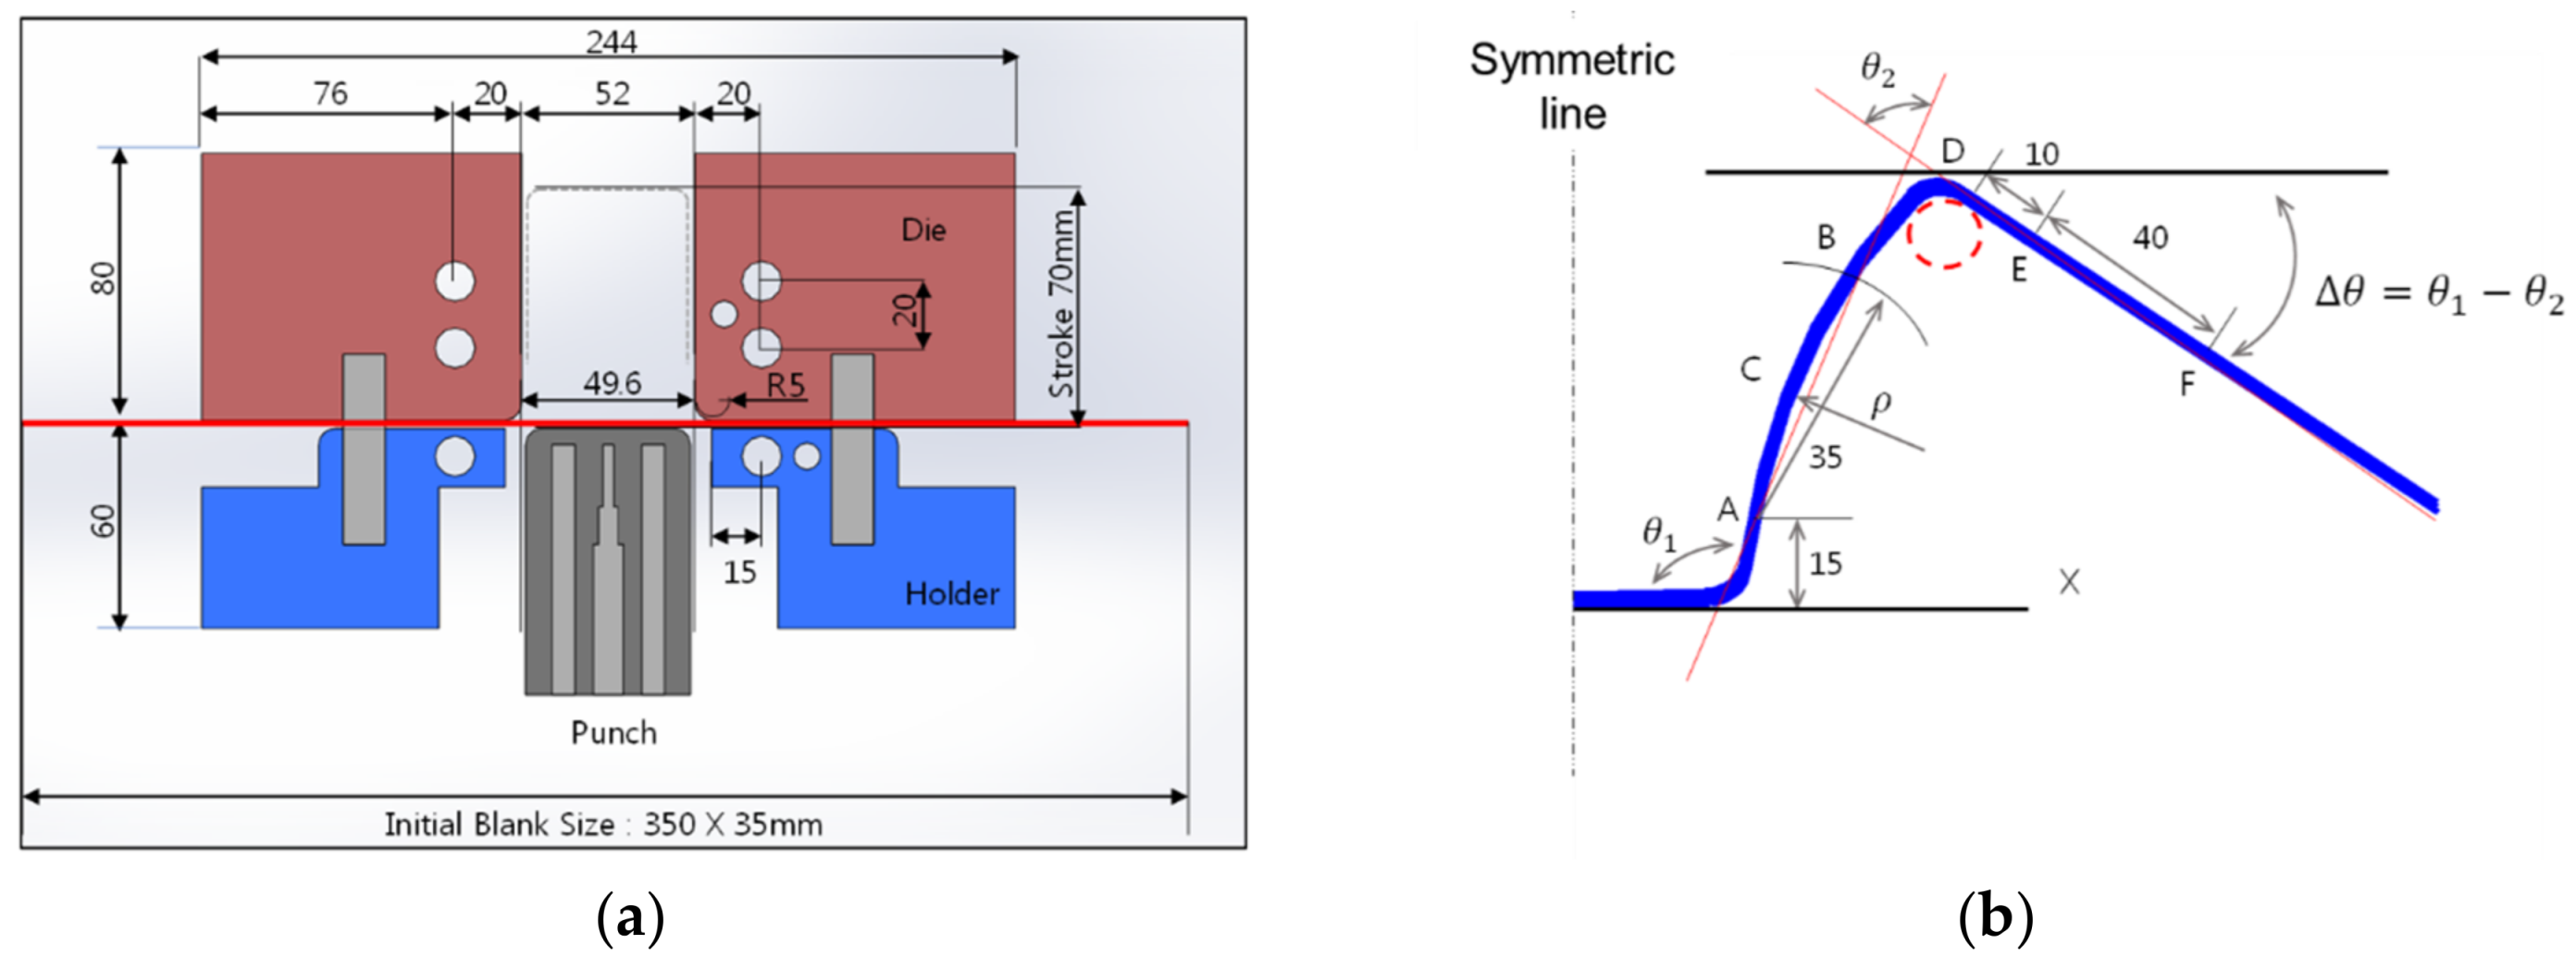
Figure 6a shows each distinct tooling region (i.e., AB: punch corner, BC and CD: sidewall, and DE: die corner) and
Figure 6b–f show the tangential stress values at the top and bottom layers of the blank after completion of U draw-bending (before unloading) at RT and elevated temperatures (150, 200, 250 and 300 °C) with a fixed punch speed of 1 mm/s. At RT, the elements in the punch corner region (the AB region in
Figure 6a) primarily experienced bending, tensile tangential stresses develop in the bottom layer of the sheet, and compressive tangential stresses develop in the top layer. In the die corner region (DE in
Figure 6a), the sign of tangential stresses reversed due to the bending changes in the opposite direction. As temperature was increased, the magnitude of tangential stresses throughout the tooling region decreased because the higher temperatures led to lower flow stress and, therefore, decreasing bending moments. The magnitudes of the tangential stresses, however, decreased more rapidly in the BC region (where both bending and unbending were expected to occur) compared to the other regions. The sign of the tangential stress of the top and bottom layers eventually reversed at temperatures above 250 °C; the stress state changed from tension to compression at the bottom layer and compression to tension at the top layer of the blank. This could occur when the magnitude of the bending moment in the BC region decreased faster than the magnitude of the unbending moment as temperature increased.
The tangential stresses at the top and bottom layers of the blank section were integrated from the center of the blank to the flange end and were named SUMTOP and SUMBOT, respectively; their values are given in the figures. ΔTAN is defined as ΔTAN = SUMBOT − SUMTOP, and their values are also given in the figures. With increasing temperature, SUMBOT changed from 12,443 to −421, whereas SUMTOP changed from −12,543 to 288. As a result, ΔTAN decreased with increasing temperature. The importance of ΔTAN in springback will be examined in the Discussion section.
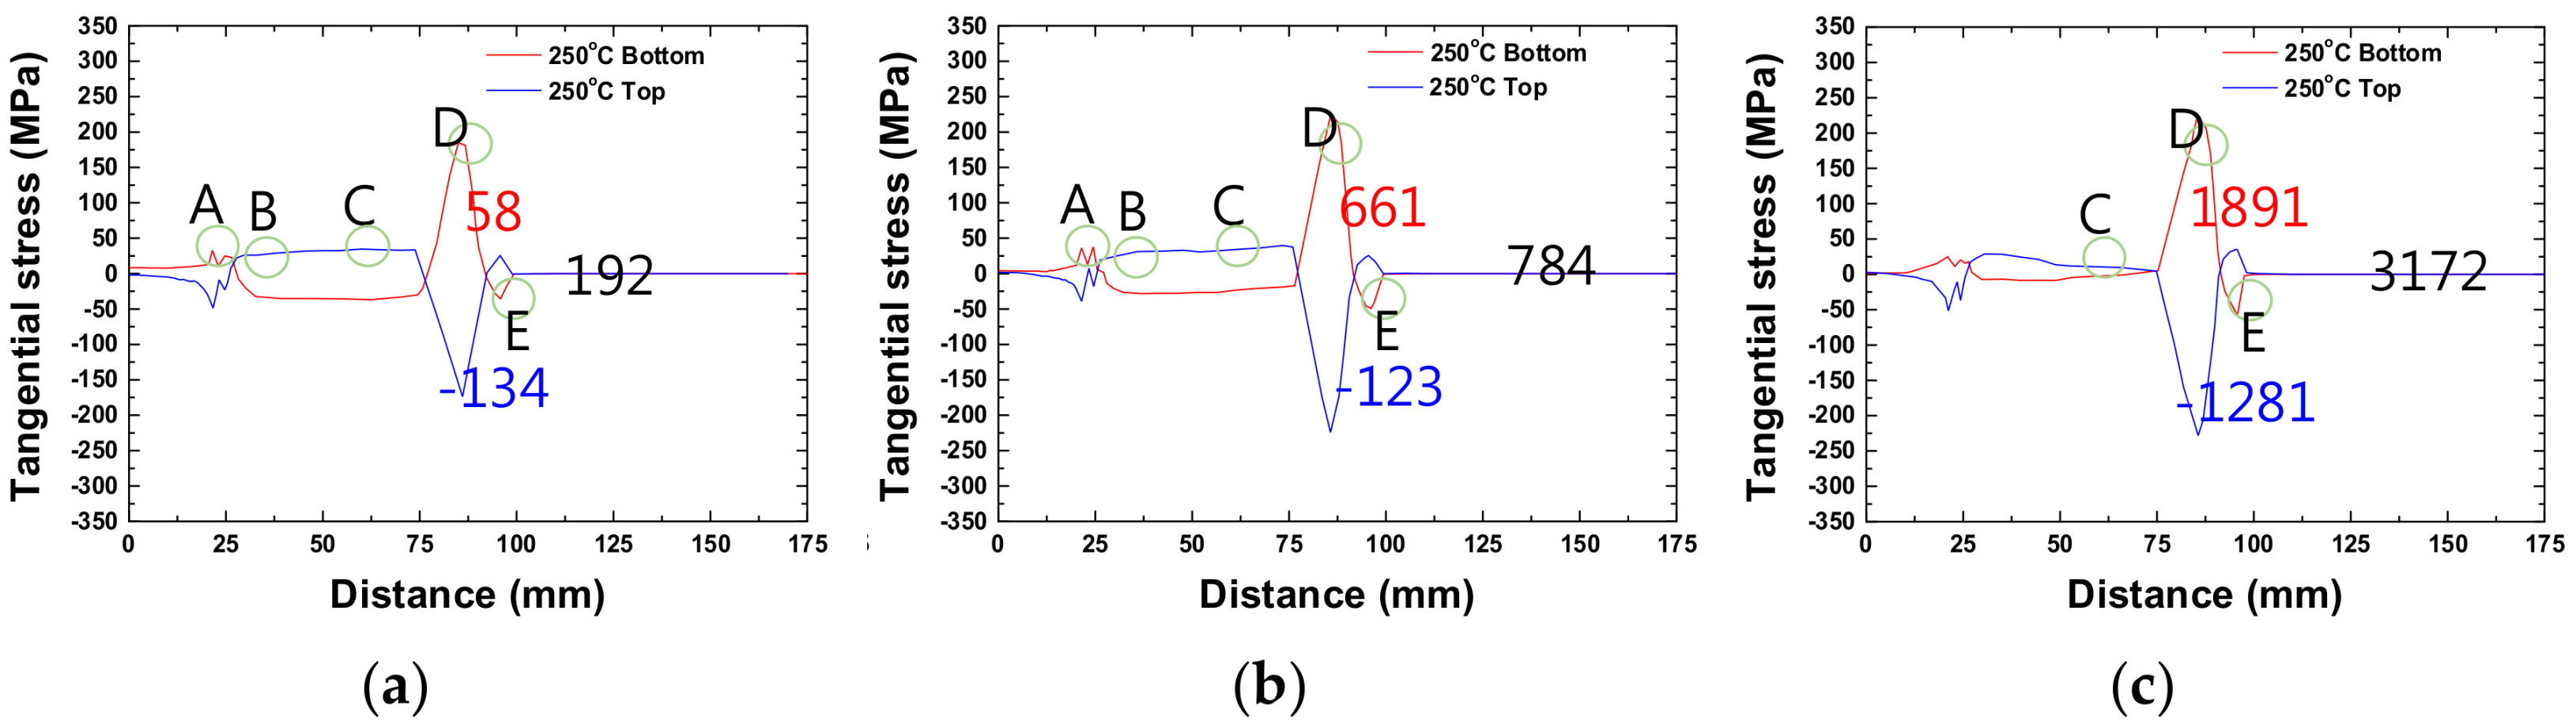
Figure 7a–c show the tangential stress values at the top and bottom layers of the blank for punch speeds of 1, 5 and 10 mm/s at 250 °C under isothermal condition. As the punch speed increased, SUMBOT and SUMTOP, whose signs were positive and negative, respectively, increased in magnitude because as the strain rate increased with increasing punch speed, the flow-stress level increased, and, thus, the bending moment of the blank increased. For this reason, ΔTAN increased with increasing punch speed.
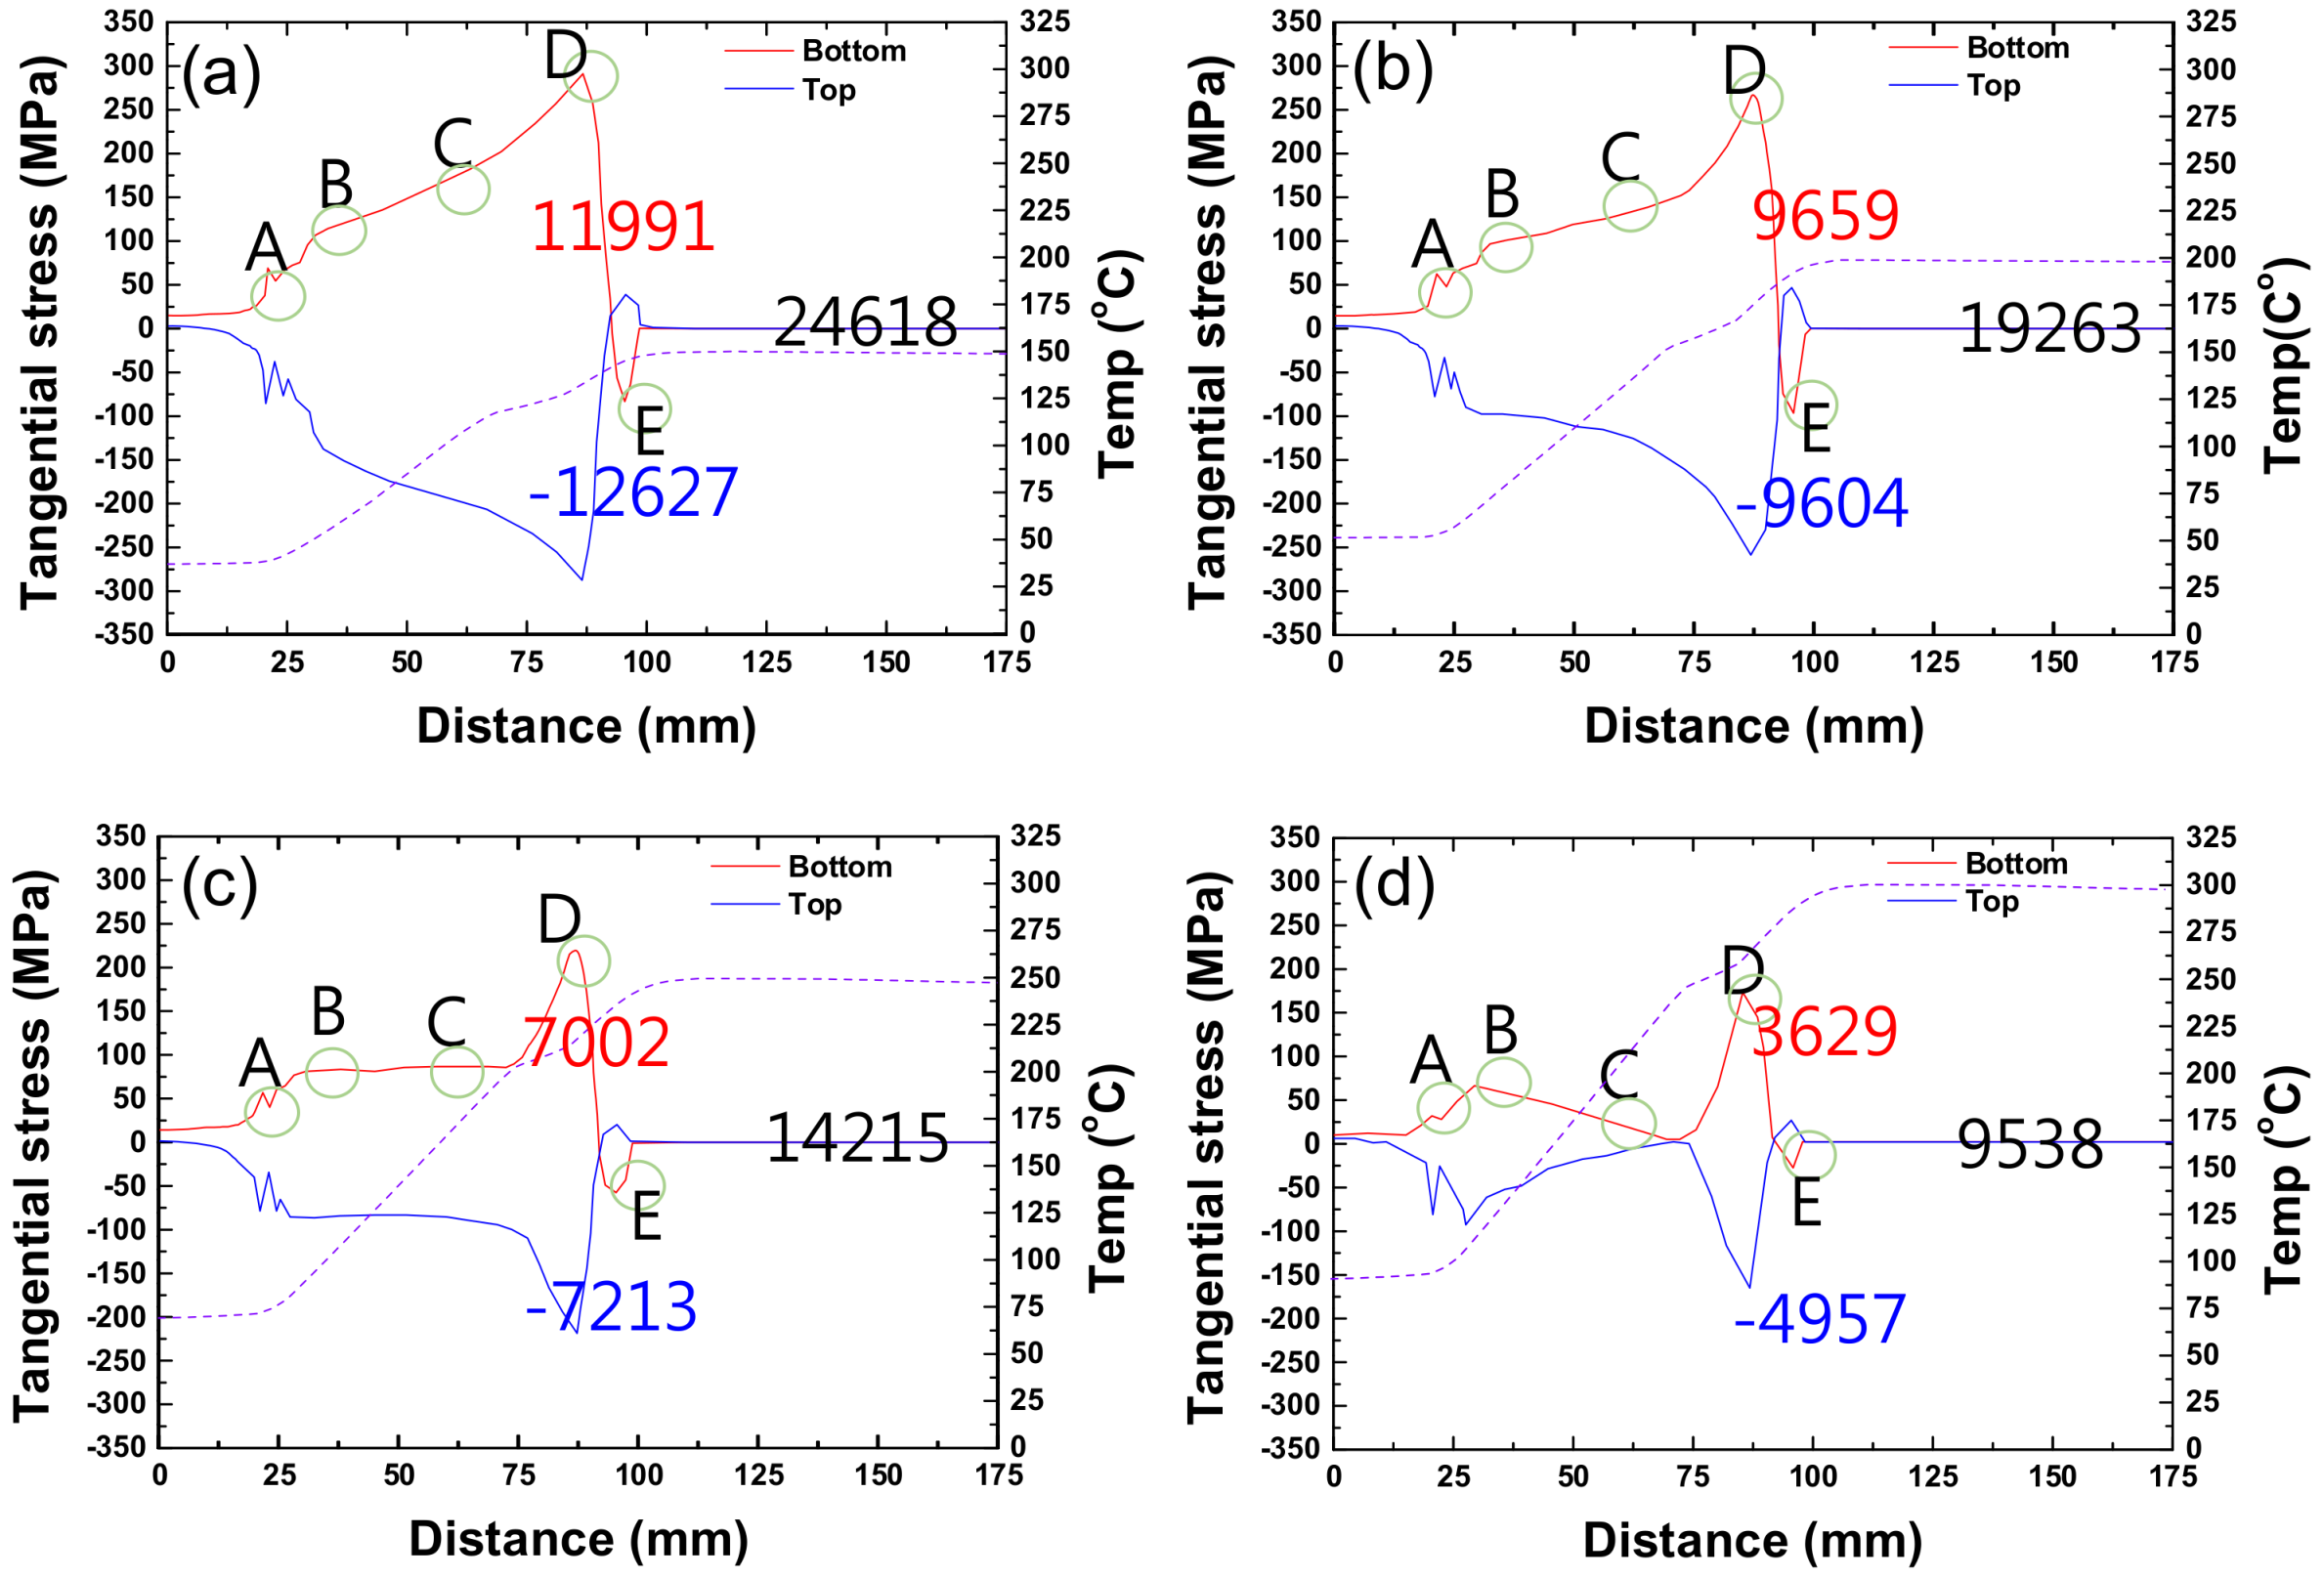
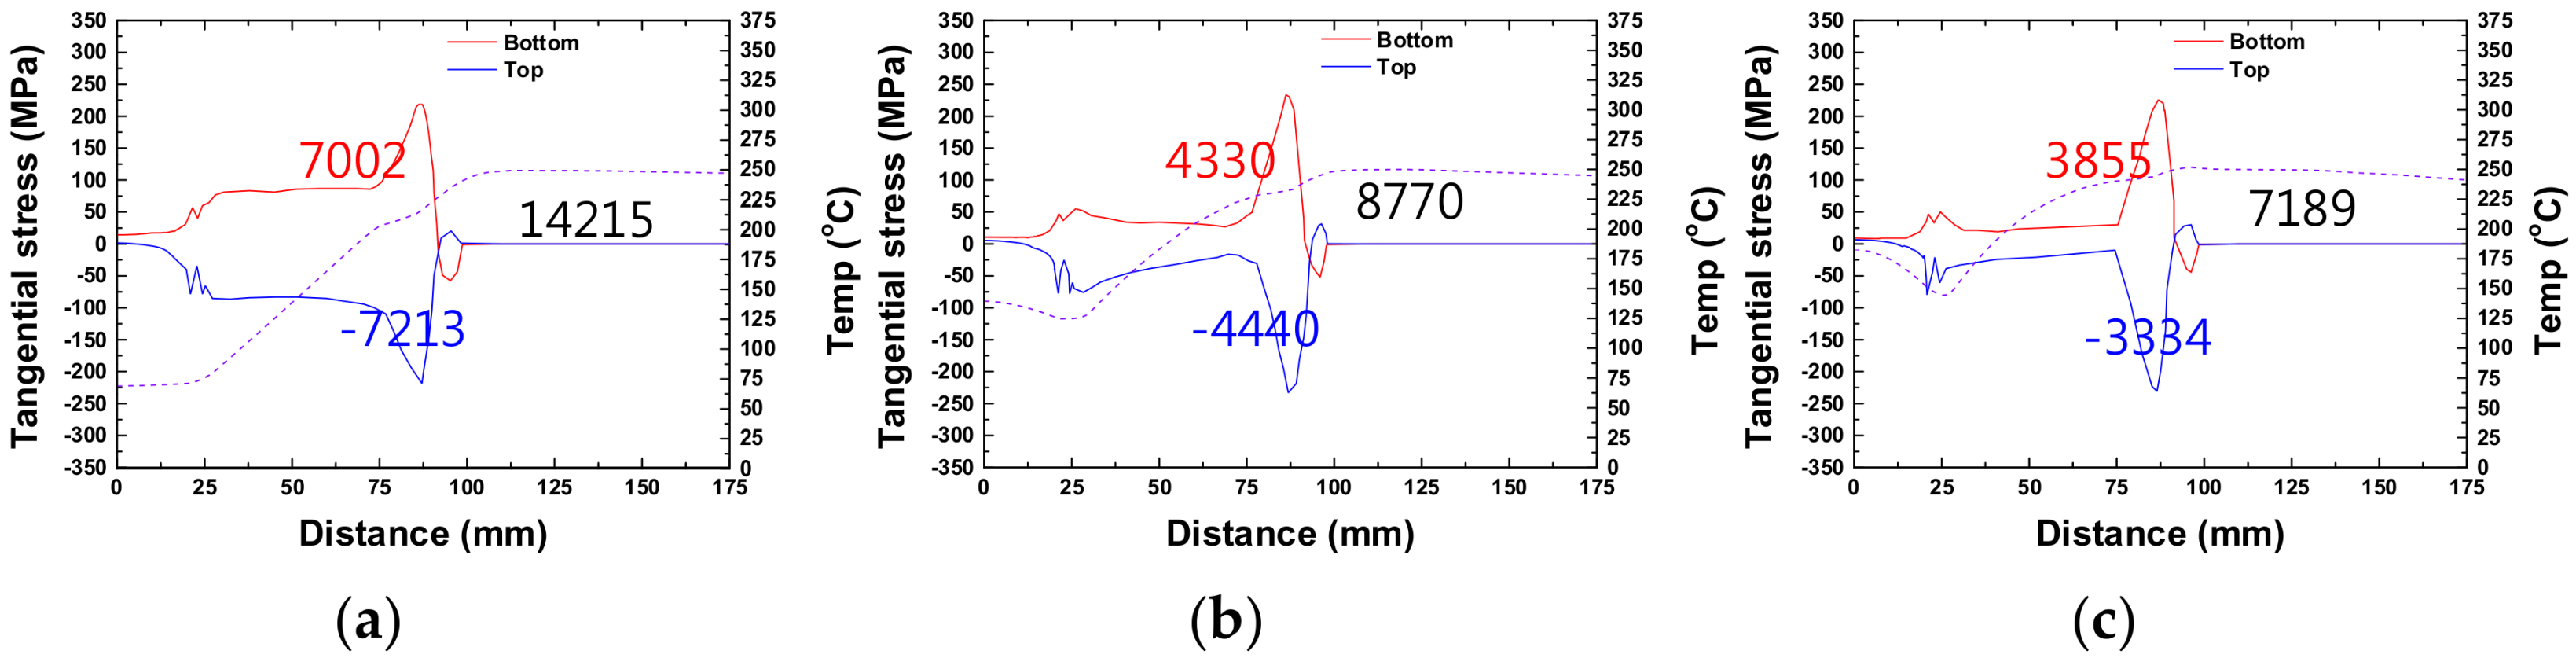
For the non-isothermal forming, the effects of temperature and strain rate on the value and distribution of tangential stresses are shown in
Figure 8 and
Figure 9, respectively. As in the case of isothermal conditions, the tangential stress and ΔTAN magnitudes decreased with increasing temperature (
Figure 8a–d). However, there were two major differences when compared to the case of isothermal forming. First, the magnitudes of the tangential stresses and ΔTAN for the non-isothermal condition were larger than those for isothermal forming; the ΔTAN decreased from 24,618 to 9583 under the non-isothermal condition as temperature increased from 150 to 300 °C, whereas they decreased from 17,685 to −709 under the isothermal condition. As the temperatures around the punch and sidewalls were lower than the forming start temperatures under the non-isothermal condition, the larger magnitude of ΔTAN was a result of the higher flow stresses, bending moments, and tangential stresses of the blank in comparison with those measured under isothermal forming. Second, the sign reversal of the tangential stress in the BC region did not occur up to 300 °C under the non-isothermal condition, whereas it occurred at temperatures above 250 °C under the isothermal condition. This is also because the average temperature experienced by the material under the non-isothermal condition was lower than that experienced under the isothermal condition.
Under the isothermal forming described above (
Figure 7a–c), the overall magnitudes of tangential stress and ΔTAN increased as the punch speed increased from 1 to 10 mm/s. However, under the non-isothermal forming, an opposite trend was observed; the tangential stress and ΔTAN magnitudes decreased with increasing punch speed (
Figure 9a–c). This is because, under the non-isothermal condition, as punch speed increased, the times for heat transfer from the material to the punch in the BC region were shorter, resulting in smaller decreases in material temperature during the forming process. When this temperature effect is more significant than the effect of strain rate itself, ΔTAN can decrease with increasing punch speed.
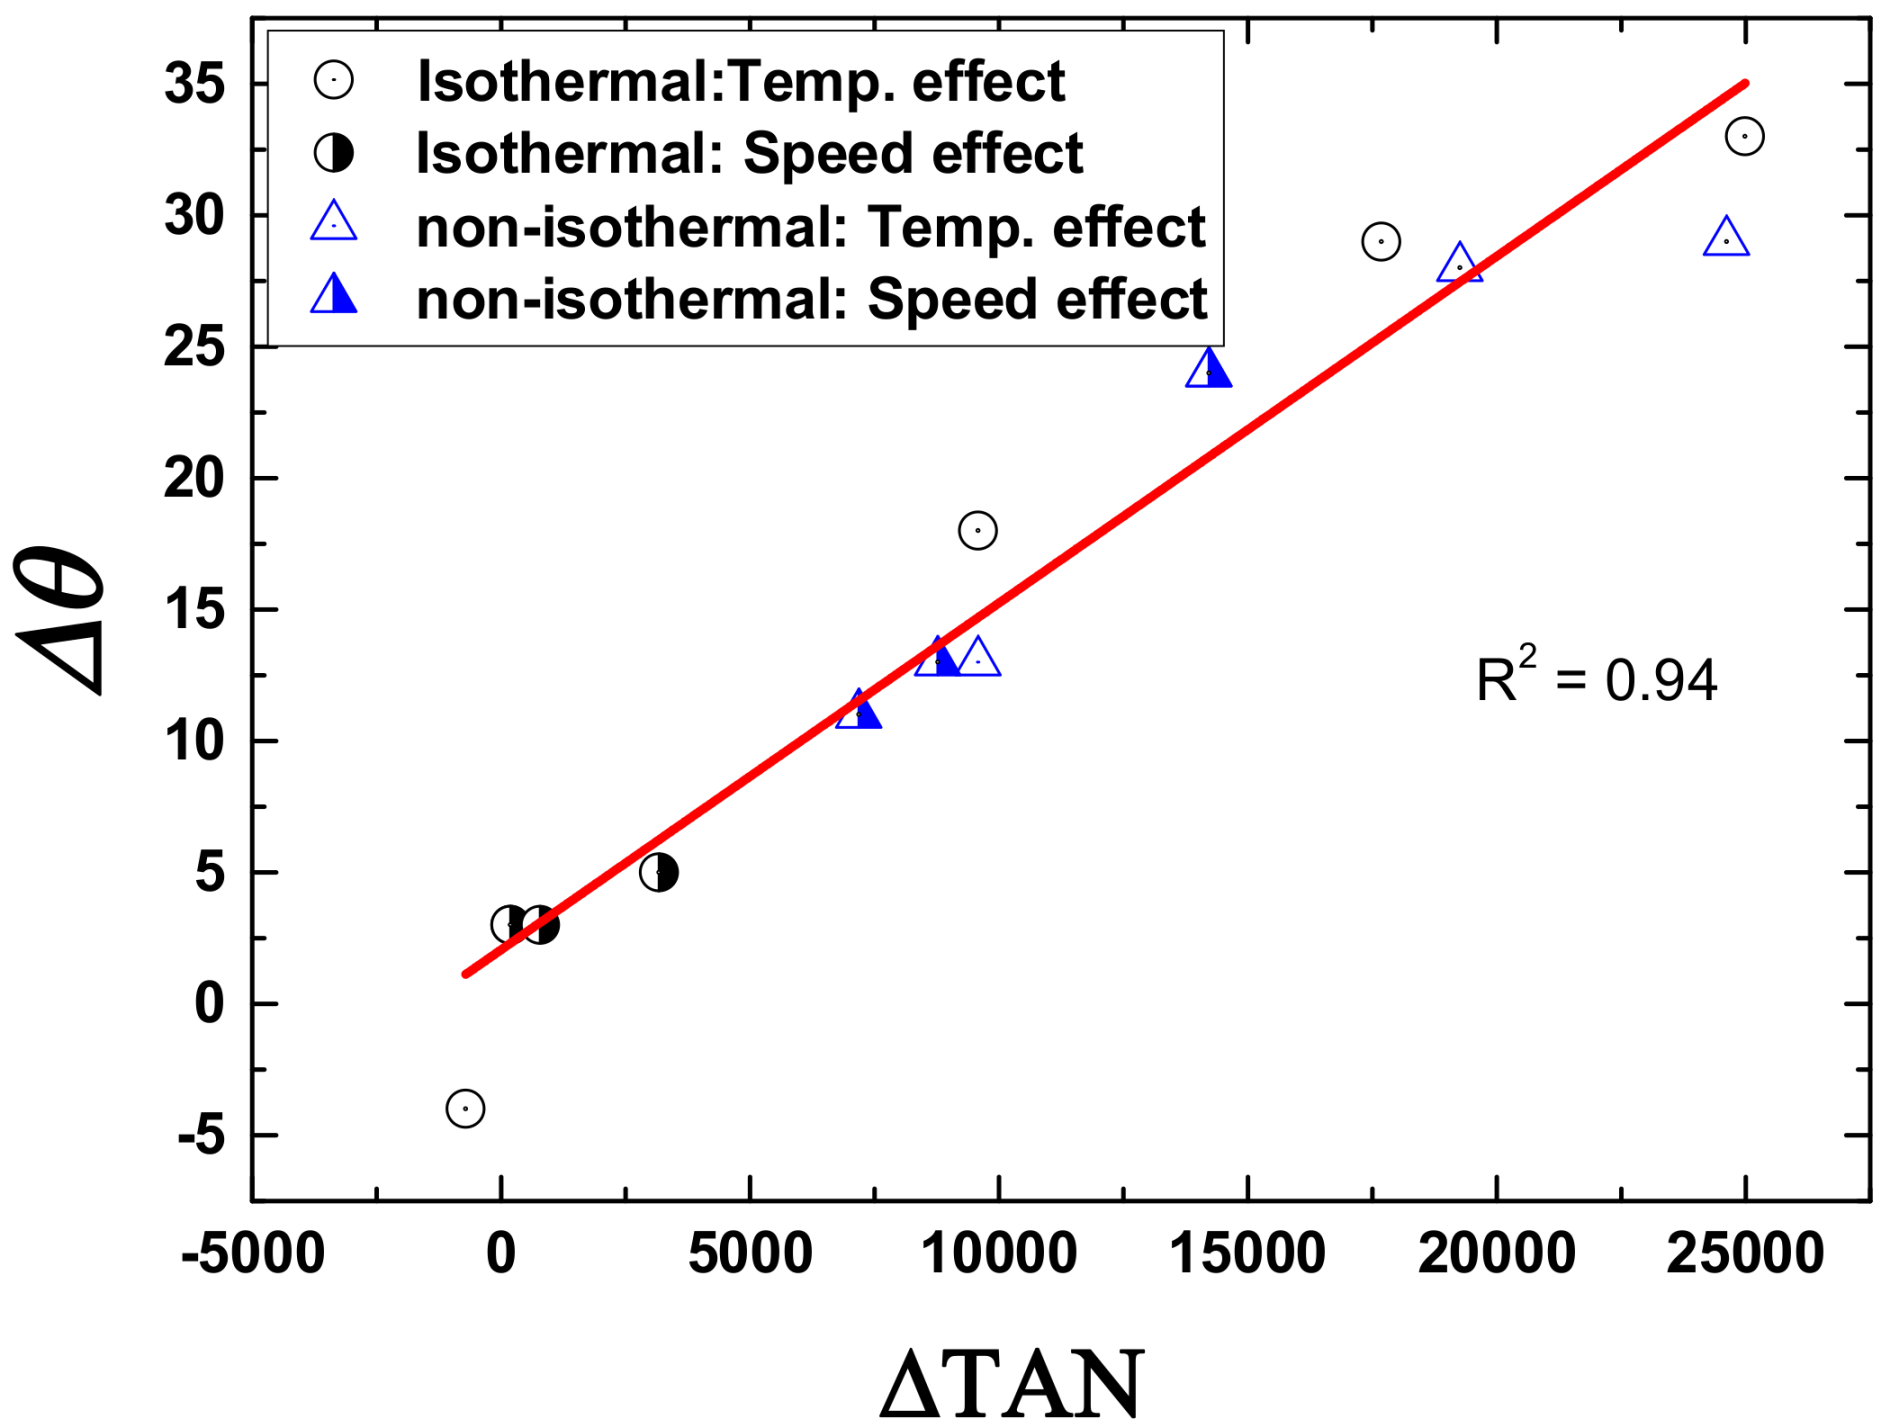
The relationship between ΔTAN and Δθ (from the FEM analysis results) is shown in
Figure 10 for all cases, including the cases of isothermal and non-isothermal conditions. The results show that there was a good linear relationship between the two parameters (with a linear regression
R-squared value of 0.94). From that observation, it can be inferred that quantitative prediction of springback is possible by observing only tangential stress distribution on the blank cross-section.
4. Discussion
According to the plot in
Figure 10, the magnitude of the springback of a U draw-bended product is proportional to the difference in tangential stresses at the top and bottom layers of the sheet. In this section, we examine whether such results can be rationalized and present a springback prediction model that can utilize the tangential stress data obtained from the FEM forming analysis.
When effective stress and effective strain are used to depict the general state of stress in a material, Equation (6) changes to
where
is the effective stress and
is the effective strain.
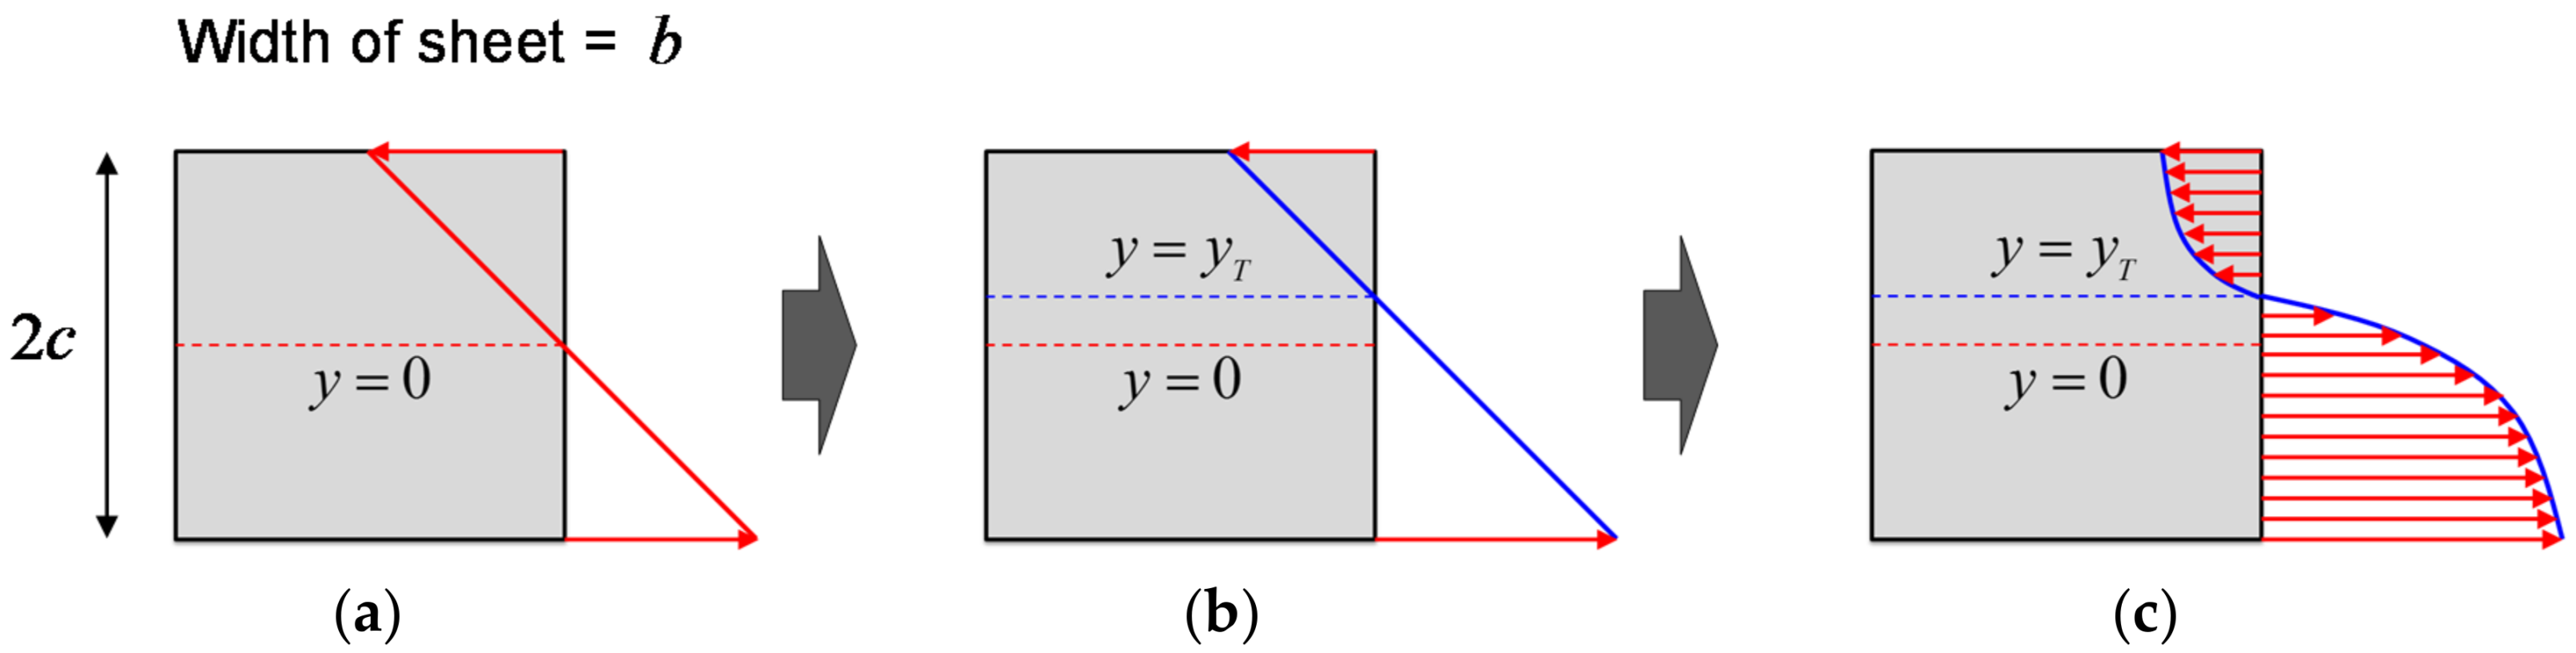
When an arbitrary stress is distributed in the section of the sheet due to an externally applied load, it can be assumed that the stress distribution is decomposed into stresses due to pure bending and sheet stretching. In that case, pure bending causes a tensile (or compressive) stress that increases linearly from the neutral plane, and sheet stretching causes a uniform tensile stress in the sheet cross-section. If the sheet receives a compressive force in the in-plane direction, a uniform compressive stress may occur in the sheet cross-section. However, the magnitude of the compressive stress generated in the sheet cross-section is usually small, and if the in-plane compressive force is too large, the sheet will instead buckle. Thus, the presence of a uniform compressive stress is neglected in the following derivation.
The strain distributions on a sheet cross-section when a sheet undergoes different bending modes are schematically shown in
Figure 11a,b.
Figure 11a shows the strain distribution on a sheet cross-section due to pure bending, and
Figure 11b shows the strain distribution on a sheet cross-section when the tensile strain due to sheet stretching is added to the strain distribution caused by pure bending.
Figure 11c shows the stress distribution on a sheet cross-section caused by the strain distribution of
Figure 11b. Assuming that all regions of the cross-section are in a plastic deformation state, a nonlinear stress distribution appears.
According to the Euler-Bernoulli beam theory [
25], the longitudinal strain of the beam can be calculated by
where
is the distance from the sheet thickness center plane to the neutral plane in the sheet cross-section when the neutral plane moves due to the effect of sheet stretching, and
is the radius of curvature of the beam under bending. However, if the beam undergoes various plastic deformation paths, including tensile and compressive deformation, it is necessary to consider the deformation history. For that purpose,
and
are defined as variables that reflect the deformation history.
The stress distribution on the sheet cross-section can be obtained from Equations (9) and (10). If the sheet thickness is thin (i.e., a plane stress condition), and the variation of temperature and strain rate in the cross-section is not large, Equation (9) can be approximated as
where
,
, and
N ≈
N(
Tavg) for the average temperature
Tavg and the average strain rate
.
The bending moment due to the stress distribution in the cross-section can be calculated as
where
b is the width of the sheet and
c is half the sheet thickness. When the external load is removed, the bending moment becomes zero due to elastic recovery. From a microscopic perspective of elastic recovery, an elastic stress is generated on the sheet cross-section that generates a bending moment of the same magnitude in the opposite direction. That elastic stress causes springback. The inverse of the radius of curvature is then given by the following equation
where the area moment of inertia
was used.
The angle change due to the springback can then be obtained as follows:
where Δ
L denotes the length of the sheet element where the angle change
occurred.
The tangential stresses occurring at the bottom Equation (15) and top layers of the sheet Equation (16) can be expressed as follows, respectively:
In the case of
in the above equations, the stresses in the sheet cross-section assume a symmetrical distribution that changes from tension to compression with respect to the neutral plane. In the case of
, the stress throughout the sheet cross-section is in a tensile state. From Equations (15) and (16), the parameters
and
can be expressed as
If
is tensile and
is compressive, the difference in the tangential stresses at the top and bottom layers of the sheet,
, is then
Equation (14) can be expressed in terms of
as
The total cumulative value of the angle change can be determined by converting the above equation found for a sheet element of length Δ
L into an equation for an element of infinitesimal length d
x and integrating it over the entire length:
If
is compressive and
is tensile, however,
and
will be equal in magnitude but opposite in sign compared to the case where
is tensile and
is compressive. Therefore,
in Equation (18) should be expressed in a more general form as
The followings are inferred from Equation (21). First,
is linearly proportional to ΔTAN, which agrees with the trend shown in
Figure 10. Second, according to Equations (3), (8) and (22), ΔTAN increases as strain rate increases and temperature decreases. Thus,
increases as strain rate increases and temperature decreases. Third,
increases as
E decreases, which is in good agreement with the general observation that smaller
E yields greater springback [
26]. Fourth,
is inversely proportional to
c because ΔTAN is proportional to the
N power of
c, whereas the slope of the curve of
vs. ΔTAN is proportional to the −1 power of
c, consequently leading to
α (
N−1) power of
c. Because
N is usually less than 1,
is inversely proportional to
c. This prediction also matches the general tendency that the amount of springback increases with decreasing sheet thickness. Ho et al. [
27] analyzed the springback behavior of creep forming of aluminum sheets using a finite element method and showed that springback decreases with increasing workpiece thickness. Liu et al. [
28] analyzed the unloading springback of sheet metal foils after a micro-bending process using a developed finite element model and showed that springback angle generally increases with decreasing sheet thickness. Fifth,
increases as
N increases and
decreases.
According to Equation (21), the slope of the curve of
vs. ΔTAN,
is a function of
E,
N, and
c. Under the present experimental conditions, as temperature increases,
E decreases from 73.1 to 60.3 GPa (
Table 1) and
N decreases from 0.37 to 0. With
c = 0.55 mm, the average
E value of 66 GPa and the
N value in range between 0 and 0.37,
S was calculated to be in range between 1.74 × 10
−5 and 2.07 × 10
−5 /MPa⋅mm. The slope measured from the plot in
Figure 10 is 2.01 × 10
−5/MPa⋅mm, indicating that the slope (
S) of the derived formula is very similar to the slope of the plot obtained from the FEM analysis results. This result verifies that the cumulative springback angle can be estimated directly from the information on the tangential stress difference.
When deriving the explicit forms of the above equations, several simplifying assumptions were made. Nevertheless, Equation (21) supports the observed trend that ΔTAN is proportional to and predict the dependencies of several parameters on correctly. Therefore, application of Equation (21) can potentially be extended beyond the material type and the case of U-draw bending, having found its usefulness in predicting the amounts of springback in warm sheet metal forming processes.


