Article

Growth Morphologies and Primary Solidification Modes in a Dissimilar Weld between a Low-Alloy Steel and an Austenitic Stainless Steel

1
University Grenoble Alpes, CNRS, Grenoble INP SIMaP, F-38000 Grenoble, France
2
AREVA NP, Tour Areva, 92084 Paris La Défense, France
3
EDF R&D, Avenue des Renardières, 77250 Moret-Sur-Loing, France
*
Author to whom correspondence should be addressed.
Metals 2018, 8(4), 284; https://doi.org/10.3390/met8040284
Submission received: 5 March 2018 / Revised: 7 April 2018 / Accepted: 11 April 2018 / Published: 19 April 2018

Abstract

:
Dissimilar welds close to the fusion boundary exhibit a variety of solidification microstructures that strongly impact their service behavior. Investigations were therefore undertaken to clarify the origins of the morphological and microstructural evolutions encountered in a 18MND5/309L dissimilar joint produced by submerged arc welding, using a combination of microstructural characterizations, thermodynamic computations, and solidification modelling. An unexpected evolution was observed in the solidification mode, from primary austenite towards primary ferrite with increasing growth rate. Solidification of austenite at the fusion boundary was assigned to its epitaxial growth on the metastable austenitic structure of the base metal resulting from an incipient melting mechanism. The evolution of the solidification mode toward primary ferrite was explained based on computations of the solute built up between austenite cells followed using the so-called “interface response function model”. Analyzing macro- and microstructural characteristic lengths with the published solidification model and data enabled evaluation of local values of the solidification rate, thermal gradient, and cooling rate close to the fusion boundary, thus providing useful data for numerical modelling of the submerged arc-welding process.

Graphical Abstract

1. Introduction

Dissimilar metal welds (DMWs) are widely used in nuclear power plant and oil refinery components for joining/cladding ferritic low-alloy steels to/with corrosion-resistant austenitic stainless steels. Different arc-welding processes may be employed: gas metal arc welding (GMAW) [1], gas tungsten arc welding (GTAW) [2,3,4,5,6,7,8,9,10], shielded metal arc welding (SMAW) [10,11,12] and submerged arc welding SAW [13,14,15,16,17,18].
With ferritic low-alloy steel as base metal, the most frequently used electrode materials, i.e., filler metals for welding or overlaying materials for surfacing, are austenitic stainless steels AISI 309L [2,5,6,8,14,18], AISI 308 [5] or AISI 304 [6] and Ni-base alloys: Inconel 82 [7,8,10], Inconel 182 [10], Monel NiCu 70-30 [2,3,4] and Hastelloy C22 [10,12].
Because of its impact on the final in-service properties of the weld metal (including ageing, corrosion, and fracture behaviors) the as-welded metallurgical structure of DMWs is a key parameter to be controlled. Since the 1970s many investigations on DMWs revealed several common microstructural features near the fusion line. A “transition layer” or “partially mixed zone” PMZ is always present in which the chemical composition varies continuously from that of the solid base metal to that of the bulk weld metal characterized by a homogeneous composition resulting from the mixing in the liquid pool of the filler metal with part of the base metal. For most of the authors [19,20,21,22,23] the origin of this partially mixed zone is related to fluid flow and the existence in the molten pool of a stagnant fluid layer poorly stirred by convection in contact with the solid substrate, where solute transport would occur mainly by diffusion in the liquid. Close to the fusion line in this transition layer the rapid decrease of the thermal gradient and increase of the solidification rate produce morphological transitions of the liquid-solid interface, from planar front to cells and dendrites, but also eventually a change in the primary solidification phase [24,25,26]. For Fe-C-Al-Mn steels solidifying into primary δ-ferrite in conditions close to equilibrium, an increase of the solidification rate was observed to promote the primary solidification of non-equilibrium γ-austenite using time-resolved X-ray diffraction [11,27].
In welds between a ferritic and an austenitic steel, the combination of the local chemical composition and the rapid cooling subsequent to welding creates a narrow band of martensite along the fusion line [15,20,28] that greatly influences carbon migration and microstructural evolutions during post-weld heat treatment [29,30,31] with a significant effect on the mechanical properties of the joint [10,32]. Another characteristic feature of ferritic/austenitic welds is the occurrence of Type-II grain boundaries on the weld metal side, next to the fusion line and almost parallel to it, that have been prone to premature cracking under stress [18] or hydrogen-rich environments [4]. Different mechanisms have been suggested to account for their origin: (i) a change in the primary solidification phase from δ-ferrite to γ-austenite in the case of primary δ solidification [33] or (ii) the migration from the heat-affected zone (HAZ) towards the weld metal of austenite grain boundaries during the δ→γ transformation of the ferritic base metal upon cooling [4].
Most of the above microstructural characteristics have been reported on DMWs produced by gas tungsten arc welding. Some of them have also been observed in welds produced by submerged arc welding and correlated with hardness measurements [14,16,18], tensile properties [16] and fracture behavior [16,18]. However, no correlation was made with the local solidification conditions (thermal gradient G and solidification rate V) controlling the microstructure formation during the SAW process. Although not available through direct measurements during welding, these conditions (G, V) might be deduced from macro-microstructural measurements with use of both classical solidification models and correlations already published between solidification parameters and macro-microstructure. They would thus provide interesting data for SAW numerical modelling whose results are generally tested only on macrostructural features such as the geometry and size of the weld and HAZ [34,35,36].
Hence the objectives of the present study were:
(1)
to investigate the evolutions of composition, morphology, microstructure, and solidification mode near the fusion boundary of a single-pass weld produced by SAW between the 18MND5 low-alloy steel (similar to ASTM A533 grade B or DIN 1.6308) and the 309L stainless steel;
(2)
to evaluate from these data the local values of the solidification parameters (G, V);
(3)
to discuss the mechanisms responsible for the selection of the primary solidification phase observed at the fusion line by questioning the melting behavior of the base metal;
(4)
to use thermokinetic computations and the solidification model for explaining the transitions in solidification mode and predict their location in the welded joint.

2. Materials and Methods

2.1. Base Materials and Weld Production

The chemical compositions of the 18MND5 base metal and the 309L filler metal used for this work are listed in Table 1 and the welding parameters chosen for the SAW process are summarized in Table 2. During welding the molten pool and the arc zone were protected from atmospheric contamination by being “submerged” under a blanket of granular fusible flux consisting of silica and other oxides and fluorides. The dimensions and thickness of the base metal plate to be cladded were respectively 630 × 1200 mm2 and 90 mm. The strip electrode was 60 mm wide and 5 mm thick. Only one layer was deposited on the base metal plate in order that the as-welded microstructure might not be modified by thermal effects associated with other deposits next to or above the initial one. Preheating of the piece to be cladded and drying of the flux material have been performed to minimize the hydrogen content in the deposited metal and so the risk of premature cracking.

2.2. Characterization of Composition and Microstructure

Transverse and longitudinal cross-sections were prepared for optical and scanning electron microscopy (SEM) by grinding and polishing with diamond down to 1 µm. A double etching technique was required to allow for the simultaneous observation by optical microscopy of the various microstructures throughout the dissimilar junction: immersion in a Nital solution (4% HNO3 in methanol, 5 s) to etch the base metal was followed by an electrolytic etching of the weld in a chromic acid solution (100 mL H2O, 10 g CrO3, 4 V, 1 A·cm2, 5 s). Electrolytic etching in a nitric acid solution (50% H2O, 50% HNO3, 1.2 V, 20 mA·cm2, 20 s) revealed the morphology of both the fusion line and the solidification front. Lichtenegger and Bloesch chemical solution (100 mL H2O, 20 g NH4HF2, and 1 g K2S2O5) was used for its sensitivity to the level of microsegregation occurring during solidification of the weld and resulting in specific colors for ferrite and austenite.
Composition profiles were measured by both wavelength dispersive spectroscopy (WDS) and energy dispersive spectroscopy (EDS). WDS measurements were performed on a CAMECA SX50 (Gennevilliers, France) electron probe micro-analyzer (EPMA) equipped with the XMAS software (SAMX, Trappes, France), with an accelerating voltage of 16 kV and a probe intensity of 600 nA. Reference samples made of the pure metals and the phi-rho-z method for correction were used for quantification. Measurements were made every 20 µm in the homogeneous parts of the base and weld metals far from the fusion line, and every 5 µm in the near-interface area. EDS on a JEOL JSM 6400 SEM (Peabody, MA, USA) equipped with a BRUKER AXS SDD detector (Billerica, MA, USA) was chosen for the measurements of inter-cellular and dendritic microsegregations with a step of 0.5 µm. No measurement was performed for carbon and nitrogen. When necessary, their local content was evaluated based on a dilution coefficient d (w(C, x) = d(x) × w(C, 18MND5) + (1 − d(x)) ∗ w(C, 309L) with d(x) = (w(Ni, x) − w(Ni, 309L))/(w(Ni, 18MND5) − w(Ni, 309L)), w(X,x) being the mass content of element X at the distance x from the fusion line) which corresponds to the proportion in which the base metal participates by its own melting to the fusion zone. This dilution ratio was estimated from the Ni profile, Cr being potentially subjected to evaporation during welding and additions from the flux.
Electron backscattered diffraction (EBSD) analysis was used to study the orientation relationships between the solid substrate and the weld metal. The samples were prepared by classical mechanical grinding and polishing techniques, the last step consisting of prolonged polishing in a colloidal silica suspension (0.04 µm) to remove residual cold-working. EBSD patterns were acquired on a JEOL 7001F SEM under the following conditions: an acceleration voltage of 20 kV, a specimen tilt of 70°, a working distance of 20 mm and a scan step varying between 1 µm and 400 nm on a hexagonal grid. Kikuchi patterns were automatically analyzed using the OIMTM software (TSL-EDAX, Mahwah, NJ, USA). Automatic reconstruction of the parent grains orientation was performed with the ARPGE software (CEA, Grenoble, France). Of interest in this software is the fact that there is no need for any residual parent phase. After a specified orientation relationship was postulated between parent and product phases, the product grains were identified, and the calculation proceeded in two steps: first a nucleation step with a low tolerance angle (3° in the present case) and then a growth step with a larger tolerance angle (6°). A detailed description of the ARPGE program can be found in references [37,38].

2.3. Thermodynamic Calculations

Thermodynamic calculations, both phase equilibria and modified Scheil-Gulliver solidification, were performed with Thermo-Calc® software (Solna, Sweden)) [39] together with the TCFE6 database dedicated to iron-based alloys. In the modified Scheil-Gulliver model the fraction and composition of all phases during solidification are calculated step by step by applying local equilibrium at interface, with the assumption of a very slow, and therefore negligible, diffusion of substitutional species in the solid phases, whereas back diffusion for carbon and nitrogen is considered at infinite rate in both ferrite and austenite.

3. Results

A longitudinal cross section of the weld (XZ plane) is presented in Figure 1, displaying both the melting and solidification fronts, with the weld direction along X axis. The evolution of the growth rate (liquid-solid interface velocity) VZ with the distance Z from the fusion line can be determined by simple geometrical considerations as depicted on this figure: for a point M with coordinates (X,Z) the velocity VZ is found by projection of the travel speed of the strip electrode V t on the direction V perpendicular to the solidification front at M:
V Z =   V t cos θ
At the bottom of the liquid pool (Z = 0 and θ = π/2) solidification starts in contact with the unmelted base metal with a velocity V equal to zero and goes on at an increasing rate when the solidification front moves away from the base metal (Table 3).
In what follows microstructures will be analyzed on transverse sections (YZ planes).

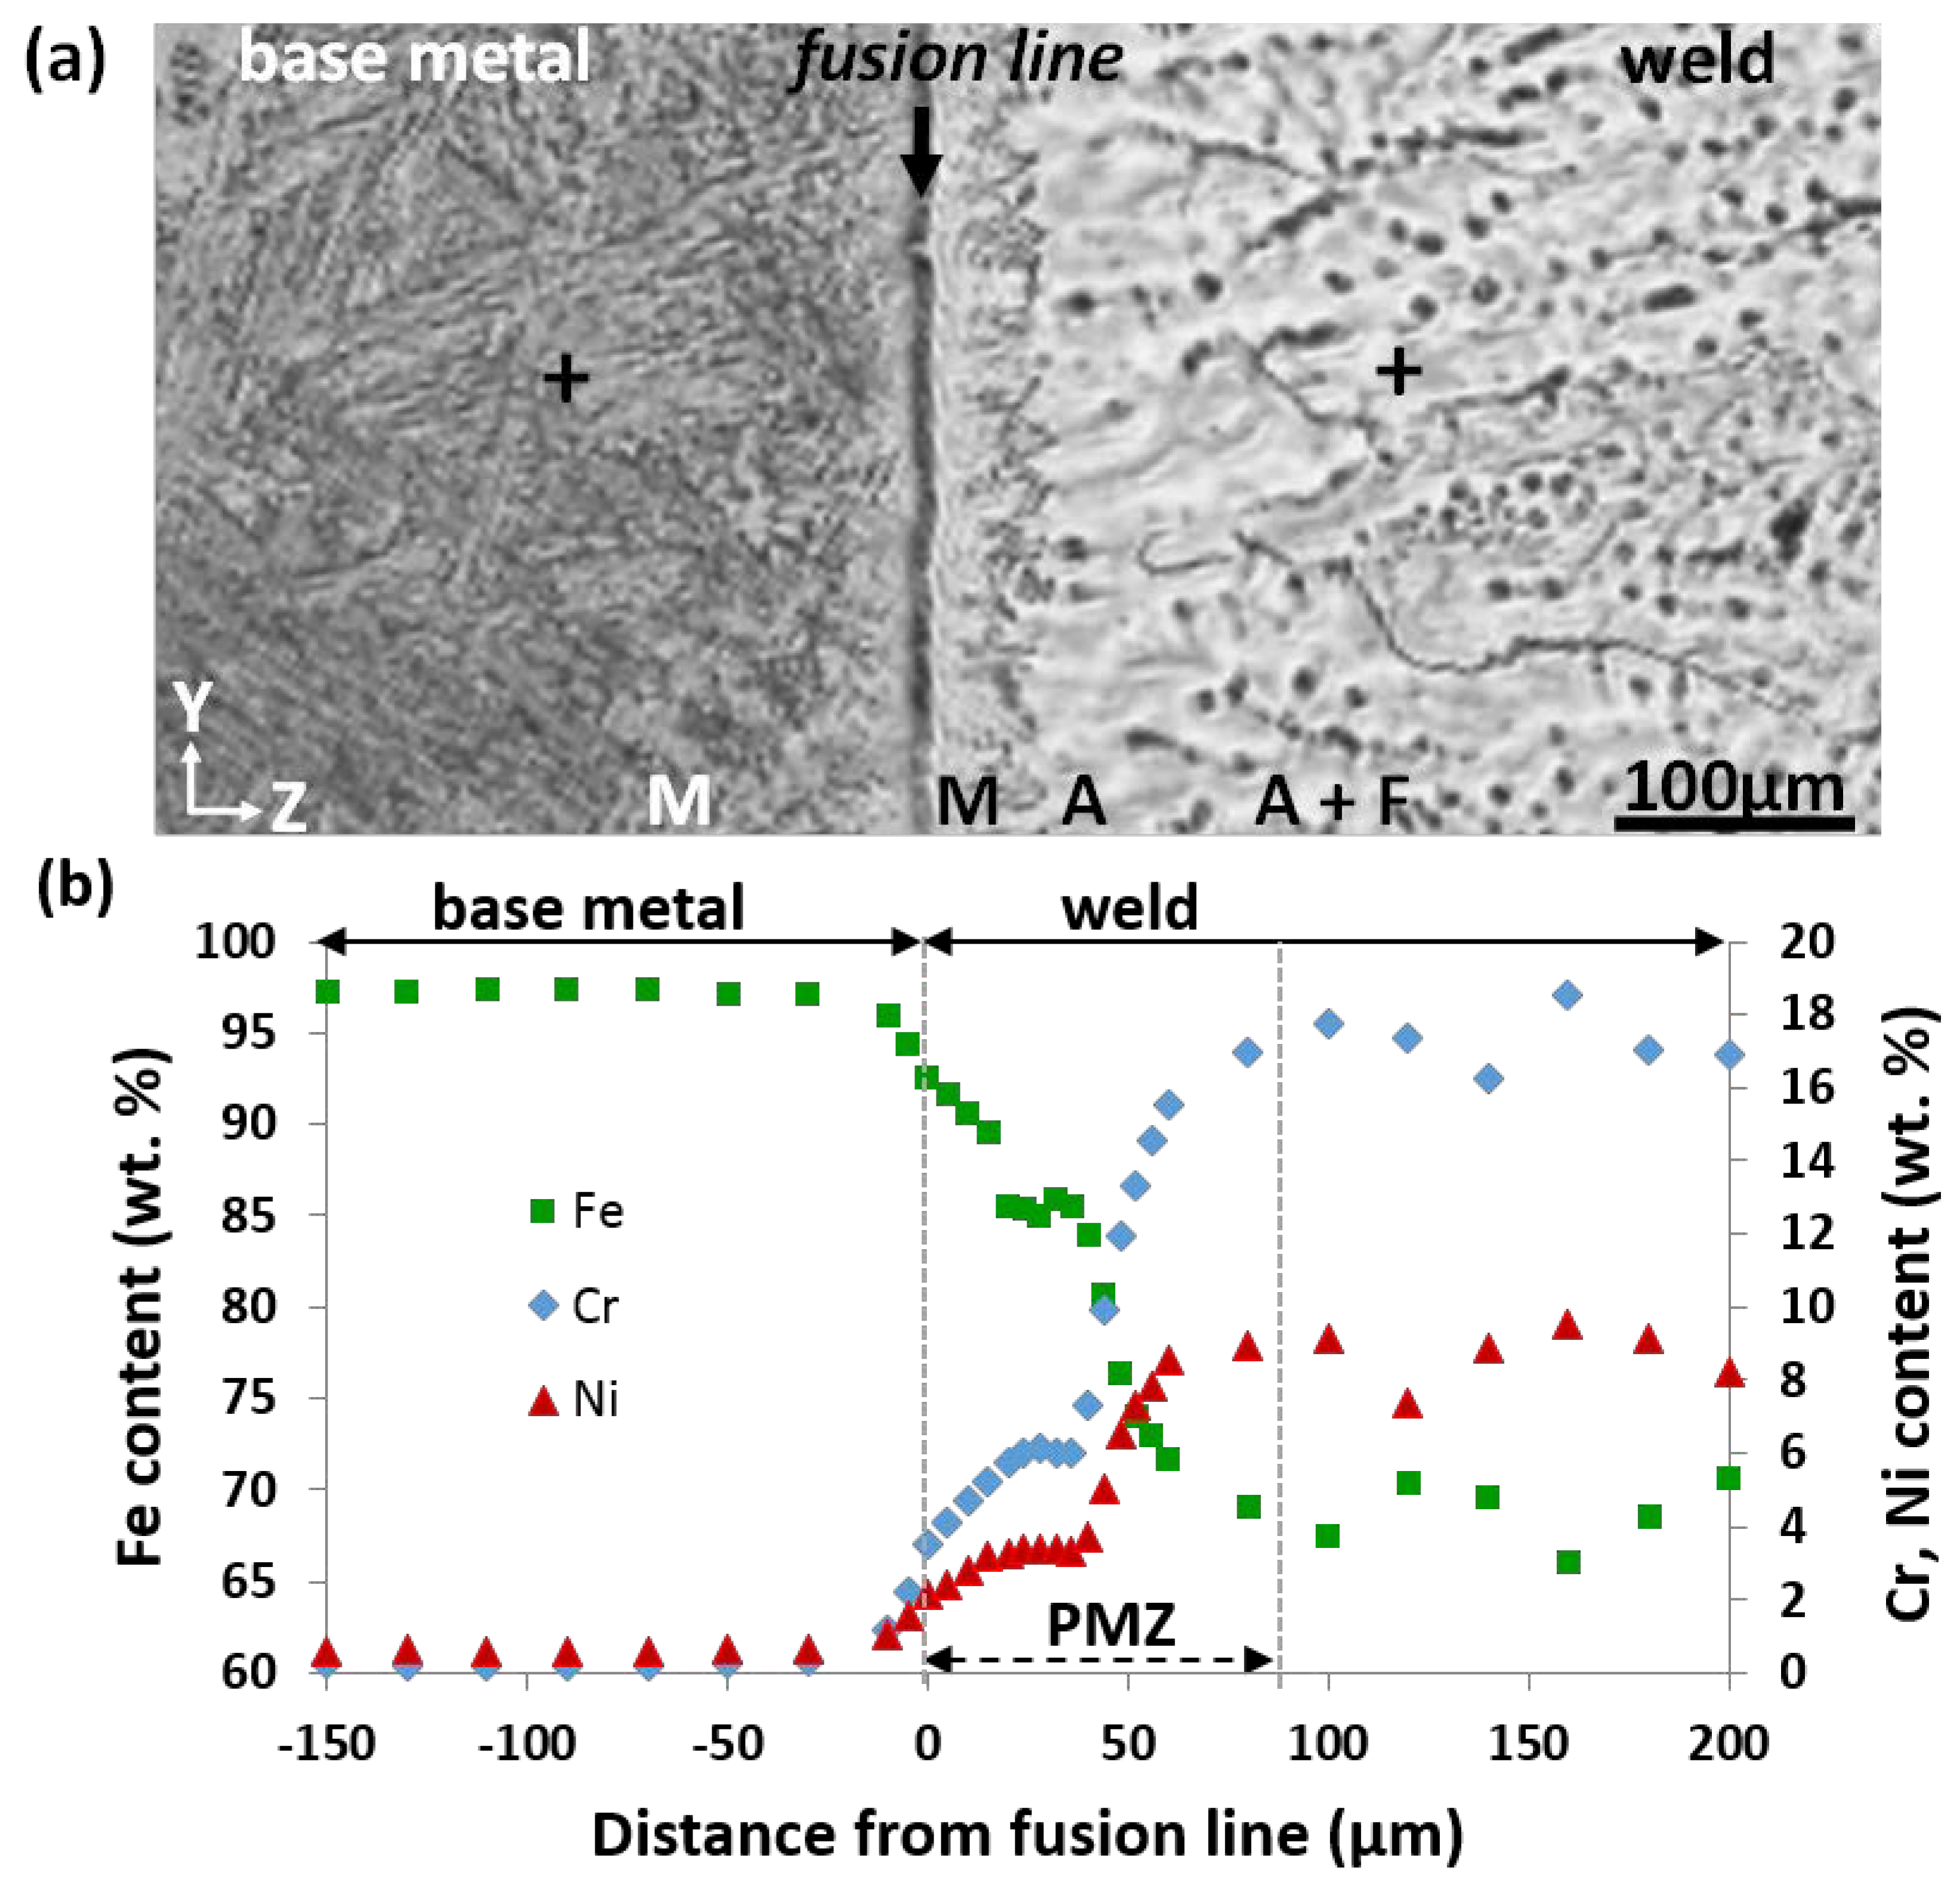
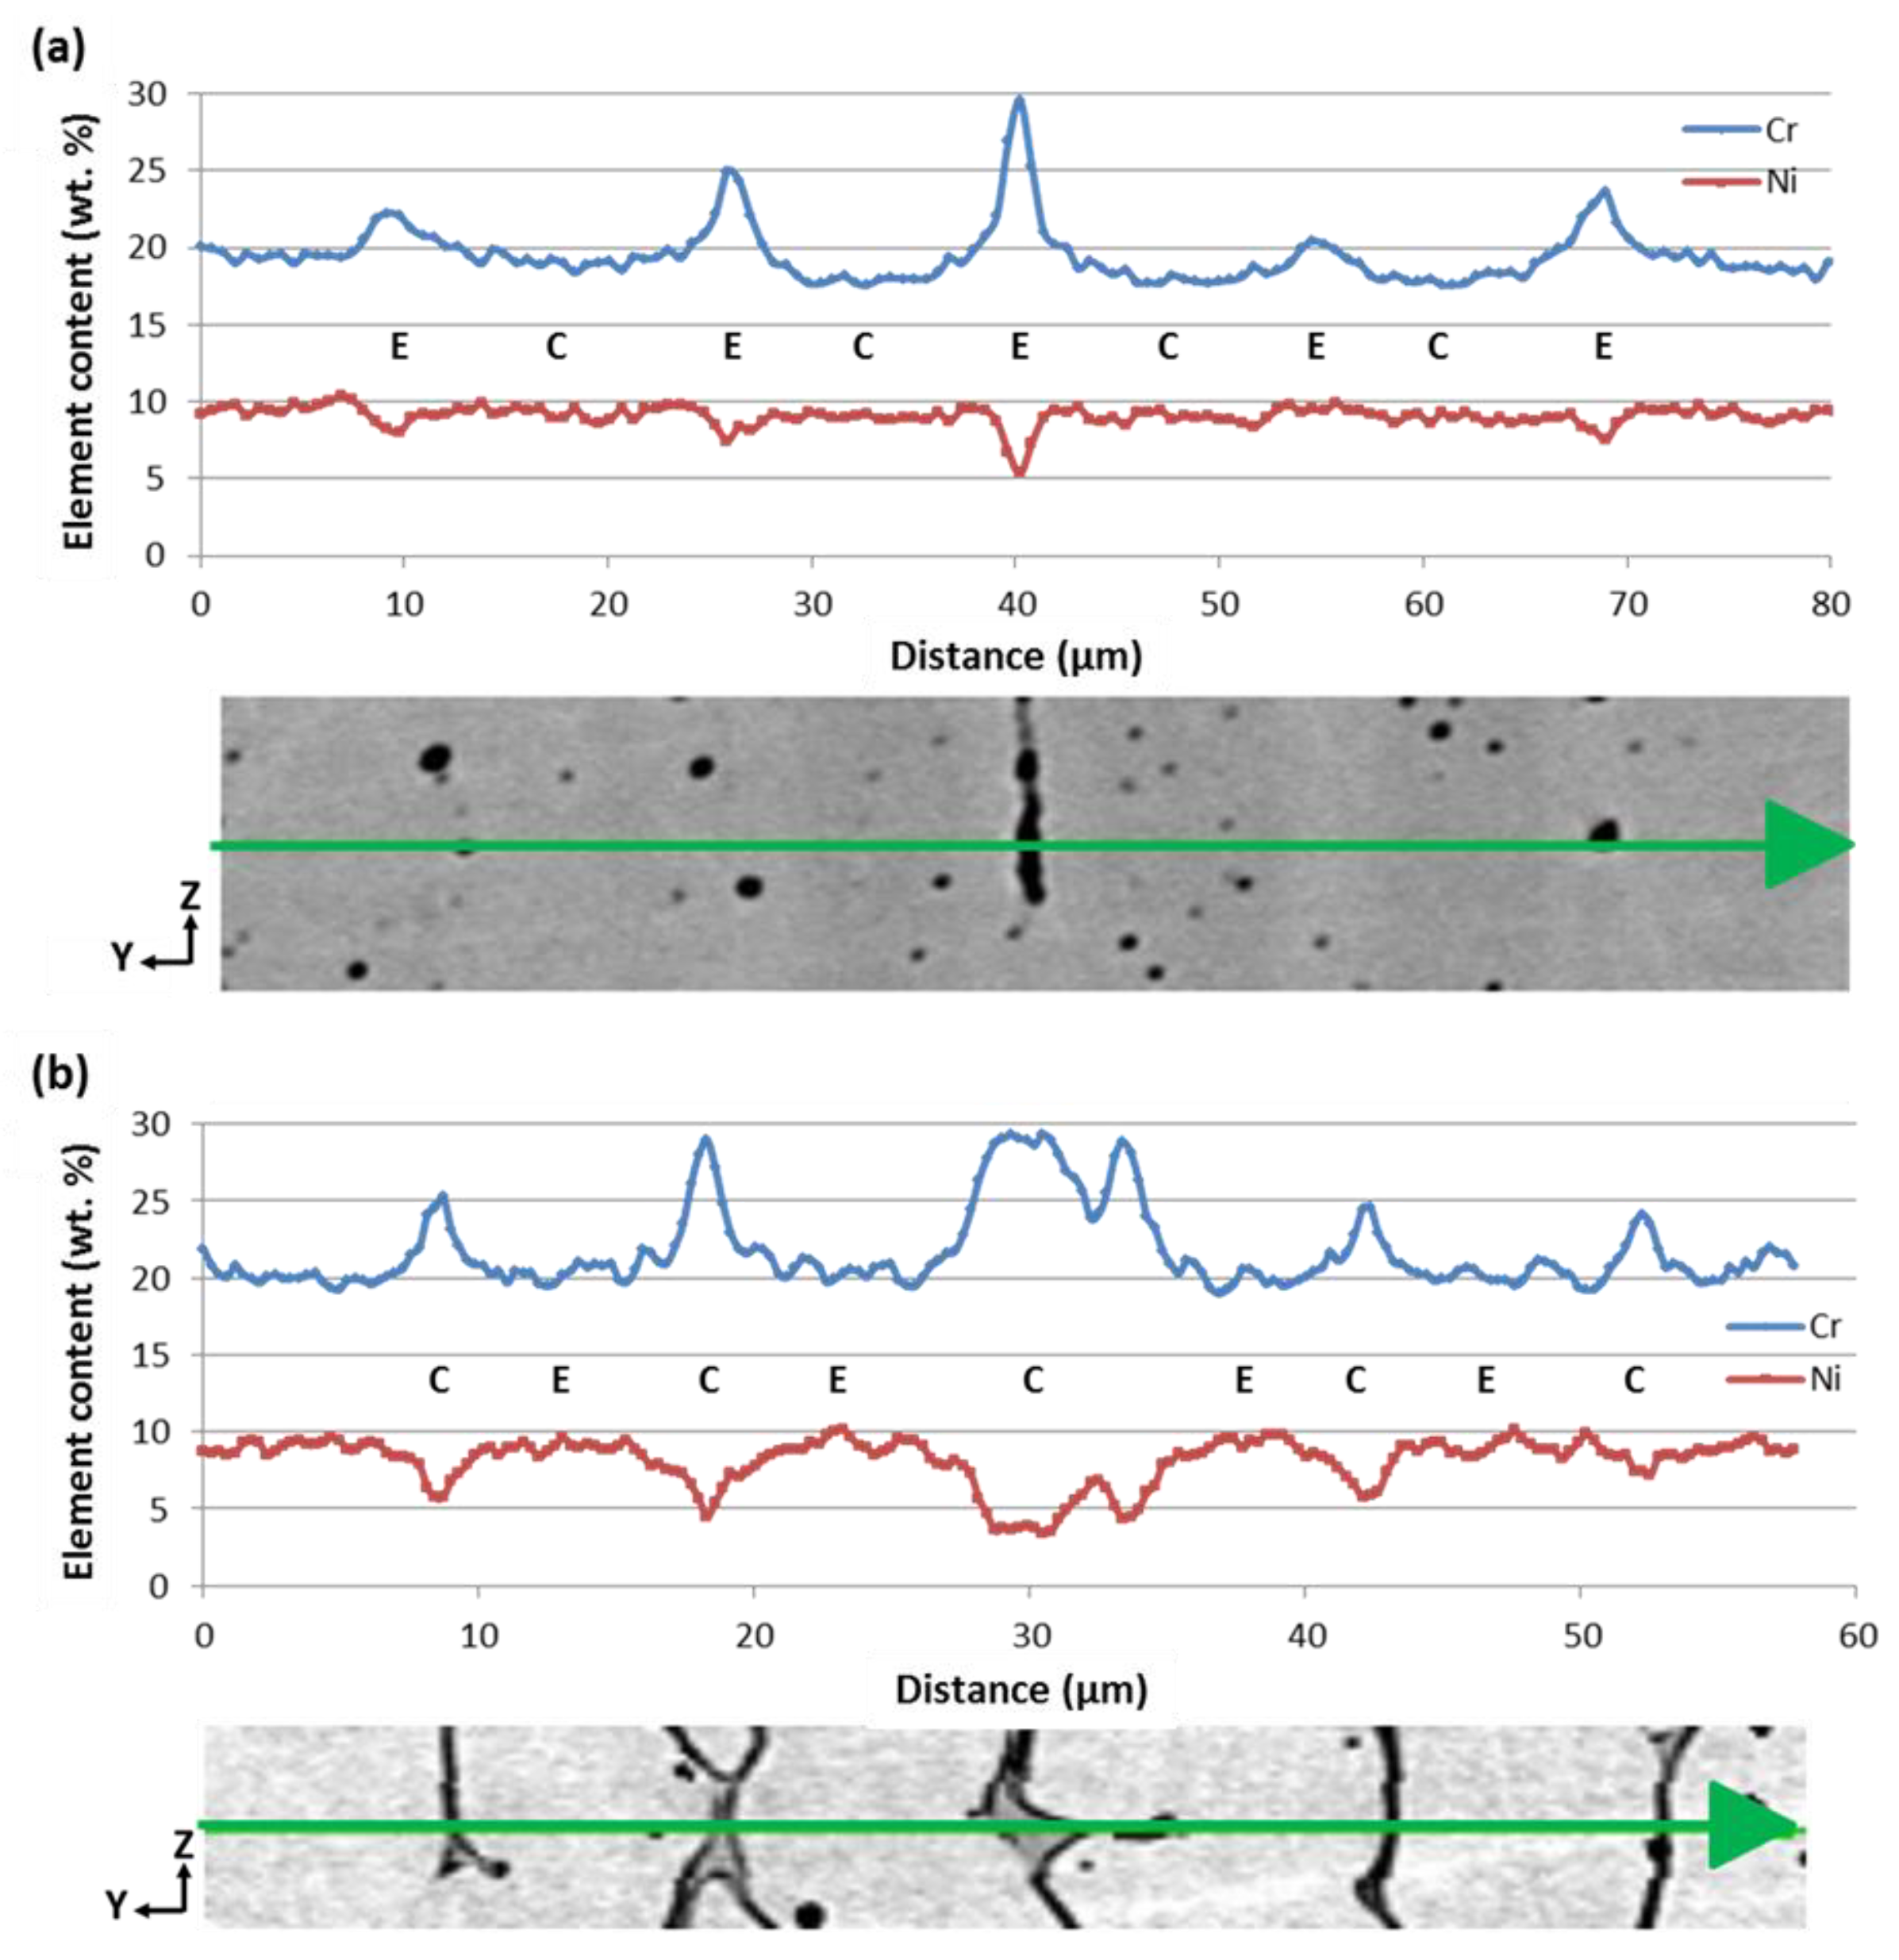
3.1. Evolution of Composition and Microstructure through the Weld

On the base metal side, the original bainitic structure of the 18MND5 plate has been replaced by martensite in the heat-affected zone, and on the weld side one meets successively a narrow layer of martensite, a fully austenitic zone and then the two-phase δ−γ microstructure typical of a stainless steel with 18 wt. % Cr and 9 wt. % Ni (Figure 2a).
Composition profiles measured across the fusion line by WDS on a transverse section of the weld and plotted for Fe, Ni and Cr (Figure 2b) show three regions: the heat affected zone of the base metal which remained solid during welding, then a transition zone in which composition gradients take place and finally a quasi-flat part resulting from the homogeneous mixing of the molten metals in the weld pool by convection in proportions 20% base metal-80% filler metal, in agreement with the remelted width of the 18MND5 substrate. In the transition zone the composition profile has been refined with one measurement every 5 µm to precisely capture variations occurring over short distances. This region, often referred in the literature as PMZ (partially mixed zone) corresponds to a boundary layer in which only partial mixing occurs by convection and diffusion in the liquid phase, with convection decreasing as fluid velocity tends to zero at the fusion line.
The width of the martensitic layer observed on the weld side is directly related to the Cr and Ni composition profiles, the upper limits for martensite formation (~14% Cr and 7.5% Ni from Ms temperature determination) being measured at ~50 µm from fusion line (Figure 2b) in good agreement with the experimental observations (Figure 2a). Nevertheless, the extents of both the PMZ and martensitic layer may be subject to variations due to fluctuations caused by the arc affecting hydrodynamic motions in the melted bath.

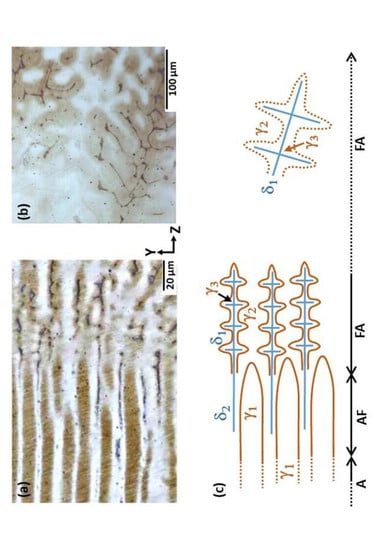
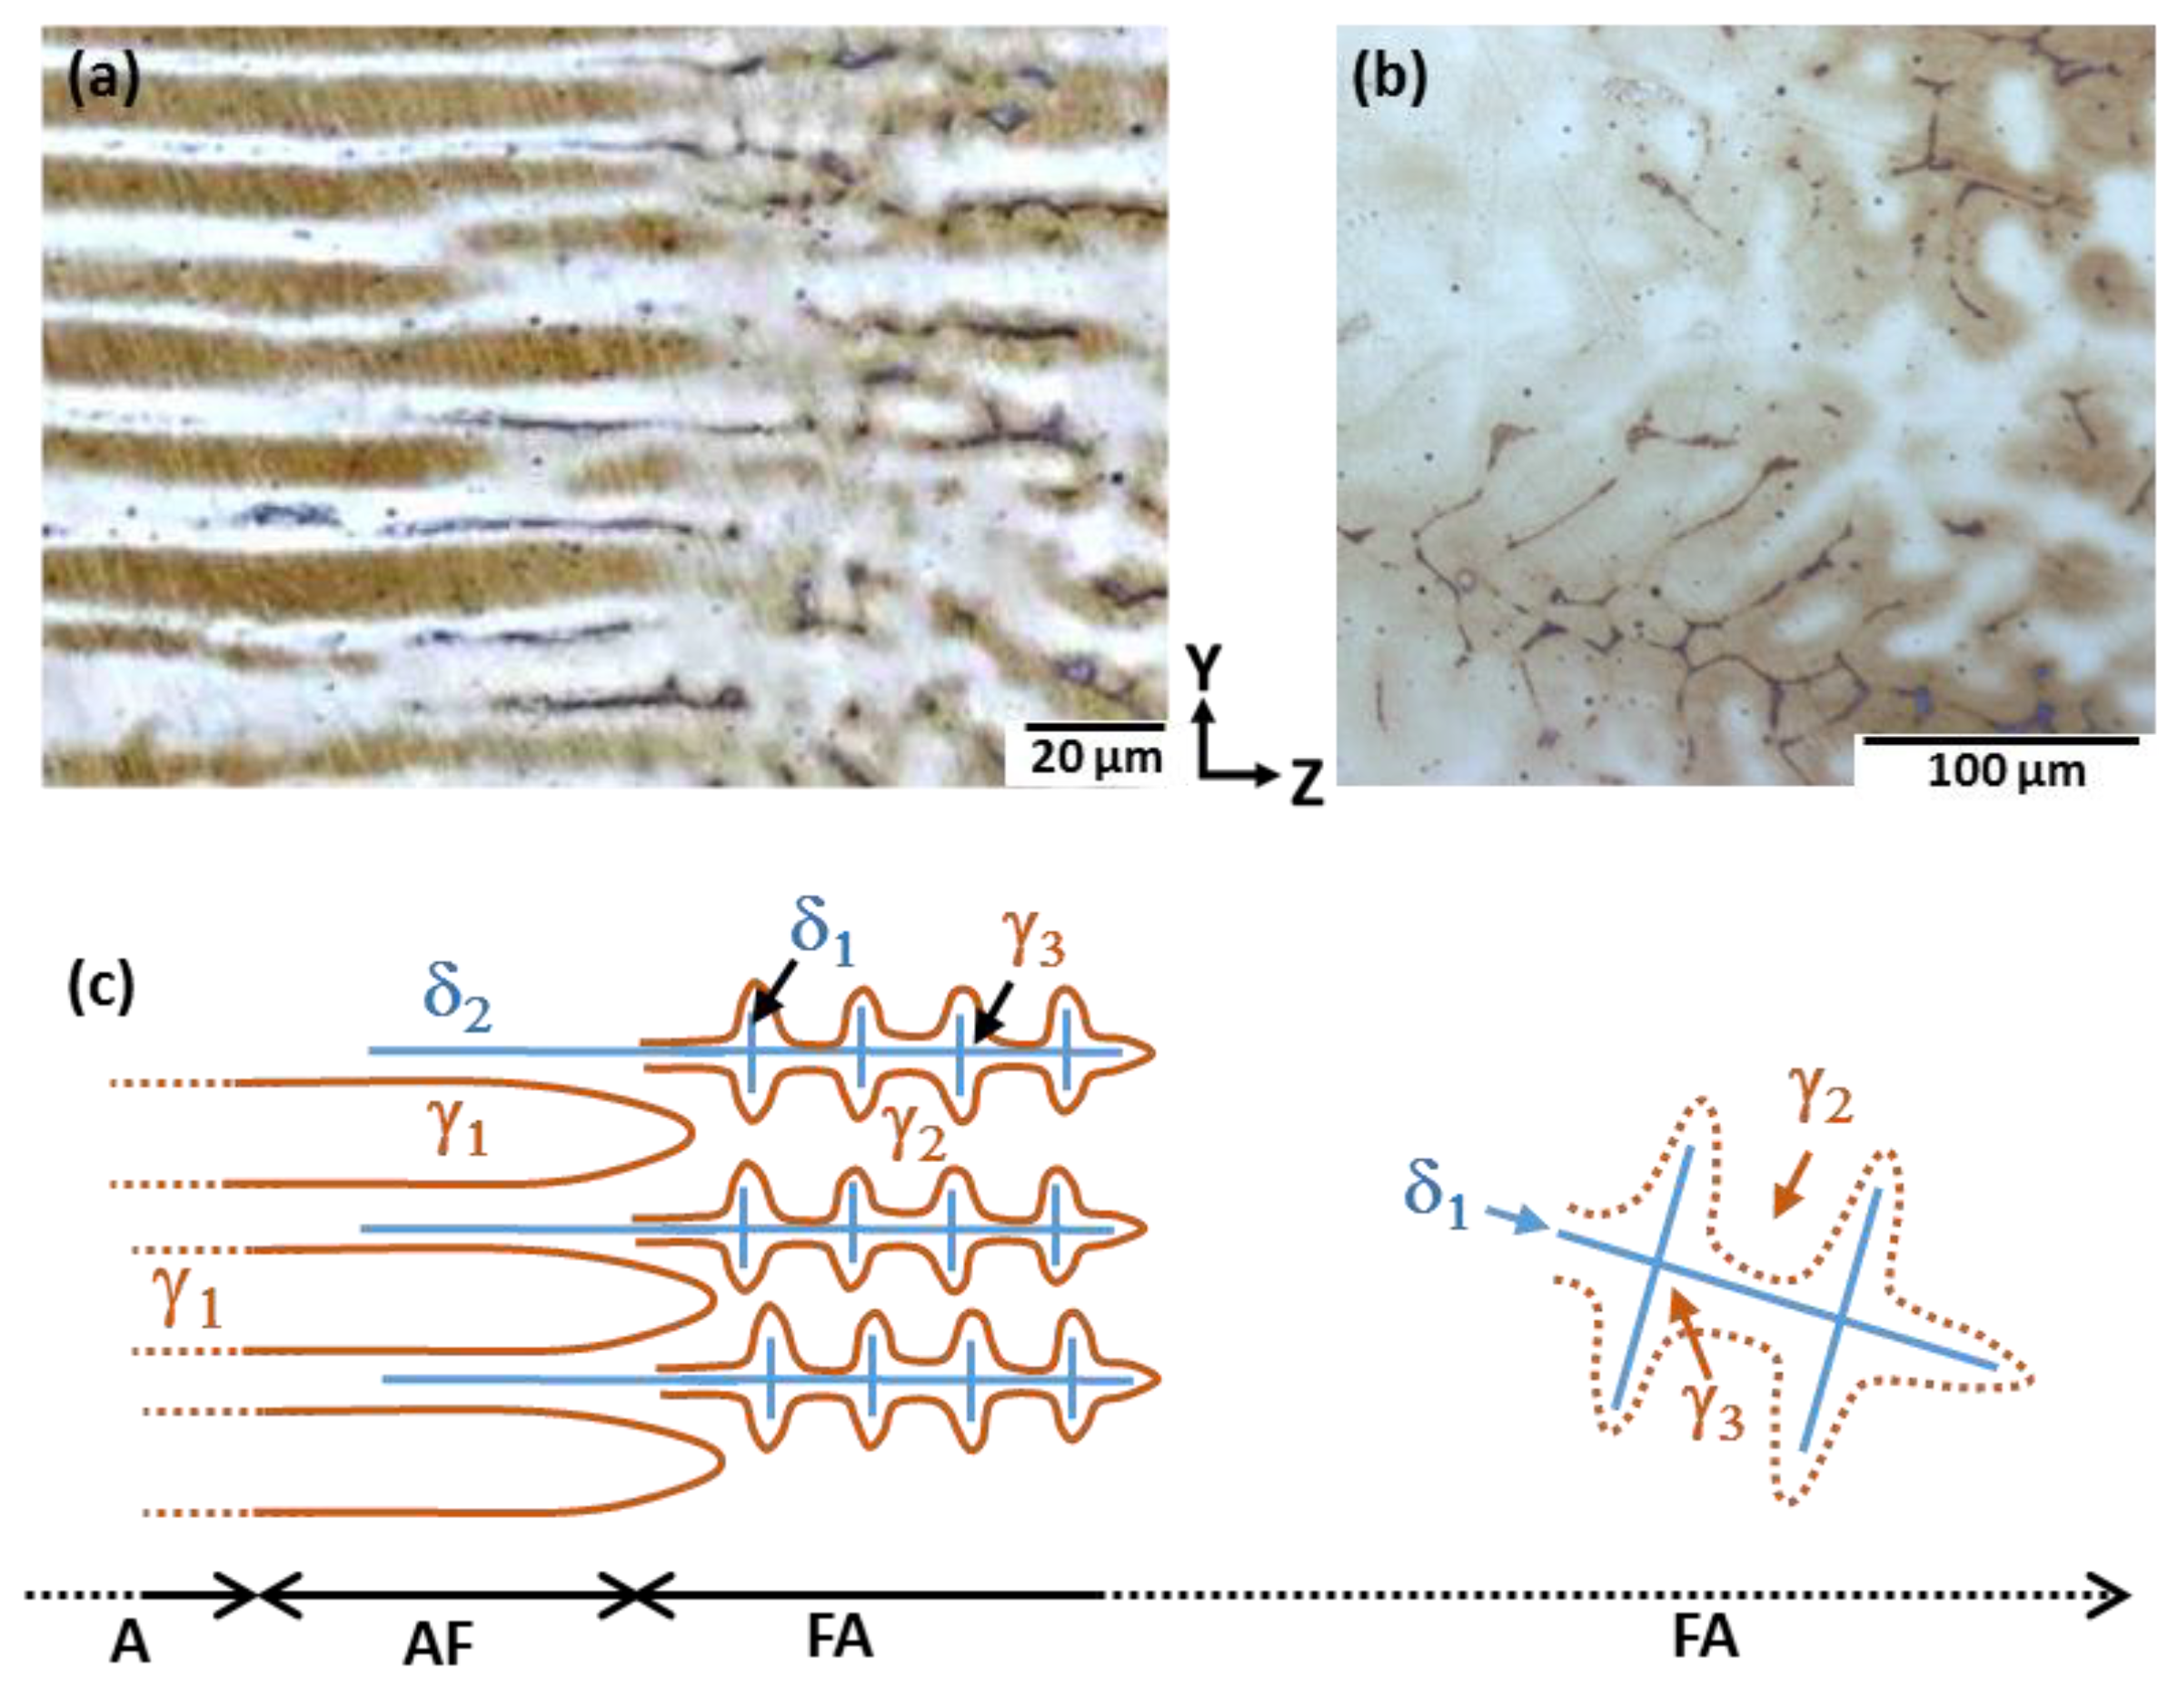
3.2. Morphological Evolution and Change in the Solidification Mode

The morphology of the fusion line appears corrugated with a wavelength varying between 7 and 15 µm along the interface (Figure 3). The interpenetration of base and weld metals over a ~10 µm thickness corresponds to the extent of the mushy zone at the end of the melting stage, the penetration of the liquid enriched by diffusion in elements from the filler metal being evidenced on EDS maps, as shown in Figure 3c for Cr.
Starting from the fusion line where solidification begins with a rate equal to zero and progressively increases towards the bulk of the weld, several morphologies of the liquid-solid interface are encountered: a planar front is observed over ZPC ~ 20 µm, before getting destabilized first into cells and then into dendrites (Figure 3a and Figure 4). The intercellular spacing λ1 varies from λ 1 P C ~   10   μ m at the plane front to cells transition to λ 1 C D ~   15   μ m at the cells to dendrites transition where the mean secondary dendrite arm spacing (SDAS) is λ 2 C D ~   6   μ m .
In addition to these morphological transitions, several changes in the solidification mode occur close to the fusion line: in the regions of plane front growth and beginning of cellular growth only austenite is identified, then progressively some δ ferrite appears first in the inter-cellular zones in between the γ cells, before finally being observed in the center of the dendrites, surrounded by austenite (Figure 4a,b). The latest microstructure (visible beyond 100 µm from fusion line) is typical of primary ferrite solidification [40]. These observations suggest an evolution in the solidification modes depicted in Figure 4c:
(1)
A mode: Liquid→γ1
(2)
AF mode: Liquid→γ1, followed by Liquid→γ1 + δ2
(3)
FA mode: Liquid→δ1, followed by Liquid→γ2 and by δ1→γ3 during cooling.
Nevertheless, in the regions where only austenite is observed, its formation could result from a solid-state phase transformation (δ1→γ3) instead of a direct solidification (Liquid→γ1). Therefore, complementary investigations were required to determine the successive solidification modes. The solute partitioning between solid and liquid phases during growth was used for this purpose, referring for each solute X (Cr, Ni) to its partition coefficient kX defined as:
k X =   w ( X ,   solid ) w ( X ,   liquid )
where w(X, solid) and w(X, liquid) denote the weight fractions of element X in the solid and liquid phases.
In the case of primary austenite solidification (Liquid→γ1, “A mode”), the partition coefficients for chromium ( k C r γ < 1 ) and nickel ( k N i γ = 1 ) reported in Table 4 predict no segregation of nickel in the growing austenite, but segregation of chromium towards the liquid that may lead to the formation of ferrite (δ2) in the late stages of solidification (“AF mode”).
Segregation profiles measured by EDS in the region of cellular growth following the plane front destabilization are shown in Figure 5a: the enrichment in Cr of the intercellular regions leading to secondary ferrite growth and the constant Ni content inside the cells clearly correspond to a primary austenite solidification in the near interface region [40].
In the case of primary ferrite growth (Liquid→δ1), the partition coefficients for chromium ( k C r δ 1 ) and nickel ( k N i δ < 1 ) reported in Table 4 predict no segregation of chromium but nickel segregation towards the liquid that eventually leads further to secondary austenite growth (Liquid→γ2) with Cr segregation. However, the further ferrite regression (δ1→γ3) starting at the δ12 interface creates a redistribution of Ni and Cr with a marked enrichment in Cr towards the inner part of the dendrites that stabilizes a ferritic core during cooling down to room temperature. The Cr and Ni profiles measured by EDS across the two-phase dendrites (Figure 5b) are in agreement with the above description of a primary ferrite solidification and regression [40]. The difference in the composition of the two types of austenite (γ2, γ3) is responsible for the difference in colors after Lichtenegger and Bloesch etching (Figure 4a,b).
Thus, these results clearly confirm the evolution of the solidification mode, from first single phase austenite (A mode of solidification) close to the fusion line towards primary austenite with ferrite as second phase (AF mode) in the region of cellular growth, and finally primary ferrite with austenite as second phase (FA mode) in the dendritic region that represents the main part of the weld. The latter transition (AF→FA) is observed near the transition between cellular and dendritic growth (Figure 4a), i.e., ZAF-FA ~ ZCD ~100 µm.

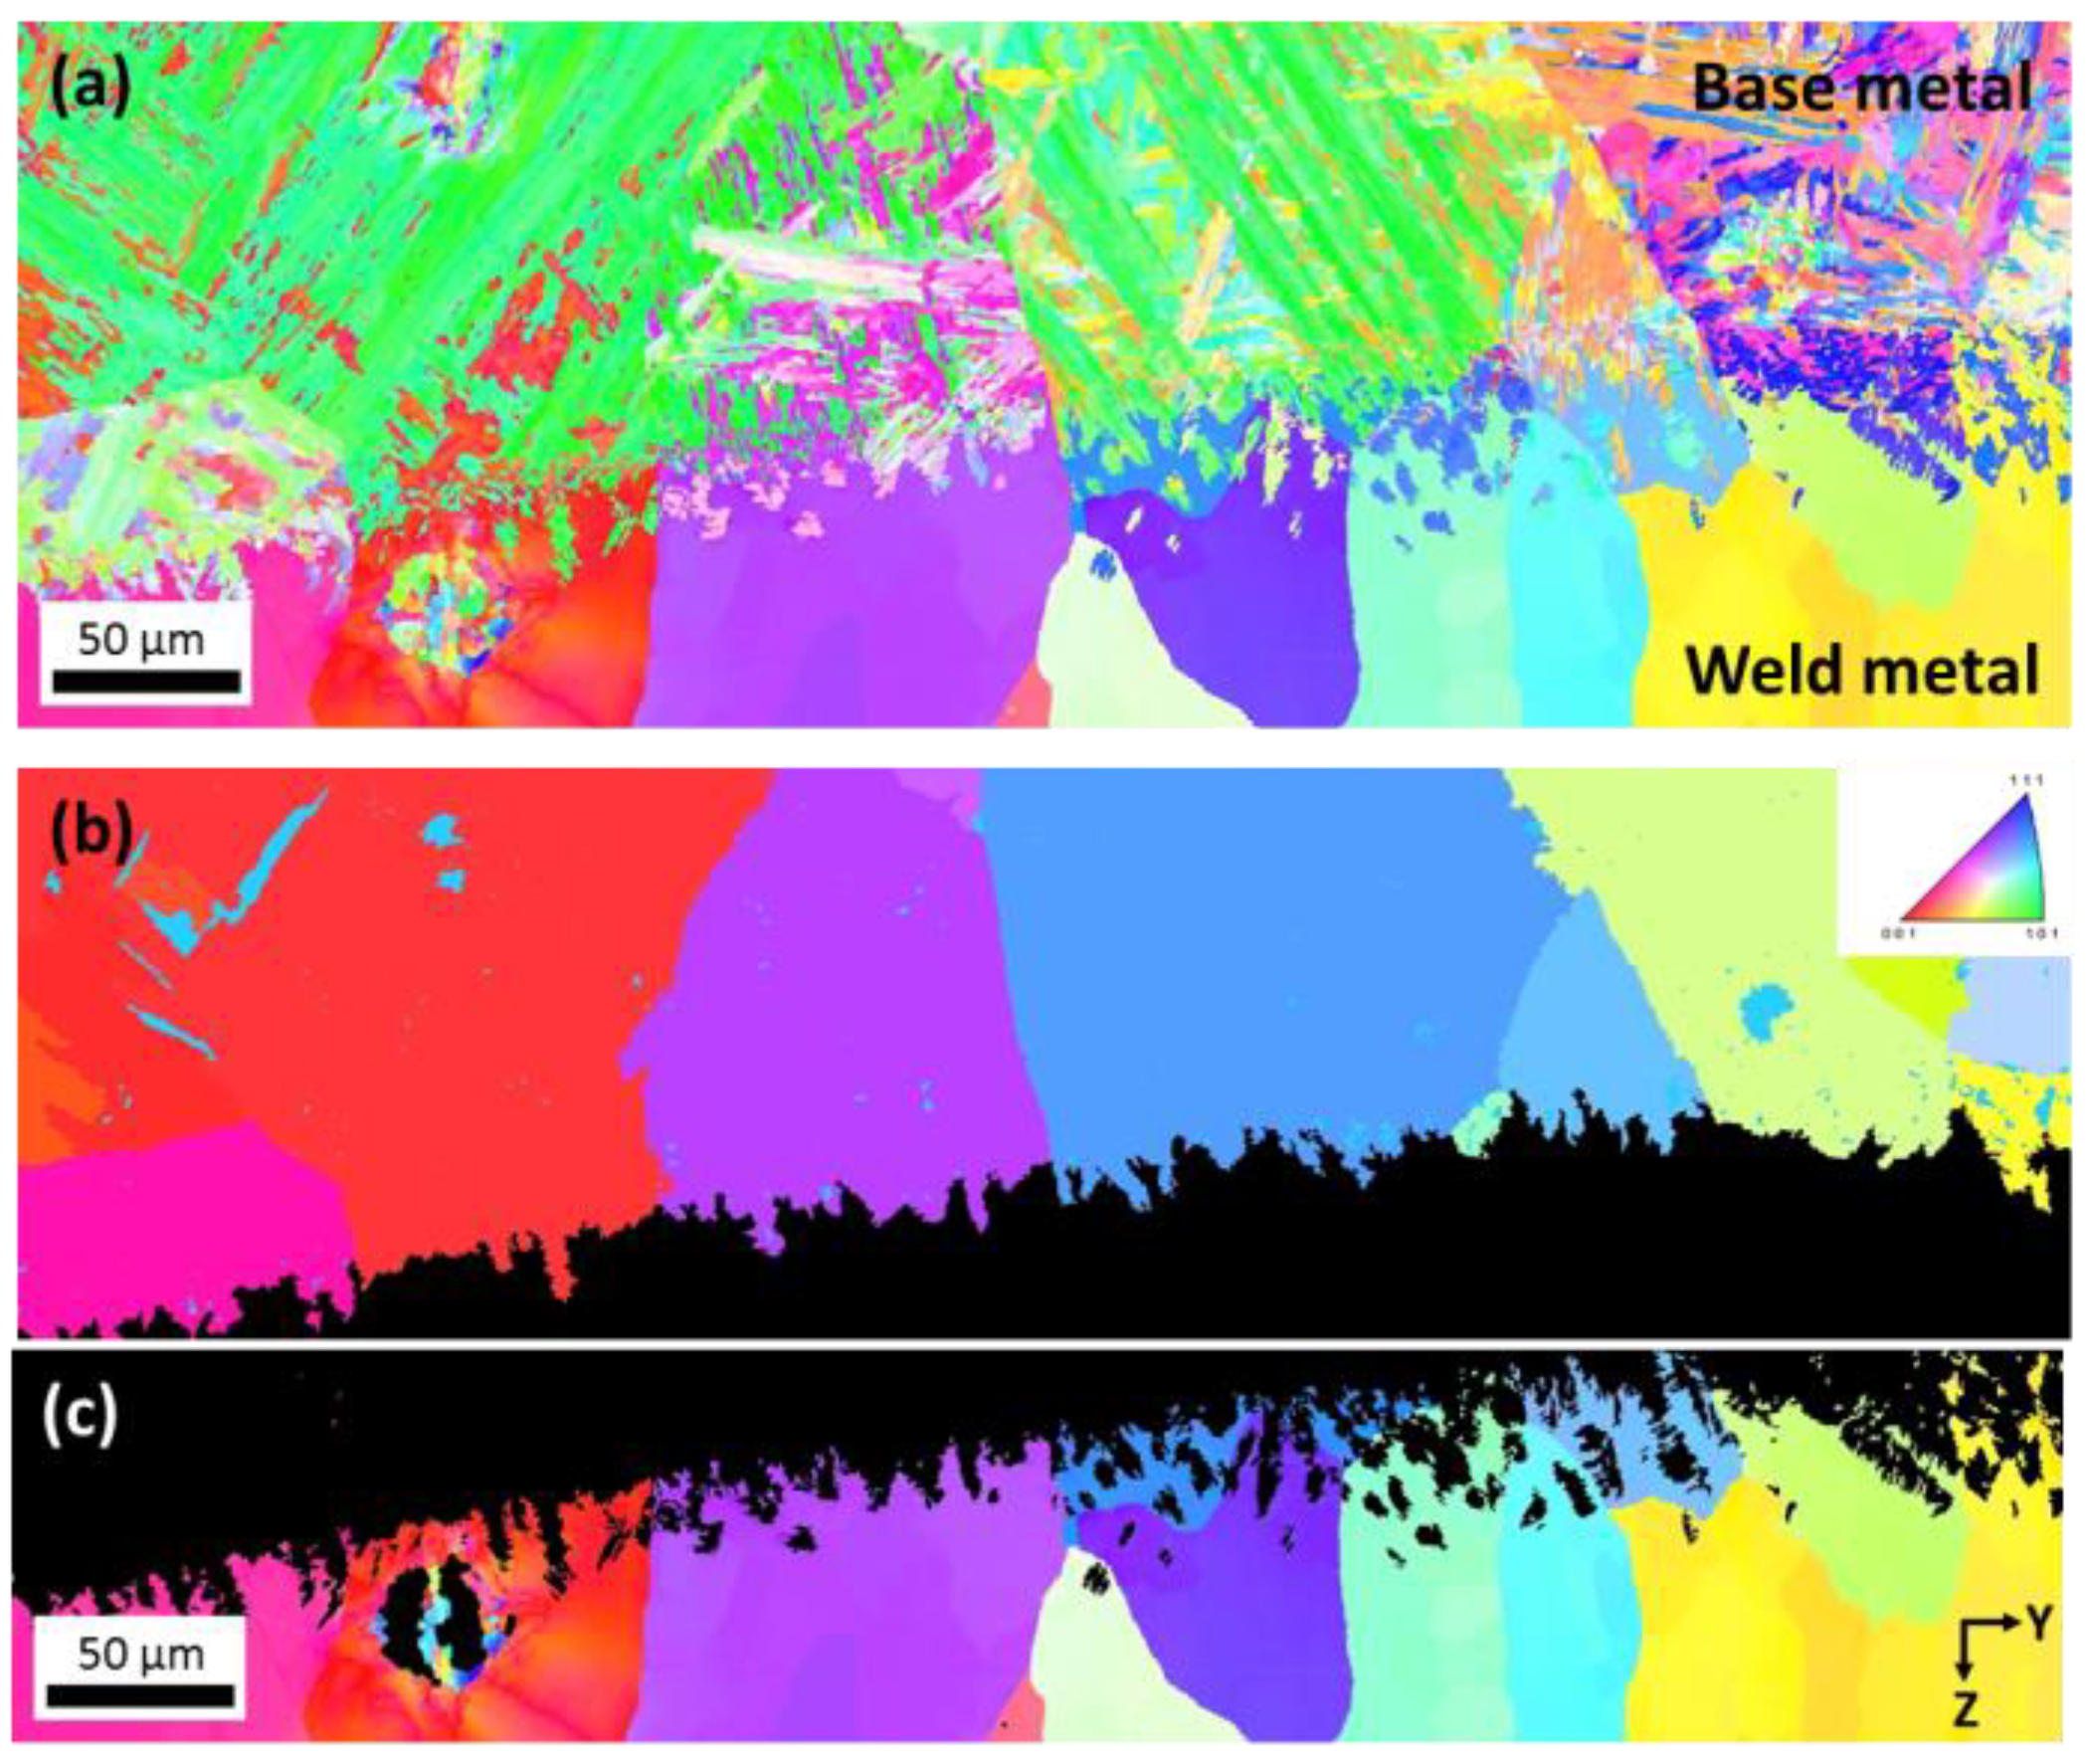
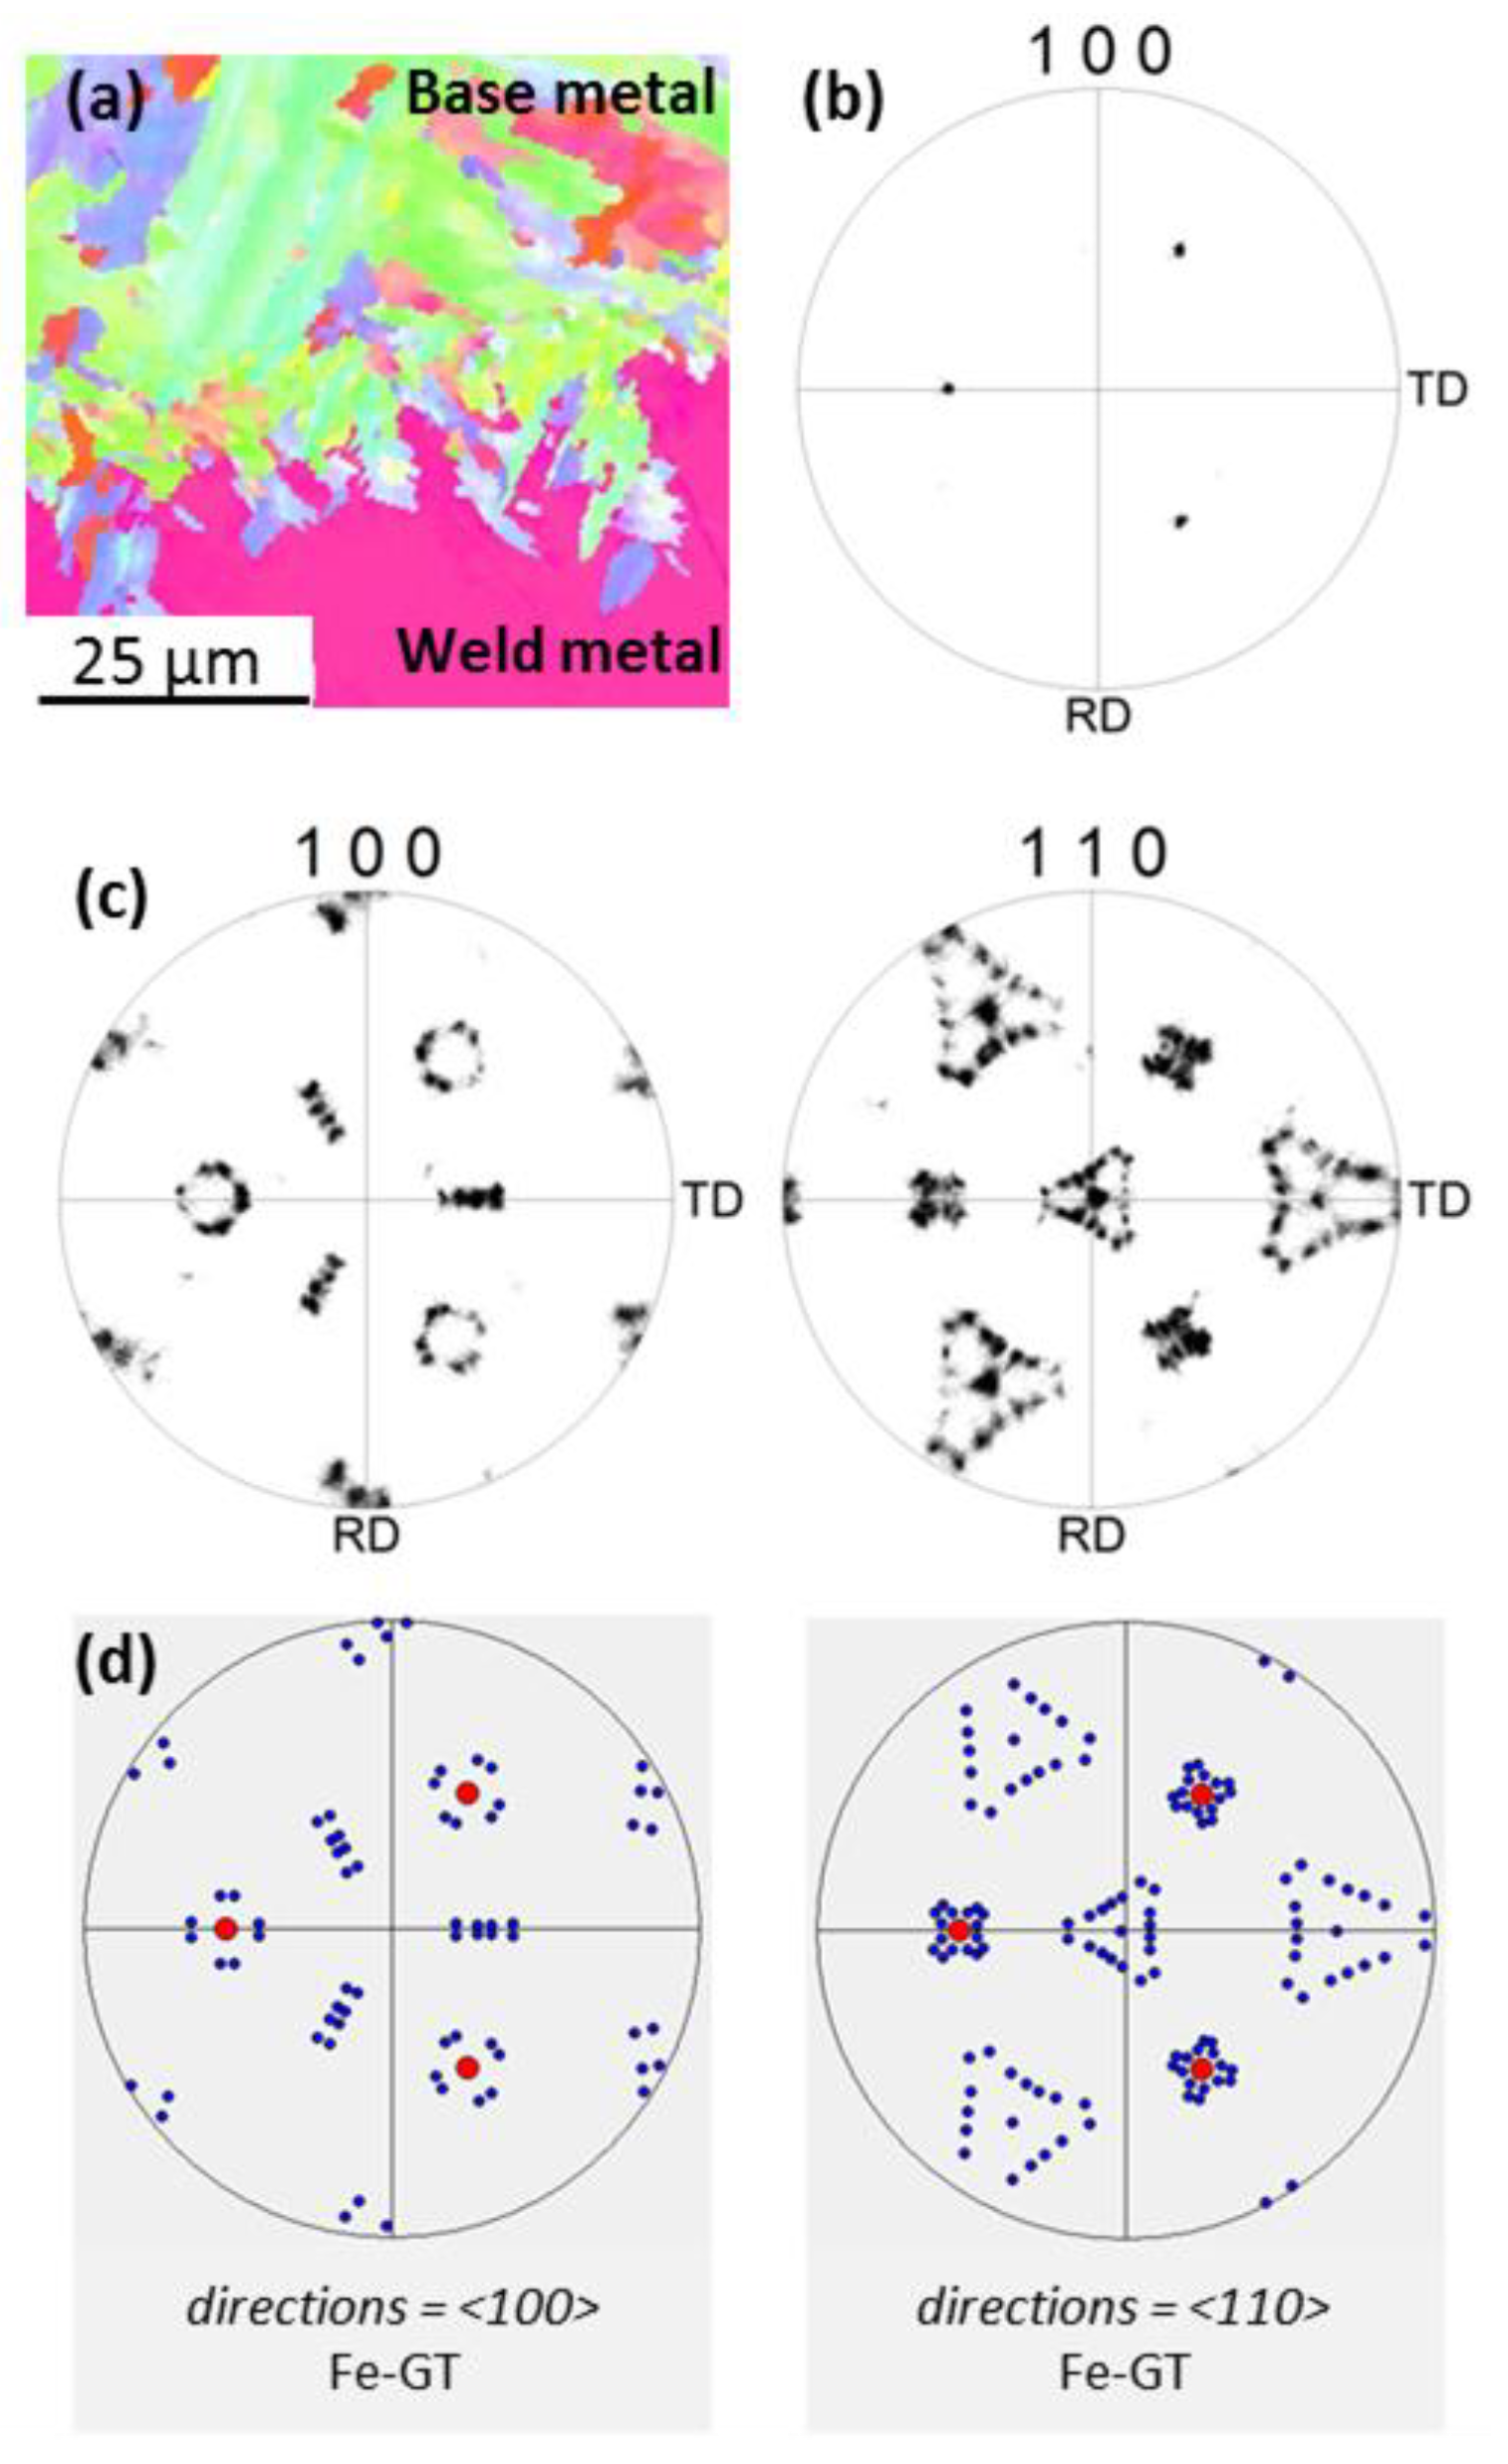
3.3. Orientation Relationship between Base and Weld Metals

A meticulous examination along the fusion line on etched samples revealed a continuity between the former austenitic grain boundaries of the base metal and the newly formed austenitic grain boundaries of the weld metal (Figure 6). These boundaries, often referred to as Type I grain boundaries on the weld side, seem to indicate that the austenitic region of the weld has grown either by epitaxy on the austenite grains of the base metal during solidification or by phase boundary migration during the subsequent δ→γ solid-state phase transformation, as will be discussed later.
For verifying these observations, an EBSD study of the orientation relationships (OR) between the base and the weld metals was conducted. Due to rapid cooling after welding, the base metal at the interface has a martensitic microstructure and no residual austenite was found to enable a direct comparison of its orientation with the one of the adjacent grain in the weld. For several austenitic grains of the weld lying along the fusion line, the <100> pole figure was compared with the <100> and the <110> pole figures from a set of martensitic laths formed from a single austenitic grain located in the base metal, just across the interface. One example is presented in Figure 7, and for all the grains tested in the base metal, each martensitic variant has one of its <100> and <110> directions lying around one <100> directions of the opposite austenitic grain in the weld. This is typical of a Bain transformation and indicates that there is a high probability for the former austenitic grain (from which the martensitic laths have grown) to have the same orientation as the adjacent FCC grain of the weld. The exact OR was then determined by comparing the experimental and simulated <100> and <110> pole figures of martensite crystal orientations inside a single austenite grain. The experimental pole figures were created by post-treatment of the EBSD maps with the OIMTM software. The simulated one were generated using the GenOVa program [41], assuming a given OR between the martensitic daughter grains and the austenitic parent grain. The better match was obtained with the crystallographic correspondence proposed by Greninger and Troiano (GT) [42] and is displayed in Figure 7c,d.
The GT transformation is intermediate between the well-known Kurdjumov-Sachs (KS) [43] and Nishiyama-Wassemann (NW) [44] ORs. Its Euler angles (φ1, φ, φ2) are 2.7, 46.6 and 7.5° respectively. This OR, which is implemented into ARPGE software, was postulated for the reconstruction of the parent austenitic grains on the base metal side and the results are shown in Figure 8. The orientations calculated in the base metal (Figure 8b) are in perfect agreement with the ones recorded in the austenitic grains of the weld metal, just across the fusion line (Figure 8c).

4. Discussion

4.1. Solidification Conditions at the Plane Front to Cell Transition

With a growth rate equal to zero at the fusion line the solidification front is planar with solute rejection into the liquid in front of the interface [45,46]. As the liquid composition and the growth rate continuously evolve in the partially mixed zone (PMZ) of the weld extending over ~100 µm, plane front solidification takes place in transient conditions. The plateau observed on the WDS profile around Z ~ 40 µm (Figure 2b) can thus not be ascribed to any steady state regime, as encountered during solidification of homogeneous liquids. The complex shape of the composition profiles in the PMZ region is rather the result of the coupling between the original diffusive/convective profiles established in the liquid at the end of the melting stage, and segregations occurring during solidification at a rate that varies with the velocity of the solid-liquid interface.
Then, as the solidification rate further increases, the morphology of the solid/liquid interface evolves to adapt the solute exchange area between solid and liquid phases to the growth kinetics. It corresponds to the transition from plane front to cells (PC) that can be predicted using the constitutional supercooling criterion [47], extended to ternary alloys [48] and applied to the Fe-Cr-Ni system:
V P C = G P C   [ D 11   k 1 m 1 C 1 0 ( k 1 1 ) +   D 22   k 2 m 2 C 2 0 ( k 2 1 ) ]
This criterion relates the local processing variables at the liquid-solid interface, i.e., the thermal gradient in the liquid G and the interface velocity V, to the alloy properties defined in Table 5 where the values have been extracted from TCFE6 and MOB2 databases. Knowing the value of the growth rate VPC ~ 175 µm·s−1 (Table 3) at the plane front to cell transition (ZPC = 20 µm), this criterion allows to deduce the local values of the thermal gradient GPC = 4 × 10⁶ K·m−1, and the cooling rate T’PC = GPC. VPC = 700 K·s−1. The assumption used of primary austenitic solidification is discussed in the next paragraph.
The order of magnitude of this thermal gradient seems to be quite high in comparison to available data in the literature concerning arc welding of stainless steel: 2.2 to 2.7 × 10⁵ K·m−1 for GTAW [24] and 3 × 10⁵ K·m−1 for SAW surfacing of S355 steel [36]. Nevertheless it should be pointed out that these values were deduced from temperatures measured either in the vicinity of the weld or on the weld pool surface [24], or obtained from computational modelling of thermal and fluid flow in the liquid pool correlated with experimental results such as the shape and size of the weld pool [35,36]. Thus, they do not bring a precise indication on the thermal gradient in the liquid at the bottom of the weld pool where this gradient is maximum. As there are no available data directly comparable to the value of the gradient GPC calculated above, a relationship λ1 = 80 (GV)−0.33 between cooling rate GV (K/s) and cell spacing (µm), established by Katayama and Matsunawa [49] for the 310 stainless steel and later used by Elmer [50] was used to verify the value of 4 × 10⁶ K·m−1 obtained from the constitutional supercooling criterion. The predicted cell spacing at the PC transition is then λ1 = 9.2 µm with VPC = 175 µm·s−1, in fairly good agreement with the value of cell spacing (~10 µm) measured on the micrographs. This seems to confirm the order of magnitude of the local conditions (G, V, T’) determined at the PC transition.
It is worth noting that the plane front growth extends over a thickness (~20 µm) significantly smaller than the transition zone where chemical gradients were evidenced by EPMA. This observation agrees with most of the studies dedicated to dissimilar metal welds [19,20,21,22,23,51], but conflicts with the conclusion of Ornath et al. [1] who interpreted the transition zone as the result of segregations occurring during plane front solidification only.

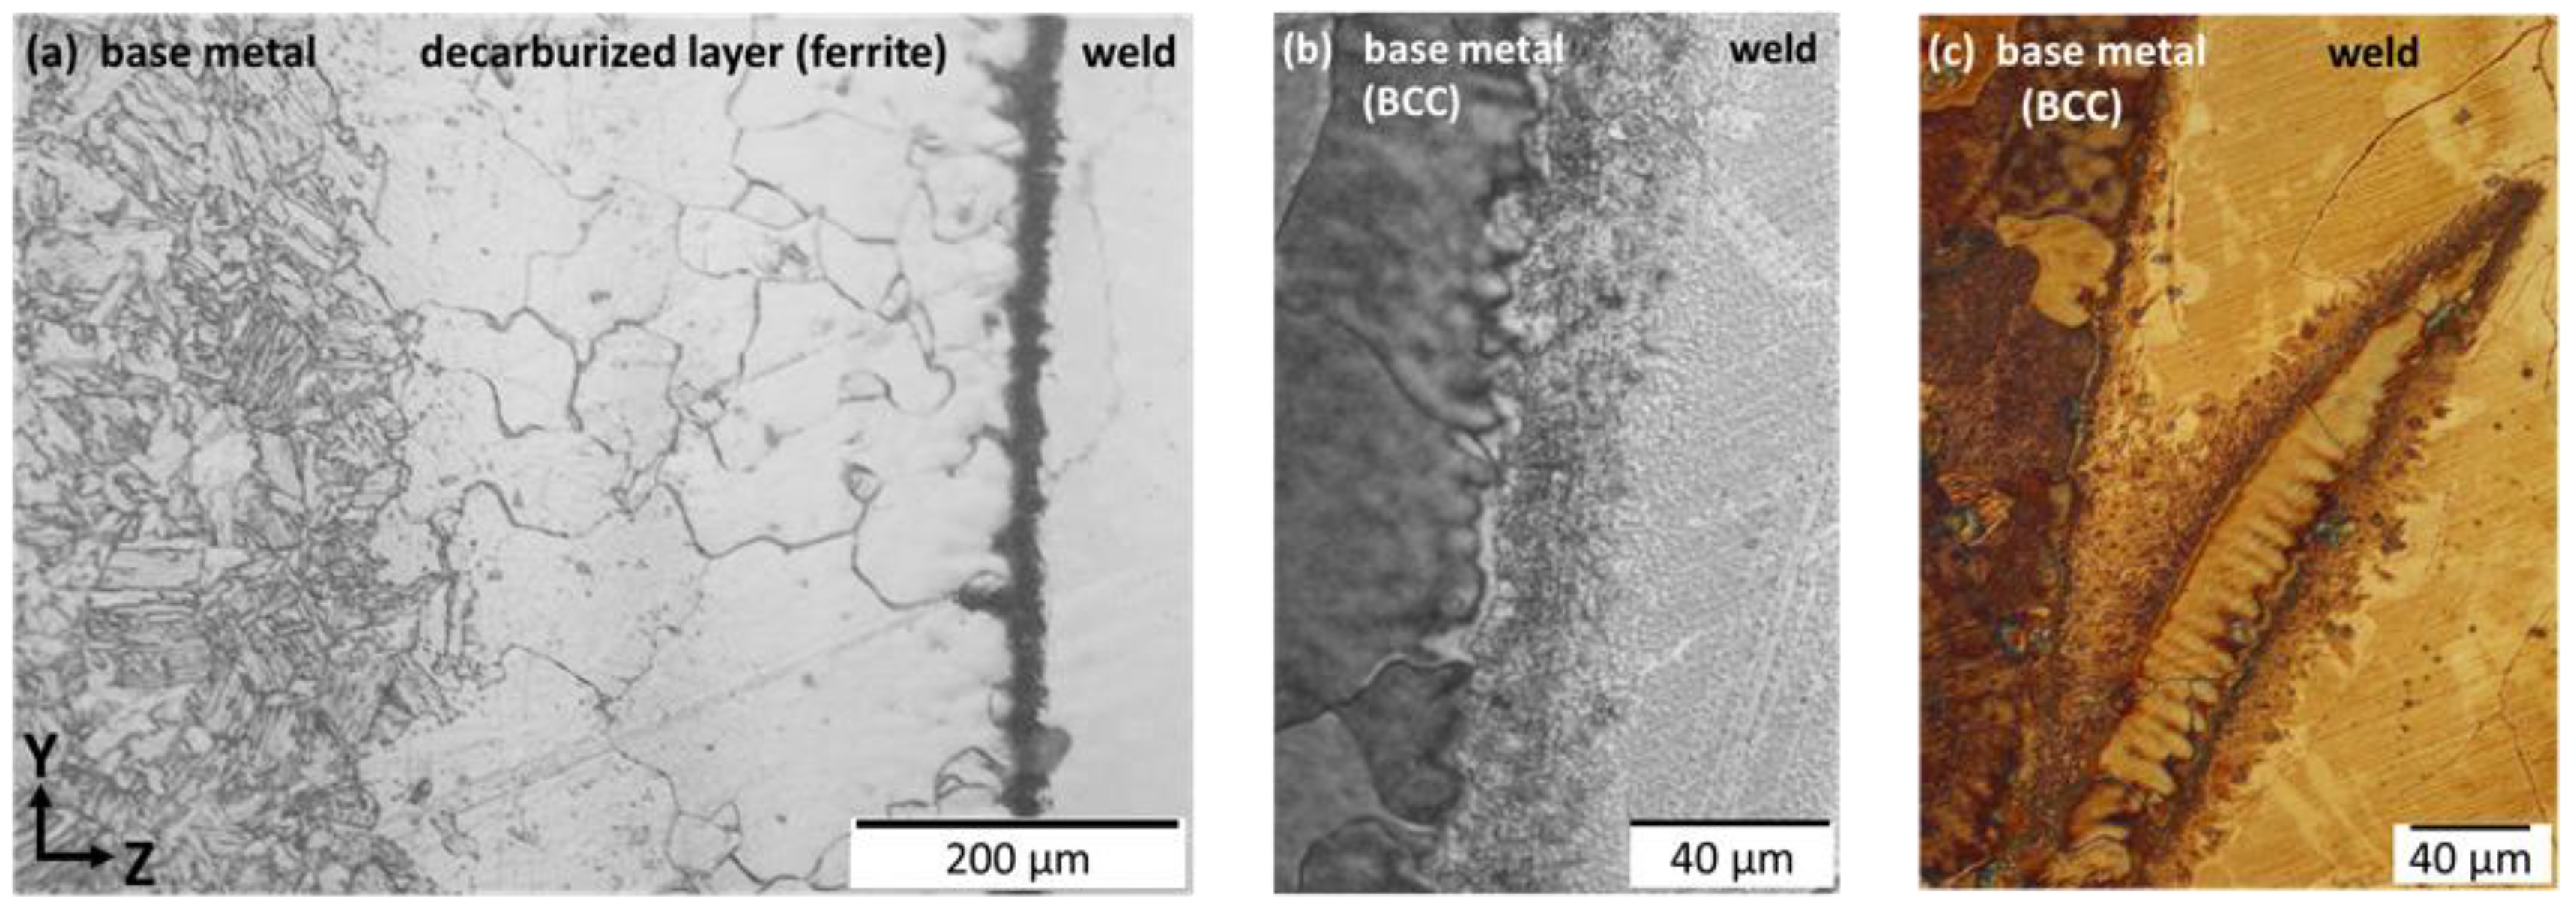
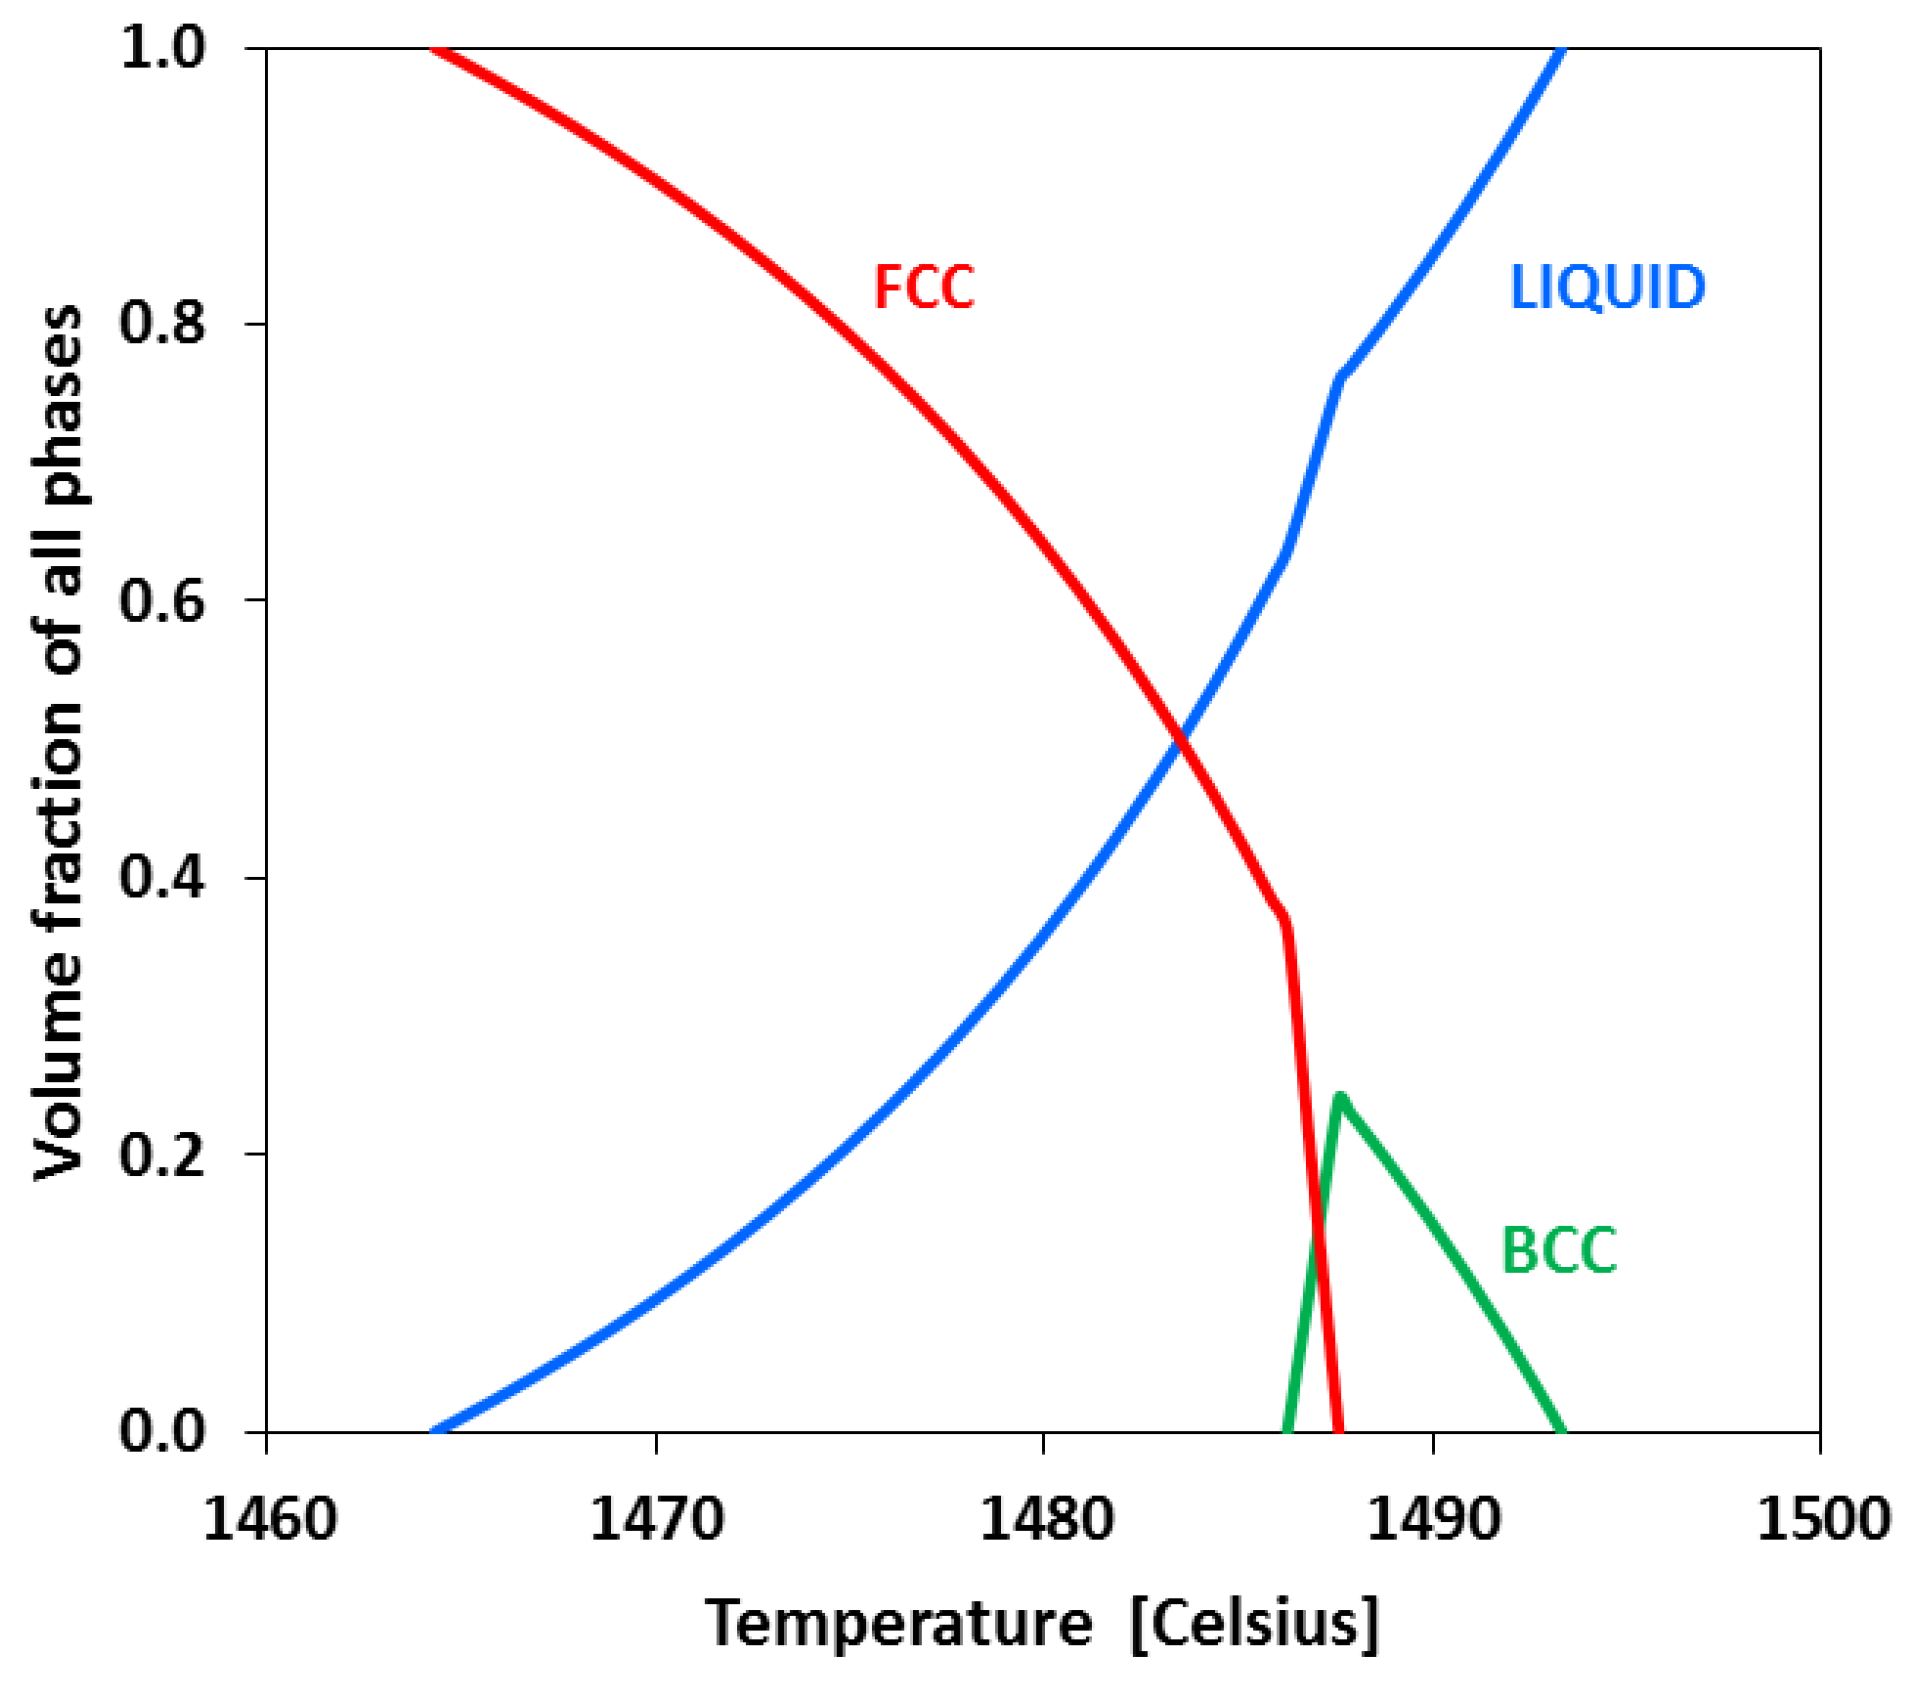
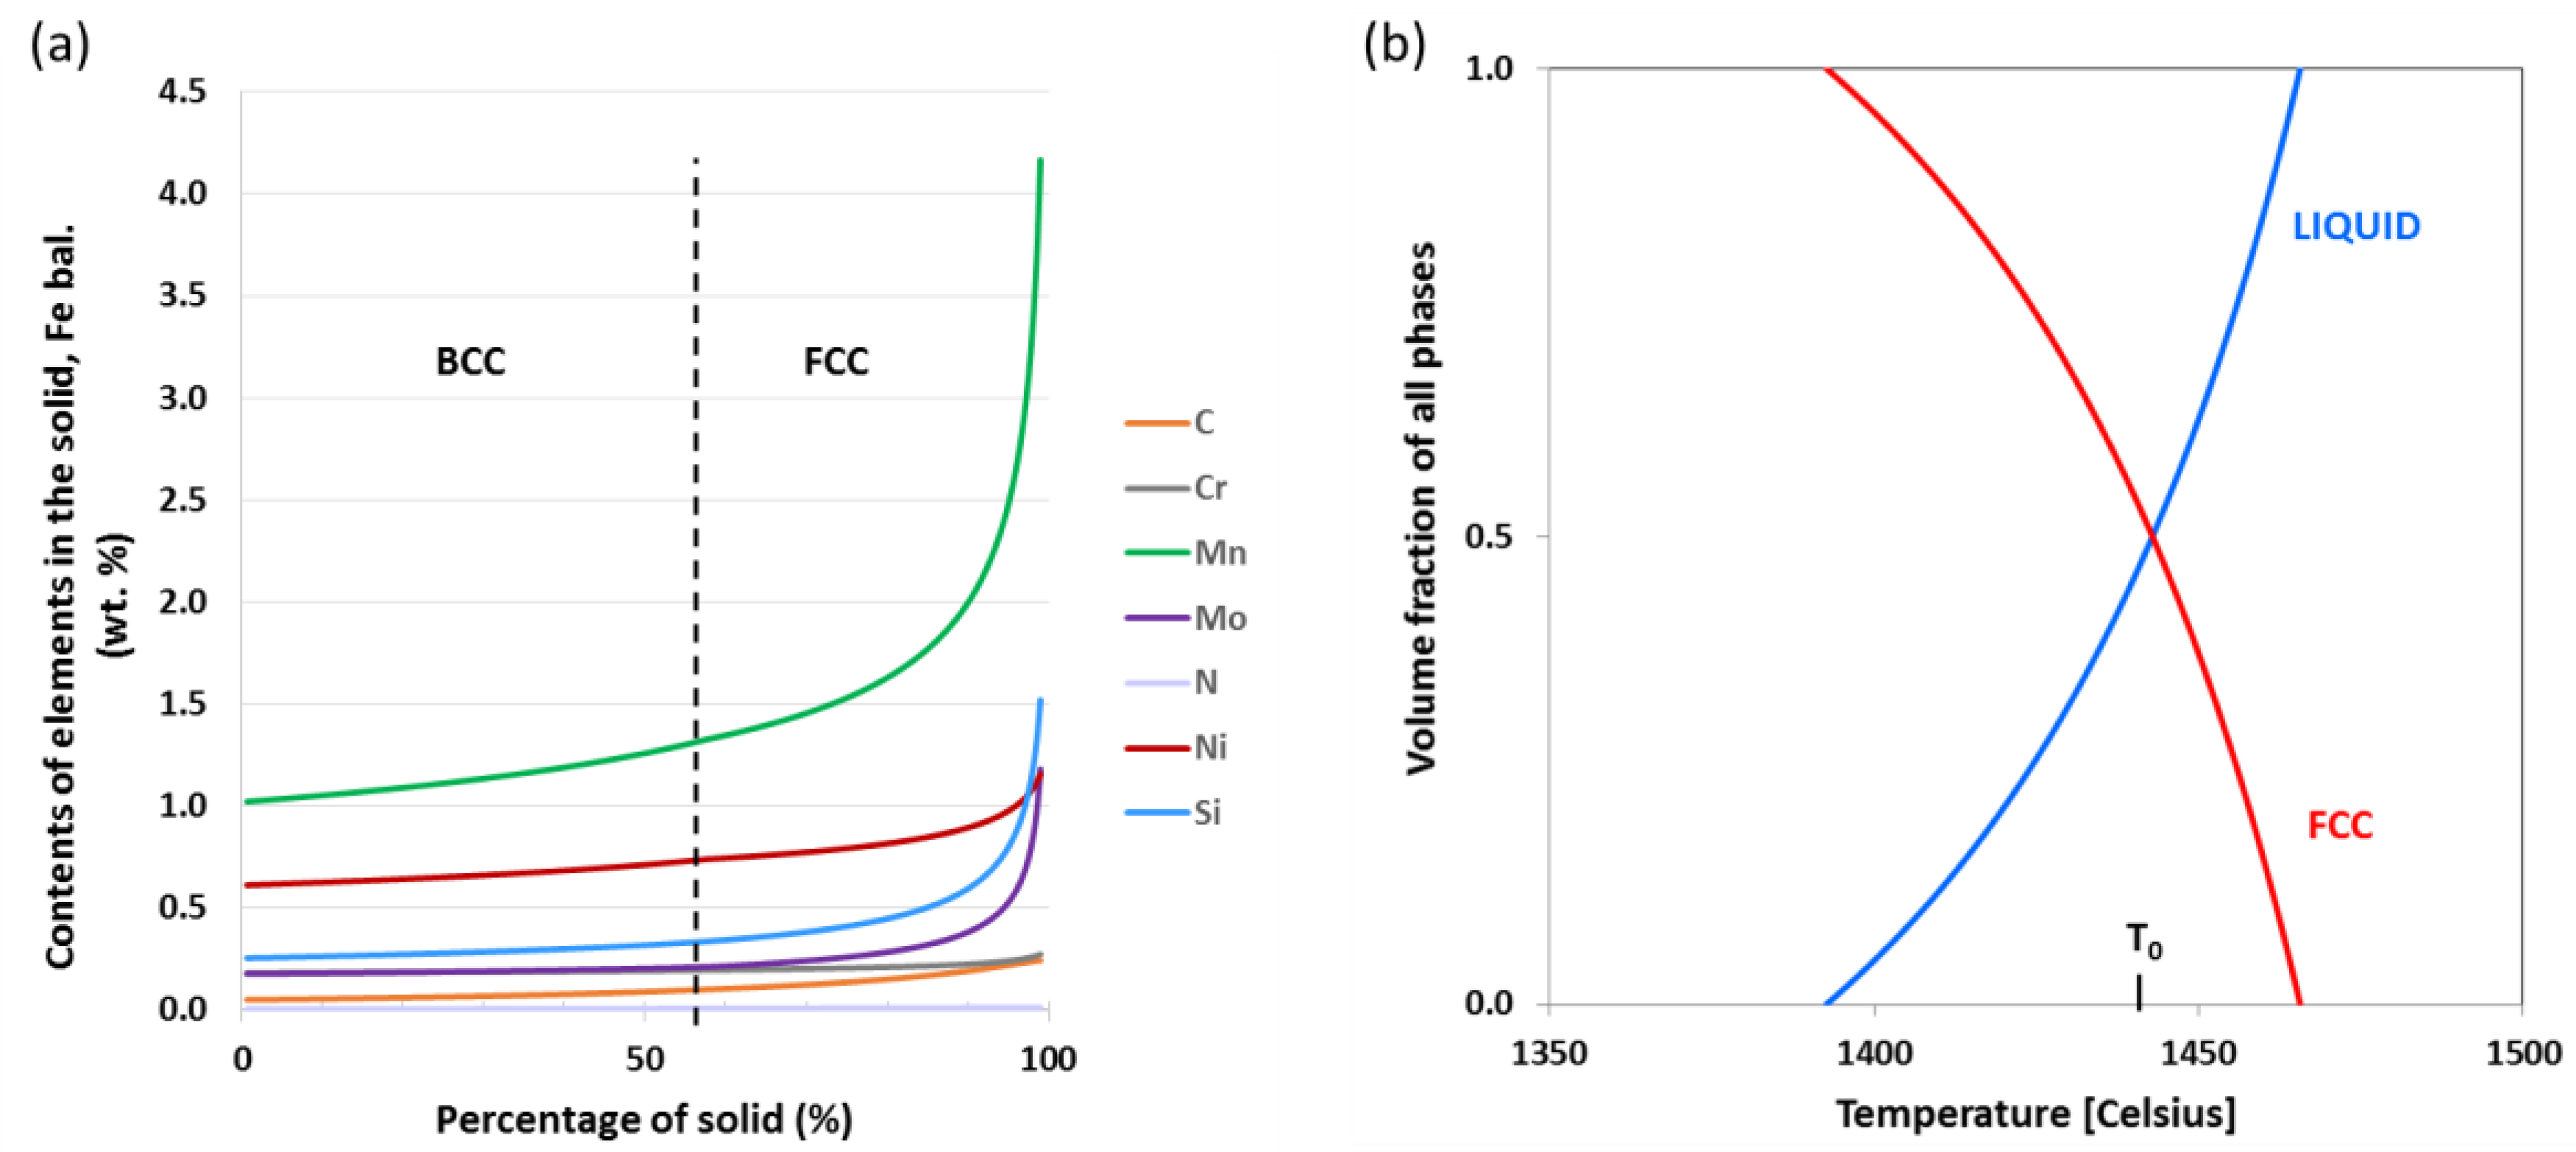
4.2. Origin of the Purely Austenitic Zone

The selection of the solid phase (ferrite or austenite) solidifying at the bottom of the weld pool depends on several parameters that will be discussed hereafter: (i) the liquid composition; (ii) the local conditions (G, V) leading to plane front growth; and (iii) the possible epitaxy on the grains of the unmelted substrate.
WDS measurements across the cells after the plane front destabilization evidenced that the first solidification mode encountered at the bottom of the weld pool is austenitic (Liquid→γ). As planar growth of austenite starts at the fusion line in initial transient conditions, the composition of the liquid at the fusion line (2.84% Ni-4.43% Cr) can be deduced from the composition of the first austenite layer measured by EPMA (2.60% Ni-3.96% Cr), by taking into account the partition coefficients of Ni (0.91) and Cr (0.88) obtained from Thermo-Calc® and TCFE6 database for this composition [45,46]. Liquid-solid phase equilibria computed for this composition (Figure 9) show that the first solid phase expected to grow from this interfacial liquid should be ferrite, austenite appearing at lower temperature from a peritectic reaction.
Solidification sequence predicted in equilibrium conditions is that of a hyper-peritectic alloy composition:
(1)
Liquid→δ
(2)
Liquid + δ→γ until ferrite disappears
(3)
Liquid→γ
A change in the dendritic solidification mode from predicted ferrite to austenite has already been observed by TRXRD during welding of a Fe-C-Al-Mn steel [11,27] and assigned to the high velocity of the liquid-solid interface during rapid cooling in contact with the two phase δ−γ structure of the HAZ at the fusion line. However, in the present case non-equilibrium austenite was observed to solidify at very low solidification rate during transient planar front growth. Several possible mechanisms at the origin of this result are discussed below, linked either to growth kinetics or to nucleation. The growth competition between stable and metastable phases can be discussed with help of microstructure selection maps and interface response functions [52] enabling to predict the leading phase as a function of the alloy composition and the local (G, V) conditions [53,54,55,56]. For hyper-peritectic compositions, and at very low growth rate, the expected solid phase is namely the metastable peritectic γ phase, in agreement with our observations. Nevertheless, this criterion is based on assumptions of abundant nucleation of both phases and steady state conditions, the latter being not fulfilled during the initial transient period of plane front growth.
Concerning the possible epitaxial growth of austenite on the unmelted base metal, the metallurgical structure of the low-alloy steel substrate at the fusion line and then its melting sequence have to be questioned, taking into account the jagged edge of the fusion line (Figure 3). The origin of these corrugations has been evidenced after examination of samples submitted to a post-weld heat-treatment (PWHT) at 610 °C during 16 h: due to a difference in its chemical potential at 610 °C on both sides of the fusion line, carbon diffuses from the base metal towards the weld, leading to a decarburized layer in the 18MND5 substrate that becomes fully ferritic in the vicinity of the fusion line (Figure 10) [31]. In the newly grown ferrite grains, etchings sensitive to microsegregations revealed phantoms of the original dendritic structure of the 18MND5 ingot from which the base metal plate used for welding has been extracted. This clearly shows that a significant amount of residual microsegregation was still present in the base metal at the scale of the dendritic network before welding. Moreover, the perfect matching between the periodicity (7–15 µm) of the corrugations observed along the fusion line (Figure 3) and the typical size (7–11 µm) of the secondary dendrite arms spacings (Figure 10) seems to indicate that melting occurs along dendrite edges.
The upper degree of segregation during solidification can be estimated by computing the solidification path of the 18MND5 steel with Thermo-Calc® and the TCFE6 database using the modified Scheil-Gulliver model (Figure 11a). Assuming a negligible or slight redistribution of substitutional solutes during cooling of the 18MND5 cast ingot and reheating during welding, incipient melting (driven by a thermal effect) could then occur along dendrite outer edges above 1393 °C in a single step (γ→Liquid), as indicated by the solid-liquid equilibria computed for the composition of the outer austenite shell (Figure 11b): in this case melting would proceed with solute partitioning between solid and liquid phases over a temperature range of ~70°.
Another possible mechanism is the incipient melting without partitioning of the austenitic shell at temperatures above T0 (T0 is the temperature at which the Gibbs free energy of the liquid and the solid γ are equal) (=1440 °C for γ and liquid, calculated with Thermo-Calc®), if the solid-liquid interface velocity exceeds a critical value Vc given by Vc = Ds/δ, where Ds is the diffusivity of substitutional species in the solid phase and δ the thickness of the solid-liquid interface [57]. In most metallic alloys, the order of magnitude for δ is a few atomic distances (~10−9 m), whereas Ds (~10–13 m2·s−1) was calculated with DICTRA [39] and the databases TCFE6 and MOB2 for all substitutional elements in the outer austenite shell of the dendrites at the T0 temperature. The welding speed (2.3 mm·s−1) being higher than the critical velocity Vc (0.1 mm·s−1), conditions for a loss of equilibrium at the solid-liquid interface are fulfilled, allowing a possible incipient melting of the outer shell of dendrites above T0. A third possible melting mechanism would be solutal remelting, where segregated parts of the 18MND5 substrate could dissolve in contact with a solute-enriched liquid. Nevertheless the solutally controlled melting rate being much lower than the thermally controlled one [58], the rapid heating and cooling rates (and solid-liquid interface velocity) encountered during the present welding process suggest that remelting would be driven more likely by a thermal effect instead of a solutal one [57].
Assuming one of the above incipient melting mechanisms, only austenite would be present in contact with the molten liquid at the fusion line, allowing epitaxial growth of austenite on the weld side, and explaining both the continuity of the grain boundaries across the fusion line (Figure 6) and the perfect match for the orientations of the austenitic grains on both sides of the interface (Figure 8). This interpretation differs from that proposed by Nelson et al. [4] or Wu et al. [33] who explained the continuity of austenite grain boundaries in ferritic-austenitic dissimilar metal welds on the basis of a primary solidification of ferrite from the body-centered cubic (BCC) substrate followed by grain boundary migration of the austenite from the heat affected zone into the weld during the subsequent δ→γ solid-state phase transformation upon cooling.
Type II grain boundaries present in the weld almost parallel to the fusion line have been interpreted by Nelson et al. [4] as the end of this migration, whereas Wu et al. assigned them to the change in the solidification mode from primary BCC to primary FCC [33]. In the present case Type II grain boundaries are observed at the transition between the austenitic (AF) and ferritic (FA) modes of solidification (Figure 6) and correspond to the different origins and orientations of the austenite (γ1 and γ2 phases, see Figure 4c).

4.3. Formation of Ferrite in the Inter-Cellular Space

The plane front growth of austenite is further replaced by cellular austenite growth (A mode of solidification) before some ferrite forms in the intercellular regions (AF mode). The location of this transition from the A-mode to the AF-mode can be forecast by mean of a two-step modified Scheil-Gulliver calculation: starting from the destabilization of the plane front, solidification was simulated for each local composition in the transition zone (Figure 2): Mo, Mn and Si contents (not shown on this figure) were measured by EPMA, whereas C and N were estimated by dilution calculations. In the first application of the modified Scheil-Gulliver model, only FCC phase and the liquid could form, the ferritic phase being rejected from the calculations to reproduce the observed growth of austenitic cells. Interrupting the calculation after 95% of the liquid has solidified allowed extracting the composition of the 5% remaining liquid to serve as initial condition in a second solidification calculation now conducted without any constraint on the phases allowed to form, in order to simulate the free solidification of the last liquid in between the austenitic cells (Figure 12). It is worth mentioning that calculations performed for 2% and 1% remaining liquid led to similar results in terms of phase selection.
For the first 20 mm from the beginning of the cellular growth, only austenite is predicted to grow from the last 5% liquid, which means that no ferrite formed in the inter-cellular space. However, the progressive increase in ferrite-stabilizing elements in the late fractions of liquid is responsible for the appearance of ferrite in between the cells and then the change in primary phase of solidification. Two examples of the method employed here are displayed in Figure 12, one before the transition (A mode-Figure 12a,b) and the other after (AF mode-Figure 12c,d). Thus, the transition from A to AF mode of solidification was found to occur at about 50 µm from the fusion line, which is of the same order of magnitude as the microstructural observations. This transition has been predicted by means of thermodynamic arguments only, based on the evolution of the local composition: in agreement with the local equilibrium condition, ferrite has been considered to appear as soon as its formation allowed reducing the Gibbs free energy of the system, by comparison with the situation without any ferrite.

4.4. Growth Competition between Ferrite and Austenite

Once ferrite has nucleated in the inter-cellular regions, a change in the mode of solidification from AF to FA can occur if the growth rate of ferrite exceeds that of austenite. It has often been experimentally observed that steels, for which thermodynamics forecasts a primary δ- ferrite solidification, can be induced to solidify as metastable austenite by rapid cooling [59,60,61,62,63]. However, in the present case, we showed that the conditions present in our system, both in terms of compositions and solidification velocity, do not allow metastable austenite to continue growing and that ferrite will finally prevail.
A model for columnar dendritic growth, first developed by Kurz et al. [52], extended to multi-component system by Bobadilla et al. [59] and applied to conditions of high solidification velocities by Rappaz et al. [64] can be used for analyzing this observation. The model developed by Siredey and Lacaze [65] is based on the calculation of the growth undercooling of cells or dendrites of all competing solid phases, the phase with the highest growth (or tip) temperature T* being selected for its solidification front preceding that of the others. Considering the thermal, solutal and capillarity undercoolings and neglecting the kinetic undercooling of the interface (assumption justified for non-faceted phase such as ferrite and austenite), the growth temperature T* is given by:
T * =   T L +   i   m i     ( C i *   C i 0 )   G D V   2 Γ R
where T L is the liquidus temperature, m i   the liquidus slope for element i,   C i * and C i 0 the liquid and nominal composition for element i respectively, G the thermal gradient, D the liquid interdiffusion coefficient, V the solidification velocity, Γ the Gibbs-Thomson parameter and R the radius of the dendrite tip. Estimating the solutal contribution requires the knowledge of the concentration fields around the growing cell.
As displayed in Equations (5) and (6), the tip was approximated by a paraboloid and Ivantsov solution [66] was applied to obtain the amount of solute build-up at the solid-liquid interface:
C i * =   C i 0 1 ( 1 k )   I v   ( P )
with   P = V R 2 D   and   I v ( P ) = P   exp ( P ) P exp ( u ) u   d u
P being the solutal Peclet number. According to the marginal stability criterion of Mullins and Sekerka [67] extended to multicomponent systems by Coates et al. [48], the radius of curvature of the growing tip was taken equal to the shortest wavelength which makes the plan front unstable.
Calculations were performed for the composition (reduced to the quaternary Fe-Ni-Cr-C system) encountered in the weld at 60 µm from fusion boundary, where ferrite is found in the inter-cellular space. The value of 3 × 10⁵ K·m−1 for the thermal gradient G was determined from SDAS measurements λ 2 C D ~   6   μ m at the cell to dendrite transition (ZCD ~ 100 µm) close to the appearance of ferrite, using the empirical formula λ2 = 25 (GV)−0.28 [50] with VCD = 560 µm·s−1 (Table 3). The parameters used in the tip growth calculation are listed in Table 6, the thermodynamic ones being extracted from the TCFE6 database and the kinetic ones from the MOB2 database. Gibbs-Thomson coefficient Γ was calculated for both solid phases using the expression:
Γ =   σ s l   V m Δ S m f
where σ s l is the solid/liquid interfacial energy, Vm the molar volume and Δ S m f the molar entropy of fusion.
This model allowed to obtain the tip temperature of both δ and γ phases as a function of the growth rate V, as displayed in Figure 13. A vertical line has been drawn on this figure to mark the value of the welding speed, which represents the maximum solidification velocity that can be reached in the weld pool.
For the compositions and the velocity encountered in the present process, the ferrite tip will always be warmer than the austenite one. This confirms that, once δ has nucleated, the conditions in the weld pool will favor its growth at the expense of γ and that a transition from AF mode to FA mode can take place. This conclusion is in agreement with the optical micrograph of Figure 4a–c where one can notice a continuity between the ferrite nucleated in the inter-cellular regions (AF mode) and the one observed in the core of the dendrites (FA mode), suggesting that inter-cellular secondary ferrite (δ2) serves as nucleus for the further dendritic growth of primary ferrite (δ1).

5. Conclusions

The microstructures encountered in the partially mixed zone of a dissimilar weld between the 18MND5 low-alloy steel and the 309L stainless steel have been investigated. In this transition layer ~100 µm thick three types of evolutions were evidenced, namely in terms of composition, growth morphology and primary solidification mode. Based on a detailed analysis of microstructural features and the use of thermodynamic computations and classical solidification models, the main following results and conclusions were obtained:
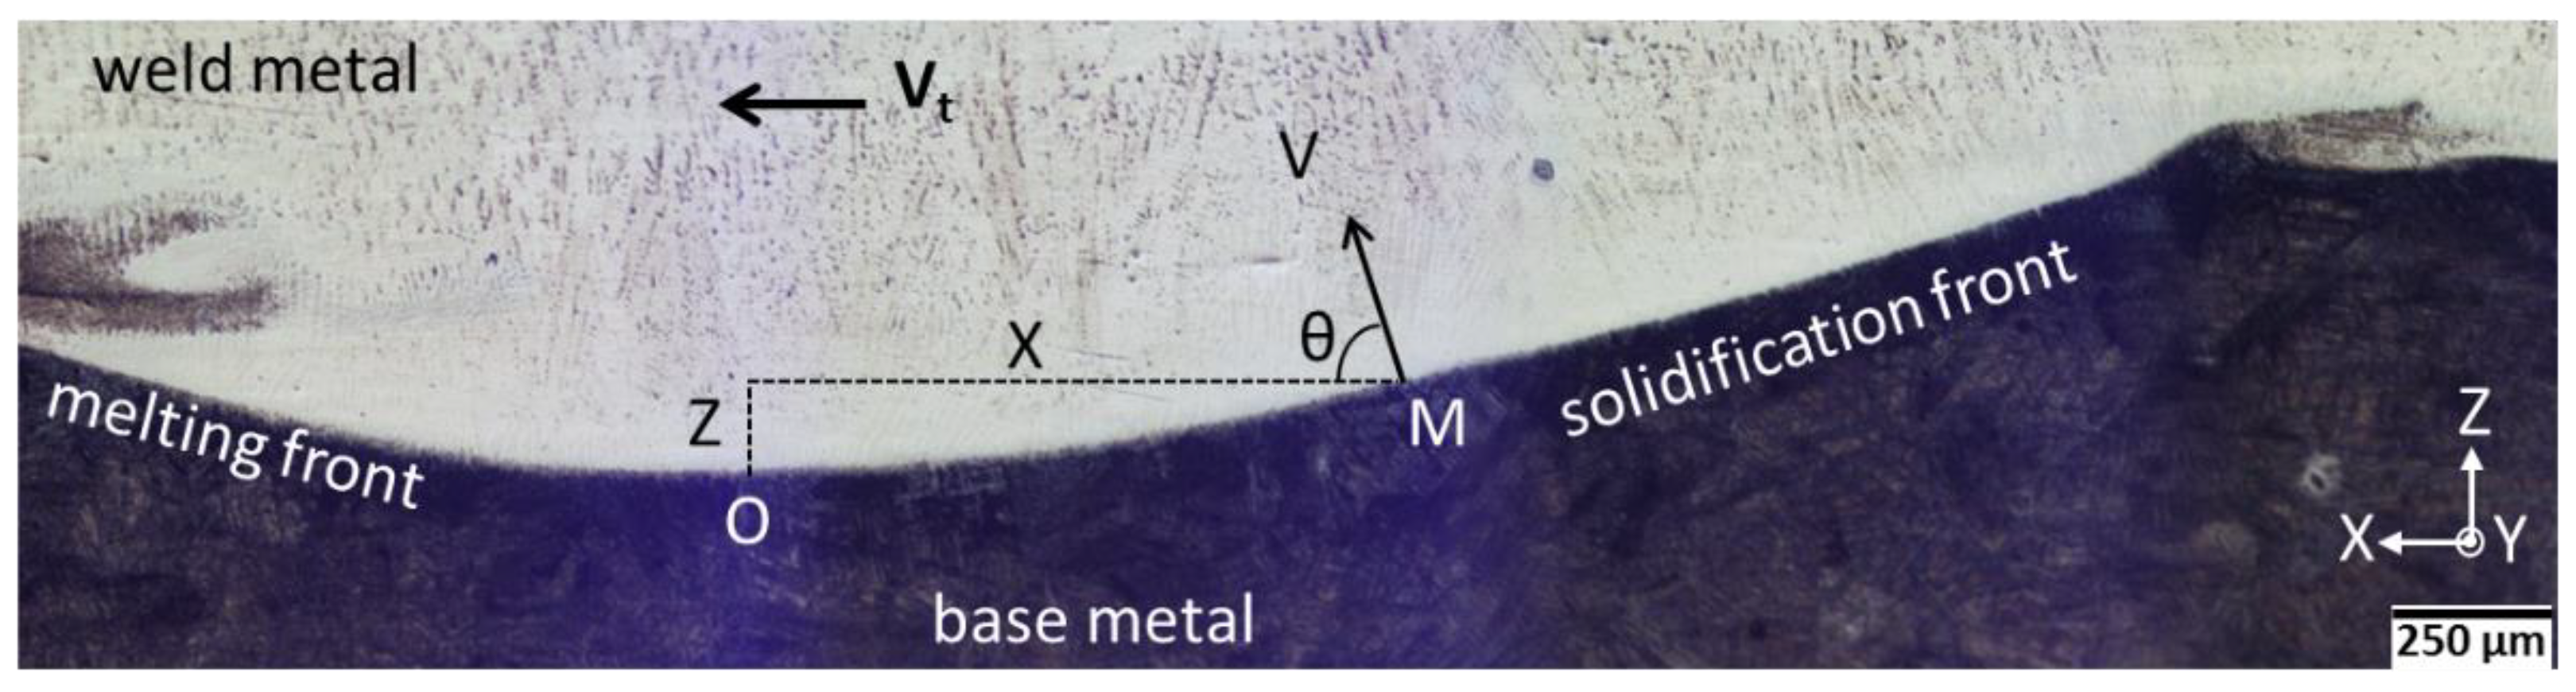
  • Transitions between planar, cellular, and dendritic morphologies were observed as predicted by the increasing growth rate when moving away from the fusion line.
  • Close to the fusion boundary the order of magnitude of the growth rate (~175 µm·s−1) and thermal gradient (~4 × 10⁶ K·m−1) were estimated at the plane front to cells transition. The present approach combining microstructural observations, thermodynamic and kinetic data, and the constitutional supercooling criterion can be successfully used for determining those important pieces of data useful for the validation of numerical modelling of welding processes.
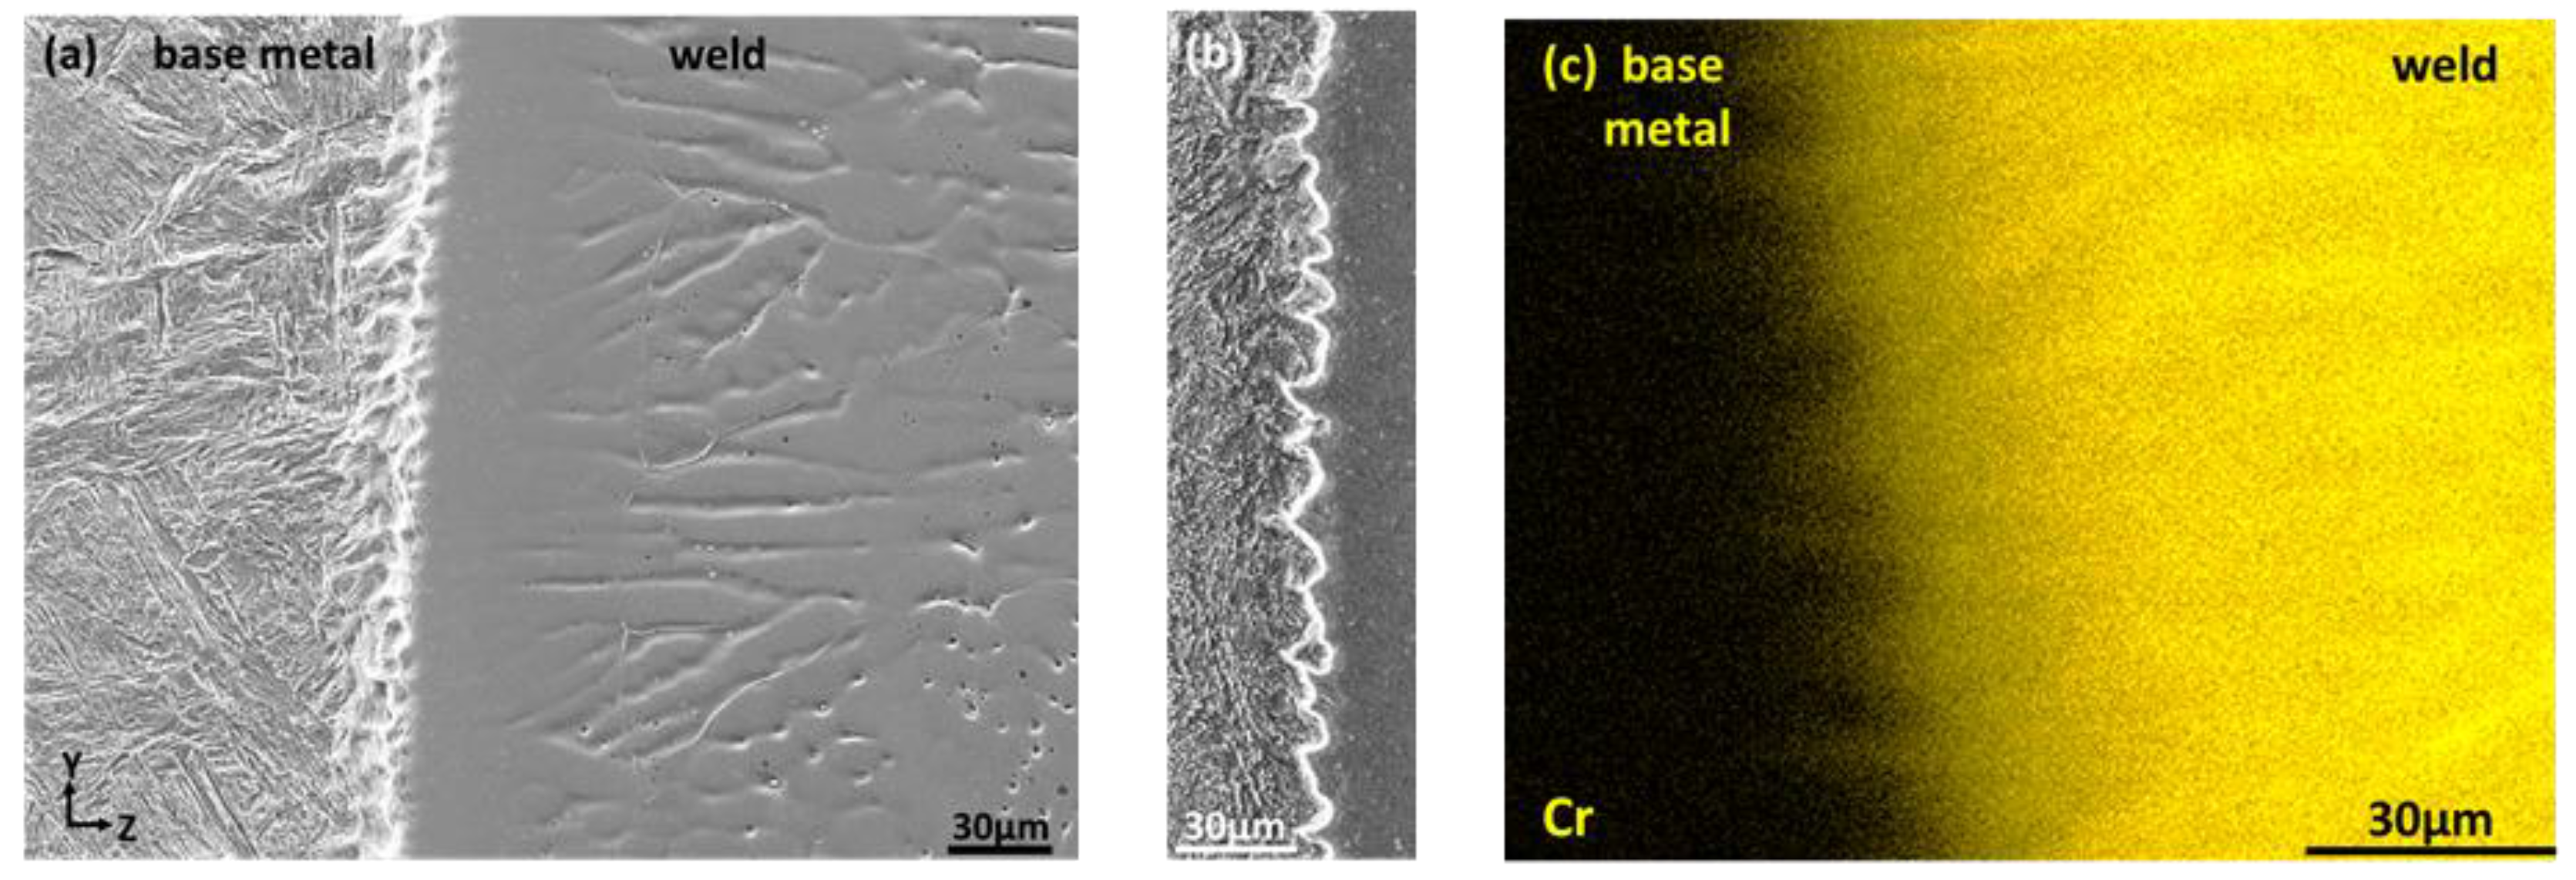
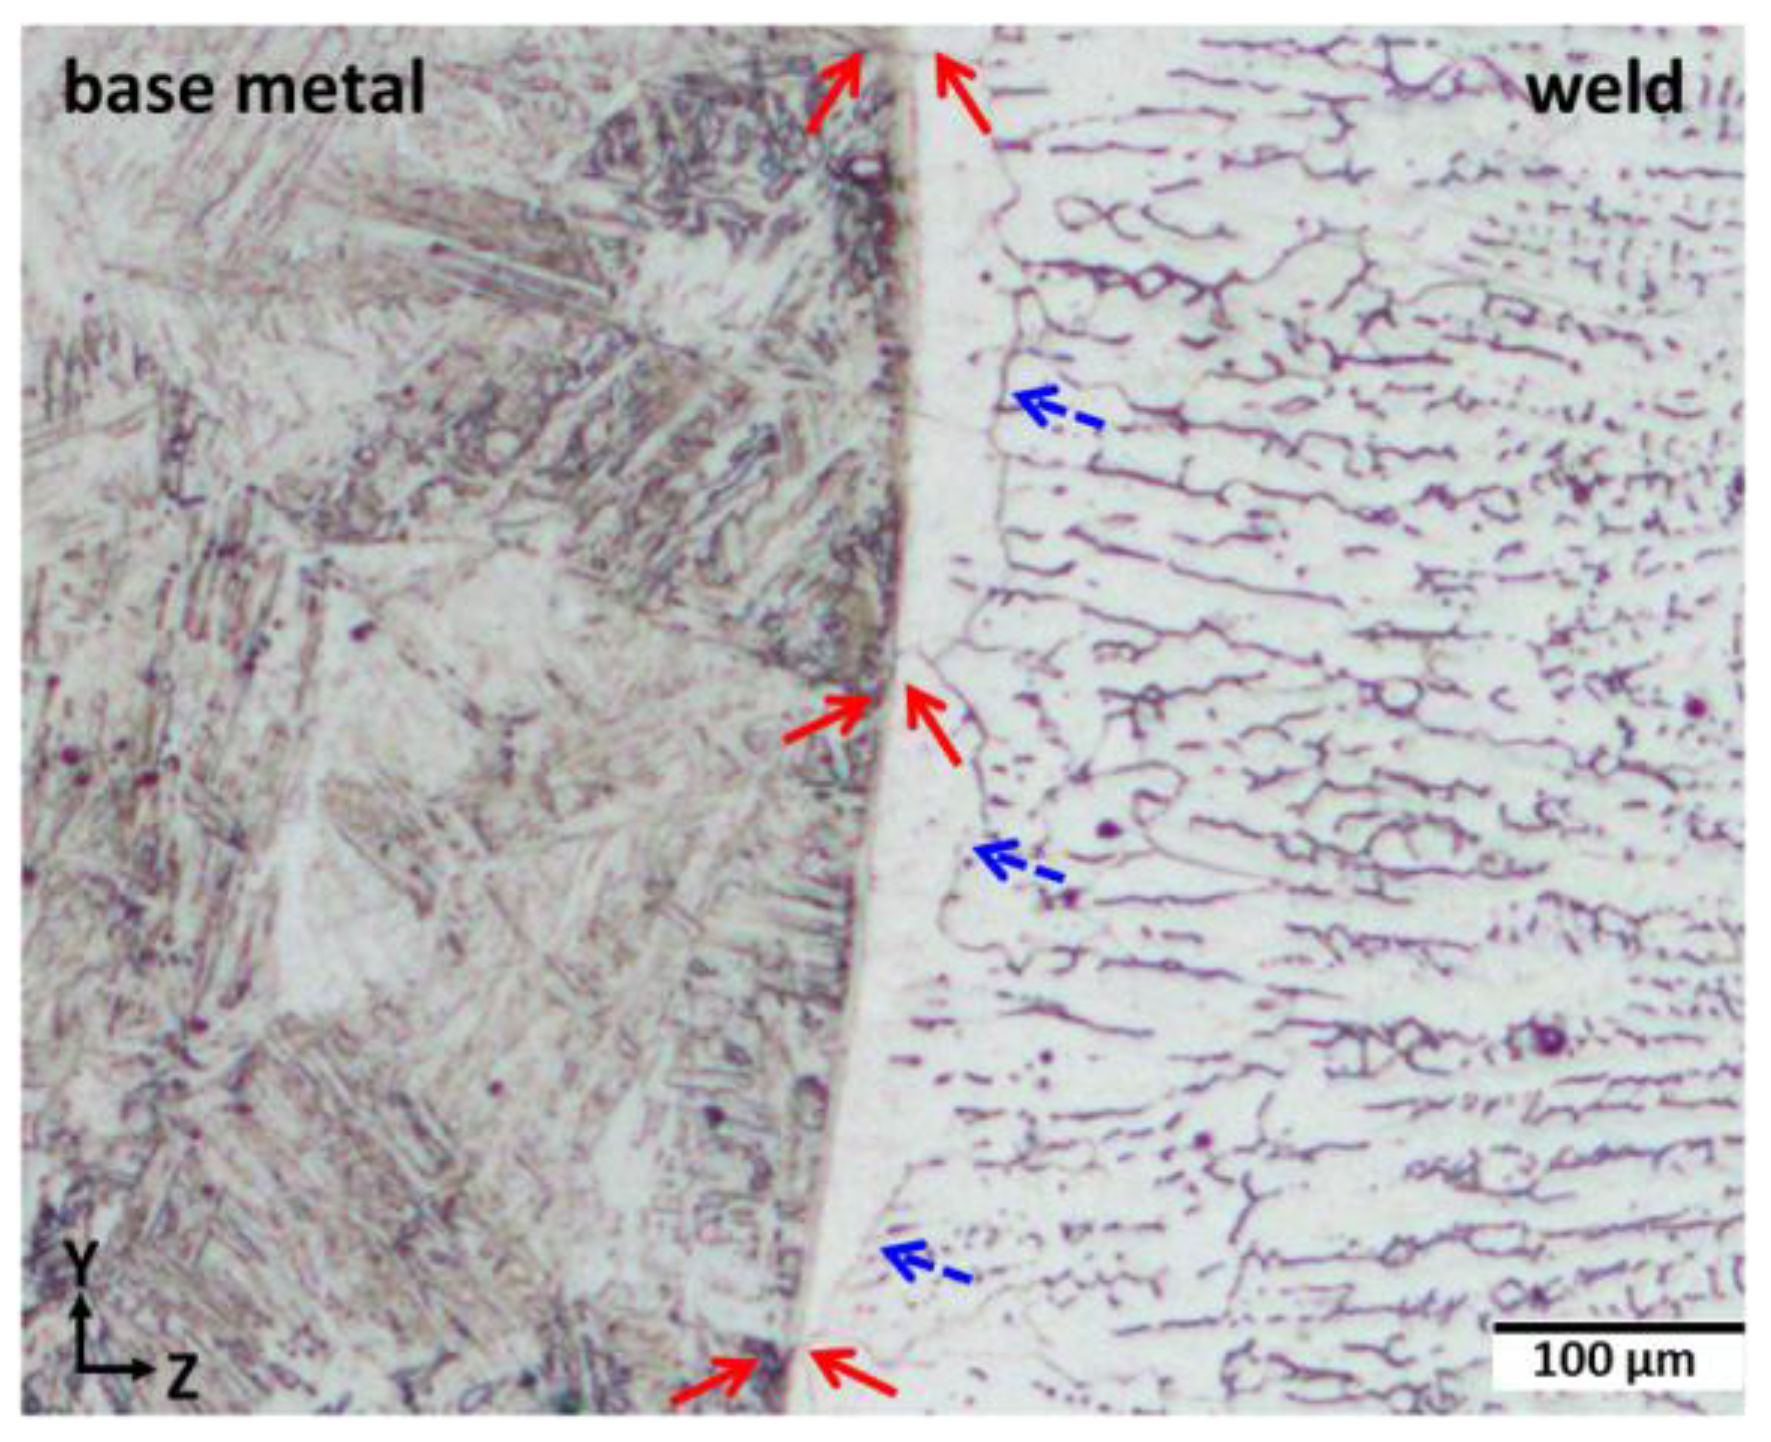
  • The selection of non-equilibrium austenite as primary phase during the initial transient period of plane front growth was assigned to its epitaxial growth on the entirely austenitic structure of the 18MND5 substrate at the fusion line resulting from an incipient melting mechanism. This interpretation is supported both by (i) the clear correspondence between the corrugated shape of the fusion line and the observed phantom of the dendritic network of the cast 18MND5 ingot and (ii) by thermodynamic computations considering the segregation of solutes during solidification of the 18MND5 ingot.
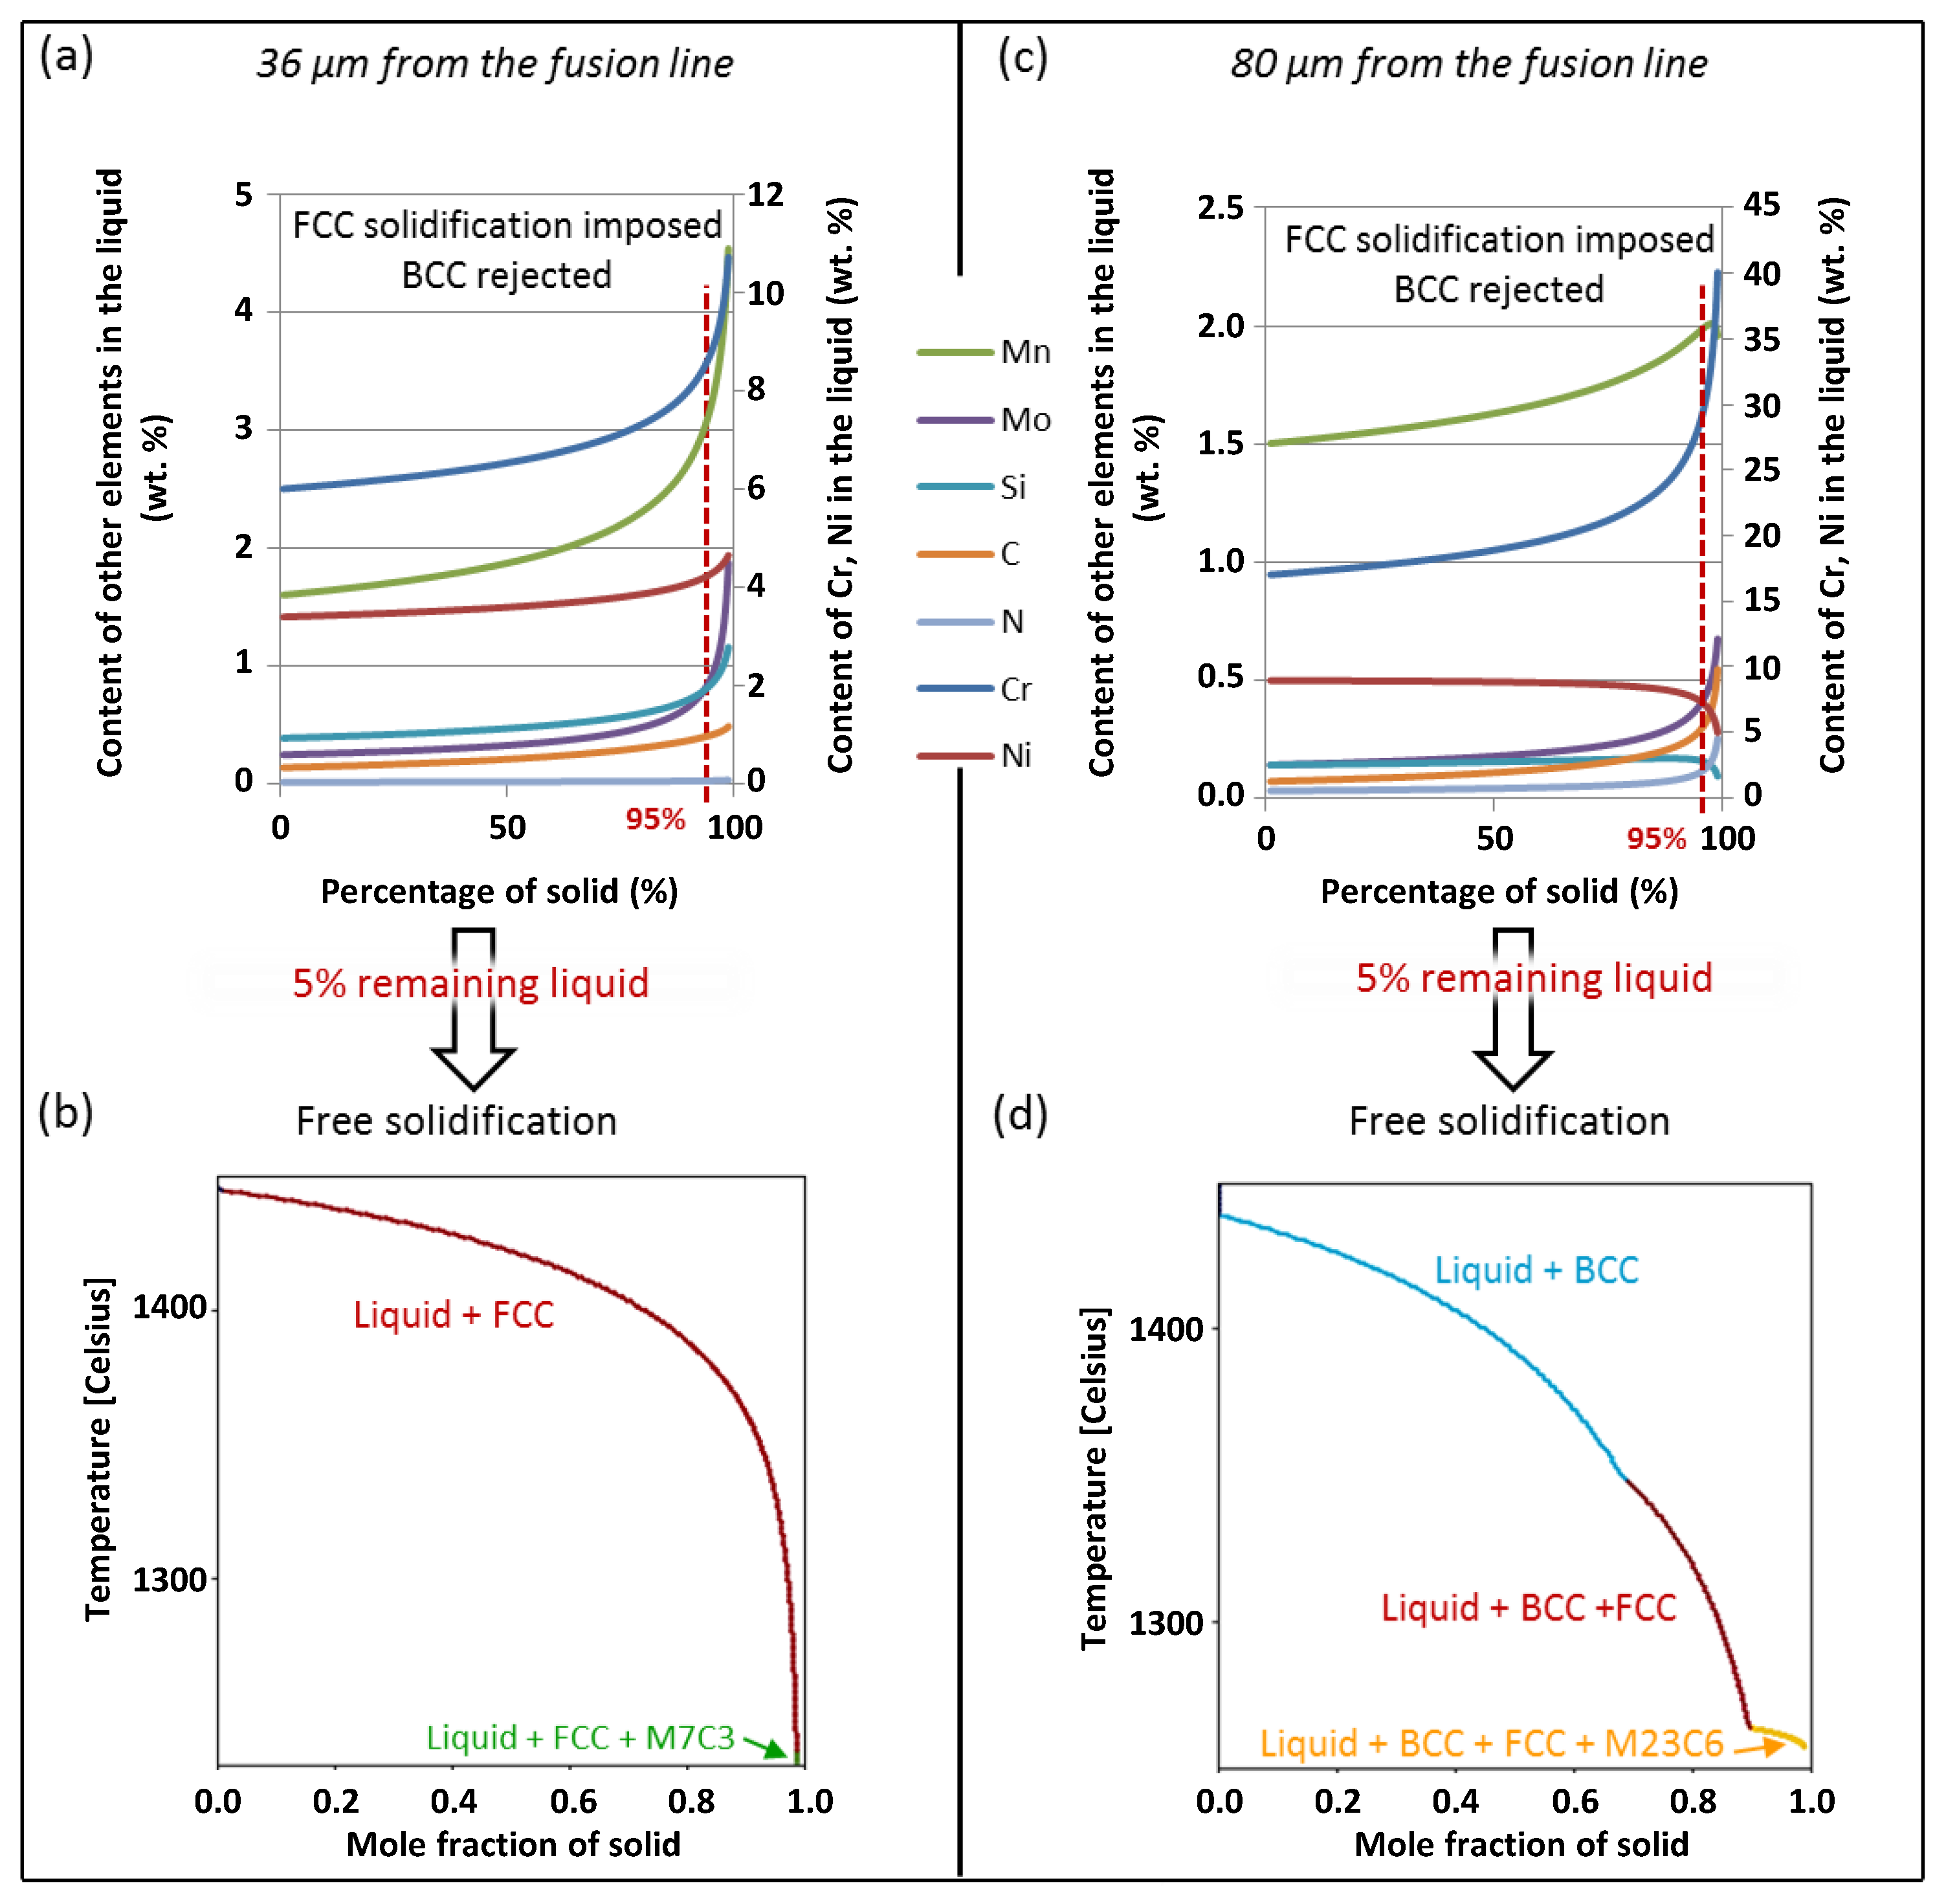
  • The first change in the solidification mode (A→AF) with ferrite forming in between the austenite cells was accurately predicted by computations of non-equilibrium solidification paths considering the evolution of the liquid composition in the partially mixed zone.
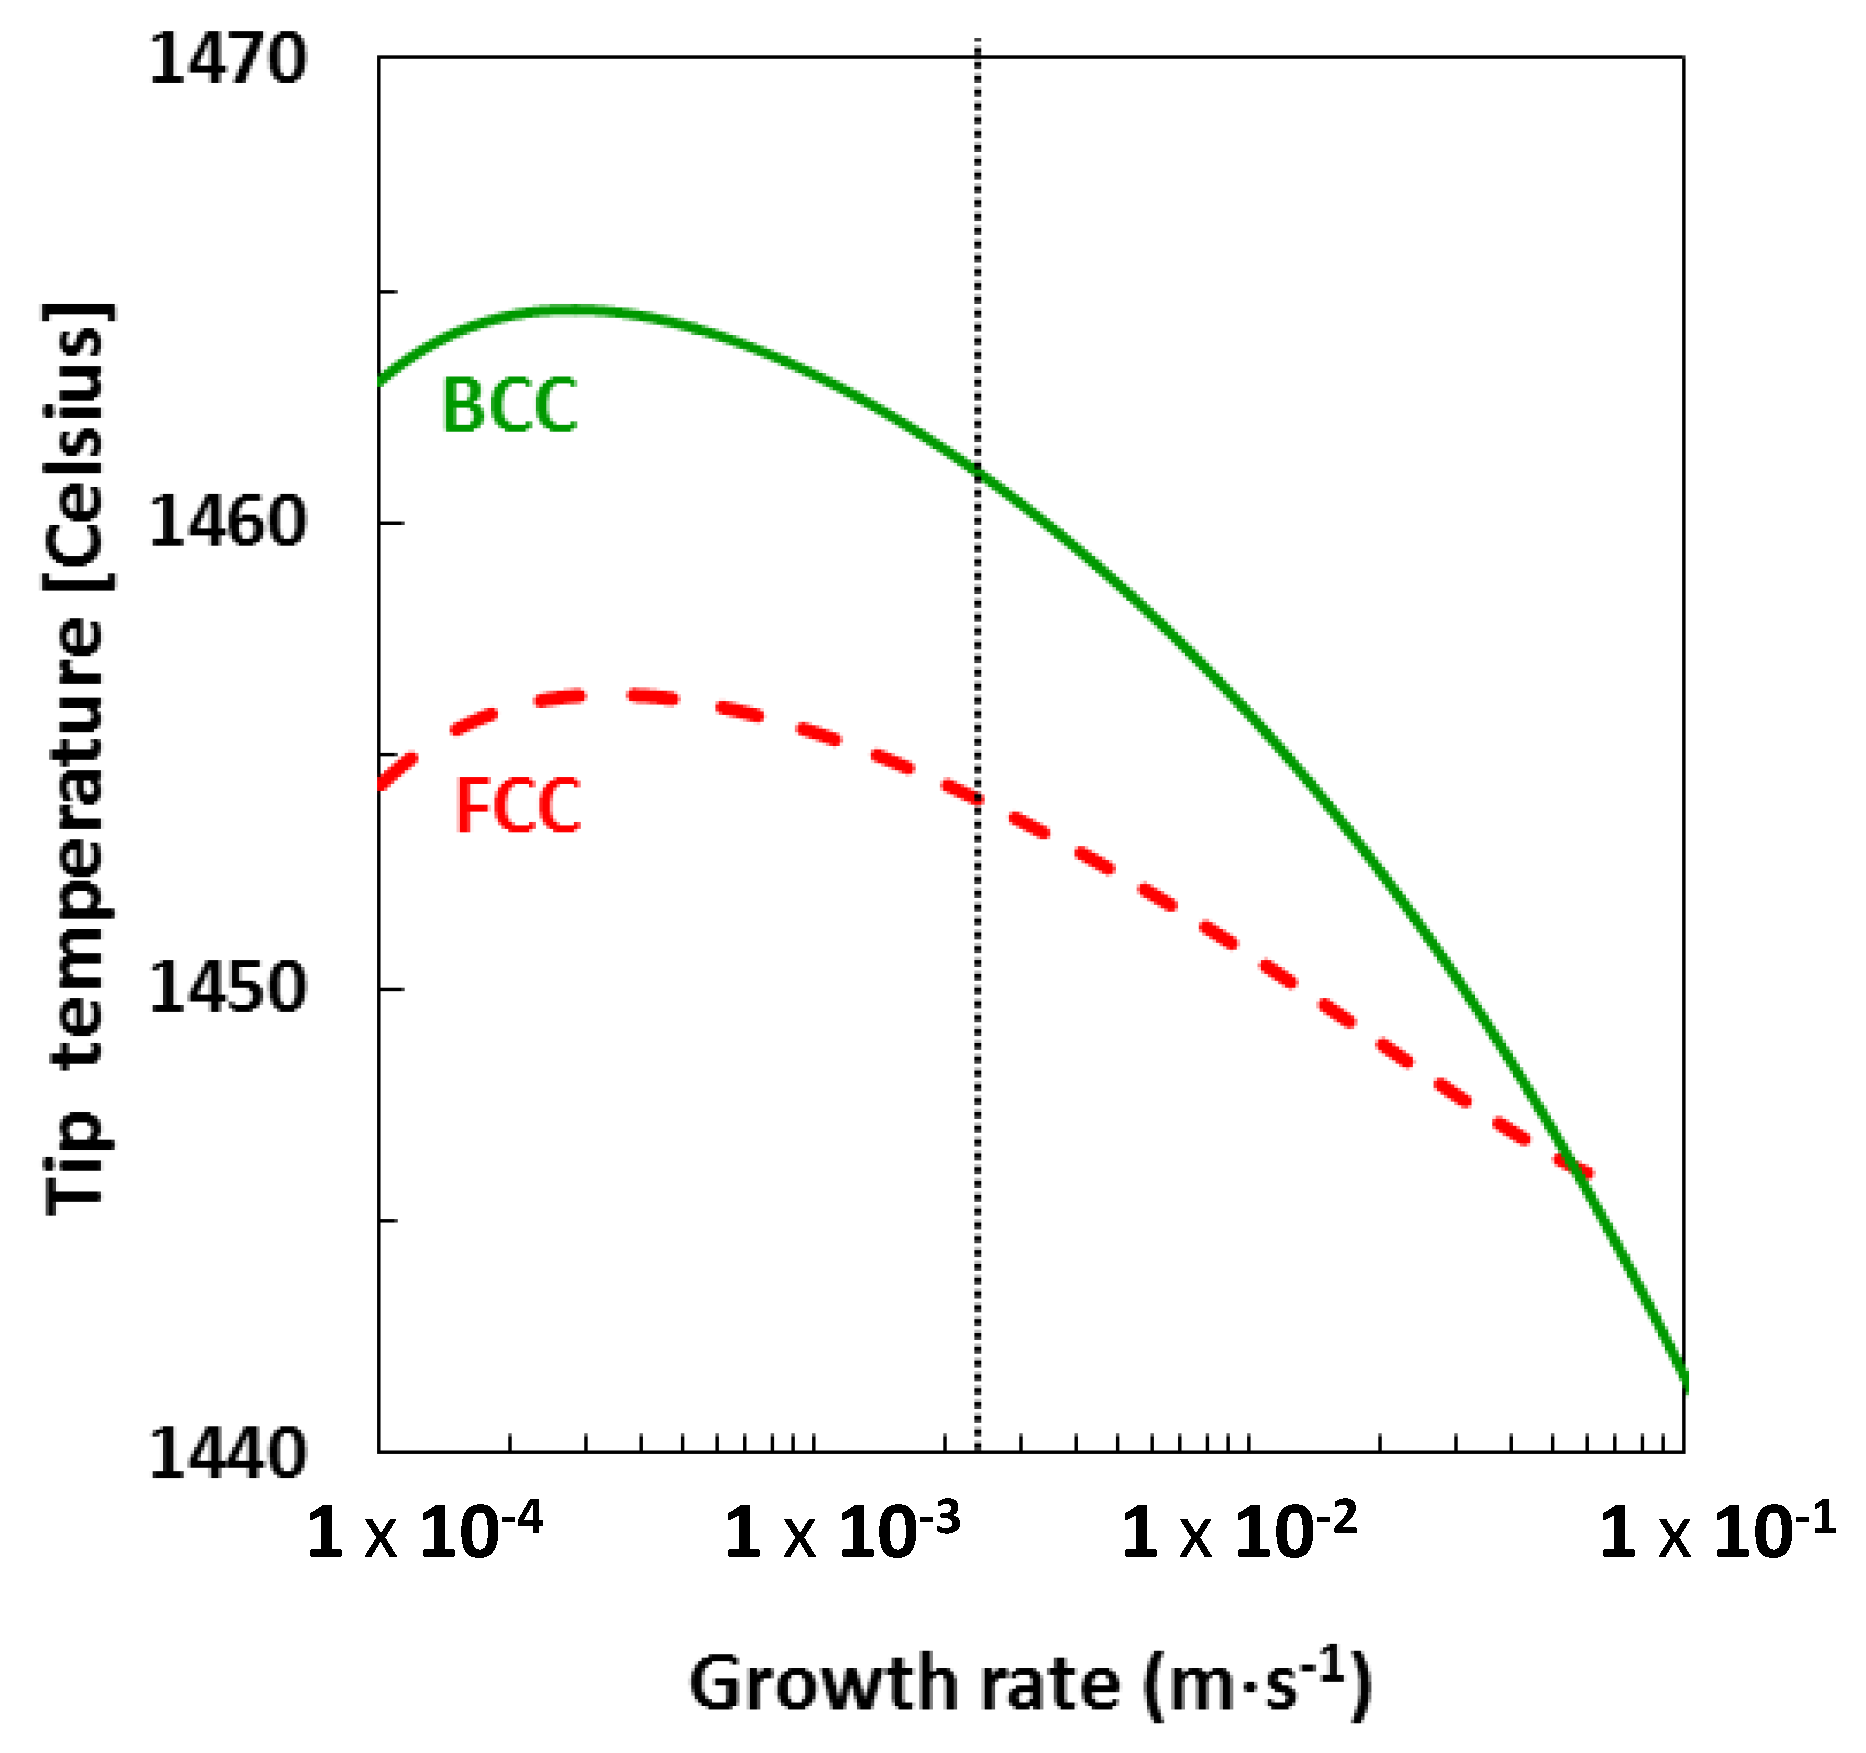
  • The last transition (AF→FA) was assigned to the faster growth of ferrite (once nucleated) compared to austenite, as confirmed by use of a classical model of columnar dendritic growth.

Acknowledgments

This study was sponsored by both EDF and Areva through the PhD grant ofFanny Mas. In addition, the authors wish to thank Pierre Chemelle (Ugitech) for EBSD and EDX acquisitions, Cyril Cayron (CEA) for his assistance in operating ARPGE software and Jacques Lacaze (CIRIMAT) and Michel Rappaz (EPFL) for fruitful discussions on microstructure selection and helpful comments.

Author Contributions

François Roch, Miguel Yescas and Patrick Todeschini conceived, designed, and performed the welding experiments; Fanny Mas and Catherine Tassin performed and analyzed microstructural characterizations, thermokinetic computations and solidification modelling. Yves Bréchet contributed with other co-authors to the discussion of the above reported results.

Conflicts of Interest

The authors declare no conflict of interest.

References

  1. Ornath, F.; Soudry, J.; Weiss, B. Weld pool segregation during the welding of low alloy steels with austenitic electrodes. Weld. J. Weld. Res. Suppl. 1981, 60, 227s–230s. [Google Scholar]
  2. Nelson, T.W.; Lippold, J.C.; Mills, M.J. Investigation of boundaries and structures in dissimilar metal welds. Sci. Technol. Weld. Join. 1998, 3, 249–255. [Google Scholar] [CrossRef]
  3. Nelson, T.W.; Lippold, J.C.; Mills, M.J. Nature and evolution of the fusion boundary in ferritic-austenitic dissimilar metal welds. Part 1—Nucleation and growth. Weld. J. Weld. Res. Suppl. 1999, 78, 329s–337s. [Google Scholar]
  4. Nelson, T.W.; Lippold, J.C.; Mills, M.J. Nature and evolution of the fusion boundary in ferritic-austenitic dissimilar metal welds. Part 2—On-cooling transformations. Weld. J. Weld. Res. Suppl. 2000, 79, 267s–277s. [Google Scholar]
  5. Rowe, M.D.; Nelson, T.W.; Lippold, J.C. Hydrogen-induced cracking along the fusion boundary of dissimilar metal welds. Weld. J. Weld. Res. Suppl. 1999, 78, 31s–37s. [Google Scholar]
  6. Arivazhagan, N.; Singh, S.; Prakash, S.; Reddy, G.M. Investigation on AISI 304 austenitic stainless steel to AISI 4140 low alloy steel dissimilar joints by gas tungsten arc, electron beam and friction welding. Mater. Des. 2011, 32, 3036–3050. [Google Scholar] [CrossRef]
  7. Brentrup, G.J.; DuPont, J.N. Fabrication and characterization of graded transition joints for welding dissimilar alloys. Weld. J. Weld. Res. Suppl. 2013, 92, 72s–79s. [Google Scholar]
  8. Hajiannia, I.; Shamanian, M.; Kasiri, M. Microstructure and mechanical properties of AISI 347 stainless steel/A335 low alloy steel dissimilar joint produced by gas tungsten arc welding. Mater. Des. 2013, 50, 566–573. [Google Scholar] [CrossRef]
  9. Ahmad, H.W.; Hwang, J.H.; Lee, J.H.; Bae, D.H. An assessment of the mechanical properties and microstructural analysis of dissimilar material welded joint between alloy 617 and 12Cr steel. Metals 2016, 6, 242. [Google Scholar] [CrossRef]
  10. DuPont, J.N.; Mizia, R.E. Review of Dissimilar Metal Welding for the NGNP Helical-Coil Steam Generator; INL Report; EXT-10-18459; Idaho National Laboratory: Idaho Falls, ID, USA, 2010; pp. 1–68.
  11. Babu, S.S.; Elmer, J.W.; Vitek, J.M.; David, S.A. Time-resolved X-ray diffraction investigation of primary weld solidification in Fe-C-Al-Mn steel welds. Acta Mater. 2002, 50, 4763–4781. [Google Scholar] [CrossRef]
  12. Cui, Y.; Xu, C.; Han, Q. Effect of ultrasonic vibration on unmixed zone formation. Scr. Mater. 2006, 55, 975–978. [Google Scholar] [CrossRef]
  13. Joarder, A.; Saha, S.C.; Ghose, A.K. Study of submerged arc weld metal and heat-affected zone microstructures of a plain carbon steel. Weld. J. Weld. Res. Suppl. 1991, 70, 141s–146s. [Google Scholar]
  14. McPherson, N.A.; Baker, T.N.; Millar, D.W. A study of the structure of dissimilar submerged arc welds. Metall. Mater. Trans. A 1998, 29, 823–832. [Google Scholar] [CrossRef]
  15. McPherson, N.A.; Chi, K.; McLean, M.S.; Baker, T.N. Structure and properties of carbon steel to duplex stainless steel submerged arc welds. Mater. Sci. Technol. 2003, 19, 219–226. [Google Scholar] [CrossRef]
  16. Taban, E.; Deleu, E.; Dhooge, A.; Kaluc, E. Evaluation of Dissimilar Welds between Ferritic Stainless Steel Modified 12% Cr and Carbon Steel S355. Weld. J. Weld. Res. Suppl. 2008, 87, 291s–297s. [Google Scholar]
  17. Sirin, K.; Sirin, S.Y.; Kaluc, E. Influence of the chemical composition of weld electrode on the mechanical properties of submerged arc welded pipe. Int. J. Adv. Manuf. Technol. 2016, 87, 1941–1950. [Google Scholar] [CrossRef]
  18. Wang, Q.; Zhang, M.; Liu, W.; Wei, X.; Xu, J.; Chen, J.; Lu, H.; Yu, C. Study of type-II boundary behavior during SA508-3/EQ309L overlay weld interfacial failure process. J. Mater. Proc. Technol. 2017, 247, 64–72. [Google Scholar] [CrossRef]
  19. Savage, W.; Nippes, E.; Szekeres, E. A study of weld interface phenomena in a low-alloy steel. Weld. J. Weld. Res. Suppl. 1976, 55, 260s–268s. [Google Scholar]
  20. Ishida, T. Formation of stainless steel layer on mild steel by welding arc cladding. J. Mater. Sci. 1991, 26, 6431–6435. [Google Scholar] [CrossRef]
  21. Doody, T. Intermediate mixed zone in dissimilar metal welds for sour service. Weld. J. Weld. Res. Suppl. 1992, 55, 55s–60s. [Google Scholar]
  22. Kou, S.; Yang, Y. Fusion-boundary macrosegregation in dissimilar-filler welds. Weld. J. Weld. Res. Suppl. 2007, 86, 303s–312s. [Google Scholar]
  23. DuPont, J.; Kusko, C. Technical note: Martensite formation in austenitic/ferritic dissimilar alloy welds. Weld. J. Weld. Res. Suppl. 2007, 86, 51s–54s. [Google Scholar]
  24. David, S.; Vitek, J. Correlation between solidification parameters and weld microstructures. Int. Mater. Rev. 1989, 34, 213–245. [Google Scholar] [CrossRef]
  25. Kou, S. Welding Metallurgy, 2nd ed.; John Wiley & Sons: Hobken, NJ, USA, 2003; pp. 226–231. ISBN 0-471-43491-4. [Google Scholar]
  26. DuPont, J.N. Fundamentals of weld solidification. In ASM Handbook 6A, Welding Fundamentals and Processes; ASM International: Metals Park, OH, USA, 2011; pp. 96–114. [Google Scholar]
  27. Elmer, J.W. A new path forward for understanding microstructural evolution during welding. Weld. J. Weld. Res. Suppl. 2008, 87, 149s–166s. [Google Scholar]
  28. Pan, C.; Wang, R.; Gui, J.; Shi, Y. Direct TEM observation of microstructures of the austenitic/carbon steels welded joint. J. Mater. Sci. 1990, 25, 3281–3285. [Google Scholar] [CrossRef]
  29. Gauzzi, F.; Missori, S. Microstructural transformations in austenitic-ferritic transition joints. J. Mater. Sci. 1988, 23, 782–789. [Google Scholar] [CrossRef]
  30. Huang, M.L.; Wang, D.L. Carbon migration in 5Cr-0.5 Mo/21Cr-12Ni dissimilar metal welds. Metall. Mater. Trans. A 1998, 29, 3037–3046. [Google Scholar] [CrossRef]
  31. Mas, F.; Tassin, C.; Valle, N.; Robaut, F.; Charlot, F.; Yescas, M.; Roch, F.; Todeschini, P.; Bréchet, Y. Metallurgical characterization of coupled carbon diffusion and precipitation in dissimilar steel welds. J. Mater. Sci. 2016, 51, 4864–4879. [Google Scholar] [CrossRef]
  32. Mas, F.; Martin, G.; Lhuissier, P.; Bréchet, Y.; Tassin, C.; Roch, F.; Todeschini, P.; Simar, A. Heterogeneities in local plastic flow behavior in a dissimilar weld between low-alloy steel and stainless steel. Mater. Sci. Eng. A 2016, 667, 156–170. [Google Scholar] [CrossRef]
  33. Wu, Y.; Patchett, B.M. Formation of crack-susceptible structures of weld overlay of corrosion resistant alloys. Mater. Perform. Sulphur Energy 1992, 283–295. [Google Scholar]
  34. Murugan, N.; Gunaraj, V. Prediction and control of weld bead geometry and shape relationships in submerged arc welding of pipes. J. Mater. Proc. Technol. 2005, 168, 478–487. [Google Scholar] [CrossRef]
  35. Cho, D.W.; Song, W.H.; Cho, M.H.; Na, S.J. Analysis of submerged arc welding process by three-dimensional computational fluid dynamics simulations. J. Mater. Proc. Technol. 2013, 213, 2278–2291. [Google Scholar] [CrossRef]
  36. Winczek, J.; Gawronska, E. The modeling of heat affected zone (HAZ) in submerged arc welding (SAW) surfacing steel element. Metabk 2016, 55, 225–228. [Google Scholar]
  37. Cayron, C.; Artaud, B.; Briottet, L. Reconstruction of Parent Grains from EBSD Data. Mater. Charact. 2006, 57, 386–401. [Google Scholar] [CrossRef]
  38. Cayron, C. ARPGE: A computer program to automatically reconstruct the parent grains from electron backscatter diffraction data. J. Appl. Cryst. 2007, 40, 1183–1188. [Google Scholar] [CrossRef]
  39. Andersson, J.O.; Helander, T.; Höglund, L.; Shi, P.; Sundman, B. Thermo-Calc and DICTRA, Computational tools for materials science. Calphad 2002, 26, 273–312. [Google Scholar] [CrossRef]
  40. Anderson, T.D.; Perricone, M.J.; Dupont, J.N.; Marder, A.R. The influence of molybdenum on stainless steel weld microstructures. Weld. J. Weld. Res. Suppl. 2007, 86, 281s–292s. [Google Scholar]
  41. Cayron, C. GenOVa: A computer program to generate orientational variants. J. Appl. Cryst. 2007, 40, 1179–1182. [Google Scholar] [CrossRef]
  42. Greninger, A.B.; Troiano, A.R. The mechanism of martensite formation. Metall. Trans. 1949, 1, 590–598. [Google Scholar] [CrossRef]
  43. Kurdjumov, G.; Sachs, G. Über den Mechanismus der Stahlhärtung. Z. Für Phys. 1930, 64, 325–343. [Google Scholar] [CrossRef]
  44. Nishiyama, Z. X-ray investigation of the mechanism of transformation from face-centered-cubic lattice to body-centered cubic. Sci. Rep. Tohoku. Univ. 1934, 23, 637–664. [Google Scholar]
  45. Kurz, W.; Fisher, D.J. Fundamentals of Solidification, 3rd ed.; Trans Tech Publications: Zürich, Switzerland, 1989; pp. 45–61. ISBN 0-87849-522-3. [Google Scholar]
  46. Dantzig, J.A.; Rappaz, M. Solidification, 1st ed.; EPFL Press: Lausanne, Switzerland, 2009; pp. 451–452. ISBN 978-2-940222-17-9. [Google Scholar]
  47. Tiller, W.A.; Jackson, K.A.; Rutter, J.W.; Chalmers, B. The redistribution of solute atoms during the solidification of metals. Acta. Metall. 1953, 1, 428–437. [Google Scholar] [CrossRef]
  48. Coates, D.E.; Subramanian, S.V.; Purdy, G.R. Solid-liquid interface stability during solidification of dilute ternary alloys. Trans. AIME 1968, 242, 800–809. [Google Scholar]
  49. Katayama, S.; Matsunawa, A. Solidification microstructure of laser welded stainless steels. In Proceedings of the International Congress on Applications of Lasers & Electro-Optics (ICALEO), Boston, MA, USA, 12–15 November 1968; Publ. Laser Institute of America: Orlando, FL, USA, 1968; pp. 60–67. [Google Scholar]
  50. Elmer, J.W.; Allen, S.M.; Eager, T.W. Microstructural development during solidification of stainless steel alloys. Metall. Trans. A 1989, 20, 2117–2131. [Google Scholar] [CrossRef]
  51. Ikawa, H.; Shin, S.; Inui, M.; Takeda, Y.; Nakano, A. On the martensitic-like structure at weld bond and the macroscopic segregation in weld metal in the welded dissimilar metals of α−steels and γ−steels. IIW Database 1972, IIW Doc IX-785-72, 1–32. [Google Scholar]
  52. Kurz, W.; Giovanola, B.; Trivedi, R. Theory of microstructural development during rapid solidification. Acta. Metall. 1986, 34, 823–830. [Google Scholar] [CrossRef]
  53. Ha, H.P.; Hunt, J.D. An experimental and theoretical study of the peritectic reaction. In Proceedings of the 4th Decennial International Conference on Solidification Processing, Sheffield, UK, 7–10 July 1997; Beech, J., Jones, H., Eds.; pp. 444–448. [Google Scholar]
  54. Vandyoussefi, M.; Kerr, H.W.; Kurz, W. Solidification microstructure selection map for Fe-Ni peritectic alloys. In Proceedings of the 4th Decennial International Conference on Solidification Processing, Sheffield, UK, 7–10 July 1997; Beech, J., Jones, H., Eds.; pp. 564–567. [Google Scholar]
  55. Hunziker, O.; Vandyoussefi, M.; Kurz, W. Phase and microstructure selection in peritectic alloys close to the limit of constitutional undercooling. Acta Mater. 1998, 46, 6325–6336. [Google Scholar] [CrossRef]
  56. Fukumoto, S.; Okane, T.; Umeda, T.; Kurz, W. Crystallographic relationships between δ-ferrite and γ-austenite during unidirectional solidification of Fe-Cr-Ni alloys. ISIJ Int. 2000, 40, 677–684. [Google Scholar] [CrossRef]
  57. Rettenmayr, M. Melting and remelting phenomena. Int. Mater. Rev. 2009, 54, 1–17. [Google Scholar] [CrossRef]
  58. Han, Q.; Hellawell, H. Primary particle melting rates and equiaxed solidification. Metall. Mater. Trans. B 1997, 28, 169–173. [Google Scholar] [CrossRef]
  59. Bobadilla, M.; Lacaze, J.; Lesoult, G. Influence des conditions de solidification sur le déroulement de la solidification des aciers inoxydables austénitiques. J. Cryst. Growth. 1988, 89, 531–544. [Google Scholar] [CrossRef]
  60. Fukumoto, S.; Kurz, W. The δ to γ transition in Fe-Cr-Ni alloys during laser treatment. ISIJ Int. 1997, 7, 677–684. [Google Scholar] [CrossRef]
  61. Fukumoto, S.; Kurz, W. Prediction of the δ to γ transition in austenitic stainless steels during laser treatment. ISIJ Int. 1998, 38, 71–77. [Google Scholar] [CrossRef]
  62. Babu, S.S.; Vitek, J.M.; Elmer, J.W.; Palmer, T.A.; David, S.A. Nonequilibrium phase selection during weld solidification of Fe-C-Mn-Al. In Solidification Processes and Microstructures: A Symposium in Honor of Wilfried Kurz; Wiley: New York, NY, USA, 2004; pp. 339–344. [Google Scholar]
  63. Hashimoto, T.; Terasaki, H.; Komizo, Y. Effect of solidification velocity on weld solidification process of alloy tool steel. Sci. Technol. Weld. Join. 2008, 13, 409–414. [Google Scholar] [CrossRef]
  64. Rappaz, M.; David, S.A.; Vitek, J.M.; Boatner, L.A. Analysis of solidification microstructures in Fe-Ni-Cr single-crystal welds. Metall. Trans. A 1990, 21, 1767–1782. [Google Scholar] [CrossRef]
  65. Siredey, N.; Lacaze, J. Growth conditions at the solidification front of multicomponent alloys. Scr. Metall. Mater. 1993, 29, 759–764. [Google Scholar] [CrossRef]
  66. Ivantsov, G.P. Temperature field around a spherical, cylindrical, and needle-shaped crystal, growing in a pre-cooled melt. Dokl. Akad. Nauk. SSSR 1947, 58, 567–569. [Google Scholar]
  67. Mullins, W.W.; Sekerka, R.F. Stability of a planar interface during solidification of a dilute binary alloy. J. Appl. Phys. 1964, 35, 444–451. [Google Scholar] [CrossRef]
Figure 1. Optical micrograph of a longitudinal section in a single-layer weld. Vt and V refer respectively to the travel speed of the strip electrode and the local solidification velocity at a point M on the liquid-solid interface.
Metals 08 00284 g001
Figure 2. Transverse section of the dissimilar weld. (a) Optical micrograph after double etching (M martensite, A austenite, F ferrite); (b) Composition profiles (Fe, Cr, Ni) measured by WDS along the line marked with crosses on the above micrograph: the transition zone is noticed as PMZ (partially mixed zone).
Metals 08 00284 g002
Figure 3. Microstructure near the fusion line. (a) SEM micrograph after electro-nitric etching showing the transition between plane front and cellular growth modes; (b) SEM micrograph of the fusion boundary after light electro-nitric etching; (c) EDS map for chromium.
Metals 08 00284 g003
Figure 4. (a, b) Optical micrographs of the weld metal after Lichtenegger and Bloesch etching: austenite is colored in dark/light brown relative to its composition, and ferrite in black. (a) Microstructure in the first 150 µm close to the fusion line; (b) Microstructure at 4 mm from fusion line; (c) Schematic of the transitions in the solidification mode: cellular A mode (γ1), cellular AF mode (γ1, δ) and dendritic FA mode (δ1, γ2, γ2).
Metals 08 00284 g004
Figure 5. Cr and Ni profiles measured by EDS. (a) Across several austenitic cells (AF region in Figure 4); (b) Across several secondary arms of two-phase dendrites (FA region in Figure 4). C and E refer respectively to centers and edges of cells or dendrites. Extrema of Cr and Ni contents are measured in ferrite and depend on the size of the probed volume relative to that of the ferrite phase, thus they cannot be considered as quantitative.
Metals 08 00284 g005
Figure 6. Optical micrograph of the weld after a two-step etching: Nital and Electro-nitric. Solid arrows (in red) highlight the continuity of Type I grain boundaries across the fusion line. Type II grain boundaries almost parallel to the fusion line are also indicated by dotted arrows (in blue).
Metals 08 00284 g006
Figure 7. (a) EBSD map of some martensitic laths in the base metal and the adjacent austenitic grain in the weld; (b) Experimental <100> pole figure from the austenitic grain; (c) Experimental <100> and <110> pole figures from the martensitic laths; (d) Simulated poles figures, red dots being the <100> directions of the parent austenitic grain and blue dots being the directions of the 24 martensitic variants obtained assuming the GT orientation relationship.
Metals 08 00284 g007
Figure 8. Results of the parent grains reconstruction with ARPGE software. (a) Initial EBSD map around the interface; (b) Crystallographic orientations of the former austenitic grains on the base metal side, calculated by ARPGE; (c) Crystallographic orientations of the austenitic grains on the weld metal side.
Metals 08 00284 g008
Figure 9. High temperature phase equilibria calculated with Thermo-Calc® and the TCFE6 database for the composition (in wt. %) of the liquid estimated at the fusion line: C = 0.151, Cr = 4.43, Mn = 1.454, Mo = 0.26, N = 0.014, Ni = 2.842, Si = 0.393, Fe = bal.
Metals 08 00284 g009
Figure 10. Optical micrographs of the near interface region after welding followed by PWHT heat treatment during 16 h at 610 °C. (a) Decarburized layer in the 18MND5 base metal and carburized layer (in dark) on the weld side. Magnifications around the fusion line showing the phantoms of the dendritic network in the ferrite grains of the locally decarburized 18MND5: (b) on the base metal side; (c) in an unmelted steel part.
Metals 08 00284 g010
Figure 11. (a) Evolution of the composition of the solid phases (BCC and FCC) during solidification of the 18MND5 base metal, computed with Thermo-Calc® and the TCFE6 database, using a modified Scheil-Gulliver model: percentage of solid equal to zero corresponds to the axis of the dendrites and equal to 100% to their outer shell; (b) Liquid-solid phase equilibria for the composition (in wt. %) of the last austenite solidified at the outer shell of the dendrites: Cr = 0.27, Ni = 1.16, Mn = 4.17, Mo = 1.18, Si = 1.52, C = 0.24, N = 0.014, Fe = bal.
Metals 08 00284 g011
Figure 12. Solidification paths computed with Thermo-Calc® and the TCFE6 database using a modified Scheil-Gulliver model. (a) BCC ferrite rejected for the local compositions at 36 µm from the fusion line (in wt. %): Cr = 6.0, Ni = 3.4, Mn = 1.6, Mo = 0.25, Si = 0.39, C = 0.14, N = 0.016, Fe = bal.; (b) Free solidification for the 5% remaining liquid at 36 µm from the fusion line; (c) BCC rejected for the local compositions at 80 µm from the fusion line: Cr = 17.0, Ni = 9.0, Mn = 1.5, Mo = 0.14, Si = 0.14, C = 0.07, N = 0.03, Fe = bal.; (d) Free solidification for the 5% remaining liquid at 80 µm.
Metals 08 00284 g012
Figure 13. Cell/dendrite tip temperature T* as a function of solidification velocity for the composition (in wt. %): Cr = 15.6, Ni = 8.3, C = 0.05, Fe = bal. Welding speed is indicated by a vertical dashed line.
Metals 08 00284 g013
Table 1. Chemical composition of the materials (in wt. %).
MaterialsCCrMnMoNNiSiFe
18MND5 Base metal0.180.21.40.30.0090.70.4bal.
309L Filler metal0.02123.71.70.070.03912.60.36bal.
Table 2. SAW welding parameters.
Welding ParametersData
Polarity+ at the strip electrode
Voltage (V)27
Intensity (A)750 ± 20
Travel speed (cm·min−1)13.5–14.5
Stick-out (mm)28
Strip angle (°)90
Pre-heating temperature (°C)130
Table 3. Growth rate VZ at several distances Z from fusion line.
Z (mm)02050100300
VZ (µm·s−1)0175440560650
Table 4. Mass partition coefficients of nickel and chromium extracted from TCFE6 database, at the liquidus temperature for the composition (in wt. %) where the microsegregation profiles were measured in the transition zone: C = 0.052, Cr = 18, Mn = 1.6, Mo = 0.16, N = 0.03, Ni = 9.0, Si = 0.7, Fe = bal.
Primary Phasek (Cr)k (Ni)Liquidus (°C)
FCC (face-centered cubic) austenite0.861.01440
BCC (body-centered cubic) ferrite1.030.761452
Table 5. Thermodynamic and kinetic parameters used for the application of the constitutional supercooling criterion in the case of an austenitic solidification of a ternary Fe-Cr-Ni alloy (1 = Cr, 2 = Ni). Ni and Cr concentrations are those measured by WDS (Figure 2b) on the intermediate plateau between 15 and 30 µm from the fusion line.
Thermo-Kinetic ParametersSymbolsData
Inter-diffusion coefficient of Cr in the liquidD111.5 × 10−9 m2·s−1
Inter-diffusion coefficient of Ni in the liquidD221.5 × 10−9 m2·s−1
Nominal composition in Cr C 1 0 6.1 wt. %
Nominal composition in Ni C 2 0 3.3 wt. %
Liquidus slope for Crm1−300 K (wt. %)−1
Liquidus slope for Nim2−155 K (wt. %)−1
Liquidus temperatureTL1780 K
Mass partition coefficient of Crk10.87
Mass partition coefficient of Nik20.93
Table 6. Parameters used for the calculation of the tip temperature.
Thermo-Kinetic ParametersSymbolsFerrite (Φ = δ)Austenite (Φ = γ)
Liquidus temperature (K)TLΦ17451736
Liquidus slope for Cr (K/wt. %)mΦCr−0.75−4.18
Liquidus slope for Ni (K/wt. %)mΦNi−5.8−0.78
Liquidus slope for C (K/wt. %)mΦC−108.5−58.5
Partition coefficient of CrkCr10.85
Partition coefficient of NikNi0.781
Partition coefficient of CkC0.120.34
Interdiffusion coefficient in the liquid (m2·s−1)D1.5 × 10−91.5 × 10⁻⁹
Solid/liquid interfacial energy (J·m−2) σ s l 0.2600.358
Molar volume at liquidus temperature (m3·mol−1)Vm7.52 × 10−69.03 × 10⁻⁶
Molar entropy of fusion (J·mol−1·K−1) Δ S m f 5.796.63
Thermal conductivity (J·s−1·m−1·K−1)κ3027
Gibbs Thomson coefficient (m·K)Γ3.39 × 10−74.87 × 10−7

