Parametric Effects of Mechanical Alloying on Carbon Nanofiber Catalyst Production in the Ni-Cu System

Department of Applied Engineering, Safety and Technology, Millersville University, Millersville, PA 17551, USA
*
Author to whom correspondence should be addressed.
Metals 2018, 8(4), 286; https://doi.org/10.3390/met8040286
Submission received: 31 March 2018
/
Revised: 17 April 2018
/
Accepted: 17 April 2018
/
Published: 20 April 2018
(This article belongs to the Special Issue Mechanical Alloying 2018)
Abstract
:Mechanical alloying (MA) has been and continues to be thoroughly examined for creating structural materials, but the production of catalysts is relatively rare. This is especially true for catalysts used in the production of carbon nanofibers (CNFs), a versatile material for applications such as energy storage, catalyst support, advanced composites and others. The application of MA to create CNFs presents a valuable tool in reducing their cost and complexity, and thereby may increase their commercial potential. In this study, the effects of milling duration on CNF deposition are studied by the complementary methods of X-ray diffraction, compositional mapping, electron microscopy, particle size analysis and surface area analysis. These were used to determine microstructural and macroscale evolution of the catalyst powder and its effects on the kinetics and characteristics of carbon deposition using Ni and Ni 30 at % Cu. The results have important implications for low cost catalyst production and provide general guidance on the development of catalytic materials in miscible systems.
1. Introduction
Carbon nanofibers (CNFs) have been thoroughly researched since their discovery to better understand, control and apply their physical and chemical properties. These properties are dictated by structural and morphological variations that are possible with CNFs and controlled by the synthesis conditions [1,2,3]. Their variable structure and properties make this material valuable for diverse applications such as hydrogen storage [4], electronics [5], reinforcement for high-strength polymer nanocomposites [6], water purification [7,8], and catalyst support [9].
The properties of the fibers are linked to the methods used to create them, and the various methods include fluidized bed reactor [10], plasma enhanced chemical vapor deposition (PECVD) [11] and atmospheric pressure chemical vapor deposition (APCVD) [12]. They are formed when a carbon-containing gas is adsorbed and decomposed on the surface of the catalyst followed by dissolution and diffusion of carbon into the interior and results in precipitation of solid carbon [2,3,13]. The efficiency of the catalyst depends on reaction conditions such as the temperature, catalyst support, and reaction gas(es), and each of these factors will be specific to a particular catalyst composition [12].
The composition is not the only driving factor. The form of the catalyst, such as foil, powder, thin film, etc., will also dictate the deposition kinetics and morphological properties. For example, in studies on palladium [13,14,15], it was found that foil (250 µm thick) resulted in a thin film of carbon, but sputtered films and micron powder resulted in nanofibrous deposition. Additionally, powder sintering effects can be detrimental to deposition kinetics, but it can be overcome to improve deposition kinetics [16]. These results indicate that the microstructural and surface features of a bulk catalyst are contributing factors in the deposition process and a potential parameter for controlling the characteristics of the resulting fibers. The catalyst preparation method, then, is critical.
A method commonly used to produce catalysts for CNF growth is precipitation (e.g., [12,13,17,18]). In the general process, metal carbonates are precipitated from metal nitrate solutions using ammonium bicarbonate. The precipitate is then dried overnight, calcined for a few hours, and lastly reduced for up to 20 h. If needed, the granules are mechanically ground to form nanocrystals, as the size of the catalyst particle has been found to determine the final diameter of the CNF catalyzed by it [2]. Precipitation processes can be quite time-consuming, and alternative methods of producing catalytic alloys are desirable to reduce cost and increase throughput.
Mechanical alloying (MA) can be used to rapidly synthesize materials in a non-equilibrium state, such as highly immiscible alloys. MA is a powder processing method that produces alloys from elemental powder mixtures using repeated impacts from milling media to plastically deform and intimately mix the materials [19]. Previous work [20] determined that mechanical alloying is a viable method for creating bimetallic catalysts used in CNF synthesis. Nickel–copper and iron–copper alloys were prepared by MA and their performance in the deposition of CNFs was found comparable to literature values for alloys formed using the co-precipitation method. The minimum milling time studied was 4 h, and longer durations did not improve performance. Indeed, the kinetics suffered slightly up to the maximum of 20 h. In an effort to further elucidate the development of the catalyst during MA, we have studied the deposition from milling times as low as 5 min and incrementally increased the milling to 4 h. The objective of this work was to determine the effects the MA process has on bulk catalysis, including particle size and microstructure, and CNF size, morphology, crystallinity and surface area. To focus on these, a 70:30 Ni-Cu composition was chosen that has been thoroughly reported in other work [21,22], allowing direct comparison of processing and structural factors other than composition. Although enhanced deposition is realized over a range of compositions, alloys especially rich in Ni or Cu are much less active. This work was motivated by the desire to determine if shorter milling times can create a comparable Ni-Cu catalyst and what mechanisms determine the activity in these bulk catalysts.
2. Experiments
2.1. Material Processing
Nickel–copper alloys were prepared using a SPEX 8000M high-energy ball mill (SPEX SamplePrep, Metuchen, NJ, USA) with a ball-to-powder mass ratio of 10:1. The elemental powders used to make the alloys were nickel (99.7%, <50 µm) and low-oxygen copper (99%, <75 µm), and stearic acid (reagent grade, 95%) was added as a process control agent. All were obtained from Sigma-Aldrich (MilliporeSigma, St. Louis, MO, USA) and used without modification. Each milling run consisted of 5 g of powder in a 7:3 atomic ratio of Ni:Cu. Each alloy was milled with 1 wt % stearic acid to prevent cold welding. Separate powder charges were milled under argon for 5, 10, 15, 20, 30, 45, 60, 75, 90, 120, 180 and 240 min, in that order, without cleaning the vial in between runs to reduce contamination from the vial and milling media (stainless steel). Pure nickel was milled under the same conditions as a control. Previous studies [20,21] demonstrated pure copper to have negligible catalytic properties for CNF synthesis and was not used as a control. Ni and Ni 30 at % Cu were also used in “unmilled” form as an experimental control. This was accomplished by using the pure metals directly from the manufacturer and consisted of elemental powders of Ni and Cu mixed together in identical ratios to those which were milled (7:3, Ni:Cu). These unmilled catalysts correspond to a 0 min milling time. Alloy blends were used to control for proximity effects not related to mechanical alloying, as simple mixtures can be more effective than alloyed powders in some cases [23]. To determine the effects of particle size distribution on carbon deposition, the pure Ni and Ni-Cu powders milled for 20 min and 180 min were sifted into 4 different particle size ranges using 120, 200 and 400 mesh sieves. All powders were handled and stored in a glove box (Inert, Amesbury, MA, USA) under argon (<1 ppm O2, <1 ppm H2O).
In the glove box, approximately 10 mg of catalyst was weighed directly in alumina (Al2O3) boats (20 × 20 × 150 mm3) to negate any mass loss due to powder transfer. Two separate samples, of the same composition, were placed side-by-side in the center of the tube furnace in individual Al2O3 boats. Reaction gases used in this work were nitrogen (99.9999%), ethylene (99.5%) and forming gas (5% H2 in Ar). Each reaction began with ethylene (C2H4) and hydrogen (H2) flowing in a 4:1 ratio controlled using digitally programmed MKS G-series mass flow controllers (MKS Instruments, Inc., Andover, MA, USA). The furnace was ramped to final temperature over a 20 min period and processing was stopped after 1 h at reaction temperature. It was previously demonstrated [24] that catalytic activity was maintained from 1 h to at least 12 h reactions, and therefore catalyst deactivation is not a factor in overall growth rate. After the reaction was complete, samples were cooled under nitrogen. Reactions were performed using an Across International (Across International, Inc., Livingston, NJ, USA) 50 mm diameter, single zone tube furnace, and conducted at 550 °C for the sifted samples, and 550 °C and 600 °C for the remaining samples. The carbon deposition kinetics were calculated using percent mass gain per hour (% mass/h) to normalize the deposition rates. To determine the effects of thermal processing on the catalyst microstructure, Ni and Ni 30 at % Cu, milled for 20 minutes, were annealed at 200, 400 and 550 °C for one hour under 200 sccm forming gas (5% H2 in Ar).
2.2. Characterization
Mechanically alloyed catalysts were analyzed by using a PANalytical X’Pert Pro MPD X-ray diffractometer (XRD) (Malvern Panalytical B.V., Almelo, The Netherlands) with Cu anode (Cu Kα wavelength: 1.54 Å). Grain size estimation was performed using the Scherrer equation applied to each peak in the pattern. The overall grain size was taken as the average of all peaks. In two-phase samples, the Ni and Cu peaks were treated separately. Scanning electron microscopy (SEM) (Hitachi High Technologies, Tokyo, Japan) and energy-dispersive X-ray spectroscopy (EDS) (Oxford Instruments plc, Abingdon, Oxfordshire, UK) were performed on the catalyst using a Hitachi SU5000 equipped with an Oxford Instruments X-MaxN detector. The examined surface was created by broad beam ion milling using a Hitachi IM4000 Plus. Powder size analysis was conducted in isopropyl alcohol with a Malvern Mastersizer S (Malvern Panalytical B.V., Almelo, The Netherlands). Brunauer–Emmett–Teller (BET) surface area was measured using a Mircomeritics ASAP 2420 (Micromeritics Instrument Corp., Norcross, GA, USA) at 77K. Carbon nanofiber characteristics were examined using a Zeiss Auriga 60 CrossBeam SEM/FIB (Carl Zeiss Microscopy GmbH, Jena, Germany) at an accelerating voltage of 3 kV. Transmission electron microscopy (TEM) was performed using an FEI Talos F200C (Thermo Fisher Scientific, Inc., Waltham, MA, USA) (accelerating voltage of 200 kV). CNFs were distributed dropwise on lacey carbon grids after sonication in ethanol and dried in air before examination.
3. Results
3.1. Milling Duration and Catalyst Microstructure
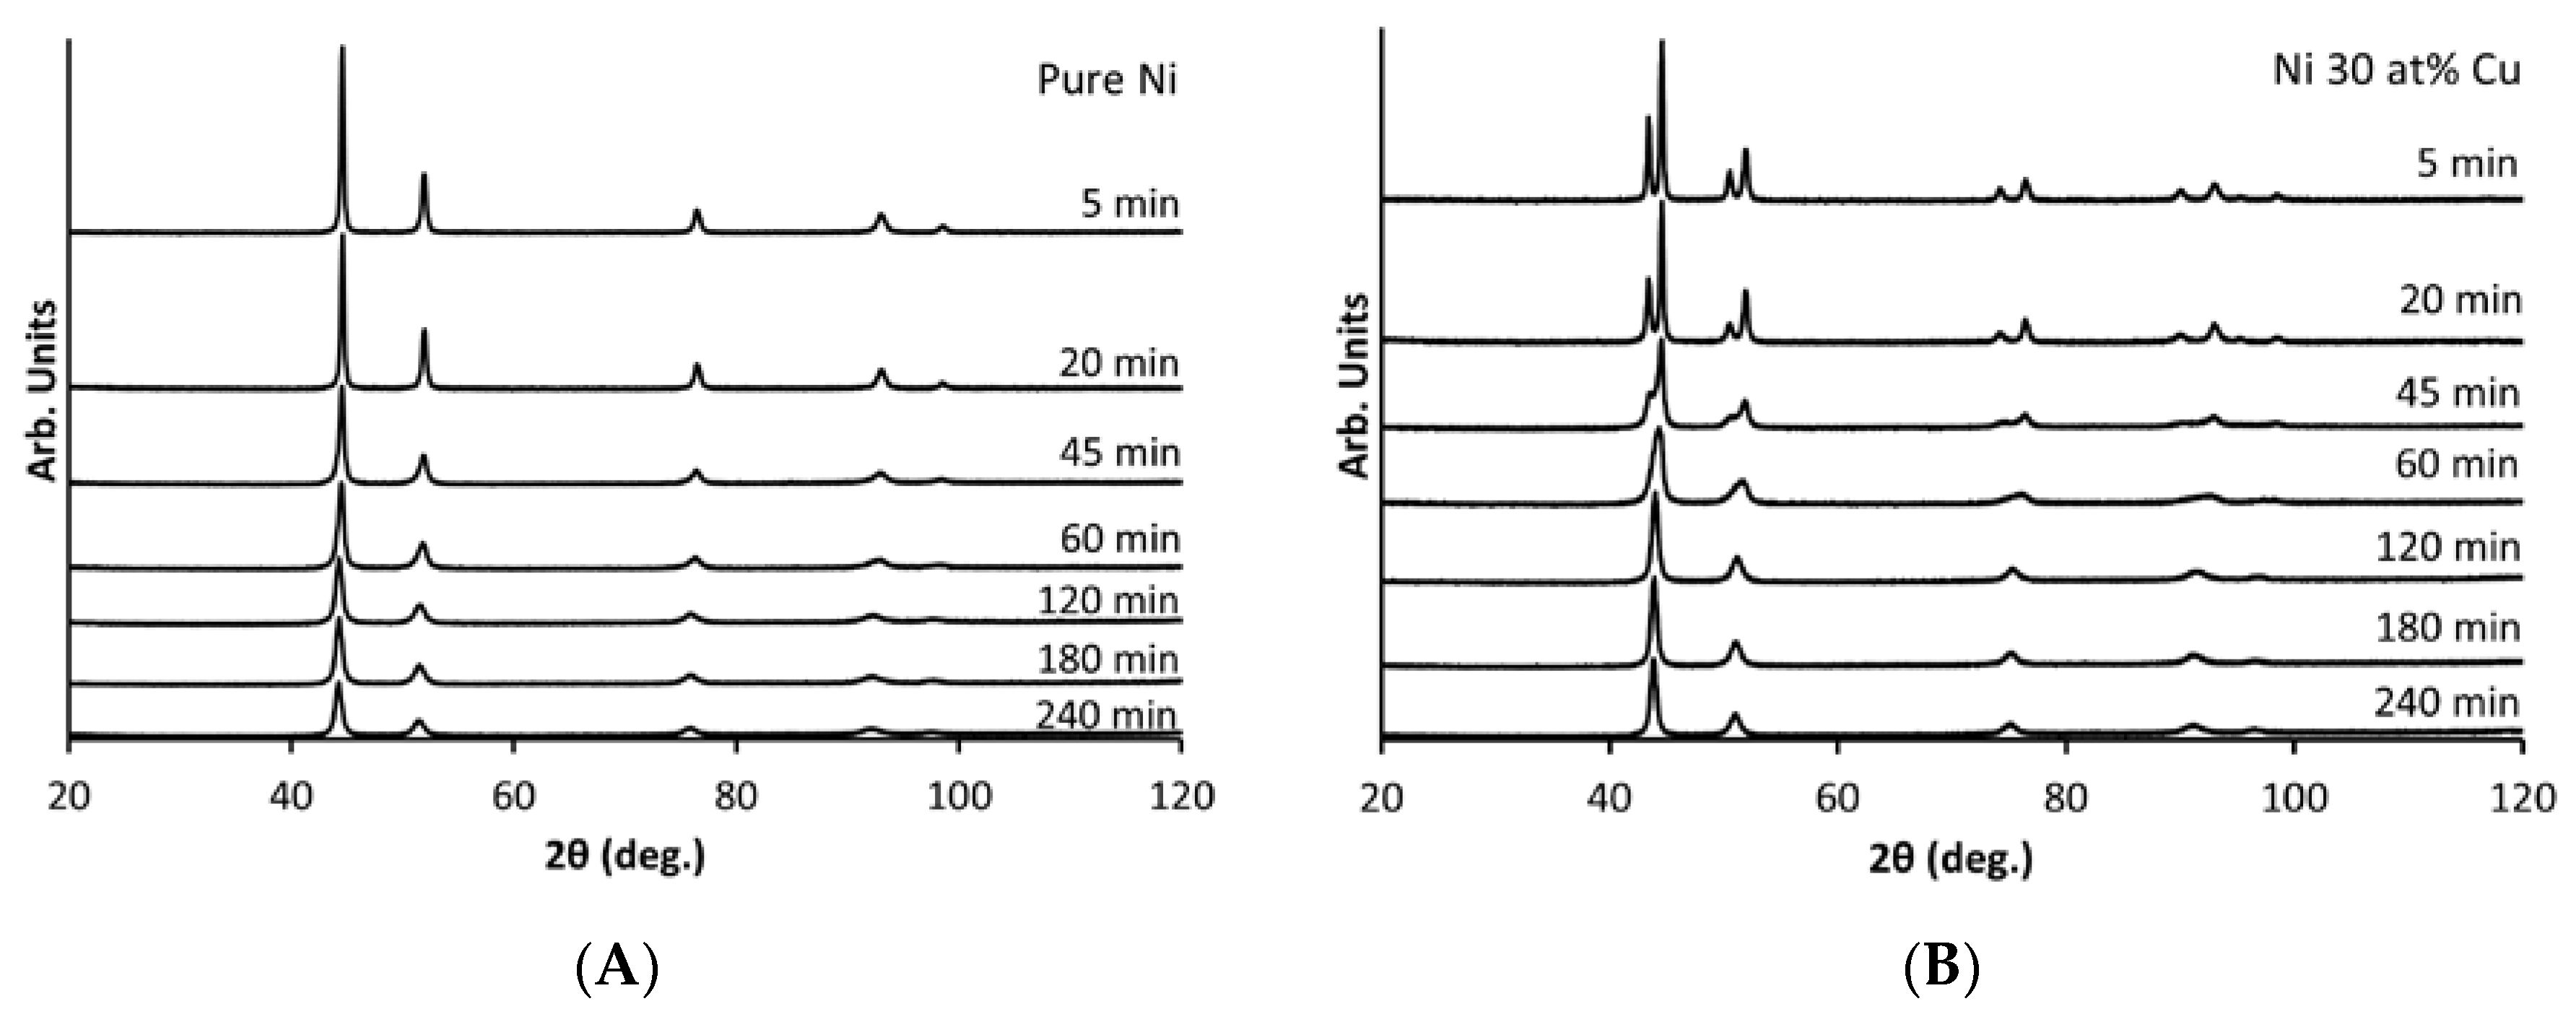
The XRD patterns after various milling times for pure Ni and Ni 30 at % Cu are shown in Figure 1. As milling time increases for pure Ni, evidence of overall structural refinement is seen by peak broadening and reduction of intensity of the peaks. For the Ni-Cu alloy, distinct Ni and Cu peaks can be seen up to 20 min of milling. After 45 min of milling, the peaks begin to merge. After 60 min, a single set of fcc peaks can be seen, as determined by the single phase structure in the Cu-Ni phase diagram [25], suggesting full alloying of the two constituents is nearly complete, but the asymmetric peak shape indicates some remaining convolution of the two. Structural refinement at longer milling times is indicated in the Ni-Cu alloy as both peak broadening and reduction of intensity of the peaks occur.
The grain size after each milling increment was estimated from the XRD patterns using the Scherrer equation (see Figure 2). As milling time increases up to 45 min, the grain size decreases for pure nickel and both elements of the alloy. After 60 min of milling the lowest grain size is reach and it is then stabilized from 75 to 240 min of milling. Before the Ni-Cu alloy is fully mixed, the peaks for Ni and Cu were analyzed separately (until 60 min). The Scherrer equation assumes an inverse proportionality between peak width and crystallite size. However, instrumental profile, different types of microstrains, and solid solution inhomogeneity also contribute to peak width. Additionally, the Scherrer constant can vary depending on how the peak width and crystallite size are defined, the shape of the crystal, and the size distribution [26]. It is expected, then, that although the grain size quickly reduces to a stable value estimated at approximately 10 nm, in reality there is a broad distribution of grain size with a portion much larger than estimated.
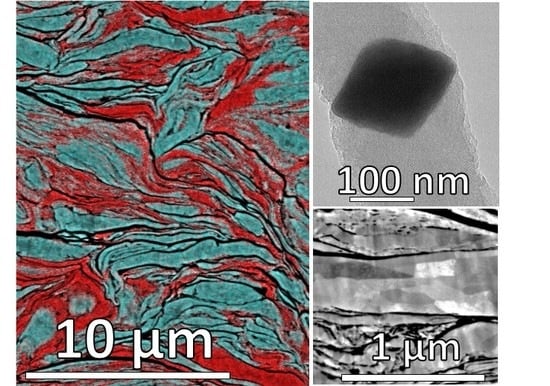
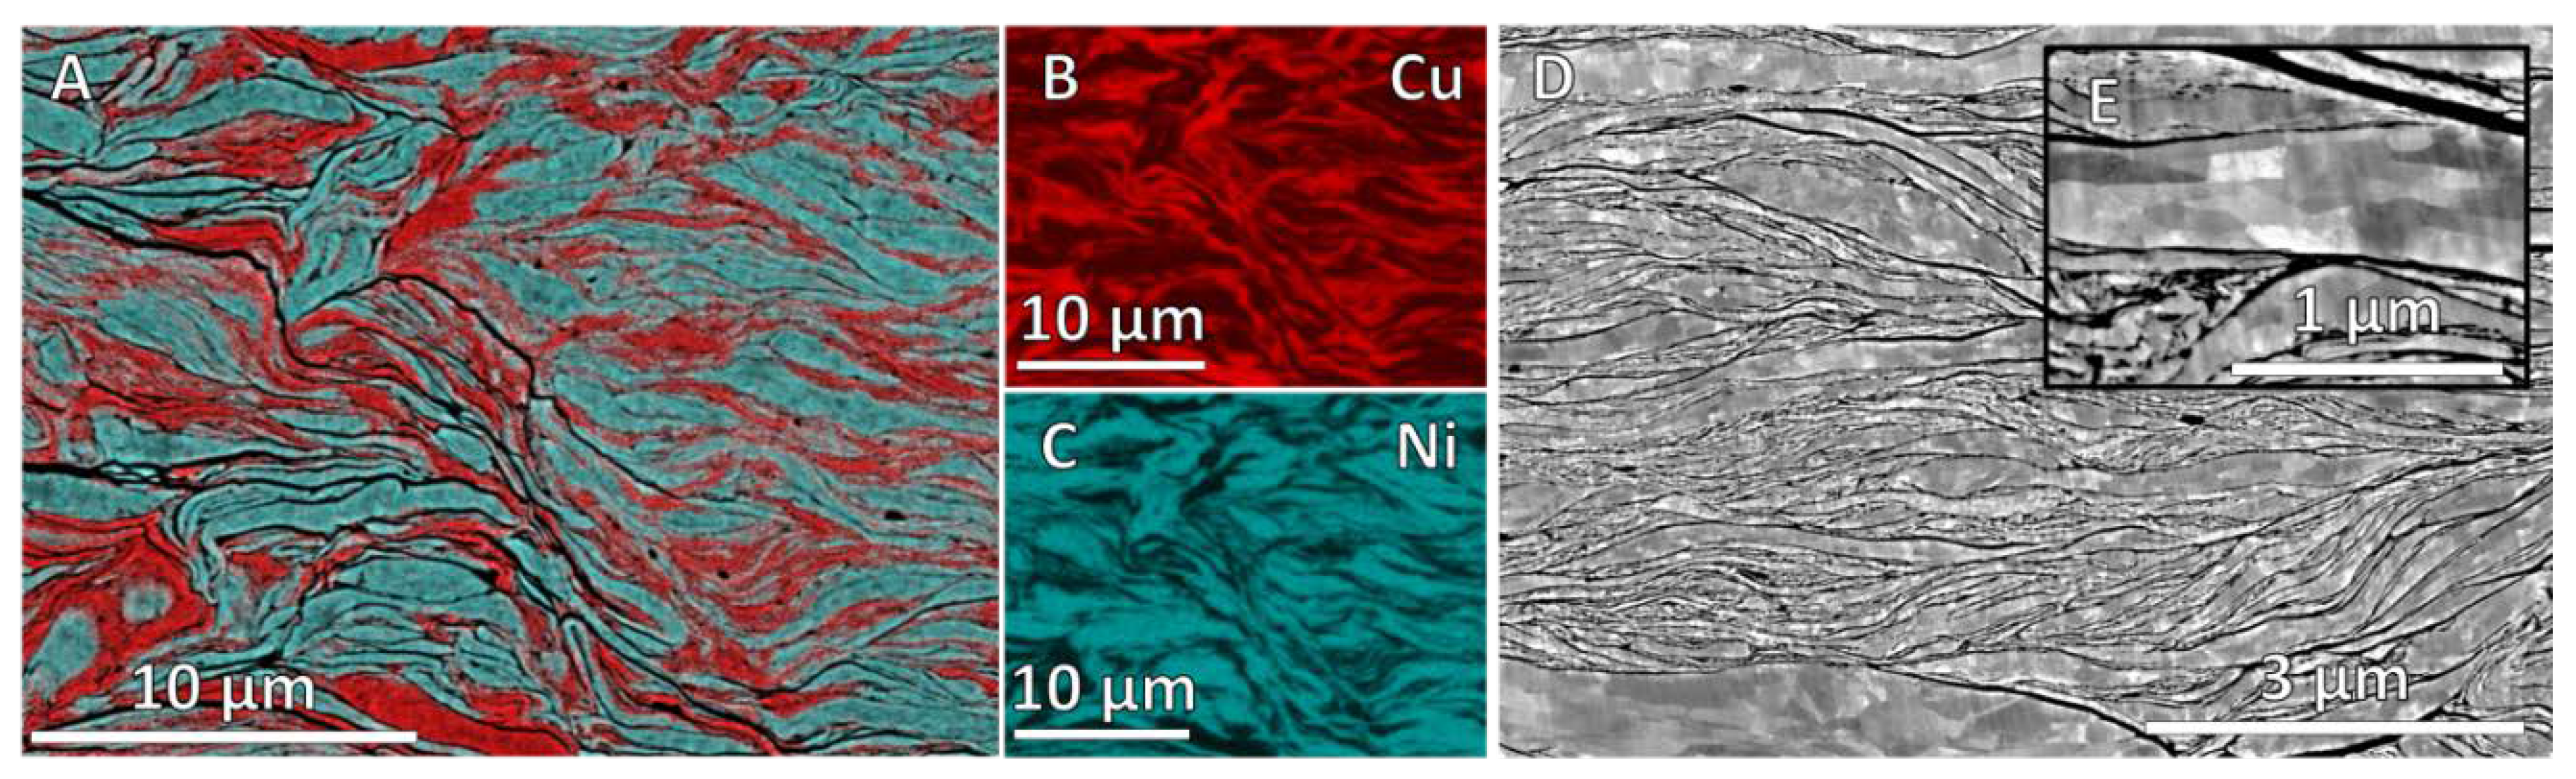
As discussed in Section 3.3, 20 min of milling is sufficient to create a fully active Ni-Cu catalyst, and to determine the microstructure of the alloy milled for 20 min, SEM and EDS mapping were performed (see Figure 3). In agreement with XRD (Figure 1B), the alloy is not fully mixed after 20 min of milling, and distinct micron-scale lamellar regions of the constituents can be seen in Figure 3A–C. In Figure 3D,E, backscatter electron (BSE) grain contrast can be seen, and it is evident that the grain size is very fine, but there still exist a number of grains which are hundreds of nanometers in size (see Figure 3E). There is also a large presence of voids within the highly textured microstructure, indicating incomplete welding of particles at this early stage.
3.2. Milling Duration and Carbon Deposition
After milling, pure nickel achieves a deposition rate of no more than 350% mass/h under the reaction conditions applied here (see Figure 4A). As-received nickel actually has a higher deposition rate than nickel milled for short times, but its carbon deposition rate is still significantly lower than when used as an alloy with copper (see Figure 4B). The nickel-copper alloy achieves a deposition rate greater than 2000% mass/h under similar conditions, and the Ni-Cu alloy is also less sensitive to milling time, as it retains a relatively consistent activity over the entire range of milling durations.
It should be noted that variability in growth rate is sensitive to relatively minor fluctuations in final mass as the initial catalyst load, which the kinetics are based on, is small (10 mg). Even so, the differences in deposition with time, and especially with regard to the differences between Ni and the Ni-Cu alloy are definitive. To verify the importance of alloying, a mixture of Ni and Cu powders, corresponding to a 0 milling time, was used as a control to exclude proximity effects not related to alloying. The minor growth seen at 0 min milling can be attributed to nickel alone, as copper has negligible catalytic properties. This emphasizes that Cu must be intimately mixed to see the synergistic effects, unlike the Pd-Co system, where proximity is preferred over alloying [23].
Figure 4 suggests that pure Ni has a complex relationship to milling time. Although 30 min of milling does improve the catalytic activity of pure Ni by more than 75% (from ~200 to 350% mass/h), it is not nearly as effective toward carbon deposition as the Ni-Cu alloy (consistently between 3000 and 4000% mass/h). Pure Ni also shows a maximum efficiency at an intermediate milling time, while Ni-Cu remains relatively steady after only 10 min. These variations are expected to be linked to a combination of particle characteristics as discussed later.
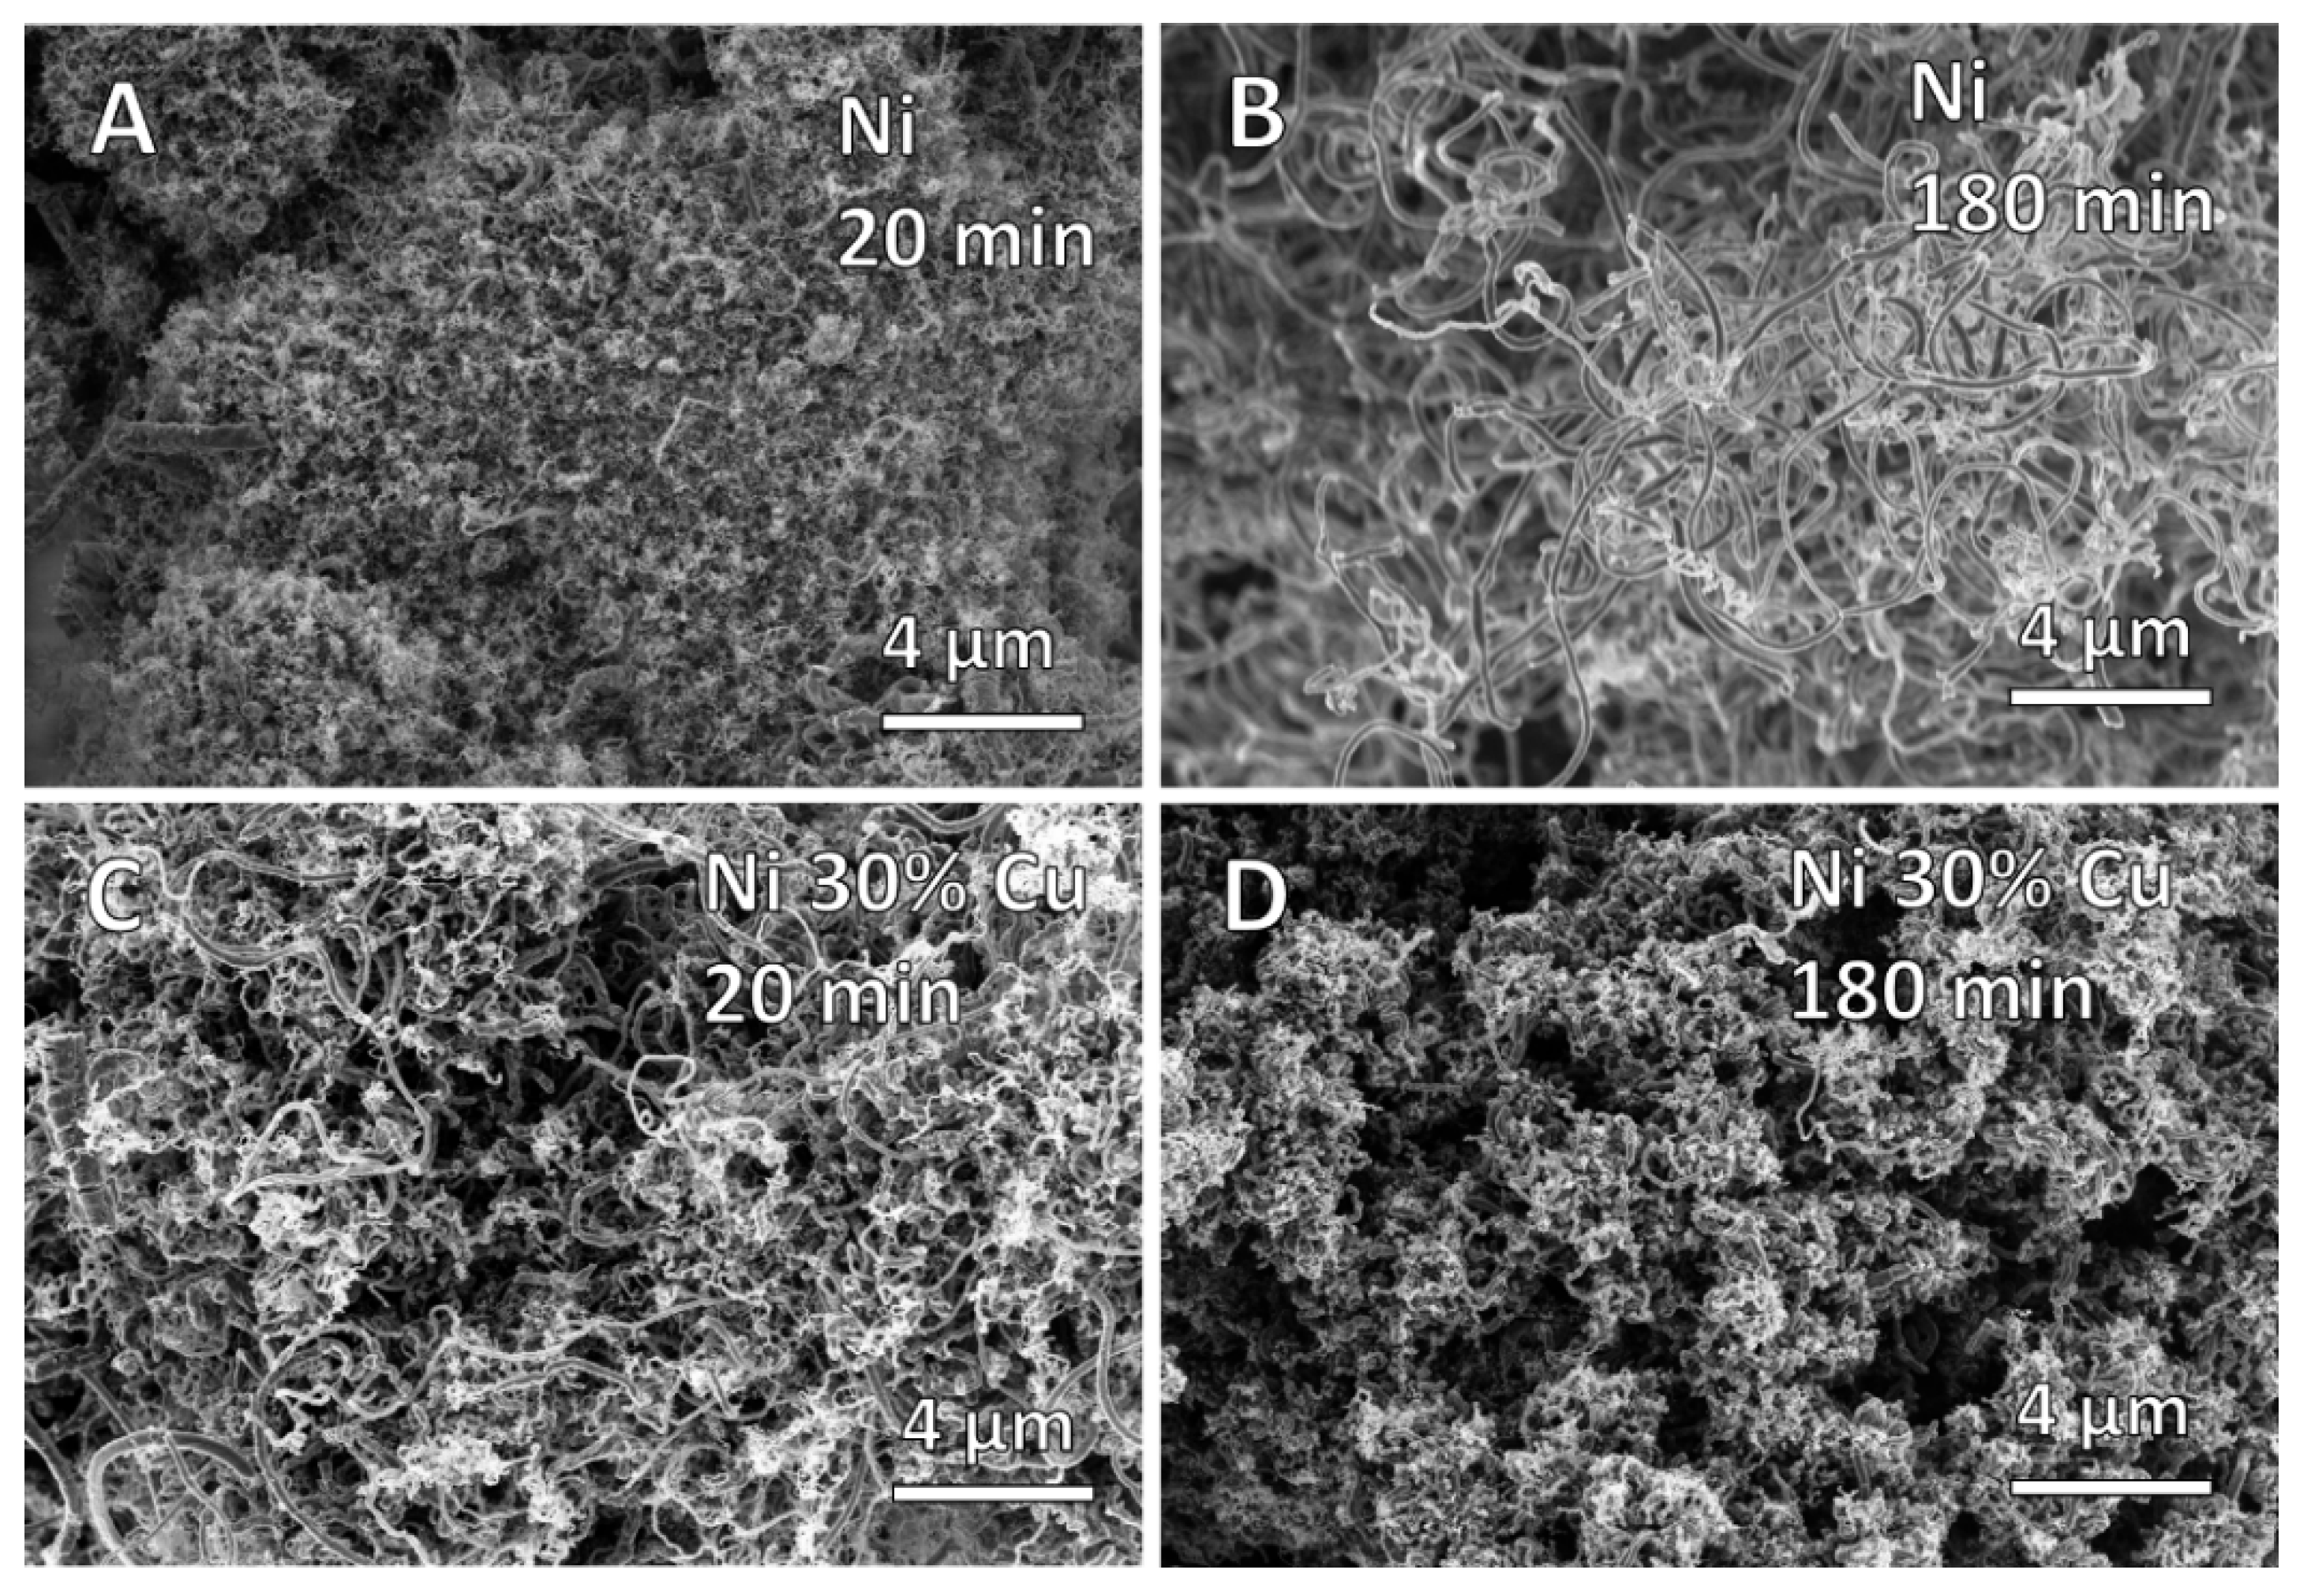
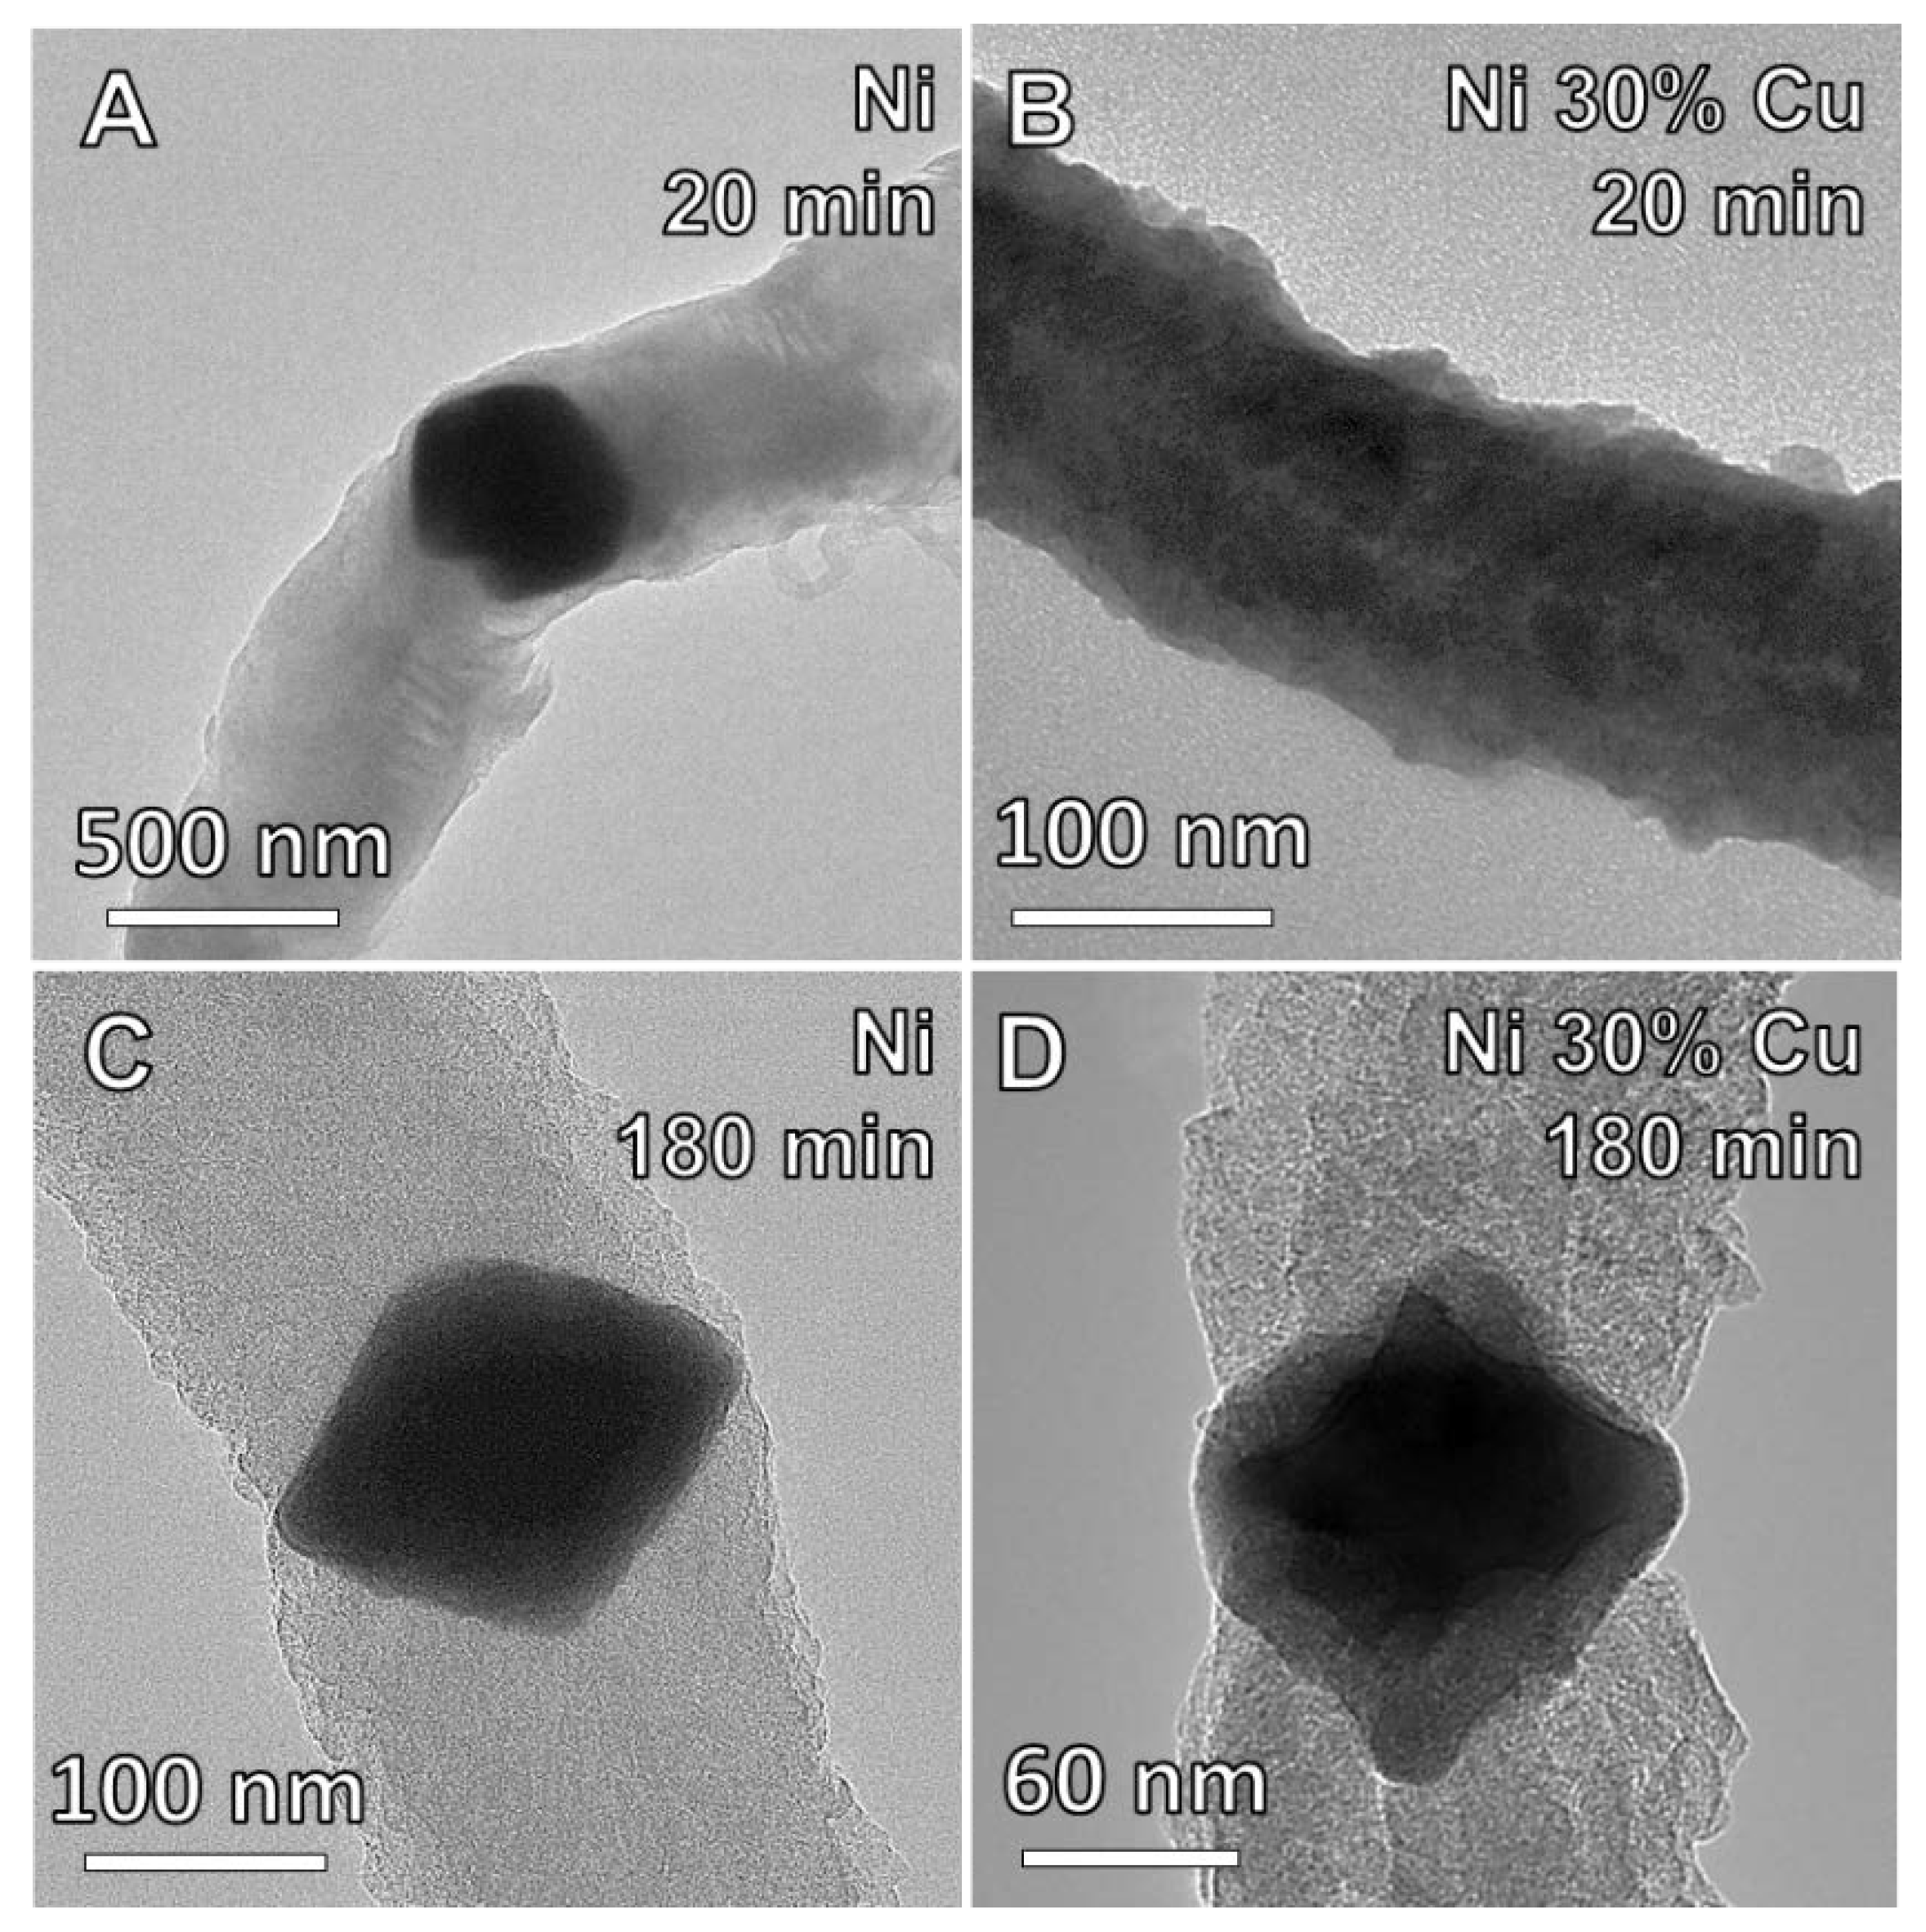
Despite the variation in growth kinetics, the carbon nanofiber characteristics are relatively consistent. As shown in Figure 5, the fibers deposited on Ni and Ni-Cu milled for 20 min (Figure 5A,C, respectively) are similar in diameter and morphology to those deposited on Ni and Ni-Cu milled for 180 min (Figure 5B,D, respectively). Both revealed the majority of fibers to be in the range of 100–200 nm in diameter with a relatively consistent morphology, though some also exhibit a helical nature. The fibers tend to grow in tightly woven bundles, and the average fiber diameter was found to be 60 nm (±18 nm).
TEM examination (see Figure 6) reveals the fibers can vary greatly in size, with some being nearly 500 nm in diameter and others less than 10 nm. Where observed, the catalyst particles were found to be within the fibers deposited from them, not at the tip or base as is sometimes observed. Surfaces of the nanofibers possess nanoscale roughness from all examined catalysts, but Ni-Cu exhibited this to a greater extent. BET surface areas of the nanofibers were measured to be 66 m2/g (Ni 20 min), 32 m2/g (Ni 180 min), 221 m2/g (Ni 30% Cu 20 min) and 222 m2/g (Ni 30% Cu 180 min). All fibers were previously found to be highly amorphous [24], with little evidence of graphitic structure.
3.3. The Effects of Thermal Processing on Catalyst Microstructure
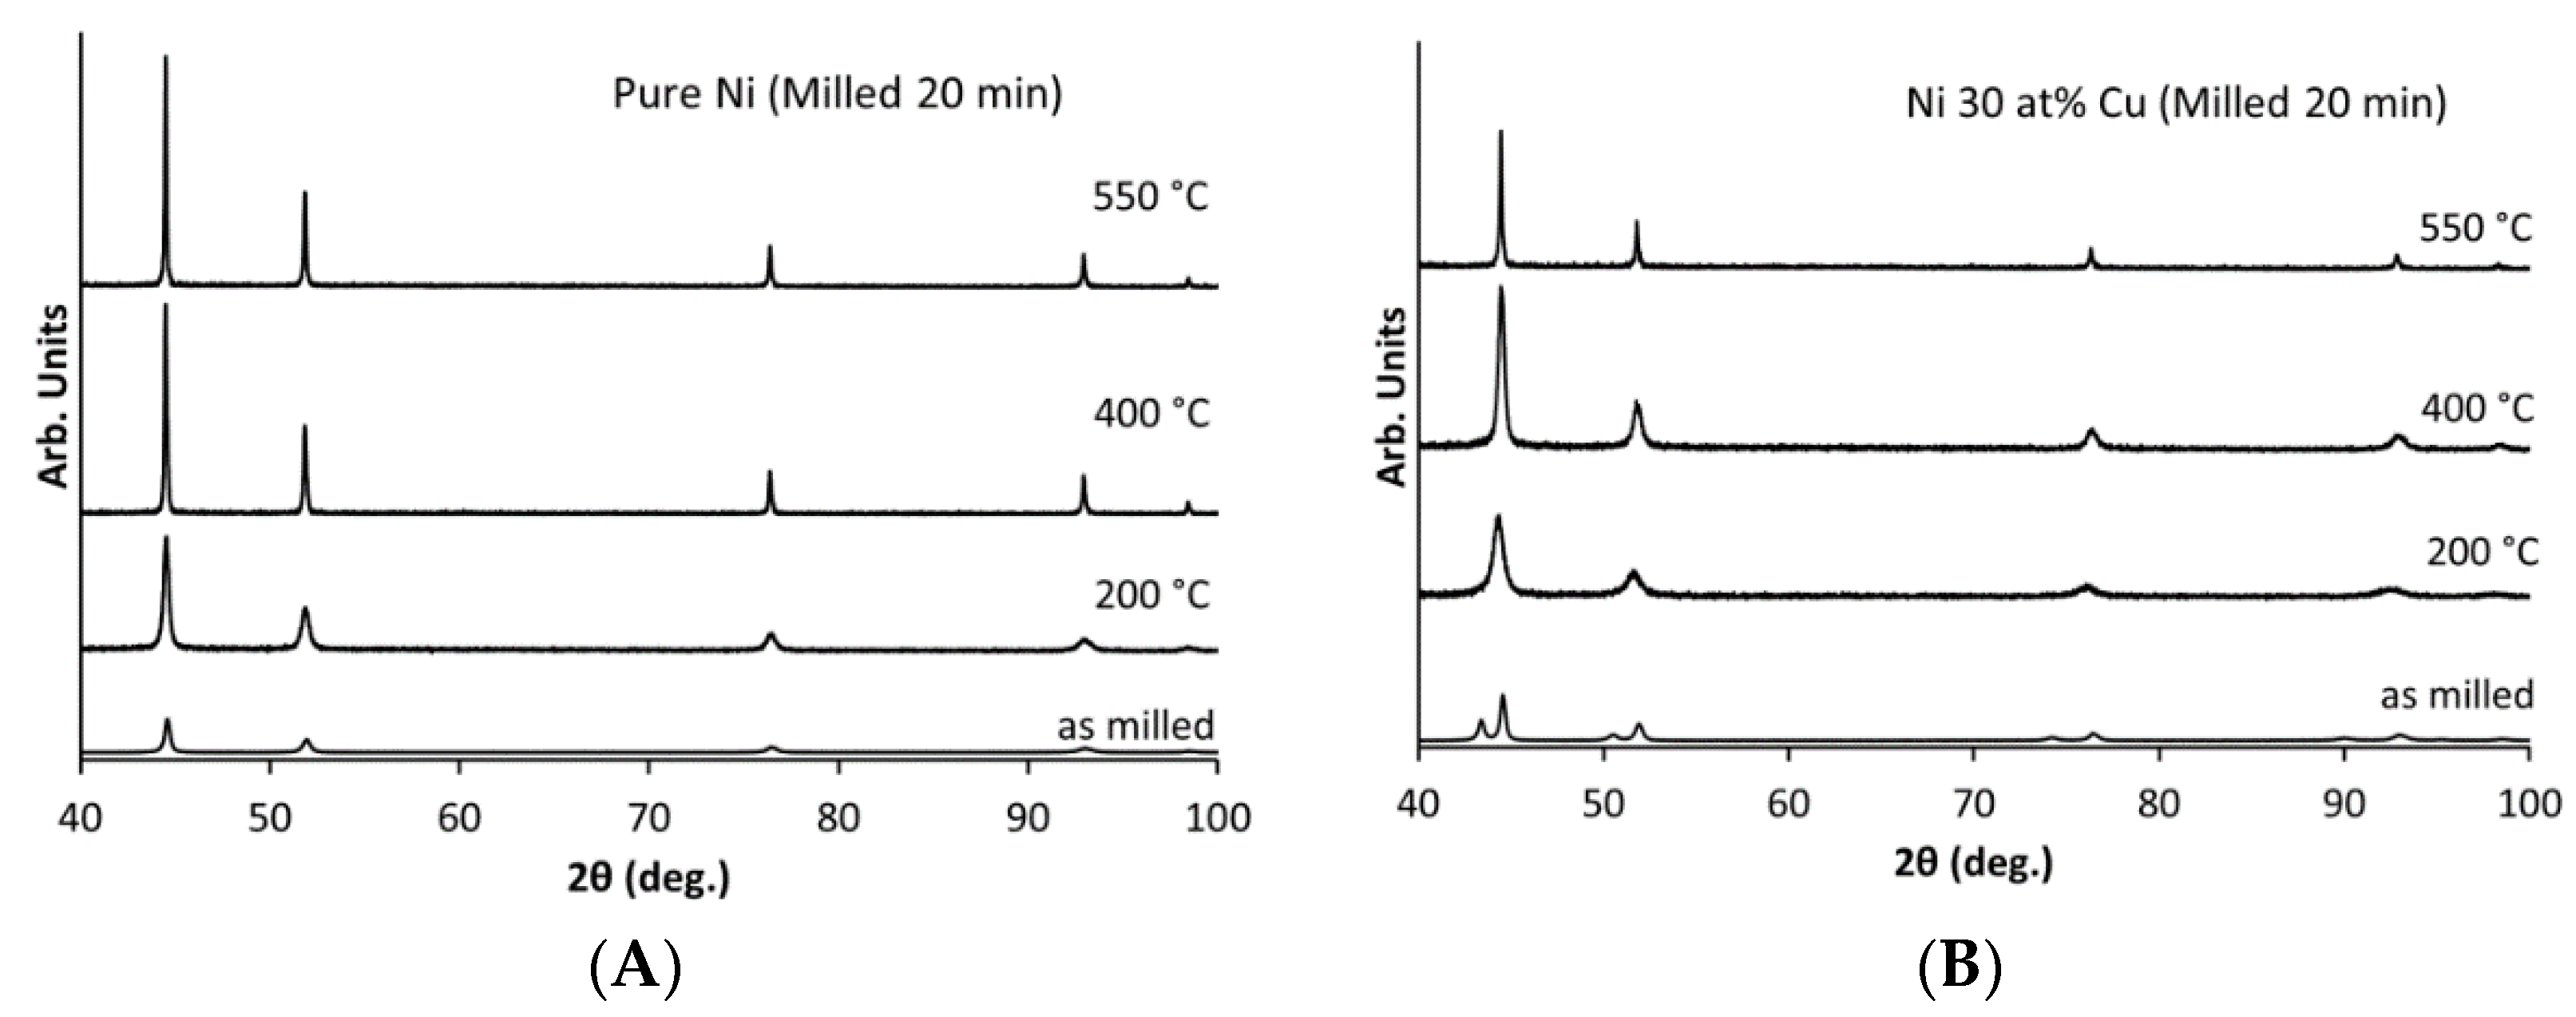
It is well documented that the creation of nanostructured metals and alloys is efficient using mechanical alloying; however, it is equally noted that the retention of such microstructures at elevated temperatures is a central challenge. For the general APCVD route presented here, processing temperatures are typically 500–700 °C, which is much more than adequate to coarsen the microstructure of a nanocrystalline catalyst. The Ni and Ni-Cu alloys milled for 20 min were annealed at temperatures up to 550 °C to investigate their behavior at typical deposition temperature, and the XRD results are given in Figure 7.
The Ni and Ni-Cu samples both display significant peak narrowing and an overall increase in intensity after annealing, which indicates the microstructure has coarsened. This becomes most pronounced at 400 °C for pure Ni and 600 °C for the Ni-Cu alloy. Additionally, the Ni-Cu alloy, which starts as a two-phase mixture before annealing, becomes a single-phase alloy during annealing. As Ni and Cu are completely miscible in one another [27], it is expected that this in situ completion of the alloying is responsible for consistent deposition characteristics, even after very short milling times. Although, 120 min milling is needed to fully mechanically alloy Ni-Cu, as indicated in Figure 1, annealing at 400 °C demonstrates that the alloying is occurring before the carbon deposition (550–600 °C) takes place.
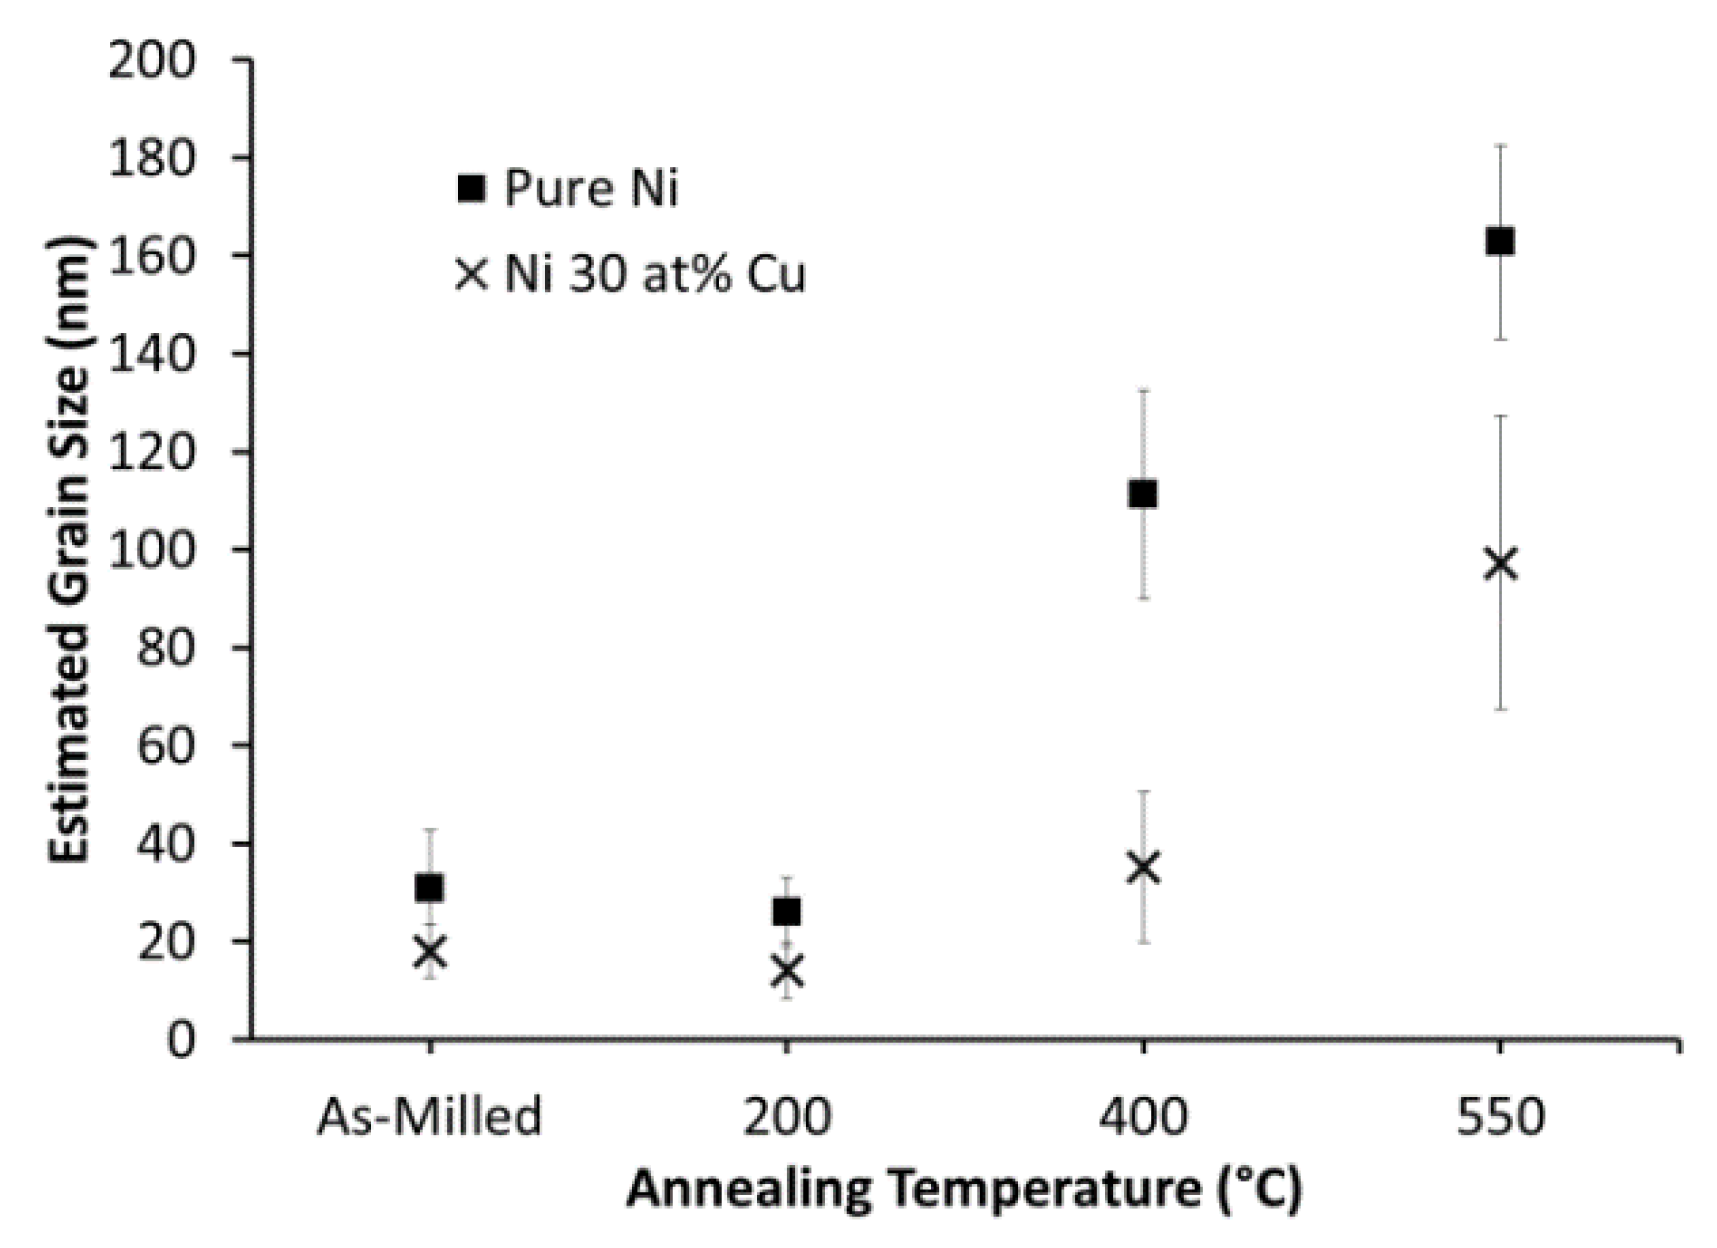
It also appears that the Ni-Cu alloy has a greater thermal stability than pure Ni, as indicated by peak shape. To quantify the grain size, Scherrer fitting was applied to the XRD patterns and the resulting grain size estimations are presented in Figure 8. As noted above, the estimations must be carefully interpreted to correctly attribute broadening effects. Measurements of grain size become less accurate as peak breadth decreases and grain size estimation exceeding 50 nm tends to be decreasingly quantitative, depending on the equipment and analysis conditions. The estimations, then, are valuable for identifying potential trends but should be verified otherwise in critical cases.
3.4. Particle Size and Deposition Kinetics
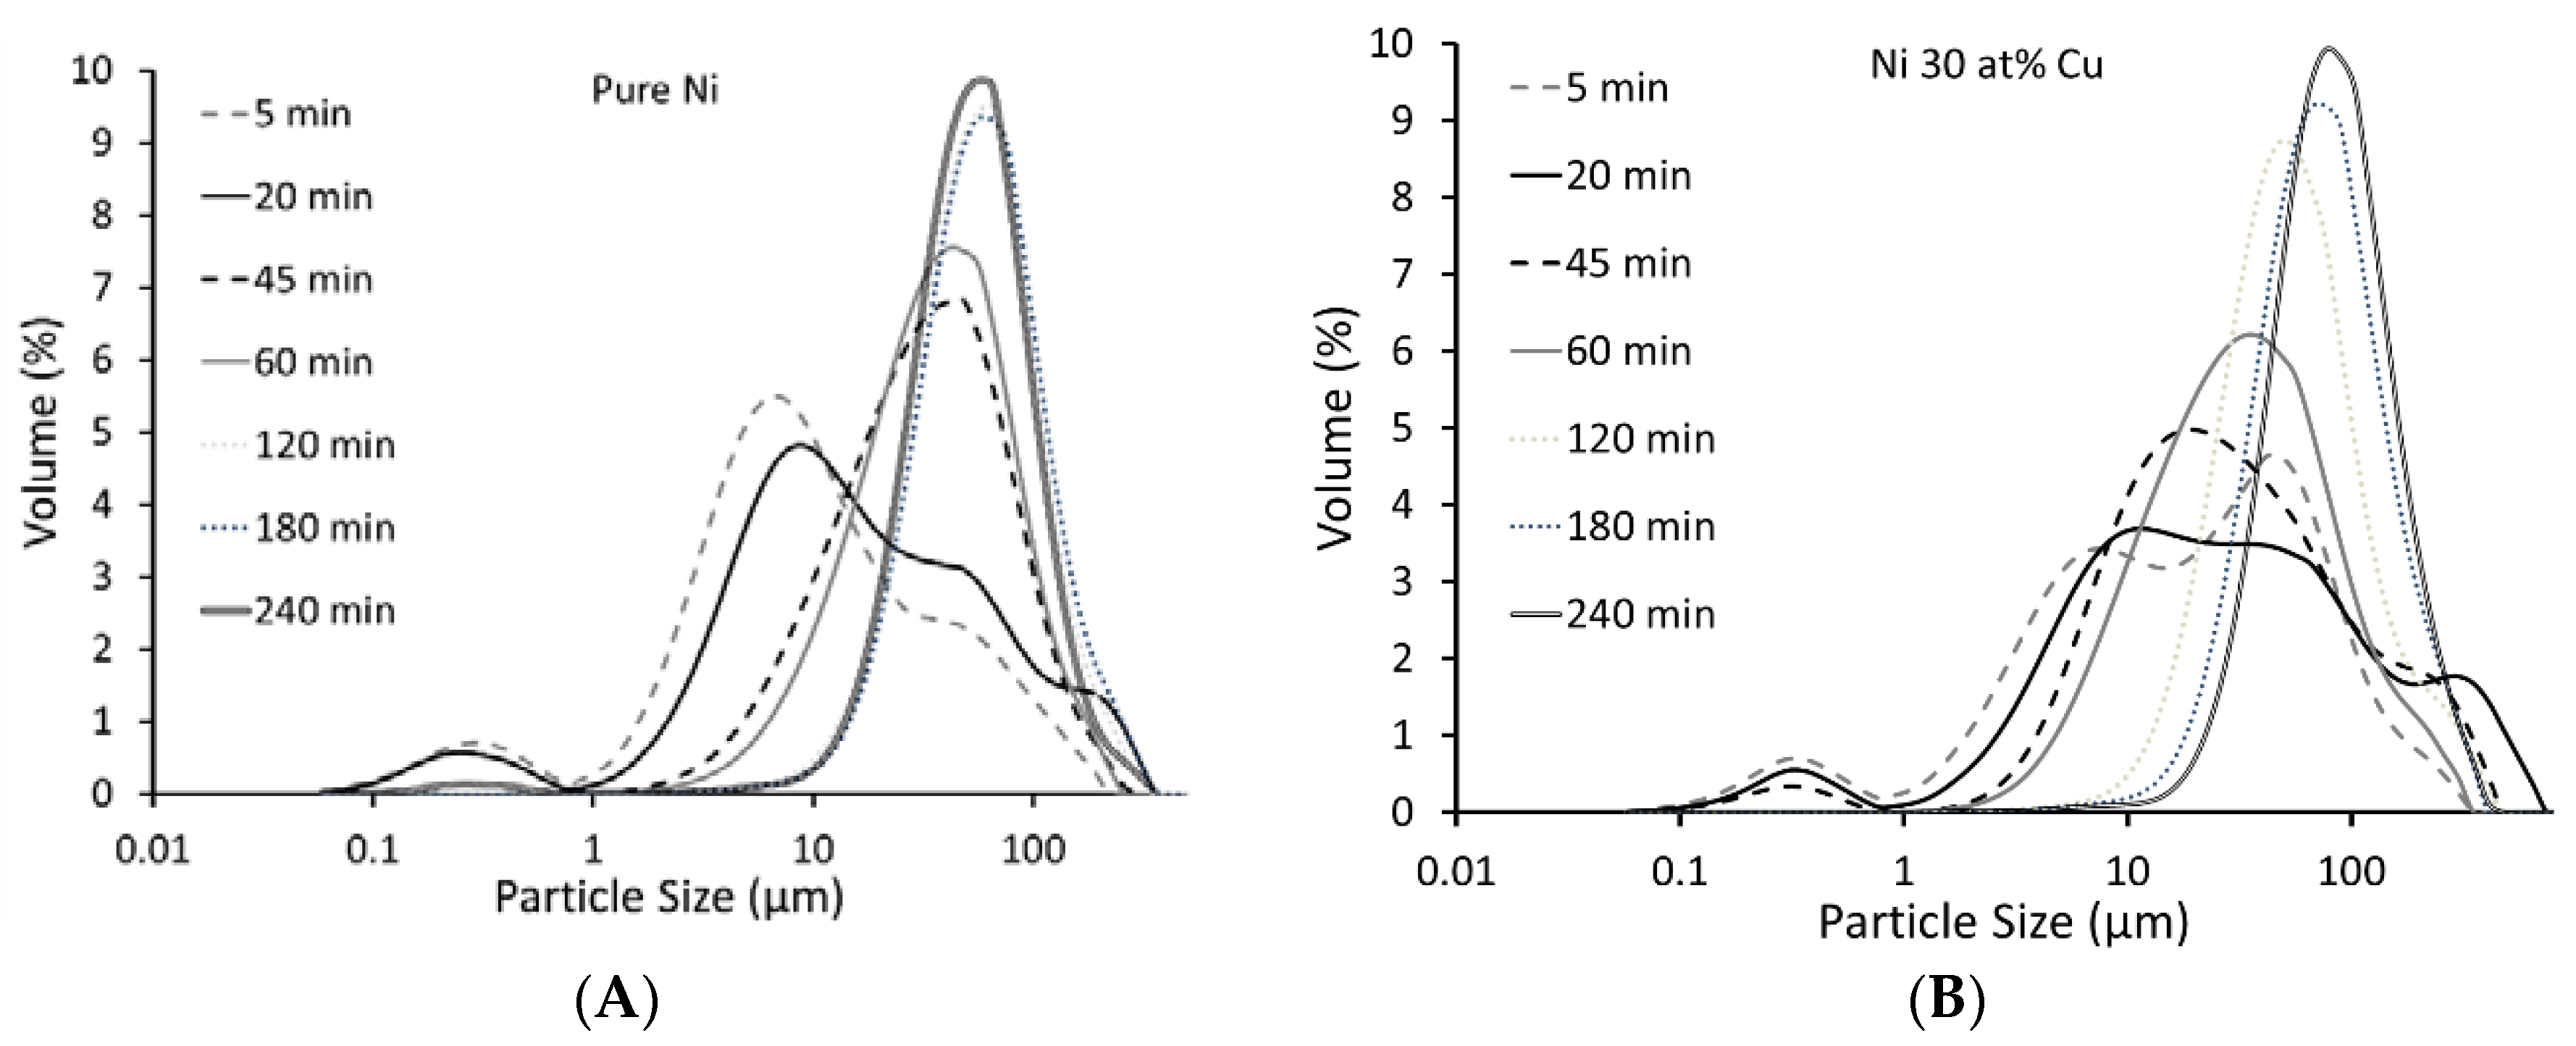
Particle size was investigated as a function of milling time, and the size distributions are shown in Figure 9. From the analysis, it is observed that increasing milling times serve to increase the average particle size and narrow the distribution of sizes. Smaller particle sizes and a larger distribution of particle size can be seen for the lower milling times, but at the longest milling times (180 min and 240 min) the Ni and Ni-Cu samples show comparable sizes, even though the starting powders are varied.
To summarize the particle size distribution, the particle size data after each milling duration are presented according to the median value (50% of particles larger or smaller), the 10th percentile (90% of particles larger than the stated size) and the 90th percentile (90% of particles smaller than the stated size). Effectively, this provides upper and lower limits of particle size with the median showing the prevalence of particles toward those limits. Specifically, the size distribution is proportionally skewed toward smaller particles the closer the median is to the 10th percentile (and likewise for larger particles). This indicates that the majority of particles are on the smaller end of the size range in both materials, and both display an increase in particle size with milling time. Although both materials display a similar trend in particle size with milling duration, the Ni-Cu alloy is consistently larger with a greater prevalence of very large particles (setting the 90th percentile). The increased size is attributed to the addition of low-oxygen Cu, which is highly ductile and possesses clean surfaces, both of which favor welding over fracturing of the particles during milling [19].
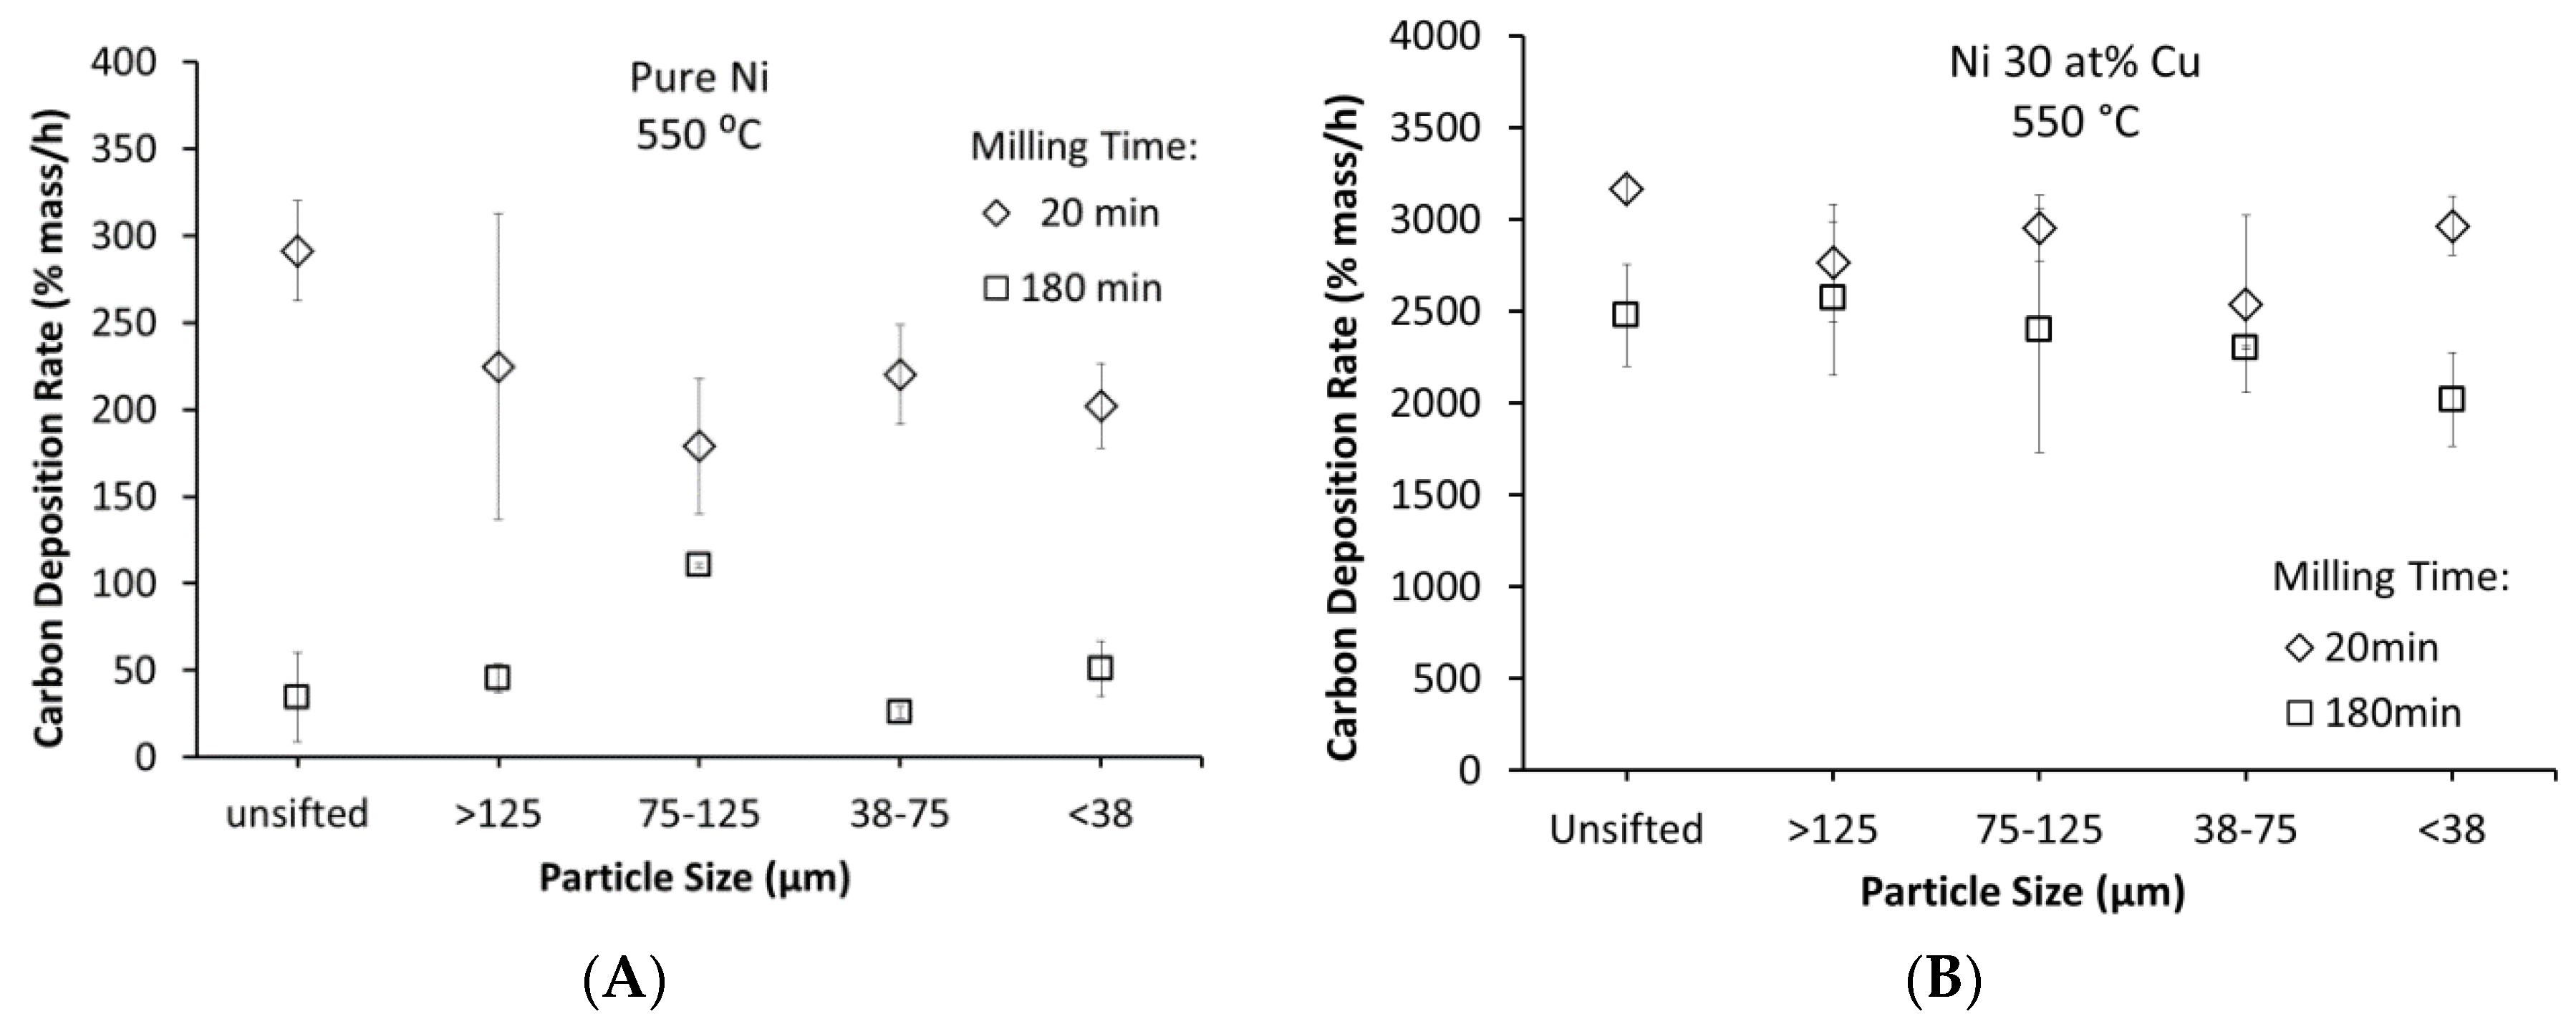
To elucidate the catalytic effects of the particle size distribution seen in Figure 9 and Figure 10, the catalysts milled for 20 min and 180 min were sifted to isolate specific particle sizes and determine particle size effects on CNF deposition (see Figure 11). Surprisingly, both materials performed similarly in the deposition of carbon when particles are unsifted and when isolated by size. Therefore, particles sizes within the presented ranges do not have a distinct effect on the resulting kinetics. That is, the smallest size range (less than 38 µm) performs similarly to the largest (greater 125 µm). This indicates that within the micron size range the mechanisms of deposition are constant. In other work [16], it was found that sub-micron Pd powder outperformed nanoscale powder, and the cause is at least partially attributed to the sintering of the nanoparticles. Bulk powder, then, has an advantage in that it is less sensitive to such processing effects.
4. Discussion
Catalytic materials are important in a range of applications, and the efficient production and utilization of these materials can reduce their cost and their required quantities. For most applications, the process efficiency is determined by the surface area of the catalyst. Therefore, most synthesis methods seek to produce nanoscale particles which are distributed on a suitable substrate. Mechanical alloying has been examined in the production of catalysts (e.g., [28,29]), but most applications are not for carbon deposition. Most MA processes involving carbon nanomaterials are in regard to the effects on milled carbon (nanotubes, fullerenes, etc.) or the distribution of such structures within other materials to create composites (e.g., [30]). The only article found [31] which mentions the process in regard to creating CNF catalysts refers to the Fe-Cu system and provides very little discussion of the methods and results, as MA is one of several techniques identified in the context of hydrogen storage.
Carbon nanofiber (CNF) production is inherently destructive to the catalyst, and the process is well-documented and reviewed [2,3,12]. This work was motivated by the desire to simplify, reduce the cost of and accelerate the production of catalysts used in the production of CNFs. The importance of this is related to the cost and availability of carbon nanomaterials. The cheaper they can be produced, the more viable they become commercially. This work demonstrates that effective Ni-Cu catalysts can be produced in gram quantities within minutes, even on an experimental, laboratory scale. The various factors influencing this production are discussed below.
4.1. Catalyst Development
The nickel–copper system is quite literally the textbook example for miscible alloy systems [32]. Because they can be fully mixed in any quantity, they provide a simple system to examine the effects of MA on the catalytic deposition of carbon. The primary advantage of MA, and the reason it is of particular interest, is that it can rapidly create alloys with unique, nonequilibrium microstructures. In this regard, it may be possible to develop unique catalysts not practical or possible through common techniques, such as co-precipitation [22] or thin film deposition [1].
Ball milling involves a balance between welding and fracturing of particles, and the properties of the metal or alloy will evolve over time. The Ni-Cu system was chosen to elucidate some of the foundational considerations in catalyst development by this method, including microstructural and particle size progression during milling. Although these factors have been thoroughly researched [19], their influence on CNF deposition has not.
The Ni and Ni-Cu materials were both found to refine microstructurally throughout the milling time. After 60 min of milling the Cu and Ni peaks become indistinguishable and the alloying is complete or nearly complete. Milling for as little as 5 min can create a functional catalyst, indicating that fully alloying the elements during milling is not required. This is because the alloying is completed during heating to the reaction temperature (550 °C). Thermal instability in nanostructured materials is well-documented (even at room temperature [33]), and without stabilization by kinetic or thermodynamic techniques [34], coarsening is fully expected. The Ni-Cu alloy is more stable at 400 °C, and this type of increased stability has been seen in other miscible systems such as brass (Cu 30 at % Zn) [35] and Ni-W [36]. For this work, microstructural coarsening is not a disadvantage, and thermally-assisted coarsening and diffusion is actually beneficial in that the alloy can be formed in situ. This allows a throughput of 1 g/min even with an unrefined, experimental production method as used here. This could be increased significantly through proper scaling. Even at the present rate, the catalyst produced each minute is capable of depositing 200 g (or more) of carbon nanofibers in routine work [24]. Other methods of preparing this particular alloy may be even faster, but the ability to tailor the microstructure in other systems is a distinct advantage of MA, and this work provides general guidance and considerations that may be applied to many catalytic systems.
Another surprising result is the irrelevance of particle size in deposition kinetics. As mentioned in the introduction, the form of a catalyst (foil, sputter film, powder, etc.) can play a significant role in the way carbon is deposited. Here, even the largest particles (greater than 125 µm) were effective at rapidly depositing CNFs. Although the particle size increases with time, there is little effect on the deposition rate, especially in the Ni-Cu alloy. Again, this indicates that a short milling time is effective in producing a viable catalyst.
4.2. Carbon Deposition
The purpose of this work was to examine the production of Ni-Cu catalyst by MA with goal of reducing cost and complexity, and thereby make CNFs more economically viable. Ni-Cu catalysts have been examined for their catalytic properties in other studies [1,22], and their low material cost and high efficiency make them a prime candidate for the purpose. This work demonstrates that efficiency in carbon deposition (kinetics and properties) is comparable to state-of-the-art techniques (e.g., [22]), but the time required to prepare the material is lower and easily scalable. Because Ni and Cu can be easily alloyed thermally, the primary improvement in efficiency is in production of the catalyst. The fundamental knowledge that deposition on this powder is not effected by particle size within the tested range also relieves the need to produce nanoscale powders and further supports the viability of this method. The use of MA has broader appeal, however, as it may provide a strategy for creating nonequilibrium alloys that cannot be readily produced and controlled through other methods, thus allowing new catalyst compositions.
The CNFs deposited were found to have a higher surface area than the fibers deposited from pure nickel, and the carbon from both catalysts is highly amorphous. Either of these features can be changed through activation to increase surface area [37] or graphitization to increase the crystallinity [38,39]. Performing these modifications may be desirable in applications where high surface area or high electrical conductivity is desirable. The primary use of the catalysts presented here has been the creation of three-dimensional nonwoven nanofibrous carbon structures using the constrained formation of fibrous nanostructures (CoFFiN) process [40], and the fibers deposited from this catalyst have been successfully applied to generate mechanically robust carbon aerogel structures at centimeter scales [41]. The particular advantage is the long lifetime of the catalyst, as it has proven to maintain a constant deposition rate over a 12-h period [24].
The particular challenge with using bulk powder catalysts is that the fiber size is dependent on the breakup of the catalyst particles [42,43], which is not easily controlled. Though variations in the processing conditions have been found to influence the carbon deposition over foils [14,15], it is not a reliable way to create monodisperse fiber size. Where that is not a requirement, MA is expected to be highly competitive, and it is further anticipated that fiber characteristics may be controlled through microstructural tailoring in other catalytic alloys.
5. Conclusions
Ball milling metallic catalysts is not widely practiced, especially for the purpose of carbon nanofiber deposition. This work not only shows that that milling is a viable method for creating catalyst powders, but that it can be very efficient. By tracking the evolution of microstructure and particle characteristics, it was determined that the Ni 30 at % Cu catalyst under investigation is largely unaffected by changes occurring to the catalyst over the studied milling duration. Pure Ni was studied to control for the various effects of processing, and it was found to respond similarly in all respects. Specifically, a milling time of 20 min was sufficient to achieve full activity in the catalyst, with 5 min being sufficient to benefit from the alloying of Ni and Cu. The carbon nanofibers produced were found to be consistent in terms of diameter, crystallinity and surface characteristics from samples examined at 20 min and 180 min. The primary reason for this is the high solubility in the Ni-Cu system and the relatively high reaction temperature. Although a two-phase mixture is present in the as-milled condition, the alloy was found to be fully mixed after heating to only 200 °C. This indicates that soluble catalyst systems may be rapidly produced by mechanical alloying, and there exists the potential for further microstructural design in other systems.
Acknowledgments
We would like to thank the organizations which assisted through characterization facilities and analysis: The University of Delaware Keck Center for Advanced Microscopy and Microanalysis (nanofiber SEM, TEM), Pennsylvania State University Materials Characterization Laboratory (particle size analysis, BET surface area), Franklin and Marshall College department of Earth and Environment (XRD), and Hitachi High Technologies, Clarksburg Office (Ion milling, EDS mapping, BSE contrast). This work was supported by the National Science Foundation award # 1436444.
Author Contributions
Laura Guevara conducted experiments and analysis and contributed to writing the paper. Roger Welsh conducted experiments and performed analysis. Mark A. Atwater conceived the experiments, supervised the work, and contributed to writing the manuscript.
Conflicts of Interest
The authors declare no conflict of interest.
References
- Klein, K.L.; Melechko, A.V.; Rack, P.D.; Fowlkes, J.D.; Meyer, H.M.; Simpson, M.L. Cu–Ni composition gradient for the catalytic synthesis of vertically aligned carbon nanofibers. Carbon 2005, 43, 1857–1863. [Google Scholar] [CrossRef]
- Rodriguez, N.M. A review of catlytically grown carbon nanofibers. J. Mater. Res. 1993, 8, 3233–3250. [Google Scholar] [CrossRef]
- DeJong, K.P.; Geus, J.W. Carbon nanofiber: Synthesis and applications. Catal. Rev. 2000, 42, 481–510. [Google Scholar] [CrossRef]
- Chambers, A.; Park, C.; Baker, R.T.K.; Rodriguez, N.M. Hydrogen storage in graphite nanofibers. J. Phys. Chem. B 1998, 102, 4253–4256. [Google Scholar] [CrossRef]
- Kim, M.; Kim, Y.; Lee, K.M.; Jeong, S.Y.; Lee, E.; Baeck, S.H.; Shim, S.E. Electrochemical improvement due to alignment of carbon nanofibers fabricated by electrospinning as an electrode for supercapacitor. Carbon 2016, 99, 607–618. [Google Scholar] [CrossRef]
- Hammel, E.; Tang, X.; Trampert, M.; Schmitt, T.; Mauthner, K.; Eder, A.; Potschke, P. Carbon nanofibers for composite applications. Carbon 2004, 42, 1153–1158. [Google Scholar] [CrossRef]
- Wang, G.; Dong, Q.; Ling, Z.; Pan, C.; Yu, C.; Qiu, J. Hierarchical activated carbon nanofiber webs with tuned structure fabricated by electrospinning for capacitive deionization. J. Mat. Chem. 2012, 22, 21819–21823. [Google Scholar] [CrossRef]
- Faccini, M.; Borja, G.; Boerrigter, M.; Mart, D.M.; Crespiera, S.M.; Vázquez-Campos, S.; Aubouy, L.; Amantia, D. Electrospun carbon nanofiber membranes for filtration of nanoparticles from water. J. Nanomater. 2015, 2015, 247471. [Google Scholar] [CrossRef]
- Rodriguez, N.M.; Kim, M.-S.; Baker, R.T.K. Carbon nanofibers: A unique catalyst support medium. J. Phys. Chem. 1994, 98, 13108–13111. [Google Scholar] [CrossRef]
- See, C.H.; Harris, A.T. A review of carbon nanotube synthesis via fluidized-bed chemical vapor deposition. Ind. Eng. Chem. Res. 2007, 46, 997–1012. [Google Scholar] [CrossRef]
- Meyyappan, M.; Delzeit, L.; Cassell, A.; Hash, D. Carbon nanotube growth by PECVD: A review. Plasma Sources Sci. Technol. 2003, 12, 205–216. [Google Scholar] [CrossRef]
- Rodriguez, N.M.; Chambers, A.; Baker, R.T.K. Catalytic engineering of carbon nanostructures. Langmuir 1995, 11, 3862–3866. [Google Scholar] [CrossRef]
- Baird, T.; Fryer, J.R.; Grant, B. Structure of filamentous carbon. Nature 1971, 233, 329–330. [Google Scholar] [CrossRef] [PubMed]
- Atwater, M.A.; Phillips, J.; Doorn, S.K.; Luhrs, C.C.; Fernandez, Y.; Menendez, J.A.; Leseman, Z.C. The production of carbon nanofibers and thin films on palladium catalysts from ethylene–oxygen mixtures. Carbon 2009, 47, 2269–2280. [Google Scholar] [CrossRef]
- Atwater, M.A.; Phillips, J.; Leseman, Z.C. Formation of carbon nanofibers and thin films catalyzed by palladium in ethylene-hydrogen mixtures. J. Phys. Chem. C 2010, 114, 5804–5810. [Google Scholar] [CrossRef]
- Atwater, M.A.; Phillips, J.; Leseman, Z.C. The effect of powder sintering on the palladium-catalyzed formation of carbon nanofibers from ethylene–oxygen mixtures. Carbon 2010, 48, 1932–1938. [Google Scholar] [CrossRef]
- Chambers, A.; Rodriguez, N.M.; Baker, R.T.K. Modification of the catalytic behavior of cobalt by the addition of copper. J. Phys. Chem. 1995, 99, 10581–10589. [Google Scholar] [CrossRef]
- Chambers, A.; Rodriguez, N.M.; Baker, R.T.K. Influence of copper on the structural characteristics of carbon nanofibers produced from the cobalt-catalyzed decomposition of ethylene. J. Mater. Res. 1996, 11, 430–438. [Google Scholar] [CrossRef]
- Suryanarayana, C.; Ivanob, E.; Boldyrev, V.V. The science and technology of mechanical alloying. Mater. Sci. Eng. A 2001, 304–306, 151–158. [Google Scholar] [CrossRef]
- Guevara, L.; Wanner, C.; Welsh, R.; Atwater, M. Using mechanical alloying to create bimetallic catalysts for vapor-phase carbon nanofiber synthesis. Fibers 2015, 3, 394–410. [Google Scholar] [CrossRef]
- Rodriguez, N.M.; Kim, M.S.; Baker, R.T.K. Deactivation of copper-nickel catalysts due to changes in surface composition. J. Catal. 1993, 140, 16–29. [Google Scholar] [CrossRef]
- Kim, M.S.; Rodriguez, N.M.; Baker, R.T.K. The interaction of hydrocarbons with copper-nickel and nickel in the formation of carbon filaments. J. Catal. 1991, 131, 60–73. [Google Scholar] [CrossRef]
- Atwater, M.A.; Phillips, J.; Leseman, Z.C. Accelerated growth of carbon nanofibers using physical mixtures and alloys of Pd and Co in an ethylene–hydrogen environment. Carbon 2011, 49, 1058–1066. [Google Scholar] [CrossRef]
- Atwater, M.A.; Welsh, R.J.; Edwards, D.S. Direct synthesis of nanofibrous nonwoven carbon components: Initial observations, capabilities, and challenges. J. Micro Nano Manuf. 2016, 4, 041004. [Google Scholar] [CrossRef]
- Massalski, T.B.; Okamoto, H.; Subramanian, P.R.; Kacprzak, L. (Eds.) Cu-Ni phase diagram. In Binary Alloy Phase Diagrams, 2nd ed.; ASM International: Materials Park, OH, USA, 1990; Volume 2, pp. 1442–1445. [Google Scholar]
- Cullity, B.D.; Stock, S.R. Elements of X-ray Diffraction, 3rd ed.; Prentice Hall: Upper Saddle River, NJ, USA, 2001; p. 170. [Google Scholar]
- Miettinen, J. Thermodynamic description of Cu–Mg–Ni and Cu–Mg–Zn systems. Calphad 2008, 32, 389–398. [Google Scholar] [CrossRef]
- Zeifert, B.; Salmones, J.; Hernández, J.; Reynoso, R.; Nava, N.; Cabañas-Moreno, J.; Aguilar-Rǭos, G. Preparation of iron–nickel catalysts by mechanical alloying. Mater. Lett. 2000, 43, 244–248. [Google Scholar] [CrossRef]
- Zaluska, A.; Zaluski, L.; Ström–Olsen, J.O. Nanocrystalline magnesium for hydrogen storage. J. Alloys Compd. 1999, 288, 217–225. [Google Scholar] [CrossRef]
- Esawi, A.; Morsi, K. Dispersion of carbon nanotubes (CNTs) in aluminum powder. Compos. Part A 2007, 38, 646–650. [Google Scholar] [CrossRef]
- Ahn, C.; Ye, Y.; Ratnakumar, B.; Witham, C.; Bowman, R., Jr.; Fultz, B. Hydrogen desorption and adsorption measurements on graphite nanofibers. Appl. Phys. Lett. 1998, 73, 3378–3380. [Google Scholar] [CrossRef]
- Callister, W.D. Materials Science and Engineering: An introduction, 7th ed.; John Wiley & Sons: New York, NY, USA, 2007. [Google Scholar]
- Ames, M.; Markmann, J.; Karos, R.; Michels, A.; Tschope, A.; Birringer, R. Unraveling the nature of room temperature grain growth in nanocrystalline materials. Acta Mater. 2008, 56, 4255–4266. [Google Scholar] [CrossRef]
- Koch, C.C.; Scattergood, R.O.; Darling, K.A.; Semones, J.E. Stabilization of nanocrystalline grain sizes by solute additions. J. Mater. Sci. 2008, 43, 7264–7272. [Google Scholar] [CrossRef]
- Atwater, M.A.; Bahmanpour, H.; Scattergood, R.O.; Koch, C.C. The thermal stability of nanocrystalline cartridge brass and the effect of zirconium additions. J. Mater. Sci. 2013, 48, 220–226. [Google Scholar] [CrossRef]
- Detor, A.J.; Schuh, C.A. Microstructural evolution during the heat treatment of nanocrystalline alloys. J. Mater. Res. 2007, 22, 3233–3248. [Google Scholar] [CrossRef]
- Yoon, S.-H.; Lim, S.; Song, Y.; Ota, Y.; Qiao, W.; Tanaka, A.; Mochida, I. Koh activation of carbon nanofibers. Carbon 2004, 42, 1723–1729. [Google Scholar] [CrossRef]
- Ramos, A.; Camean, I.; Garcıa, A.B. Graphitization thermal treatment of carbon nanofibers. Carbon 2013, 59, 2–32. [Google Scholar] [CrossRef]
- Qi, X.; Ruan, X.; Pan, C. Graphitization of solid carbon nanofibers at an unexpectedly low temperature. Mater. Lett. 2007, 61, 4272–4275. [Google Scholar] [CrossRef]
- Atwater, M.A.; Mousavi, A.K.; Phillips, J.; Leseman, Z.C. Direct synthesis of nanoscale carbon nonwovens by catalytic deposition. Carbon 2013, 57, 363–370. [Google Scholar] [CrossRef]
- Atwater, M.A.; Welsh, R.J.; Edwards, D.S.; Guevara, L.N.; Nelson, C.B.; Stone, B.T. Multiscale design of nanofibrous carbon aerogels: Synthesis, properties and comparisons with other low-density carbon materials. Carbon 2017, 124, 588–598. [Google Scholar] [CrossRef]
- Jablonski, G.A.; Geurts, F.W.; Sacco, A., Jr.; Biederman, R.R. Carbon deposition over Fe, Ni, and Co foils from CO-H2-CH4-CO2-H2O, CO-CO2, CH4-H2, and CO-H2-H2O gas mixtures: I. Morphology. Carbon 1992, 30, 87–98. [Google Scholar] [CrossRef]
- Jablonski, G.A.; Geurts, F.W.; Sacco, A., Jr. Carbon deposition over Fe, Ni, and Co foils from CO-H2-CH4-CO2-H2O, CO-CO2, CH4-H2, and CO-H2-H2O gas mixtures: II: Kinetics. Carbon 1992, 30, 99–106. [Google Scholar] [CrossRef]
Figure 1.
XRD patterns collected after listed milling times for (A) Pure nickel and (B) Ni 30 at % Cu.
Figure 1.
XRD patterns collected after listed milling times for (A) Pure nickel and (B) Ni 30 at % Cu.

Figure 2.
Grain size analysis for pure Ni and Ni 30 at % Cu after the milling times indicated. Error bars represent one standard deviation from the mean.
Figure 2.
Grain size analysis for pure Ni and Ni 30 at % Cu after the milling times indicated. Error bars represent one standard deviation from the mean.
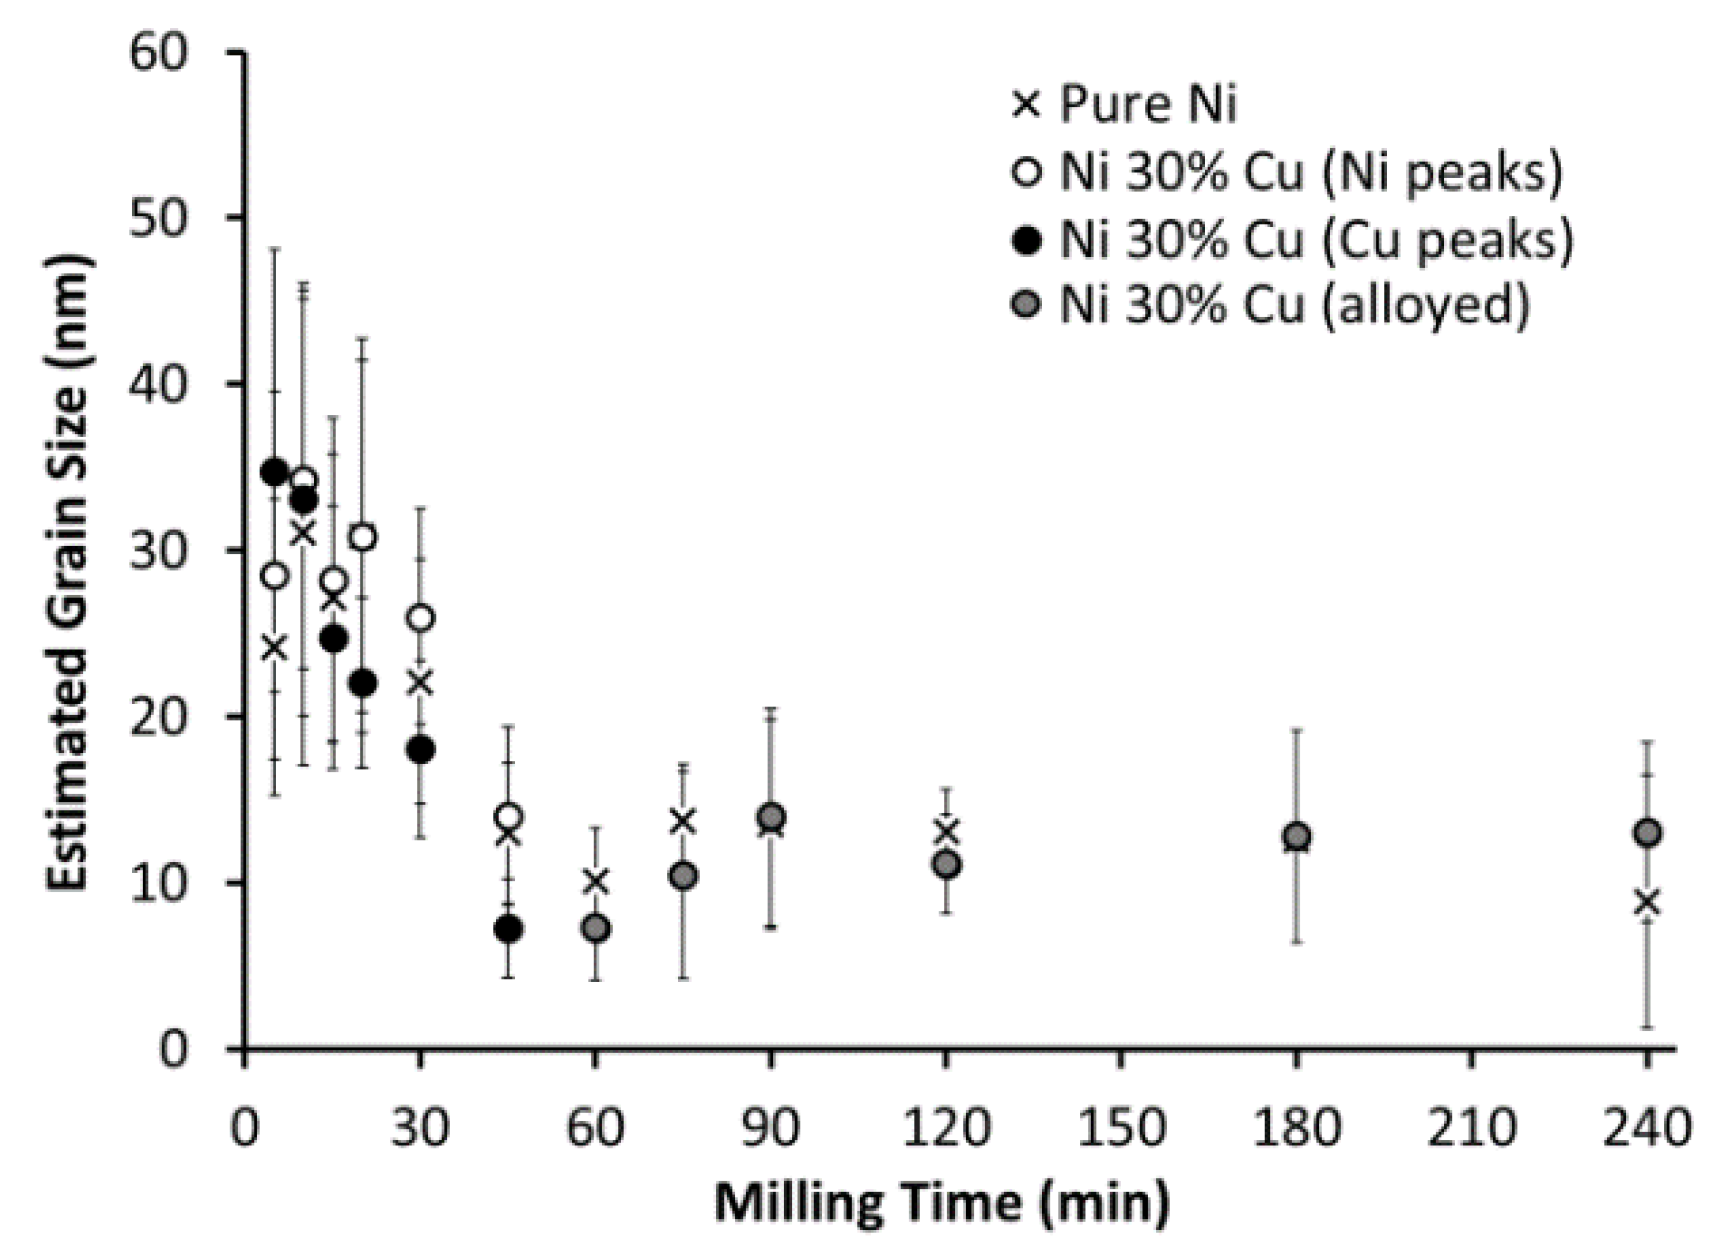
Figure 3.
Ion-milled section of Ni 30 at % Cu milled for 20 min examined by (A) energy-dispersive X-ray spectroscopy (EDS) mapping to reveal that distinct areas of (B) Cu and (C) Ni are present; and (D) the grain structure is examined using backscatter electron (BSE) contrast with (E) high magnification inset.

Figure 4.
Carbon deposition rates catalyzed by (A) Ni and (B) Ni 30 at % Cu milled for varying durations at different temperatures. Samples “milled” for 0 min correspond to no mechanical alloying conducted. Error bars represent one standard deviation from the mean.
Figure 4.
Carbon deposition rates catalyzed by (A) Ni and (B) Ni 30 at % Cu milled for varying durations at different temperatures. Samples “milled” for 0 min correspond to no mechanical alloying conducted. Error bars represent one standard deviation from the mean.
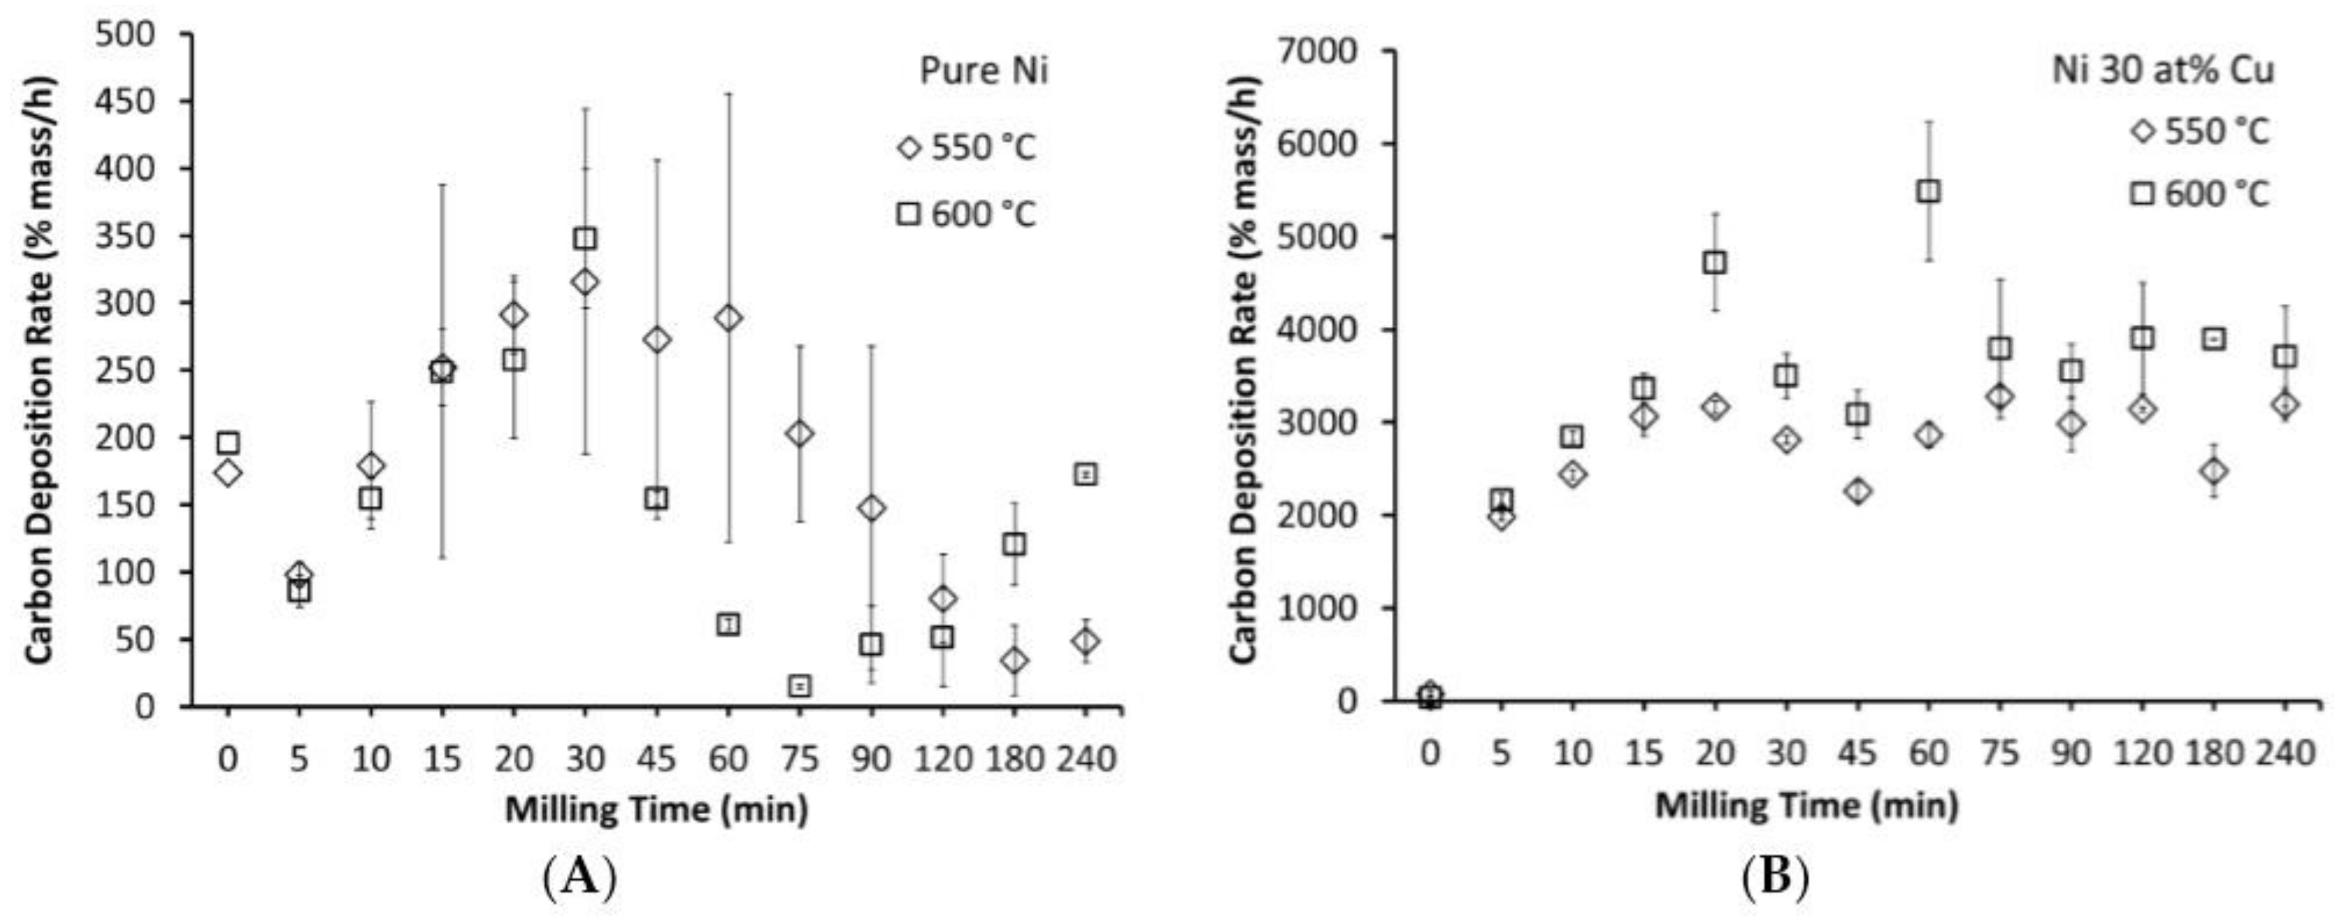
Figure 5.
Carbon nanofibers deposited on Ni milled for 20 min (A); Ni milled for 180 min (B); Ni 30 at % Cu milled for 20 min (C) and Ni 30 at % Cu milled for 180 min (D) at 550 °C with C2H4:H2 (4:1).
Figure 5.
Carbon nanofibers deposited on Ni milled for 20 min (A); Ni milled for 180 min (B); Ni 30 at % Cu milled for 20 min (C) and Ni 30 at % Cu milled for 180 min (D) at 550 °C with C2H4:H2 (4:1).

Figure 6.
Carbon nanofibers deposited at 550 °C with C2H4 and H2 (4:1) using (A) Ni milled for 20 min; (B) Ni 30 at % Cu milled for 20 min; (C) Ni milled for 180 min; and (D) Ni 30 at % Cu milled for 180 min.
Figure 6.
Carbon nanofibers deposited at 550 °C with C2H4 and H2 (4:1) using (A) Ni milled for 20 min; (B) Ni 30 at % Cu milled for 20 min; (C) Ni milled for 180 min; and (D) Ni 30 at % Cu milled for 180 min.

Figure 7.
XRD patterns collected from (A) Ni and (B) Ni 30 at % Cu after milling for 20 min and annealing at the listed temperatures for 1 h in 5% H2 (bal. Ar).
Figure 7.
XRD patterns collected from (A) Ni and (B) Ni 30 at % Cu after milling for 20 min and annealing at the listed temperatures for 1 h in 5% H2 (bal. Ar).

Figure 8.
Grain size analysis for pure Ni and Ni 30 at % Cu milled for 20 min and annealed at the annealed at the given temperatures. Error bars represent one standard deviation from the mean.
Figure 8.
Grain size analysis for pure Ni and Ni 30 at % Cu milled for 20 min and annealed at the annealed at the given temperatures. Error bars represent one standard deviation from the mean.

Figure 9.
Particle size distributions for (A) Ni and (B) Ni 30 at % Cu after milling times indicated.
Figure 9.
Particle size distributions for (A) Ni and (B) Ni 30 at % Cu after milling times indicated.

Figure 10.
The particle size of Ni and Ni 30 at % Cu powders are compared over milling times from 5 min to 240 min.
Figure 10.
The particle size of Ni and Ni 30 at % Cu powders are compared over milling times from 5 min to 240 min.
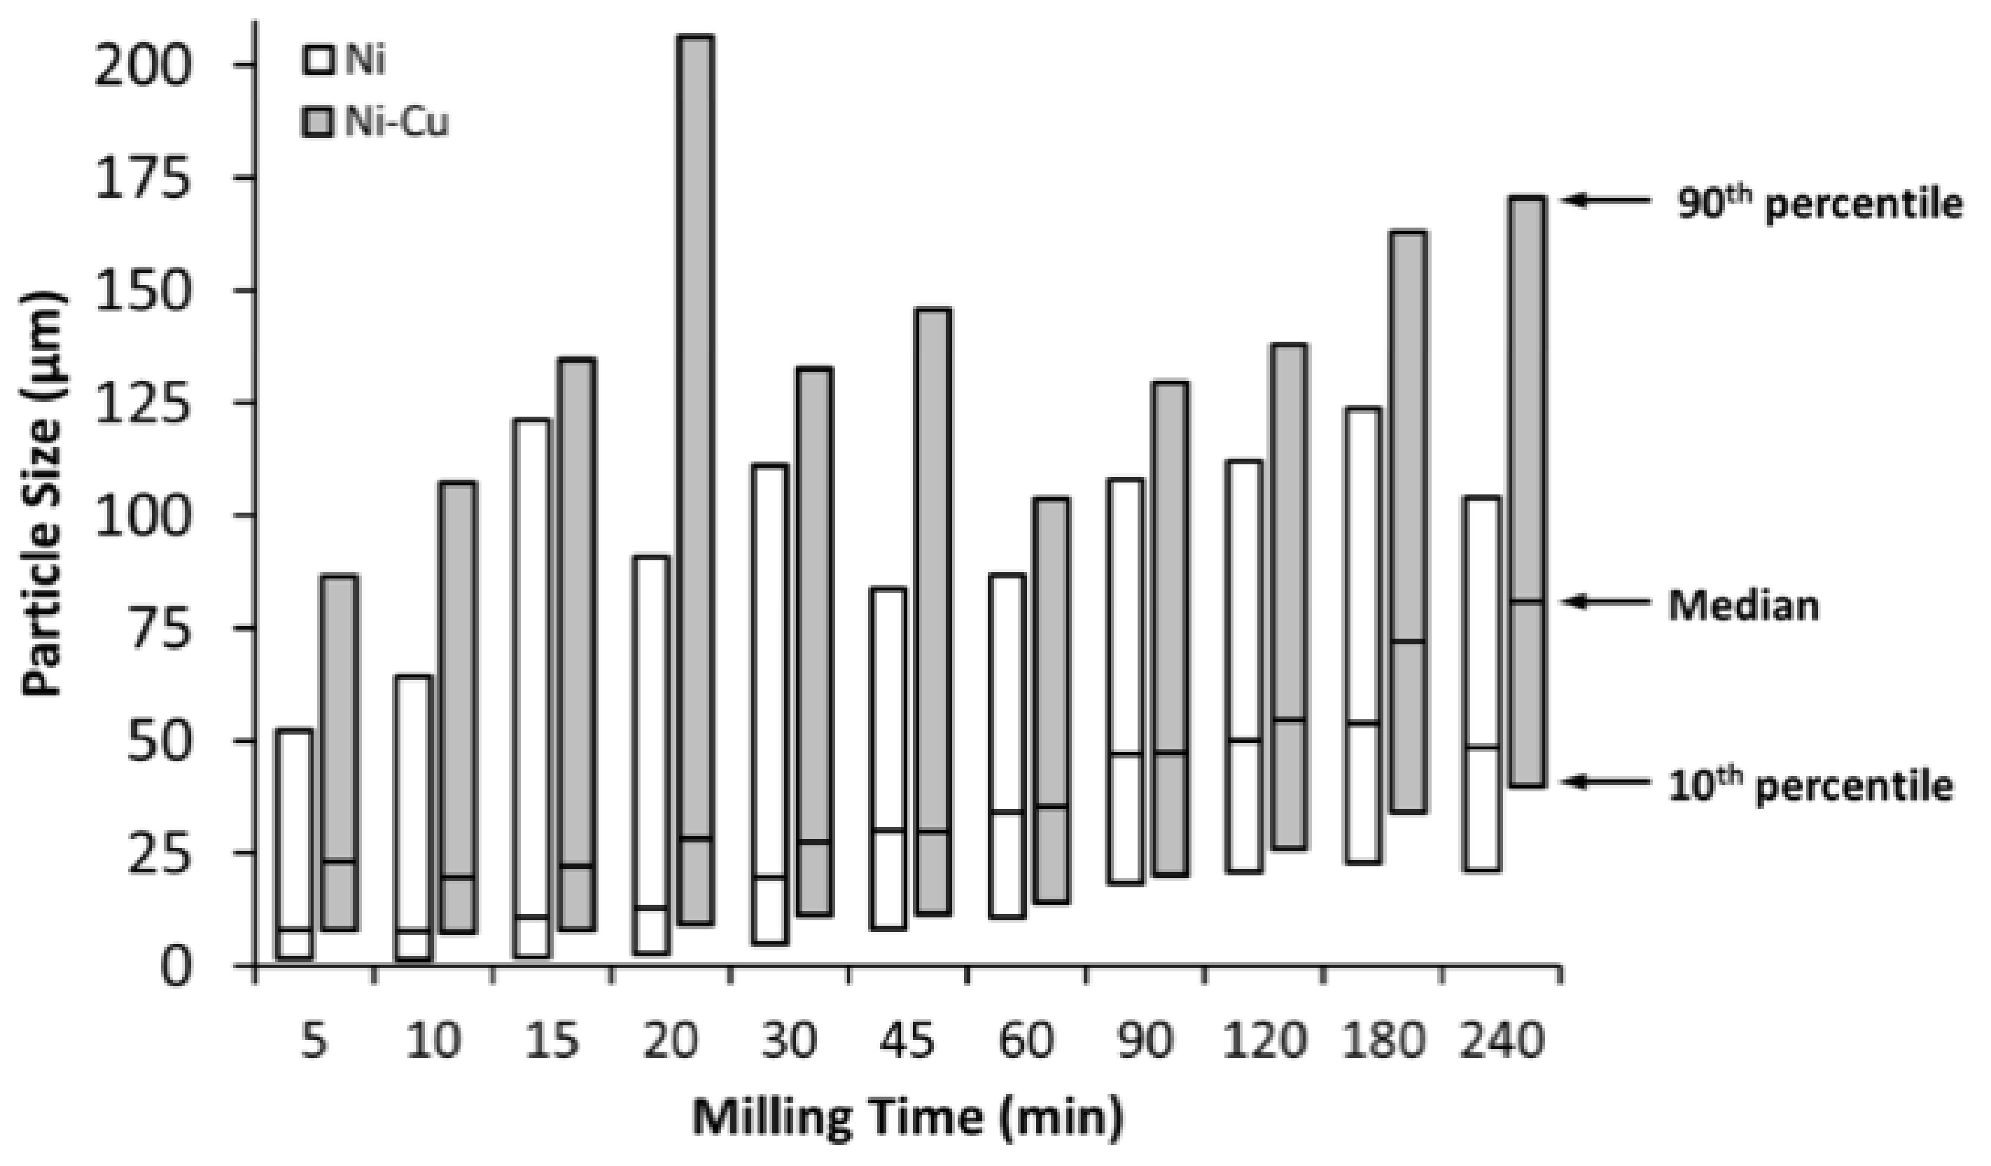
Figure 11.
Carbon deposition rates catalyzed by (A) Ni and (B) Ni 30 at % Cu separated by particle size.
Figure 11.
Carbon deposition rates catalyzed by (A) Ni and (B) Ni 30 at % Cu separated by particle size.
© 2018 by the authors. Licensee MDPI, Basel, Switzerland. This article is an open access article distributed under the terms and conditions of the Creative Commons Attribution (CC BY) license (http://creativecommons.org/licenses/by/4.0/).
Share and Cite
MDPI and ACS Style
Guevara, L.; Welsh, R.; Atwater, M.A. Parametric Effects of Mechanical Alloying on Carbon Nanofiber Catalyst Production in the Ni-Cu System. Metals 2018, 8, 286. https://doi.org/10.3390/met8040286
AMA Style
Guevara L, Welsh R, Atwater MA. Parametric Effects of Mechanical Alloying on Carbon Nanofiber Catalyst Production in the Ni-Cu System. Metals. 2018; 8(4):286. https://doi.org/10.3390/met8040286
Chicago/Turabian StyleGuevara, Laura, Roger Welsh, and Mark A. Atwater. 2018. "Parametric Effects of Mechanical Alloying on Carbon Nanofiber Catalyst Production in the Ni-Cu System" Metals 8, no. 4: 286. https://doi.org/10.3390/met8040286
Note that from the first issue of 2016, this journal uses article numbers instead of page numbers. See further details here.