Effects of Cryogenic Treatment after Annealing of Ti-6Al-4V Alloy Sheet on Its Formability at Room Temperature

1
Rolling Forging Research Institute, Jilin University, Changchun 130025, China
2
Key Laboratory of Automobile Materials, Ministry of Education, Jilin University, Changchun 130025, China
3
College of Material Science and Engineering, Jilin University, Changchun 130025, China
4
School of Engineering Technology, University of Hertfordshire, Hatfield AL109AB, UK
*
Author to whom correspondence should be addressed.
Metals 2018, 8(5), 295; https://doi.org/10.3390/met8050295
Submission received: 24 February 2018
/
Revised: 3 April 2018
/
Accepted: 22 April 2018
/
Published: 24 April 2018
(This article belongs to the Special Issue Metallic Additive Manufacturing: Design, Process and Post-processing)
Abstract
:In this article, the effects of cryogenic treatment after annealing on the formability of Ti-6Al-4V alloy sheet were experimentally studied. The Ti-6Al-4V titanium alloy was treated by cryogenic treatment after annealing (ACT). Tensile tests were carried out using a universal machine at room temperature. The microstructure evolution of Ti-6Al-4V subjected to ACT was also investigated using an optical microscope (OM). Both the shearing performance and drawing formability were analyzed by punch shearing tests and deep drawing tests, respectively. Results showed that after ACT, the tendency of the β phase can be apparently changing into stable β’ and α’ phases. The elastic modulus is lower than that of the untreated material. It was found that both the yield strength and tensile strength are declined slightly, whereas the ductility is increased significantly. The shear strength in punch shearing is decreased at room temperature and cryogenic temperature. The ratio of smooth zone on the section after ACT3 is much larger than the others. The rollover diameters are not obviously greater than those of the untreated. Additionally, the height of the burr shows a decreasing trend after ACT. During deep drawing, drawing depth is deeper than that of the untreated material, the drawing load after ACT is reduced, and the decreasing tendency of the drawing load slows down. It is noted that the micro-cracks occur at the bottom of the sample.
1. Introduction
Ti-6Al-4V titanium alloy is being increasingly used in automation, energy, aerospace industries, health care and automobile due to their excellent characteristics such as low density, high specific intensity, strong corrosion resistance, excellent heat resistance, good performance at high and low temperature, no magnetism, and good damping performance, as well as it has a special shape memory [1] and outstanding biocompatibility. Ti-6Al-4V is a type of titanium alloy of α + β with excellent comprehensive properties. Nowadays Ti-6Al-4V alloy is widely applied and it accounts for approximately 50% of the total world production of titanium alloys [2].
The cryogenic treatment (CT) is a treatment method that can change material properties by the samples being immersed in liquid nitrogen. CT is a supplementary process of traditional heat treatment which has been acknowledged for decades [3]. CT on materials could be firstly reported by Gulyaev in 1937, and CT could improve the cutting properties of tool steels [4]. Afterwards, Kamran et al. [5,6] investigated the effects of CT on the mechanical properties of some selected tool steels, i.e., D2 and 80CrMo125, and it was found that CT can eliminate the retained austenite, which can make a better carbide distribution and a higher carbide amount. An obvious improvement in wear resistance of cryogenically-treated samples was indicated. Gao et al. [7] studied the effects of CT on the microstructure and properties of WC-Fe-Ni cemented carbides. It was stated that CT could promote lath martensite formation, after CT, the hardness and transverse rupture strength of WC-Fe-Ni cemented carbides were higher than that of the untreated, while fracture toughness was decreased. In addition, the wear resistance was improved obviously. Later on, Baldisseri et al. [8] reported that CT can produce a more homogeneous structure which delayed the nucleation of cracks and increased the fatigue life of the tool. During recent years, many efforts have been devoted to the effects of cryogenic treatment on magnesium alloy. Several researchers [9,10,11] investigated the effects of CT on the microstructure and mechanical properties of AZ31 magnesium alloy. Their results showed that the tensile stress and hardness of the samples treated in cryogenic environment were higher than those of the untreated samples. The CT of other magnesium alloys, such as Mg-1.5Zn-0.15Gd and AZ91, were investigated, and it was found that CT could improve the microstructure and mechanical properties of the alloys [12,13]. Studies also revealed that CT improved the mechanical properties, dimensional stability, wear resistance and thermal conductivity of aluminum alloys, magnesium alloys, and copper alloys [14]. Zhou et al. [15] experimentally investigated the tensile properties and microstructures of the 2024-T351 aluminum alloy subjected to CT. They revealed that the residual tensile stress in 2024-T351 was removed, and slight compressive residual stress was generated after CT, this could contribute to the improvement of the tensile properties of the alloy. In terms of the residual stress, similar conclusions have been obtained for 2024 aluminum alloy. Zhang et al. [16] investigated the tensile behavior of 3104 aluminum alloy with CT. Their results showed that the sample exhibited superior comprehensive mechanical properties, including tensile strength, yield strength, and elongation. The stress-strain curve of the sample exhibited the Portevin-Le Chatelier effect. In this case the CT could accelerate both the precipitation and dispersion of secondary phase particles, which could enhance the dislocation pinning effect of solvent atoms. Moreover, they also conducted scanning electron microscope (SEM) analyses of the fracture surfaces and a good plasticity was achieved. Araghchi et al. [17] carried out microstructure observation, mechanical properties measurement, and residual stresses determination on 2024 aluminum alloy. It was found that CT not only resulted in reduction of residual stresses, but also improved the mechanical properties. Vidyarthi et al. [18] experimentally studied the effects of CT on the microstructure and wear performance of Cr-Mn-Cu white cast iron grinding media copper alloys. Their results showed that the hardness and wear properties were improved significantly.
Most recently, Kim et al. [19] investigated the effects of CT on nickel-titanium endodontic instruments, and found that there was a slight increase in microhardness after CT. Gu [20] found that, after CT, wear resistance was increased due to the reduction of β phase. Yumark [21] also found that the content of β phase was decreased after CT, and the energy absorption increased and damaged areas were decreased. Moreover, Gu et al. [14] also investigated the effect of CT on the mechanical properties of Ti-6Al-4V alloy. They found that the microstructure of Ti-6Al-4V alloy consisted of α phase and β phase, with β phases dispersed in the boundaries of equiaxed α grains. They reported that CT reduced the quantities of β phases by transforming the metastable β phases into stable β phases and α phase. This reduction of β phase particles was beneficial to the improvement in plasticity of Ti-6Al-4V alloy. CT increased the ductility and strength of Ti-6Al-4V alloy. Although CT is beneficial to Ti-6Al-4V alloy, the research about the effect of CT on the mechanical properties of Ti-6Al-4V alloy is scarce.
There are much literature on the formability of material described by the forming limit diagram (FLD). Veenaas et al. [22] carried out scaled Nakajima tests to determine the FLD for describing the limit of formability under deep drawing stress state conditions. Zhang et al. [23] carried out uniaxial tensile tests, cupping tests and rigid bulging experiment to obtain the forming limit diagram (FLSD), taking the cold-rolling deep drawing sheet SPCEN-SD and DC04 as research object. The FLSD can provide reference for practical production according to the values of hardening exponent (n), plastic strain ratio (r) and strength coefficient (K). However, it should be noted that it is not enough to evaluate the formability of the titanium alloy sheet only by tensile tests. Punch shearing tests and deep drawing tests are employed to study the formability. In addition, the punching depth in deep drawing is also a material characteristic value for evaluation. Therefore, punch shearing tests, deep drawing, and tensile tests were employed in this paper to investigate the effects of CT of Ti-6Al-4V titanium alloys on its formability at room temperature.
2. Experimental Procedure
2.1. Material
In current work, the commercial Ti-6Al-4V alloy sheet was selected and Table 1 list is chemical compositions. The tensile strength, yield strength (), and ductility were 1070 MPa, 930 MPa, and 11% respectively.
2.2. Samples
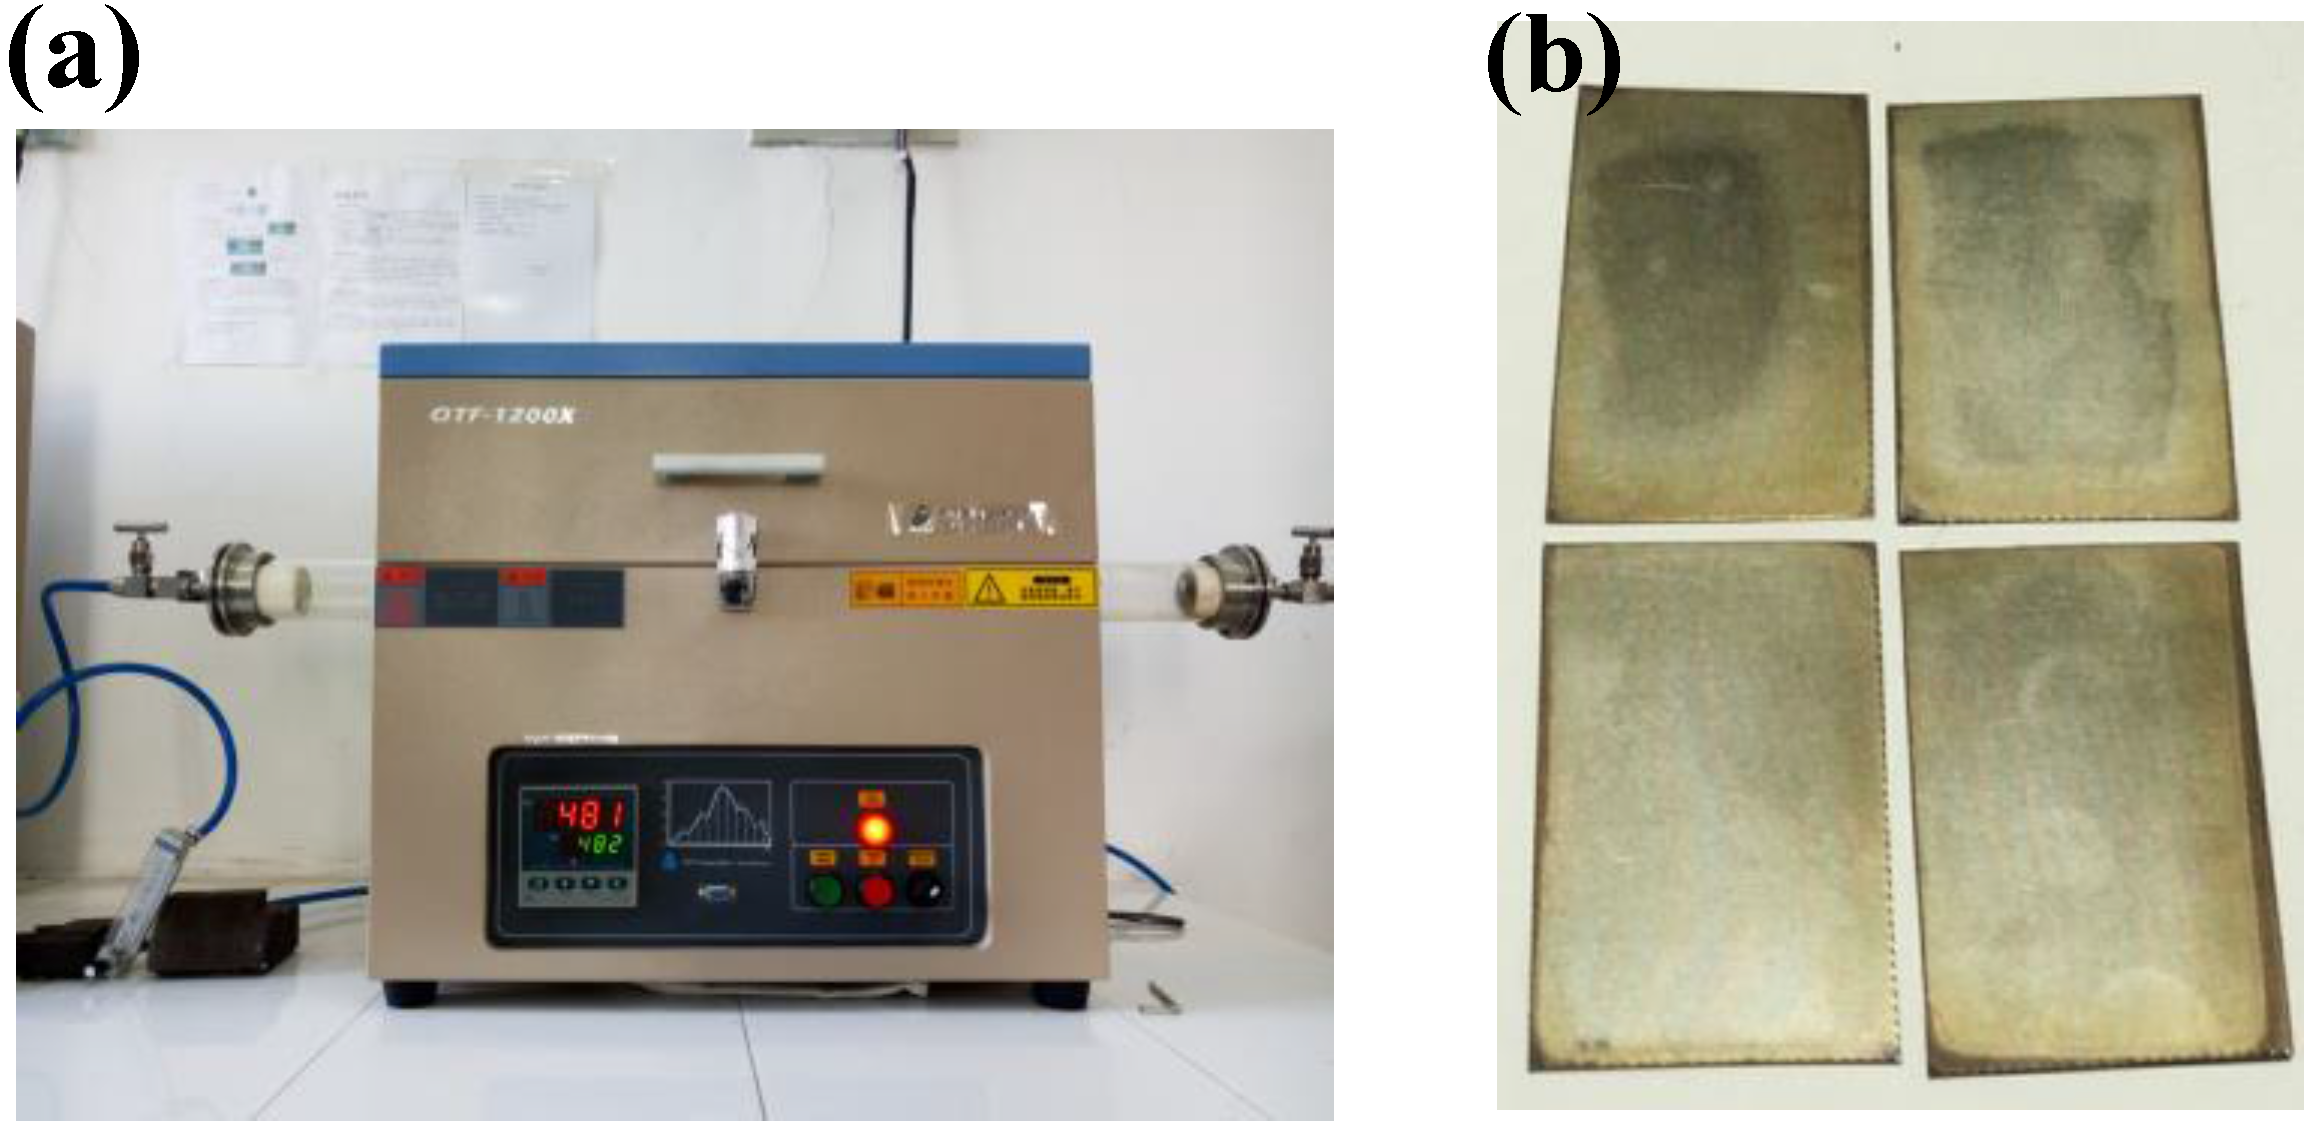
The samples were annealed at 760 °C for 90 min [24], then they were cooled in the QTF-1200X vacuum tube furnace with the temperature controlling accuracy is ±1 °C, as shown in Figure 1a. The maximum heating rate and cooling rate are 20 °C/min. During annealing the Argon gas was continuously injected into the tube. After annealing the samples (see Figure 1b) with different CT time were stored in a liquid nitrogen. All the samples were divided into seven groups according to CT time. The details of groups are shown in Table 2.
2.3. Metallographic Observation
After treatments, the surface of the samples was initially grinded by abrasive paper and then polished. Afterwards, the sample surface was corroded by chemical reagents with 88 vol% H2O, 2 vol% HF, and 10 vol% HNO3. Finally, the sample of each group was detected by optical microscopy (ZEISS microscope; Axio.Imager.A2m, manufactured by Carl Zeiss Microlmaging GmbH, Gottingen, Germany).
2.4. Vickers Hardness
Vickers hardness values of the samples were obtained using Vickers hardness tester under different treatment process. During the tests, the load is 100 N and the duration is 5 s with the magnification is 400 times. In the current study, the sample surface o roughness is Ra0.2. For each group sample, five points were tested for hardness, and the average values were calculated accordingly.
2.5. Tensile Tests
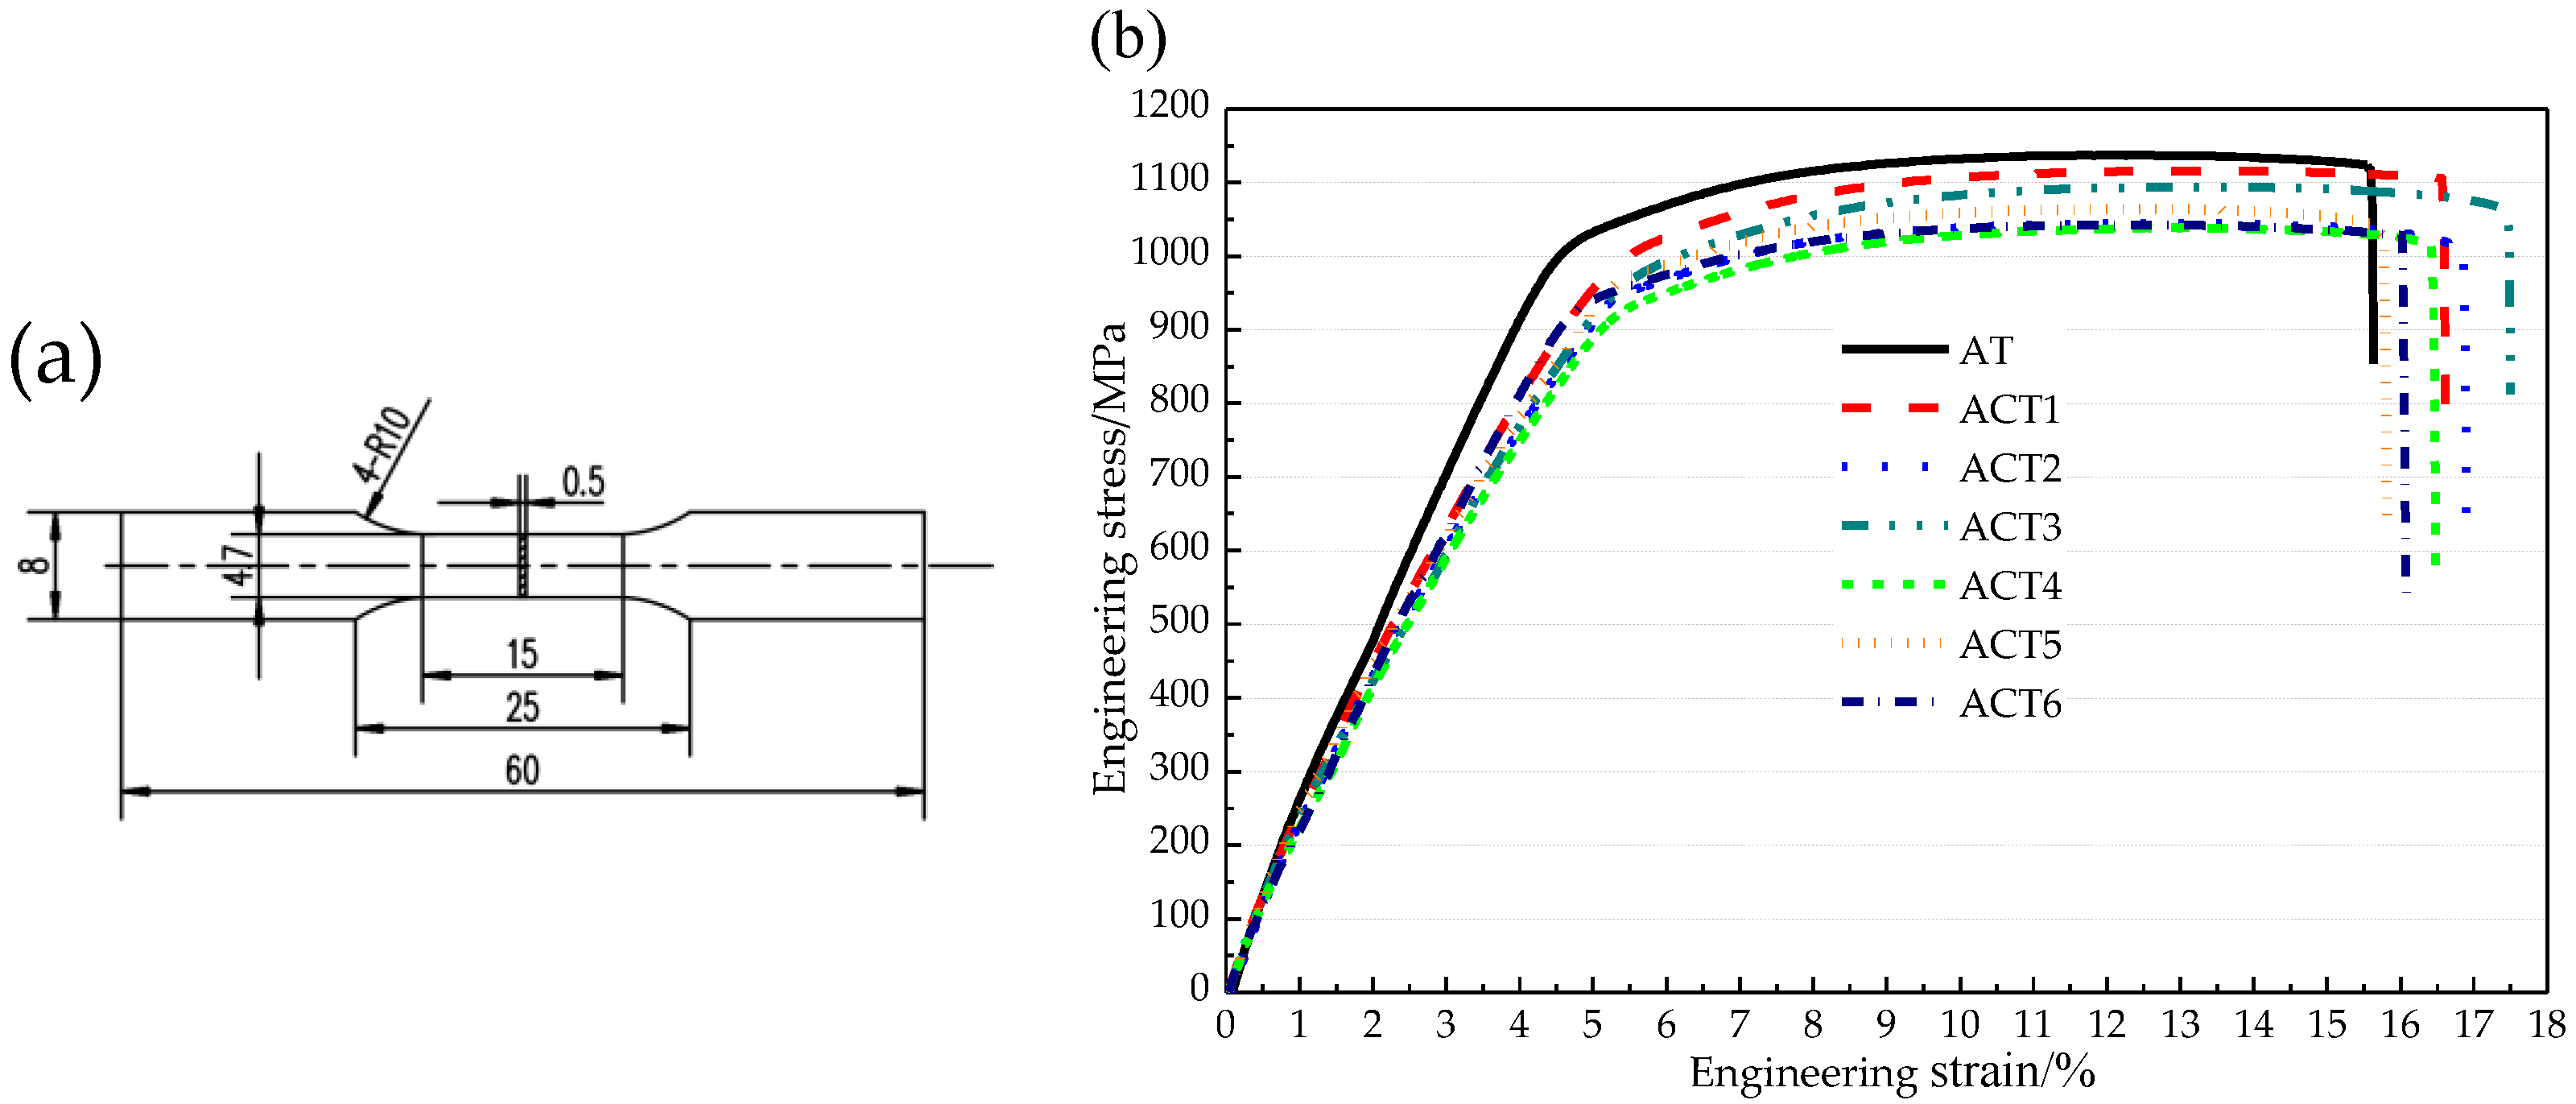
The details of the sample dimensions are shown in Figure 2, the tensile tests were carried out at room temperature using a universal testing machine at a tensile rate of 2 mm/min. Three samples in each group were selected for the test. The maximum force () of the sample and the total deformation of the gauge length section after tensile fracture of the sample can be obtained. Engineering stress and strain can be calculated by the engineering stress-strain formula.
Figure 2b plots the stress and strain curves of the samples. From Figure 2b, in the process of deformation, elastic deformation occurs firstly, and the stress is proportional to strain. When the stress exceeds ( is the elastic limit), and the material starts to yield, it can also be noted that there is not apparent yield platform in the curves. Under the condition, the stress value that produces 0.2% residual deformation is defined as its yield limit (). When the stress exceeds the yield limit, plastic deformation occurs. As the cross-sectional area shrinks, the maximum force () when the sample is broken is divided by the original cross-sectional area (), the result is called tensile strength (). When the stress reaches , the stage of uniform plastic deformation has ended. The sample starts to produce uneven plastic deformation and form necking, followed by the stress decreases. When the final stress reaches (Fracture strength), the specimen is found to be broken.
2.6. Punch Shearing Tests
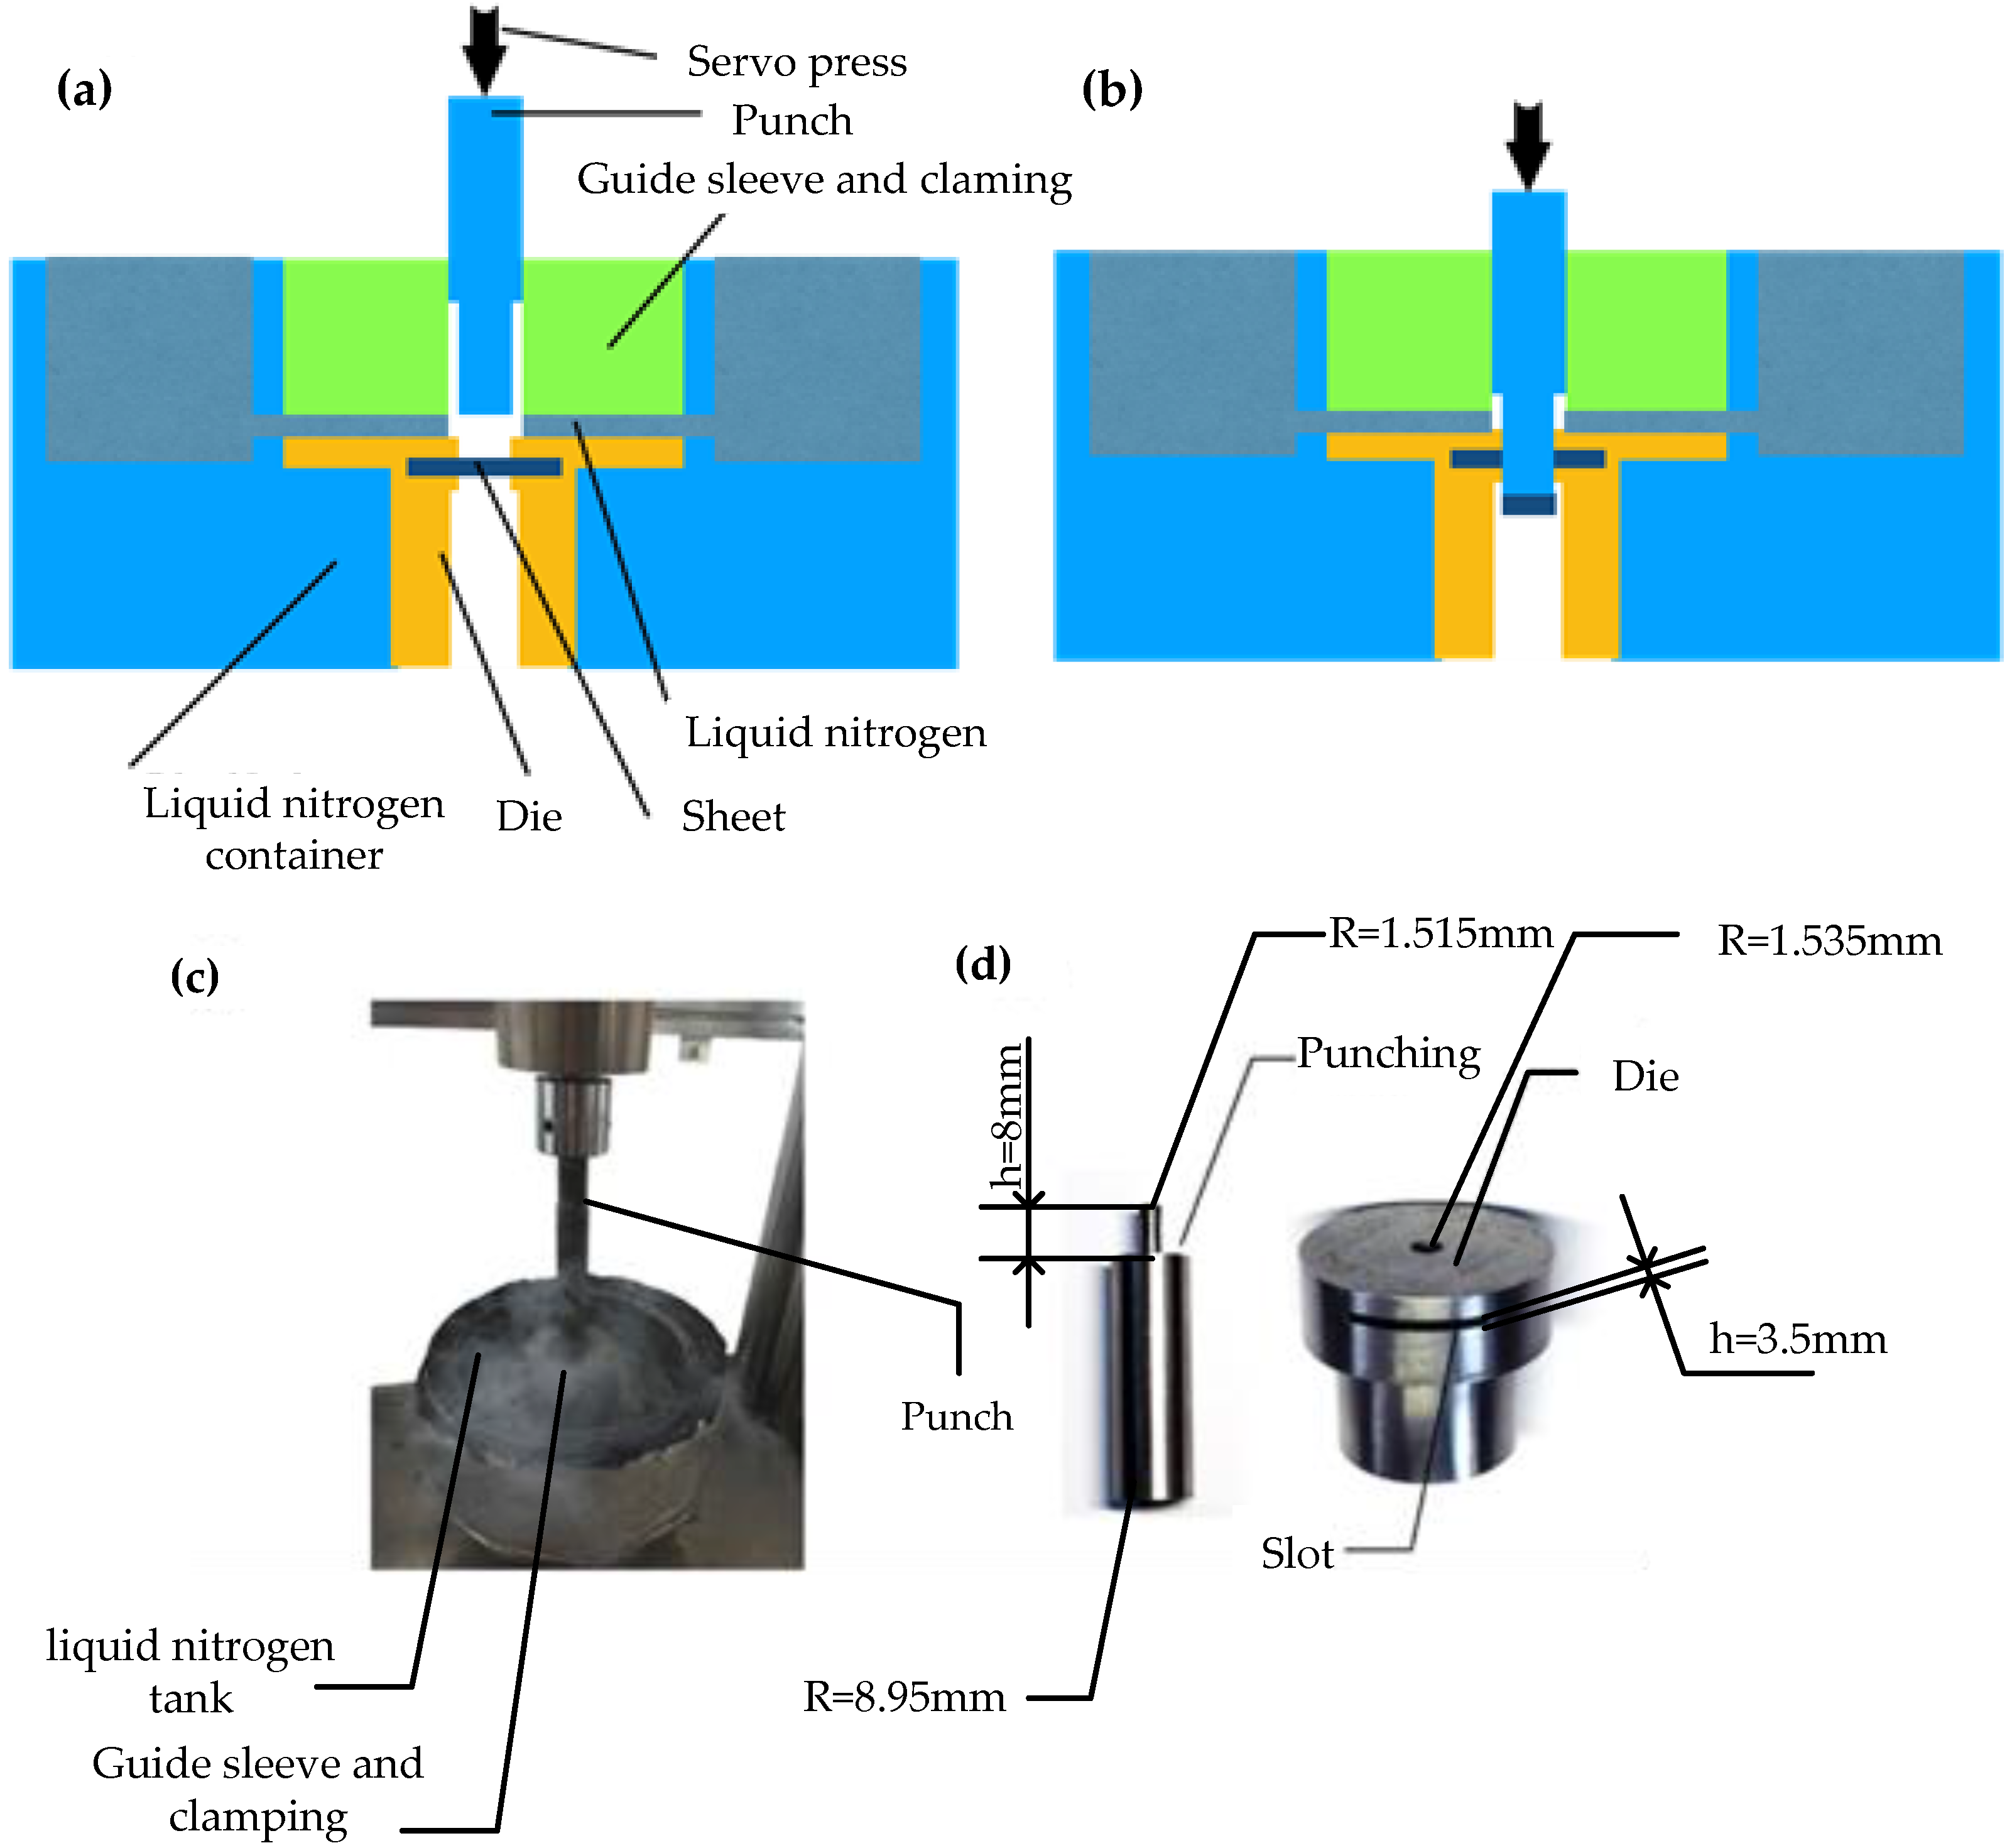
In the current study, punch shearing was employed to investigate the effects of ACT on the properties of Ti-6Al-4V titanium alloy. The principle of punch shearing and the die are shown in Figure 3a,b,d, respectively. The diameter of the punch is 3 mm and the die is 3.07 mm. A slot is machined in the die to clamp the sample. In order to obtain better section quality, the punching speed is set to be 5 mm/s 24. After ACT, the samples with the length of 30 mm, the width of 19 mm and the height of 0.2 mm will be punched and divided into two groups. A group of the samples will be immersed into the liquid nitrogen and punched as shown in Figure 3c. Another group of the samples will be punched at room temperature. Fracture surface was detected by optical microscopy (ZEISS microscope; Axio.Imager.A2m). Table 3 lists the test numbers of the samples under different conditions. During punch shearing, the relationship between the maximum deformation resistance and shear strength is calculated by the following formula:
where is the thickness of the plate, , is the radius of the punch, and is the radius of the die.
2.7. Deep Drawing
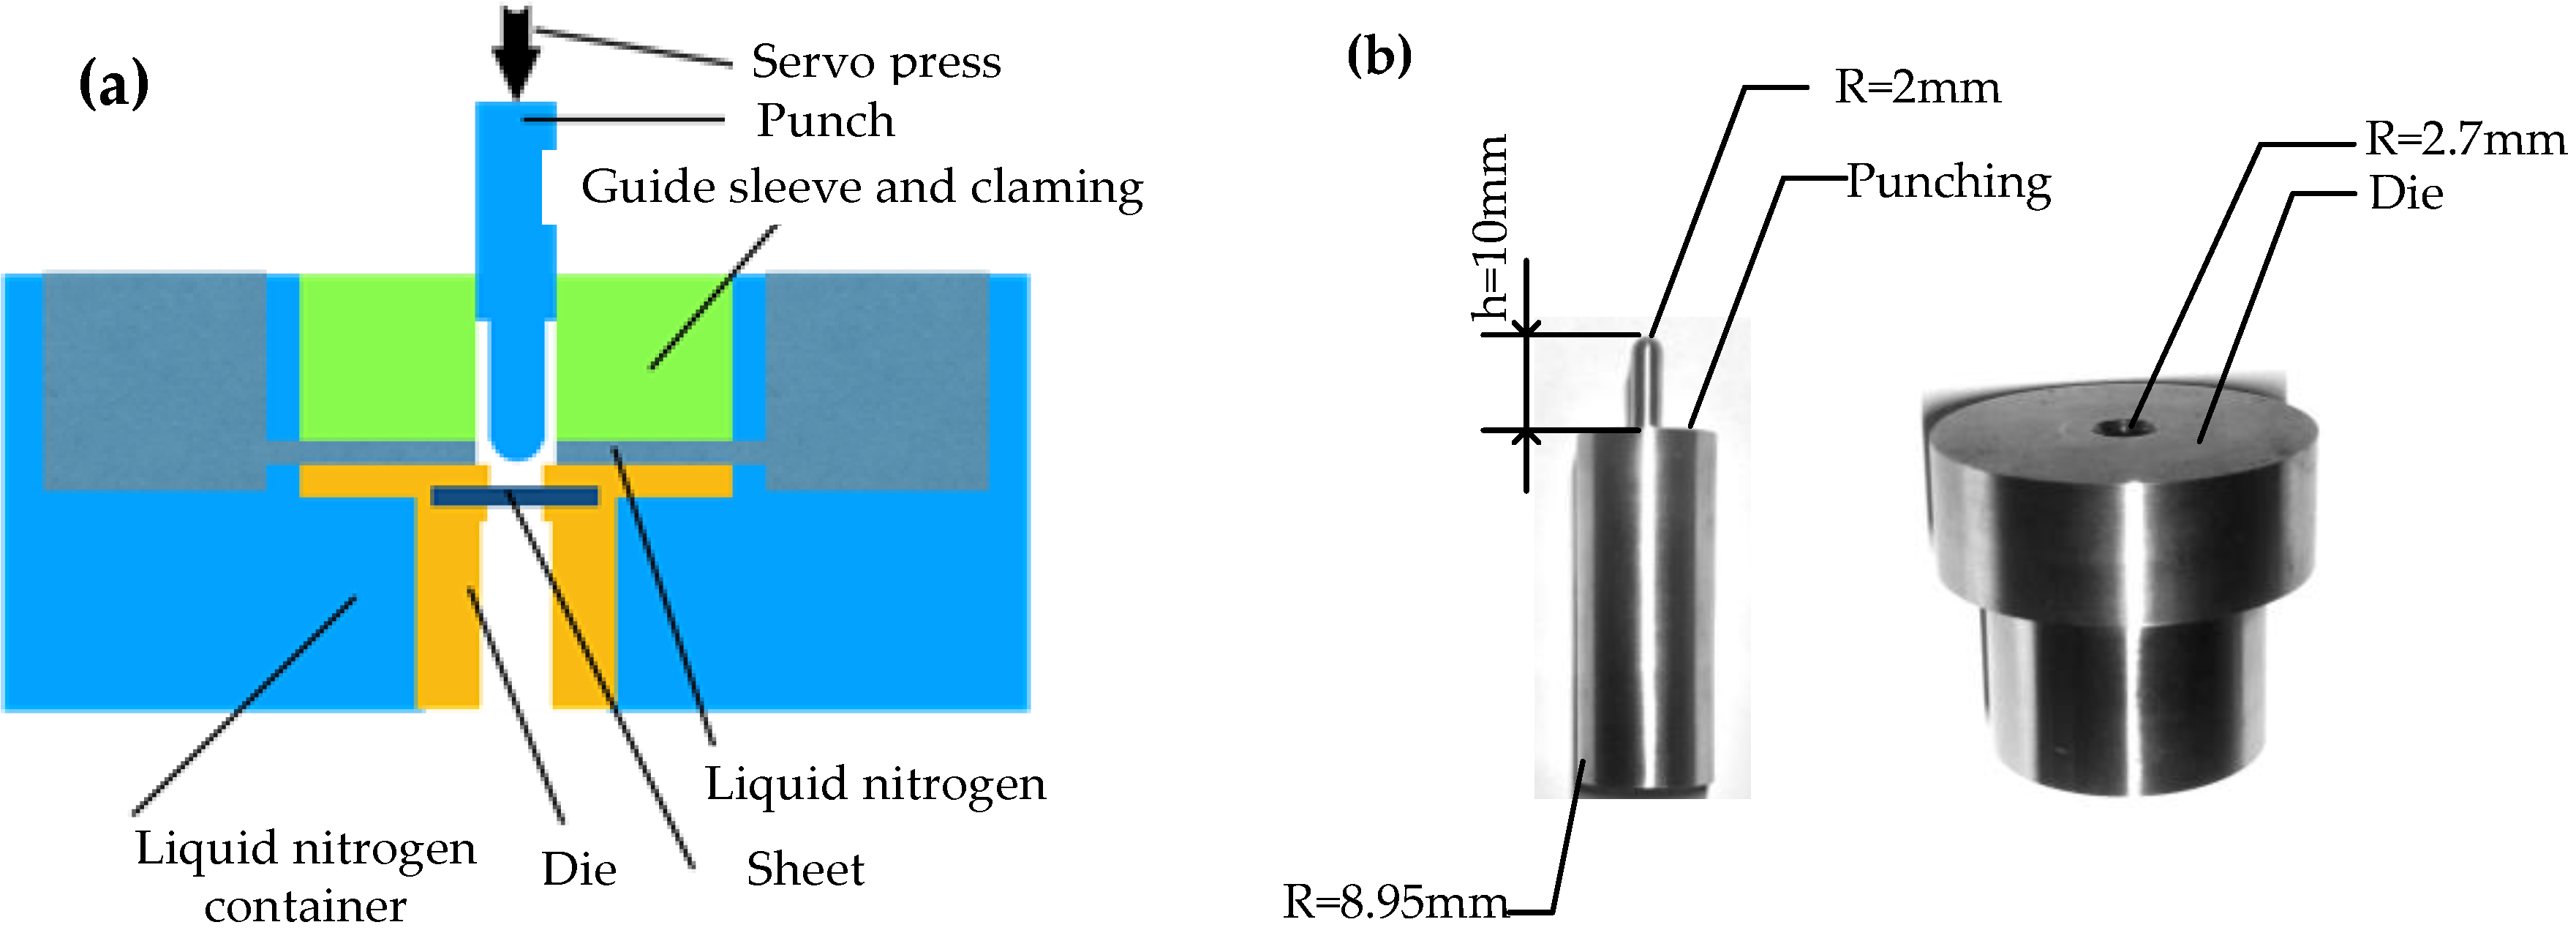
In the current work, deep drawing tests were also conducted using a servo press to study the effect of ACT on the formability of Ti-6Al-4V titanium alloy. The size of the sample for the deep drawing test is 29 mm × 29 mm × 0.2 mm. Table 4 listed the test cases. The principle of deep drawing, the schematic diagram of the die and punch are shown in Figure 4. Additionally, the diameter of the punch with sphere is 4 mm, and the die is 5.4 mm. During deep drawing, the punch continuously descends down until the sample happens to crack. At this time, the displacement value of the punch is the limit depth of deep drawing.
3. Results and Discussion
3.1. Microstructural Characteristics
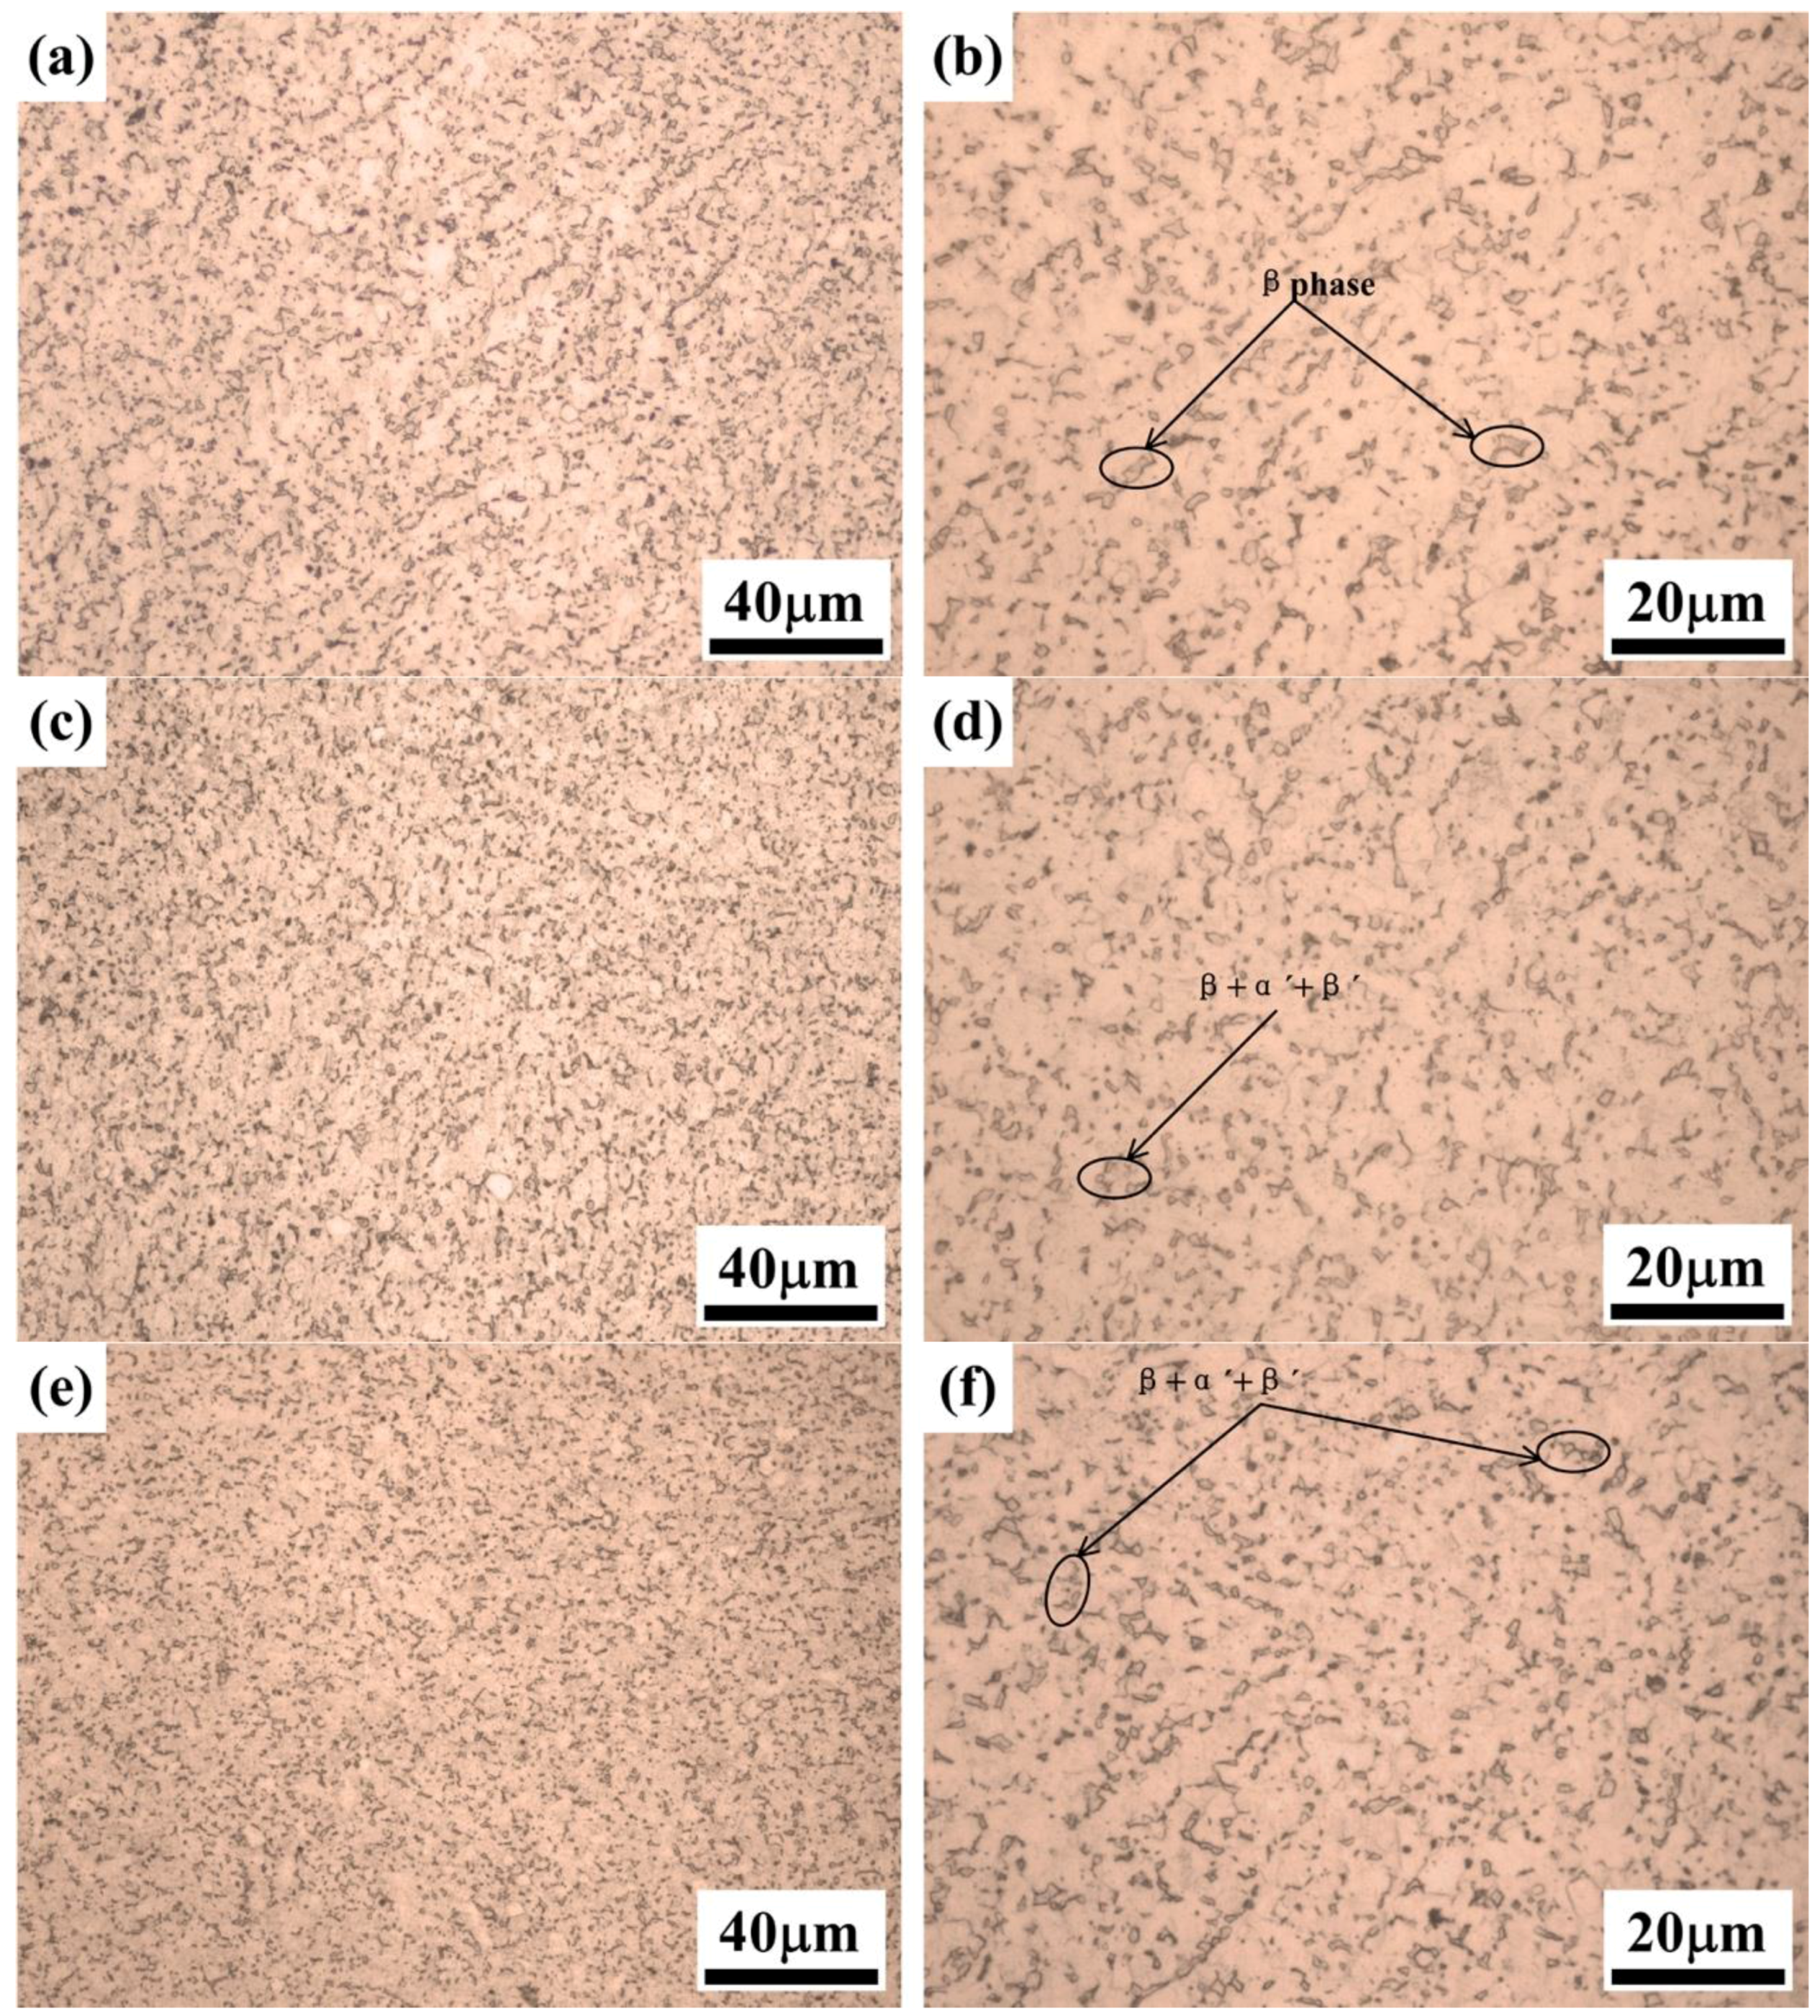
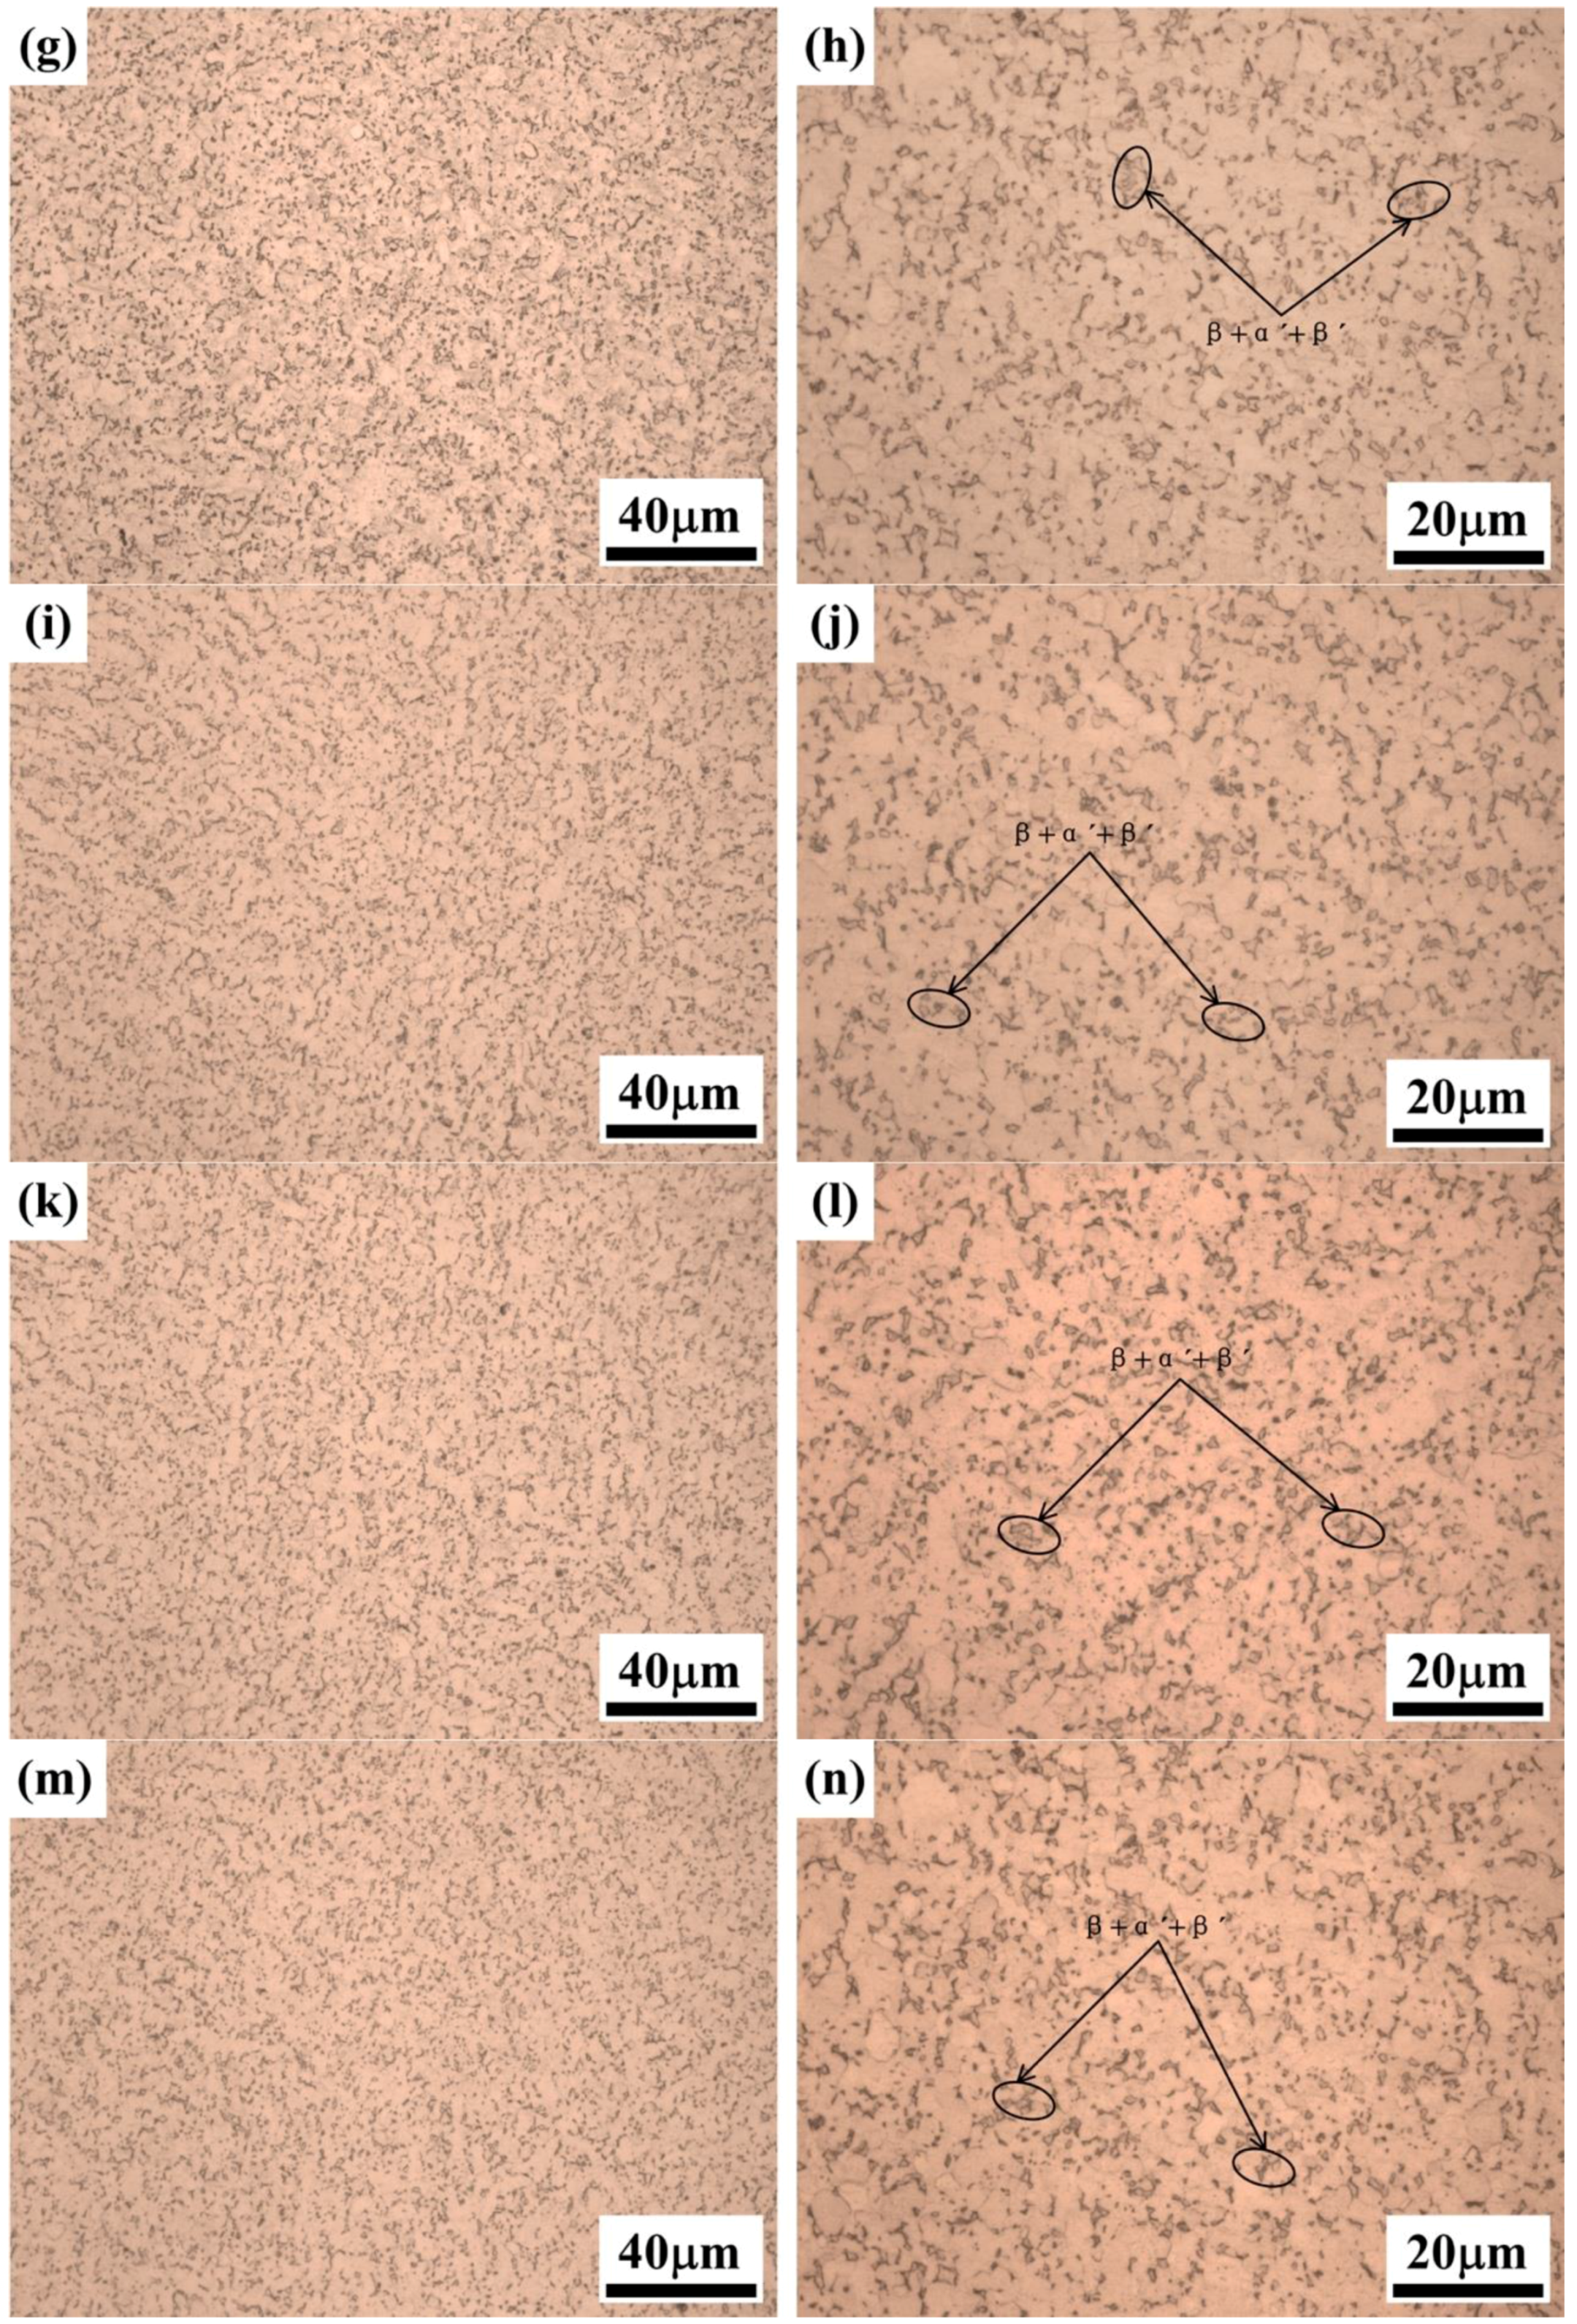
Figure 5 shows the microstructures of the samples after AT and ACT. After recrystallization annealing, the microstructure is composed of α and β phases, and the β phase is dispersed in the boundary of equiaxed α grains. In Figure 5 the bright regions are α phases, and the black grains are β phases. The distribution of β phases is shown in Figure 5a,b, and it can be seen clearly that β phases disperse in the boundaries of α grain after AT. However, after ACT1, new phases including α’ and β’ are precipitated [26]. The α’, β’ and untransformed β phase disperse uniformly in boundaries of α phases, as shown in Figure 5c,d. From ACT1 to ACT2, the change in microstructure with the increase of the CT time, is shown in Figure 5e,f. It should be noted that the precipitates including α’, β’, and β increase remarkably and disperse uniformly. When the CT time arrives at 12 h, the quantities of the precipitates are increased, and the sizes become larger, as shown in Figure 5g,h. When the time increases from ACT4 to ACT6, the change in the microstructure is exhibited in Figure 5i–n. It needs to be observed that the both quantities and sizes increase further, which indicates that ACT can transform the metastable β phase into stable β’ phase and α’ phase, and there is no obvious change in α phase. The results achieved as above are in consistence with those obtained in the literature 24.
It can be seen from all the figures that both the quantities and sizes of the precipitates are apparently increased after ACT. The reason could be that, the α-Ti is a hexagonal close-packed structure, whereas the β-Ti is the body centered cubic structure, and the diffusion ability of hexagonal close-packed structure is far below the body centered cubic structure owing to hexagonal close-packed structure is in close array. Gu et al. [26] stated that the contraction velocity of the β phase is faster than that of α phase at low temperature, which can produce enough driving force to promote the precipitate of the α titanium particle s depending on the matrix. Moreover, at low temperature, the solubility of vanadium drops significantly, resulting in β phase is in metastable state and transformed to stable β’ phase. ACT can transform the metastable β phase into stable β’ phase and α’ phase. Due to the precipitation of precipitates, the bonding force between grain boundary and grain boundary is small, this will lower the bond strength at the crystal boundary, resulting in the decrease of tensile strength. On the other hand, the effect of the cold compression in ACT process could make the gaps in the material larger. Especially at the grain boundary, the number of the pores increases due to weak bonding force between the precipitates and the grain boundary. Thus, the unrecoverable plastic deformation is easier to occur, the elastic modulus and tensile strength decrease.
3.2. Tensile and Hardness Properties
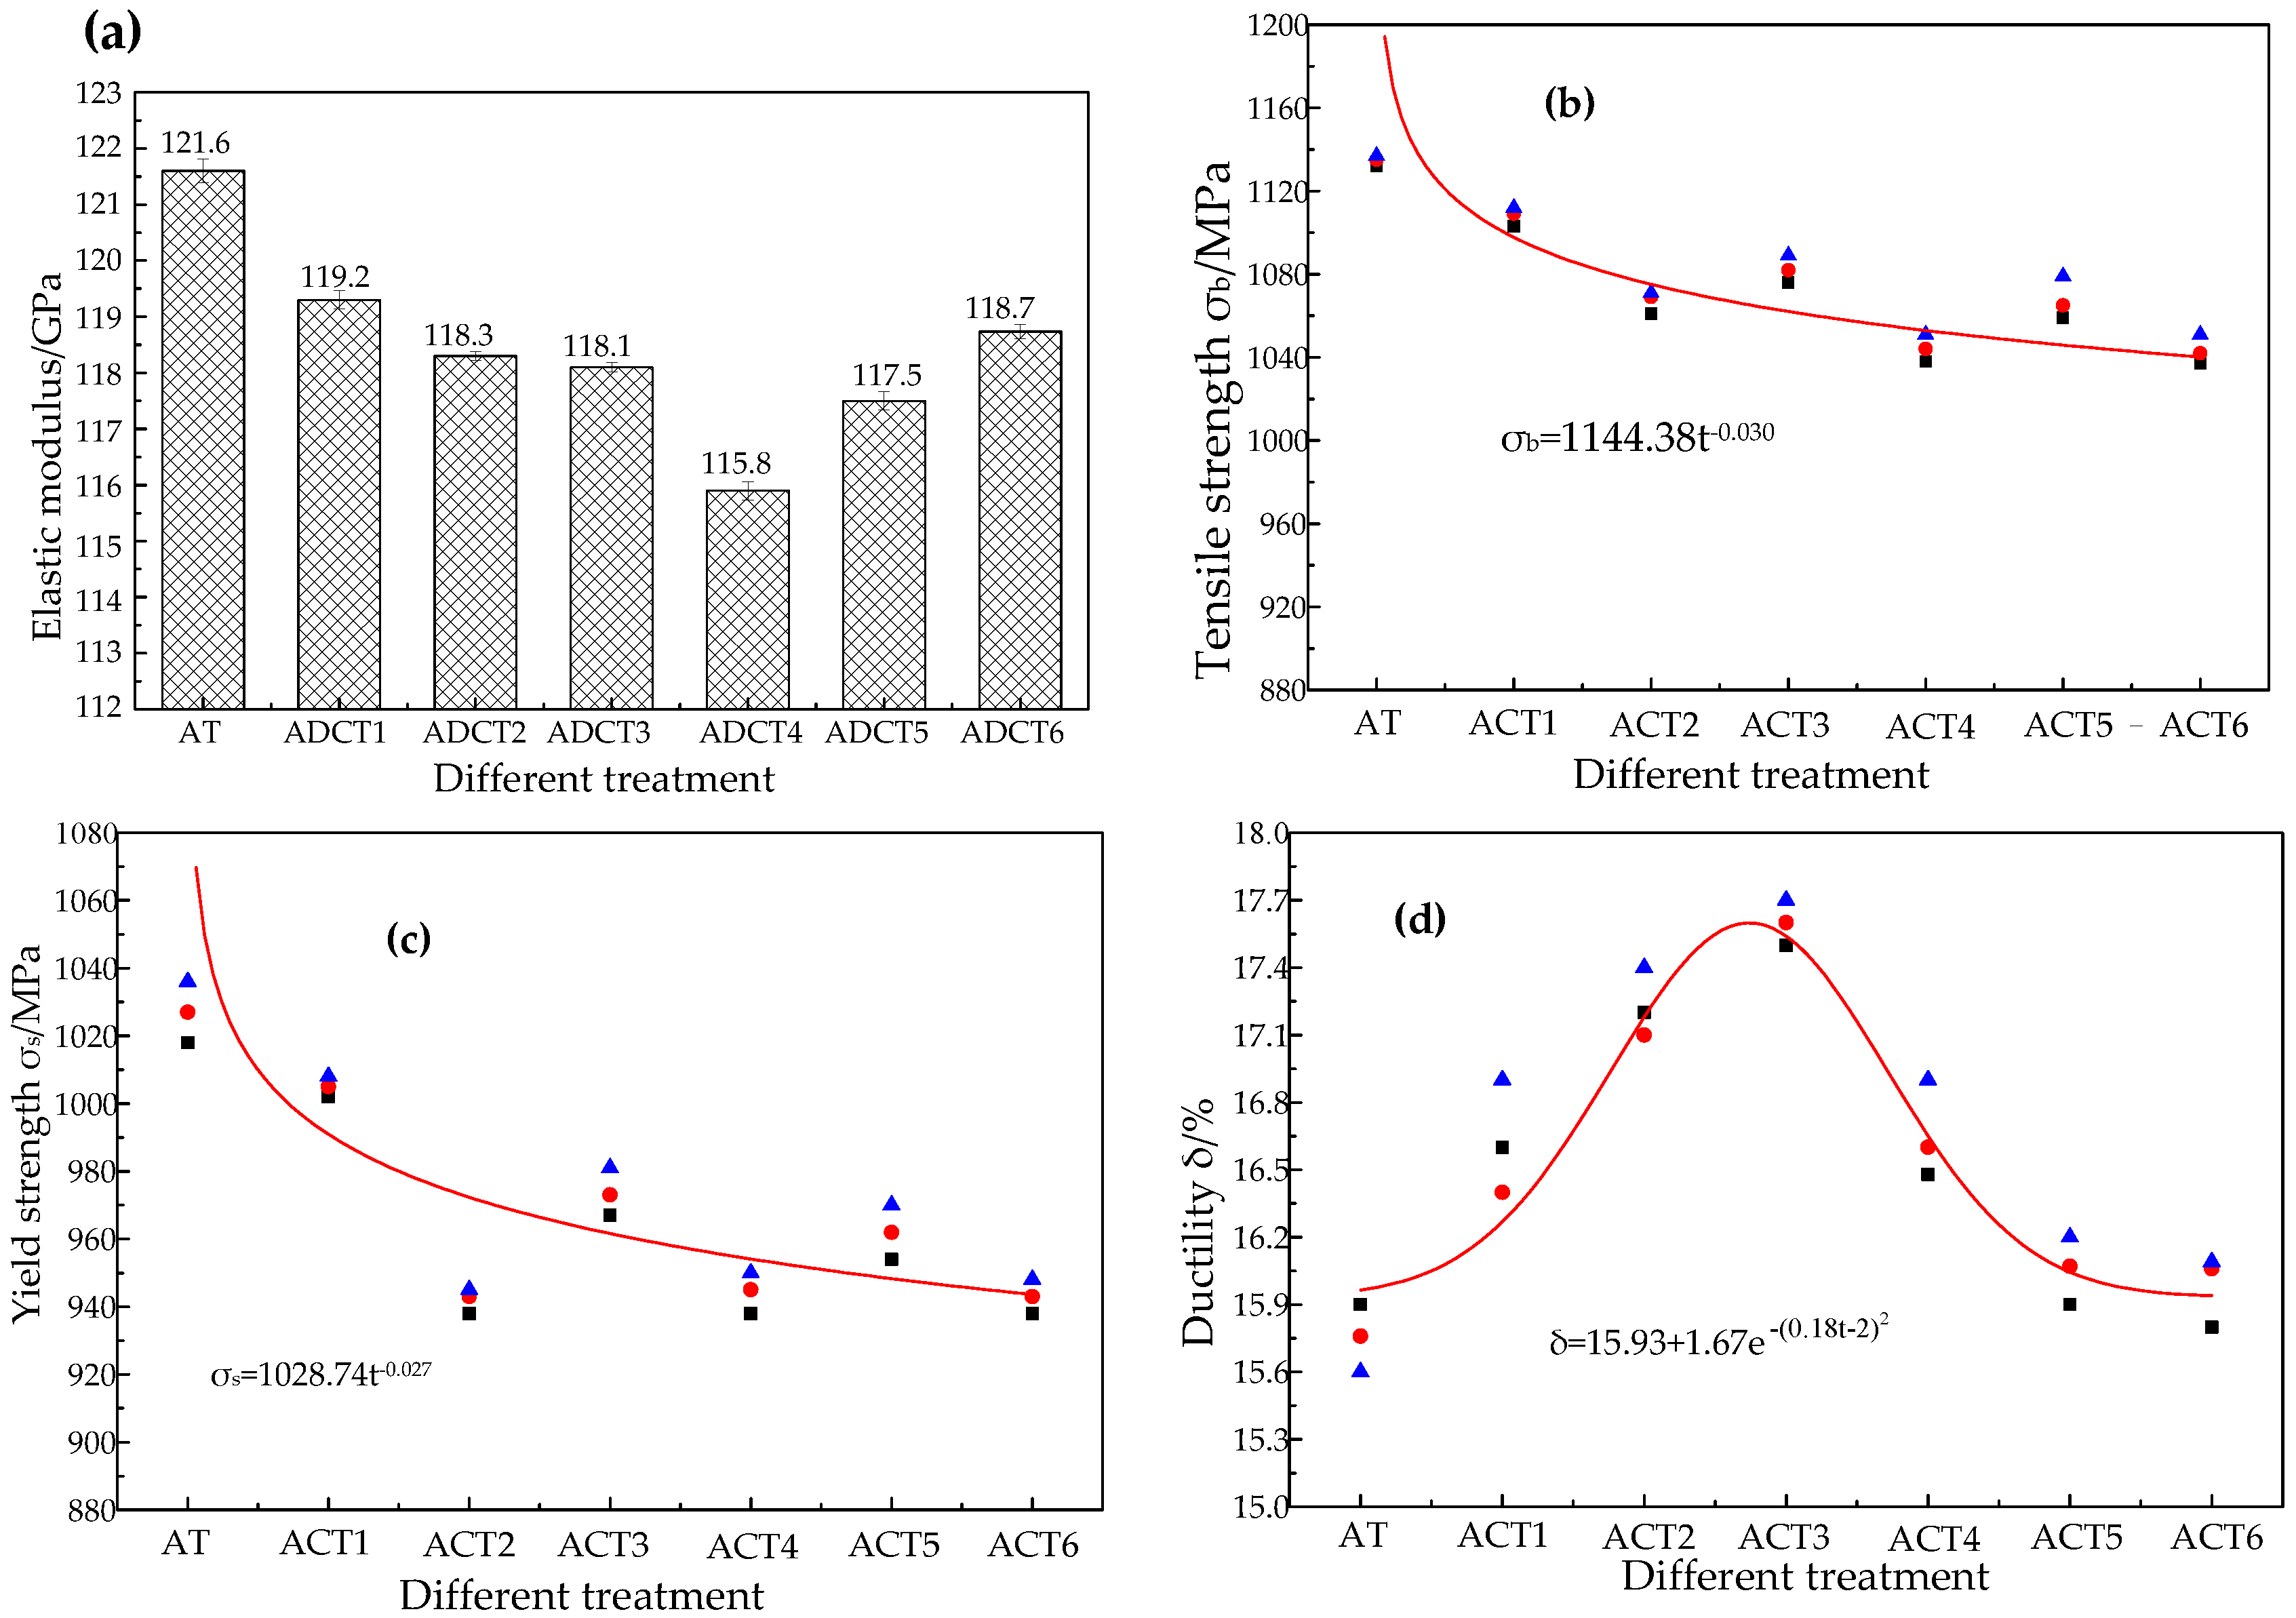
Figure 6 plots the average values of elastic modulus, tensile strength, yield strength, and the ductility. It can be seen from Figure 6a that, after AT, the elastic modulus is 121.6 MPa, whereas after ACT1, the average value of the elastic modulus is decreased to 119.2 MPa. From Figure 6a, it is also observed that the overall average values of the elastic modulus are decreased slowly with the increase of CT time, reaching a minimum value of 115.8 MPa after ACT4. With the increase of CT time, from ACT5 to ACT6, the average value of the elastic modulus slightly increase from 117.5 MPa to 118.7 MPa. The correlation equation is established and it can be concluded that the elastic modulus of all the samples with AT or ACT is decreased, whereas the elastic modulus is increased after ACT4, but the overall values of the elastic modulus is lower than that of the untreated samples. Figure 6b shows tensile strength, and it can be seen that the values obtained by three tests approach each other both after AT and ACT. Moreover, with the increase of CT time, the tensile strength decreases and the decreasing trend follows accordance with the equation as follows: , where is constant, and calculated as 1144.38 MPa, and is constant, and calculated as −0.03. Figure 6c shows the yield strength it is clearly observed that with the increase of the CT time, the values of the yield strength decreases, and the equation of declining trend is in accordance with that of the tensile strength as mentioned above, where is calculated as 1028.74 MPa, and is calculated as −0.027. Figure 6d demonstrates the ductility, and it can be seen that the ductility is increased gradually with treatment methods from AT to ACT. Furthermore, with the increase of the CT time, the ductility is increased remarkably until, the peak value is achieved after ACT3, which is increased by 17.5% compared to the values after AT. Afterwards, the values decrease from ACT4 to ACT6. The correlation equation can, thus, be . The improvement of mechanical properties has obvious influence on the formability of Ti-6Al-4V sheet. After ACT, plastic deformation is more likely to occur due to the decrease of yield strength and elastic modulus. The ductility is clearly increased, which results in the late occurrence of cracks during deformation. The proportion of smooth zone in punch shearing and the depth in deep drawing increase.
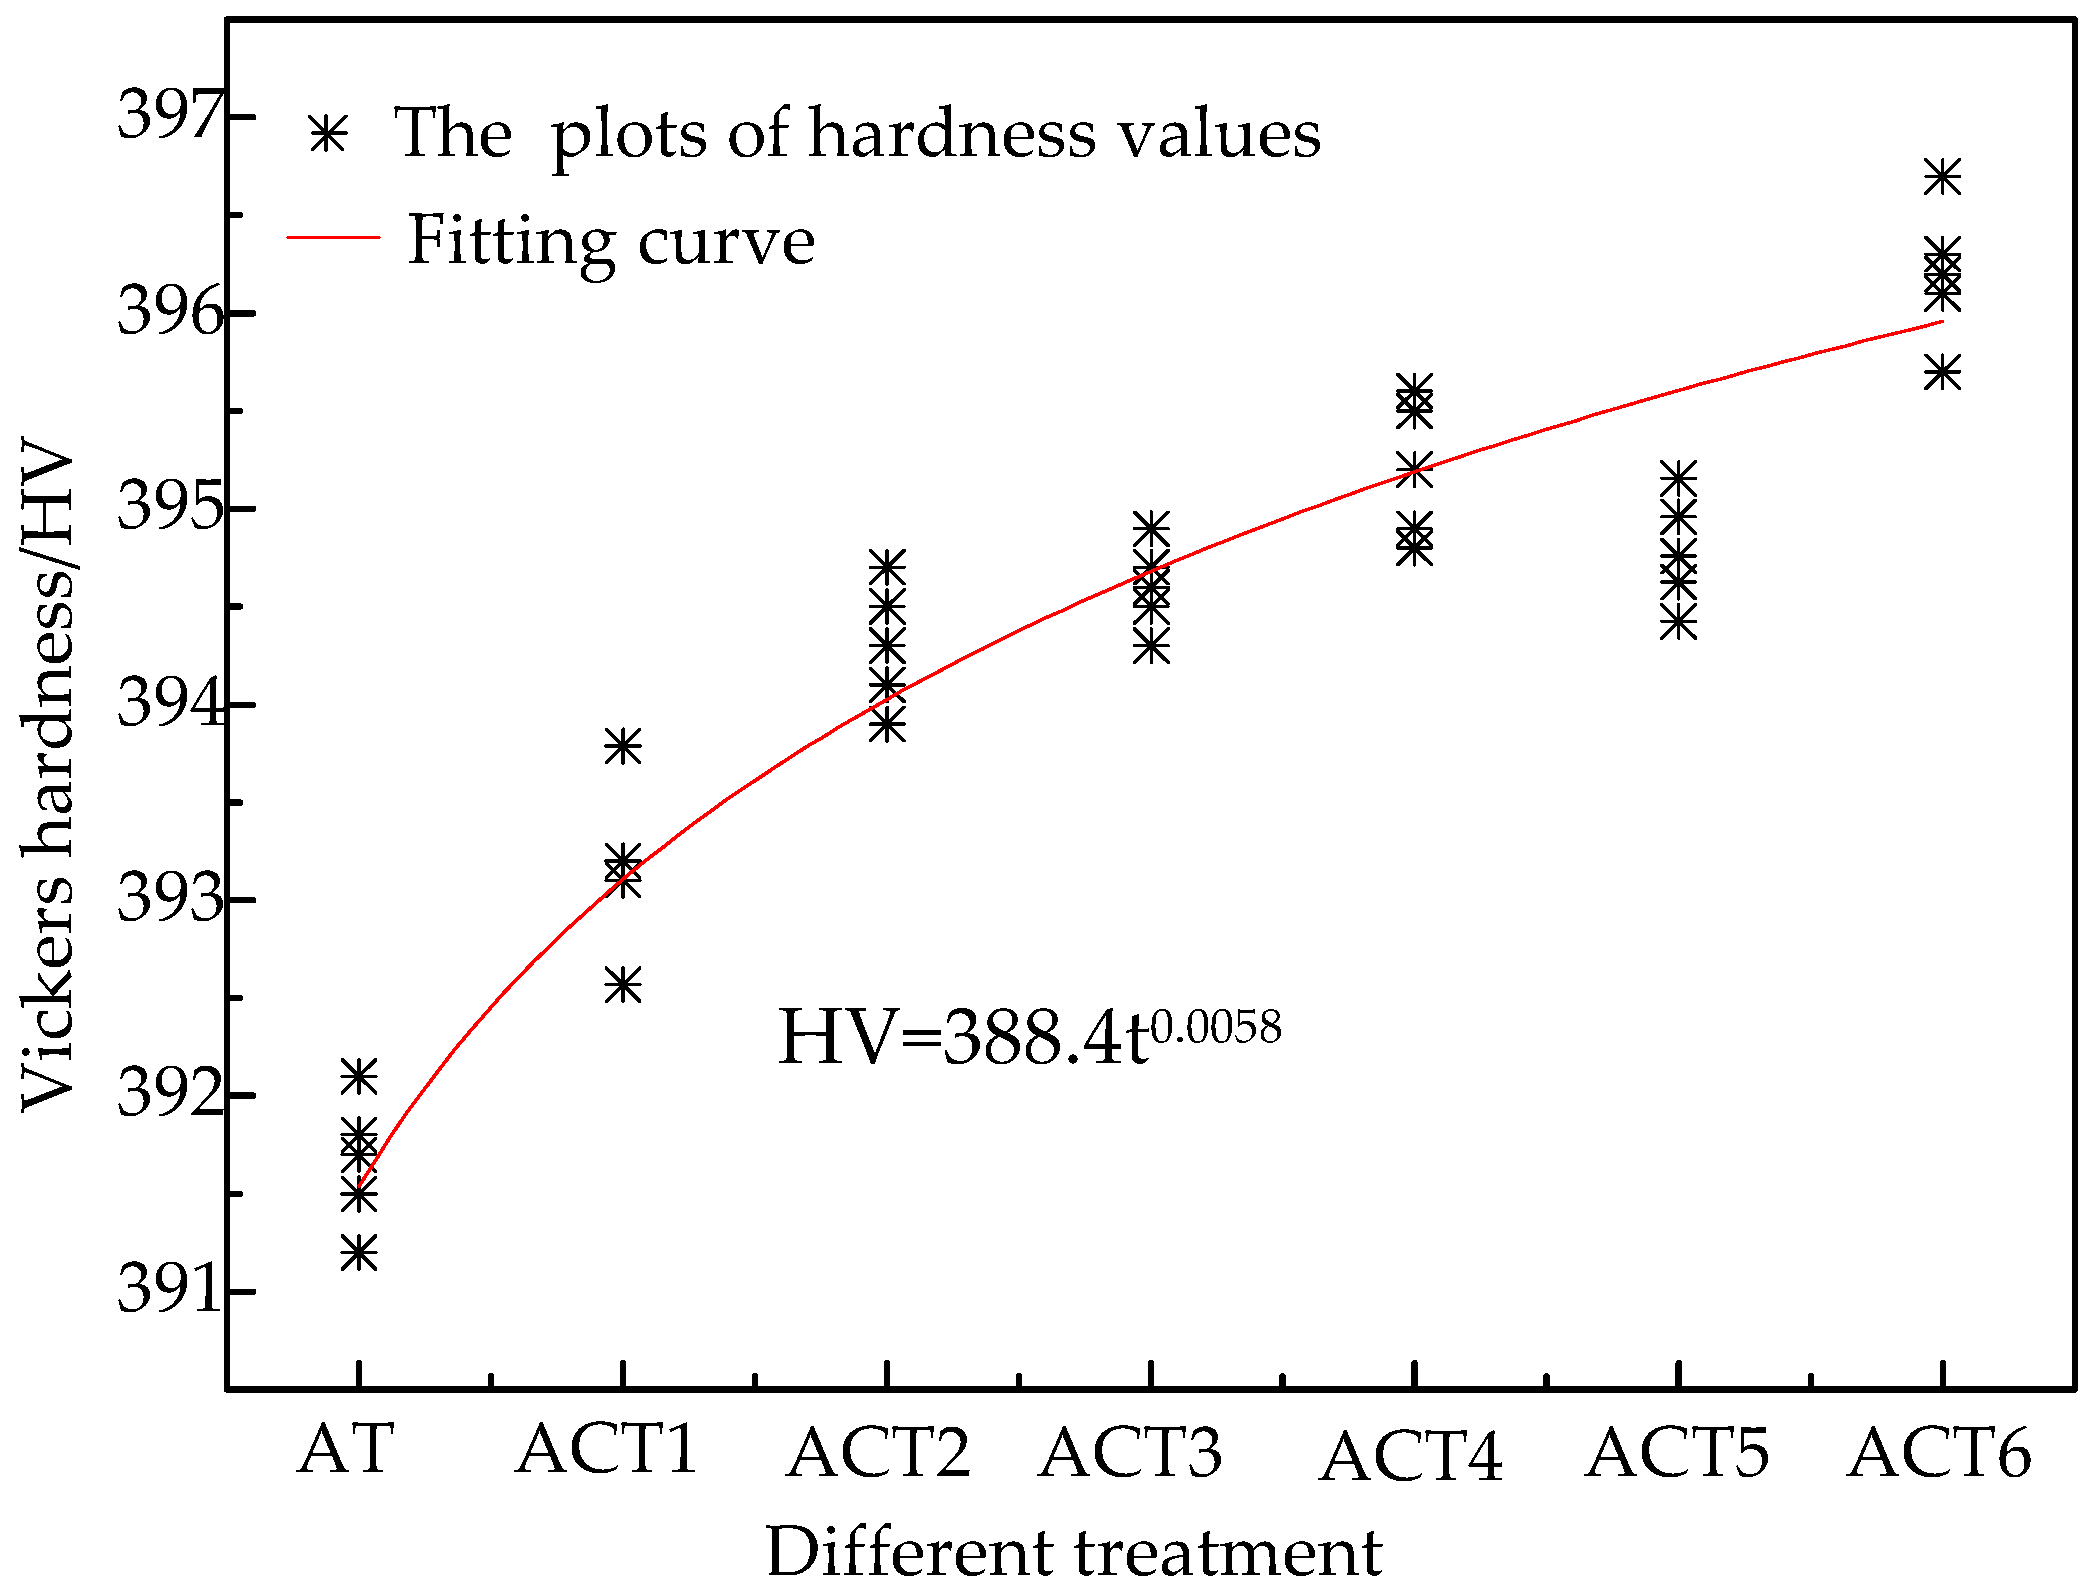
Five points distributed uniformly on each sample were marked by the Vickers hardness tester. Variation of Vickers hardness with different treatment is shown in Figure 7. The average values of five values in each group were calculated and the curve of the variation is as follows: where is the constant and calculated as 388.4 HV, and is variable of CT time. It can be seen from Figure 7 that the hardness values distribute on both sides of the curve. It also can be seen that the harness values are increased with the increase of CT time, and the increasing trend of values is in accord with the equation. Although the hardness of the sample after ACT is overall increased, the changes in the hardness are not obvious because the maximum difference between the maximum and the minimum is 4.5 HV. It can be concluded that ACT has insignificant effect on the hardness of the alloy.
3.3. Effect on Punch Shearing Properties
3.3.1. Shear Strength
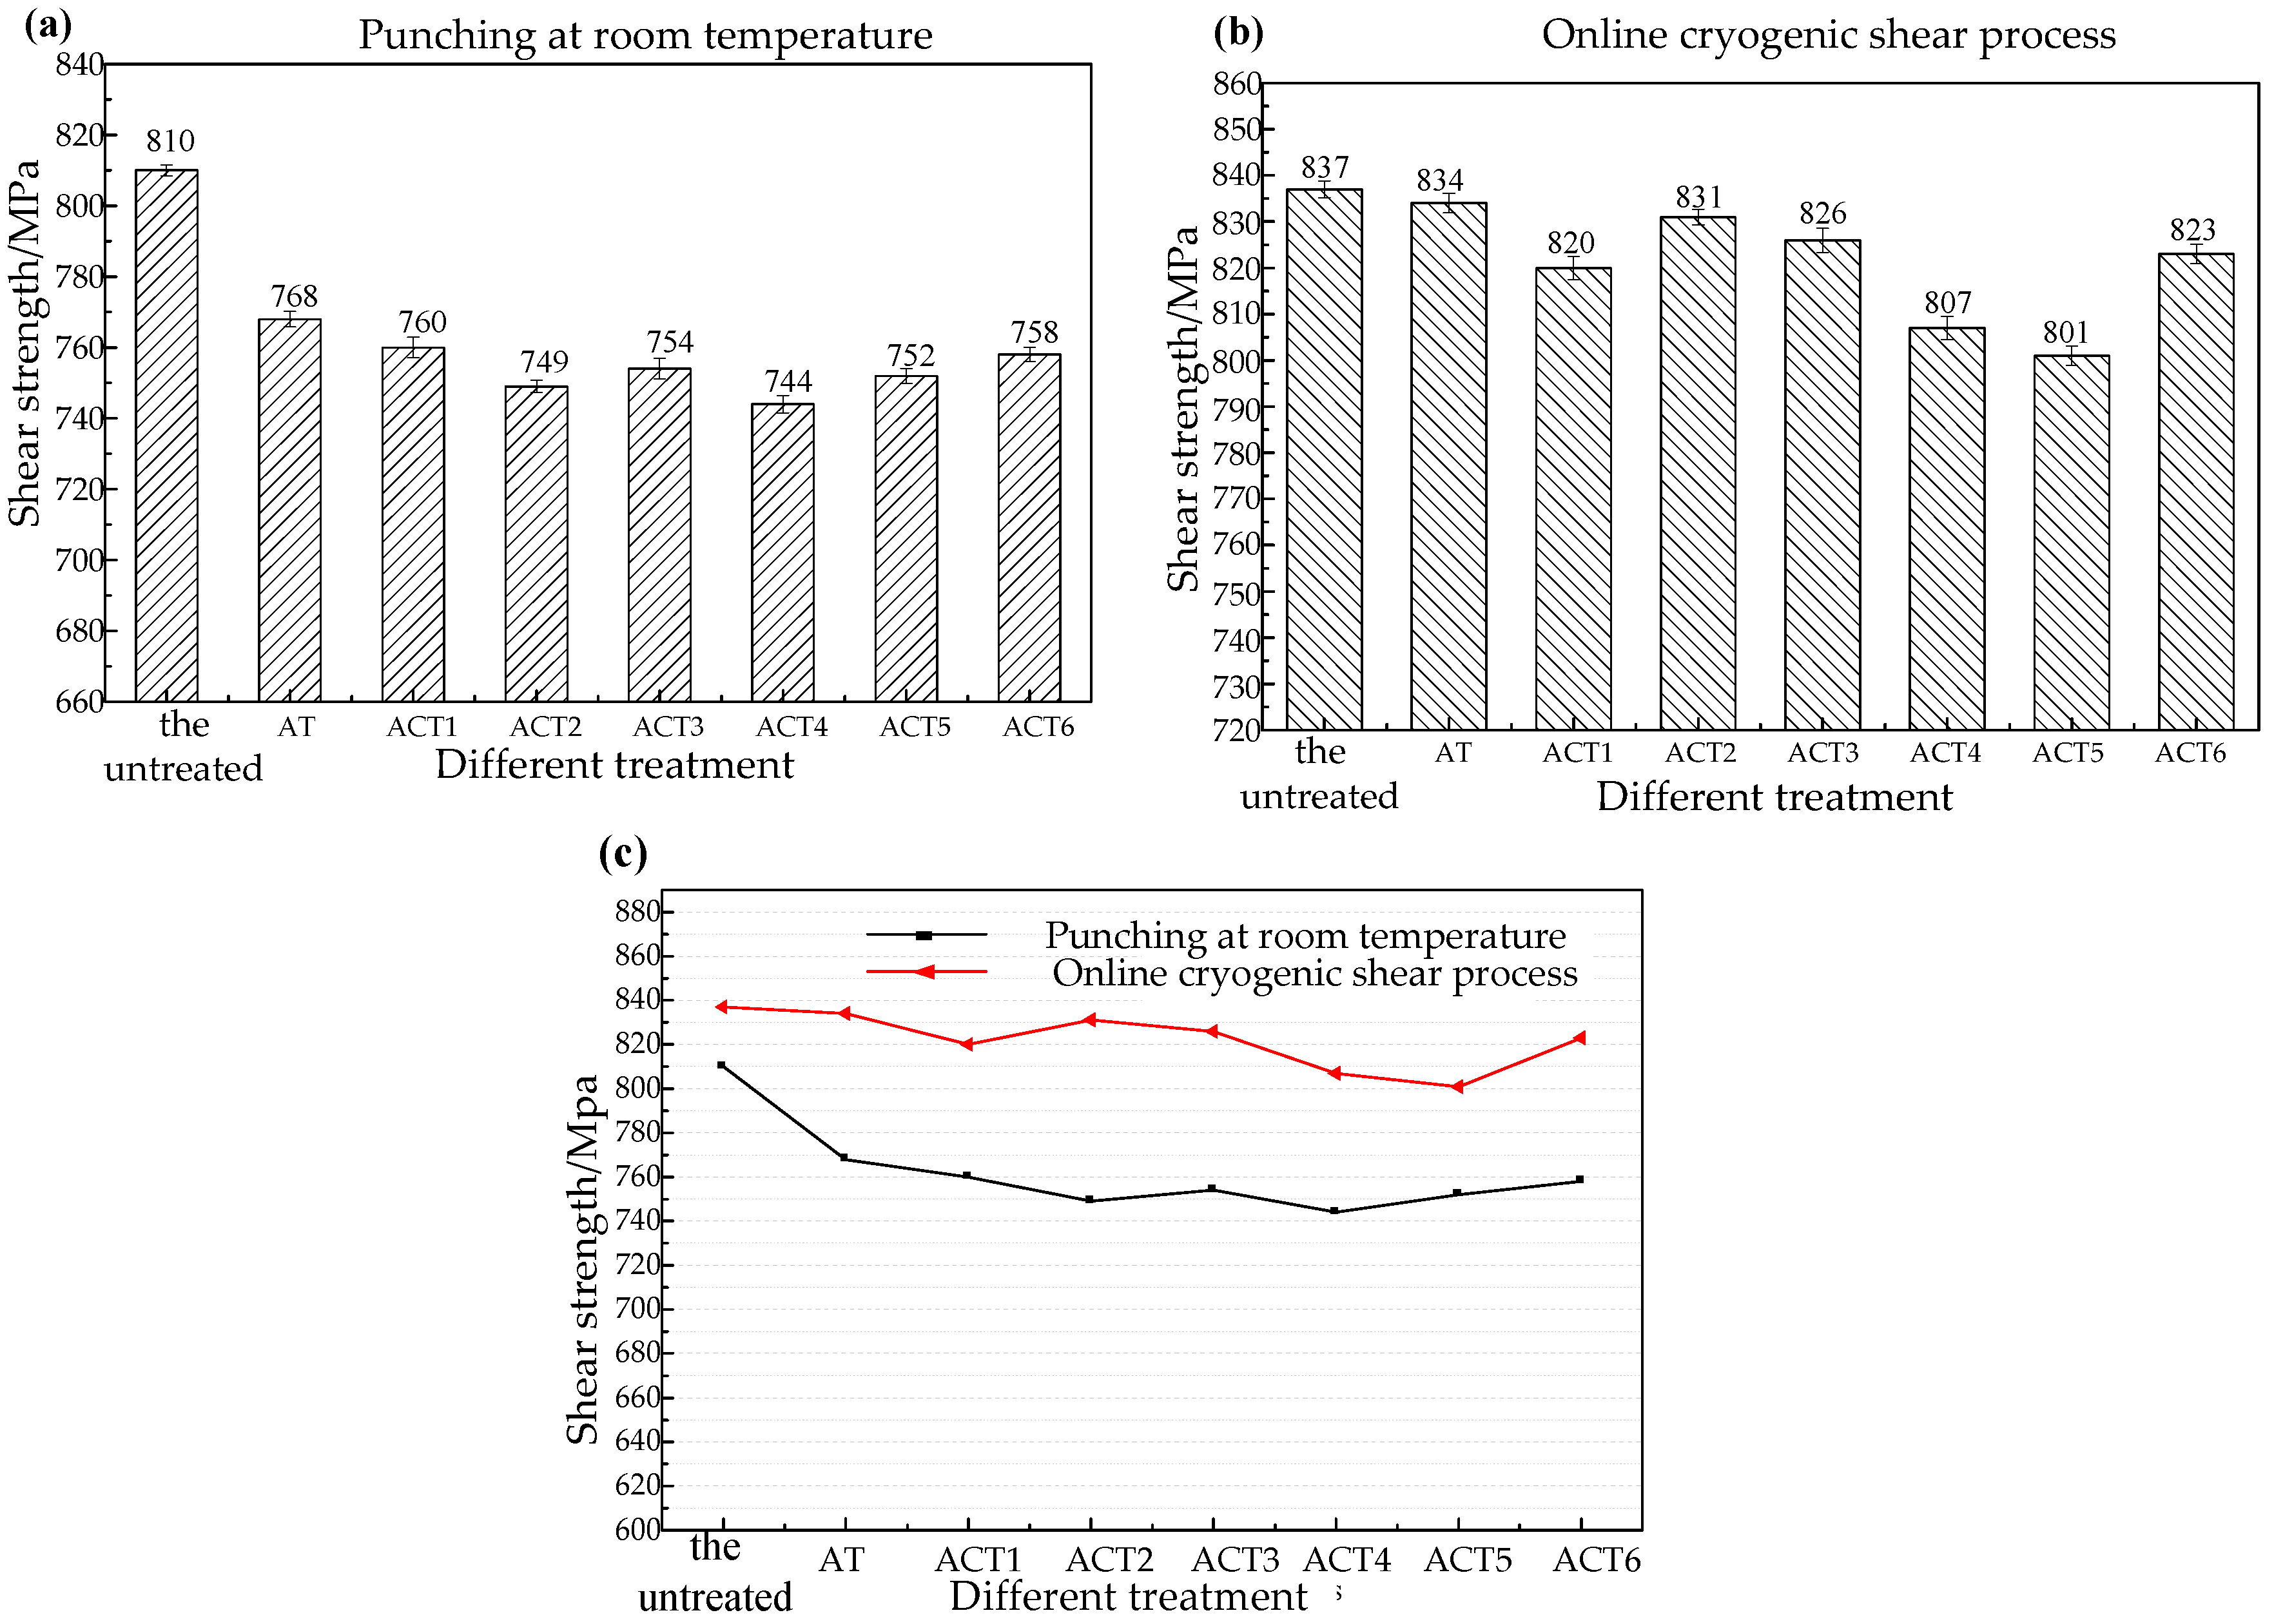
Figure 8a,b show the shear strength of the samples with different treatments at both room and cryogenic temperature, respectively. It can be seen from Figure 8a that whether after AT or ACT, the shear strength decreases in comparison to the untreated material. It should be noted that, after the treatments from AT to ACT2, the shear strength gradually decreases from 768 MPa to 749 MPa, then a quick increase at ACT3, which is 754 MPa, and afterwards it decreases to 744 MPa at ACT4. From ACT4 to ACT6, the shear strength is increased from 744 MPa to 758 MPa. In order to study the effects of CT on the punch shearing, the punch shearing was performed at cryogenic temperature, and the shear strength is shown in Figure 8b. It can be seen clearly from Figure 8b that the change in shear strength of samples after AT is smaller than untreated ones. From ACT1 to ACT4, the shear strength decreases from 831 MPa to 807 MPa, but decreasing tendencies are slowed. At ACT5, the shear strength reaches the minimum value of 801 MPa, and then it increases to 823 MPa at ACT6. The comparison of shear strength at room temperature and cryogenic temperature is shown in Figure 8c. It can be observed from Figure 8c that shear strength at room temperature is lower than that at cryogenic temperature. Meanwhile, the change of the shear strength at cryogenic temperature is much gentler than the shear strength at room temperature.
3.3.2. Characteristics of Punch Shearing
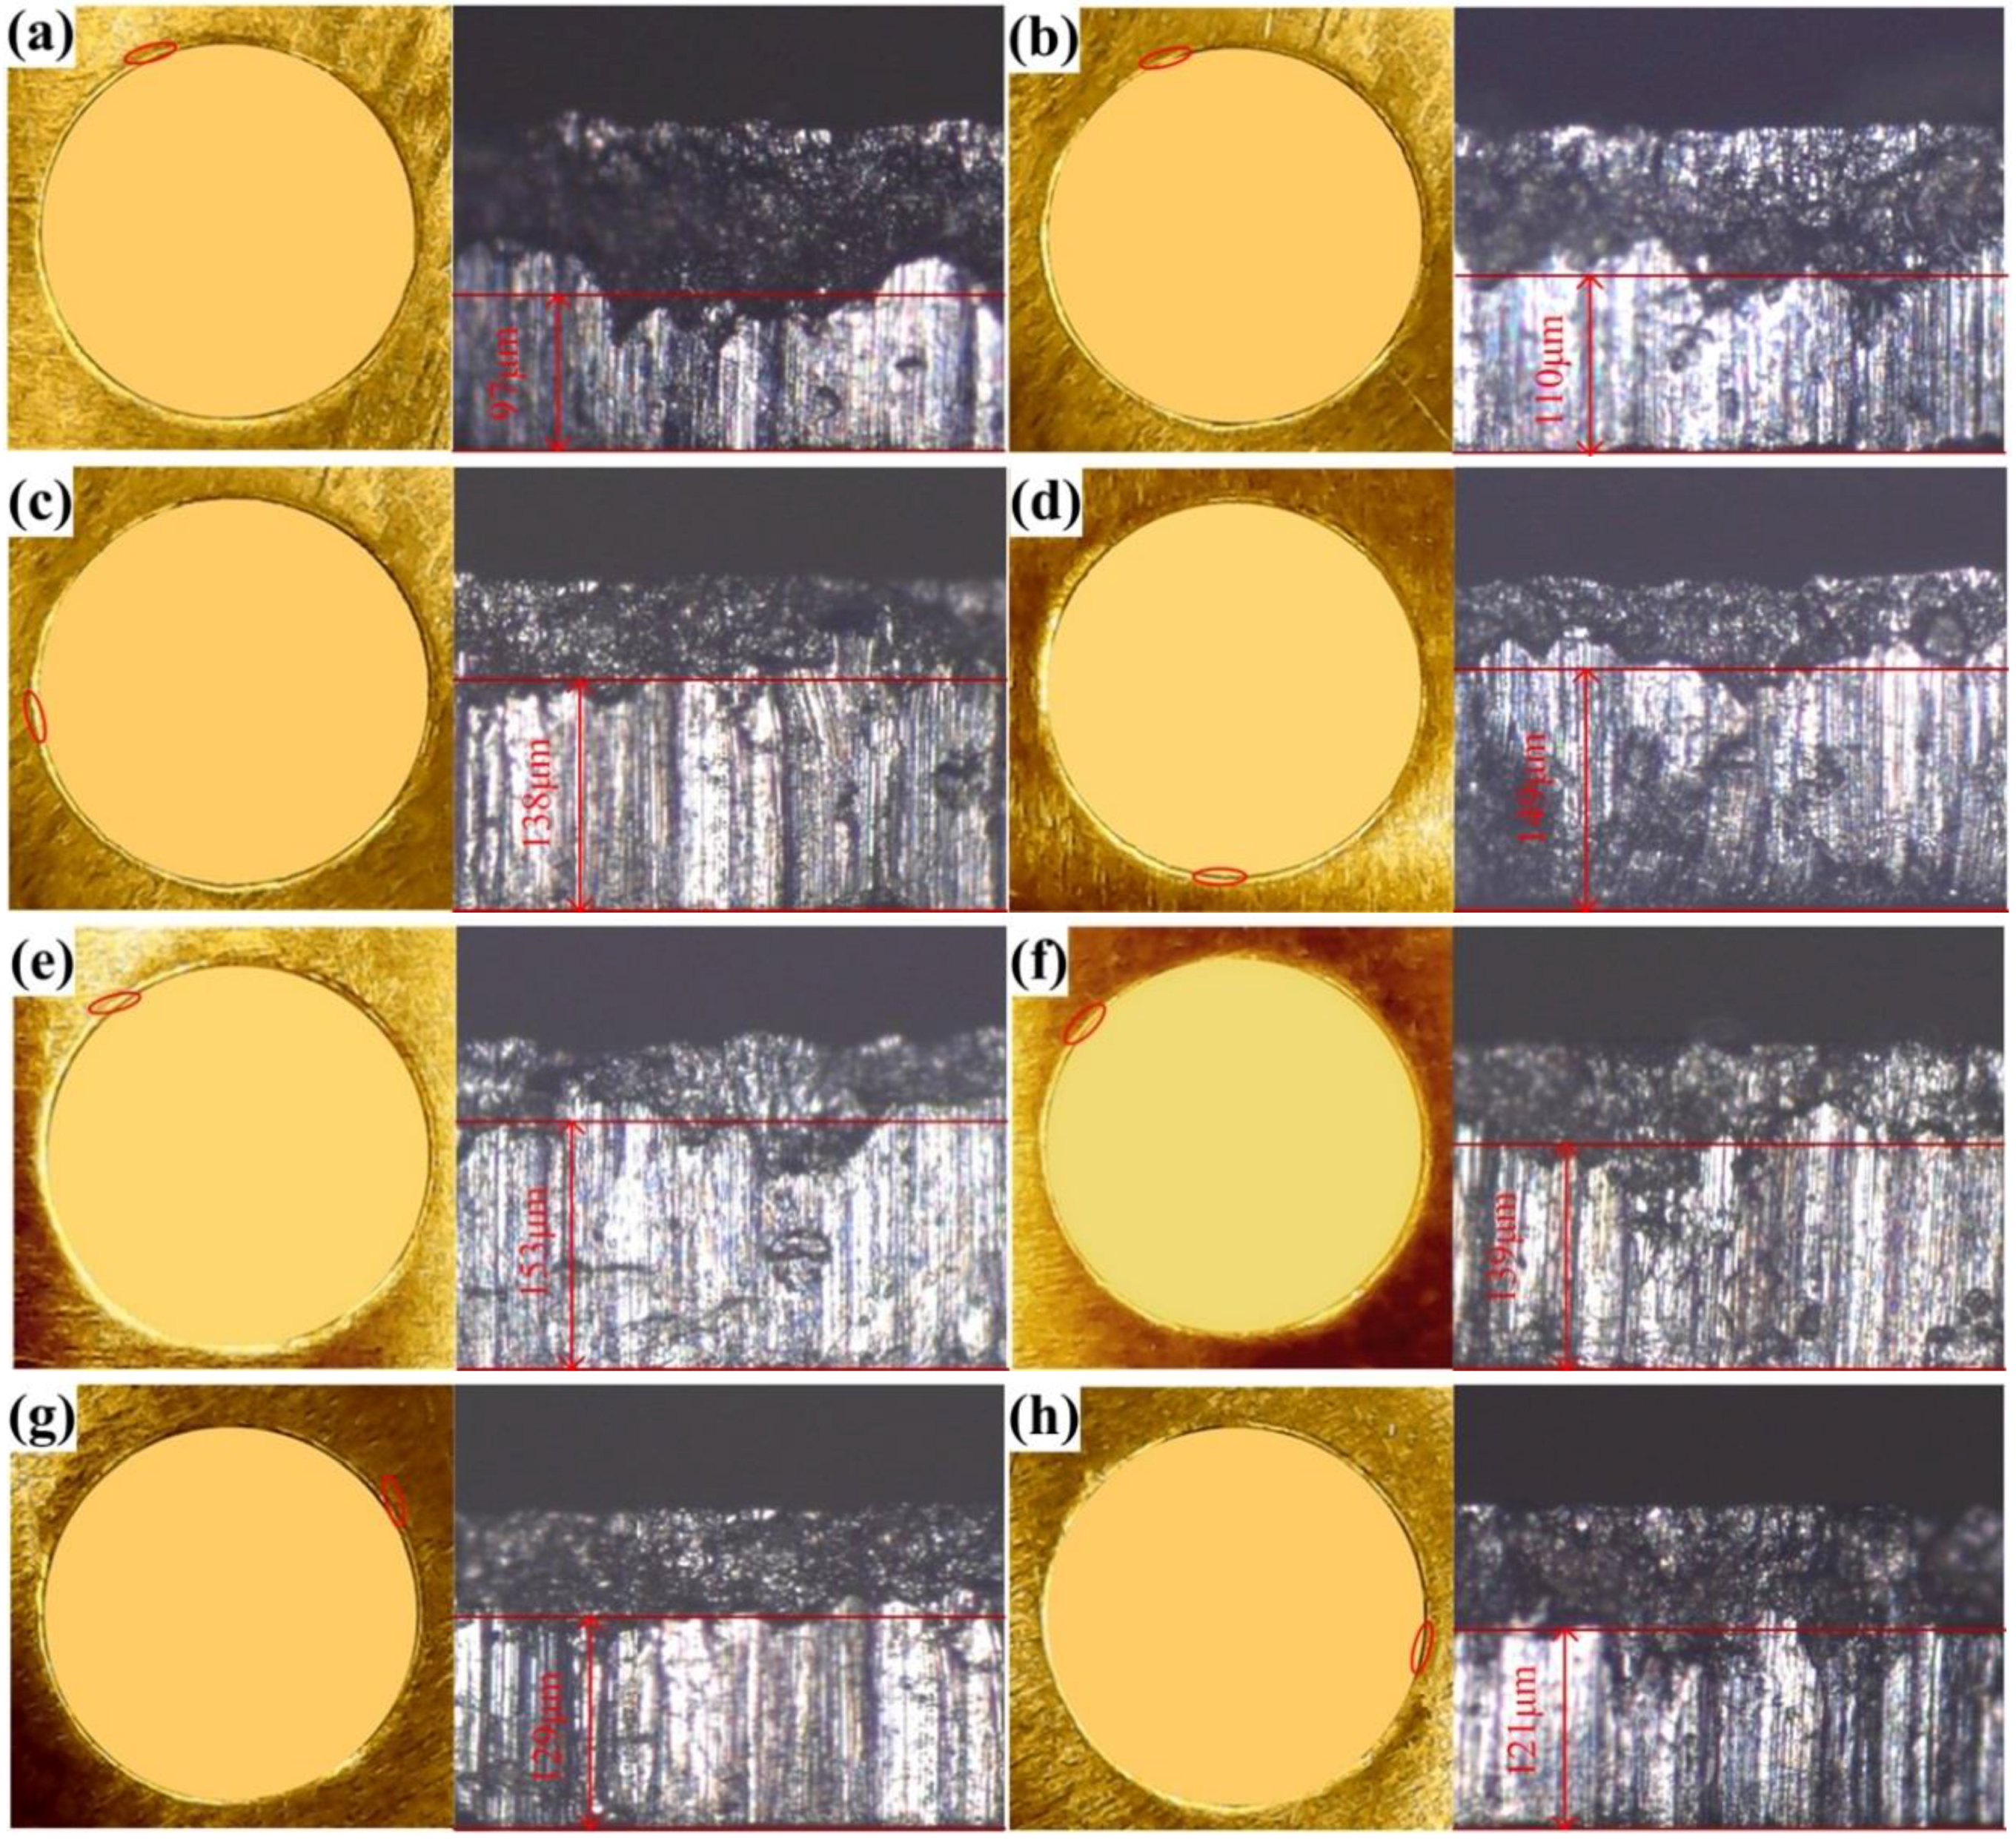
It is recognized that the smooth zone is employed to evaluate the quality of the cross-section, and the smooth zone of the cross-section by punch shearing on the different positions are shown in Figure 9. It can be seen from Figure 9a–e that the heights of smooth zone are increased from 97 µm to 153 µm after the treatments from AT to ACT3. It is noted that with the increase of CT time from ACT3 to ACT6, the heights of the smooth zone decreases from 153 µm to 121 µm. This implies that, after ACT3, the smooth zone is better than the others.
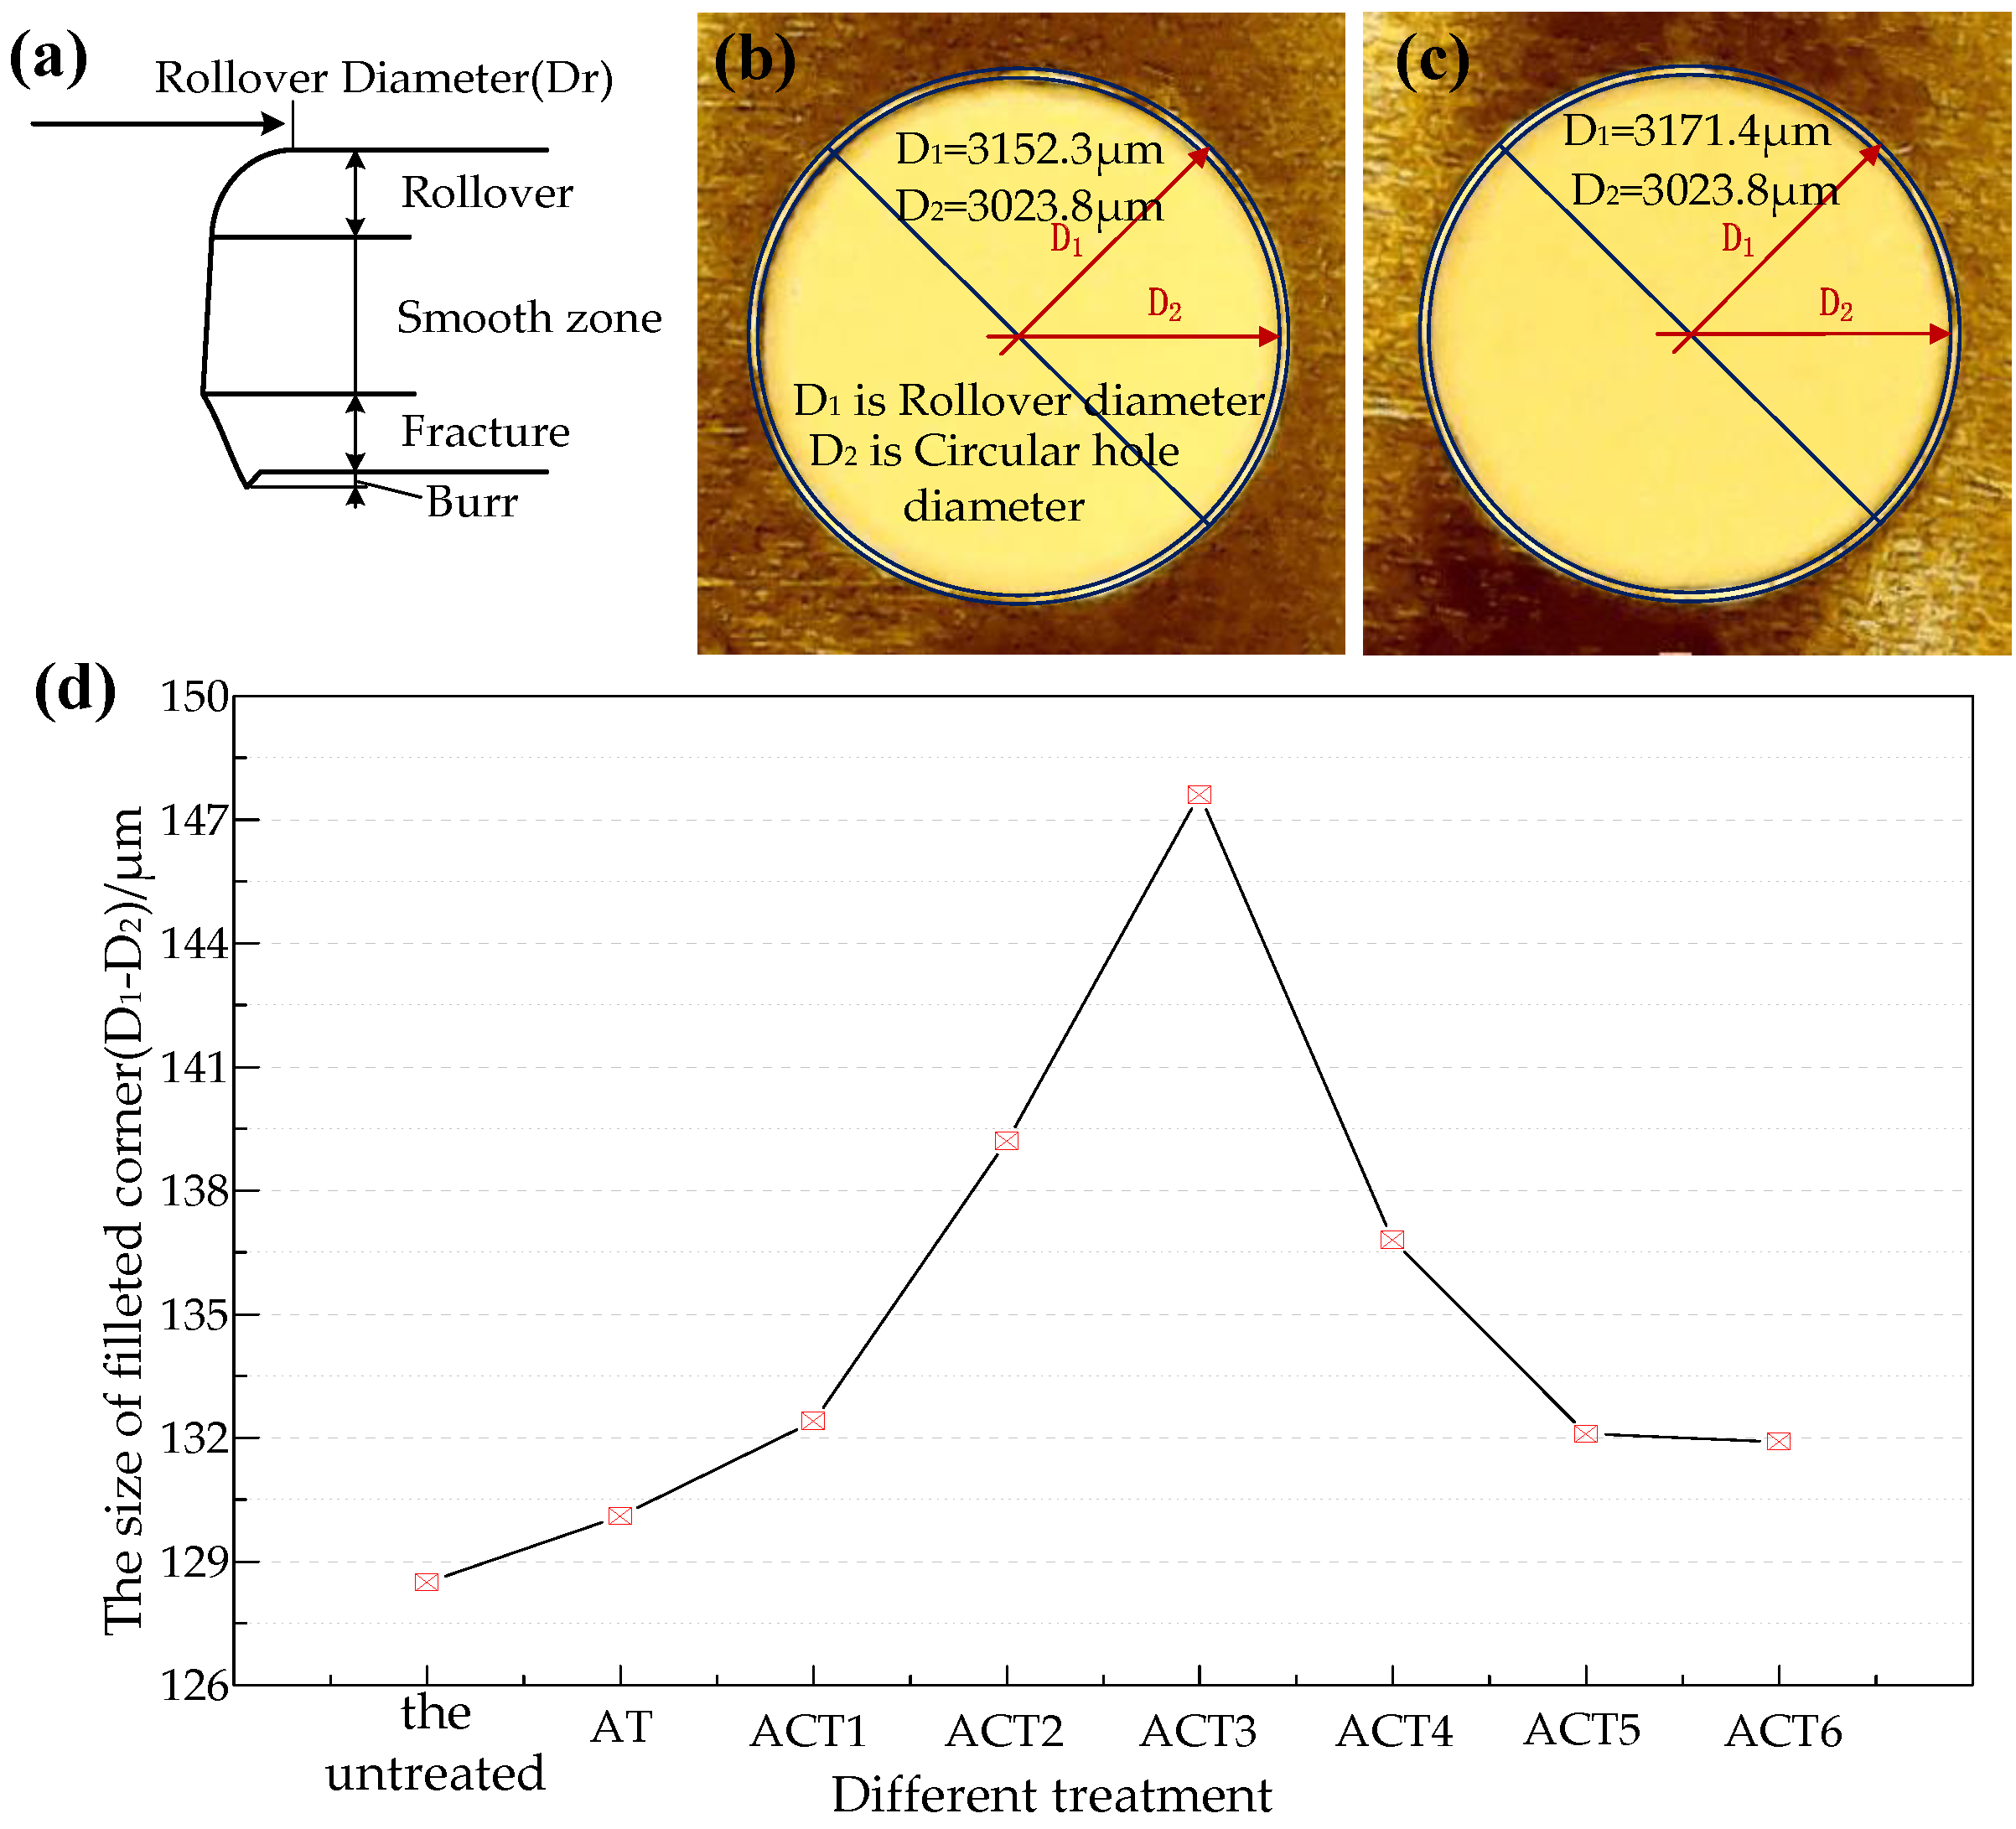
Since the rollover is also one of the characteristics to evaluate the quality of punch shearing, it is essential to be investigated. Figure 10 shows the change in the rollover. It can be seen from Figure 10 that the rollover diameters are increased with the increase of CT time. When the CT time reaches ACT3 (12 h), the peak value of the rollover diameter reaches 148 µm, and then the rollover diameters start to decrease from ACT3 to ACT6. Overall, the rollover diameters are greater than those untreated. The main reason could be that the strength of the Ti-6Al-4V alloy was decreased and the ductility was increased after ACT.
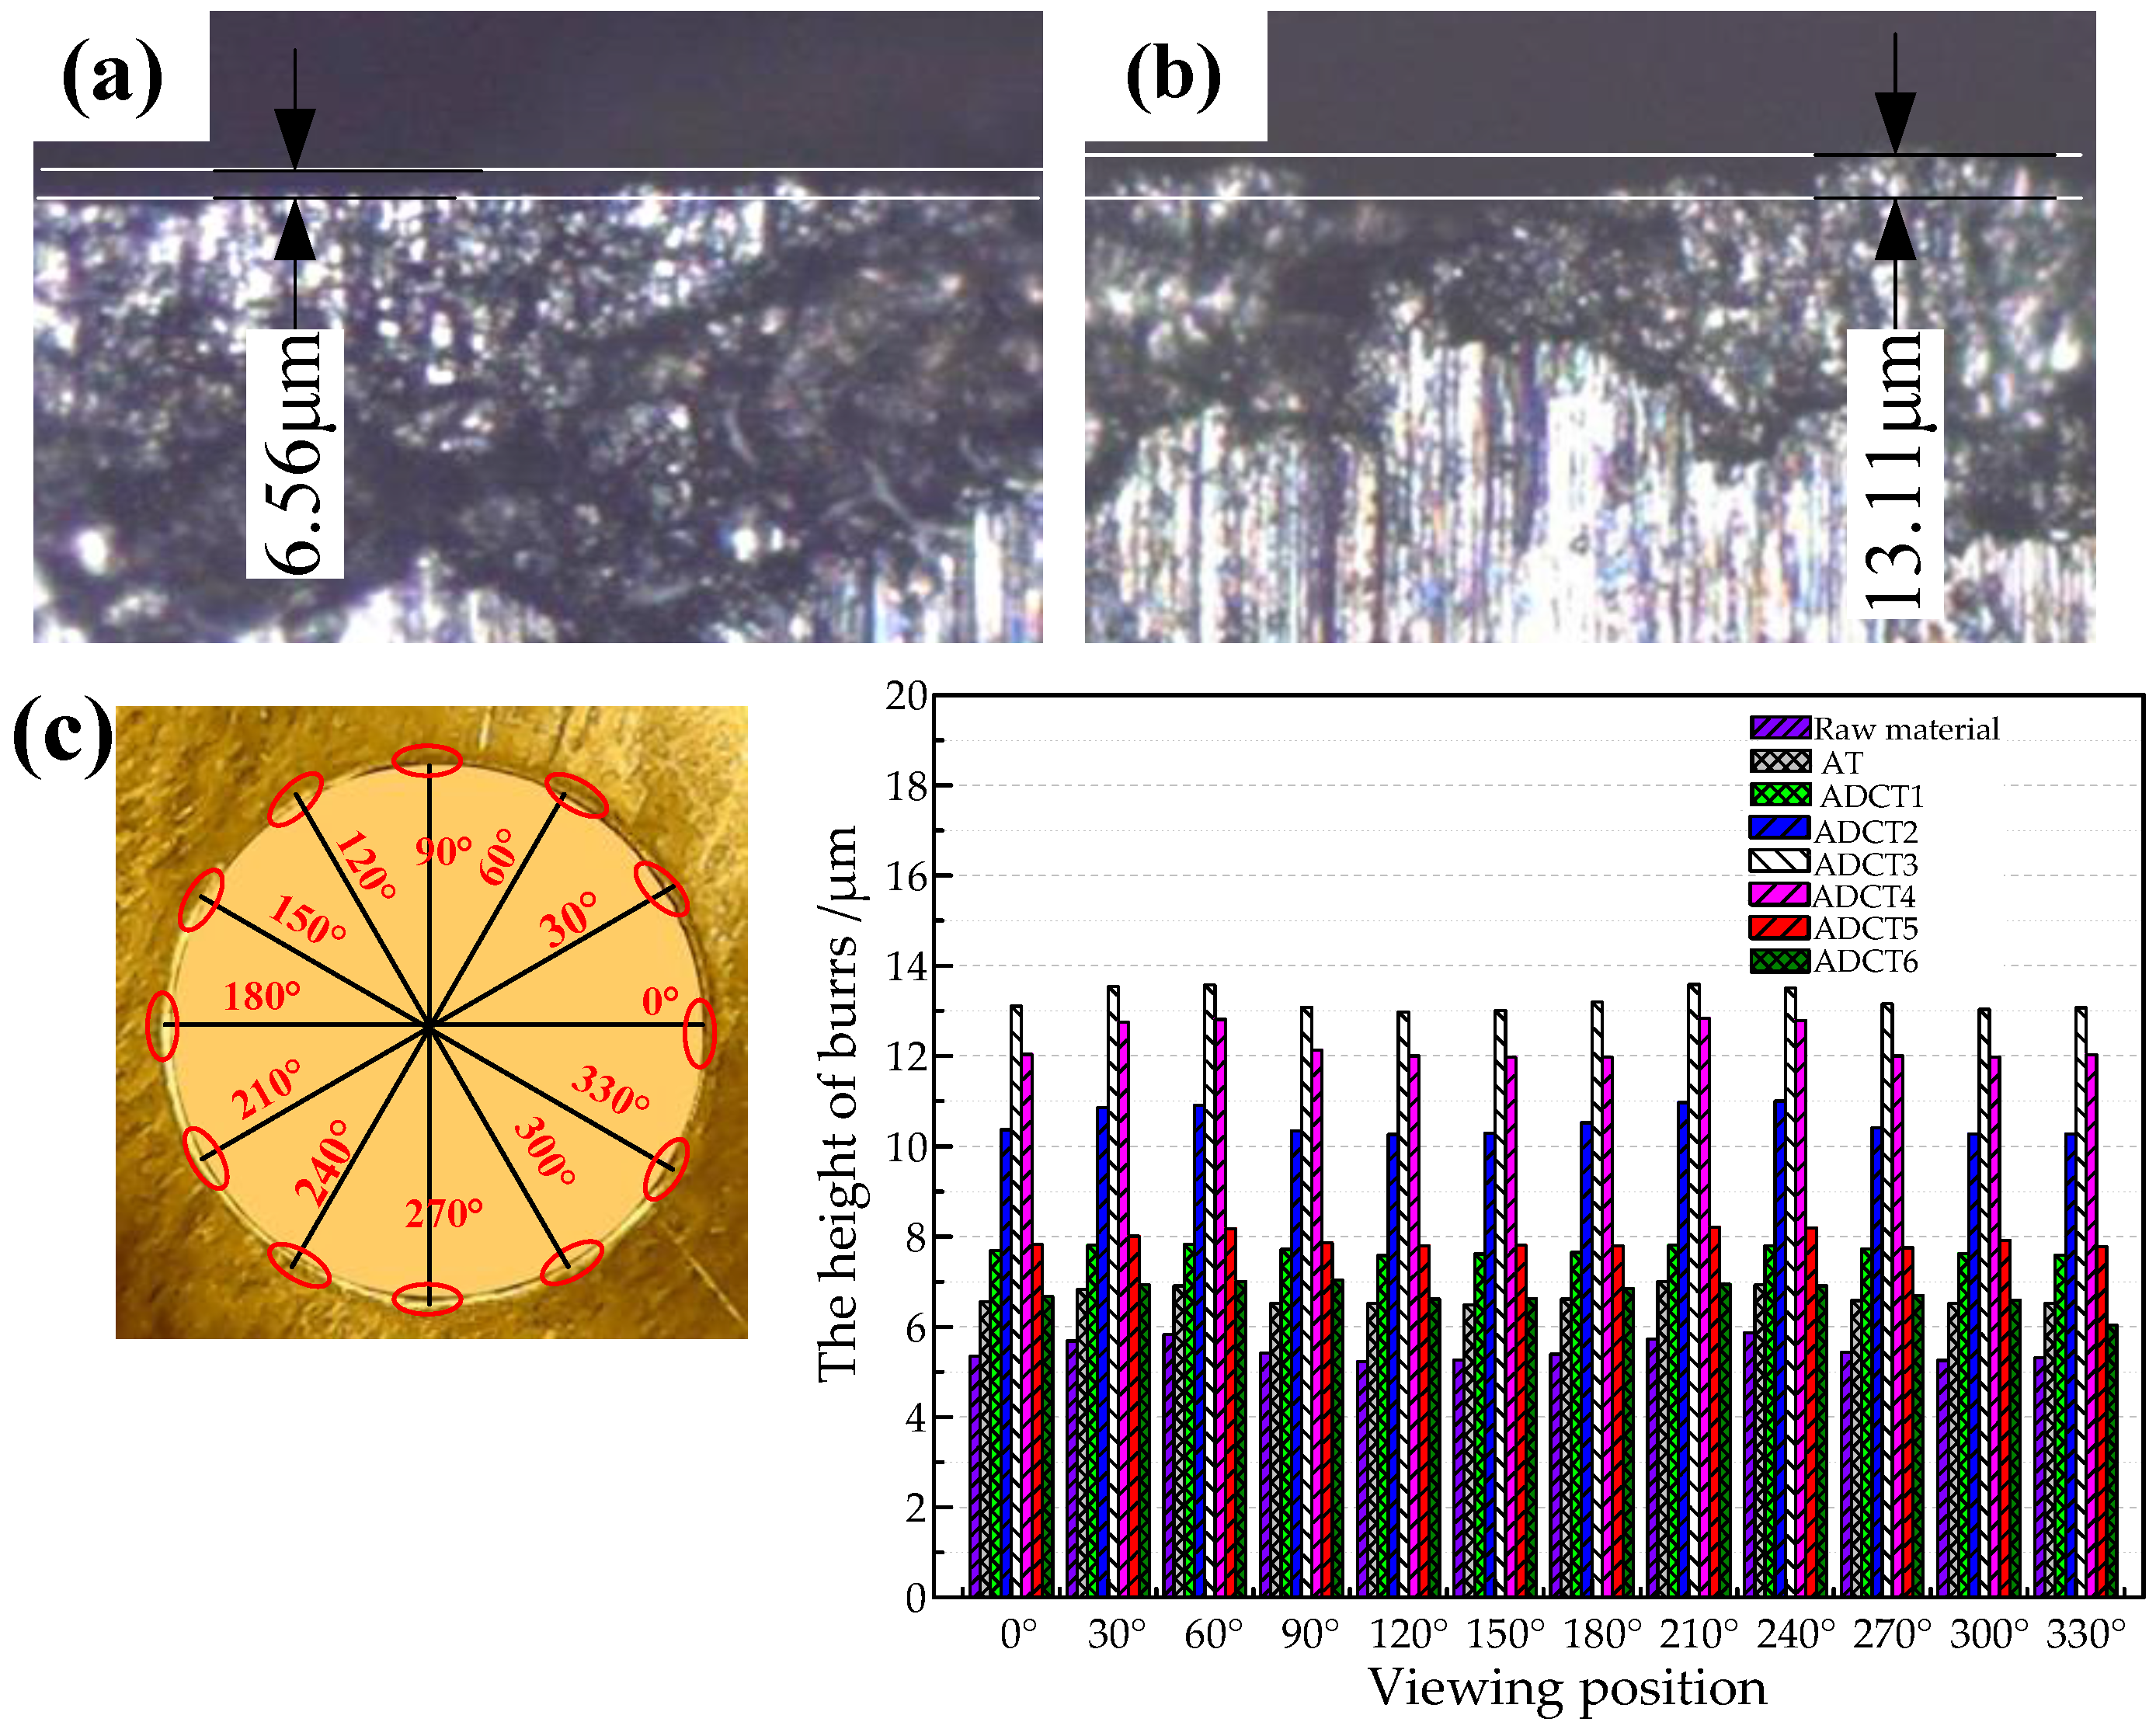
The burr is also one of the important characteristics during punch shearing. In order to understand the effect of ACT on punch shearing in detail, the changes in the burrs are measured, as are shown in Figure 11. The measured results of the heights of burrs are shown in Figure 11a,b, whereas the measured positions are shown in Figure 11c and the changes in the burrs are shown in Figure 11d. It can be seen from Figure 11d that the heights of burrs are increased after AT and ACT comparing to the untreated. From ACT1 to ACT3, the heights of burrs increase continuously, and the whole heights of burrs after ACT3 are maximum. Afterward, the heights of burrs are decreased gradually from ACT3 to ACT6. It is concluded that both AT and ACT show disadvantages for punch shearing, but the difference of the height of the burr is small, and the effect of ACT on punch shearing is very small.
3.4. Deep Drawing
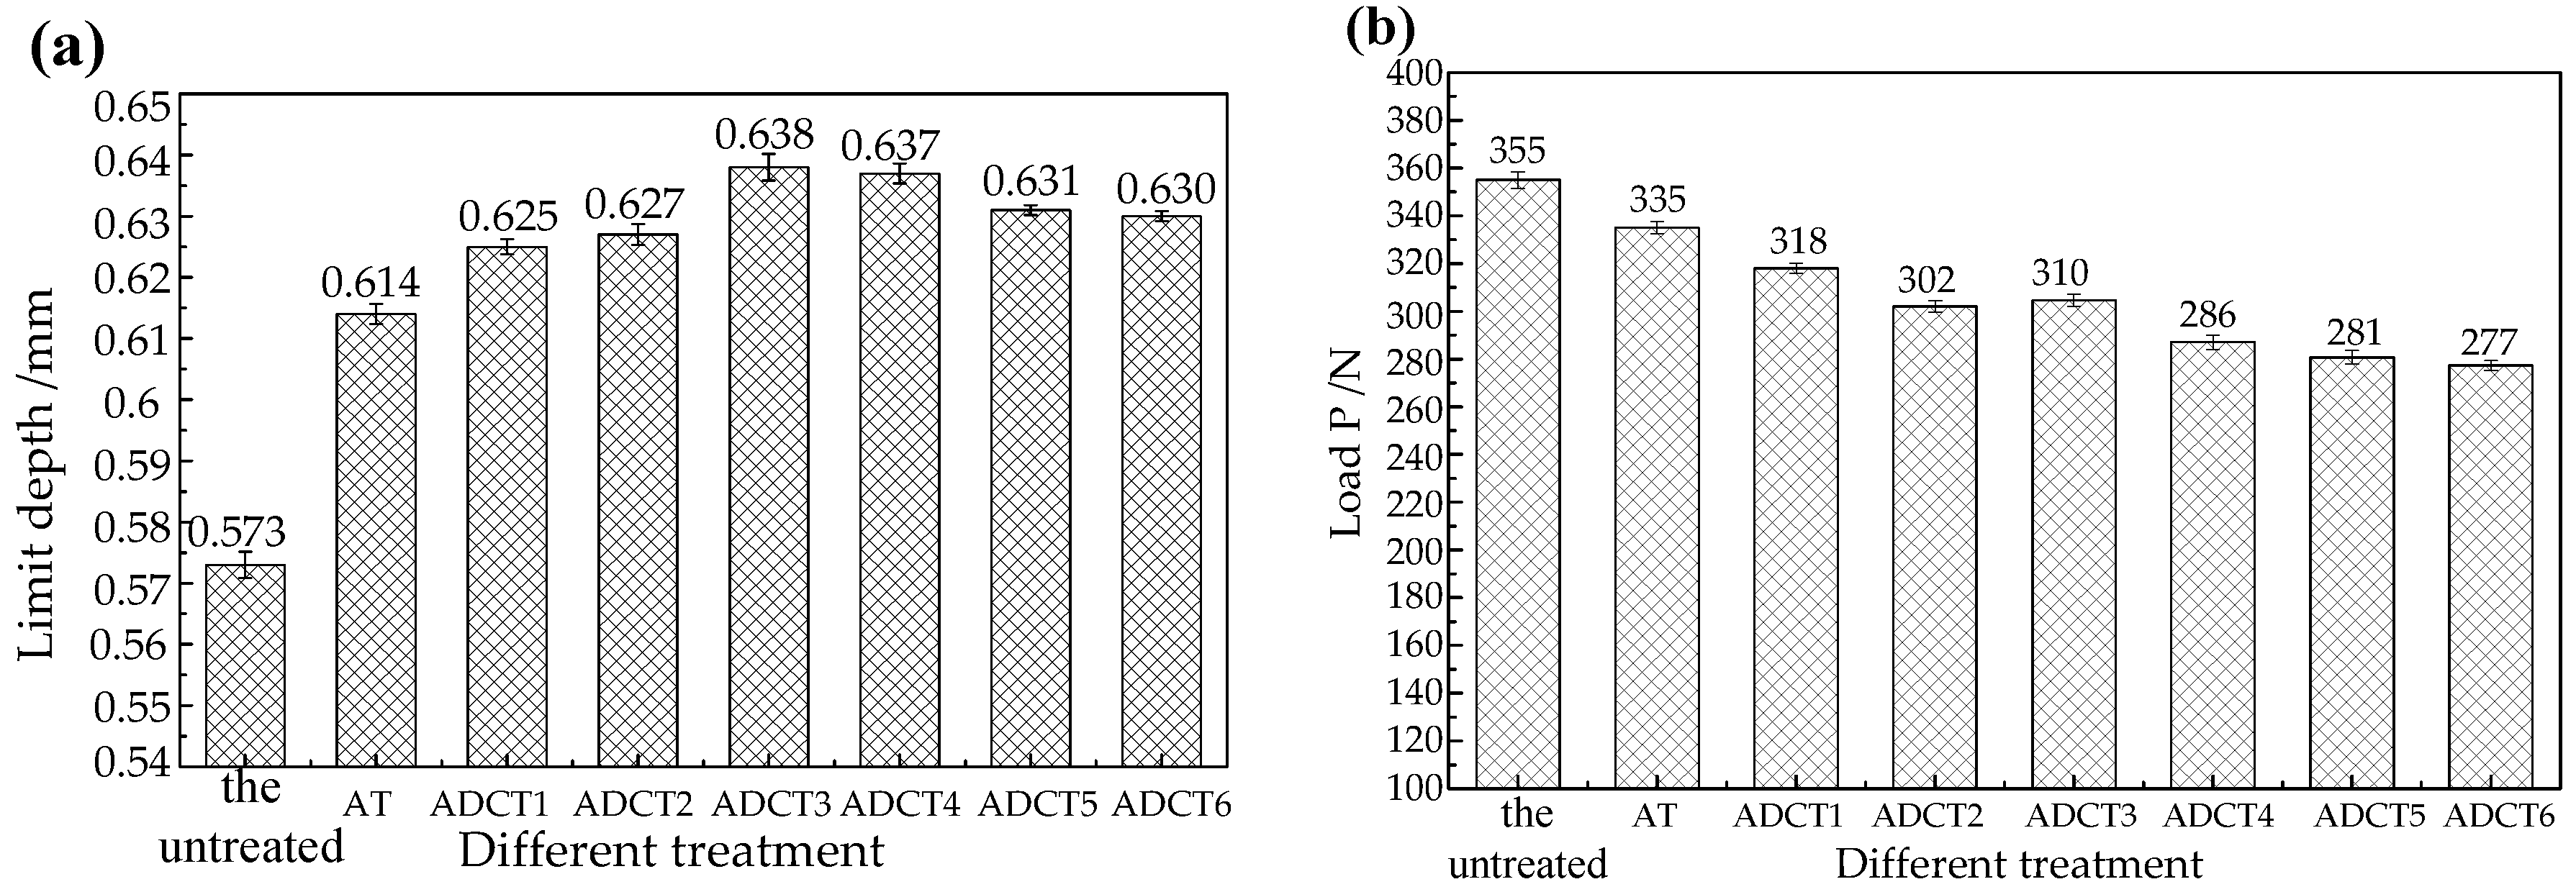
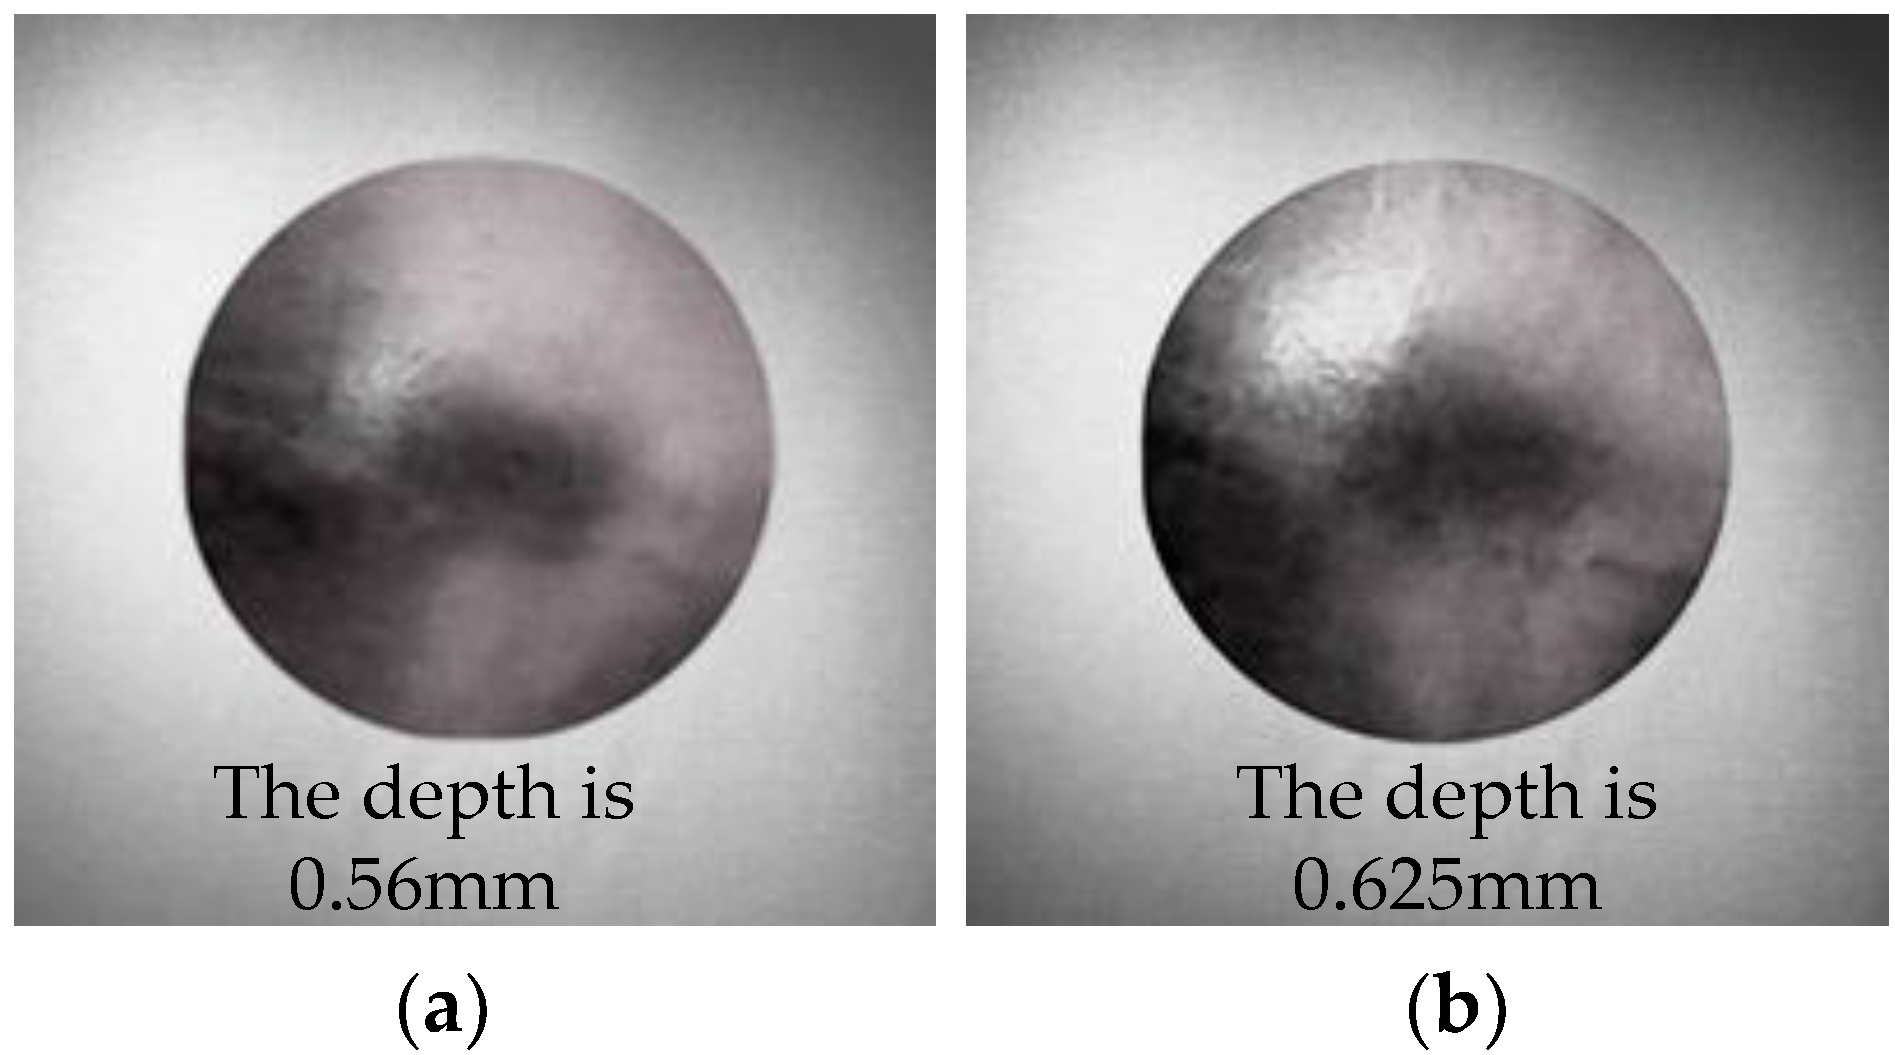
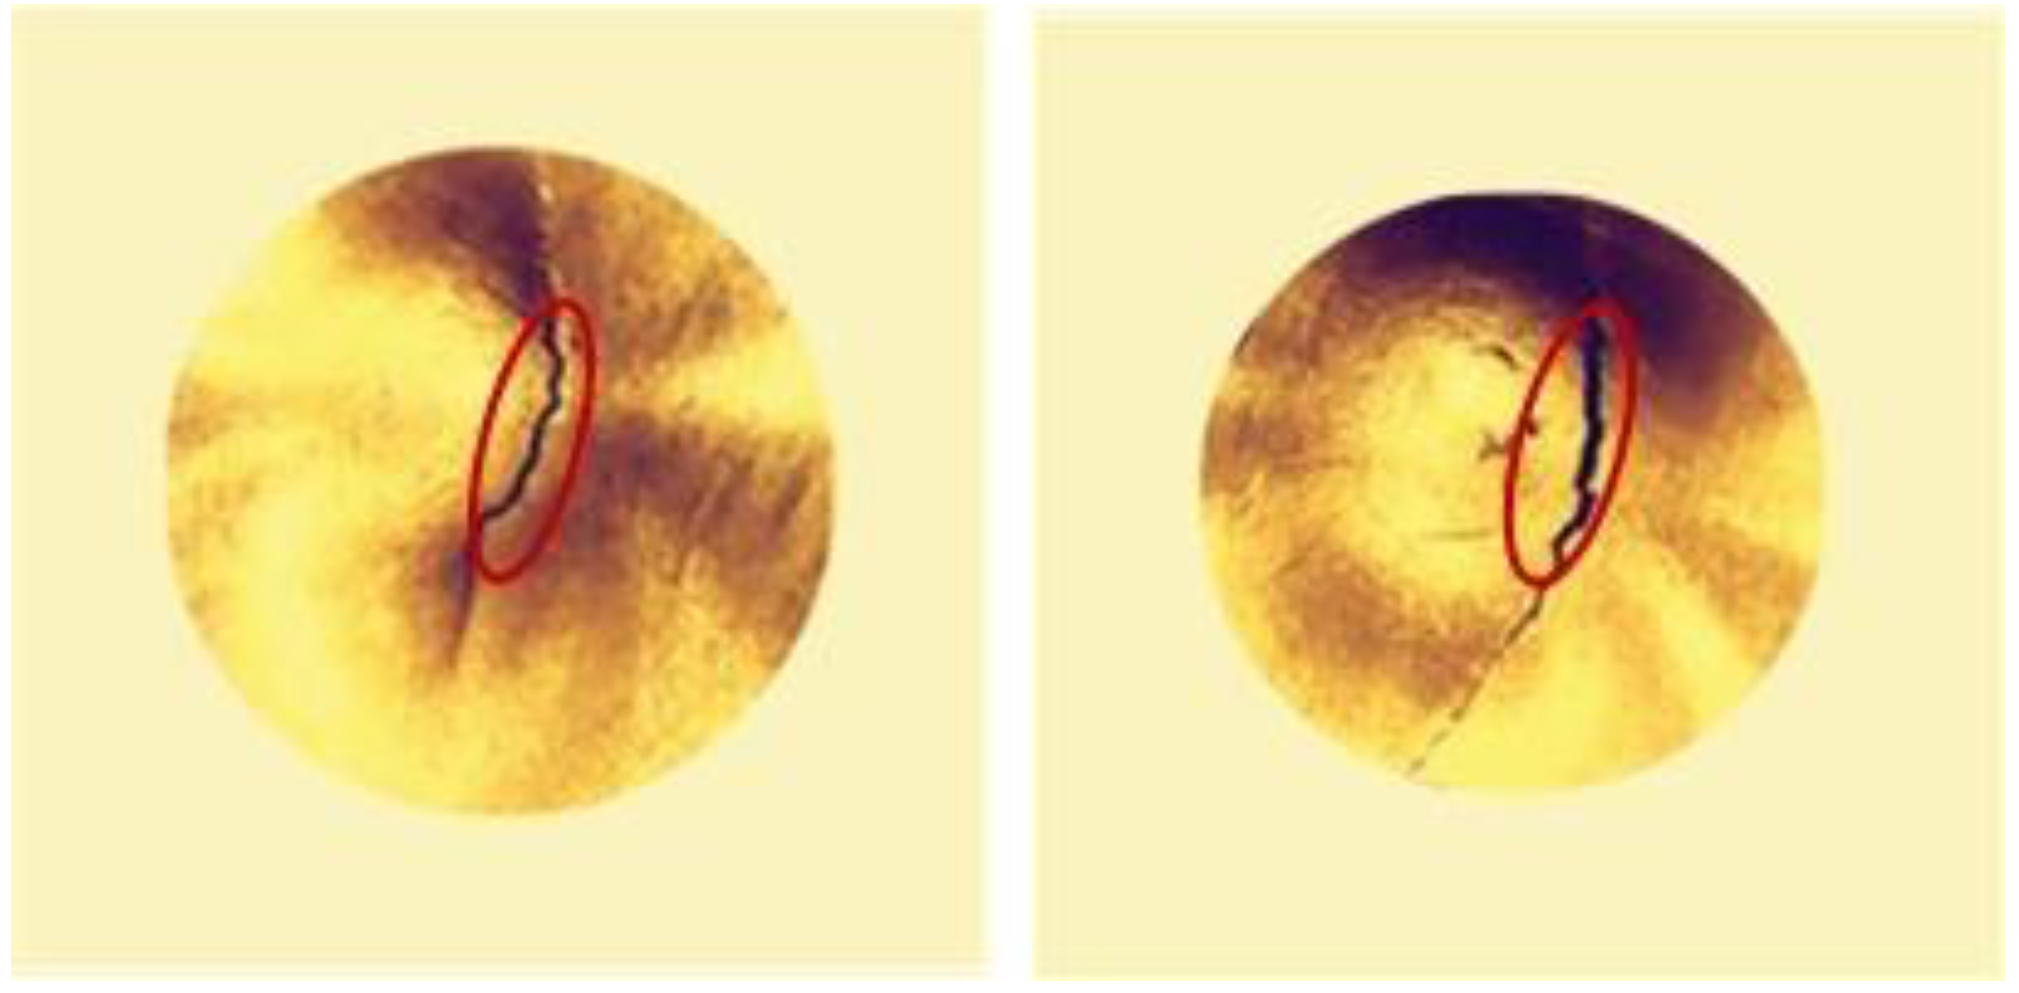
In the current work, in order to further investigate the effects of ACT on the material, deep drawing was carried out at room temperature. Figure 12 demonstrates the drawing depth and drawing load at room temperature. As shown in Figure 12a, the drawing depth of the untreated material is 0.573 mm, while the drawing depth increases to 0.614 mm after AT. The drawing depth gradually increases and then the peak value of 0.638 mm is achieved at ACT3 (12 h). The drawing depth then begins to decrease from ACT3 to ACT6, but the drawing depth values are all greater than those of untreated material. It can also be seen from Figure 12b that the drawing load after AT or ACT decrease compared to untreated material. However, with the increase of CT time, the decreasing trend of the drawing load slows down. This can be explained by the fact that both the yield strength and tensile strength decrease after ACT as described above, which result in the drawing load decreased. Meanwhile, after ACT, the values of ductility are increased, which result in the drawing depth is increased. The images of the samples are shown in Figure 13. Some samples with micro-cracks are shown in Figure 14. It can be seen from Figure 14 that the micro-cracks occur at the bottom of the samples. For those untreated samples, the micro-cracks occur when the displacement of the punch is 0.573 mm and the load is 355 N. After ACT3, the displacement increases to 0.638 mm, while the load is reduced to 310 N compared to the untreated.
In the present work, the β phases (in the untreated material) were changed into new α‘ and β’ phases through ACT, resulting in the decrease of the amount of β phase in the microstructure, which played an important role in the formability of Ti-6Al-4V. A lower amount of β phases indicates a better plastic performance of Ti-6Al-4V alloy. However, deeper insight into the effect of the detailed changes of the β phase on formability requires further study.
4. Conclusions
In this paper, the effects of ACT on the formability of Ti-6Al-4V alloy were experimentally studied. Major findings based on the experimental results are drawn as follows:
- (1)
- The ACT has a positive effect on the microstructure. After AT, the original β phases will be changed into stable β’ phases and α’ phase, and the refined grains begin to appear. After ACT, the grains are further refined, and the tendency of the β phase being changed into stable β’ and α’ phases is apparent. This is in favor of increasing the plasticity of the Ti-6Al-4V alloy.
- (2)
- After AT or ACT, the elastic modulus is lower than those of untreated. AT or ACT has a positive effect on the tensile strength and yield strength, and the decreasing trend is obvious. The ductility initially increases and then decreases, and ACT has little effect on the hardness of the alloy.
- (3)
- After AT and ACT, the shear strength in punch shearing is decreased both at room and cryogenic temperatures. Moreover, the shear strength at room temperature is lower than that at cryogenic temperature, and the decreasing tendency of the shear strength at room temperature is more obvious.
- (4)
- The smooth zone is much better than those of untreated material after AT, and the best result is obtained after ACT3. The rollover diameters are bigger than those of the untreated, and with the increase of CT time, the heights of burrs showed a decreasing trend. However, the variations of the rollover diameters and the heights of burrs are small.
- (5)
- The drawing depth is deeper than the untreated material, and the drawing load after AT or ACT is reduced compared to that of the untreated. However, with the increase of CT time, the decreasing trend of the drawing load slows down.
Author Contributions
Z.H. and H.Z. conceived and designed the experiments; H.Z. performed the experiments; Z.H. and H.Z. analyzed the data; G.L. contributed experimental equipment; Z.H. wrote the paper; and H.W. polished the writing and grammar.
Funding
This research received no external funding.
Acknowledgments
This research is funded by the NSFC (grant numbers 51275201 and 51311130129) and the Jilin Key Scientific and Technological Project (20140204062GX), and the author is grateful to those funds.
Conflicts of Interest
The authors declare no conflict of interest.
References
- Luo, S.D.; Qian, M. Microwave processing of titanium and titanium alloys for structural, biomedical and shape memory applications: Current status and challenges. Mater. Manuf. Process. 2018, 33, 35–49. [Google Scholar] [CrossRef]
- Collings, E.W. The Physical Metallurgy of Ti Alloys; ASM: Metals Park, OH, USA, 1984; pp. 66–70. [Google Scholar]
- Barron, R.F. Cryogenic treatment of metals to improve wear resistance. Cryogenics 1982, 22, 409–413. [Google Scholar] [CrossRef]
- Gulyaev, A.P. Improved methods of heat treating high speed steels to improve the cutting properties. Metallurgy 1937, 12, 65. [Google Scholar]
- Amini, K.; Nategh, S.; Shafyei, A. Effect of deep cryogenic treatment on the properties of 80CrMo12 5 tool steel. Mater. Des. 2012, 19, 30–37. [Google Scholar] [CrossRef]
- Amini, K.; Akhbarizadeh, A.; Javadpour, S. Effect of deep cryogenic treatment on the formation of nano-sized carbides and the wear behavior of D2 tool steel. Metall. Mater. 2012, 19, 795–799. [Google Scholar] [CrossRef]
- Gao, Y.; Luo, B.H.; Bai, Z.H.; Zhu, B. Effects of deep cryogenic treatment on the microstructure and properties of WC–Fe–Ni cemented carbides. Met. Hard Mater. 2016, 58, 42–50. [Google Scholar] [CrossRef]
- Pérez, M.; Belzunce, F.J. The effect of deep cryogenic treatments on the mechanical properties of an AISIH13 steel, University of Oviedo. Mater. Des. A 2015, 624, 32–40. [Google Scholar]
- Jiang, Y.; Chen, D.; Chen, Z.H.; Liu, J.W. Effect of Cryogenic Treatment on the Microstructure and Mechanical Properties of AZ31 Magnesium Alloy. Adv. Mater. Res. 2010, 25, 837–841. [Google Scholar] [CrossRef]
- Li, J.; Jiang, X.Q. Effect of Cryogenic Treatment on the Microstructure and Mechanical Properties of AZ31 Magnesium Alloy. In Materials Science Forum; Trans Tech Publications: Zürich, Switzerland, 2011; Volume 686, pp. 53–56. [Google Scholar]
- Yu, B.Y.; Luo, Q.Q.; Li, Y.; Wu, Y.J.; Li, R.X. Effects of solution and cryogenic treatments on microstructures and mechanical properties of AZ31 alloy tubes. Adv. Mater. Res. 2013, 750–752, 760–764. [Google Scholar] [CrossRef]
- Liu, Y.; Shao, S.; Xu, C.S.; Zeng, X.S.; Yang, X.J. Effect of cryogenic treatment on the microstructure and mechanical properties of Mg–1.5Zn–0.15Gd magnesium alloy. Mater. Sci. Eng. A 2013, 588, 76–81. [Google Scholar] [CrossRef]
- Li, G.R.; Wang, H.M.; Cai, Y. Microstructure and mechanical properties of AZ91 magnesium alloy subject to deep cryogenic treatments. Metall. Mater. 2013, 20, 896–901. [Google Scholar] [CrossRef]
- Gu, K.X.; Zhang, H.; Zhao, B.; Wang, J.J.; Zhou, Y.; Li, Z.Q. Effect of cryogenic treatment and aging treatment on the tensile properties and microstructure of Ti-6Al-4V alloy. Mater. Sci. Eng. A 2013, 584, 170–176. [Google Scholar] [CrossRef]
- Zhou, J.Z.; Xu, S.Q.; Huang, S.; Meng, X.K. Tensile Properties and Microstructures of a 2024-T351 Aluminum Alloy Subjected to Cryogenic Treatment. Metals 2016, 6, 279. [Google Scholar] [CrossRef]
- Zhang, W.D.; Bai, P.K.; Yang, J.; Xu, H.; Dang, J.Z.; Du, Z.M. Tensile behavior of 3104 aluminum alloy processed by homogenization and cryogenic treatment. Trans. Nonferrous Met. Soc. China 2014, 24, 2453–2458. [Google Scholar] [CrossRef]
- Araghchi, M.; Mansouri, H.; Vafaei, R.; Guo, Y. A novel cryogenic treatment for reduction of residual stresses in 2024 aluminum alloy. Mater. Sci. Eng. A 2017, 689, 48–52. [Google Scholar] [CrossRef]
- Vidyarthi, M.K.; Ghose, A.K.; Chakrabarty, I. Effect of deep cryogenic treatment on the microstructure and wear performance of Cr–Mn–Cu white cast iron grinding media. Cryogenics 2013, 58, 85–92. [Google Scholar] [CrossRef]
- Kim, J.W.; Griggs, J.A.; Regan, J.D.; Ellis, R.A.; Cai, Z. Effect of cryogenic treatment on nickel–titanium endodontic instruments. Int. Endod. J. 2005, 38, 364–371. [Google Scholar] [CrossRef] [PubMed]
- Gu, K.X.; Wang, J.J.; Zhou, Y. Effect of cryogenic treatment on wear resistance of Ti-6Al-4V alloy for biomedical applications. J. Mech. Behav. Biomed. 2014, 30, 131–139. [Google Scholar] [CrossRef] [PubMed]
- Yumak, N.; Aslantas, K.; Pekbey, Y. Effect of cryogenic and aging treatments on low-energy impact behaviors of Ti-6Al-4V alloy. Trans. Nonferrous Met. Soc. China 2017, 27, 514–526. [Google Scholar] [CrossRef]
- Veenaas, S.; Behrens, G.; Kröger, K.; Vollertsen, F. Determination of forming limit diagrams for thin foil materials based on scaled Nakajima test. Appl. Mech. Mater. 2015, 794, 190–198. [Google Scholar] [CrossRef]
- Zhang, S.Y.; Ma, S.; Wang, Z.H. Research on forming limit stress of cold-rolling deep-drawing sheet. Heavy Mach. 2012, 2, 20–24. (In Chinese) [Google Scholar]
- Chen, J.S. Effect of Cryogenic Treatment on Industrial Titanium and TC4 Alloy; Hunan University: Changsha, China, 2011. (In Chinese) [Google Scholar]
- Zhao, Z.; Zhang, M.; Wei, X. Study of influence of blanking velocity on section quality of stamping work-piece. J. Plast. Eng. 2010, 17, 45–49. [Google Scholar]
- Gu, K.X.; Li, Z.Q.; Wang, J.J. The effects of cryogenic treatment on the microstructure and properties of Ti-6Al-4V titanium alloy. In Materials Science Forum; Trans Tech Publications: Zürich, Switzerland, 2013; pp. 899–903. [Google Scholar]
Figure 1.
(a) QTF-1200X vacuum tube furnace; and (b) the annealed samples for punch shearing tests.

Figure 2.
Tensile sample and stress and strain curves under different treatment (a) the tensile sample (unit: mm); and (b) stress-strain curves under different treatment.
Figure 2.
Tensile sample and stress and strain curves under different treatment (a) the tensile sample (unit: mm); and (b) stress-strain curves under different treatment.

Figure 3.
(a) Principle of punch shearing; (b) the punching process; (c) at cryogenic temperature punching; and (d) the punch and die.
Figure 3.
(a) Principle of punch shearing; (b) the punching process; (c) at cryogenic temperature punching; and (d) the punch and die.

Figure 4.
(a) The principle of deep drawing; and (b) the punch and die.

Figure 5.
Microstructure of Ti-6Al-4V with different the treatment: (a) AT, 500×; (b) AT, 1000×; (c) ACT1, 500×; (d) ACT1, 1000×; (e) ACT2, 500×; (f) ACT2, 1000×; (g) ACT3, 500×; (h) ACT3, 1000×; (i) ACT4, 500×; (j) ACT4, 1000×; (k) ACT5, 500×; (l) ACT5, 1000×; (m) ACT6, 500×; (n) ACT6, 1000×.
Figure 5.
Microstructure of Ti-6Al-4V with different the treatment: (a) AT, 500×; (b) AT, 1000×; (c) ACT1, 500×; (d) ACT1, 1000×; (e) ACT2, 500×; (f) ACT2, 1000×; (g) ACT3, 500×; (h) ACT3, 1000×; (i) ACT4, 500×; (j) ACT4, 1000×; (k) ACT5, 500×; (l) ACT5, 1000×; (m) ACT6, 500×; (n) ACT6, 1000×.


Figure 6.
Changes of tensile test: (a) elastic modulus; (b) tensile strength; (c) yield strength; (d) ductility.
Figure 6.
Changes of tensile test: (a) elastic modulus; (b) tensile strength; (c) yield strength; (d) ductility.

Figure 7.
Variation of Vickers hardness with different treatment.

Figure 8.
Shear strength at room and cryogenic temperature: (a) averaged shear strength at room temperature; (b) the averaged shear strength at cryogenic temperature; and (c) the comparison of shear strength.
Figure 8.
Shear strength at room and cryogenic temperature: (a) averaged shear strength at room temperature; (b) the averaged shear strength at cryogenic temperature; and (c) the comparison of shear strength.

Figure 9.
Diagrams of blanking fracture surface: (a) untreated; (b) AT; (c) ACT1; (d) ACT2; (e) ACT3; (f) ACT4; (g) ACT5; and (h) ACT6.
Figure 9.
Diagrams of blanking fracture surface: (a) untreated; (b) AT; (c) ACT1; (d) ACT2; (e) ACT3; (f) ACT4; (g) ACT5; and (h) ACT6.

Figure 10.
Rollover diameter of the specimens: (a) untreated; (b,c) example of measured results; and (d) changes in rollover diameters.
Figure 10.
Rollover diameter of the specimens: (a) untreated; (b,c) example of measured results; and (d) changes in rollover diameters.

Figure 11.
Change of the burrs: (a,b) example of measured results; (c) measured position and changes in the heights of burrs.
Figure 11.
Change of the burrs: (a,b) example of measured results; (c) measured position and changes in the heights of burrs.

Figure 12.
Results of deep drawing tests: (a) averaged limit depth; and (b) averaged load.

Figure 13.
Drawing deep samples (a) untreated material; and (b) ADCT3.

Figure 14.
Micro-cracks on the samples when the crack appears at the bottom of the samples.


Table 1.
Chemical compositions of Ti-6Al-4V titanium alloy (wt%).
| Ti | Al | V | Fe | C | N | H | O | Others |
|---|---|---|---|---|---|---|---|---|
| 89.1755 | 6.14 | 4.07 | 0.075 | 0.016 | 0.022 | 0.0015 | 0.1 | 0.4 |
Table 2.
Treatment groups.
| Group Index | Treatment Method | CT Time |
|---|---|---|
| AT | Annealed | - |
| ACT1 | Annealed | −196 × 4 h |
| ACT2 | Annealed | −196 × 8 h |
| ACT3 | Annealed | −196 × 12 h |
| ACT4 | Annealed | −196 × 16 h |
| ACT5 | Annealed | −196 × 20 h |
| ACT6 | Annealed | −196 × 24 h |
Table 3.
Test samples for punch shearing tests.
| Number at Diff. Temp. | the Untreated | AT | ACT1 | ACT2 | ACT3 | ACT4 | ACT5 | ACT6 | |
|---|---|---|---|---|---|---|---|---|---|
| Group Index | |||||||||
| Number at room temp. | 3 | 3 | 3 | 3 | 3 | 3 | 3 | 3 | |
| Number online cryogenic | 3 | 3 | 3 | 3 | 3 | 3 | 3 | 3 | |
Table 4.
Test samples for deep drawing tests.
| Group Index | the Untreated | AT | ACT1 | ACT2 | ACT3 | ACT4 | ACT5 | ACT6 |
|---|---|---|---|---|---|---|---|---|
| Number | 3 | 3 | 3 | 3 | 3 | 3 | 3 | 3 |
© 2018 by the authors. Licensee MDPI, Basel, Switzerland. This article is an open access article distributed under the terms and conditions of the Creative Commons Attribution (CC BY) license (http://creativecommons.org/licenses/by/4.0/).
Share and Cite
MDPI and ACS Style
Hu, Z.; Zheng, H.; Liu, G.; Wu, H. Effects of Cryogenic Treatment after Annealing of Ti-6Al-4V Alloy Sheet on Its Formability at Room Temperature. Metals 2018, 8, 295. https://doi.org/10.3390/met8050295
AMA Style
Hu Z, Zheng H, Liu G, Wu H. Effects of Cryogenic Treatment after Annealing of Ti-6Al-4V Alloy Sheet on Its Formability at Room Temperature. Metals. 2018; 8(5):295. https://doi.org/10.3390/met8050295
Chicago/Turabian StyleHu, Zhiqing, Huihui Zheng, Guojun Liu, and Hongwei Wu. 2018. "Effects of Cryogenic Treatment after Annealing of Ti-6Al-4V Alloy Sheet on Its Formability at Room Temperature" Metals 8, no. 5: 295. https://doi.org/10.3390/met8050295
Note that from the first issue of 2016, this journal uses article numbers instead of page numbers. See further details here.