A Study on the Nanoparticles Evolution in Isothermally Aged Strain Glass of Ti48.7Ni51.3 Shape Memory Alloy by In Situ Small-Angle X-ray Scattering

1
Department of Materials Science and Engineering, National Taiwan University, Taipei 106, Taiwan
2
Nuclear Fuel and Materials Division, Institute of Nuclear Energy Research, Taoyuan 325, Taiwan
3
Department of Mechanical Engineering, National Taiwan University, Taipei 106, Taiwan
*
Author to whom correspondence should be addressed.
Metals 2018, 8(5), 352; https://doi.org/10.3390/met8050352
Submission received: 6 March 2018
/
Revised: 20 April 2018
/
Accepted: 11 May 2018
/
Published: 14 May 2018
(This article belongs to the Special Issue In Situ X-Ray Diffraction on Metals and Alloys)
Abstract
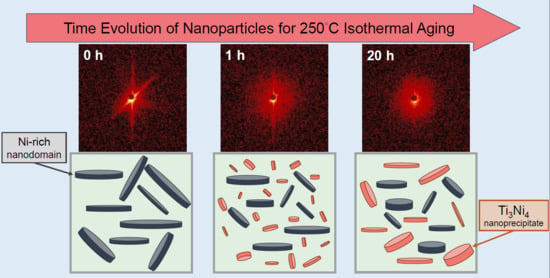
:Ni-rich nanodomains and Ti3Ni4 nanoprecipitates in the strain glass of Ni-rich Ti-Ni shape memory alloys (SMAs) play an important role in the origin and characteristic control of the strain glass transition. Ni-rich nanodomains are formed in the quenching process and dissolve during isothermal aging. Ti3Ni4 nanoprecipitates nucleate, grow and coarsen during aging. This study performed in situ small-angle X-ray scattering (SAXS) and ex situ X-ray diffraction to investigate the structural evolutions with aging time of nanoparticles in Ti48.7Ni51.3 SMA aged isothermally at 250 °C in terms of relative volume fraction, radius, thickness, orientation, lattice ordering, and morphology. The mechanism and kinetics of the concurrent phase evolutions of Ni-rich nanodomains and Ti3Ni4 nanoprecipitates are revealed and discussed in detail. Frequency-dependent storage modulus vs. temperature at different frequencies for different aging times was measured to characterize the strain glass transition. Quantitative correlation of all structural evolutions and kinetics of Ni-rich and Ti3Ni4 nanoparticles with respect to the variation and loss of the strain glass transition during aging times of 0 to 20 h is presented. The roles of different nanoparticles in causing or suppressing the strain glass behavior are also experimentally revealed.
1. Introduction
TiNi-based shape memory alloys (SMAs) are well-known functional materials with an excellent shape memory effect, pseudoelasticity, and high damping capacity due to the thermoelastic martensitic transformation from the B2 parent phase to B19’ martensite with long-range ordering (LRO) of the lattice strain [1,2,3]. However, the regime of phase transformation of Ni-rich Ti50−xNi50+x SMAs with x > 1.2 at % changes from martensitic transformation to strain glass transition [4,5,6,7], and this change is attributed to the excess Ni atoms acting as point defects. According to previous reports [4,5,8,9], Ti50−xNi50+x (x > 1.2 at %) SMAs demonstrate a precursor phase of dynamic strain-disordered B2 phase with embedded quasistatic strain nanodomains at temperatures above the glass transition temperature Tg. As the temperature falls below Tg, the strain glass transition exhibits a freezing transition from a dynamic strain-disordered phase (strain liquid or unfrozen strain glass) to a frozen strain-disordered phase with static strain nanodomains (frozen strain liquid or strain glass phase). It was proposed [9] that these point defect-induced nanodomains have local or short-range ordering (SRO) strain, which can effectively inhibit the LRO strain and the martensitic transformation in the whole ferroelastic system. Point defects in the ferroic system generate a similar glassy state for ferroelectric transition and ferromagnetic transition, which respectively transform into ferroelectric relaxor [10] and spin glass [11,12]. Strain glass in the ferroelastic system has also exhibited a number of interesting properties [13], such as the shape memory effect and superelasticity subject to the Tg. Strain glass has emerged as a new direction of ferroelastic research in the past decade and may offer opportunities for both fundamental and applied studies leading to a novel field and applications. An increasing number of strain glass systems have been found, suggesting that the origin of strain glass could attract more research in the future [4,7,9,14]. However, fundamental understanding of the mechanism of this strain glass transition is still limited.
The quasistatic (or static) strain nanodomains in the strain glass play a critical role in the formation of the strain glass transition/characteristics. Transmission electron microscopy (TEM) [4] has only confirmed the existence of these strain nanodomains in the unfrozen and frozen states of strain glass in as-quenched Ti48.7Ni51.3 SMA due to the measurement of the diffraction strain effect. A previous small angle X-ray scattering (SAXS) study [15] using the excess electron density contrast between matrix and nanodomains directly measured the distribution, orientation and real morphology of these nanodomains formed by the aggregation of Ni atoms during the quenching process of Ti48.7Ni51.3 SMA. For simplicity, these nanodomains with a structurally defined disk-/plate-like morphology that form in the as-quenched Ti48.7Ni51.3 SMA are called “Ni-rich nanodomains” in this work. On the other hand, a previous study [16] pointed out that “Ti3Ni4 nanoprecipitates”, produced by the aging of Ti48.7Ni51.3 SMA at 200 °C for 3 h, can prohibit the martensitic transformation and lead to strain glass behavior. It is worth noting that the Ni-rich nanodomains, which are clustered by excess Ni atoms and possess higher concentration of Ni atoms than the matrix, have the same structure as the matrix while the Ti3Ni4 nanoprecipitates with stoichiometric composition have their own structure different from the matrix. Therefore, the current results on the formation mechanism of strain glass cause an interesting issue: do all the nanoscale structures or particles formed by excess Ni point defects, such as Ni-rich nanodomains and Ti3Ni4 nanoprecipitates, cause the strain glass transition? The real morphologies of both Ni-rich nanodomains and Ti3Ni4 nanoprecipitates are very difficult to observe by TEM technique using the strain contrast. How Ti3Ni4 nanoprecipitates nucleate and grow in the strain glass has never been reported due to the limitations of the experiment. Moreover, the previous SAXS study [15] combined with X-ray diffraction (XRD) pointed out the co-existence of Ni-rich nanodomains and Ti3Ni4 nanoprecipitates in the early-aged Ti48.7Ni51.3 SMA, but the structural analysis in that study ignored the morphology of Ti3Ni4 nanoprecipitate and regarded it as a minor phase. The SAXS study presented in [15] only reported that the Ni-rich nanodomains, tuned by the aging time, can qualitatively affect the strain glass transition. The coexistence of two nanoparticles largely increases the complexity of resolving their respective contributions quantitatively or qualitatively to the strain glass transition, which is necessary for comprehensively understanding the mechanism. To date, no studies have investigated the kinetics and mechanism of the concurrent evolutions of Ni-rich nanodomains and Ti3Ni4 nanoprecipitates in the strain glass of Ti48.7Ni51.3 SMA during thermal aging.
The SAXS technique has been demonstrated to be an effective tool for quantitatively determining the shape, orientation and size of a large number of polydispersed nanoparticles in bulk samples of various alloys [17], such as Al-Cu and Al-Mg-Si alloys [18,19,20], Al-Cu-Li alloys [21,22], Al-Zn-Mg alloys [23,24,25,26,27], Al-Li alloys [28], Al-Si-Zr-V-Fe alloys [29], Ti-Ni-Hf alloys [30], Fe-Cr alloys [31], Zr-Pd alloys [32] and Cu-Co alloys [33]. Moreover, several SAXS studies have resolved the different structures of two co-existing plate-like precipitates [34,35,36]. Therefore, due to the low aging temperature of 250 °C which can prevent the rapid dissolution of Ni-rich nanodomains and provide the effective precipitation for Ti3Ni4 nanoprecipitates without a prolonged aging time, in situ SAXS measurement was performed on Ti48.7Ni51.3 SMA aged isothermally at 250 °C from the as-quenched state (0 h) to 20 h. In addition, for characterizing the strain glass transition and Tg, the frequency-dependent storage modulus E0 vs. temperature of specimens aged for different times were measured with a dynamic mechanical analyzer (DMA). Ex situ XRD measurement was also conducted to determine the variations of phases with aging time for correlation to the morphological changes. In this study, the in situ SAXS analysis was used to resolve the concurrent evolutions of Ni-rich nanodomains and Ti3Ni4 nanoprecipitates by the corresponding scattering patterns with different orientations. At the same time, the in situ SAXS results can provide information as follows: (1) the temporal evolutions of relative volume fraction, radius and thickness of disk-/plate-like Ni-rich and Ti3Ni4 nanoparticles, (2) the quantitative correlation of all structural evolutions and kinetics of Ni-rich and Ti3Ni4 nanoparticles with the variation and loss of the strain glass transition, and (3) the roles of Ni-rich and Ti3Ni4 nanoparticles in causing or suppressing the strain glass behavior. The mechanism, kinetics, and their mutual influence on the nucleation, growth and coarsening of Ti3Ni4 nanoprecipitates and the concurrent dissolution of Ni-rich nanodomains are discussed simultaneously.
2. Materials and Methods
A Ti48.7Ni51.3 ingot was prepared according to a previous study [15]. The ingot was then hot-rolled at 900 °C into a plate with a thickness of about 2 mm. The plate was solid-solution treated at 900 °C for 1 h followed by quenching in water. The SAXS specimen was cut to the size of 10 × 10 mm2 and ground to a thickness of ≤40 μm, as described in [15]. The grain size of the specimen was measured by the ASTM E112-88 standard to be 80 ± 15 μm. In situ SAXS measurements were conducted using a BRUKER instrument (AXS GmbH, NANOSTAR, Karlsruhe, Germany) operated at 2.5 kW (50 kV, 50 mA) equipped with a heater on the sample stage. The SAXS instrument has a three-pinhole collimation system (500, 150, 50 μm) with the beam size of ~150 μm. The configuration, operation procedure and data reduction of the SAXS instrument are described in the literature [15]. In situ SAXS measurements were conducted to study the evolution of the nanostructure in Ti48.7Ni51.3 specimens during 250 °C isothermal aging. The SAXS pattern was collected first at room temperature (RT) for an as-quenched specimen for 30 min. Then the sample was directly heated up to 250 °C, during which the SAXS patterns were collected every 30 min, from the beginning to 20 h. The 2D SAXS patterns were reduced into 1D SAXS profiles as a function of the scattering vector Q = 4πsin(θ/2)/λ, in which θ is the scattering angle and λ is the X-ray wavelength. The frequency-dependent storage modulus E0 vs. temperature measurement was performed by a dynamic mechanical analyzer (DMA 2980, TA Instruments, New Castle, DE, USA) with a cooling/heating rate of 3 °C/min. The ex situ XRD measurement was performed by a high-power monochromatized X-ray diffractometer (XRD, TTRAX III, RigaKu Co., Tokyo, Japan).
3. Results
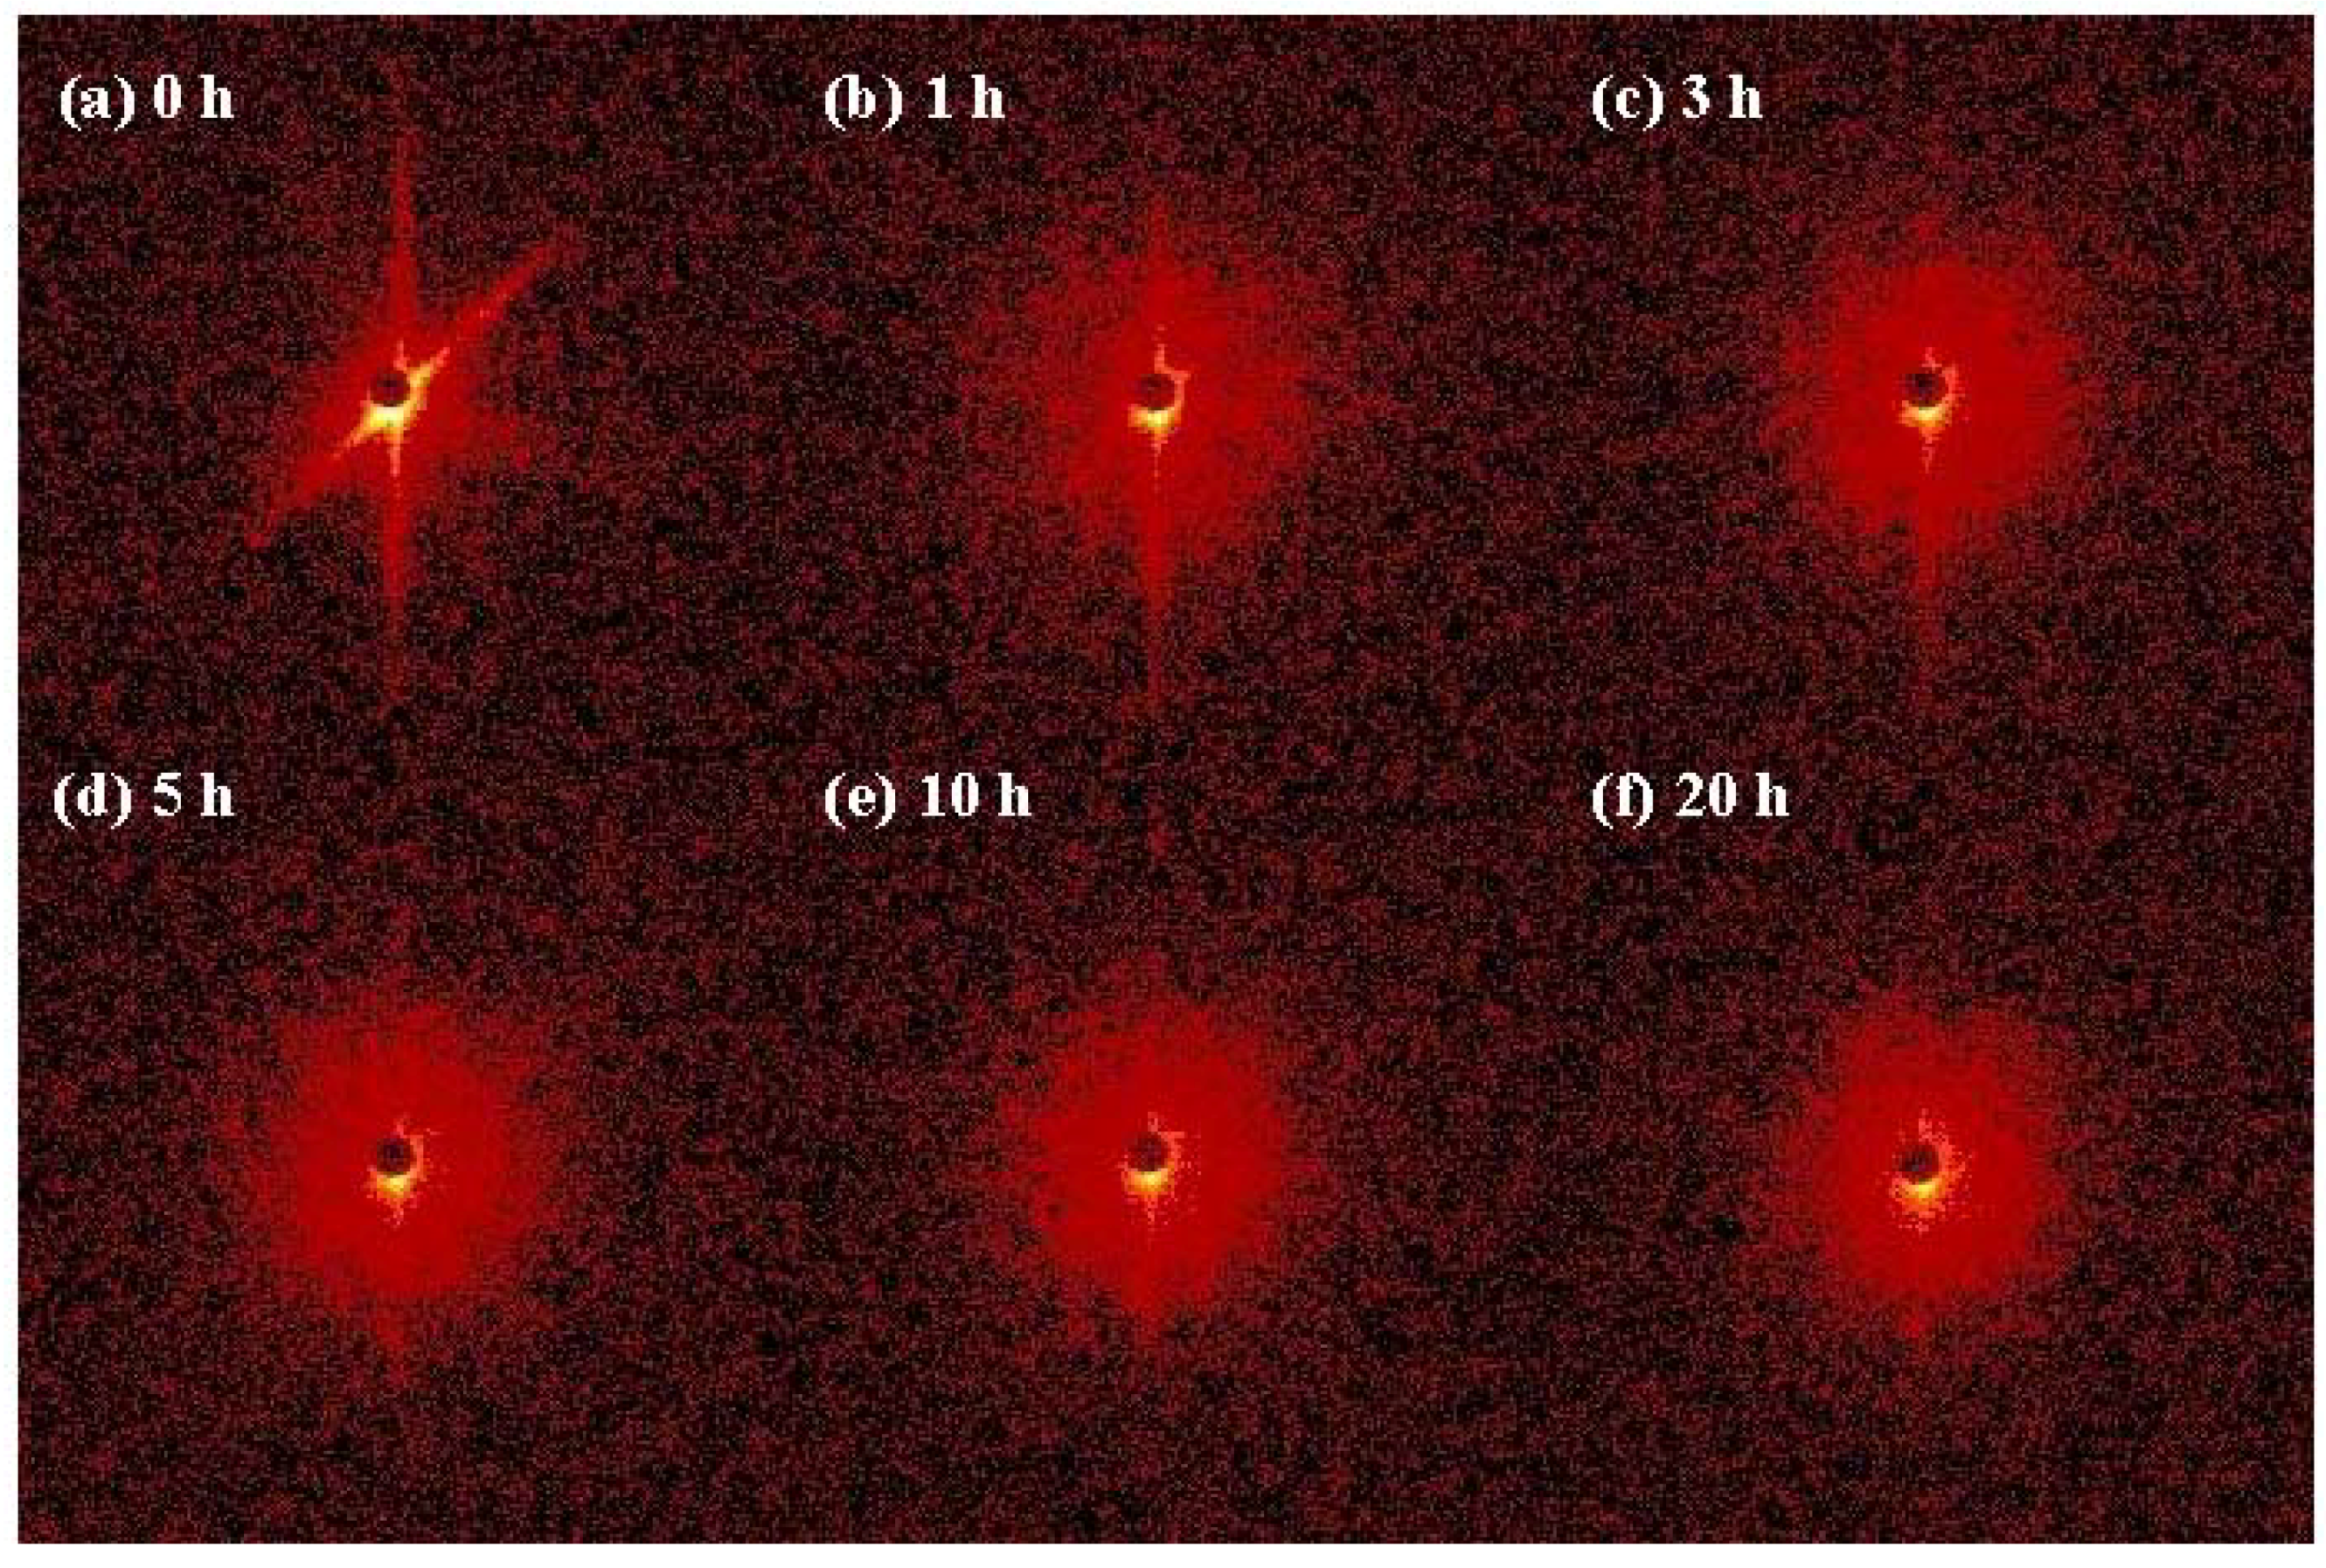
A previous study of the strain glass of Ti48.7Ni51.3 SMA indicated that the Ni-rich nanodomains lying on the orthogonal habit planes have a disk-/plate-like morphology [15]. The Ni-rich nanodomains in as-quenched specimens formed by the vacancy-enhanced aggregation of the excess Ni atoms give rise to the SAXS intensity. Figure 1a–f shows the 2D SAXS patterns measured from an as-quenched Ti48.7Ni51.3 specimen followed by isothermal aging at 250 °C for 0 h (as-quenched state), 1 h, 3 h, 5 h, 10 h and 20 h, respectively. The intensity scale of Figure 1a–f is the same. The radial streaks of the 2D SAXS patterns for all specimens, especially for the as-quenched specimen shown in Figure 1a, are caused by the Ni-rich nanodomains with special orientation, directly evidencing the disk-/plate-like morphology of the nanostructure.
3.1. Formation and Structural Evolution of the New Nanoprecipitates during Isothermal Aging at 250 °C
Carefully comparing the 2D SAXS patterns of 0-h- and 1-h-aged specimens (Figure 1a,b), respectively), one can find that for the 1-h-aged specimen, new intensities with an isotropic scattering distribution surround the beam center and are different from the radial streaks of Ni-rich nanodomains in the 0-h-aged specimen, revealing the formation of new nanoparticles. From Figure 1b,c, it can be seen that the intensity of the isotropic scattering in the 2D SAXS patterns becomes remarkably stronger as the aging time increases. It means that the newly formed nanoparticles with isotropic orientations nucleate at different sites and grow in both size and volume fraction as the aging time increases. After 3 h of aging, the isotropic intensity distribution seems to become saturated, according to observation. Previous research [37,38] had pointed out that the precipitates formed in the aged Ni-rich TiNi SMAs are Ti3Ni4-like ones. The newly-formed nanoparticles can be considered to be Ti3Ni4 nanoprecipitates or their precursor phase.
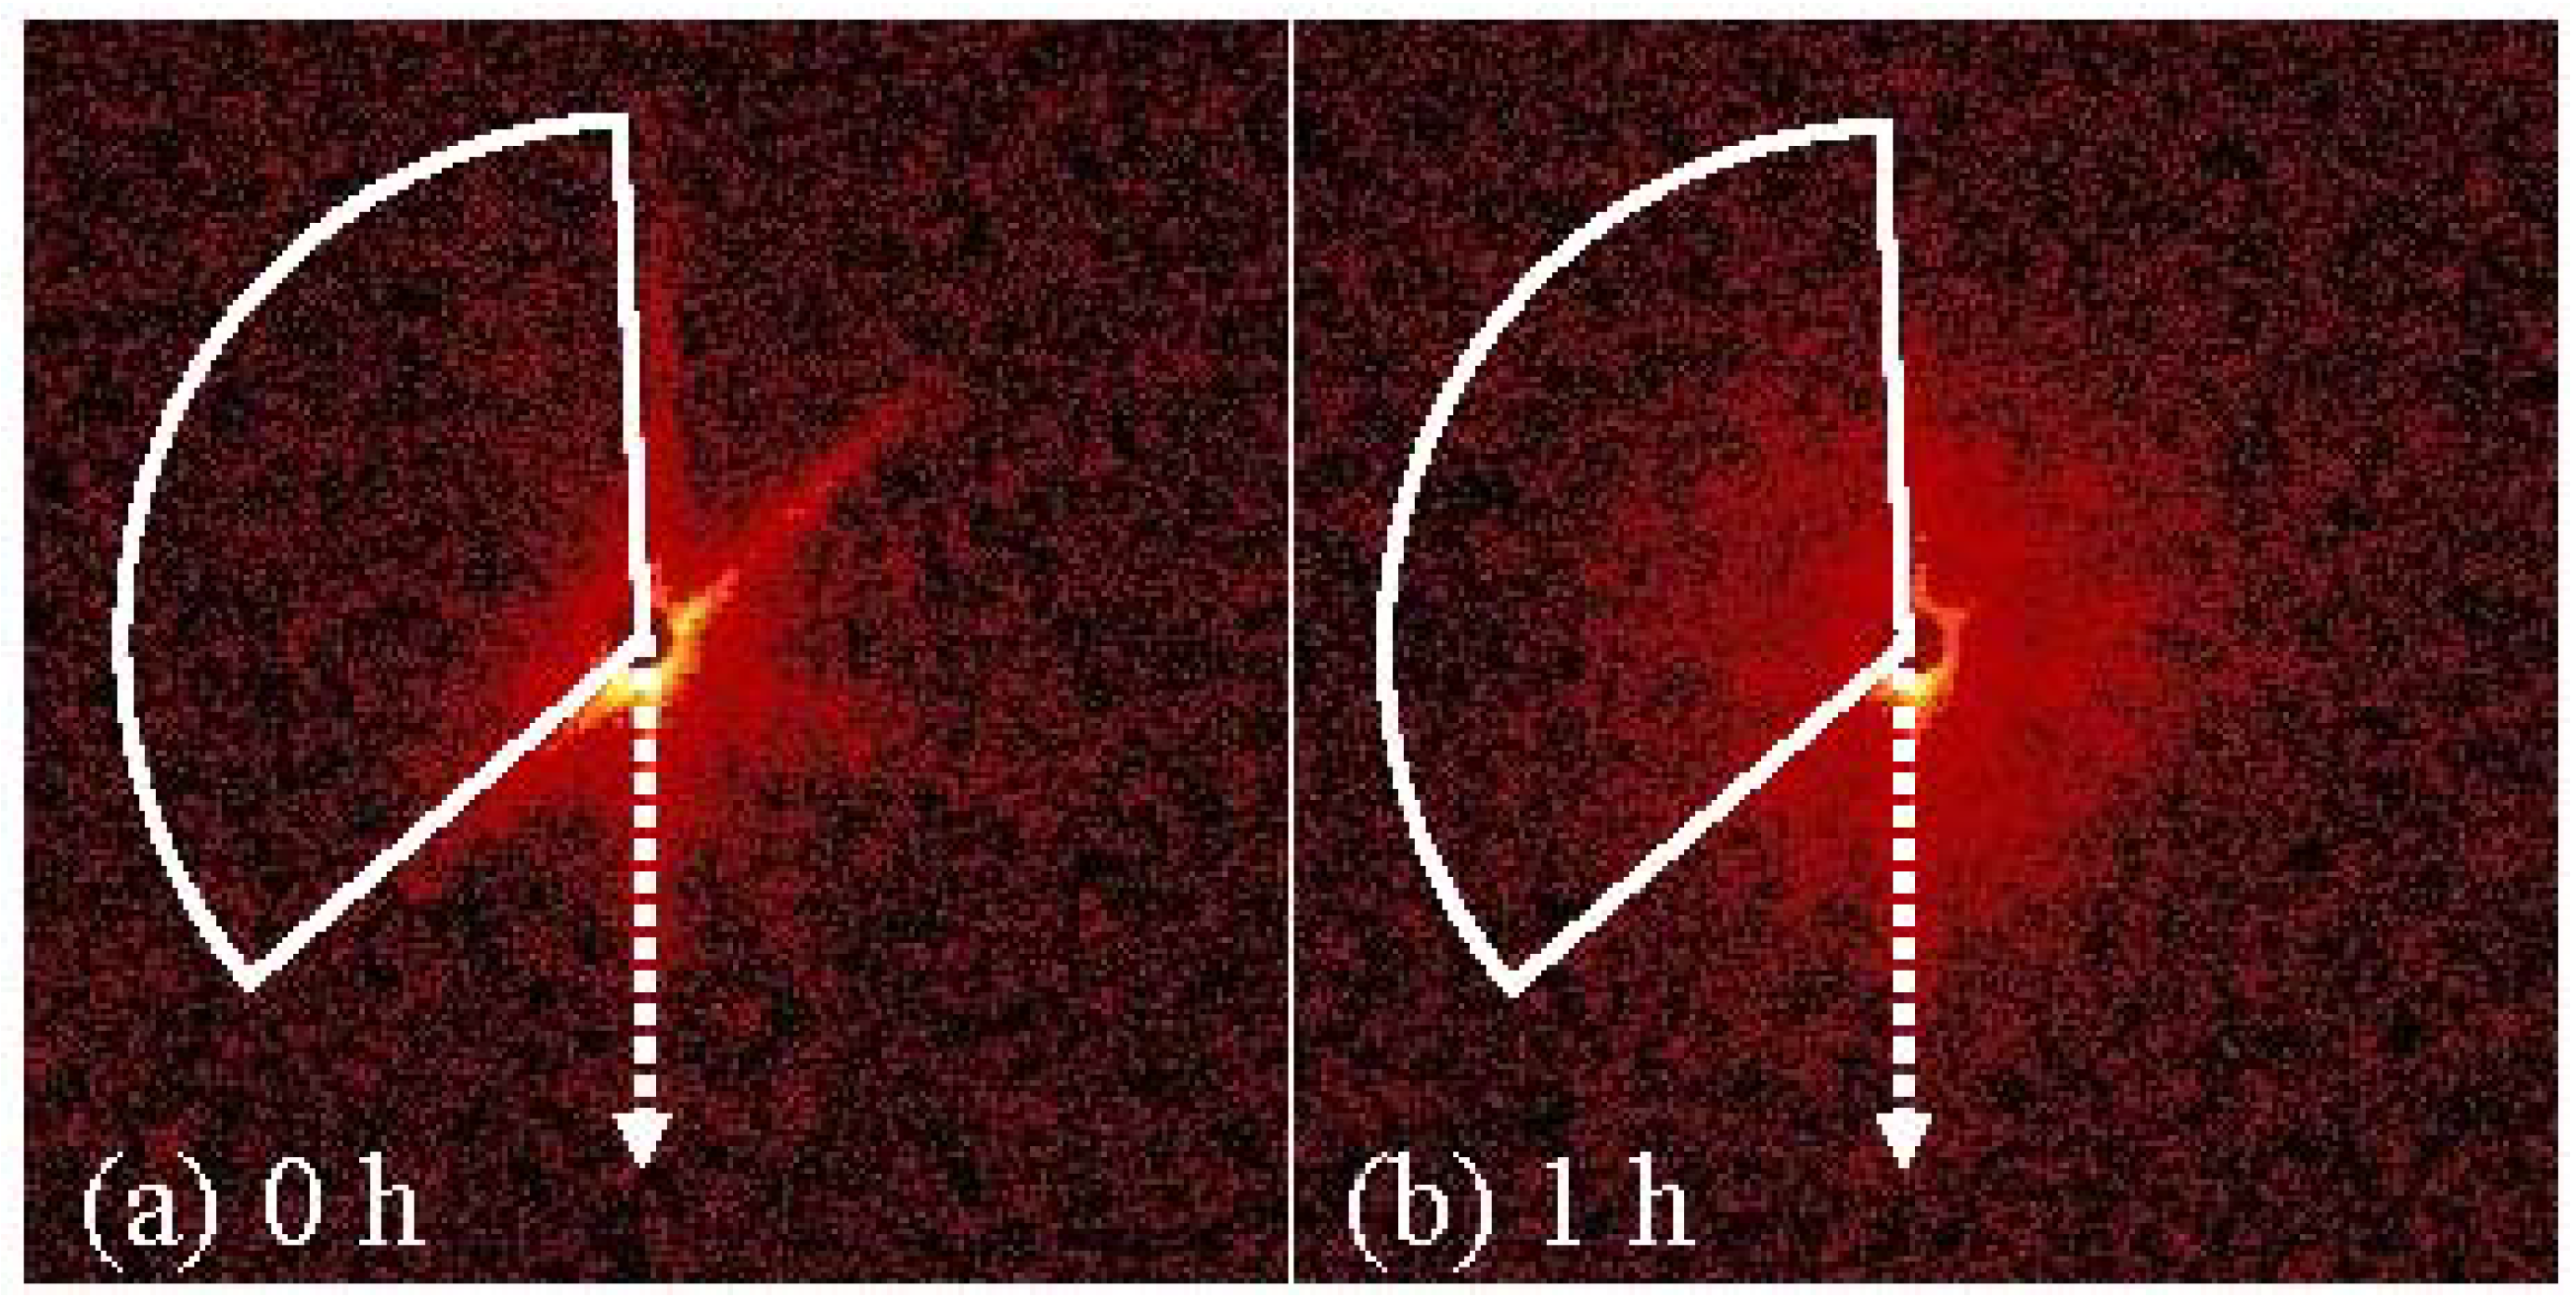
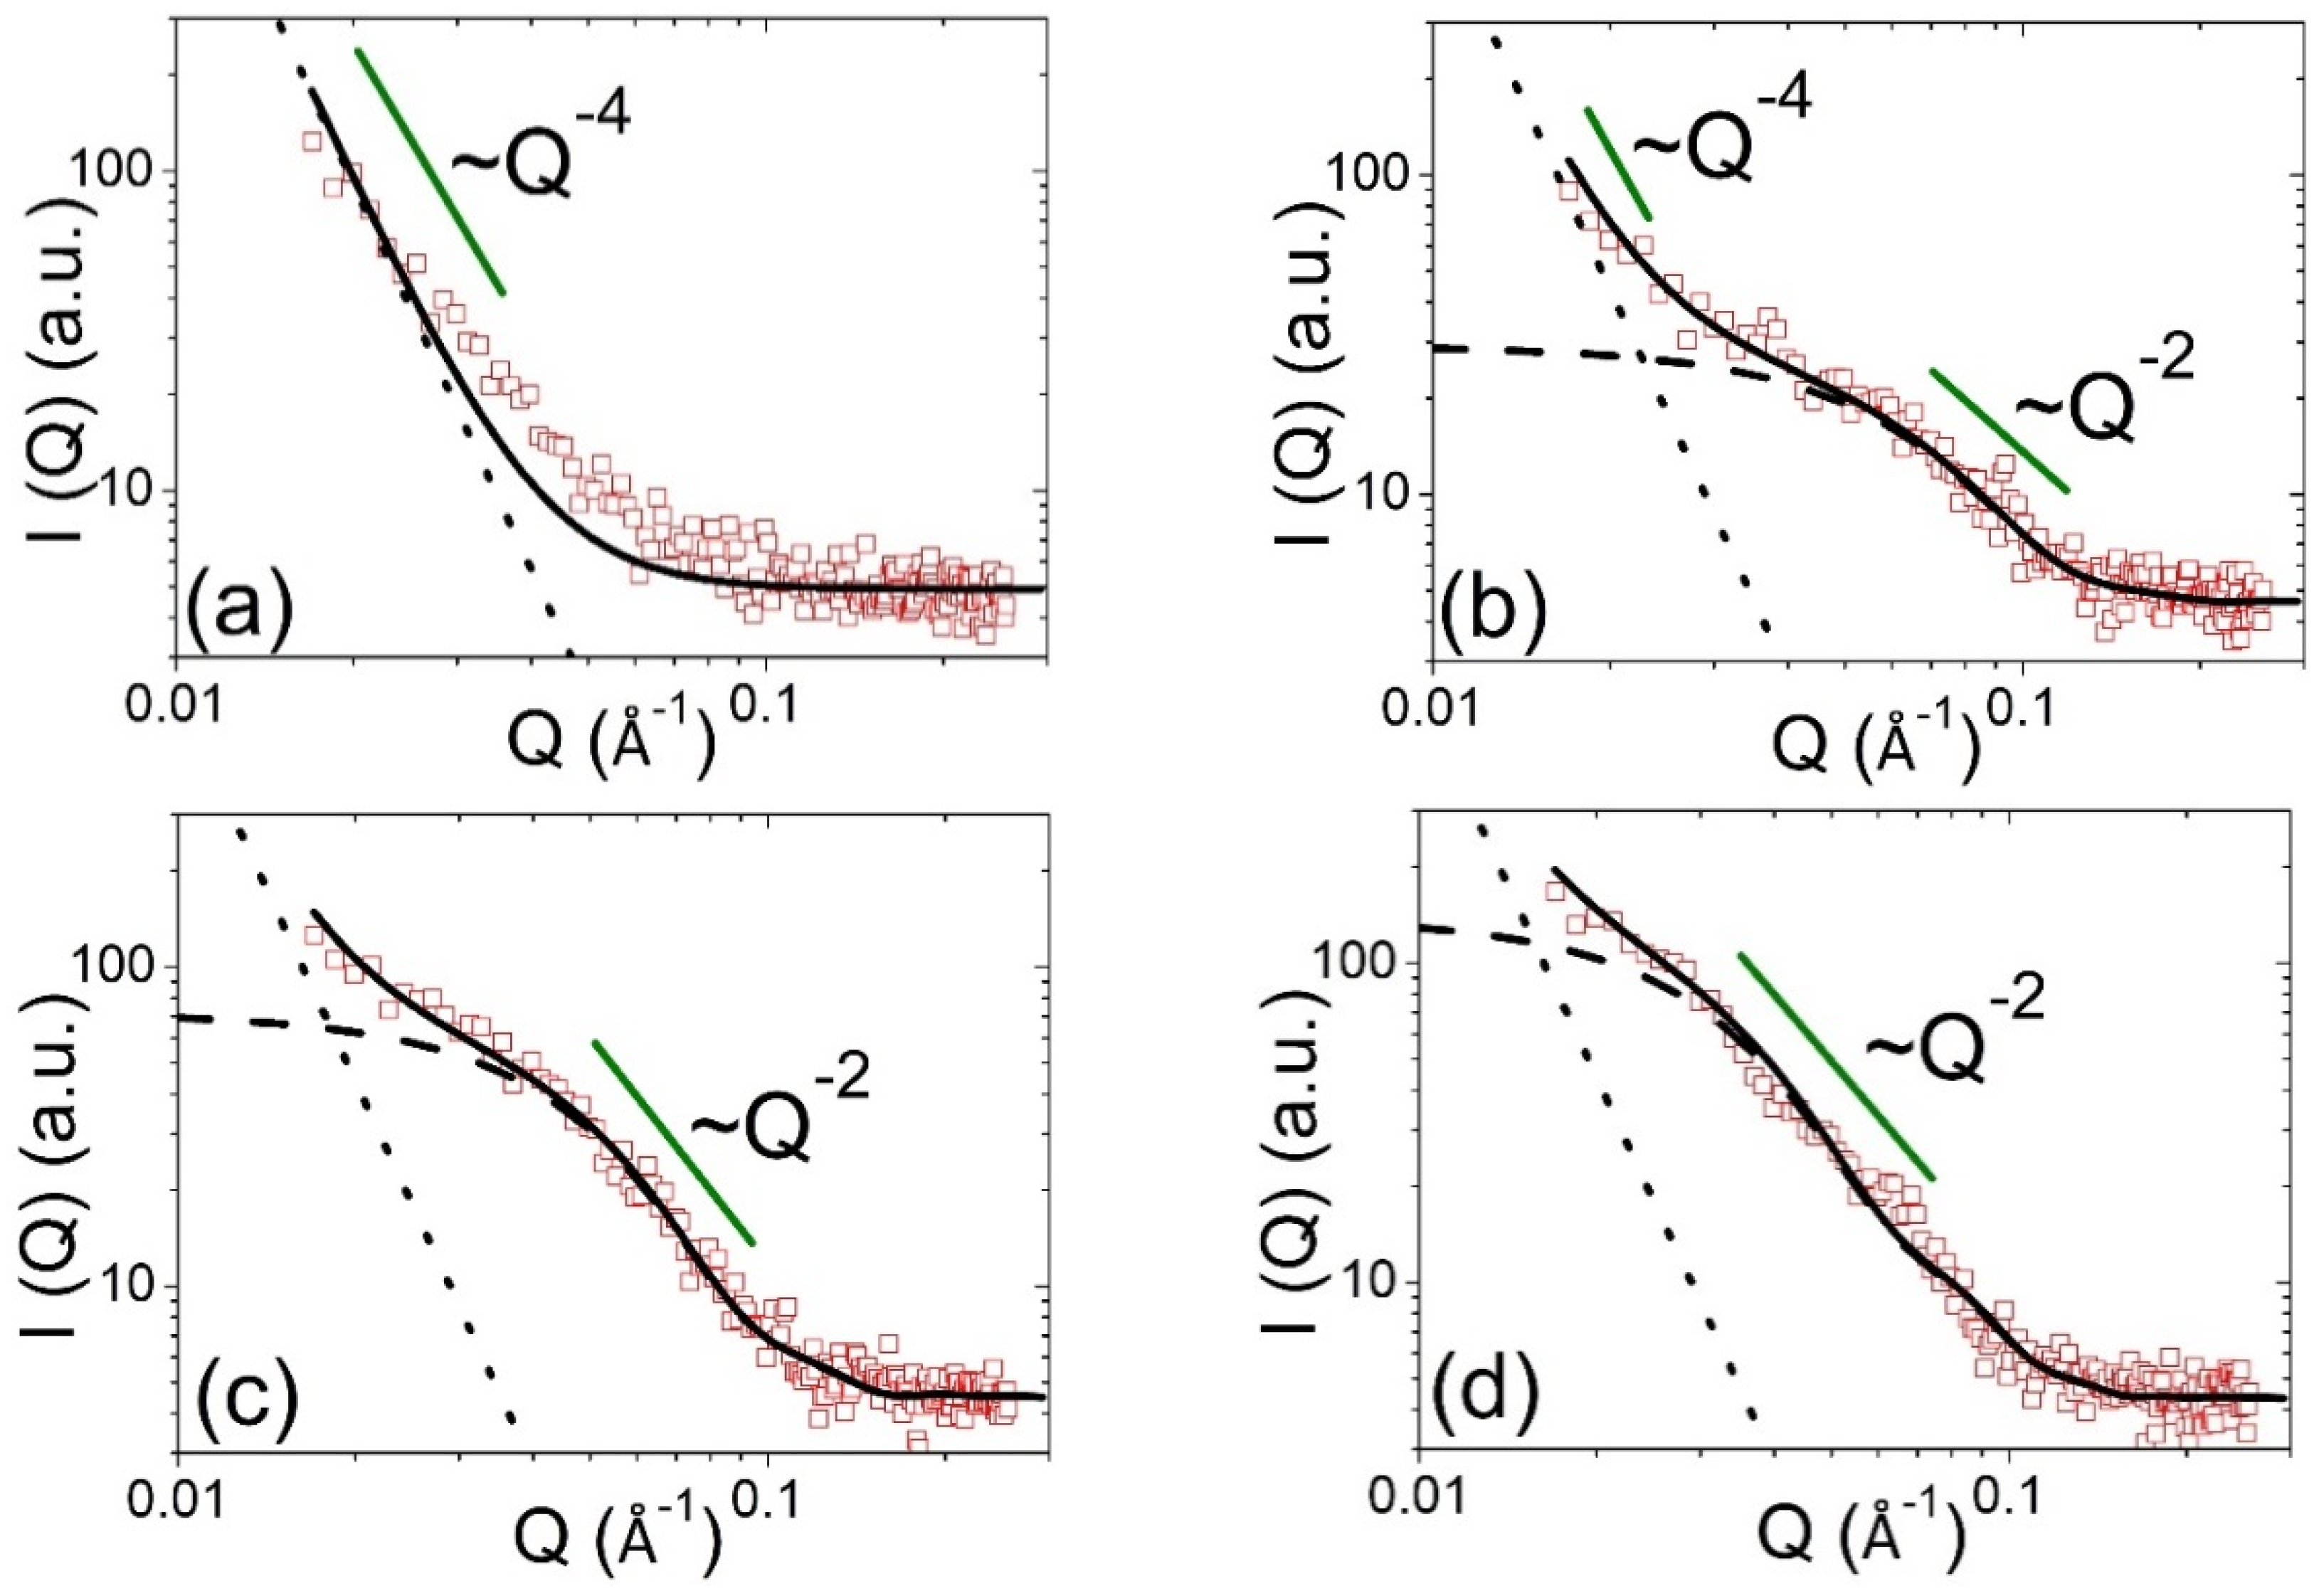
The 2D SAXS patterns in the present study allow analysis of the orientation-resolved information of these newly-formed nanoprecipitates, except for the originally existing Ni-rich nanodomains characterized by the radial streaks [15,39,40]. To quantitatively investigate the structural evolution of these newly-formed nanoprecipitates, a cut sector of the 2D SAXS pattern without the originally existing streaks was selected to reduce the data to obtain the typical SAXS profile contributed only by the newly-formed nanoprecipiates, as shown in Figure 2a. The 1D SAXS profiles were reduced along the sector-shaped 2D SAXS patterns by the azimuthal average, the standard calibration and the background subtraction. Figure 3a–d shows the 1D SAXS profiles contributed by the newly-formed nanoprecipitates reduced from the sectors of 2D SAXS patterns of Figure 1a,b,d,f, respectively. As shown in Figure 3, during the short aging time (0 h~1 h), the intensity upturn in the low-Q region exhibits the power-law scattering behavior, I(Q) ∝ Q−α, with α being 4, which is resulted from the smooth surfaces of the large particles. The large particles are assumed to be Ti2Ni or (Ti2Ni)2O, which form during the ingot preparation and usually appear in TiNi-based SMAs [41,42]. With increases in aging time, this intensity upturn from the large particle remains unchanged because the Ti2Ni is a stable phase at 250 °C. However, the mainly dominant intensity is replaced by the growing shoulder of the intensity profile in the middle-Q region when the aging time exceeds 5 h. As shown in Figure 3, the shoulder of the intensity profiles in the middle-Q region (0.025~0.07 Å−1) shows the power-law scattering behavior, I(Q) ∝ Q−α with α being 2, as the evidence of the disk-/plate-like morphology of newly formed Ti3Ni4 nanoprecipitates [15,39,40]. It is well known that the Ti3Ni4 precipitates have the disk-/plate-like morphology in hundreds of nanometers [37,38,43,44], which also agrees with the SAXS results. The isotropic scattering distribution of the 2D SAXS pattern contributed by disk-/plate-like Ti3Ni4 nanoprecipitates indicates their random orientations. The intensity of the shoulder profile resulting from Ti3Ni4 nanoprecipitates in the 1D SAXS profiles largely increases as aging time increases, signifying the dramatic increase in volume fraction. In addition, the shoulder of the intensity profile (Guinier profile; 0.012~0.05 Å−1) shifts toward the low-Q region with increases in aging time, which directly demonstrates the size growth of Ti3Ni4 nanoprecipitates. Note that some fitting error between model-fitting profile and experimental profile for the as-quenched specimen, as shown in Figure 3a, suggests the possible existence of a very small portion of Ti3Ni4 nanoprecipitates or the experimental error caused by instrument.
The shape of Ti3Ni4 precipitates has been resolved as disk-/plate-like morphology by the power-law behavior Q−α with α being 2 from SAXS profile of Figure 3. The thickness, radius and relative volume fraction of Ti3Ni4 nanoprecipitates can be accurately determined by the quantitative model fitting of the 1D SAXS profile. The validity of model analysis regarding the disk-/plate-like nanoparticles has been demonstrated [18]. For the model fitting, the IGOR program (WaveMatrics Inc., Lake Oswego, OR, USA) was used to perform the nonlinear least-squares calculation to fit the 1D SAXS profile [45]. The SAXS intensity profile caused by disk-/plate-like nanoprecipitates can be expressed as the form factor of polydisperse disks with a radius R and Schulz distribution of the thickness t [17,18,19,45], as given by Equation (1):
where is the volume fraction of disk-/plate-like precipitates in the sample, denotes the scattering length density contrast between the nanoprecipitates and the surrounding matrix, and j0 and j1 are the zero-order and first-order Bessel functions, respectively. The integral over averages the form factor over all possible orientations of the disks with solid angle with respect to Q. The product of and can be regarded as a prefactor constant. f(t) is the normalized Schulz distribution of the polydisperse thickness t with a mean thickness T. The polydispersity of thicknesses, i.e., the ratio of the width of thickness distribution to T, is described by the fitting parameter, and is the mean volume of disks/plates with polydisperse thicknesses. Taking into account the large originally stable Ti2Ni particles, the measured SAXS profile can be modeled by the following equation:
where the first term on the right-hand side is used to describe the surface scattering from large Ti2Ni particles. A is the fitting parameter. The fitting constant b is the incoherent scattering background. As shown in Figure 3, the SAXS profiles can be fitted well using the model of Equation (2). The fitted intensities (dotted lines) corresponding to the scattering contribution of large Ti2Ni particles are stable with increases in aging time. The shoulder profiles (dashed lines), calculated by the form factor corresponding to nanoprecipitates, gradually dominate the main intensity with increases in aging time.
Figure 4 shows the variation of mean thickness and the radius of Ti3Ni4 nanoprecipitates determined by the model fitting with aging times of 0.5 h to 20 h. The polydispersity of thickness distribution is determined to be 0.2. We also adopted a model-independent method (called the Kratky–Porod approximation) to determine in parallel the thickness of the disk-/plate-like particles [17,46]. This method of approximation is valid in the Q region of π/R < Q < 2π/T. We plotted ln[I(Q) × Q2] vs. Q2 in the appropriate Q region for each SAXS profile of Figure 3, as shown in Figure S1. The Kratky–Porod plot usually exhibits a trend of a straight line. The thickness of the disk can be directly determined from the slope of the fitted straight line (=−T2/12). The thickness results determined by the model-independent method agree with the model fitting result, as also shown in Figure 4. This cross examination demonstrates the accuracy and reliability of SAXS analysis.
Assuming the nanoprecipitate composition remains a constant during the aging, i.e., a constant scattering length density contrast, the relative volume fraction of Ti3Ni4 nanoprecipitates can be model-independently evaluated using the Porod invariant (i.e., integration of the measured intensity), as given by Equation (3) [17,47].
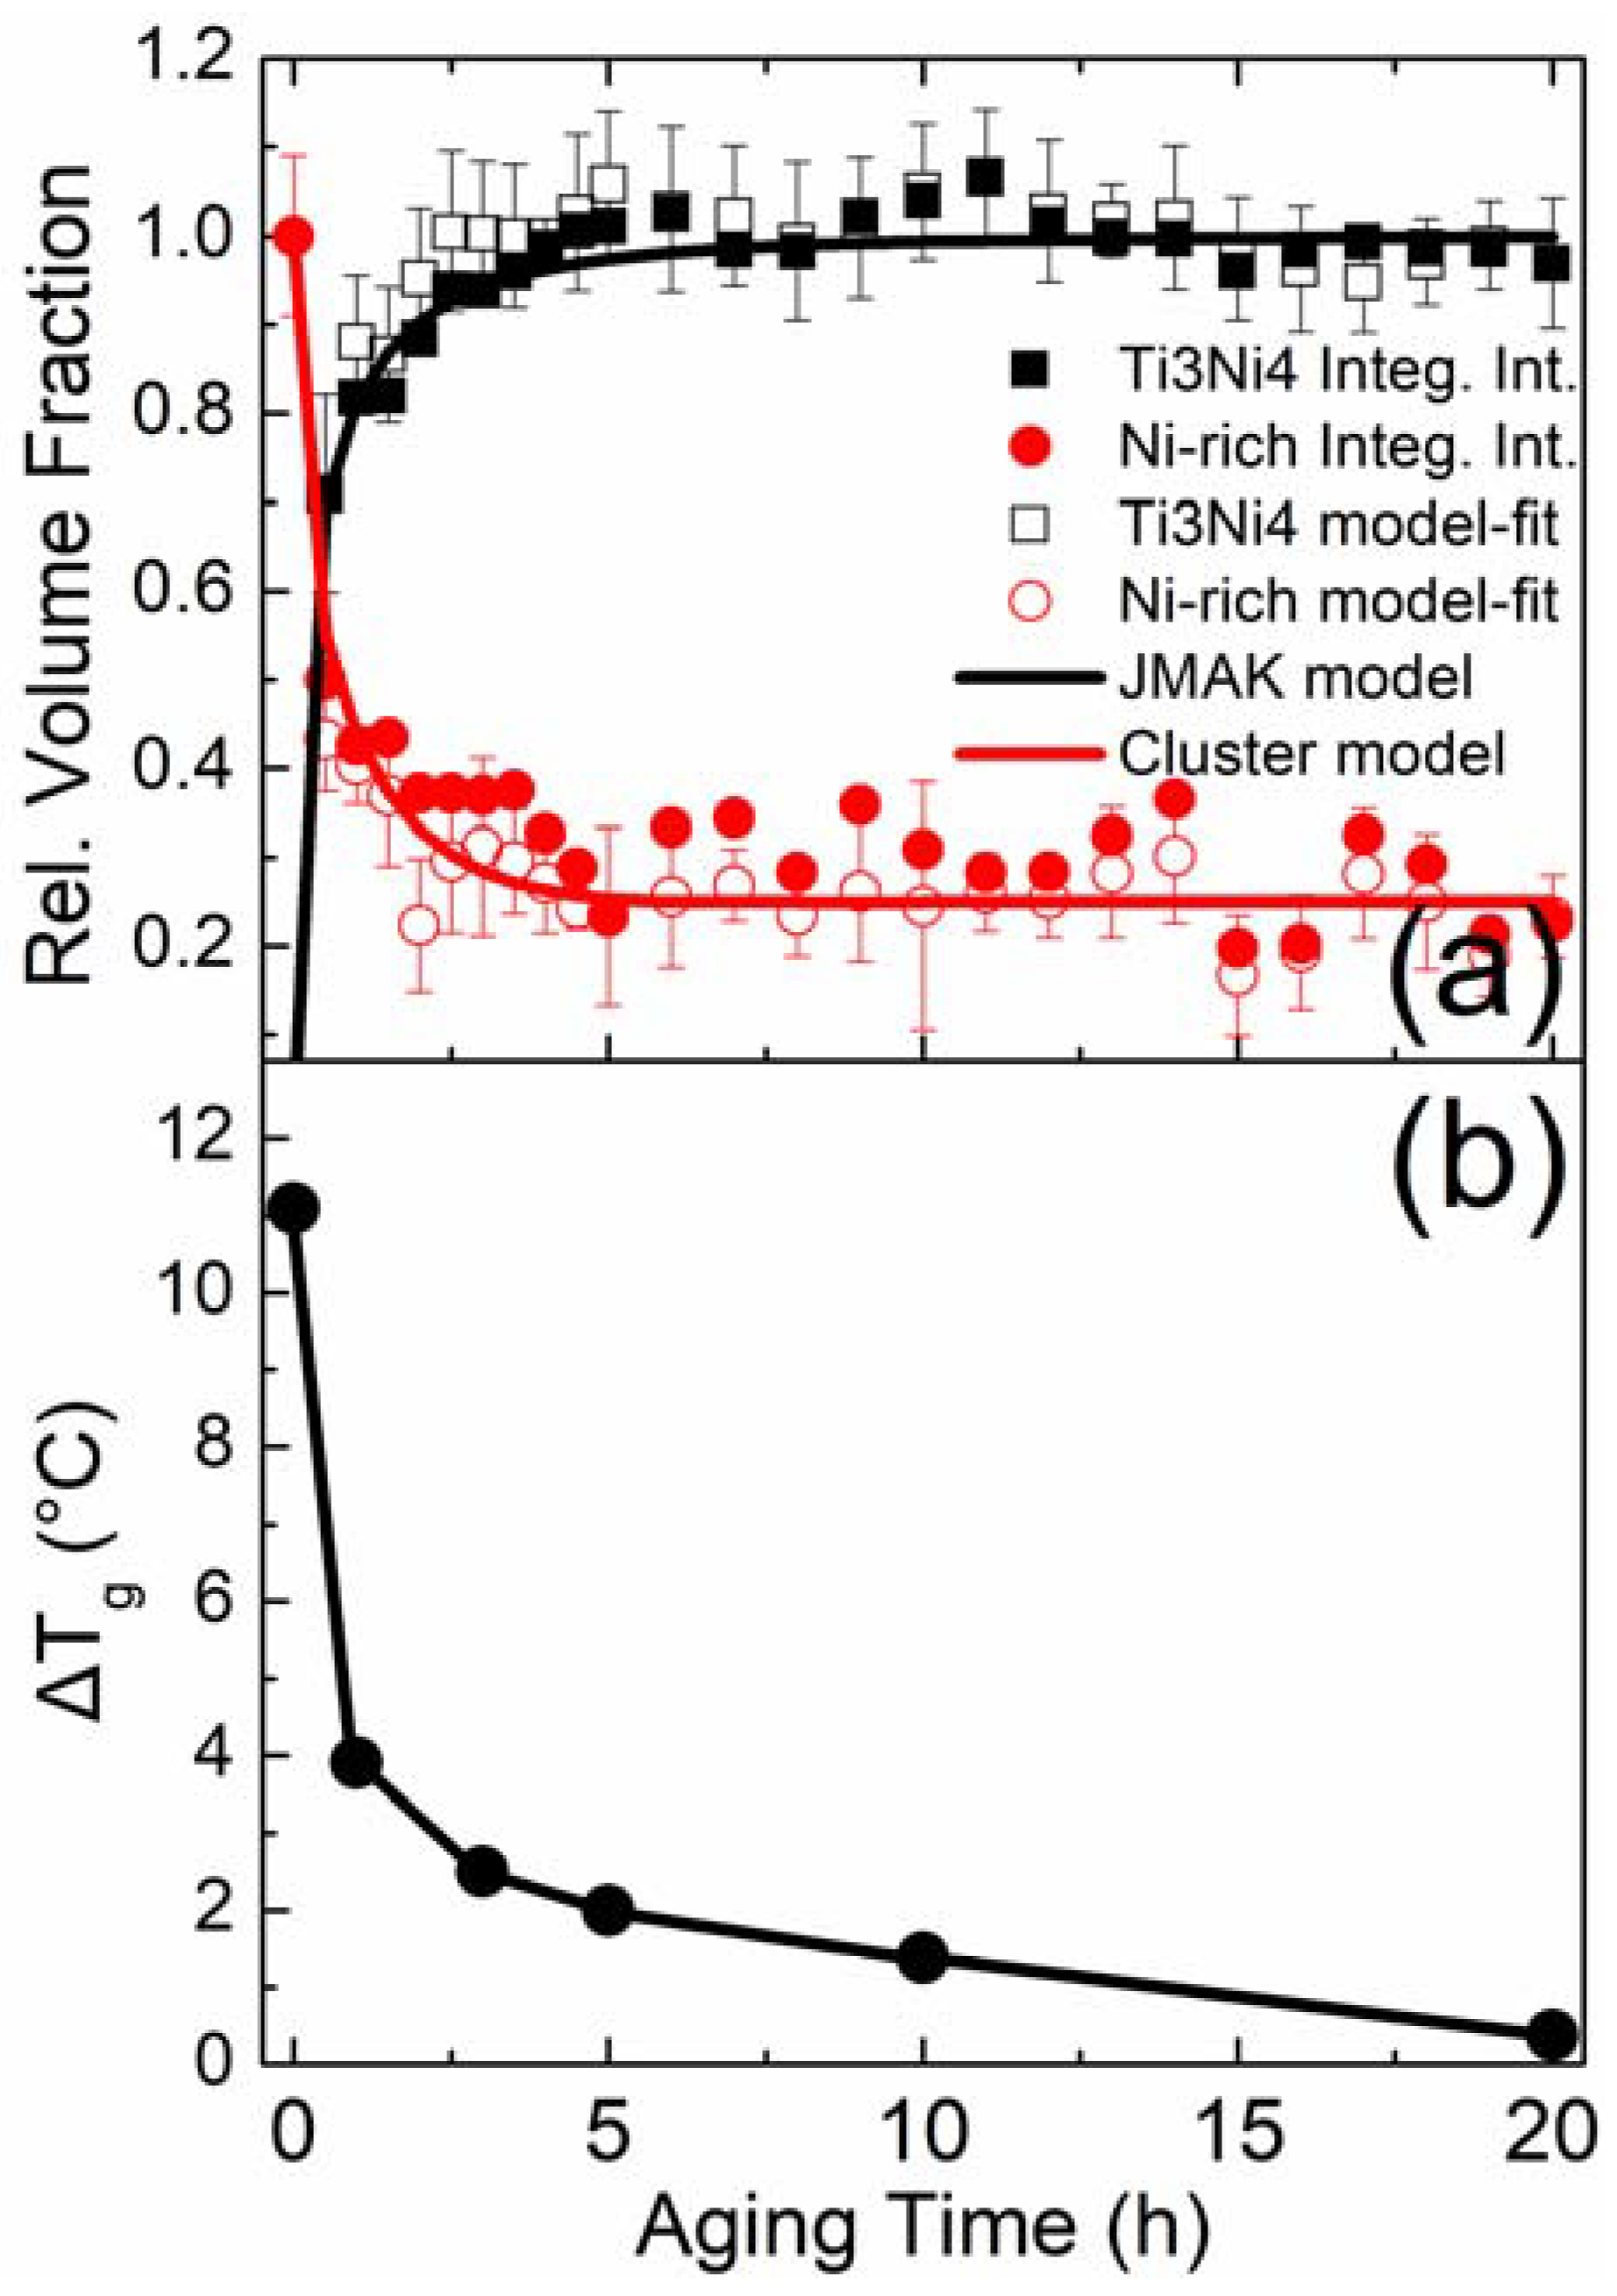
The total integrated intensity is calculated based on the measured intensity profile, and the intensities is extrapolated to zero using Guinier approximation and to infinity using Porod asymptotic behavior [26]. The temporal evolution of the relative volume fractions model-independently determined by Equation (3) for Ti3Ni4 nanoprecipitates is shown in Figure 5a. The relative volume fraction is normalized. The relative volume fraction of Ti3Ni4 nanoprecipitates determined by the model-independent method agrees with that determined by the model fitting of Equation (2), as shown in Figure 5a.
3.2. Structural Evolution of Ni-Rich Nanodomains during Isothermal Aging at 250 °C
In addition to the nucleation and growth of new Ti3Ni4 nanoprecipitates, the concurrent structural evolution of Ni-rich nanodomains is also of great interest. The mutual relationship of the structural evolutions of both nanoparticles is fundamentally important and has not been reported. Due to the coexistence of two phases, Ni-rich nanodomains and the newly-formed Ti3Ni4 nanoprecipitates, the oriented streaks of 2D SAXS patterns (dotted line in Figure 2b) have the intensities contributed by both kinds of nanoparticles.
In the present study, we resolved the structural information of Ni-rich nanodomains using the two independent approaches to cross-check the results. Approach (I) was the model-fitting method to the SAXS intensity profile averaged over all the radial streaks purely contributed by the disk-/plate-like Ni-rich nanodomains. The reduced 1D SAXS intensity profile purely contributed by the Ni-rich nanodomains, Inanodomain(Q), can be obtained by subtracting the SAXS intensity profile corresponding to Ti3Ni4 nanoprecipitates, Inanoprecipitate(Q), from the total SAXS intensity profile, Itotal(Q), measured over all orientations and caused by both Ti3Ni4 nanoprecipitates and Ni-rich nanodomains, as given by Equation (4).
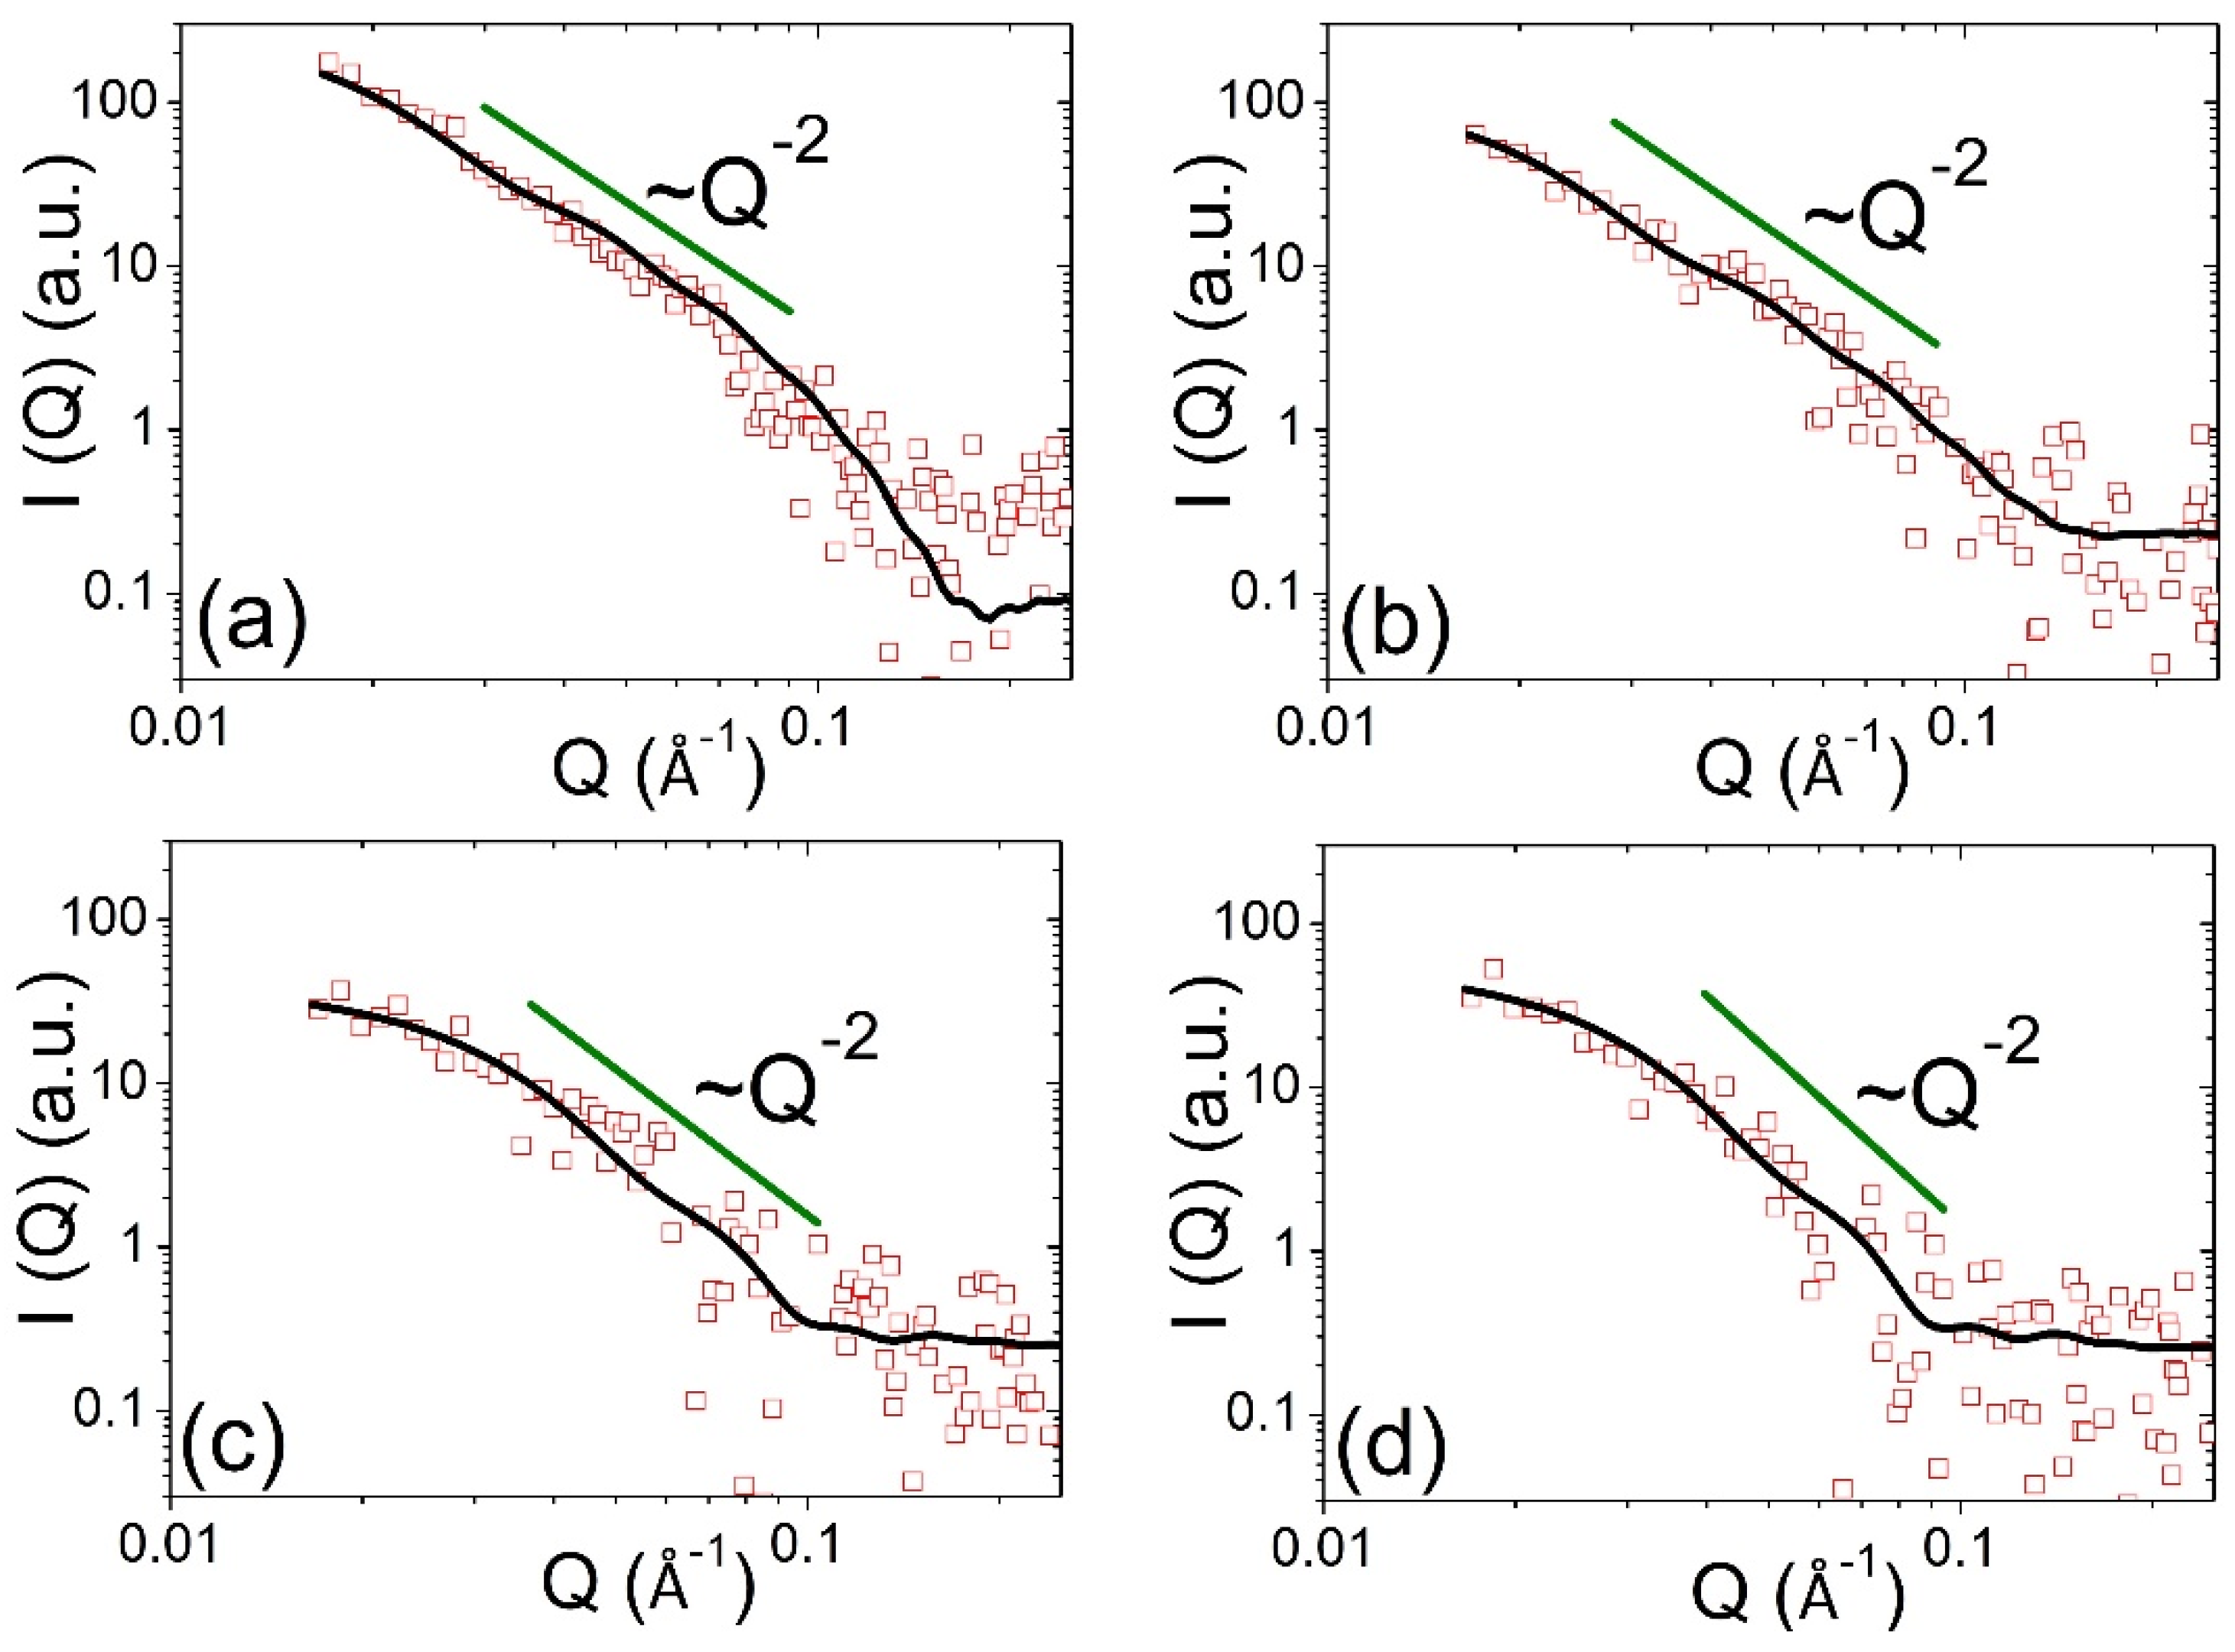
The Itotal(Q) can be reduced along the azimuthal average of the whole 2D SAXS pattern through the standard calibration and the background subtraction [19,26]. The Inanoprecipitate(Q) profiles were reduced from the sector cut, the same SAXS data as that in Figure 3. Figure 6a–d show the 1D SAXS profiles mainly contributed by the Ni-rich nanodomains reduced by Equation (4) for specimens aged for (a) 0 h, (b) 1 h, (c) 5 h and (d) 20 h, respectively. In Figure 6, the power-law scattering in the middle-Q region (0.012~0.05 Å−1) of the SAXS profile also shows I(Q) ∝ Q−α with α being 2, revealing direct evidence of a disk-/plate-like morphology, consistent with previous studies [15,20]. The reduced SAXS profiles corresponding to the Ni-rich nanodomains can be fitted well using the model of Equation (1). The variation in thickness and the radius of disk-/plate-like Ni-rich nanodomains determined by model-fitting analysis with aging time are shown in Figure 7 for specimens aged from 0 h to 20 h. The temporal evolution of relative volume fractons determined by the model analysis is also shown in Figure 5a. The morphology of Ni-rich nanodomains changes from the original thin disk to an oblate nanoparticle during isothermal aging (0 to 20 h). The relative volume fractions of the Ni-rich nanodomains can also be model-independently determined using the intensity integration of 1D SAXS profiles (Porod invariant method) according to Equation (3). Figure 5a shows the temporal evolution of the normalized relative volume fraction of the Ni-rich nanodomains determined by the model-independent method. From Figure 5a, the relative volume fraction of the Ni-rich nanodomains drops rapidly as the aging time increases from 0 h to 5 h, showing the characteristic of the dissolution stage and instability of Ni-rich nanodomains at high temperature. Once the decay of the volume fraction of Ni-rich nanodomains reaches saturation at ~3 h, the subsequent relative volume fraction remains at ~0.25, with some fluctuation, due to the uncertainties from the data treatment, background substraction and measurement, as shown in Figure 5a. The relative volume fraction determined by the model fitting method agrees with those determined by the model-independent method, showing the consistency of the cross examination.
Approach (II) was a direct and model-independent structural analysis with respect to the single radial SAXS streak caused by the Ni-rich nanodomains lying on the habit plane of a specially oriented crystal grain [39,40]. The structural evolution of this oriented streak intensity with respect to this nanodomain group can also be resolved. The thickness of the specific disk-/plate-like nanodomains with such an orientation can be directly determined by slicing (line-cutting) the profile along the radial direction of this streak [19,39,40]. The details of the method and associated plots are provided in Figure S2. The thickness variation of the nanodomains with aging time determined by this model-independent Guinier approximation, also shown in Figure 7, agrees with the thickness values determined by model analysis.
3.3. Variation of Strain Glass Temperature Tg and Frequency-Dependent Storage Modulus E0 with Aging Time at 250 °C
According to reported studies [4,5,15,48], the Ni-rich Ti50−xNi50+x SMA (x > 1.2) exhibits the frequency-dependent storage modulus minimum caused by a softening dip in elastic constant C44 with frequency dispersion during cooling, showing an evidence for strain glass transition. The temperature corresponding to the minimum of the storage modulus E0 vs. temperature curve in strain glass is also characterized as the glass transition temperature Tg. Therefore, the strain glass can be characterized by the existence of the frequency-dependent behavior of Tg. Figure S3 shows the frequency-dependent dip in the storage modulus E0 vs. temperature curves of the Ti48.7Ni51.3 specimen aged at 250 °C for 0, 1, 3, 5, 10 and 20 h measured by DMA at frequencies 1~50 Hz. The Tg values measured at different frequencies for the specimens aged for 0, 1, 3, 5, 10 and 20 h are listed in Table S1. Moreover, the characteristic of strain glass can be regarded as the ability to suppress the martensitic transformation and exhibit the strain glass transition. Therefore, due to the frequency dispersion effect of strain glass, the difference between the maximum and minimum Tg values obtained at different frequencies from 1 Hz to 50 Hz, denoted here by ΔTg, can be used to be an index for quantitatively measuring the characteristic of the strain glass. Table 1 shows the glass transition temperature Tg,1Hz determined by the dip of the storage modulus E0 curves measured at 1 Hz as the representative index. For each aging time, the determined ΔTg value is also listed in Table 1. The variation of ΔTg with aging time is shown in Figure 5b, indicating the loss of the strain glass characteristic with increases in aging time.
4. Discussion
4.1. Concurrent Phase Evolutions and Kinetics of Ni-Rich Nanodomains and Ti3Ni4 Nanoprecipitates
4.1.1. Precipitation Kinetics and Mechanism of Ti3Ni4 Nanoprecipitates
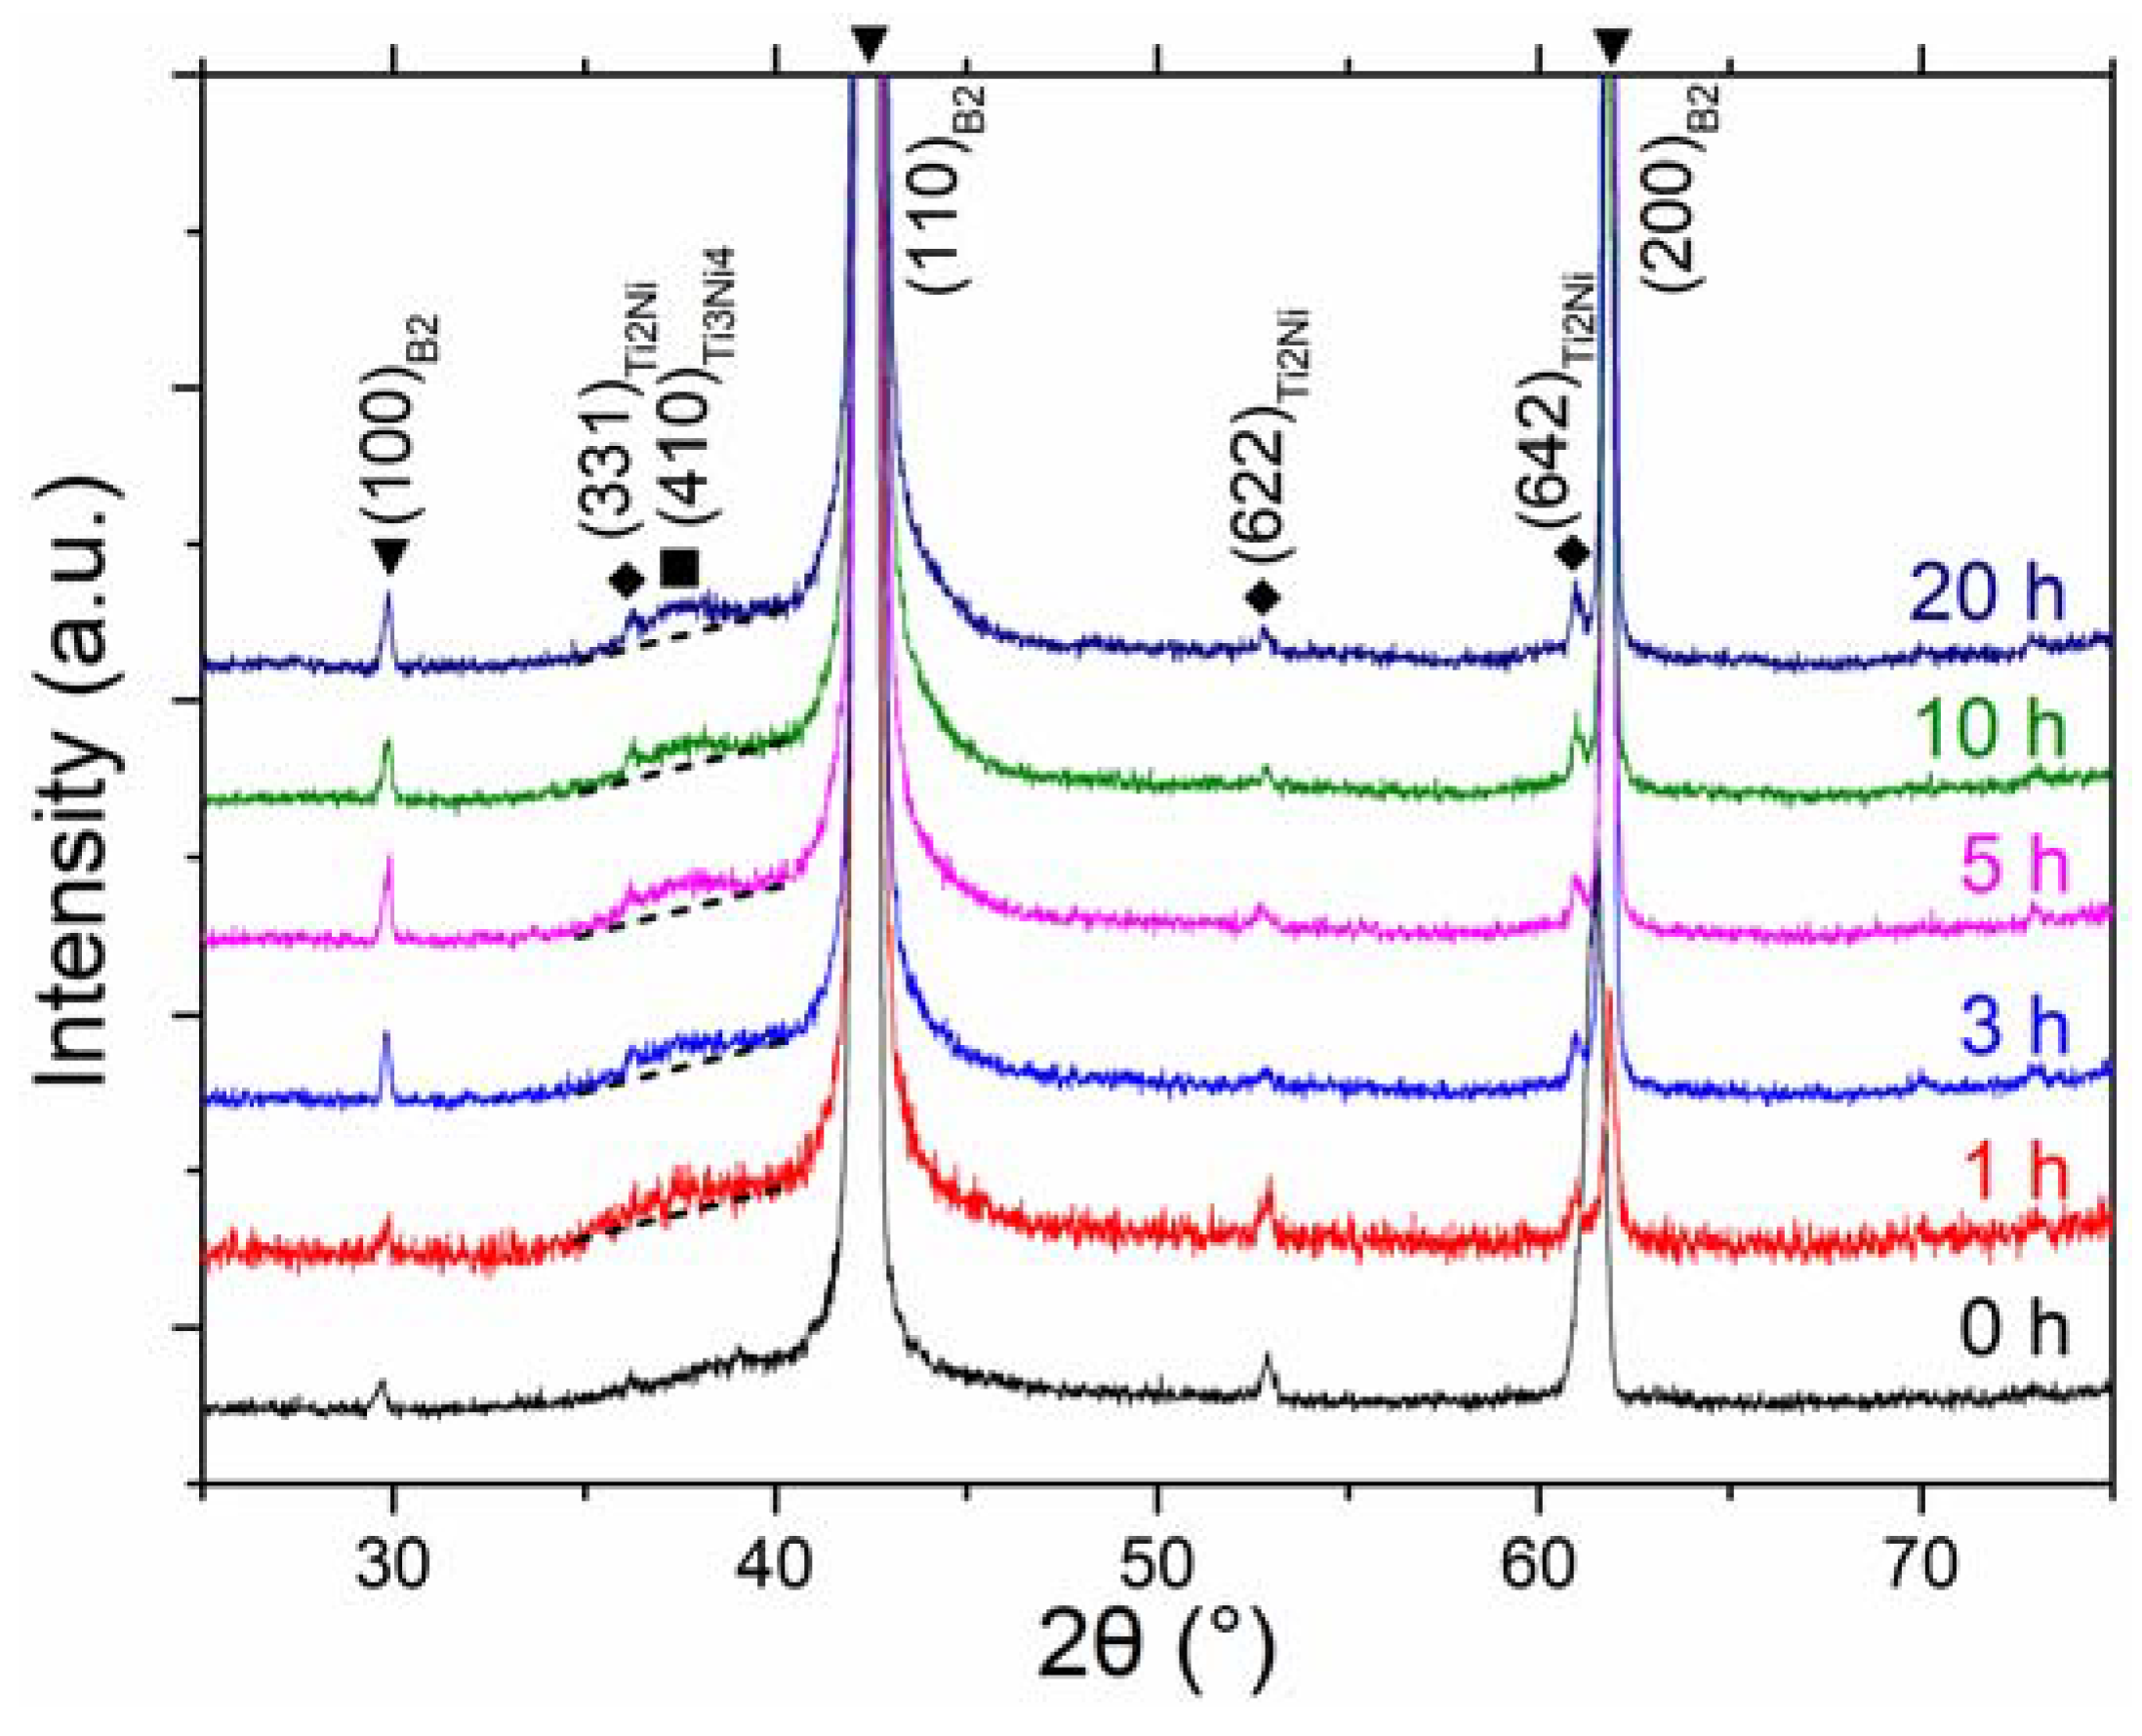
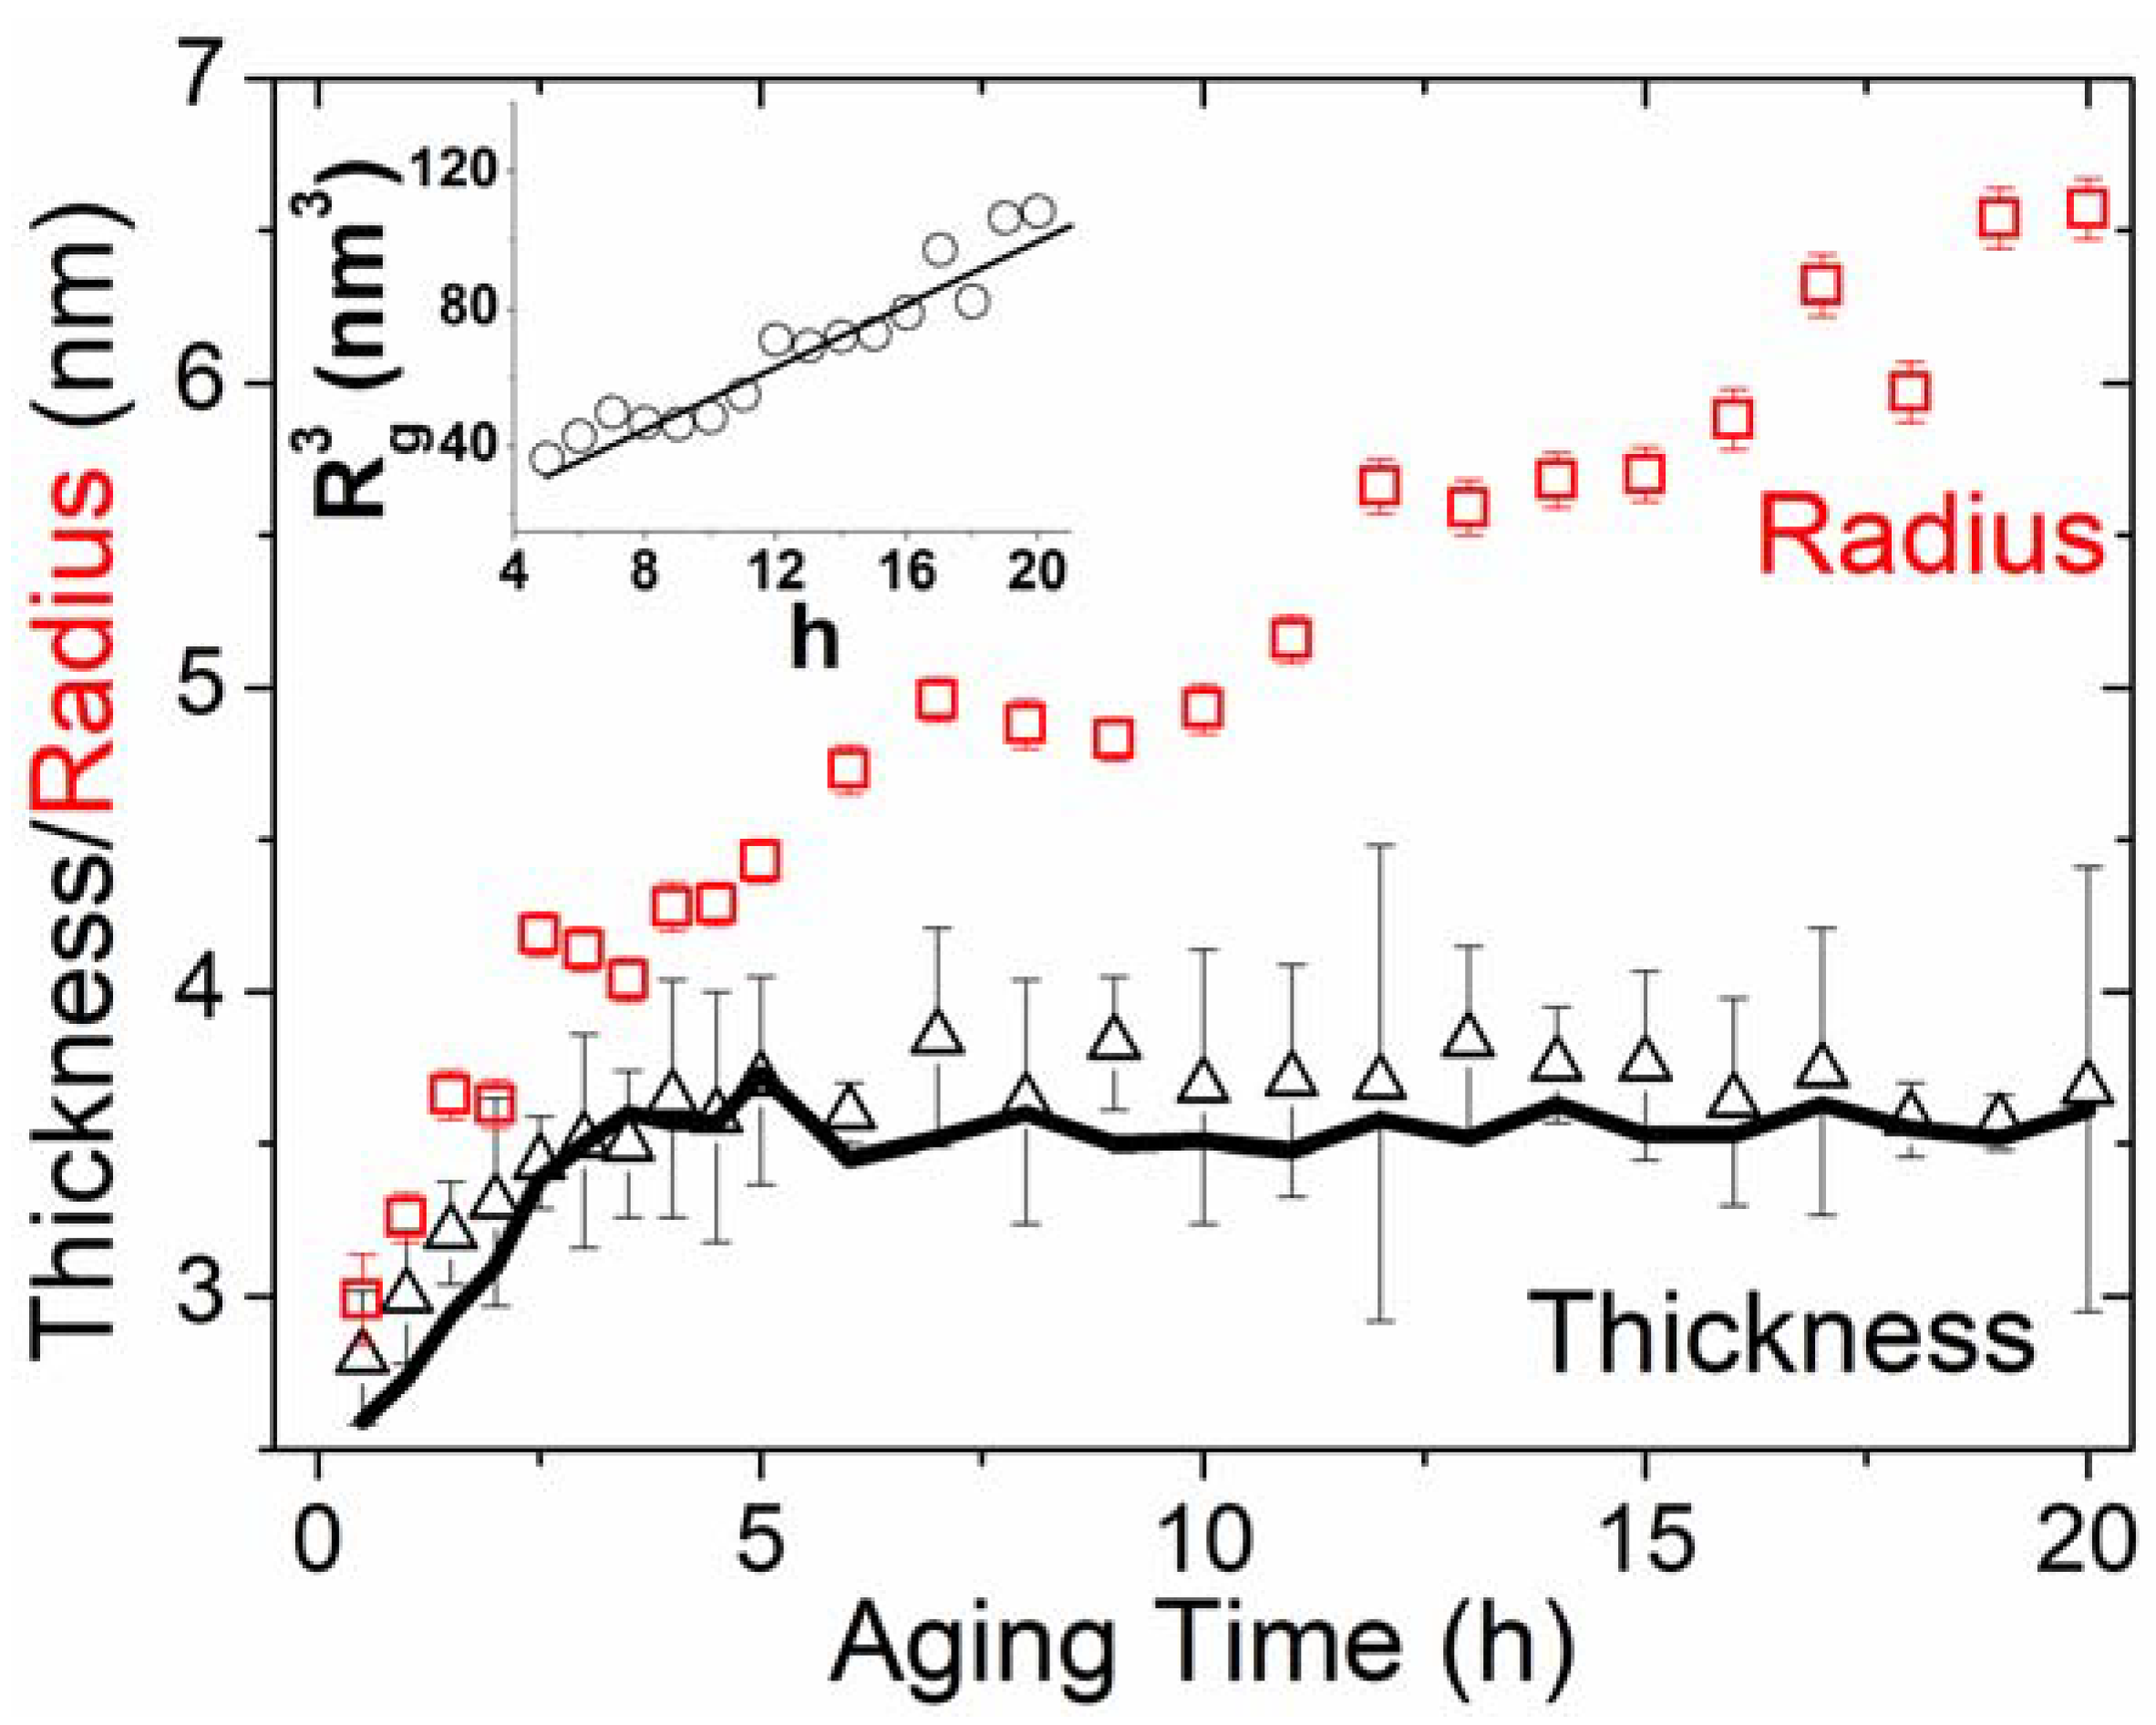
In the past, reports on the precipitation kinetics and mechanism of Ti3Ni4 nanoprecipitates in Ni-rich TiNi SMA were rare [49,50]. In this study, the quantitation and mechanism investigation on the structural evolution, phase transition and kinetic behavior of Ti3Ni4 nanoprecipitation are revealed using in situ SAXS and ex situ XRD. In as-quenched Ti48.7Ni51.3 SMA, only Ni-rich nanodomains exist, as indicated by the radially oriented streaks shown in Figure 1a. In contrast, Ti3Ni4 nanoprecipitates quickly nucleate and have a remarkable cylinder size of 3 nm in radius and 2.8 nm in thickness within the initial 0.5 h of isothermal aging, as shown in Figure 4. The nuclei of new nanoprecipitates form with random orientations at new sites, directly resolved by the 2D SAXS pattern. Note that the thicknesses of Ti3Ni4 nanoprecipitate nuclei are much larger than that of the Guinier–Preston zone (GPZ) in the Al-Cu system [18] or Ni-rich nanodomains in the as-quenched Ti48.7Ni51.3 SMA [15]. It is speculated that the quick formation of large Ti3Ni4 nuclei can be attributed to the short-range diffusion of Ni atoms near the sites of concurrently-dissolving Ni-rich nanodomains, or the nucleation site based on the splitting pieces from the original Ni-rich nanodomains, as discussed in Section 4.1.2. The distinctive changes of the concurrent development in the relative volume fraction, radius and thickness of Ti3Ni4 nanoprecipitates are quantitatively shown in Figure 4 and Figure 5a in detail according to the analysis of in situ SAXS measurement. The theoretical modeling and prediction of the kinetics in thickness and radius for anisotropic nanoprecipitates are still full of challenges and difficulties due to complex factors such as strain field and coherent interface. Therefore, the related theoretical or experimental information is fundamentally important and interesting to the in-depth research for generally correlating the process, structure and properties. Basically, the precipitation kinetics of Ti3Ni4 phase, in terms of relative volume fraction η, agrees with the prediction of Johnson-Mehl, Avrami, Kolmogorov (JMAK) kinetics based on the nucleation, growth and coarsening stages, as shown in Figure 5a. The JMAK kinetic model is expressed by η = 1 − exp(−ktn), where k is the rate constant [51,52,53,54]. After 5 h of 250 °C isothermal aging, the precipitate enters the late stage of typical particle coarsening, also called Oswald ripening, characterized by the completion of the volume fraction growth (approaching a relative volume fraction of 1.0, as shown in Figure 5a). During this stage, the radius still grows from 4.5 nm to 6.5 nm, with an almost fixed thickness of 3.6 nm. A similar morphology change was also found in the development of plate-like T1 precipitates in Al-Cu-Li alloy [55]. It is noted that, after 5 h of aging, the temporal behavior of the radius of gyration Rg = (T2/12 + R2/2)1/2, where T and R are the thickness and the radius of disk-/plate-like particles, also follows the usual coarsening kinetics (Rg3 ∝ aging time t), as shown in the inset of Figure 4. Therefore, the number density of Ti3Ni4 nanoprecipitates decreases with increases in aging time during the coarsening stage. For aging times of 0 h to 5 h (i.e., in the early stage), the volume fraction, radius and thickness rapidly increase with the aging time. This stage can be characterized by the typical nucleation and growth as a concomitant process according to the classical precipitation theory [20,56]. In this nucleation and growth stage, there is an interesting phenomenon. The growth of the thickness begins to saturate at 3 h of aging, which is consistent with the quick completion of the volume fraction development during the dissolution of Ni-rich nanodomains, as revealed in Figure 4 and Figure 5a. The evidence suggests that the growth rate in the nucleation and growth stage of Ti3Ni4 nanoprecipitation is affected by the concurrent dissolution of Ni-rich nanodomains. It is also noted that the radius and thickness at 3 h of aging determined by the in situ SAXS (Figure 4) are close to the morphology of Ti3Ni4 nanoprecipitates shown in the TEM picture of the literature (Figure 1 in [16]) for Ti48.7Ni51.3 SMA aged at 200 °C for 3 h. On the other hand, Figure 8 shows the XRD patterns of Ti48.7Ni51.3 SMA aged at 250 °C from 0 h to 20 h. The peaks of Ti2Ni phase appear in the as-quenched specimen and remain in the specimen aged for 1~20 h, which confirms the SAXS results describing the Ti2Ni large particles. In addition to the B2 matrix and Ti2Ni phase, a peak progressively merges at ~37° (i.e., the (131) plane of Ti3Ni4 phase) with increasing the aging time. The black dashed lines in the XRD profiles of 1~20 h at 35°~40° reveal and emphasize the formation of Ti3Ni4 during aging. Moreover, the weak intensity and broad peak also suggest the low quantity and the tiny size of Ti3Ni4 precipitates.
4.1.2. Dissolution Kinetics and Mechanism of Ni-Rich Nanodomains
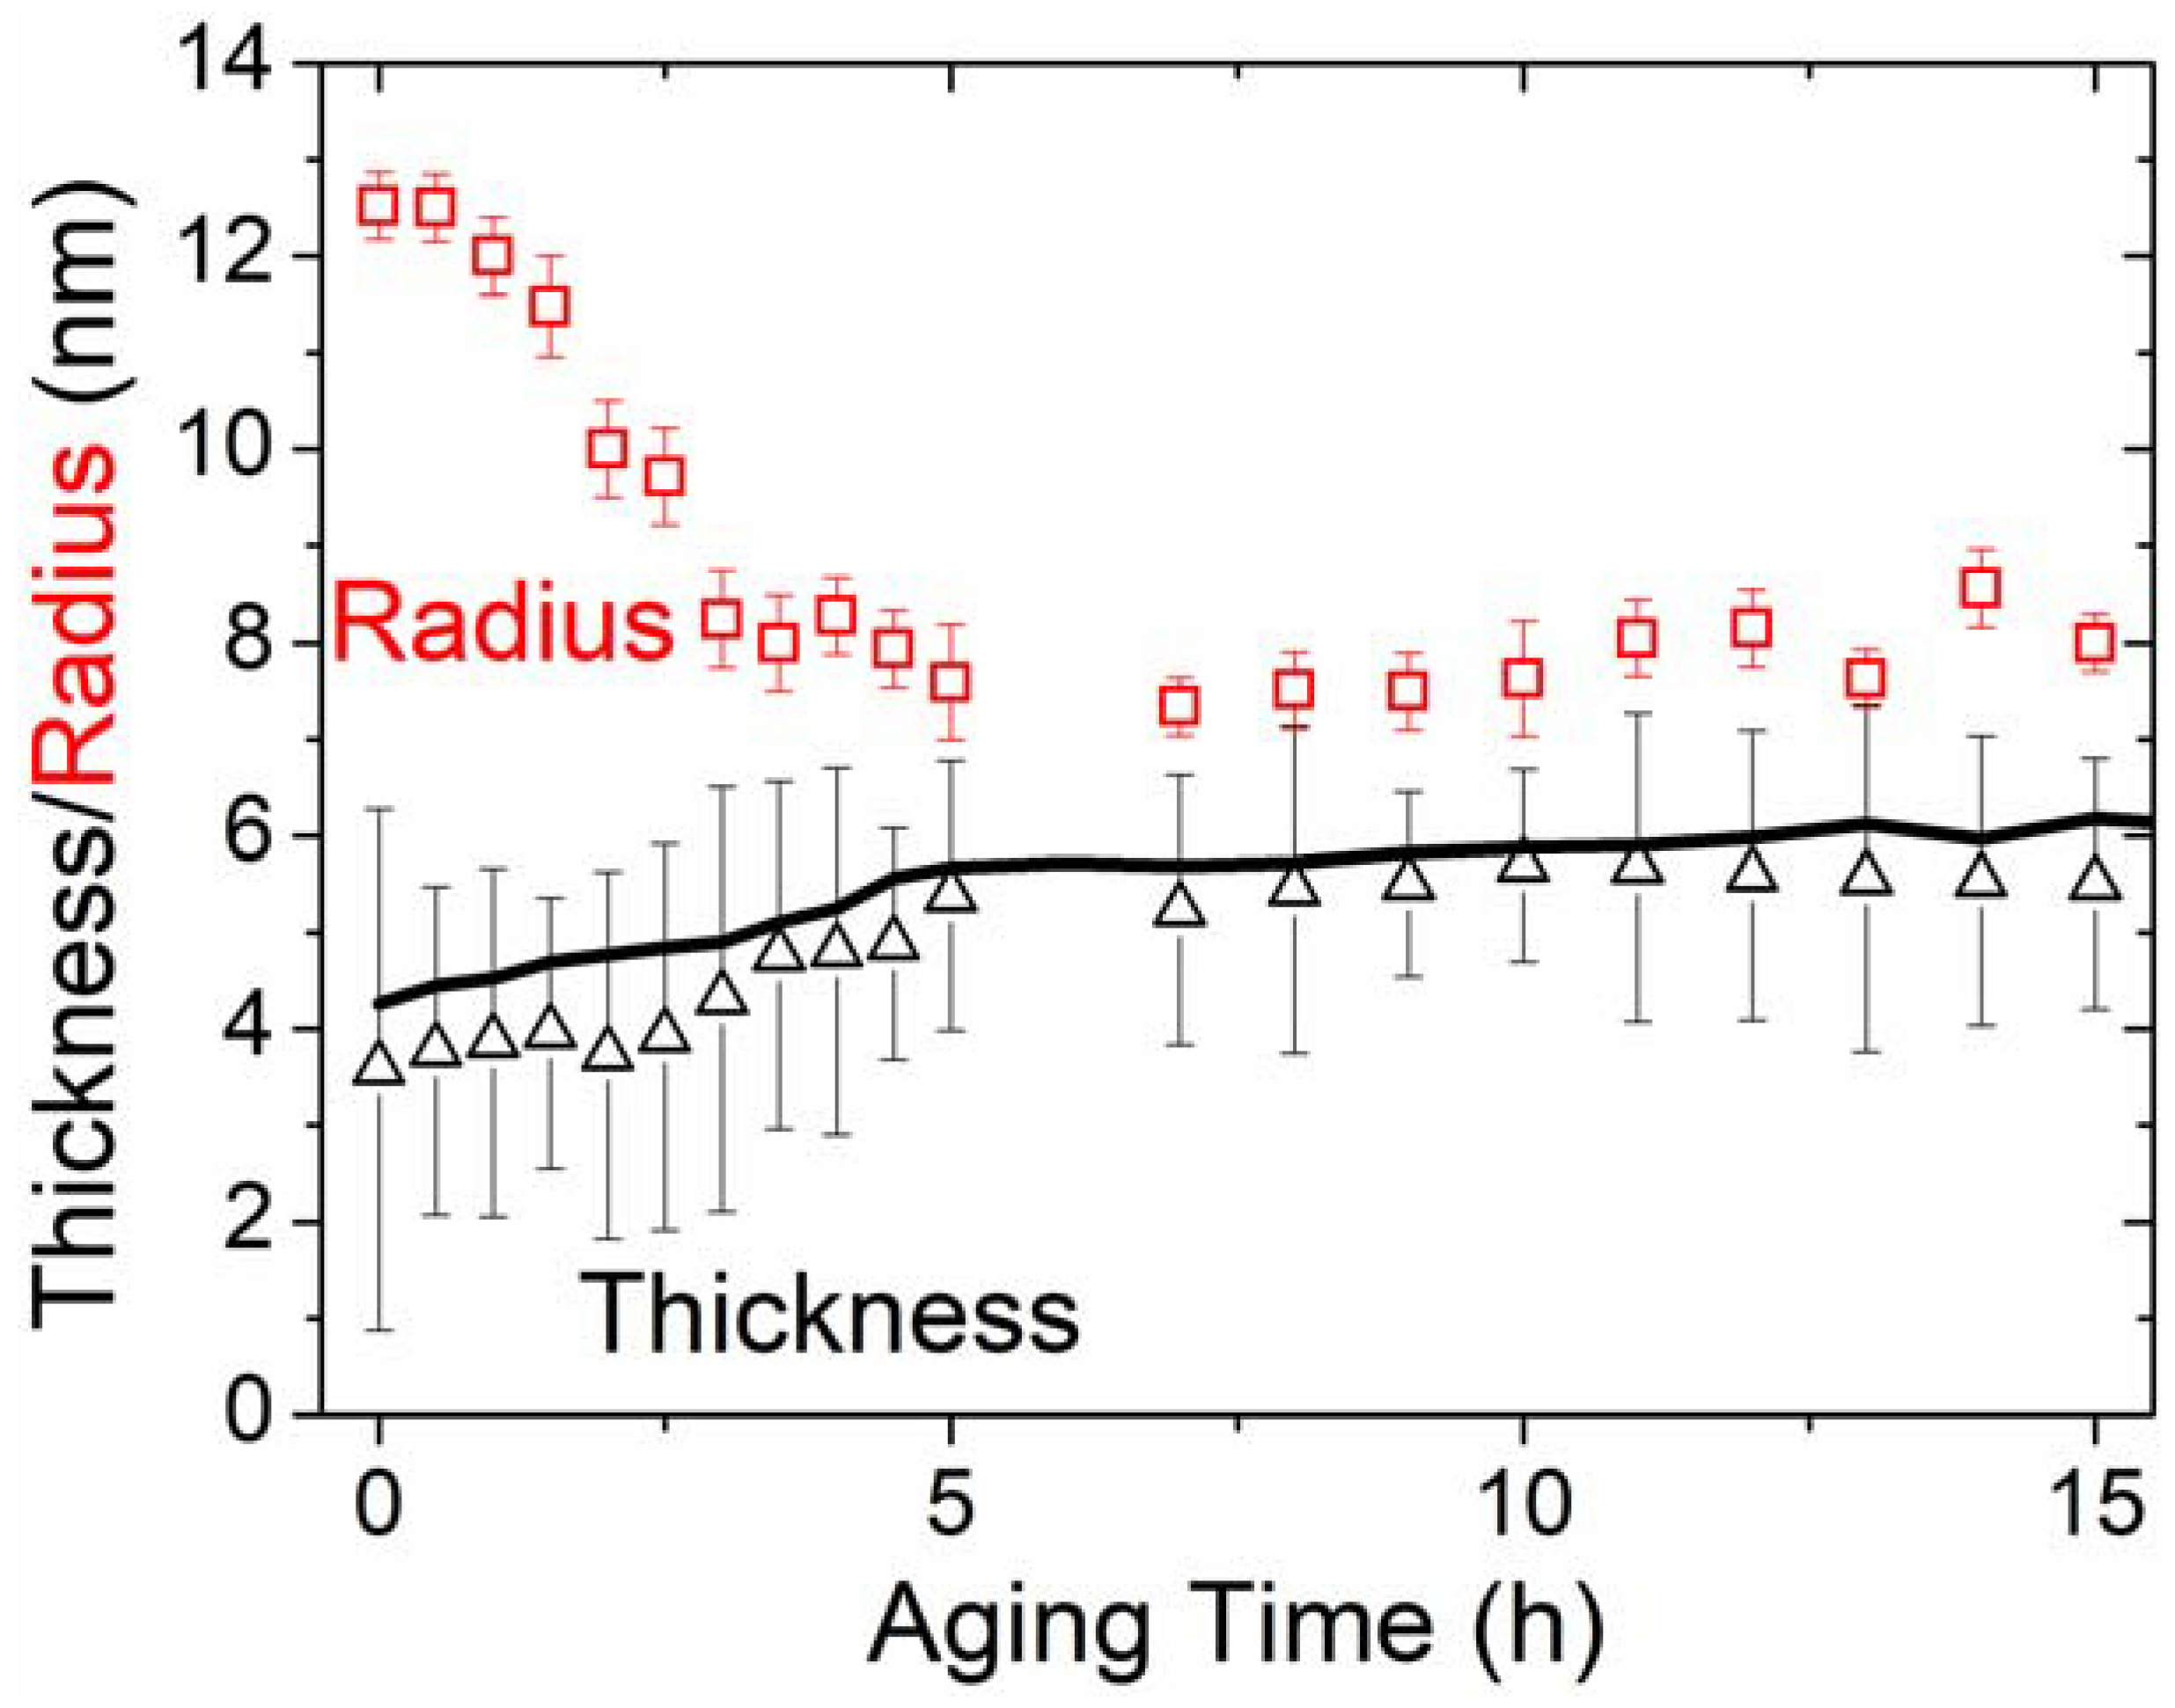
The dissolution kinetics and structural evolution of Ni-rich nanodomains during the isothermal aging at 250 °C were also revealed using the in situ SAXS technique. Compared to the previous SAXS study [15], this study provides more accurate and important information by resolving Ti3Ni4 nanoprecipitates and Ni-rich nanodomains from the in situ SAXS analysis without the interference or errors from different samplings. The kinetics of the dissolution of Ni-rich nanodomains that form during the quenching process can be simply described by relative volume fraction η with the model developed for diffusion-controlled dissolution of the clusters [54], as given by the cluster model of η = A[(1 − Bt1/2)3 + C], shown in Figure 5a. Here, B is a constant factor, and A and C are normalized constants modified for undissolved fractions. The decrease in volume fraction of the dissolution of Ni-rich nanodomains is saturated or completed at 3 h of aging with a residual invariant fraction of 0.25. This dissolution saturation is concurrent with the nucleation and growth of Ti3Ni4 nanoprecipitates and could be related to why the hardness variation with the aging time has a maximum at 3 h, as shown in our previous study (Figure 1c of [15]). Apparently, the dissolution kinetics of Ni-rich nanodomains, which is faster than the precipitation kinetics of Ti3Ni4 nanophase, serves as a source of Ni atoms. The concurrent decrease in radius and increase in thickness of Ni-rich nanodomains reach saturation at 5 h of aging, as shown in Figure 7, which may be mutually influenced by the coarsening stage of Ti3Ni4 nanoprecipitates also starting at 5 h of aging (Figure 5a). The radius of the dissolved Ni-rich nanodomains substantially shrinks to provide Ni atoms for concurrent nucleation and growth of Ti3Ni4 nanoprecipitates. Based on Figure 5a and Figure 7, it is noted that their relative number density, estimated by the ratio of relative volume fraction to the nanodomain volume, does not vary with time. We do not exclude the splitting of nanodomains into several pieces, in which a portion serves as the sites of Ti3Ni4 nanophase nuclei and the others remain in dissolution. During the stage of dissolution (0~5 h), although the radius of Ni-rich nanodomains largely shrinks from 12.5 nm to 7 nm, the thickness still increases from 3.6 nm to 5.2 nm.
This evolutional behavior can be explained by the balance between the coherent interface and the strain field (in the face and thickness sides) toward the lowest free energy. It is interesting that the stable size of dissolved Ni-rich nanodomains (7 nm in radius and 5.2 nm in thickness) is close to that of Ti3Ni4 nanoprecipitates grown at the coarsening stage (6.5 nm in radius and 3.6 nm in thickness). We may speculate that the main driving forces for both concurrent morphology evolutions are dominated by the coherent interface and the strain field in the surrounding matrix, rather than the volume energy of the nanoparticles. According to the evolution of the Ti3Ni4 peak of ex situ XRD patterns in Figure 8, it can be speculated that the residual amount of Ni-rich nanodomains with the saturation amount of ~0.25 may directly transform to Ti3Ni4 nanoprecipitates, which are more stable phase in thermodynamics, such that these residual nanodomains could not be dissolved with further aging.
4.2. Role and Quantitative Correlation of Ni-Rich Nanodomains and Ti3Ni4 Nanoprecipitates to the Loss of Strain Glass Characteristic
A realistic mechanism and experimental data of how these excess Ni atom defects and the Ni-rich nanodomains result in the strain glass characteristic are still undetermined. Moreover, no reports to date have demonstrated the relationship of how the strain glass characteristic varies with the amount or the morphology of Ti3Ni4 nanoprecipitates. To our knowledge, no studies have provided experimental evidence of the role of concurrently existing Ni-rich nanodomains and Ti3Ni4 nanoprecipitates in causing or suppressing the strain glass characteristic in Ti48.7Ni51.3 SMA. In this study, we quantitatively correlate the structural evolutions of Ni-rich nanodomains and Ti3Ni4 nanoprecipitates with the loss of strain glass behavior to reveal their roles in causing the strain glass characteristic.
The loss of the strain glass behavior due to the change of aggregation type and lattice ordering of excess Ni atoms, such as Ni-rich nanodomains vs. Ti3Ni4 nanoprecipitates, can be represented by (1) the decrease of ΔTg down to zero and (2) the increase of Tg,1Hz, as shown in Figure 5b and Table 1. For evaluating the loss of the strain glass, ΔTg is the major index because it considers the variation of frequency-dependent behavior. As shown in Figure 5b, the strain glass characteristic is gradually lost with increases in aging time from 0 h to 20 h, as demonstrated by the decrease of ΔTg from ~11 °C to ~0.4 °C. The variation of ΔTg with aging time shows a decay curve smoothly approaching 0 at 20 h. In addition, from Table S1, one can see that the Tg temperature of the specimen aged for 20 h is frequency-independent, instead of frequency-dependent. The as-quenched Ti48.7Ni51.3 SMA aged at 250 °C for more than 20 h would fully lose the strain glass characteristic and exhibit the typical SMA characteristic.
From the viewpoint of the relative volume fraction and the radii of both nanoparticles shown in Figure 4, Figure 5 and Figure 7, the change rate of the loss of the strain glass characteristic is related to the dissolution and shrinkage rate of Ni-rich nanodomains. When the characteristic of strain glass disappears (at close to 20 h), the existing stable particles are Ti3Ni4 nanoprecipitates because the residual amount of Ni-rich nanodomains may transform to Ti3Ni4 nanoprecipitates, as discussed in Section 4.1.2. It has been experimentally confirmed that the strain glass characteristic is caused by the Ni-rich nanodomains that form in the as-quenched process. In addition, the amount and radius of Ni-rich nanodomains have a positive effect on the enhancement of the strain glass characteristic (i.e., the increase of ΔTg). In contrast, the existence and the amount of Ti3Ni4 nanoprecipitates linearly degrade the strain glass characteristic. The thickness effect of both nanoparticles seems to have no significant effect on the degradation of the strain glass characteristic. This study quantitatively provides the correlation of the strain glass transition with relative volume fraction, radius and thickness of Ni-rich nanodomains and Ti3Ni4 nanoprecipitates.
5. Conclusions
The correlation of the strain glass characteristic with the structural evolution of the Ni-rich nanodomains and the Ti3Ni4 nanoprecipitates for as-quenched Ti48.7Ni51.3 SMA aged for up to 20 h has been investigated by in situ SAXS technique, XRD tests and DMA storage modulus measurement. The SAXS results demonstrate that the disk-/plate-like Ti3Ni4 nanoprecipitates nucleate and grow with the concurrent dissolution of the originally existed Ni-rich nanodomains during the early aging period of 0~5 h. The morphology evolution of both Ti3Ni4 nanoprecipitates and Ni-rich nanodomains is determined by the model fitting method and the model-independent method for cross examination. The volume fraction evolutions of both nanoparticles demonstrate that the dissolution kinetics of Ni-rich nanodomains, serving as a source of Ni atoms, is faster than the precipitation kinetics of Ti3Ni4 nanoprecipitates. The SAXS technique also resolves the orientation information of the nanoparticles. DMA measurements reveal the loss of the strain glass characteristics as the aging time increases. Due to the positive correlation between the extent of frequency dispersion and the amount of Ni-rich nanodomains, the strain glass transition is proposed to be induced by the Ni-rich nanodomains. The residual Ni-rich nanodomains are also proposed to evolve to Ti3Ni4 nanoprecipitates based on the XRD patterns and the loss of the strain glass characteristics.
Supplementary Materials
The following are available online at https://www.mdpi.com/2075-4701/8/5/352/s1, Figure S1: Kratky-Porod plots ( versus ), selected to show the evolution of thickness (determined by the slope of fitting lines) of Ti3Ni4 nanoprecipitates with aging time (The data are separated by vertical translation), Figure S2: Guinier plots ( versus ), selected to show the evolution of thickness (determined by the slope of fitting lines) of Ni-rich nanodomains with aging time (The data are separated by vertical translation), Figure S3: Frequency-dependent dip in the storage modulus E0 vs. temperature curves of the Ti48.7Ni51.3 specimens aged at 250 °C for 0, 1, 3, 5, 10 and 20 h measured by DMA at frequencies 1~50 Hz, Table S1: Glass transition temperature Tg determined by the minimum of storage modulus E0 curves at different frequencies and the difference between the maximum Tg and the minimum Tg, ΔTg, of storage modulus E0 dip at different frequencies in Ti48.7Ni51.3 SMA for different aging times. (All the data are come from Figure S3).
Author Contributions
Y.C.H., C.S.T and S.K.W designed the research. Y.C.H. conducted the experiments, data analysis and drafted the manuscript. C.S.T. participated in the data analysis, experimental discussion and interpretation. S.K.W. contributed to the interpretation of the results and the revision of the manuscript.
Funding
This research was funded by Ministry of Science and Technology (MOST), Taiwan, under grant number MOST 105-2221-E002-043-MY2.
Acknowledgments
The authors gratefully acknowledge the financial support for this study provided by the Ministry of Science and Technology (MOST), Taiwan, under Grant No. MOST 105-2221-E002-043-MY2.
Conflicts of Interest
The authors declare no conflicts of interest.
References
- Otsuka, K.; Shimizu, K. Pseudoelasticity and shape memory effects in alloys. Int. Met. Rev. 1986, 31, 93–114. [Google Scholar] [CrossRef]
- Otsuka, K.; Wayman, C.M. Shape Memory Materials; Cambridge University Press: Cambridge, UK, 1999; pp. 1–96. [Google Scholar]
- Otsuka, K.; Ren, X. Physical metallurgy of Ti-Ni-based shape memory alloys. Prog. Mater. Sci. 2005, 50, 511–678. [Google Scholar] [CrossRef]
- Sarkar, S.; Ren, X.B.; Otsuka, K. Evidence for strain glass in the ferroelastic-martensitic system Ti50−xNi50+x. Phys. Rev. Lett. 2005, 95, 205702. [Google Scholar] [CrossRef] [PubMed]
- Ren, X.B.; Wang, Y.; Otsuka, K.; Lloveras, P.; Castan, T.; Porta, M.; Planes, A.; Saxena, A. Ferroelastic nanostructures and nanoscale transitions: Ferroics with point defects. MRS Bull. 2009, 34, 838–846. [Google Scholar] [CrossRef]
- Vasseur, R.; Lookman, T. Effects of disorder in ferroelastics: A spin model for strain glass. Phys. Rev. B 2010, 81, 094107. [Google Scholar] [CrossRef]
- Ren, X.B.; Wang, Y.; Zhou, Y.M.; Zhang, Z.; Wang, D.; Fan, G.L.; Otsuka, K.; Suzuki, T.; Ji, Y.C.; Zhang, J.; et al. Strain glass in ferroelastic systems: Premartensitic tweed versus strain glass. Philos. Mag. 2010, 90, 141–157. [Google Scholar] [CrossRef]
- Wang, D.; Wang, Y.Z.; Zhang, Z.; Ren, X.B. Modeling abnormal strain states in ferroelastic systems: The role of point defects. Phys. Rev. Lett. 2010, 105, 205702–205704. [Google Scholar] [CrossRef] [PubMed]
- Ren, X.B. Strain glass and strain glass transition. In Disorder and Strain-Induced Complexity in Functional Materials; Springer: Berlin/Heidelberg, Germany, 2012; pp. 201–225. [Google Scholar]
- Vugmeister, B.E.; Glinchuk, M.D. Dipole glass and ferroelectricity in random-site electric-dipole systems. Rev. Mod. Phys. 1990, 62, 993–1026. [Google Scholar] [CrossRef]
- Mydosh, J.A. Spin Glasses; Taylor & Francis: London, UK, 1993; pp. 3–9. [Google Scholar]
- Snyder, J.; Slusky, J.S.; Cava, R.J.; Schiffer, P. How ‘spin ice’ freezes. Nature 2001, 413, 48–51. [Google Scholar] [CrossRef] [PubMed]
- Wang, Y.; Ren, X.B.; Otsuka, K. Shape memory effect and superelasticity in a strain glass alloy. Phys. Rev. Lett. 2006, 97, 225703. [Google Scholar] [CrossRef] [PubMed]
- Wang, D.; Zhang, Z.; Zhang, J.A.; Zhou, Y.M.; Wang, Y.; Ding, X.D.; Wang, Y.Z.; Ren, X.B. Strain glass in Fe-doped Ti-Ni. Acta Mater. 2010, 58, 6206–6215. [Google Scholar] [CrossRef]
- Chien, C.; Tsao, C.S.; Wu, S.K.; Chang, C.Y.; Chang, P.C.; Kuo, Y.K. Characteristics of the strain glass transition in as-quenched and 250 °C early-aged Ti48.7Ni51.3 shape memory alloy. Acta Mater. 2016, 120, 159–167. [Google Scholar] [CrossRef]
- Ji, Y.C.; Ding, X.D.; Lookman, T.; Otsuka, K.; Ren, X.B. Heterogeneities and strain glass behavior: Role of nanoscale precipitates in low-temperature-aged Ti48.7Ni51.3 alloys. Phys. Rev. B 2013, 87, 104110. [Google Scholar] [CrossRef]
- Glatter, O.; Kratky, O. Small Angle X-ray Scattering; Academic Press: Cambridge, MA, USA, 1982; p. 222. [Google Scholar]
- Tsao, C.S.; Huang, E.W.; Wen, M.H.; Kuo, T.Y.; Jeng, S.L.; Jeng, U.S.; Sun, Y.S. Phase transformation and precipitation of an Al-Cu alloy during non-isothermal heating studied by in situ small-angle and wide-angle scattering. J. Alloys Compd. 2013, 579, 138–146. [Google Scholar] [CrossRef]
- Huang, E.W.; Tsao, C.S.; Wen, M.H.; Kuo, T.Y.; Tu, S.Y.; Wu, B.W.; Su, C.J.; Jeng, U.S. Resolution of structural transformation of intermediates in Al-Cu alloys during non-isothermal precipitation. J. Mater. Res. 2014, 29, 874–879. [Google Scholar] [CrossRef]
- Tsao, C.S.; Chen, C.Y.; Jeng, U.S.; Kuo, T.Y. Precipitation kinetics and transformation of metastable phases in Al-Mg-Si alloys. Acta Mater. 2006, 54, 4621–4631. [Google Scholar] [CrossRef]
- Dorin, T.; Deschamps, A.; De Geuser, F.; Lefebvre, W.; Sigli, C. Quantitative description of the T-1 formation kinetics in an Al-Cu-Li alloy using differential scanning calorimetry, small-angle X-ray scattering and transmission electron microscopy. Philos. Mag. 2014, 94, 1012–1030. [Google Scholar] [CrossRef]
- De Geuser, F.; Malard, B.; Deschamps, A. Microstructure mapping of a friction stir welded AA2050 Al-Li-Cu in the T8 state. Philos. Mag. 2014, 94, 1451–1462. [Google Scholar] [CrossRef] [Green Version]
- Deschamps, A.; Brechet, Y. Influence of predeformation and ageing of an Al-Zn-Mg alloy—II. Modeling of precipitation kinetics and yield stress. Acta Mater. 1998, 47, 293–305. [Google Scholar] [CrossRef]
- Deschamps, A.; Livet, F.; Brechet, Y. Influence of predeformation on ageing in an Al-Zn-Mg alloy—I. Microstructure evolution and mechanical properties. Acta Mater. 1998, 47, 281–292. [Google Scholar] [CrossRef]
- Nicolas, M.; Deschamps, A. Characterisation and modelling of precipitate evolution in an Al-Zn-Mg alloy during non-isothermal heat treatments. Acta Mater. 2003, 51, 6077–6094. [Google Scholar] [CrossRef]
- Dumont, M.; Lefebvre, W.; Doisneau-Cottignies, B.; Deschamps, A. Characterisation of the composition and volume fraction of η and η′ precipitates in an Al-Zn-Mg alloy by a combination of atom probe, small-angle X-ray scattering and transmission electron microscopy. Acta Mater. 2005, 53, 2881–2892. [Google Scholar] [CrossRef]
- Hutchinson, C.R.; de Geuser, F.; Chen, Y.; Deschamps, A. Quantitative measurements of dynamic precipitation during fatigue of an Al-Zn-Mg-(Cu) alloy using small-angle X-ray scattering. Acta Mater. 2014, 74, 96–109. [Google Scholar] [CrossRef]
- Tsao, C.S.; Lin, T.L.; Yu, M.S. δ′ precipitation in Al-9.7at%Li alloy using small-angle X-ray scattering. J. Alloys Compd. 1999, 289, 81–87. [Google Scholar] [CrossRef]
- Panagos, P.; Wang, Y.; McCartney, D.G.; Li, M.; Ghaffari, B.; Zindel, J.W.; Miao, J.; Makineni, S.; Allison, J.E.; Shebanova, O.; et al. Characterising precipitate evolution in multi-component cast aluminium alloys using small-angle X-ray scattering. J. Alloys Compd. 2017, 703, 344–353. [Google Scholar] [CrossRef]
- Prasher, M.; Sen, D. Influence of aging on phase transformation and microstructure of Ni50.3Ti29.7Hf20 high temperature shape memory alloy. J. Alloys Compd. 2014, 615, 469–474. [Google Scholar] [CrossRef]
- Xu, H.J.; Lu, Z.; Ukai, S.; Oono, N.; Liu, C.M. Effects of annealing temperature on nanoscale particles in oxide dispersion strengthened Fe-15Cr alloy powders with Ti and Zr additions. J. Alloys Compd. 2017, 693, 177–187. [Google Scholar] [CrossRef]
- Saida, J.; Yamada, R.; Kozikowski, P.; Imafuku, M.; Sato, S.; Ohnuma, M. Characterization of nano-quasicrystal-formation in correlation to the local structure in Zr-based metallic glasses containing Pd. J. Alloys Compd. 2017, 707, 46–50. [Google Scholar] [CrossRef]
- De Geuser, F.; Styles, M.J.; Hutchinson, C.R.; Deschamps, A. High-throughput in-situ characterization and modeling of precipitation kinetics in compositionally graded alloys. Acta Mater. 2015, 101, 1–9. [Google Scholar] [CrossRef] [Green Version]
- Deschamps, A.; Garcia, M.; Chevy, J.; Davo, B.; De Geuser, F. Influence of Mg and Li content on the microstructure evolution of Al-Cu-Li alloys during long-term ageing. Acta Mater. 2017, 122, 32–46. [Google Scholar] [CrossRef]
- Gumbmann, E.; De Geuser, F.; Sigli, C.; Deschamps, A. Influence of Mg, Ag and Zn minor solute additions on the precipitation kinetics and strengthening of an Al-Cu-Li alloy. Acta Mater. 2017, 133, 172–185. [Google Scholar] [CrossRef]
- Biswas, A.; Sen, D.; Sarkar, S.K.; Sarita; Mazumder, S.; Seidman, D.N. Temporal evolution of coherent precipitates in an aluminum alloy W319: A correlative anisotropic small angle X-ray scattering, transmission electron microscopy and atom-probe tomography study. Acta Mater. 2016, 116, 219–230. [Google Scholar] [CrossRef]
- Kim, J.I.; Miyazaki, S. Comparison of shape memory characteristics of a Ti-50.9 At. Pct Ni alloy aged at 473 and 673 K. Metall. Mater. Trans. A 2005, 36, 3301–3310. [Google Scholar] [CrossRef]
- Kim, J.I.; Miyazaki, S. Effect of nano-scaled precipitates on shape memory behavior of Ti-50.9 at % Ni alloy. Acta Mater. 2005, 53, 4545–4554. [Google Scholar] [CrossRef]
- Fratzl, P.; Langmayr, F.; Paris, O. Evaluation of 3D small-angle scattering from nonspherical particles in single-crystals. J. Appl. Crystallogr. 1993, 26, 820–826. [Google Scholar] [CrossRef]
- De Geuser, F.; Bley, F.; Deschamps, A. A new method for evaluating the size of plate-like precipitates by small-angle scattering. J. Appl. Crystallogr. 2012, 45, 1208–1218. [Google Scholar] [CrossRef]
- Yen, F.-C.; Hwang, K.-S.; Wu, S.-K. Fabrication of porous Ti-rich Ti51Ni49 by evaporating NaCl space holder. Metall. Mater. Trans. A 2014, 45, 2626–2635. [Google Scholar] [CrossRef]
- Nishida, M.; Wayman, C.M.; Honma, T. Precipitation processes in near-equiatomic TiNi shape memory alloys. Metall. Trans. A 1986, 17, 1505–1515. [Google Scholar] [CrossRef]
- Arciniegas, M.; Casals, J.; Manero, J.M.; Peña, J.; Gil, F.J. Study of hardness and wear behaviour of NiTi shape memory alloys. J. Alloys Compd. 2008, 460, 213–219. [Google Scholar] [CrossRef]
- Chen, Q.; Wu, X.F.; Ko, T. The effects of Ti3Ni4 precipitates on the R-phase transformation. Scr. Metall. Mater. 1993, 29, 49–53. [Google Scholar] [CrossRef]
- Kline, S.R. Reduction and analysis of SANS and USANS data using IGOR Pro. J. Appl. Crystallogr. 2006, 39, 895–900. [Google Scholar] [CrossRef]
- Tsao, C.S.; Li, M.; Zhang, Y.; Leao, J.B.; Chiang, W.S.; Chung, T.Y.; Tzeng, Y.R.; Yu, M.S.; Chen, S.H. Probing the room temperature spatial distribution of hydrogen in nanoporous carbon by use of small-angle neutron scattering. J. Phys. Chem. C 2010, 114, 19895–19900. [Google Scholar] [CrossRef]
- Deschamps, A.; Brechet, Y.; Livet, F. Influence of copper addition on precipitation kinetics and hardening in Al-Zn-Mg alloy. Mater. Sci. Technol. 1999, 15, 993–1000. [Google Scholar] [CrossRef]
- Ren, X.B. Strain glass and ferroic glass—Unusual properties from glassy nano-domains. Phys. Status Solidi B 2014, 251, 1982–1992. [Google Scholar] [CrossRef]
- Fan, G.; Zhou, Y.; Chen, W.; Yang, S.; Ren, X.; Otsuka, K. Precipitation kinetics of Ti3Ni4 in polycrystalline Ni-rich TiNi alloys and its relation to abnormal multi-stage transformation behavior. Mater. Sci. Eng. A 2006, 438, 622–626. [Google Scholar] [CrossRef]
- Filip, P.; Mazanec, K. On precipitation kinetics in TiNi shape memory alloys. Scr. Mater. 2001, 45, 701–707. [Google Scholar] [CrossRef]
- Avrami, M. Kinetics of phase change I—General theory. J. Chem. Phys. 1939, 7, 1103–1112. [Google Scholar] [CrossRef]
- Johnson, W.A.; Mehl, R.F. Reaction kinetics in processes of nucleation and growth. Trans. Metall. AIME 1939, 135, 416–442. [Google Scholar]
- Kolmogoroff, A. Zur Statistik der Kristallisationsvorgänge in Metallen. Izv. Akad. Nauk SSSR Ser. Mater. 1937, 1, 355–359. [Google Scholar]
- Esmaeili, S.; Lloyd, D.J.; Poole, W.J. Modeling of precipitation hardening for the naturally aged Al-Mg-Si-Cu alloy AA6111. Acta Mater. 2003, 51, 3467–3481. [Google Scholar] [CrossRef]
- Dorin, T.; Deschamps, A.; De Geuser, F.; Sigli, C. Quantification and modelling of the microstructure/strength relationship by tailoring the morphological parameters of the T-1 phase in an Al-Cu-Li alloy. Acta Mater. 2014, 75, 134–146. [Google Scholar] [CrossRef]
- Deschamps, A.; Sigli, C.; Mourey, T.; de Geuser, F.; Lefebvre, W.; Davo, B. Experimental and modelling assessment of precipitation kinetics in an Al-Li-Mg alloy. Acta Mater. 2012, 60, 1917–1928. [Google Scholar] [CrossRef]
Figure 1.
Two-dimensional (2D) small angle X-ray scattering (SAXS) patterns measured from Ti48.7Ni51.3 SMA aged at 250 °C for (a) 0 h (as-quenched), (b) 1 h, (c) 3 h, (d) 5 h, (e) 10 h and (f) 20 h.
Figure 1.
Two-dimensional (2D) small angle X-ray scattering (SAXS) patterns measured from Ti48.7Ni51.3 SMA aged at 250 °C for (a) 0 h (as-quenched), (b) 1 h, (c) 3 h, (d) 5 h, (e) 10 h and (f) 20 h.

Figure 2.
SAXS pattern showing the sector region only including isotropic scattering and the slice cut direction along the radial streak for the specimen aged at 250 °C for (a) 0 h and (b) 1 h, respectively.
Figure 2.
SAXS pattern showing the sector region only including isotropic scattering and the slice cut direction along the radial streak for the specimen aged at 250 °C for (a) 0 h and (b) 1 h, respectively.

Figure 3.
1D SAXS profiles of the Ti3Ni4 nanoprecipitates reduced from the sector zone of Figure 2 for the specimen aged for (a) 0 h (as-quenched), (b) 1 h, (c) 5 h and (d) 20 h. The 1D SAXS profiles are fitted well by the model calculated intensities (solid lines), which are sum of two contributions of (1) the large particles showing the power-law scattering of exponent = −4 (dotted line) and (2) the disk/plate nanoprecipitates (dashed line).

Figure 4.
Evolution of mean thickness and the radius (triangle and square symbols, respectively) of Ti3Ni4 nanoprecipitates determined by the model fitting with the aging time from 0.5 h to 20 h. The solid line represents the variation of thickness determined by the model-independent Kratky–Porod approximation. The inset is the plot of Rg3 vs. aging time.

Figure 5.
(a) Temporal behaviors of normalized relative volume fraction of Ti3Ni4 nanoprecipitates and Ni-rich nanodomains determined by both the model fitting method and the model-independent Porod method, respectively. The theoretical JMAK and cluster models for precipitation and dissolution kinetics, respectively, are shown together for comparison; (b) Variation of ΔTg with aging times. (All the data are come from Table 1).

Figure 6.
1D SAXS profiles mainly contributed by the Ni-rich nanodomains for aging time of (a) 0 h (as-quenched), (b) 1 h, (c) 5 h and (d) 20 h. The solid line represents the model fitting intensity profile.
Figure 6.
1D SAXS profiles mainly contributed by the Ni-rich nanodomains for aging time of (a) 0 h (as-quenched), (b) 1 h, (c) 5 h and (d) 20 h. The solid line represents the model fitting intensity profile.

Figure 7.
Evolution of mean thickness and the radius (triangle and square symbols, respectively) of Ni-rich nanodomains determined by the model fitting (Approach I) with the aging time from 0.5 h to 20 h. The solid line represents the variation of thickness determined by the model-independent Guinier plot from the single streak (Approach II).

Figure 8.
XRD patterns measured at room temperature for Ti48.7Ni51.3 SMA aged at 250 °C from 0 h to 20 h.
Figure 8.
XRD patterns measured at room temperature for Ti48.7Ni51.3 SMA aged at 250 °C from 0 h to 20 h.

Table 1.
Glass transition temperature Tg determined by the minimum of storage modulus E0 curves at 1 Hz and the difference between the maximum Tg and the minimum Tg, ΔTg, of storage modulus E0 dip among all frequencies in Ti48.7Ni51.3 SMA for different aging times.
Table 1.
Glass transition temperature Tg determined by the minimum of storage modulus E0 curves at 1 Hz and the difference between the maximum Tg and the minimum Tg, ΔTg, of storage modulus E0 dip among all frequencies in Ti48.7Ni51.3 SMA for different aging times.
| Aging Time (h) | 0 | 1 | 3 | 5 | 10 | 20 |
|---|---|---|---|---|---|---|
| Tg,1Hz (°C) | −56.7 | −46.9 | −37.5 | −19.6 | −7.29 | 3.55 |
| ΔTg (°C) | 11.1 | 3.9 | 2.5 | 2.0 | 1.38 | 0.38 |
© 2018 by the authors. Licensee MDPI, Basel, Switzerland. This article is an open access article distributed under the terms and conditions of the Creative Commons Attribution (CC BY) license (http://creativecommons.org/licenses/by/4.0/).
Share and Cite
MDPI and ACS Style
Huang, Y.-C.; Tsao, C.-S.; Wu, S.-K. A Study on the Nanoparticles Evolution in Isothermally Aged Strain Glass of Ti48.7Ni51.3 Shape Memory Alloy by In Situ Small-Angle X-ray Scattering. Metals 2018, 8, 352. https://doi.org/10.3390/met8050352
AMA Style
Huang Y-C, Tsao C-S, Wu S-K. A Study on the Nanoparticles Evolution in Isothermally Aged Strain Glass of Ti48.7Ni51.3 Shape Memory Alloy by In Situ Small-Angle X-ray Scattering. Metals. 2018; 8(5):352. https://doi.org/10.3390/met8050352
Chicago/Turabian StyleHuang, Yung-Chien, Cheng-Si Tsao, and Shyi-Kaan Wu. 2018. "A Study on the Nanoparticles Evolution in Isothermally Aged Strain Glass of Ti48.7Ni51.3 Shape Memory Alloy by In Situ Small-Angle X-ray Scattering" Metals 8, no. 5: 352. https://doi.org/10.3390/met8050352
Note that from the first issue of 2016, this journal uses article numbers instead of page numbers. See further details here.