Investigation of Nanoporous Superalloy Membranes for the Production of Nanoemulsions


1
Institut für Werkstoffe, Technische Universität Braunschweig, Langer Kamp 8, 38106 Braunschweig, Germany
2
Institut für Partikeltechnik, Technische Universität Braunschweig, Volkmaroder Str. 5, 38104 Braunschweig, Germany
3
Zentrum für Pharmaverfahrenstechnik—PVZ, Technische Universität Braunschweig, Franz-Liszt Straße 35A, 38106 Braunschweig, Germany
*
Authors to whom correspondence should be addressed.
Metals 2018, 8(5), 361; https://doi.org/10.3390/met8050361
Submission received: 27 February 2018
/
Revised: 7 May 2018
/
Accepted: 14 May 2018
/
Published: 16 May 2018
Abstract
:Premix membrane emulsification is a gentle process for producing nanoemulsions, i.e., for pharmaceutical purposes. The operating time of common membranes is short today, because of their fragility, membrane fouling and poor cleanability. In contrast, superalloy membranes are cleansable because of their high mechanical strength as well as high chemical and thermal resistances and therefore, could achieve clearly longer operating times. Their usability for premix membrane emulsification is investigated in this study. Different flow rates of the premix emulsion were tested up to 21 cycles with a small-scale extruder, three different nanoporous superalloy membrane structures have been tested in comparison to a common polymer membrane. Varying the two-phase-structure (γ- and γ′-phase) of superalloy bulk material through thermal or thermo-mechanical treatments and chemical extraction of either one of the phases, different membrane microstructures could be obtained. These membranes differ in pore size, pore structure, and porosity, resulting in different flow resistances, droplet sizes and droplet size distributions in the investigated premix membrane emulsification process. Emulsions with droplet sizes in the desired range of 100 to 500 nm and with acceptable droplet size distributions were achieved. Data display an improved process stability for superalloy membranes, however, special attention needs to be paid towards narrow droplet size distributions.
1. Introduction
Nanoemulsions which carry lipophilic drugs for intravenous, peroral and dermal administrations are commonly produced by high pressure homogenization [1,2]. Due to high pressure, high energy dissipation and high shear forces, temperatures are increased and sensitive substances, such as proteins, may suffer [3]. Direct membrane emulsification, in contrast, yields very small droplet sizes and narrow droplet size distributions with relatively low use of energy, resulting in low process temperatures [4]. On the other hand, the relatively low transmembrane flux leads to long process times. In premix membrane emulsification, a pre-dispersed emulsion is extruded and recirculated through a membrane, achieving higher transmembrane flux [5]. Therefore, premix membrane emulsification is promising in terms of gently processing emulsions with lipid phase droplets in nanometer scale. Common membrane materials, for example polycarbonate or polyester, are quite fragile, likely prone to fouling and hence, get disposed after short operating times [6]. Metallic nanoporous membranes can be produced from nickel-based superalloys [7]. They possess great resistance against heat and chemicals, which enables thermal or chemical cleansing. Their high mechanical strength enables operation at higher pressure. Therefore, those membranes are expected to achieve clearly longer operating times during premix membrane emulsification than the common polymer membranes.
The production process of nickel-based superalloy membranes has been developed and investigated in several studies [7,8,9,10,11,12]. The key is to develop an interpenetrating network out of the γ-matrix phase, a nickel-rich solid solution, and the γ′-precipitates (Ni3Al) through thermo-mechanical or thermal (load-free) treatments and to extract either one of them electro-chemically afterwards. First, the alloy is homogenized in several steps. During cooling from homogenization, nucleation of the γ′-particles occurs already, due to their very fast precipitation kinetics [13]. In fast cooled material, a high density of very fine γ′-particles develops, while in slow cooled material fewer bigger γ′-particles grow. Therefore, the γ′-particles show different behavior in the following step, the precipitation hardening. The γ′-particles grow in cuboidal shape, in case of fast (air) cooled, and in coarser, more irregular shape, in case of slow (furnace) cooled material from homogenization (for further details see [10,13]). In the next step, the γ′-particles are coarsened directionally, through thermo-mechanical [9,12,13,14,15], or irregularly, through thermal treatment [9], until the two phases are in themselves connected and interpenetrate each other. Due to their different electro-chemical potentials, the γ- and γ′-phase can then be separated from each other through electrochemical phase extraction [12]. The resulting structures have pores in the size range of a few hundred nanometers to a few microns [11,12] and can be used as membrane material [8]. These are channel-like, in case of the thermo-mechanical, and irregular, and interconnected, in case of the thermal treatment.
In this study, we investigated the suitability of two load-free coarsened membranes (LF-membranes), where either the γ′-phase (LF-γ-membrane) or the γ-phase (LF-γ′-membrane) was extracted, and a thermo-mechanically coarsened membrane, where the γ-phase (TM-γ′-membrane) was extracted. For these membranes, premix membrane emulsification was processually characterized in comparison to a common track etched polyester membrane (PE-membrane) with a pore size of 200 nm.
2. Materials and Methods
2.1. Manufacturing of the Superalloy Membranes
Three different types of superalloy membranes were produced from nickel-based superalloy CMSX-4® [16] single crystals. The details of the production processes are found in [8,9,10,11,12]. To produce the TM-γ′-membrane, the material was air cooled (AC) after homogenization, precipitation- hardened and thermo-mechanically coarsened under tension. Then the γ-phase was extracted electro-chemically. The material for the LF-membranes was furnace cooled (FC), precipitation hardened and coarsened load-free through thermal treatment. Then the γ-phase, in case of the LF-γ′-membrane, and the γ′-phase, in case of the LF-γ-membrane were extracted. The manufacturing steps are described in Section 2.1.1–Section 2.1.3 and summarized in Table 1.
2.1.1. Homogenization and Precipitation Heat Treatment
In order to homogenize the material, it was heat-treated in eight and seven steps, respectively as shown in Table 1. For the production of TM-γ′-membranes, the material was air cooled (AC) from homogenization final temperature to room temperature. The γ′-particles grew in cuboidal shape with edge length of a few hundred nanometers during precipitation hardening at 1080 °C for four hours. On the next step, a second γ′-particle-stabilizing annealing at 870 °C for 16 h was executed.
For the production of LF-membranes, the material was furnace cooled (FC) from homogenization final temperature to 1080 °C with a velocity of 0.2 °C/min. In precipitation hardening, for four hours at 1080 °C, which was directly executed after homogenization, the γ′-particles grew coarser and in more irregular shape than in the fast cooled material.
2.1.2. Coarsening of the γ′-Phase and Electro-Chemical Phase Extraction
The coarsening process of the γ′-phase was accomplished in two different ways. The material of the TM-γ′-membrane was loaded parallel to its dendrites with a tensile stress of 170 MPa at 1000 °C. The LF-membranes material was coarsened load-free at 1080 °C for 1000 h.
The material was cut through spark erosion into 0.6 mm thick sheets with a diameter of 19 mm. The final thickness of approximately 0.3 mm was achieved by grinding. On the next step, the γ-phase of the TM-γ′-membrane and LF-γ′-membrane was extracted under a potential of 1.3 V in an aqueous electrolyte containing 1 wt % citric acid and 1 wt % ammonium sulfate. In case of the LF-γ-membrane, 1 vol % hydrogen chloride in methanol as electrolyte and a potential of 0.3 V was used to extract the γ′-phase.
2.1.3. Superalloy Membrane Characterization
The microstructure of superalloy membranes was investigated with a scanning electron microscope (Leo 1550, Zeiss, Jena, Germany). For quantitative comparison of the membranes pore sizes, Hinze [11] formulated an equation including the law of laminar flow of Hagen-Poiseulle [17], the description of Darcy of a fluid flow through a porous medium [18], and the length related flow resistance of the membranes. With the process values pressure drop (Δp) and flow rate (), the membrane characteristics porosity (ε), flow area (A), height (s) and the dynamic viscosity of the pre-emulsion (η), a cylindrical capillary equivalent pore diameter (cce) (Equation (1)) and the viscosity coefficient (α) is calculated (Equation (2)).
2.2. Premix Membrane Emulsification
2.2.1. Pre-Emulsion Composition and Preparation
The pre-emulsions consist of 82.5% double-distilled water and 10% medium chain triglycerides (MCT; Miglyol® 812, Caesar and Loretz GmbH, Hilden, Germany) as liquid oil. To stabilize the resulting pre-emulsion, 7.5% sodium dodecyl sulfate (SDS, Texapon L100, Henkel & Cie GmbH, Düsseldorf, Germany) was used. The pre-emulsions were dispersed with a rotor-stator high shear mixer (Ultra-Turrax® IKA 25T) with a S25N-10G dispersion tool (both: IKA®-Werke GmbH & Co. KG, Staufen, Germany) at approx. 8 m/s for 1 min. Viscosities of the pre-emulsion was measured with a Bohlin Gemini rheometer (Malvern Instruments, Malvern, UK) applying a Searl measuring system. Measurements were evaluated at shear rates between 1 and 100 s−1 at a temperature of 20 °C to a mean value of 2.72 ± 0.38 mPa·s.
2.2.2. Instrumented Small-Scale Extruder
For the premix membrane emulsification, an instrumented small-scale extruder, developed by Gehrmann et al. [19] was used. Its components are a high pressure computer controlled syringe pump (neMESYS UserInterface software, version 2.6.0.4.), a 10 mL syringe and a membrane holder for membranes with a diameter of 19 mm, all made of stainless steel. The latter was either equipped with a custom-made nanoporous superalloy membrane or a PE-membrane (Pieper Filter, Bad Zwischenahn, Germany). For all studies, 10 mL emulsion was extruded with different adjustable flow rates into an open collection container which was connected to the syringe for recycling the emulsion. The syringe pump, equipped with the 10 mL syringe, can operate with a maximum pressure of 120 bar.
2.2.3. Experimental Set up
The final number of cycles through the small scale extruder was set to 21. After the 1st, 5th, 11th and 21st cycle, a small amount of the extruded emulsion was abstracted. An integrated pressure sensor monitored the extrusion pressure (p) and was read off at the 1st, 5th, 11th and 21st cycle. For specific energy consideration, the extrusion pressures were added up to the 1st, 5th, 11th and 21st cycle. The flow rates were adjusted in respect to the maximum pressure of the syringe and were chosen to 0.5, 1.0 and 1.4 mL/s. The specific energy () input was calculated according to Equation (3).
2.2.4. Droplet Size Determination
To measure the droplet size and droplet size distribution, a laser light diffractometer with polarization intensity differential scattering (PIDS) technology (LS 13320, Beckman-Coulter, Krefeld, Germany) was used. Samples were adequately diluted with distilled water and three runs of 90 s each were performed. The volume distributions and corresponding , and values were calculated using the Mie theory [20], assuming refraction indices of 1.46 for the droplets and 1.33 for the aqueous phase. The droplet size distribution was determined with the help of the span according to Equation (4).
3. Results and Discussion
3.1. Microstructure of the Membranes
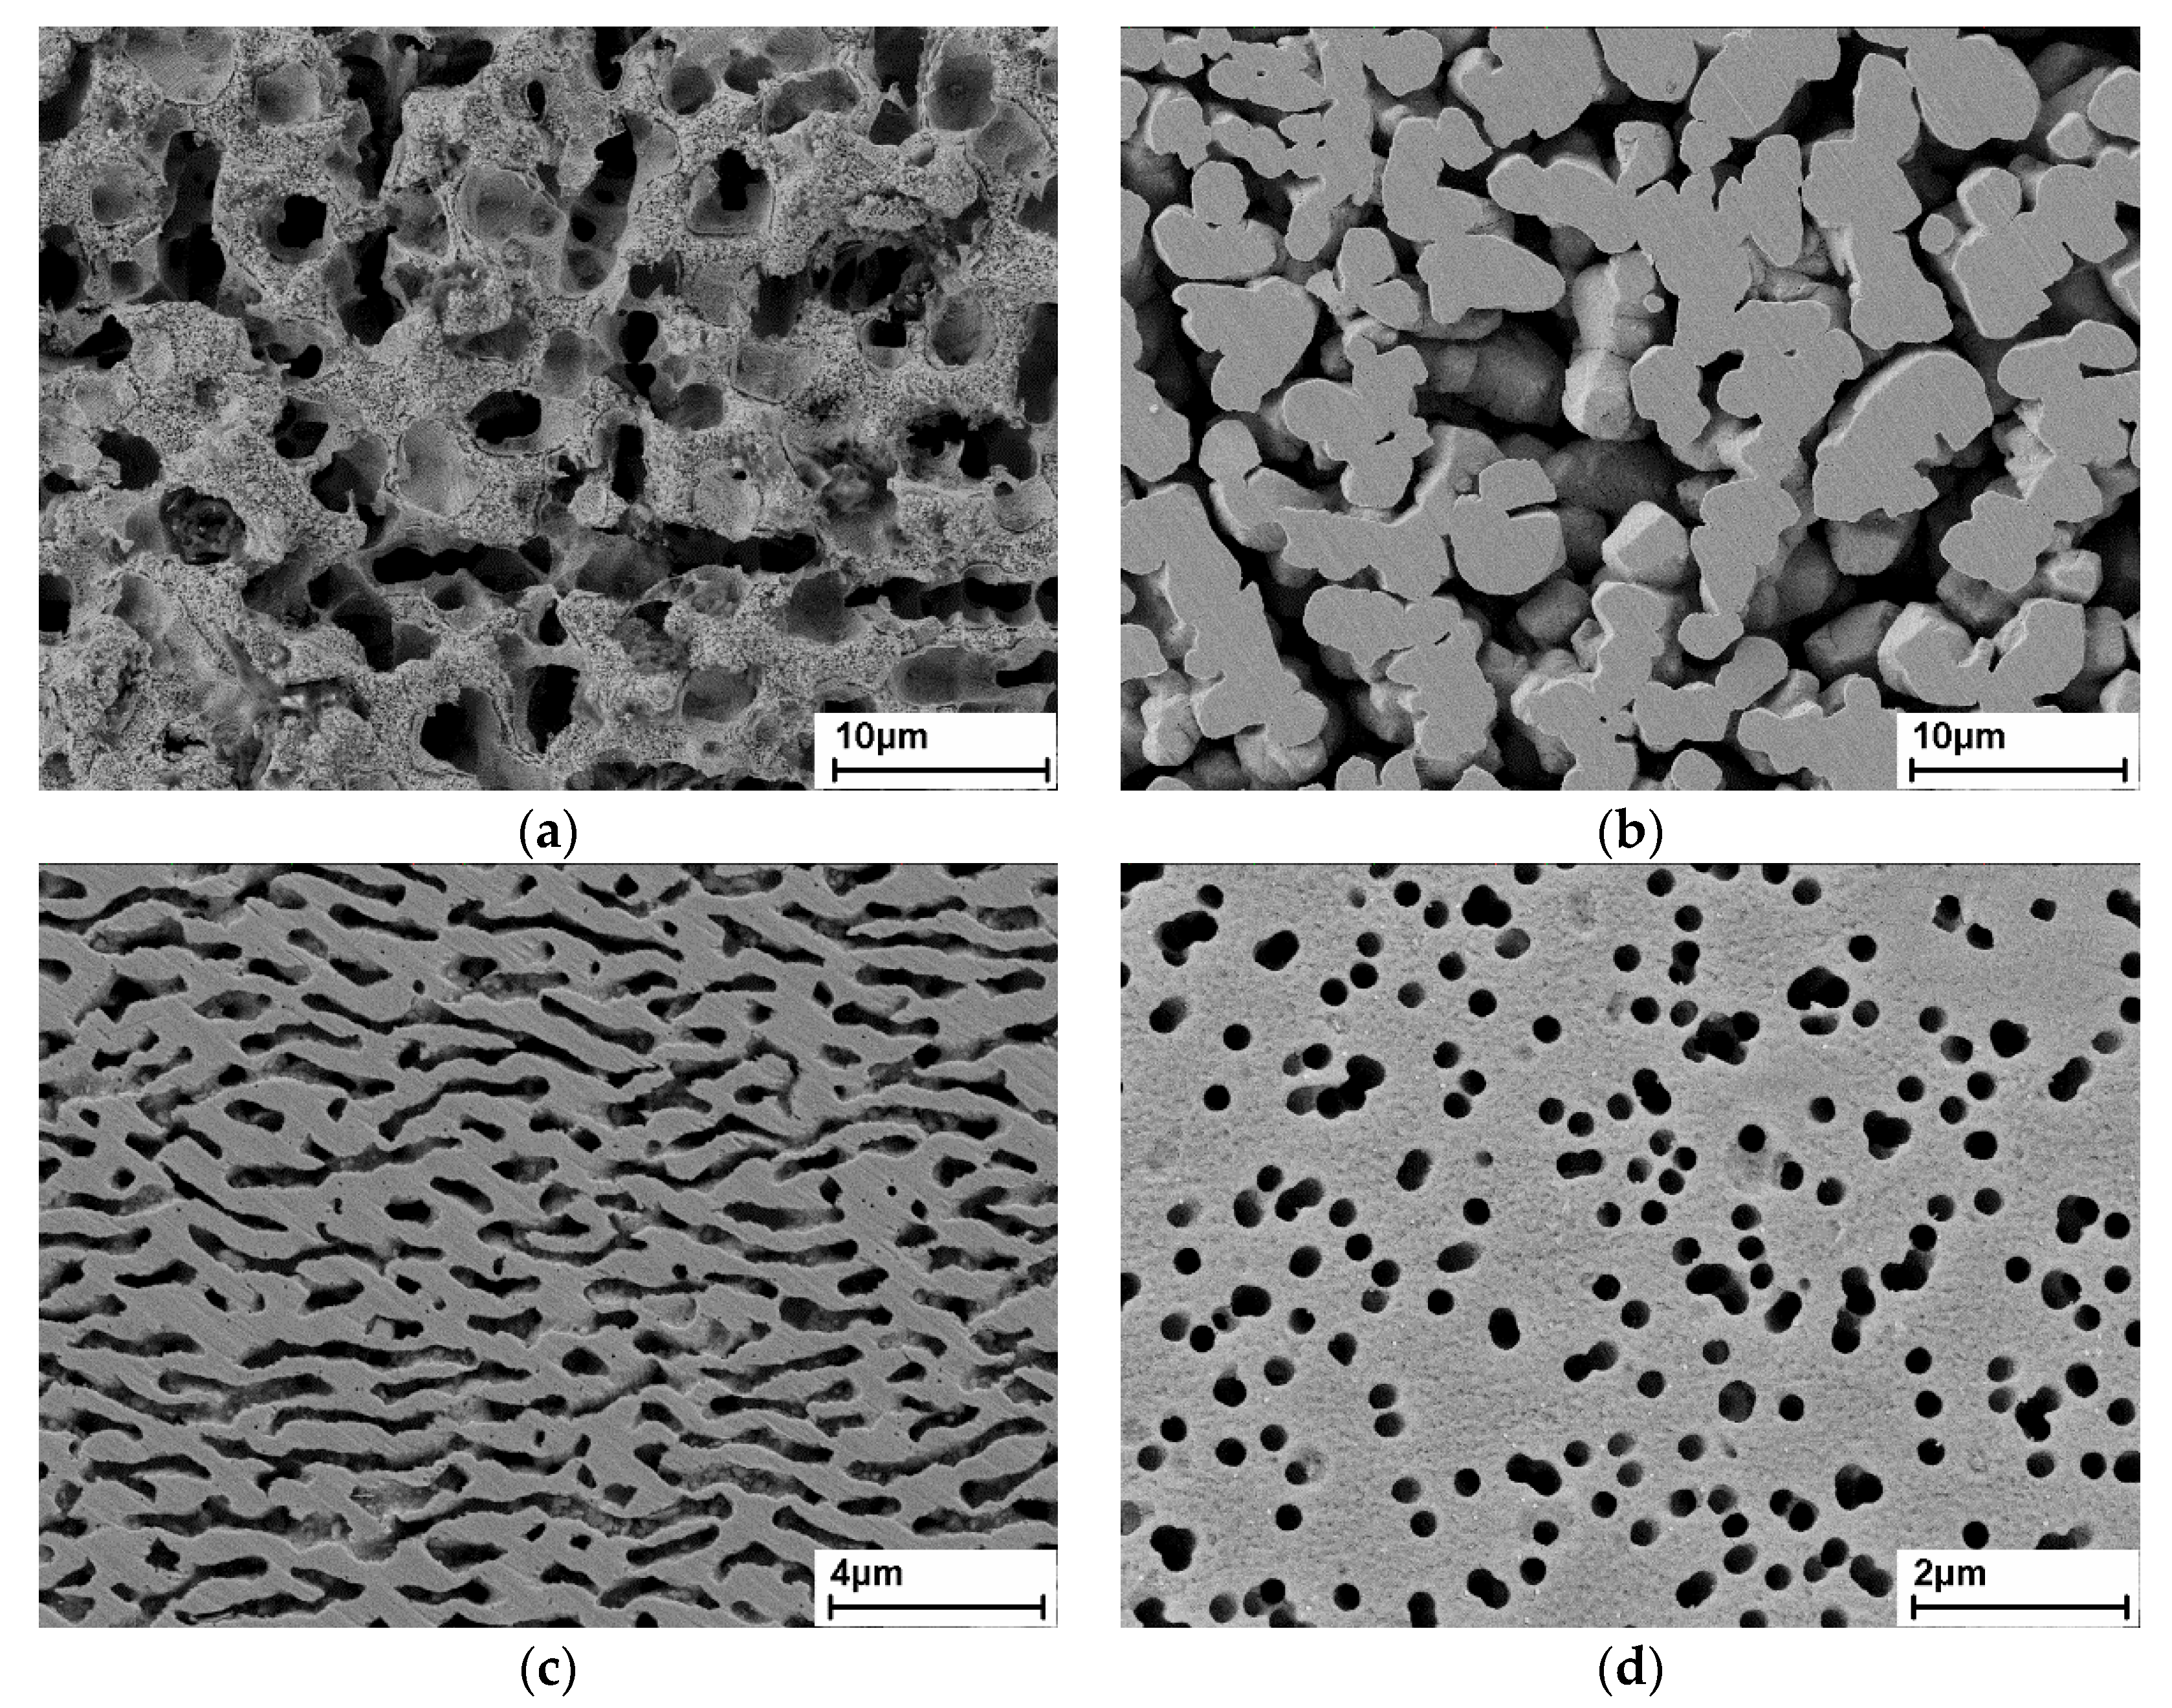
The resulting microstructures of the membranes are shown in Figure 1. The superalloy membranes consist of a three-dimensional, rigid γ′-network or γ-network, respectively, and open porosity at the location of the extracted phase. The TM-γ′-membrane has very fine pores and interconnected, horizontally elongated γ′-ligaments. The pores have a channel-like structure with channel widths between 250 and 400 nm (exposed to the membrane surface) and the porosity can be estimated to 26% [11]. For further details of the method used for estimation of the porosity, see [11]. Due to the different processing, the γ′-network of the LF-γ′-membrane is coarser and more irregularly shaped, than that of the TM-γ′-membrane. The porosity of the LF-γ′-membrane can be estimated to 41% and, as the counterpart to the LF-γ′-membrane, the porosity of the LF-γ-membrane can be estimated to approximately 59% [11]. The surface of the LF-γ-membrane is slightly rough, since small particles of secondary γ′, which precipitated during cooling from the last manufacturing step within the γ-ligaments, have been etched out. The porosity of the PE-membrane is approximately 9% and the circular pores are approximately 200 nm in diameter, as specified by the manufacturer. Some pores have locally merged together, building bigger, interconnected pores. The PE-membrane is flexible and 0.01–0.02 mm thick, while the superalloy membranes are stiff and 0.3 mm thick.
3.2. Flow Resistance and Energy Dissipation in Premix Membrane Emulsification
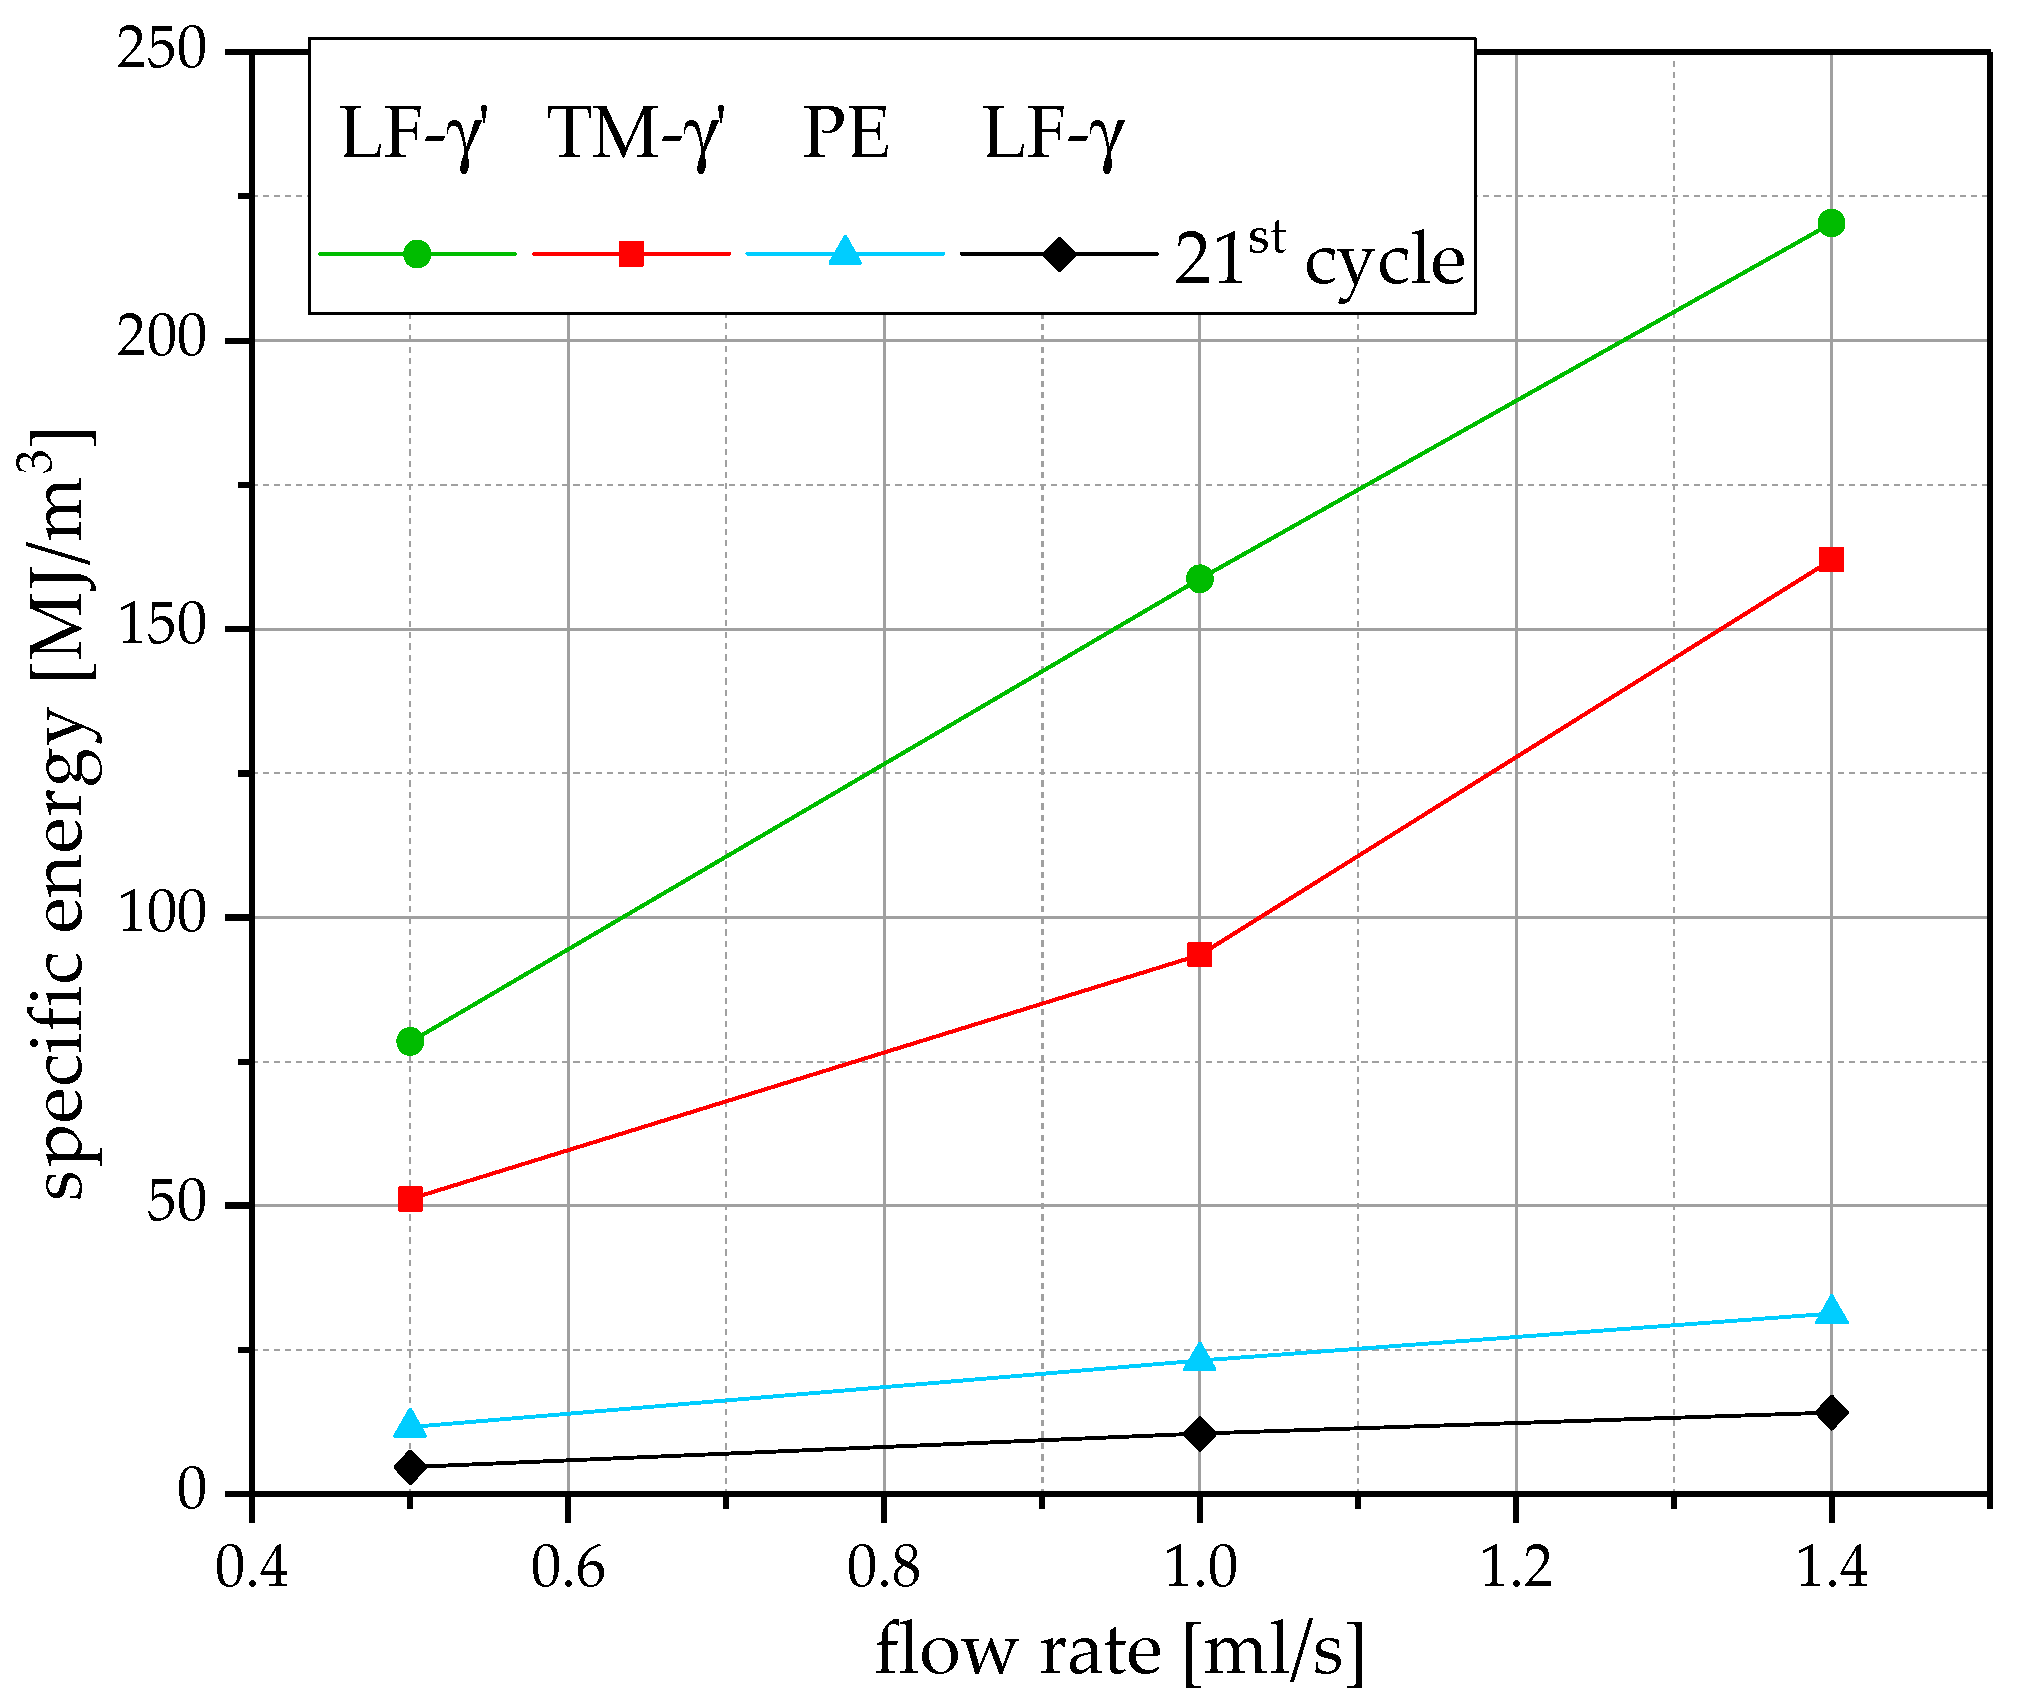
The specific energy introduced to the pre-emulsion was employed to characterize the four different membranes, applying three flow rates and investigating the 21st cycle (Figure 2). The LF-γ′-membrane required the most, the TM-γ′-membrane the second most, the PE-membrane the third most and the LF-γ-membrane the least pressure drop and, by that, the least specific energy dissipation over all flow rates. The LF-γ-membrane required approximately three to five times less specific energy than the PE-membrane and approximately nine to seventeen times less than the other superalloy membranes. The low specific energy consumption can clearly be attributed to the high porosity of the LF-γ-membrane.
In comparison to the 15 to 30 times thicker TM-γ′-membranes and LF-γ′-membranes, the thin PE-membrane (0.01–0.02 mm) yields comparably high specific energy consumption, due to its much lower porosities. The extrusion pressure (p) for the PE-membrane increased with increasing number of cycles performed at all flow rates (Table 2). At 0.5 mL/s it increased by 48%, at 1.0 mL/s by 72% and at 1.4 mL/s by 101% from the 1st to the 21st cycle. As can be seen in Figure 3a, the PE-membrane is covered with emulsion components after the 21st cycle and its pores are partially clogged with membrane fouling. This causes a drastic reduction of the overall open surface area and inlet diameter, decreasing the permeability and resulting in higher extrusion pressure to achieve the fixed flow rate. The calculated cylindrical capillary equivalent pore diameter (cce) and the viscosity coefficient (α), the more commonly known parameter for porous materials, decrease from the 1st to the 21st cycle for all flow rates, especially at the highest flow rate and confirms this observation (Table 2).
For the superalloy membranes, the extrusion pressure differed less than ±15%, the cce less than ±8% and α less than ±14% from the 1st to 21st cycle at all flow rates (Table 2) in all cases. This indicates that in the range of the measurements accuracy no fouling was detectable for superalloy membranes. The extrusion pressure for the TM-γ′-membrane was less than for the LF-γ′-membrane at all flow rates, leading to lower specific energy consumption.
Since the structure of the γ′-network and pores are irregular in size and shape, quite narrow passages exist in the LF-γ′-membrane (white arrows in Figure 3b). From this and the longer path length per membrane thickness, increased flow resistance, energy dissipation for the extrusion and a smaller cce and α may result. The more regular, channel-like pores of the TM-γ′-membrane lead to a bigger cce and α and require a lower extrusion pressure. In addition, it must be kept in mind that porosity of LF-γ′-membranes is estimated to 41% in comparison to TM-γ′ with 26%, stressing the crucial influence of pore size distribution and interconnecting structure. The cce and α values fit the ranking of the membranes’ energy dissipation. However, the flow conditions within the pore networks need further clarification.
3.3. Emulsification Performance at Low Flow Rate (0.5 mL/s)
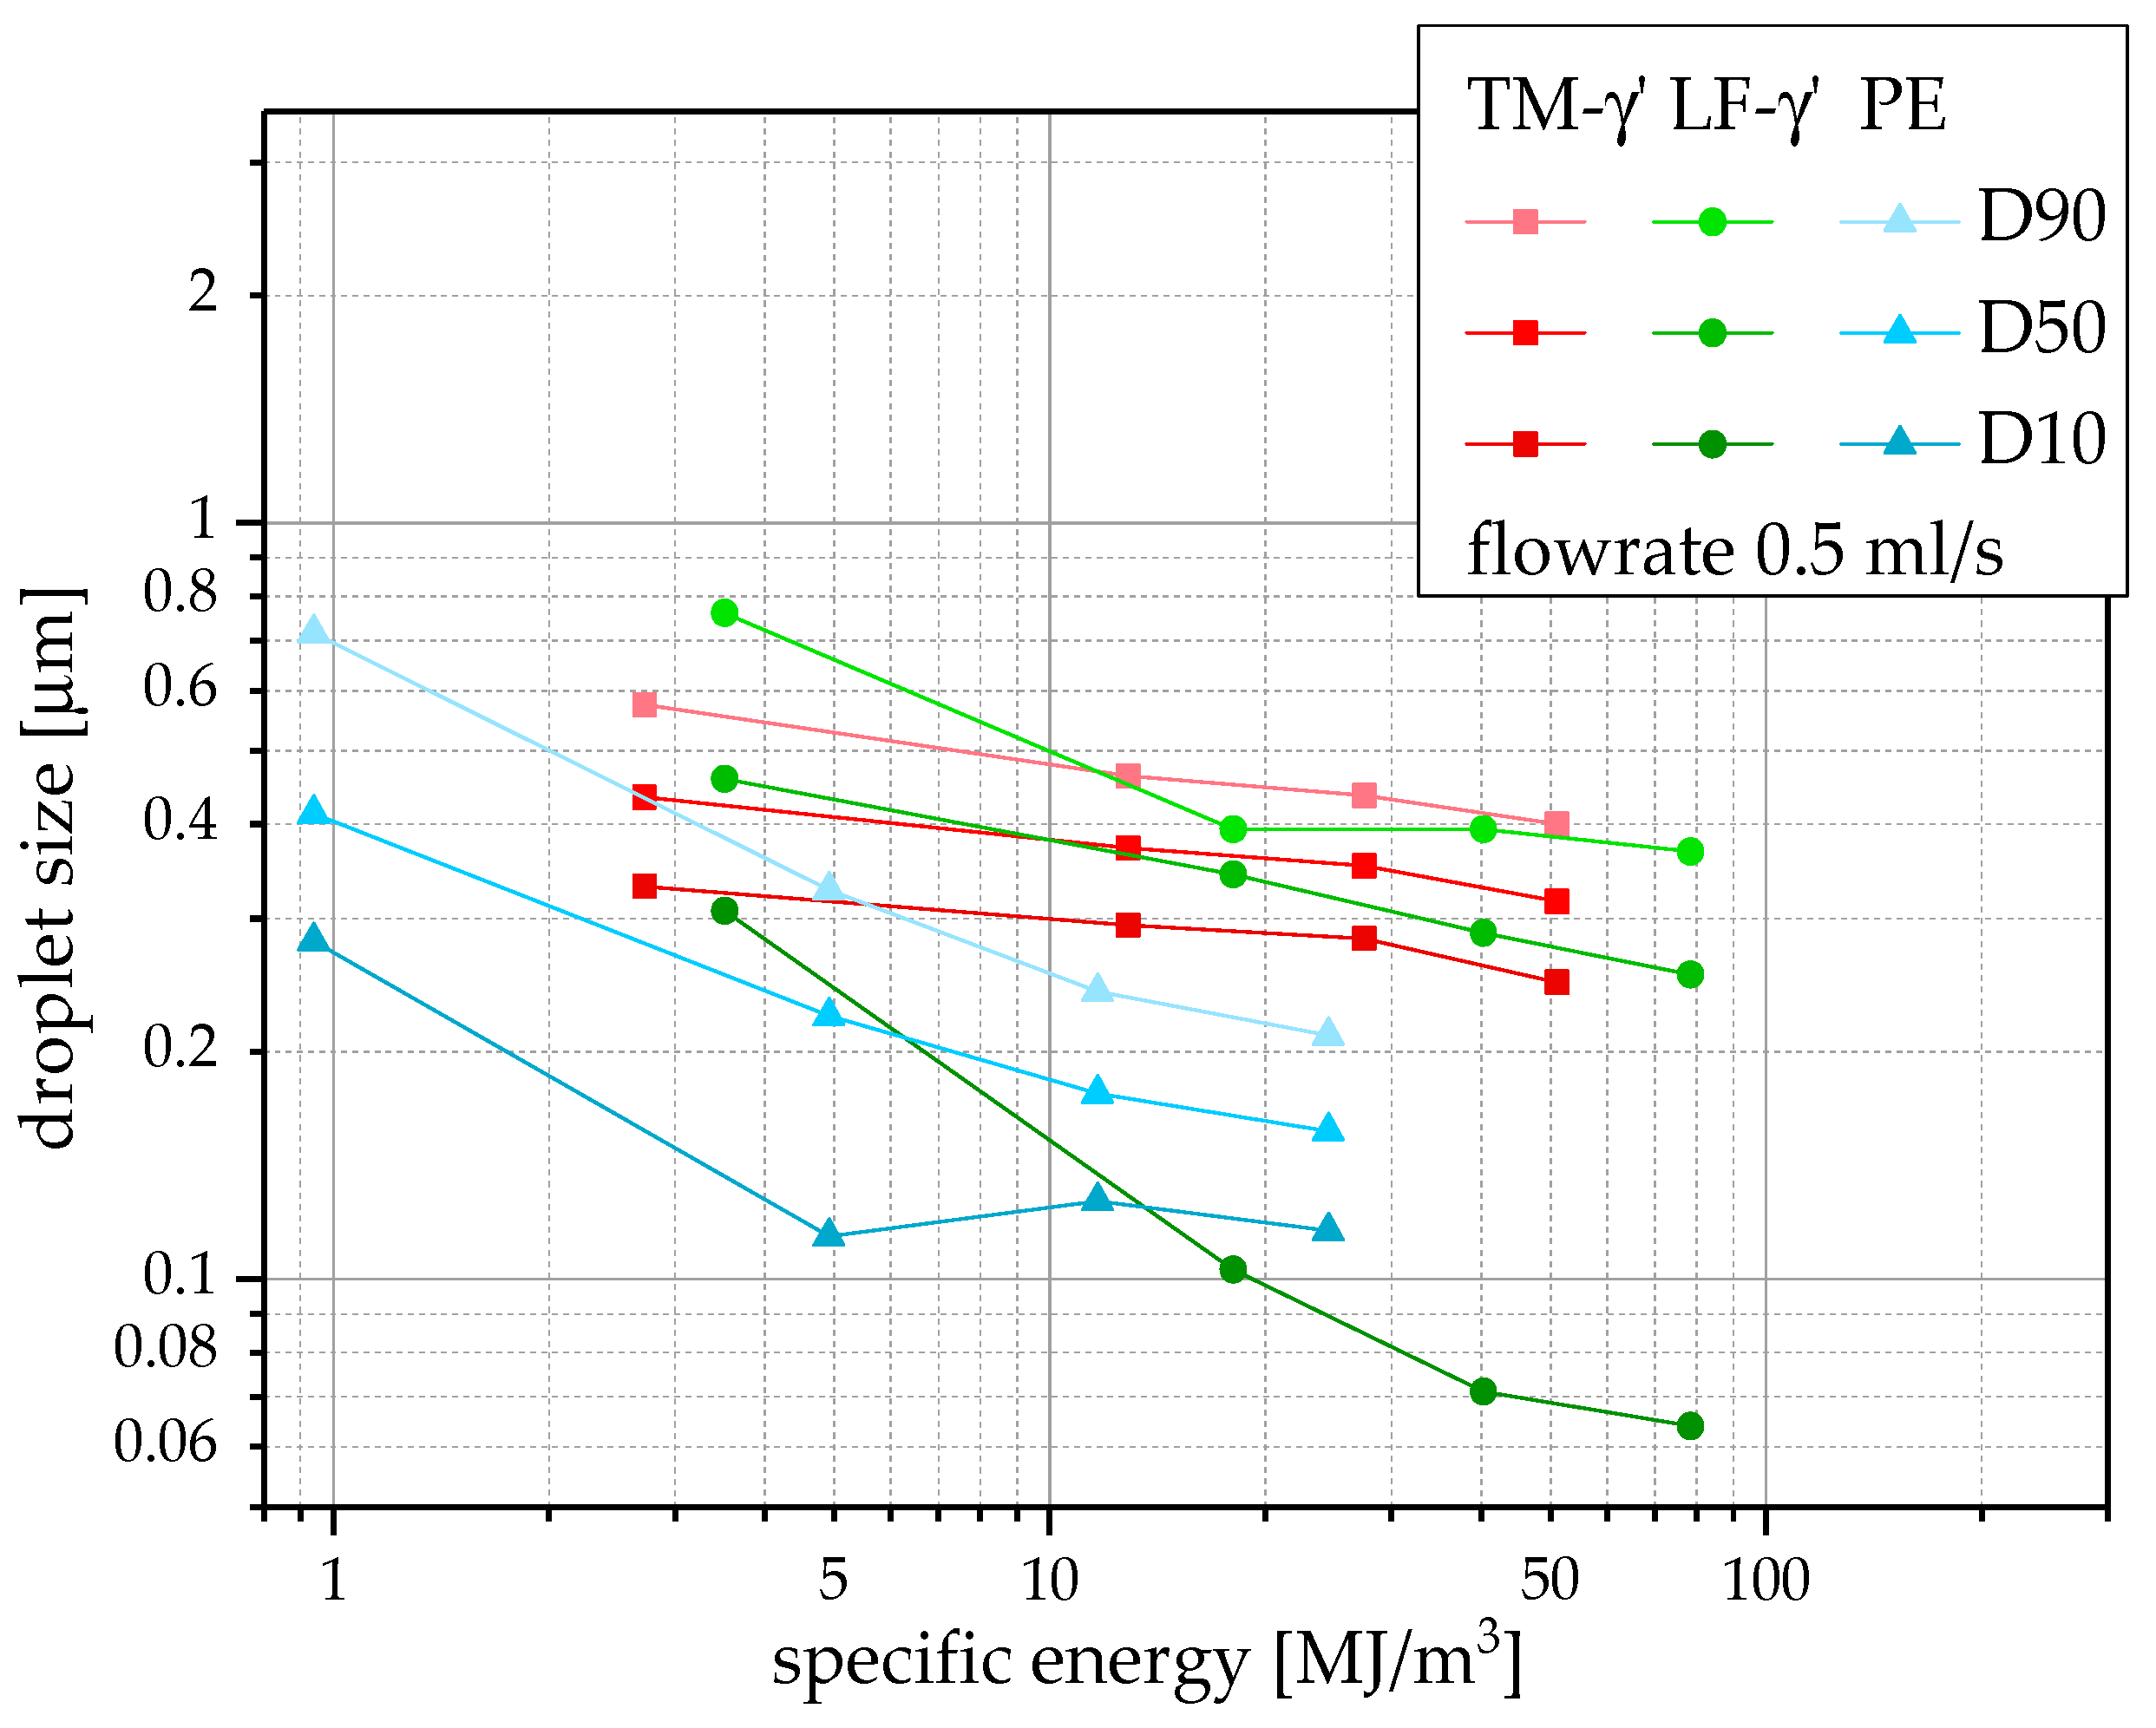
The pre-emulsions , and were measured to 1.03 ± 0.39 µm, 5.51 ± 0.39 µm and 12.3 ± 0.17 µm and the related span was calculated to 2.05. The achieved droplet sizes of the LF-γ-membrane for any cycle number (and flow rate) were too high for the production of nanoemulsions (above 1 μm, data not shown), due to its high porosity and large cce and α. Therefore, in the following, the results of the other three membranes will be discussed only. According to data after one cycle, an at least 5-fold decrease of droplet sizes (to <1 µm) was achieved by one single passage through the membrane at lowest energy input for all these membranes. Hence, they are successfully improving droplet sizes. The PE-membrane (Figure 4) delivered the smallest droplet size over all cycles at the flow rate of 0.5 mL/s. After the 21st cycle, the was sufficiently small with 157 nm. Droplet sizes in the desired range below = 200 nm were achieved from the eleventh cycle onwards. The LF-γ′-membrane delivered smaller than the TM-γ′-membrane after the 5th, 11th and 21st. After 21 cycles, the droplet sizes for the LF-γ′- and TM-γ′-membrane (253 nm and 316 nm, respectively) were promising for the preparation of nanoemulsions.
Taking the width of the droplet size distribution into account, indicated by the span (Table 3), it stands out, that the TM-γ′-membrane achieved the narrowest droplet size distribution, even after the 1st cycle. While the PE-membranes droplet size distribution was also narrow after the 21st cycle and decreased over the cycles. Span for the LF-γ′-membranes was relatively broad, caused by a high fraction of small droplets leading to a low (smaller than 100 nm from the 11th cycle on). As mentioned before, narrow passages exist within the pore network of the LF-γ′-membrane. Nonetheless, the pore size distribution appears to be broad as well. Due to higher Reynolds numbers and higher energy dissipation in smaller orifices or channels, most efficient droplet breakup takes place in the most narrow pore regions. Over the number of cycles, the statistical probability for large droplets to pass narrow pore regions in at least one of the applied cycle, accordingly, becomes higher and a growing fraction of smaller droplet sizes results. This can be found in the over proportional decrease in .
Regarding the suitability of nanoemulsions for example in pharmaceutical applications, narrow droplet size distributions are desired as these are less prone to instabilities, i.e., Ostwald ripening.
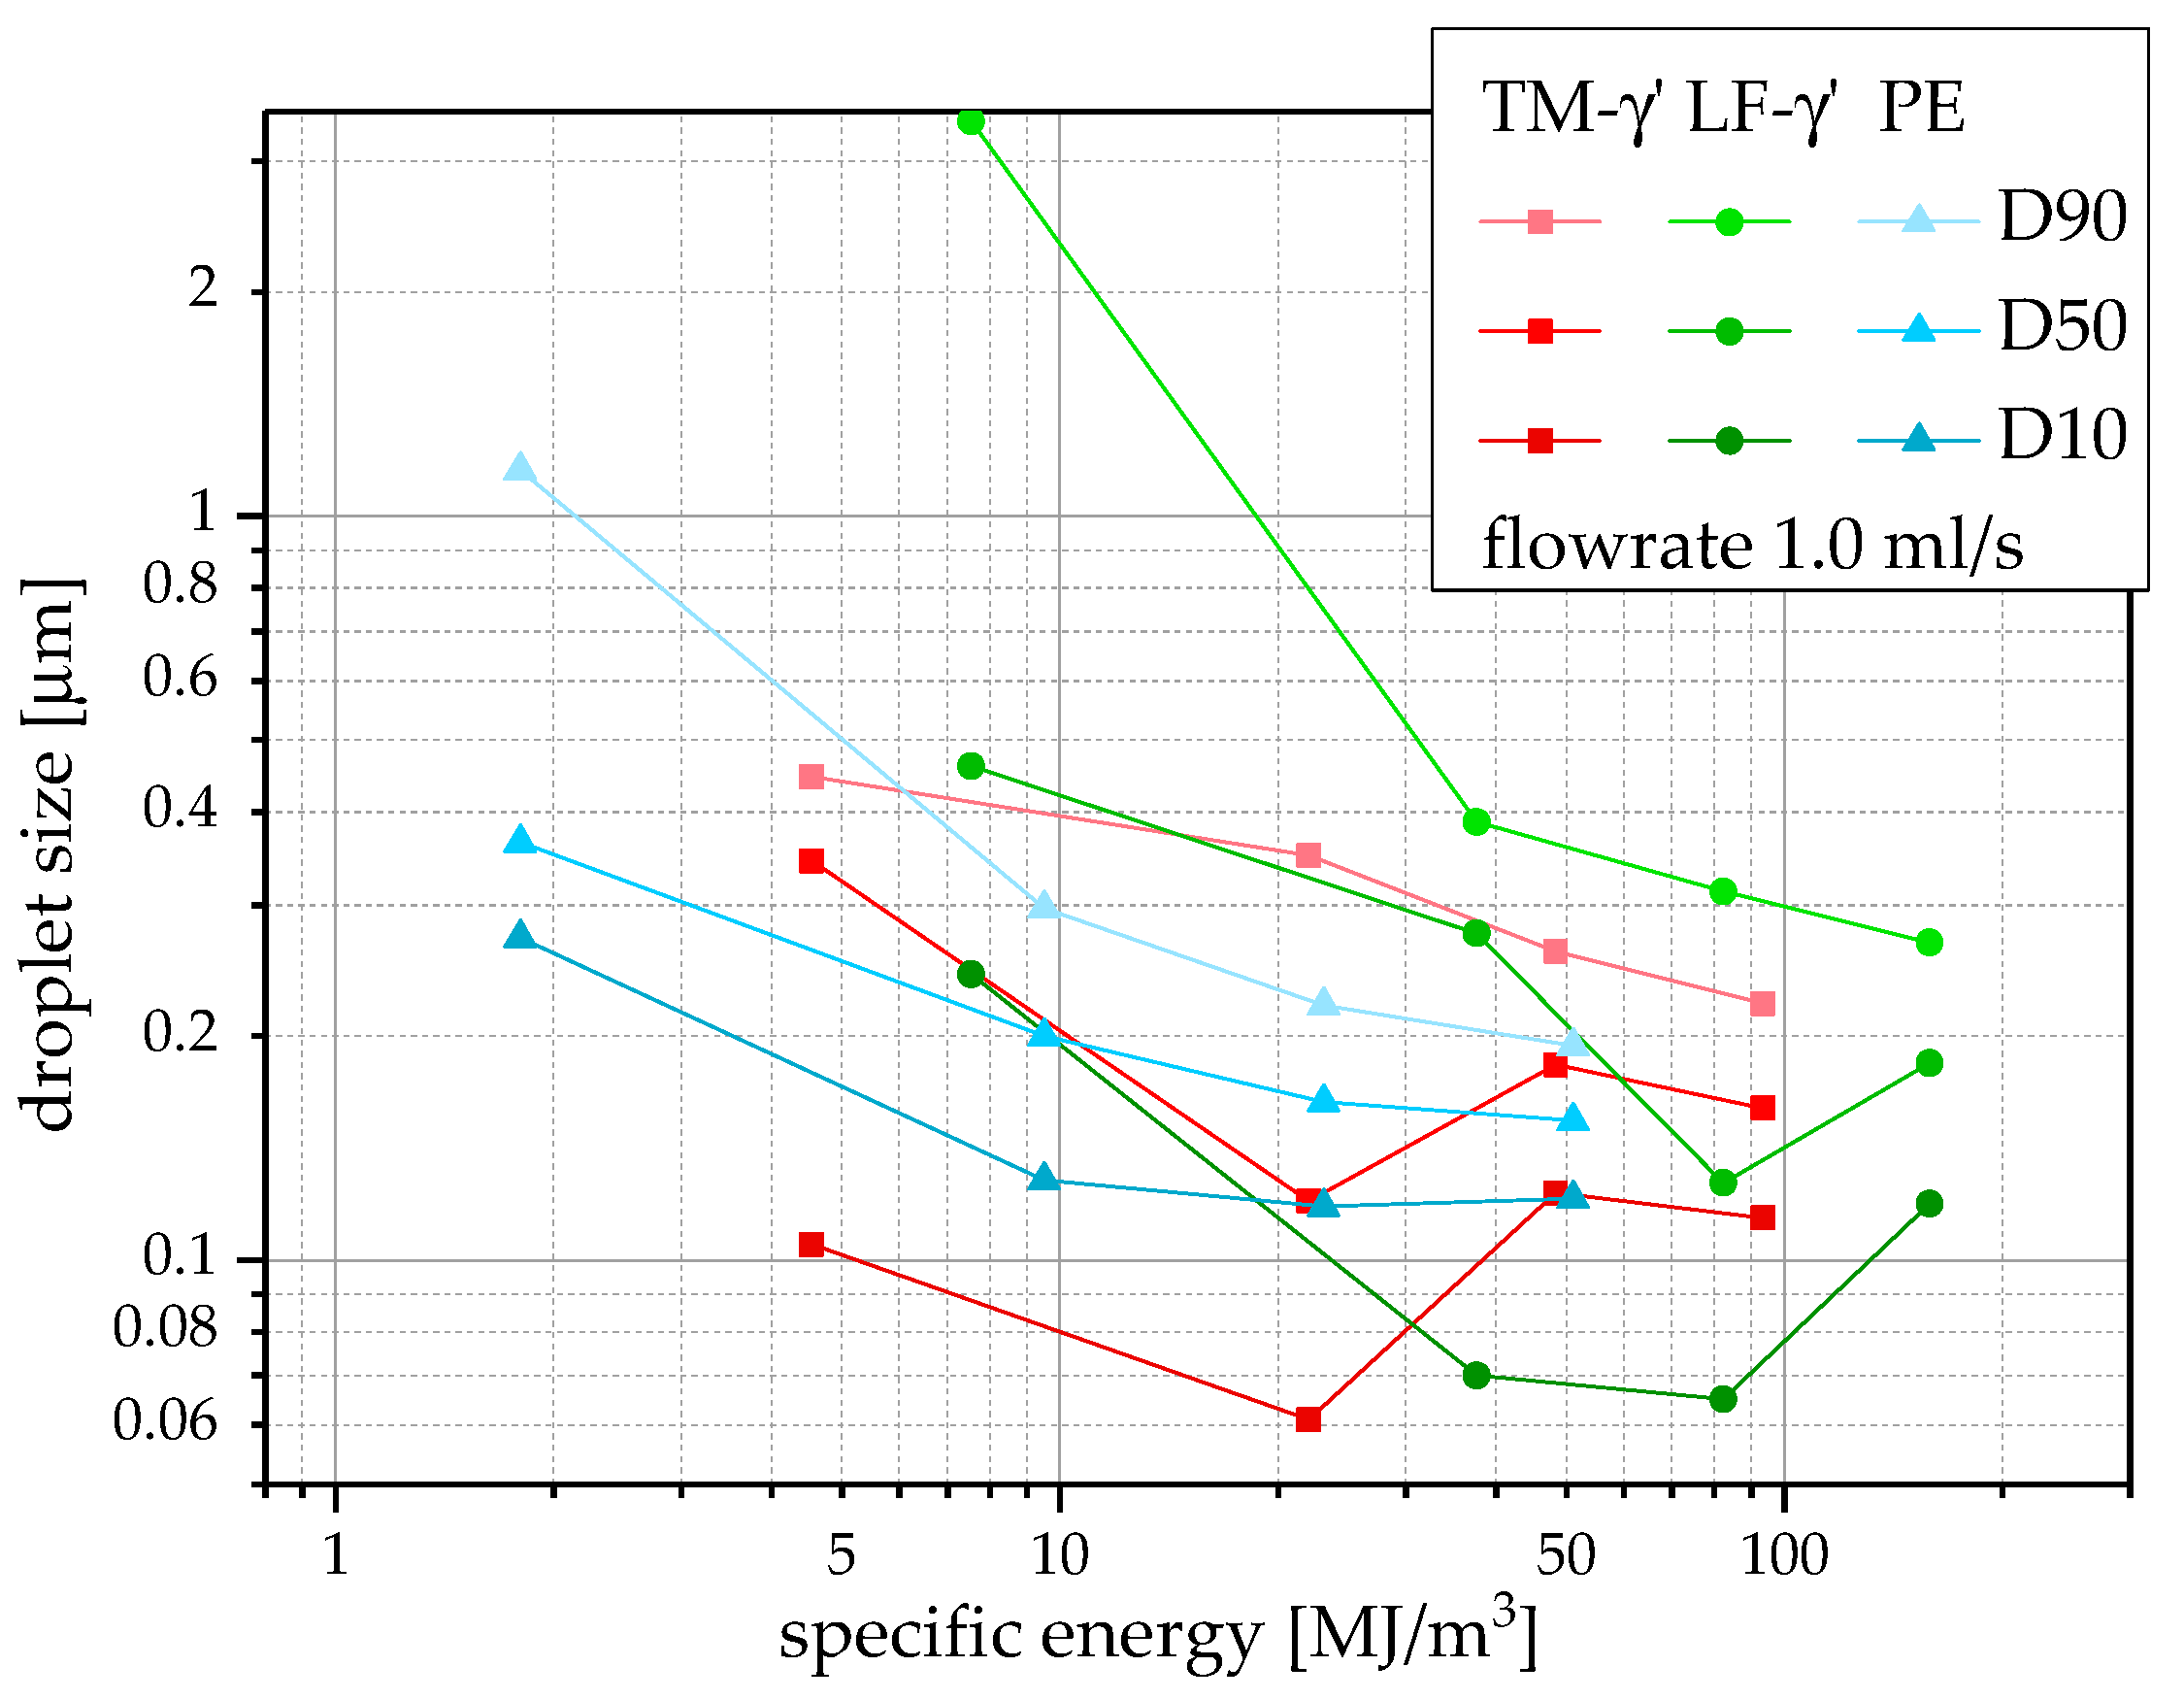
3.4. Emulsification Performance at Intermediate Flow Rate (1.0 mL/s)
After the 1st and 5th cycle, the TM-γ′-membrane produced the smallest, the PE-membrane the second smallest, and the LF-γ′-membrane the highest droplet size (Figure 5). The LF-γ′-membrane achieved the smallest droplet size after the 11th cycle, the PE-membrane the second smallest and the TM-γ′-membrane the biggest. After the 21st cycle, the PE-membrane produced the smallest droplet size with 154 nm, the TM-γ′-membrane the second smallest with 160 nm, and the LF-γ′-membrane the biggest with 184 nm. However, all three membranes were able to reach the favorable droplet size range for nanoemulsions.
From the 5th cycle on, the droplet size distribution for the PE-membrane was relatively narrow and decreased with increasing cycles (Table 4), as observed at the lower flow rate. The droplet size distribution and the droplet size slightly decreased with the higher flow rate from at least the 5th cycle on. For the TM-γ′-membrane, the droplet size decreased with the higher flow rate, while the droplet size distribution increased, but was still narrow from after the 11th cycle on. For the LF-γ′-membrane, the droplet sizes and size distribution after the 21st cycle decreased compared to the lower flow rate, however, both other membranes achieved better results overall. For all membranes, the narrowest droplet size distribution was achieved after the 21st cycle, which is understandable since the series connection of subsequent comminution processes leads to a decrease in droplet size distribution [21].
The droplet size and of the TM-γ′- and LF-γ′-membrane showed an unstable behavior over cycle number. This may hint at over-emulsification, a phenomenon describing instabilities such as coalescence that is more pronounced for smaller droplets under high energy input [22]. By the production of a fraction of very small droplets, their coalescence is favored and may lead to elevation of , but especially over cycle numbers.
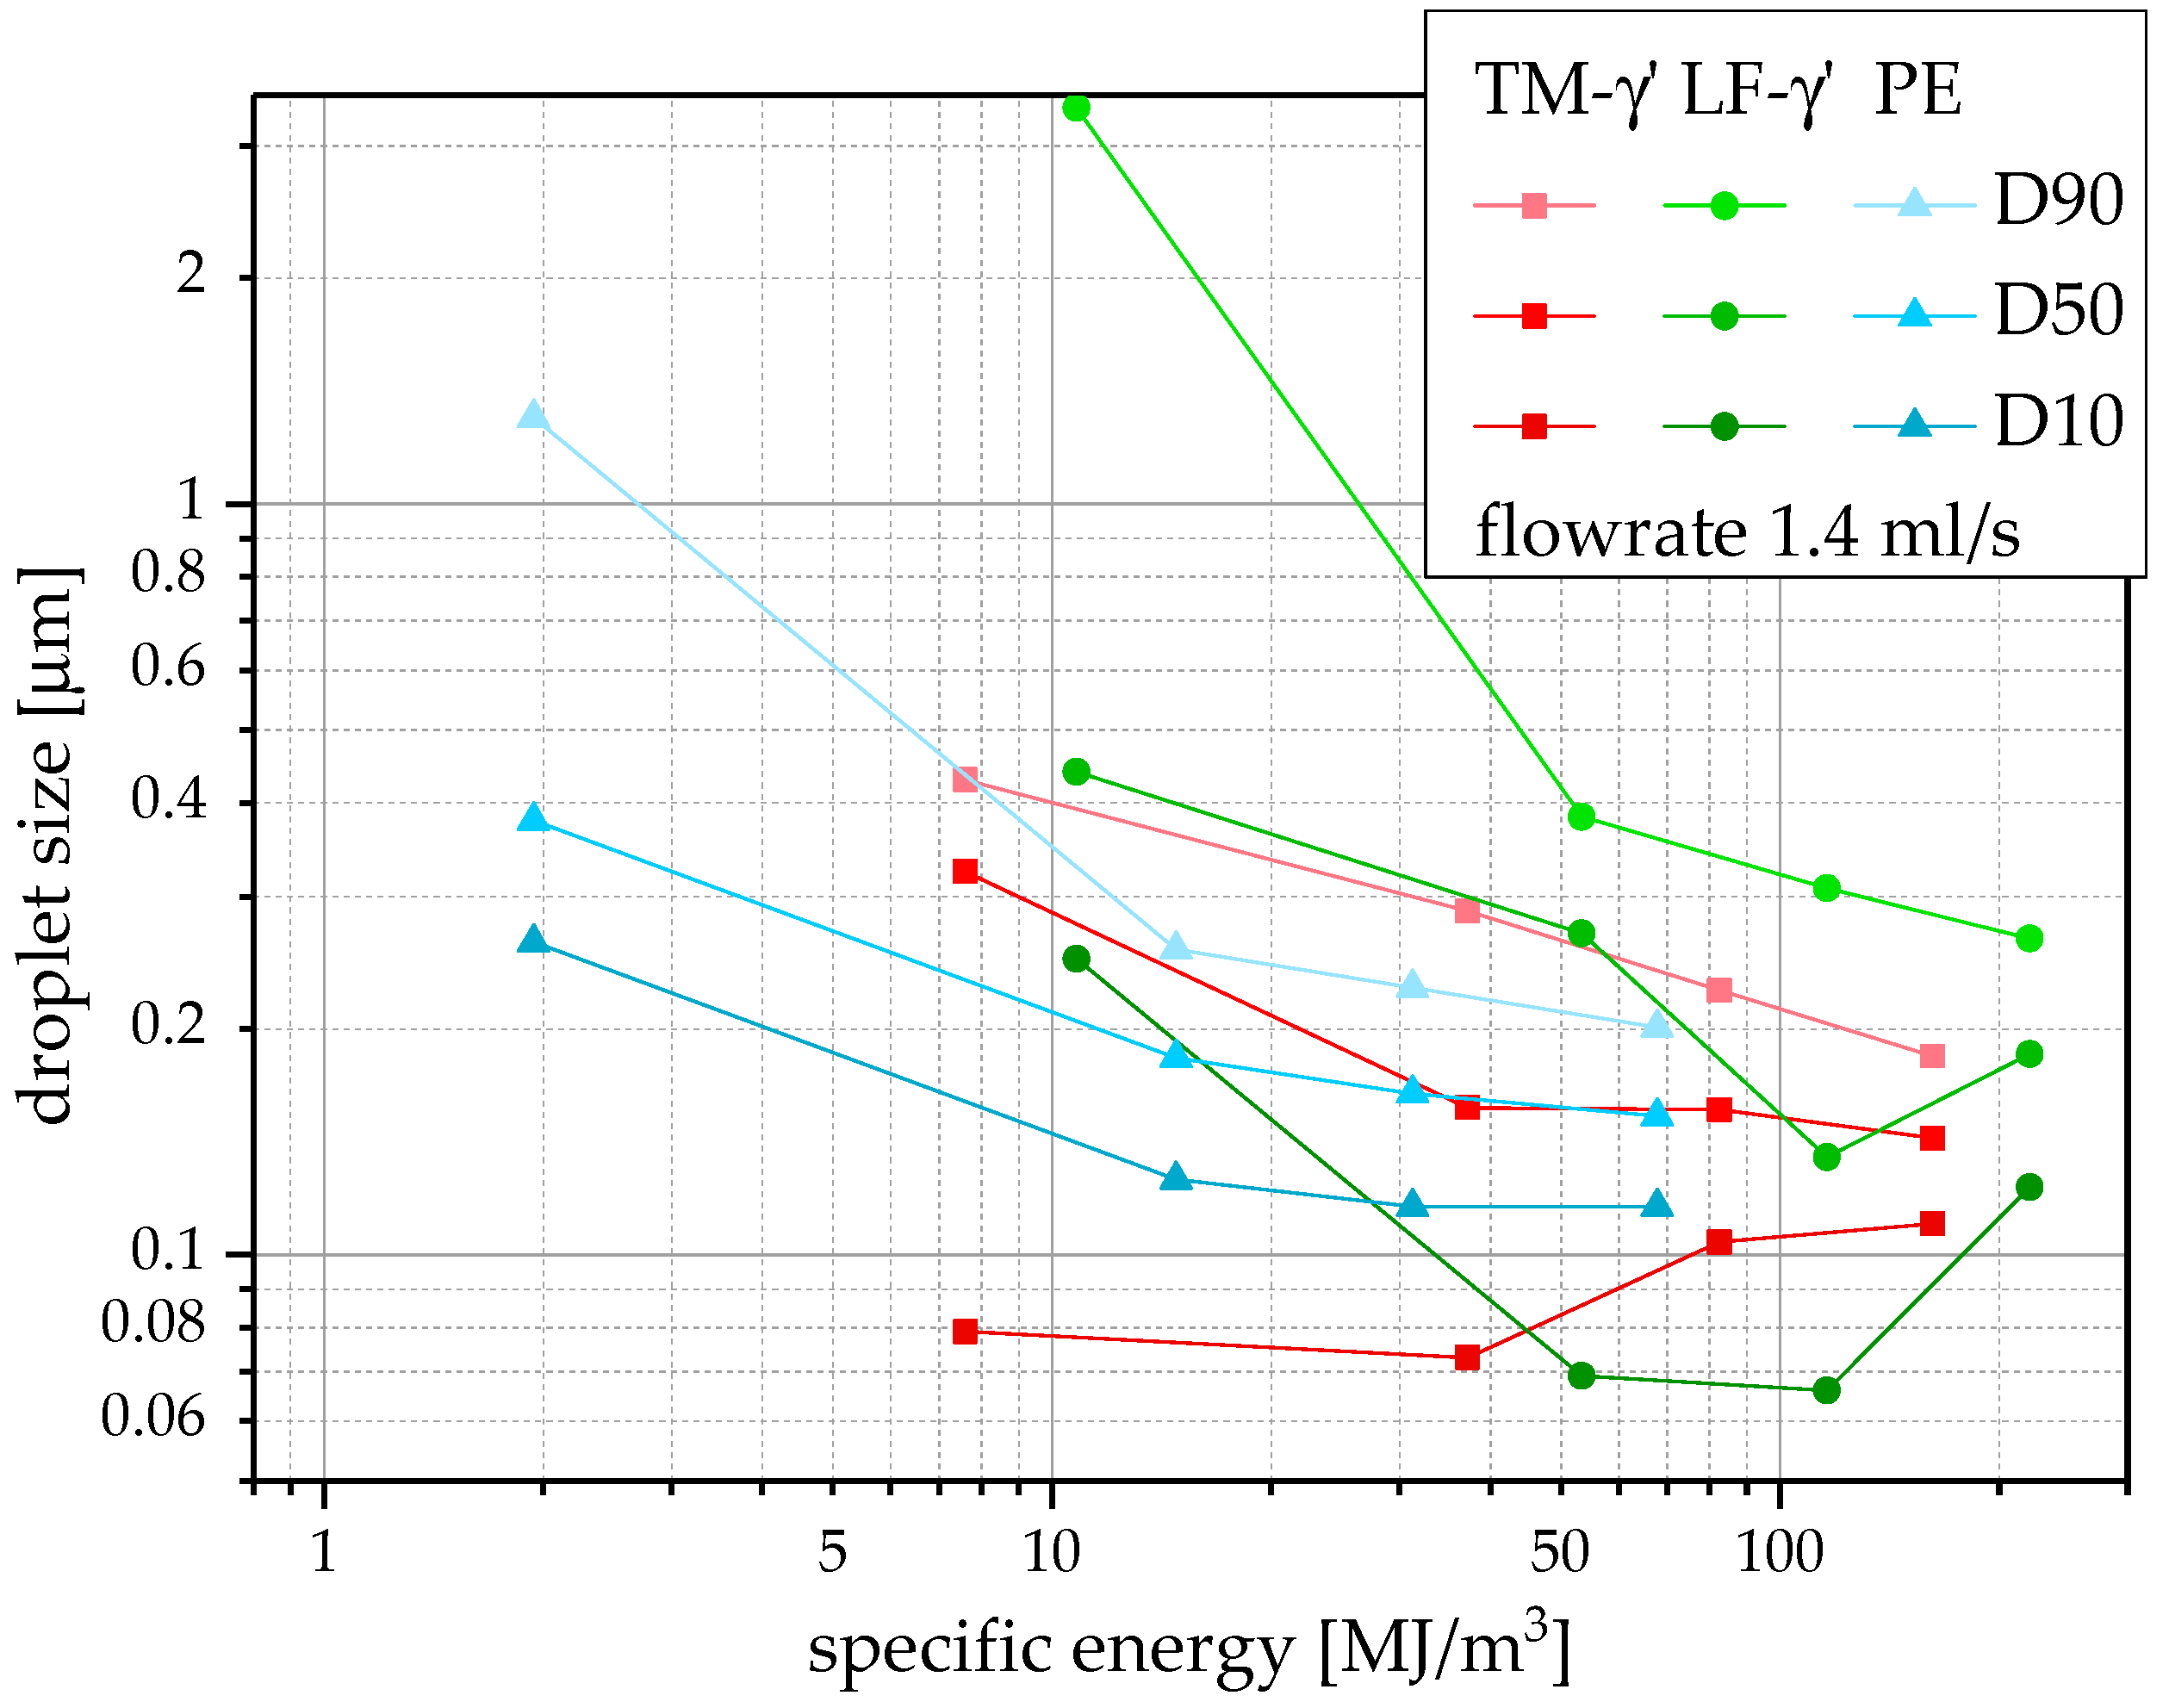
3.5. Emulsification Performance at High Flow Rate (1.4 mL/s)
The TM-γ′-membrane by trend produced the smallest, the PE-membrane the second smallest, and the LF-γ′-membrane the highest droplet size over the whole range of cycle numbers (Figure 6). Only after the 11th cycle, the LF-γ′-membrane achieved the smallest droplet size . With 143 nm for the TM-γ′-membrane, 153 nm for the PE-membrane, and 185 nm for the LF-γ′-membrane, the droplet size after the 21st cycle was in the same size range and satisfactory for the preparation of nanoemulsions.
The PE-membranes droplet sizes and size distribution (Table 5) evenly decreased with increasing cycles, but not with the higher flow rate, as compared to the intermediate and low flow rate. This observation has also been made by Gehrmann and Bunjes [23]. Since the specific energy increased with increasing flow rate and there was only a slight advantage from the low to the intermediate flow rate, the most efficient process for the PE-membrane took place at the low flow rate. The TM-γ′-membrane’s droplet sizes and size distribution decreased with higher flow rate for the most cycles, compared to the intermediate flow rate. The improvement has to weigh up against the increased requirement of specific energy input. The resulting droplet sizes and size distribution for the LF-γ′-membranes, at 1.4 mL/s flow rate, barely differed from those at the intermediate flow rate. Therefore, the most efficient process proceeded at the intermediate flow rate.
The LF-γ′-membranes droplet sizes and decreased from the 1st to the 11th cycle and increased again towards the 21st cycle. Comparably, the value for the TM-γ′-membrane was low for low cycle number and increased over the 11th to the 21st cycle. Again, a broader droplet size distribution resulted from the width of pore size distribution of these membranes and the, by that, less even stress distribution over the processed droplet population. The high generation of very small droplets leads to over-emulsification again, favoring the coalescence of this droplet population in subsequent cycles, yielding a more homogeneous droplet size distribution after a higher number of cycles for superalloy membranes.
3.6. Comparison of Flow Rates and Membrane Structures
The PE-membrane produced acceptable droplet sizes and size distributions already with the lowest flow rate. Since they did not, respectively only slightly, decrease with increasing flow rate, the lowest flow rate led to the most efficient process, because the lowest specific energy was required. Disadvantageously, the PE-membrane showed fouling with the emulsion, hence the extrusion pressure increased with increasing cycles and, by that, the requirement of specific energy. Additionally, the final droplet size cannot properly be controlled by adjustment of flow rate and, by that, process pressure.
The TM-γ′-membrane and the LF-γ′-membrane were able to produce suitable droplet sizes from intermediate flow rate on. While the droplet sizes did not decrease for the LF-γ′-membrane with the highest flow rate, they decreased further for the TM-γ′-membrane. Both, the LF-γ′- and TM-γ′-membrane produced a fraction of very small droplets (indicated by below 100 nm) at all flow rates, respectively the intermediate and high flow rate. These were more pronounced at medium cycle numbers (5, 11) and this fraction decreased for higher cycle numbers to yield narrower droplet size distributions after 21 cycles. This indicates the broadness of the pore size distributions in the superalloy membranes, especially LF-γ′-membrane, leading to broader stress distributions, resulting in a very high stressing of small fraction of the volume flow and, by that, in a fraction of very small droplets. Nonetheless, droplets that are subject to the highest energy inputs, are broken down to the smallest droplet sizes, causing very low values (i.e., <100 nm). These in turn tend to coalesce under the influence of additional energy input, introduced by the subsequent stressing cycles.
The droplet size distribution narrowed towards the 21st cycle at all flow rates for the LF-γ′-membrane. The TM-γ′-membrane showed narrow droplet size distributions at all flow rates from, at least, the 11th cycle on. Therefore, an increase of cycles leads to more homogeneous droplet size distributions [21].
In terms of specific energy requirement, the LF-γ′-membrane was unfavorable, because of its irregular microstructure, while the LF-γ-membrane was not applicable over all, since its achieved droplet sizes for all process parameter sets were not in nanometer range.
4. Conclusions
The present study has shown that nanoporous superalloy γ′-membranes are capable of producing pharmaceutical emulsions with acceptable droplet sizes in the nanometer size range (~150 nm) with acceptable particle size distributions through premix membrane emulsification, equal to the results of commonly used PE-membranes. In contrast to PE-membranes, a higher energy input (by a higher resulting pressure drop over the membranes) is necessary, due to the 15–30-fold higher thickness of the superalloy membranes. It also poses a potential for future research to investigate the strength and process lifetime of thinned superalloy membranes with thicknesses <300 µm. In case of success, the specific energy dissipation could even be below that of PE-membranes, which require rather high specific energies, considering their thin dimensions. In addition, the resulting droplet sizes for superalloy membranes can be controlled by flow rate adjustment, providing higher process flexibility, which is not the case for the PE-membranes. An outstanding advantage is the process stability for superalloy membranes as no fouling, typical for polymeric membranes, could be detected.
In terms of thickness, specific energy consumption, smallest achievable droplet size, mechanical strength, chemical and heat resistance, process flexibility and process lifetime, the superalloy γ′-membranes display promising qualities.
Author Contributions
M.K. and J.H.F. conceived and performed the experiments, evaluated and interpreted the data, and wrote the article; J.R. and A.K. supervised the studies and gave scientific advice in refining the manuscript.
Acknowledgments
We are grateful for Sandra Gehrmann’s, Nadine Francke’s, Marcel Schrader’s and Carola Jäschke’s support with the experimental set-up for producing the emulsions and the introduction to the technique and the scanning electron microscope assistance of Peter Pfeiffer and Michael Klopschar. We acknowledge support by the German Research Foundation and the Open Access Publication Funds of the Technische Universität Braunschweig. Additionally, we thank the Institute of Pharmaceutical Technology, TU Braunschweig for the allowance to perform studies on their small-scale extruder and the usage of the LS 13320.
Conflicts of Interest
The authors declare no conflict of interest.
References
- Schubert, H.; Engel, R. Product and Formulation Engineering of Emulsions. Chem. Eng. Res. Des. 2004, 82, 1137–1143. [Google Scholar] [CrossRef]
- Cornier, J.; Owen, A.; Kwade, A.; van de Voorde, M. Pharmaceutical Nanotechnology. Innovation and Production; Wiley-VCH Verlag GmbH & Co. KGaA: Weinheim, Germany, 2017. [Google Scholar]
- Jahnke, S. The theory of high-pressure homogenization. In Emulsions and Nanosuspensions for the Formulation of Poorly Soluble Drugs: Based on the Invited Lectures and Communications Presented at the Colloidal Drug Carriers—CDC—3rd Expert Meeting, Berlin (Germany), 29–31 May 1997; 34 Tables; Müller, R.H., Ed.; Medpharm Scientific Publ.: Stuttgart, Germany, 1998; pp. 177–200. [Google Scholar]
- Vladisavljević, G.T.; Williams, R.A. Recent developments in manufacturing emulsions and particulate products using membranes. Adv. Colloid Interface Sci. 2005, 113, 1–20. [Google Scholar] [CrossRef] [PubMed] [Green Version]
- Suzuki, K.; Shuto, I.; Hagura, Y. Characteristics of the Membrane Emulsification Method Combined with Preliminary Emulsification for Preparing Corn Oil-in-Water Emulsions. FSTI 1996, 2, 43–47. [Google Scholar] [CrossRef]
- Trentin, A.; Ferrando, M.; López, F.; Güell, C. Premix membrane O/W emulsification: Effect of fouling when using BSA as emulsifier. Desalination 2009, 245, 388–395. [Google Scholar] [CrossRef]
- Rösler, J.; Mukherji, D. Design of Nanoporous Superalloy Membranes for Functional Applications. Adv. Eng. Mater. 2003, 5, 916–918. [Google Scholar] [CrossRef]
- Rösler, J.; Näth, O.; Jäger, S.; Schmitz, F.; Mukherji, D. Fabrication of nanoporous Ni-based superalloy membranes. Acta Mater. 2005, 53, 1397–1406. [Google Scholar] [CrossRef]
- Rösler, J.; Näth, O. Mechanical behaviour of nanoporous superalloy membranes. Acta Mater. 2010, 58, 1815–1828. [Google Scholar] [CrossRef]
- Rösler, J.; Krause, W.; Hinze, B. A Concept for the Control of Pore Size in Superalloy Membranes. Metals 2014, 4, 1–7. [Google Scholar] [CrossRef]
- Hinze, B. Verfahren zur Materialauswahl für akustische Liner im Heißgaspfad von Flugtriebwerken. Ph.D. Thesis, Technische Universität Braunschweig, Niedersächsisches Forschungszentrum für Luftfahrt, Braunschweig, Germany, January 2015. [Google Scholar]
- Näth, O. Nanoporöse Strukturen auf Nickelbasis: Herstellung, Eigenschaften und Anwendungspotenzial. Ph.D. Thesis, Technische Universität Braunschweig, Braunschweig, Germany, October 2008. [Google Scholar]
- Durand-Charre, M. The Microstructure of Superalloys; Gordon & Breach: Amsterdam, The Netherlands, 1997. [Google Scholar]
- Tien, J.K.; Copley, S.M. The effect of uniaxial stress on the periodic morphology of coherent gamma prime precipitates in nickel-base superalloy crystals. Metall. Trans. 1971, 2, 215–219. [Google Scholar] [CrossRef]
- Pollock, T.M.; Argon, A.S. Directional coarsening in nickel-base single crystals with high volume fractions of coherent precipitates. Acta Metall. Mater. 1994, 42, 1859–1874. [Google Scholar] [CrossRef]
- Harris, K.; Erickson, G.L.; Sikkenga, S.L.; Brentnall, W.D.; Aurrecoechea, J.M.; Kubarych, K.G. Development of the Rhenium Containing Superalloys CMSX-4® & CM 186 LC® for Single Crystal Blade and Directionally Solidified Vane Applications in Advanced Turbines. In Superalloys 1992; Antolovich, S.D., Stusrud, R.W., Mackay, R.A., Anton, D.L., Khan, T., Kissinger, R.D., Klarstrom, D.L., Eds.; TMS: Warrendale, PA, USA, 1992; pp. 297–306. [Google Scholar]
- Sutera, S.P.; Skalak, R. The History of Poiseuille’s Law. Annu. Rev. Fluid Mech. 1993, 25, 1–20. [Google Scholar] [CrossRef]
- Schatt, W.; Wieters, K.-P.; Kieback, B. Pulvermetallurgie. Technologien und Werkstoffe, 1st ed.; Springer: Berlin/Heidelberg, Germany, 2007. [Google Scholar]
- Gehrmann, S.; Bunjes, H. Instrumented small scale extruder to investigate the influence of process parameters during premix membrane emulsification. Chem. Eng. J. 2016, 284, 716–723. [Google Scholar] [CrossRef]
- Mie, G. Beiträge zur Optik trüber Medien, speziell kolloidaler Metallösungen. Ann. Phys. 1908, 330, 377–445. [Google Scholar] [CrossRef]
- Kwade, A.; Schwedes, J. Chapter 6 Wet Grinding in Stirred Media Mills. In Particle Breakage; Salman, A.D., Ghadiri, M., Hounslow, M.J., Eds.; Elsevier: Amsterdam, The Netherlands, 2007; pp. 251–382. [Google Scholar]
- DeRoussel, P.; Khakhar, D.V.; Ottino, J.M. Mixing of viscous immiscible liquids. Part 2: Overemulsification—Interpretation and use. Chem. Eng. Sci. 2001, 56, 5531–5537. [Google Scholar] [CrossRef]
- Gehrmann, S.; Bunjes, H. Preparation of Nanoemulsions by Premix Membrane Emulsification: Which Parameters Have a Significant Influence on the Resulting Particle Size? J. Pharm. Sci. 2017, 106, 2068–2076. [Google Scholar] [CrossRef] [PubMed]
Figure 1.
Scanning electron micrographs of the membranes microstructure: (a) LF-γ-membrane; (b) LF-γ′-membrane; (c) TM-γ′-membrane; (d) PE-membrane.
Figure 1.
Scanning electron micrographs of the membranes microstructure: (a) LF-γ-membrane; (b) LF-γ′-membrane; (c) TM-γ′-membrane; (d) PE-membrane.

Figure 2.
Specific energy input of the four membranes (LF-γ′, TM-γ′, PE, and LF-γ) at the three flow rates (0.5 mL/s, 1.0 mL/s, 1.4 mL/s) after 21 cycles.
Figure 2.
Specific energy input of the four membranes (LF-γ′, TM-γ′, PE, and LF-γ) at the three flow rates (0.5 mL/s, 1.0 mL/s, 1.4 mL/s) after 21 cycles.

Figure 3.
Scanning electron micrographs: (a) PE-membrane after the 21st cycle at 1.4 mL/s flow rate attached with the emulsion (the surface has been gold coated); (b) LF-γ′-membrane, white arrows marking narrow passages, which may decrease the permeability.
Figure 3.
Scanning electron micrographs: (a) PE-membrane after the 21st cycle at 1.4 mL/s flow rate attached with the emulsion (the surface has been gold coated); (b) LF-γ′-membrane, white arrows marking narrow passages, which may decrease the permeability.
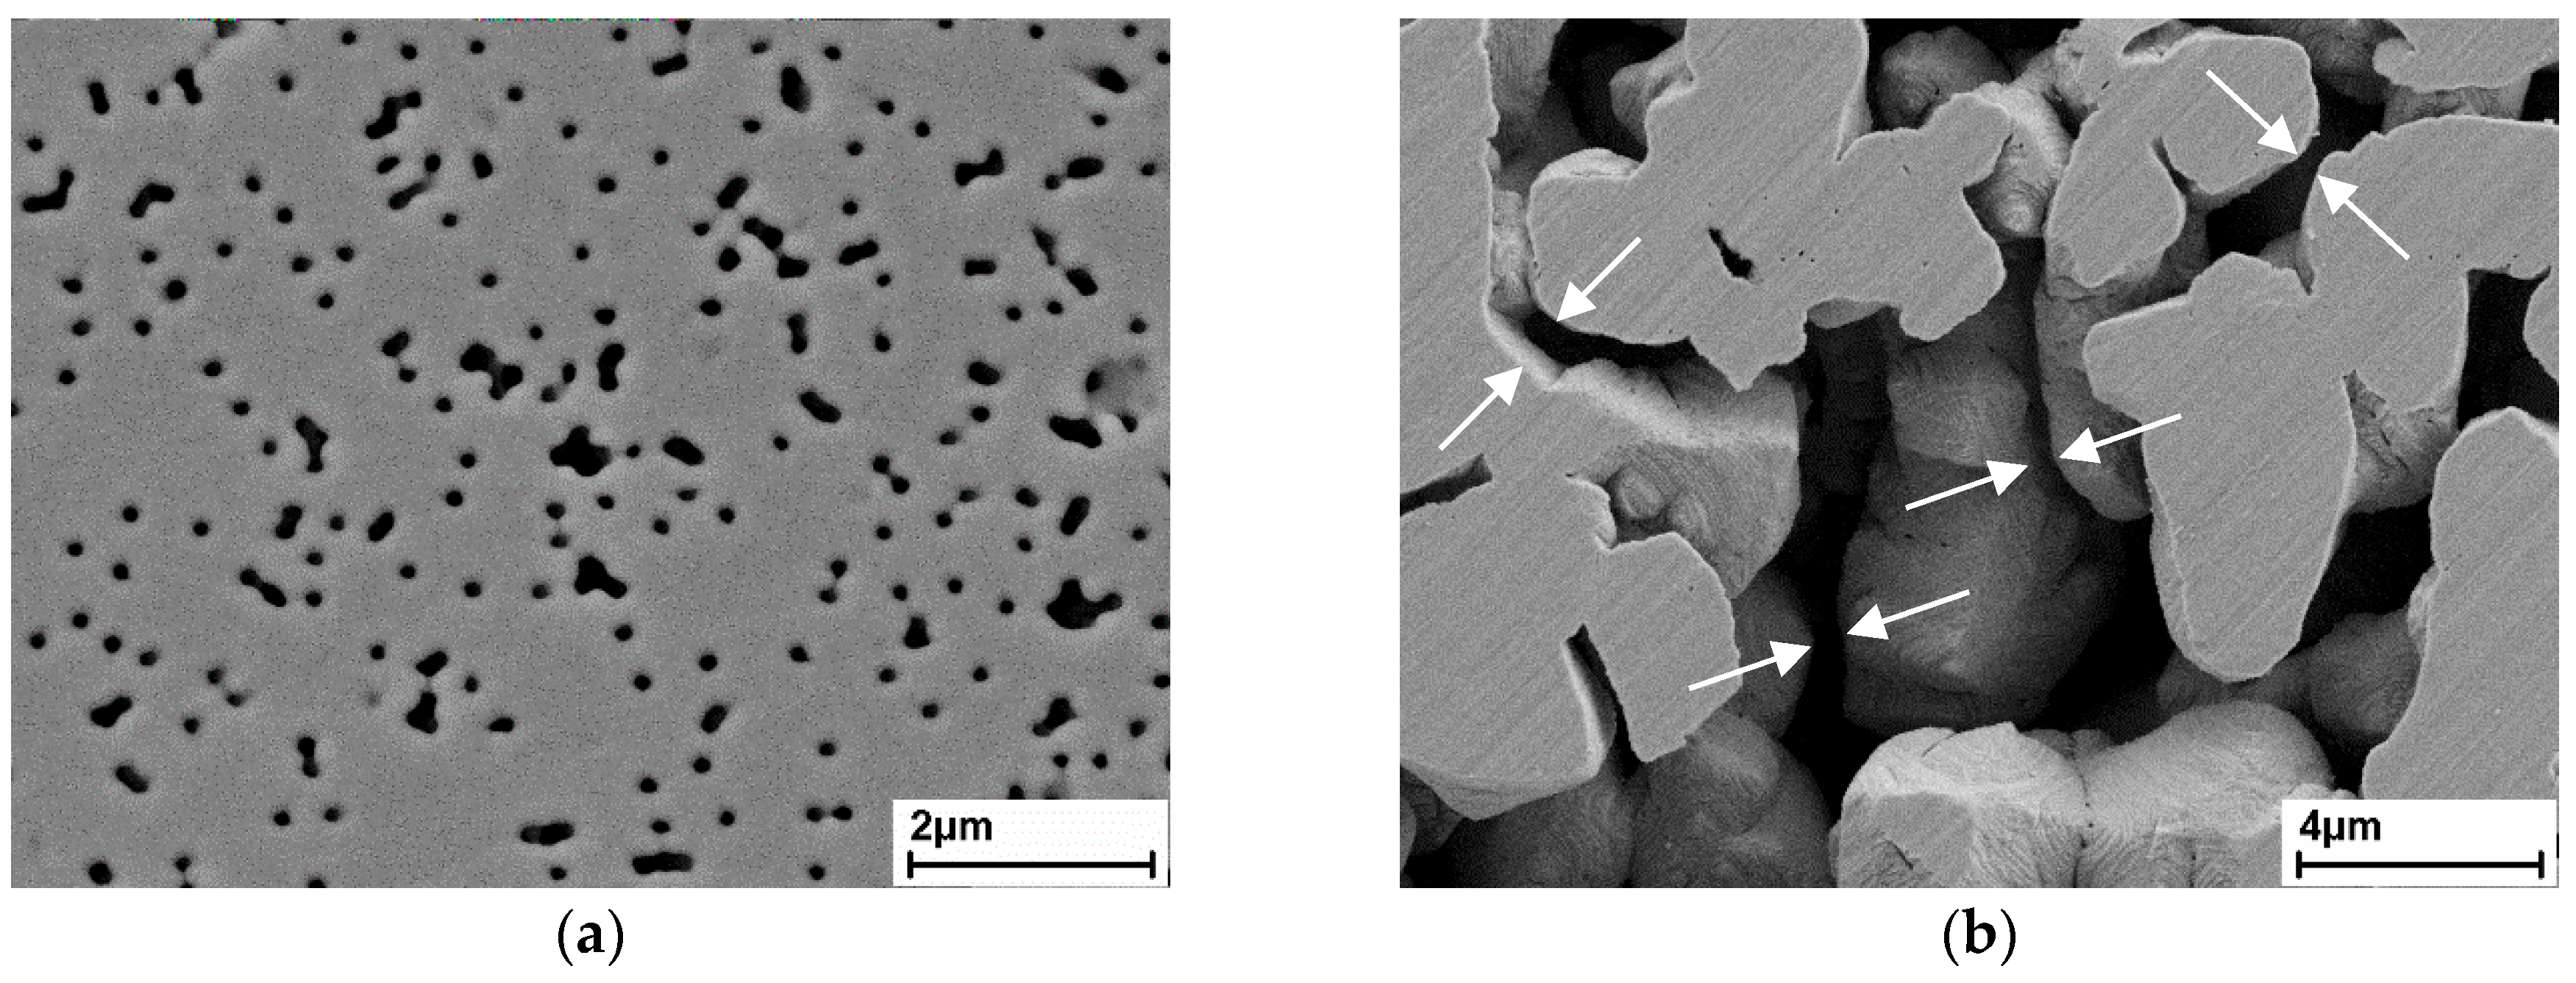
Figure 4.
Droplet sizes , and at the low flow rate (0.5 mL/s) after the 1st, 5th, 11th and 21st cycle, for the TM-γ′-, LF-γ′- and PE-membrane.
Figure 4.
Droplet sizes , and at the low flow rate (0.5 mL/s) after the 1st, 5th, 11th and 21st cycle, for the TM-γ′-, LF-γ′- and PE-membrane.

Figure 5.
Droplet sizes , and at the intermediate flow rate (1.0 mL/s) after the 1st, 5th, 11th and 21st cycle, for the TM-γ′-, LF-γ′- and PE-membrane.
Figure 5.
Droplet sizes , and at the intermediate flow rate (1.0 mL/s) after the 1st, 5th, 11th and 21st cycle, for the TM-γ′-, LF-γ′- and PE-membrane.

Figure 6.
Droplet sizes , and at the high flow rate (1.4 mL/s) after the 1st, 5th, 11th and 21st cycle, for the TM-γ′-, LF-γ′- and PE-membrane.
Figure 6.
Droplet sizes , and at the high flow rate (1.4 mL/s) after the 1st, 5th, 11th and 21st cycle, for the TM-γ′-, LF-γ′- and PE-membrane.


Table 1.
Overview of the manufacturing process of the superalloy membranes.
| Manufacturing Process Steps | TM-γ′-Membrane | LF-γ′-Membrane | LF-γ-Membrane |
|---|---|---|---|
| Homogenization heat treatment | 1277 °C for 2 h 1288 °C for 3 h 1296 °C for 3 h 1304 °C for 2 h 1313 °C for 2 h 1316 °C for 2 h 1318 °C for 2 h 1321 °C for 2 h | 1277 °C for 2 h 1288 °C for 3 h 1296 °C for 3 h 1306 °C for 3 h 1315 °C for 3 h 1318 °C for 2 h 1321 °C for 2 h | |
| Cooling from homogenization | AC to room temperature | FC 0.2 °C/min to 1080 °C | |
| Precipitation heat treatment | 1080 °C for 4 h, AC | ||
| 870 °C for 16 h, AC | |||
| Coarsening of γ′ | 1000 °C, 170 MPa, FC | 1080 °C for 1000 h, AC | |
| Extracted phase | γ-phase | γ′-phase | |
Table 2.
Comparison of extrusion pressure () at the 1st () and 21st () cycle, the difference in extrusion pressure from 1st to 21st cycle (), porosity (ε), height (s), cylindrical capillary equivalent pore diameter (cce) and viscosity coefficient (α), depending on pressure drop at the 1st () and 21st () cycle and the arithmetic mean of all pressure drops from the 1st to 21st cycle (), at the three flow rates () and for the four membranes (LF-γ, PE, TM-γ′ and LF-γ′).
| Mem-Brane | ε [%] | s [µm] | [mL/s] | [bar] | [%] | () [nm] | () [] | |||||
|---|---|---|---|---|---|---|---|---|---|---|---|---|
| LF-γ | 51 | 300 | 0.5 | 2.3 | 2.3 | 0 | 866 | 866 | 887 | 138.3 | 138.3 | 145.2 |
| 1 | 5.3 | 4.9 | −7.5 | 673 | 707 | 699 | 83.6 | 92.2 | 90.2 | |||
| 1.4 | 6.9 | 6.6 | −4.3 | 680 | 698 | 691 | 85.3 | 89.9 | 87.9 | |||
| PE | 9 | 1–2 | 0.5 | 9.4 | 13.9 | 47.9 | 195 | 157 | 173 | 1.1 | 0.7 | 0.8 |
| 1 | 18 | 31 | 72.2 | 194 | 146 | 165 | 1.1 | 0.6 | 0.8 | |||
| 1.4 | 19.4 | 39 | 101 | 221 | 153 | 169 | 1.4 | 0.7 | 0.8 | |||
| TM-γ′ | 26 | 300 | 0.5 | 27.2 | 23.5 | −13.6 | 291 | 314 | 308 | 6.9 | 8 | 7.7 |
| 1 | 45.4 | 46.3 | 2 | 316 | 313 | 319 | 8.1 | 7.9 | 8.3 | |||
| 1.4 | 76 | 82 | 7.9 | 287 | 277 | 285 | 6.7 | 6.2 | 6.6 | |||
| LF-γ′ | 41 | 300 | 0.5 | 35.2 | 38.6 | 9.7 | 203 | 193 | 196 | 5.3 | 4.8 | 4.9 |
| 1 | 75.4 | 77.8 | 3.2 | 194 | 191 | 194 | 4.8 | 4.7 | 4.8 | |||
| 1.4 | 108.1 | 104.5 | −3.3 | 192 | 195 | 194 | 4.7 | 4.9 | 4.8 | |||
Table 3.
Comparison of the span of droplet size distribution and droplet size after the 1st, 5th, 11th and 21st cycle at the low flow rate (0.5 mL/s) for the three membranes.
Table 3.
Comparison of the span of droplet size distribution and droplet size after the 1st, 5th, 11th and 21st cycle at the low flow rate (0.5 mL/s) for the three membranes.
| Membrane | ||||||||
|---|---|---|---|---|---|---|---|---|
| [nm] | Span [-] | [nm] | Span [-] | [nm] | Span [-] | [nm] | Span [-] | |
| PE | 413 | 1.06 | 223 | 0.96 | 176 | 0.64 | 157 | 0.60 |
| TM-γ′ | 434 | 0.56 | 372 | 0.45 | 352 | 0.44 | 316 | 0.48 |
| LF-γ′ | 459 | 0.99 | 343 | 0.85 | 287 | 1.13 | 253 | 1.20 |
Table 4.
Comparison of the span of droplet size distribution and droplet size after the 1st, 5th, 11th and 21st cycle at the intermediate flow rate (1.0 mL/s) for the three membranes.
Table 4.
Comparison of the span of droplet size distribution and droplet size after the 1st, 5th, 11th and 21st cycle at the intermediate flow rate (1.0 mL/s) for the three membranes.
| Membrane | ||||||||
|---|---|---|---|---|---|---|---|---|
| [nm] | Span [-] | [nm] | Span [-] | [nm] | Span [-] | [nm] | Span [-] | |
| PE | 364 | 2.42 | 200 | 0.85 | 163 | 0.63 | 154 | 0.47 |
| TM-γ′ | 344 | 0.99 | 120 | 2.41 | 183 | 0.75 | 160 | 0.67 |
| LF-γ′ | 461 | 6.83 | 275 | 1.16 | 127 | 1.95 | 184 | 0.80 |
Table 5.
Comparison of the span of droplet size distribution and droplet size after the 1st, 5th, 11th and 21st cycle at the high flow rate (1.4 mL/s) for the three membranes.
Table 5.
Comparison of the span of droplet size distribution and droplet size after the 1st, 5th, 11th and 21st cycle at the high flow rate (1.4 mL/s) for the three membranes.
| Membrane | ||||||||
|---|---|---|---|---|---|---|---|---|
| [nm] | Span [-] | [nm] | Span [-] | [nm] | Span [-] | [nm] | Span [-] | |
| PE | 379 | 2.75 | 183 | 0.70 | 164 | 0.68 | 153 | 0.56 |
| TM-γ′ | 324 | 1.08 | 157 | 1.36 | 156 | 0.78 | 143 | 0.52 |
| LF-γ′ | 440 | 7.10 | 268 | 1.17 | 135 | 1.79 | 185 | 0.76 |
© 2018 by the authors. Licensee MDPI, Basel, Switzerland. This article is an open access article distributed under the terms and conditions of the Creative Commons Attribution (CC BY) license (http://creativecommons.org/licenses/by/4.0/).
Share and Cite
MDPI and ACS Style
Kohnke, M.; Finke, J.H.; Kwade, A.; Rösler, J. Investigation of Nanoporous Superalloy Membranes for the Production of Nanoemulsions. Metals 2018, 8, 361. https://doi.org/10.3390/met8050361
AMA Style
Kohnke M, Finke JH, Kwade A, Rösler J. Investigation of Nanoporous Superalloy Membranes for the Production of Nanoemulsions. Metals. 2018; 8(5):361. https://doi.org/10.3390/met8050361
Chicago/Turabian StyleKohnke, Maren, Jan Henrik Finke, Arno Kwade, and Joachim Rösler. 2018. "Investigation of Nanoporous Superalloy Membranes for the Production of Nanoemulsions" Metals 8, no. 5: 361. https://doi.org/10.3390/met8050361
Note that from the first issue of 2016, this journal uses article numbers instead of page numbers. See further details here.