Fabrication Technology and Material Characterization of Hot Rolled Cylindrical Fe-6.5 wt. % Si Bars


State Key Laboratory for Advanced Metals and Materials, University of Science and Technology Beijing, Beijing 100083, China
*
Author to whom correspondence should be addressed.
Metals 2018, 8(5), 371; https://doi.org/10.3390/met8050371
Submission received: 28 March 2018
/
Revised: 14 May 2018
/
Accepted: 21 May 2018
/
Published: 22 May 2018
Abstract
:Cylindrical Fe-6.5 wt. % Si bars of 7.5 mm diameter were successfully fabricated from an as-cast ingot through three rolling stages, with 10 total passes: rough rolling at 850–900 °C and 8–10 m/min; medium rolling at 800–850 °C and 10–15 m/min; finish rolling at 800–850 °C and 12–18 m/min. The evolution of the microstructure, texture, and ordered structure were studied, and the mechanical properties were investigated. Results indicated that the grains were refined by the hot bar rolling. Area fractions of the {100}<011> and {011}<100> oriented grains decreased to 0 during hot bar rolling, whereas the {100}<001>, {011}<211>, and {112}<110> components increased. Furthermore, the γ fiber with {111}<110> component was dominant. After the hot bar rolling, the DO3 ordered phase was suppressed, and the B2 ordered domains were refined. Ductility of the as-rolled bar was better than that of the rotary-swaged bar, due to the absence of the DO3 ordered phase, and refinement of the grains in the rolled bar. Moreover, discontinuous dynamic recrystallization (DDRX) occurred at a high deformation rate during the rough rolling, and continuous dynamic recrystallization (CDRX) appeared at a low strain rate during the finish rolling. Hence, hot bar rolling technology is an excellent process for the fabrication of Fe-6.5 wt. % Si bars.
1. Introduction
The Fe-6.5 wt. % Si alloy has excellent soft magnetic properties, such as high electrical resistance, high relative permeability, near-zero magnetostriction, low coercive force, and low iron loss, making this alloy promising for use in high-frequency applications such as transformers, power generators, and electric relays [1,2]. However, it is very brittle at room temperature due to the formation of ordered structures, such as B2 (Pm3m) and DO3 (Fm3m) phases [3,4]. Various techniques have been developed to produce plates avoiding the room-temperature embrittlement, such as chemical vapor deposition [5], hot dipping [6], spray forming [7,8,9], rapid solidification [10,11,12], and direct powder rolling [13]. Moreover, a hot-warm-cold rolling method, combined with proper heat treatment, has been reported to fabricate sheets with thicknesses of 0.03‒0.05 mm [14,15,16].
Recent patents [17] have revealed that transformers can be constructed by coiling silicon steel wires around a copper conductor. This suggests that high-silicon steel wires with outstanding soft magnetic properties may be good materials for industrial applications. Previously, Fe-6.5 wt. % Si wires with diameters of 1.6 mm were prepared through die forging, hot rotary swaging, and the hot drawing process [18]. However, coarse and inhomogeneous grains and poor surface quality of the rotary swaging bars resulted in low productivity, and has hindered the production of Fe-6.5 wt. % Si wires. These problems can be solved by bar rolling [19]. In fact, rolling is an efficient way to produce both bars and wires from as-cast ingots. As the Fe-6.5 wt. % Si alloy exhibited low formability in sheet rolling [20], systematic research on optimizing the microstructure, surface quality, and mechanical properties should be carried out to improve bar productivity.
Recently, two studies [8,21] have characterized texture evolution during the rolling of Fe-6.5 wt. % Si sheets. However, there have been few reports regarding texture evolution during hot bar rolling. Bar rolling technology differs greatly from sheet rolling technology, in terms of temperature, rolling force, and torque. Hence, it is also necessary to investigate texture evolution during hot bar rolling.
In this paper, a series of appropriate parameters for hot bar rolling of an Fe-6.5 wt. % Si alloy were determined. Microstructure, texture, and ordered structure evolution were investigated, and the mechanical properties of the Fe-6.5 wt. % Si bars were studied in order to obtain the optimal mechanical property combination that improves the drawing efficiency of Fe-6.5 wt. % Si wires.
2. Materials and Methods
2.1. Starting Materials
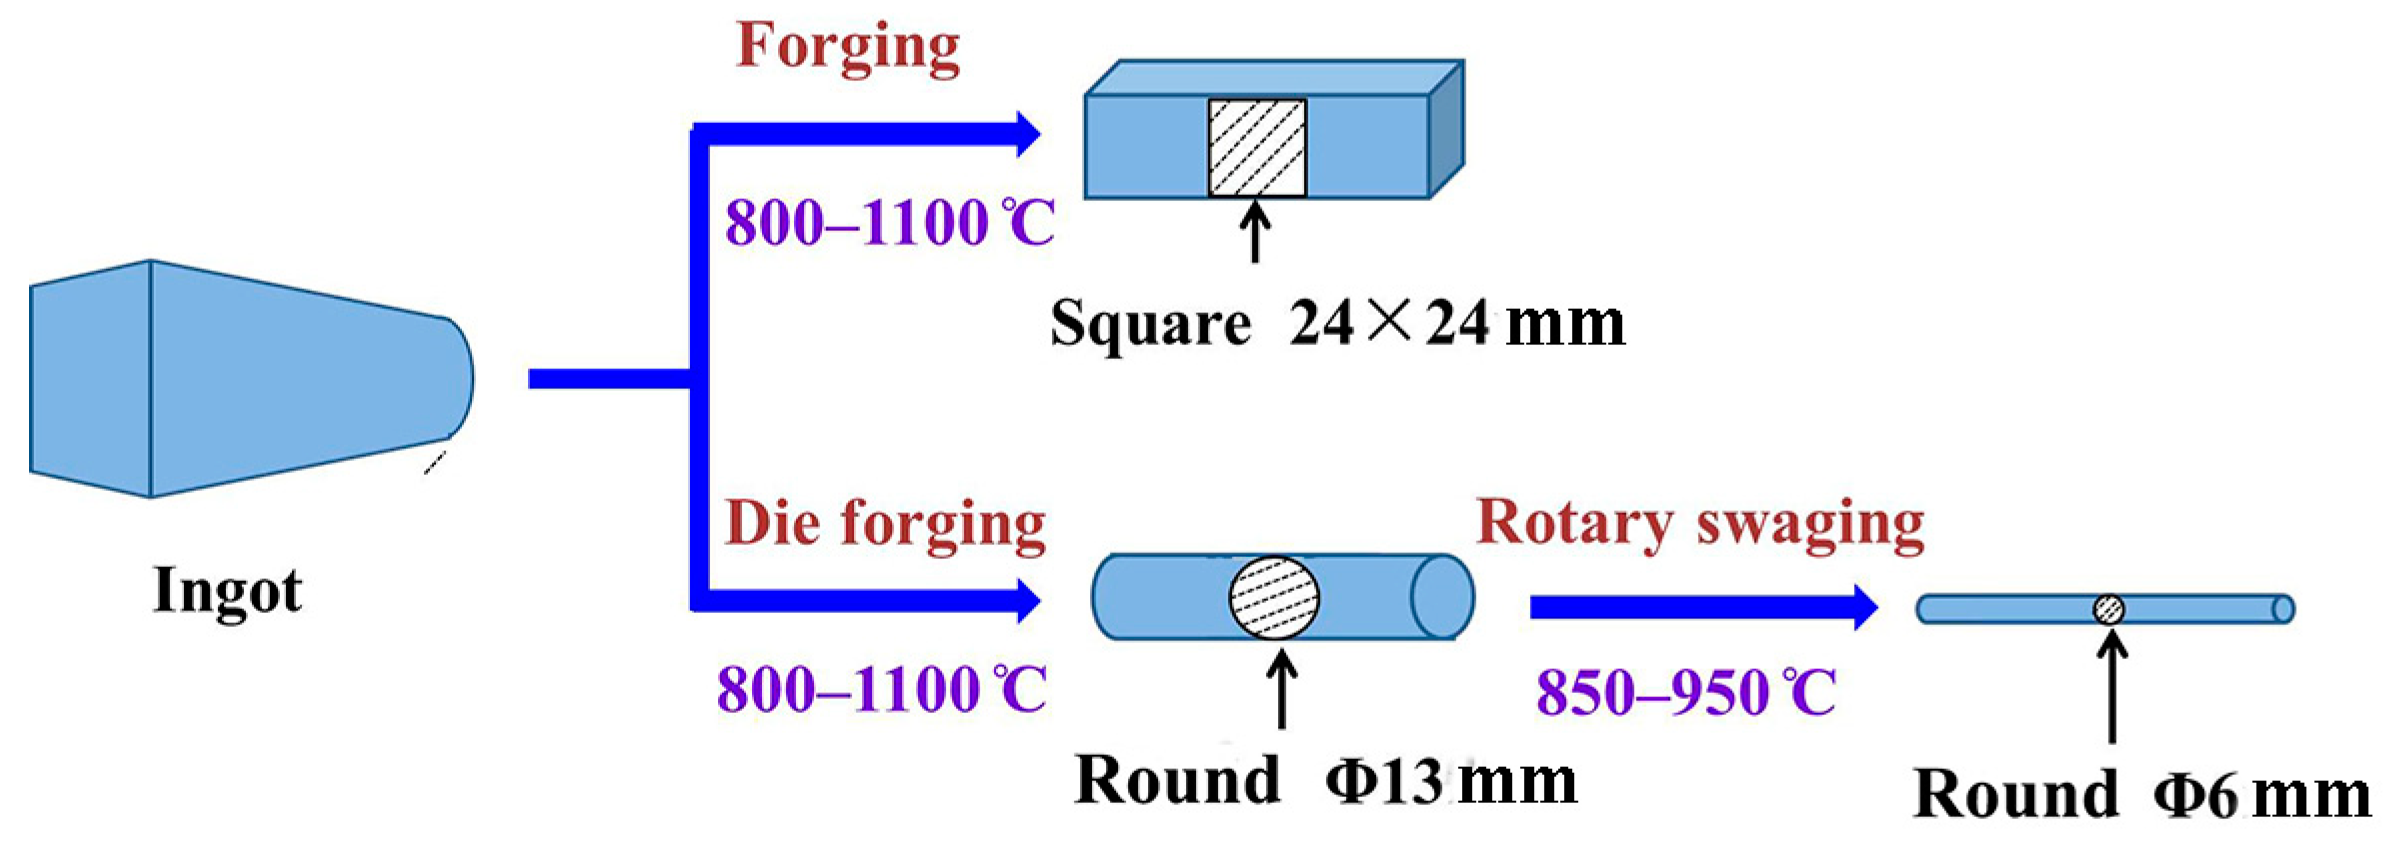
Fe-6.5 wt. % Si alloy ingots were prepared by melting pure iron (99.5 wt. %) and metallic silicon (99 wt. %) under a vacuum, through induction heating. Figure 1 shows the process flow chart for production of various shapes from the starting Fe-6.5 wt. % Si alloy. The ingots were forged into square billets (cross sectional area 24 × 24 mm) or rods (diameter Φ13 mm) at 800–1100 °C. Subsequently, the as-forged rods were hot rotary swaged into thin bars (diameter Φ6 mm) at 850–950 °C. The chemical composition of the alloy is displayed in Table 1.
2.2. Rolling Equipment
Fe-6.5 wt. % Si bars were prepared using a Φ120 mm hot rolling mill. The Fe-6.5 wt. % Si alloy was heated in a WX3–75–9 heat-treatment furnace (Dotrust Exact Science, Beijing, China).
2.3. Characterization of Microstructure and Mechanical Properties
Specimens of the Fe-6.5 wt. % Si bars were polished and etched with a solution of 5% HNO3 in deionized water. Microstructures were observed using an optical microscope (Zeiss, Jena, Germany). Micro-hardness was examined using a 402 MVD micro-hardness indenter (Wolpert Wilson Instruments, Shanghai, China).
The texture of the specimen was investigated with an electron backscatter diffraction (EBSD) detector, mounted on a ZEISS SUPRA 55 scanning electron microscope (SEM; Oxford Instruments, Oxford, UK). The HKL CHANNEL 5 program was used for processing data, such as orientation distribution functions (ODFs) and texture components of the specimens, with a deviation of 15°.
Ordered structures were investigated during hot bar rolling with a Tecnai G2 F30 transmission electron microscope (TEM; Thermo Fisher Scientific Inc., Hillsboro, OR, USA). The specimens were electropolished in a solution of 5% perchloric acid and 95% ethanol, at a voltage of 30 V, and at −20 °C.
Tensile ductility of the Fe-6.5 wt. % Si bar was measured using a DDL50 high-temperature electronic universal testing machine (Sinotest Equipment Co., Ltd., Changchun, Jilin, China). Tensile tests were carried out at a strain rate of 5 × 10⁻⁴ s−1, and at temperatures ranging from 600 to 800 °C.
3. Fabrication of Fe-6.5 wt. % Si Bars by the Hot Bar Rolling Technique
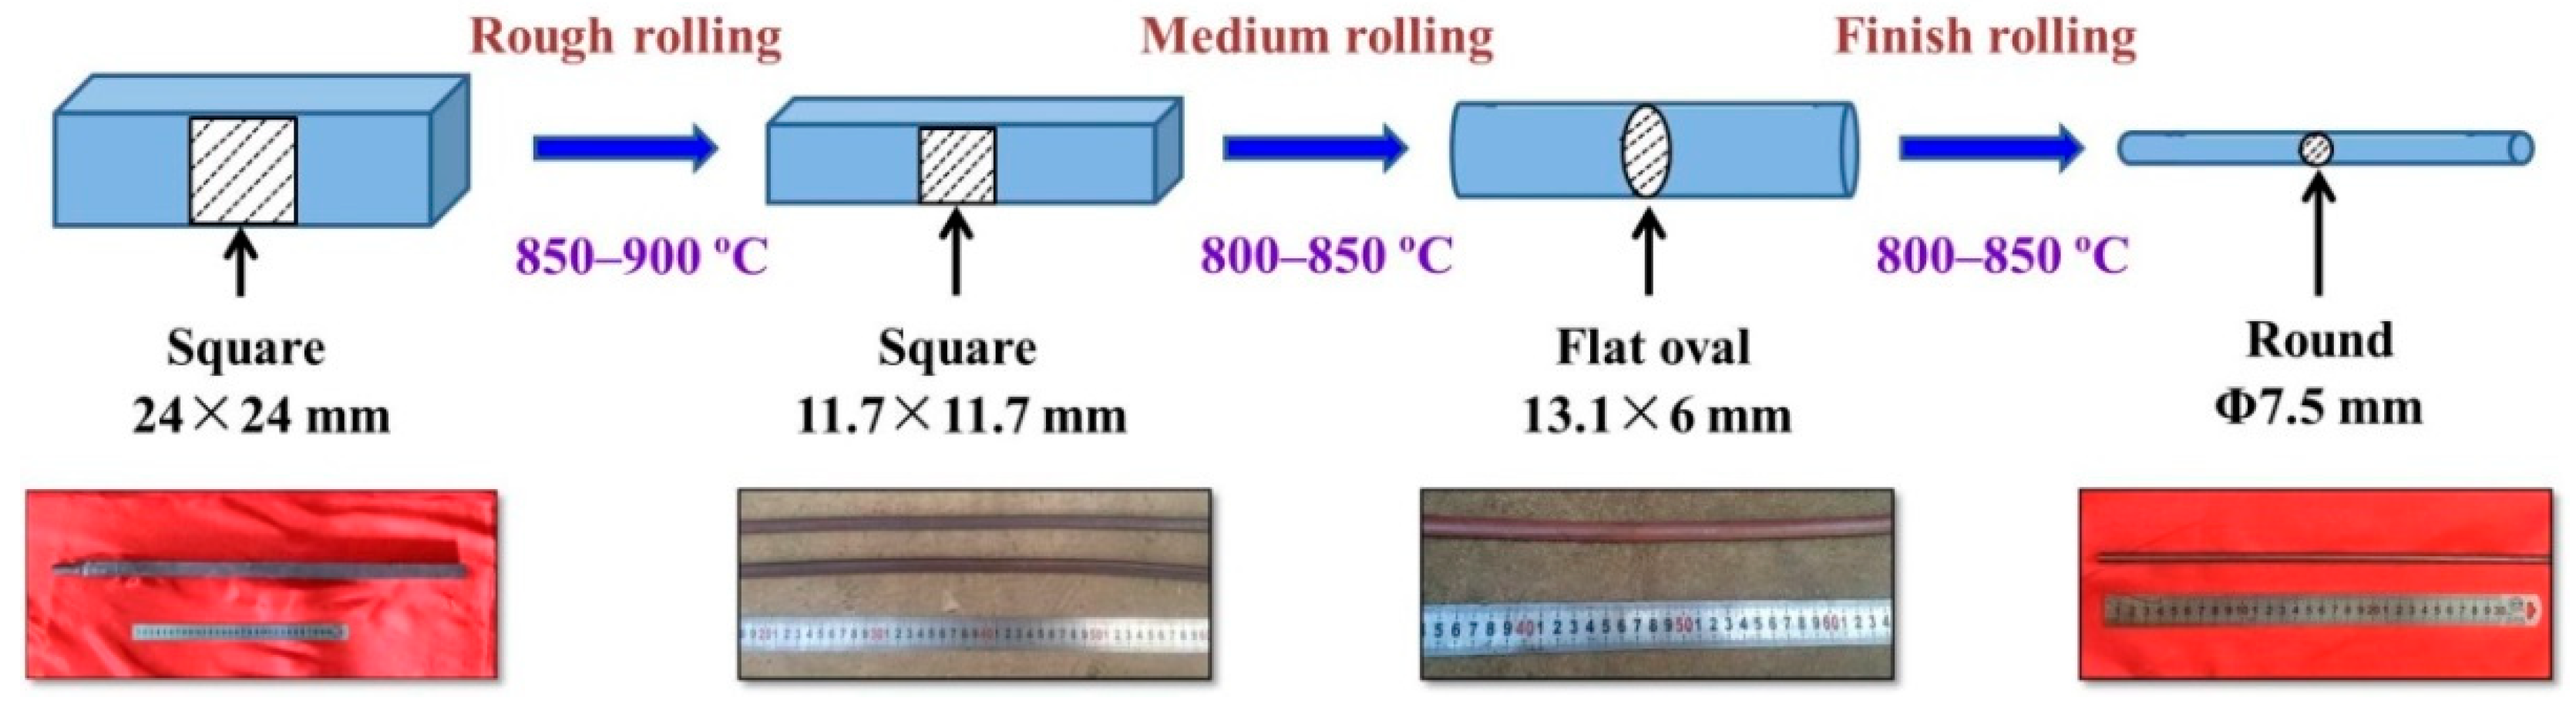
Rolling temperature, roll pass, and rolling groove are major parameters of the shape rolling design process [22,23]. Determination of these parameters was based on the results of previous studies [19,24]. Figure 2 shows a process flow-chart for the hot bar rolling of the Fe-6.5 wt. % Si alloy.
3.1. Rolling Temperature and Roll Pass
The rolling temperature utilized is dependent on the high-temperature mechanical properties of the Fe-6.5 wt. % Si alloy. The roll pass can be calculated according to the shape and size of the forging billet and the bar. Bars of 7.5 mm diameter were prepared through three rolling stages with 10 total passes: rough rolling at 850–900 °C and 8–10 m/min; medium rolling at 800–850 °C and 10–15 m/min; finish rolling at 800–850 °C and 12–18 m/min.
3.2. Rolling Groove and Deformation Ratio
The rolling grooves were determined by the deformation ratio and flow stress. The hot bar rolling parameters, including roll pass, groove system, and deformation ratio, are listed in Table 2. The hexagon-square-oval-square sequence was used during the rough rolling stage to achieve a rapid reduction of the cross-sectional area. Based on our previous study [25], a 50% deformation ratio was chosen in order to obtain a stable and secure microstructure transformation, and to improve workability. The oval-square-oval-round sequence, and a medium deformation ratio of 30% were selected as the medium rolling parameters to improve surface quality. The oval-round sequence, and a 15% deformation were used to achieve the exact dimensions during the finish rolling.
3.3. Rolling Gap
The rolling gap also influences the rolling stability and the shape of the materials. In the rough and medium rolling stages, the rolling gap was adjustable, and the profile geometry was variable, which was conducive to reducing the risk of the metal twisting. In the finish rolling stage, the rolling gap was decreased to 0 to ensure the desired shape and surface quality.
4. Results and Discussion
4.1. Microstructure Evolution
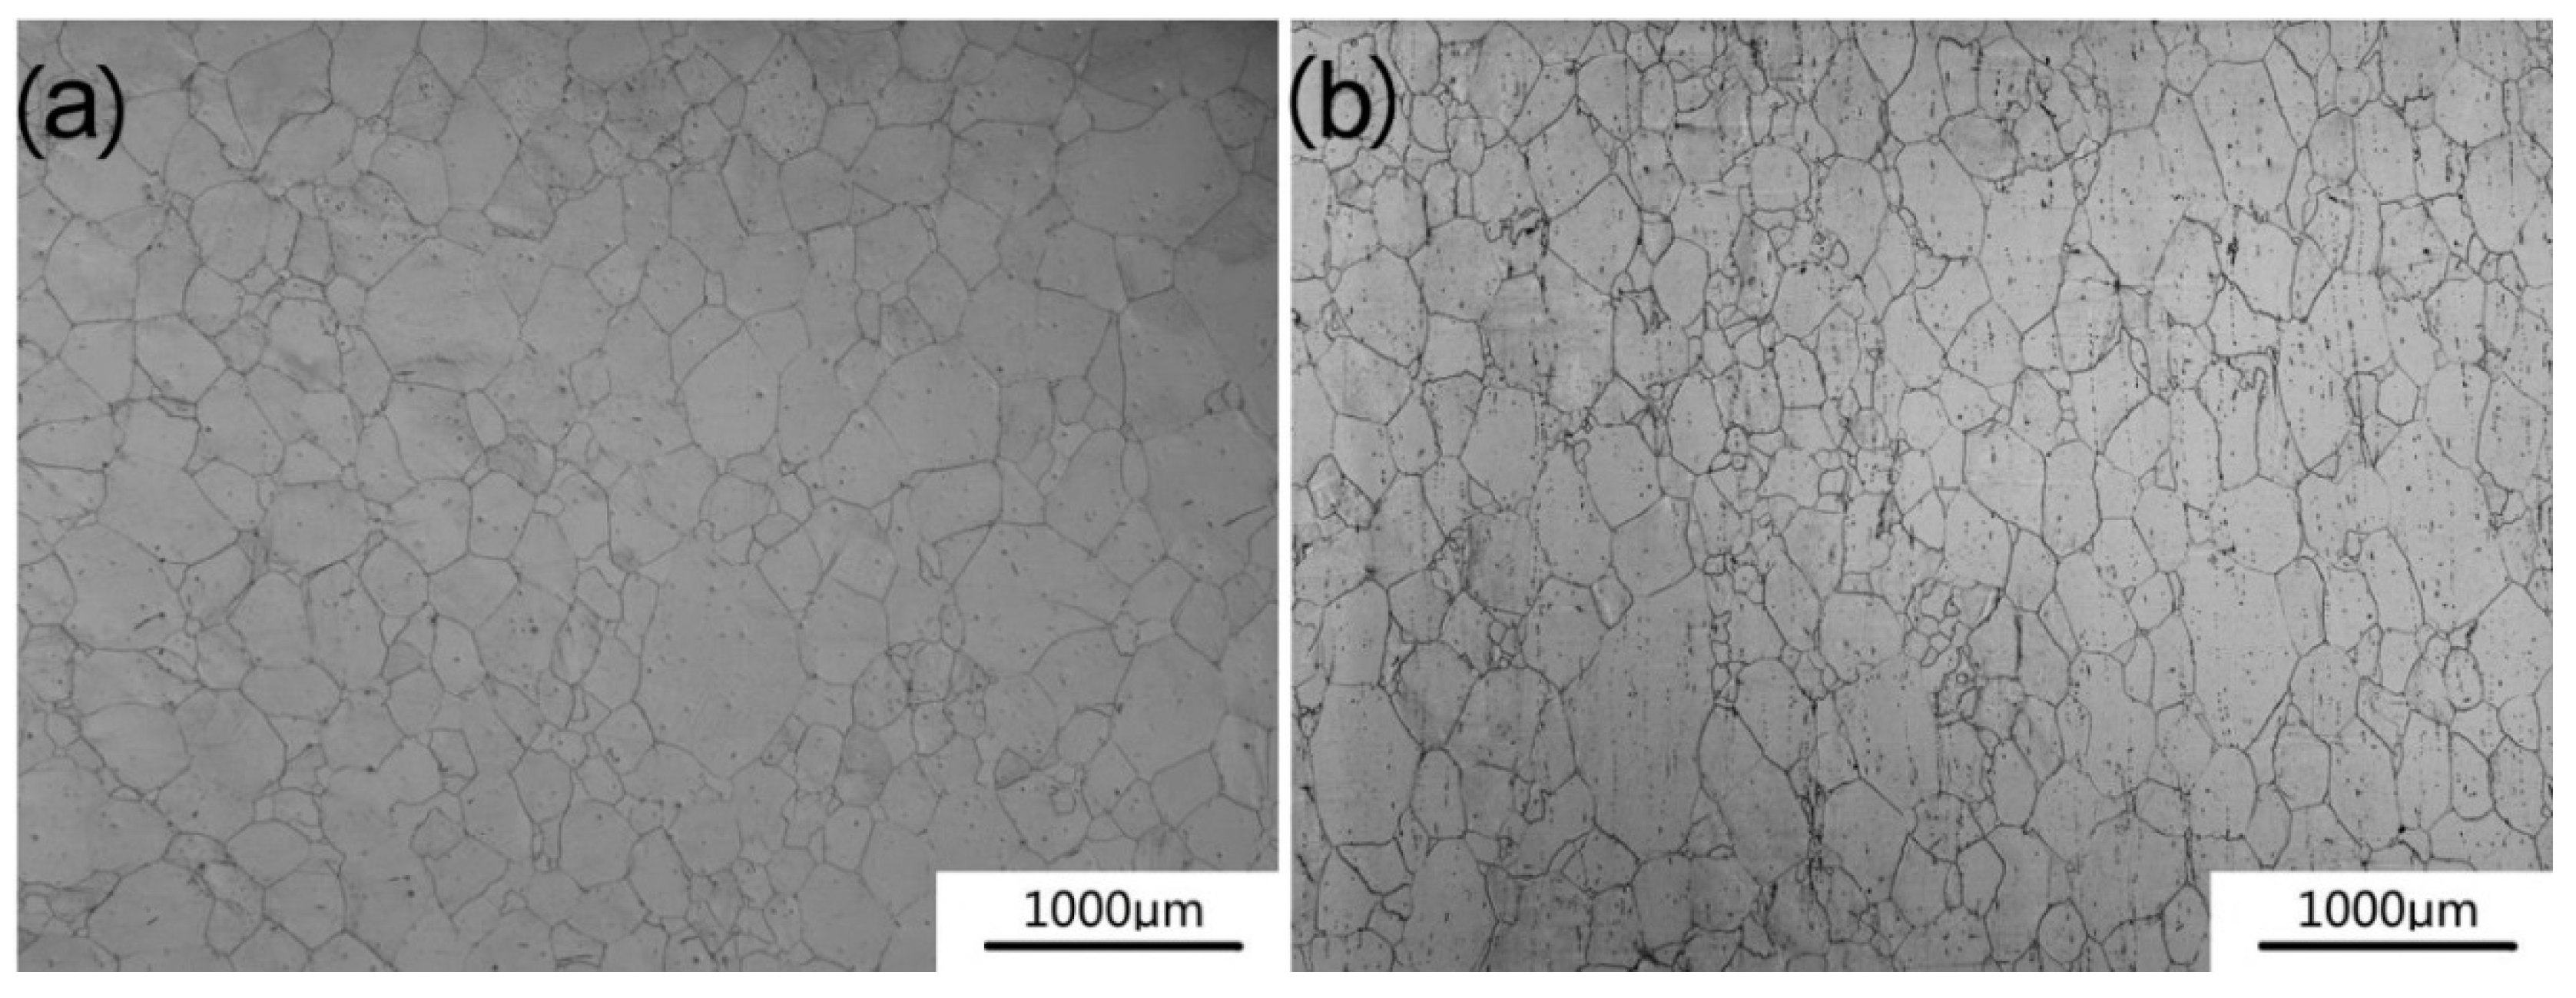
Figure 3 shows the microstructures of the as-forged Fe-6.5 wt. % Si alloy along the radial direction (RD) and axial direction (AD). The coarse grains were inhomogeneous, and grain sizes along the RD and AD were similar before hot bar rolling, as shown in Figure 3a,b. This indicates that full recrystallization and grain growth occurred due to the long tempering time during forging.
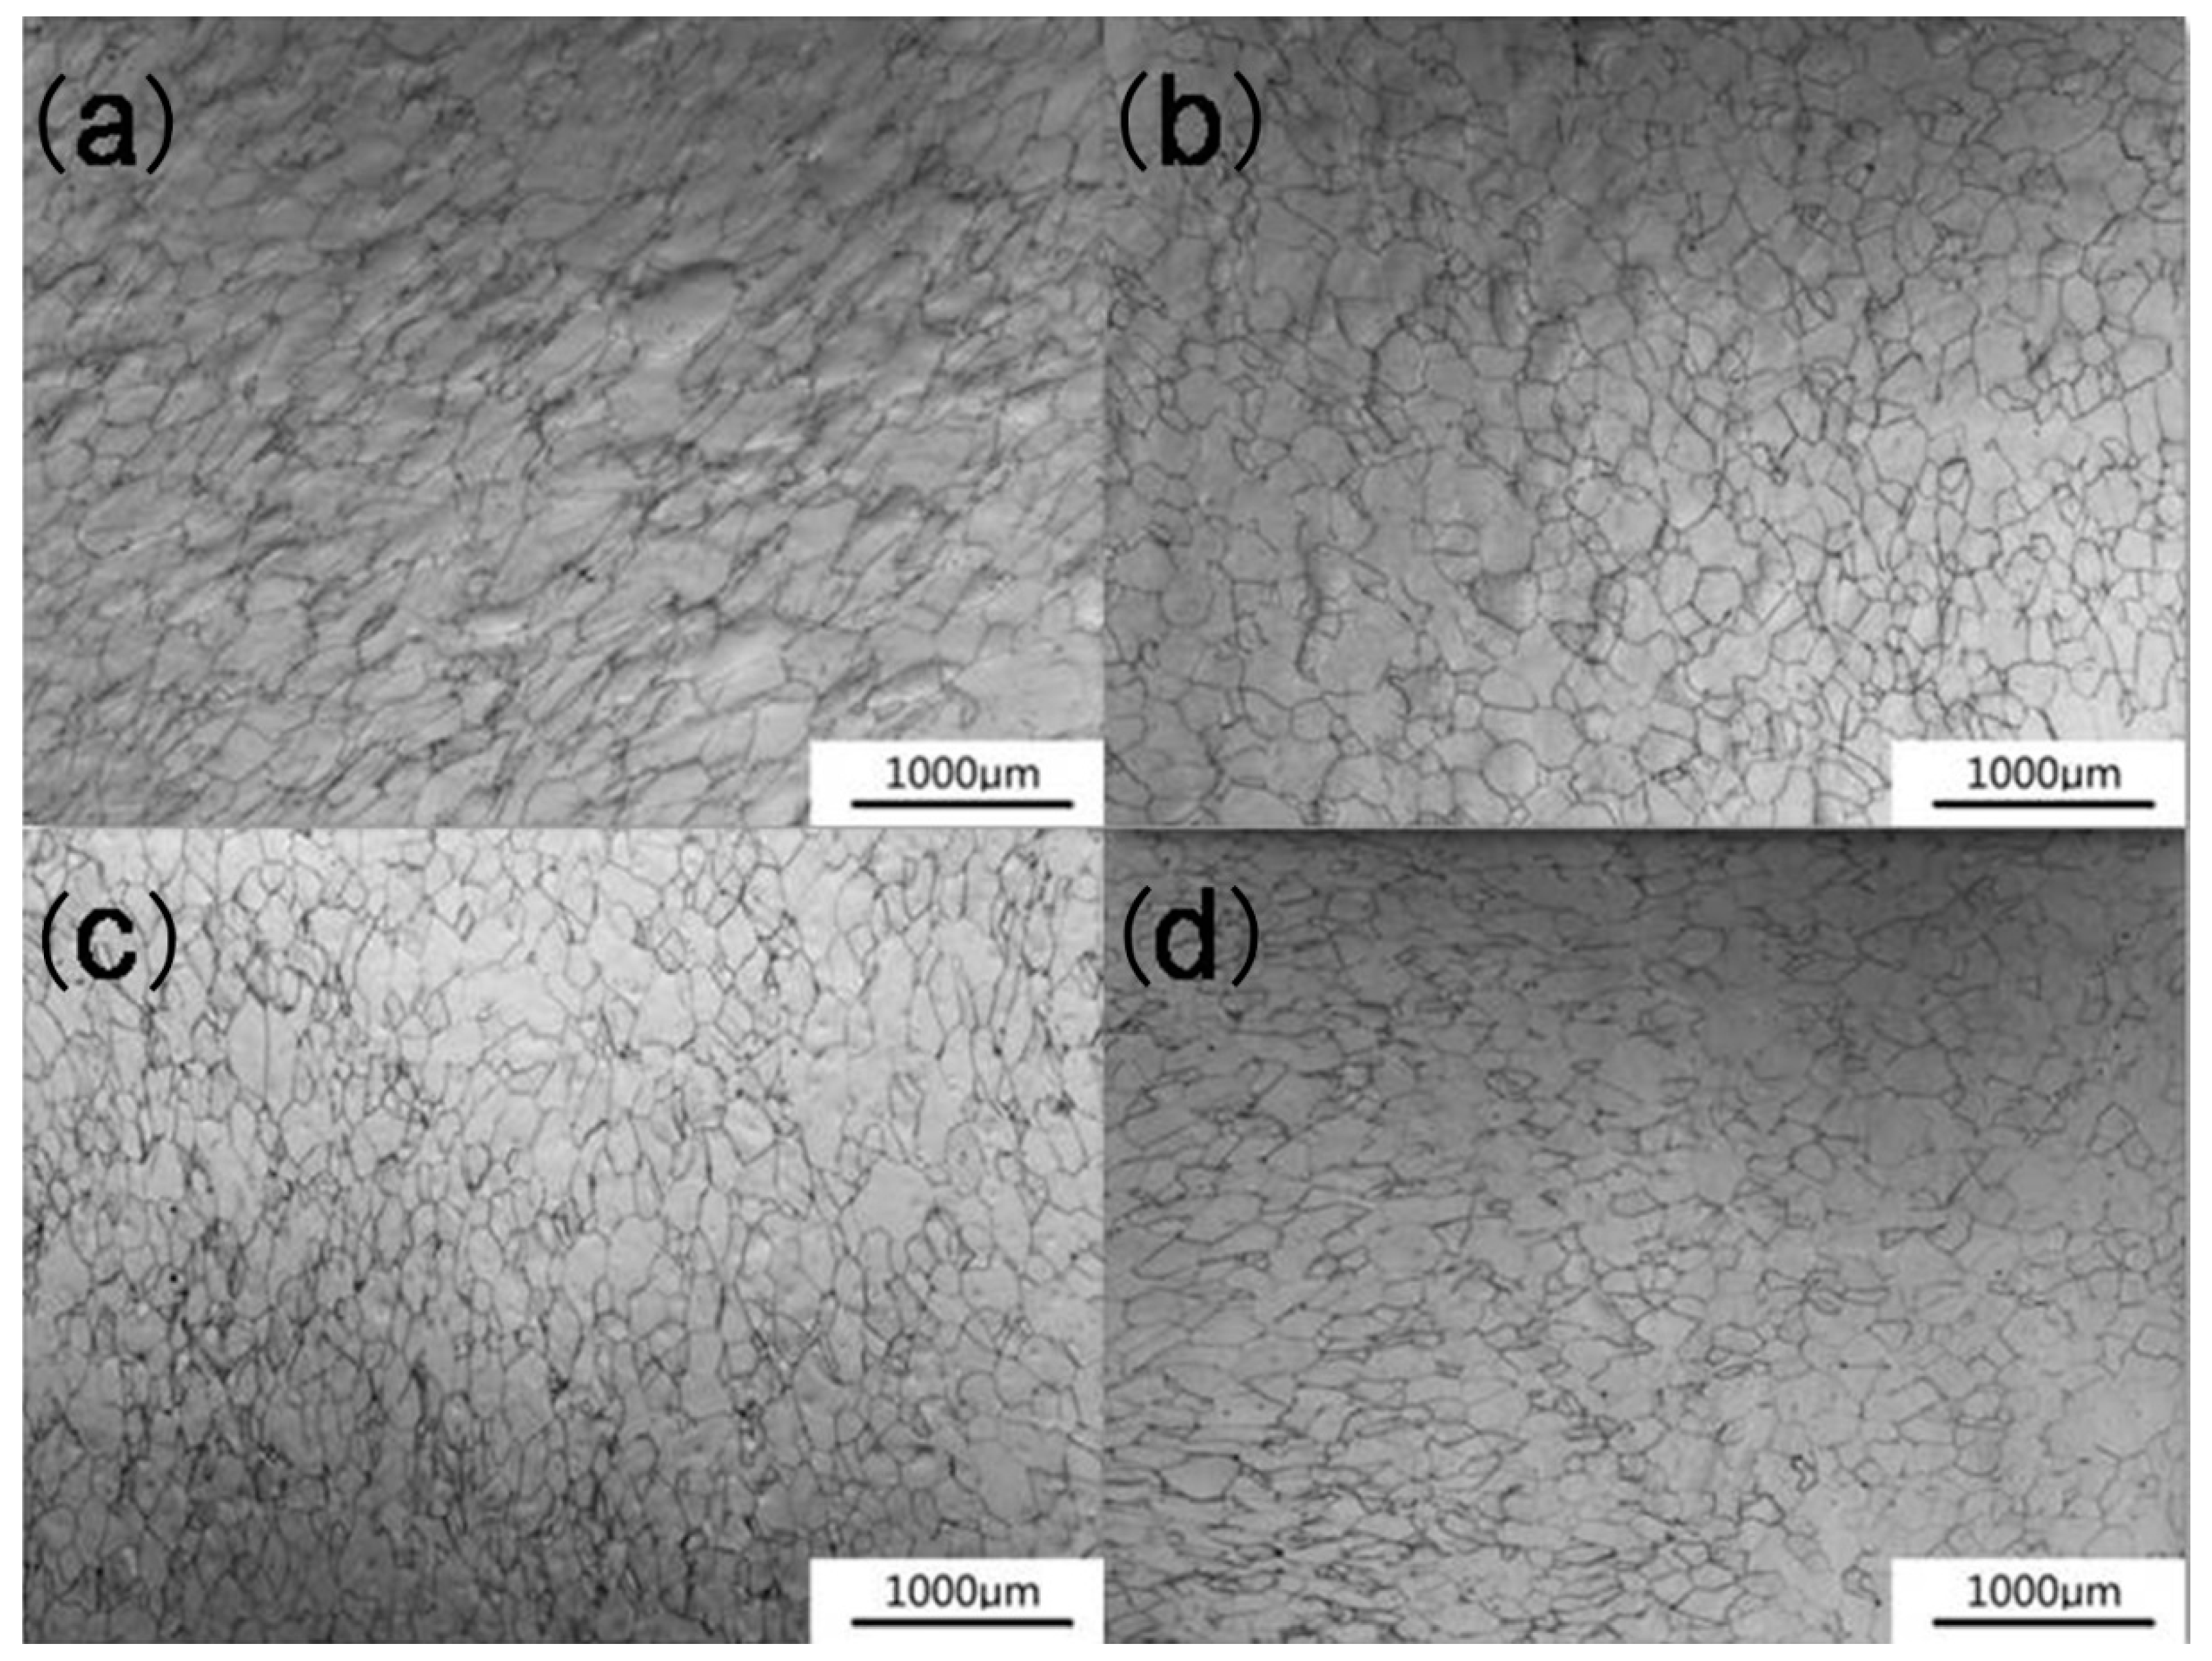
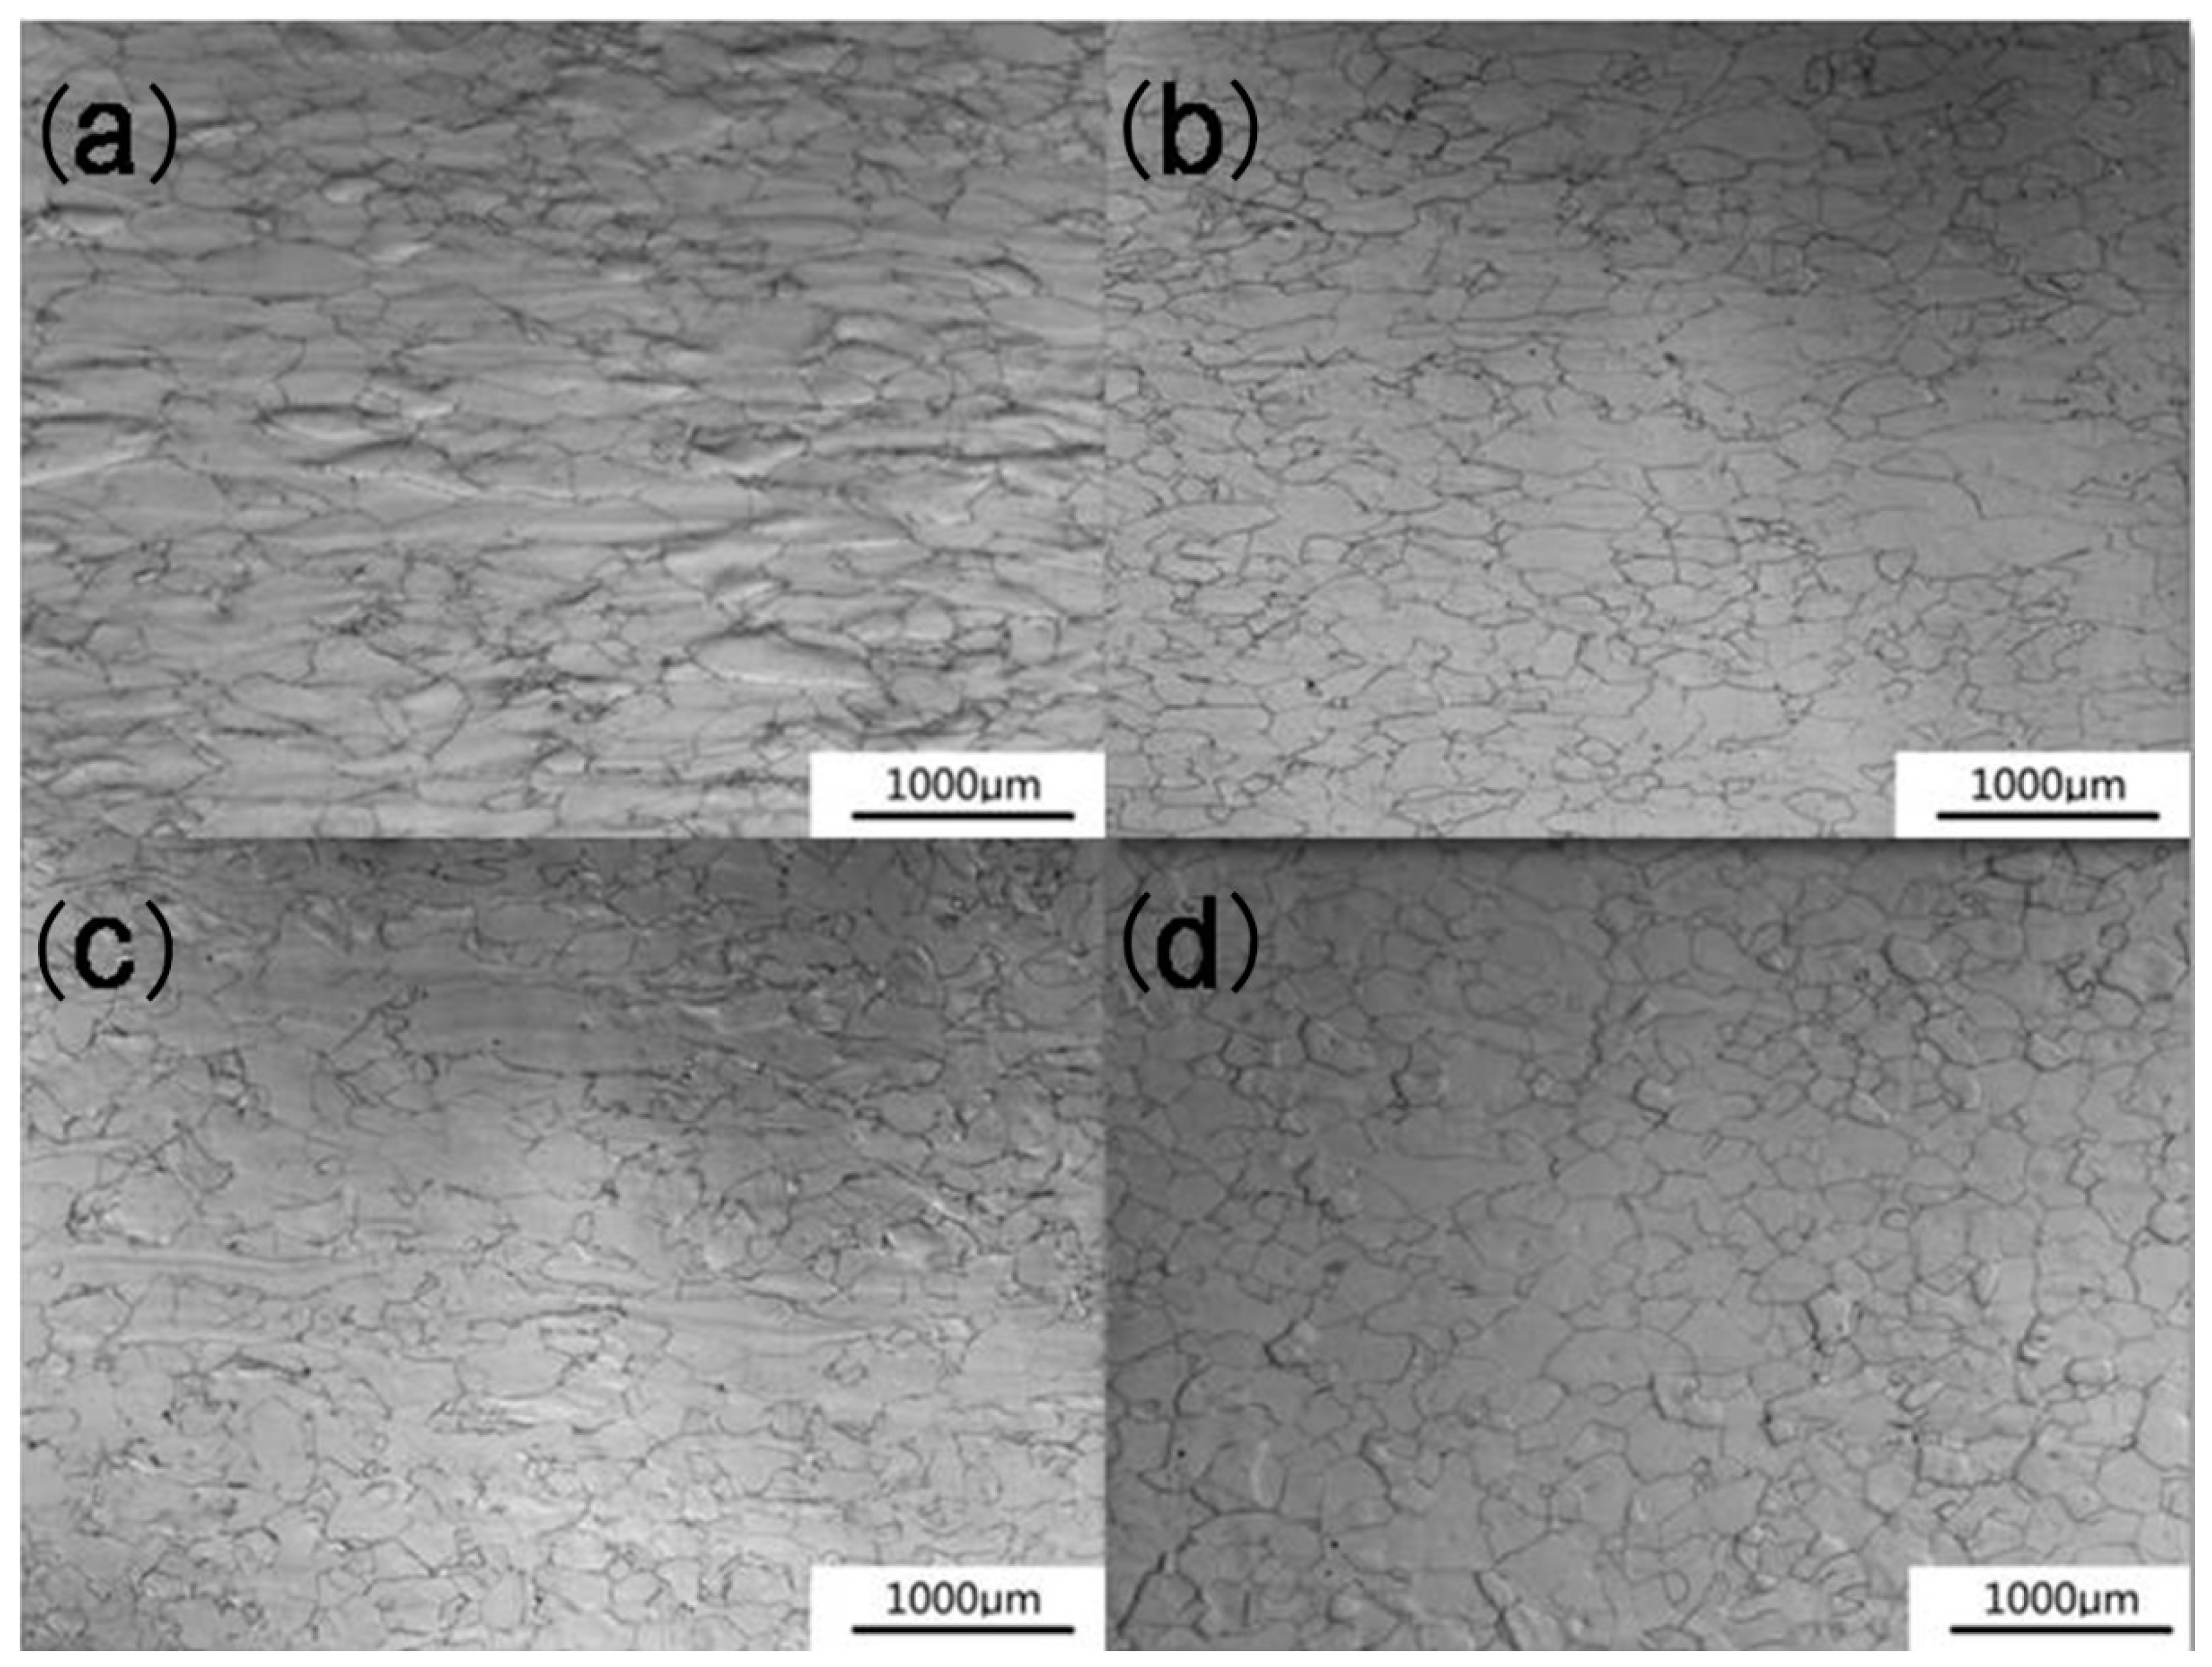
Figure 4 shows the microstructure evolution of the Fe-6.5 wt. % Si alloy along the RD during various rolling passes. The coarse and inhomogeneous grains were refined, and the grain size decreased with the increase in total deformation. The small deformation along the RD at the high rolling temperature (>800 °C) resulted in dynamic recrystallization (DRX) [26], which led to refinement of the grains.
Figure 5 shows the microstructure evolution of the Fe-6.5 wt. % Si alloy along the AD, during various rolling passes. The coarse grains were deformed and elongated along the AD after rough rolling, as shown in Figure 5a. After the medium rolling stage, the elongated grains at the edge were recrystallized, whereas the deformed grains in the center remained elongated, as represented in Figure 5b,c. This indicates that DRX occurred at the edges, owing to the large deformation. However, the small deformation did not fulfill the conditions of DRX, and thus, DRX did not occur in the center. After the finish rolling stage, equiaxed grains were observed, instead of the elongated grains in the Φ7.5 mm bars, due to the full DRX, as shown in Figure 5d.
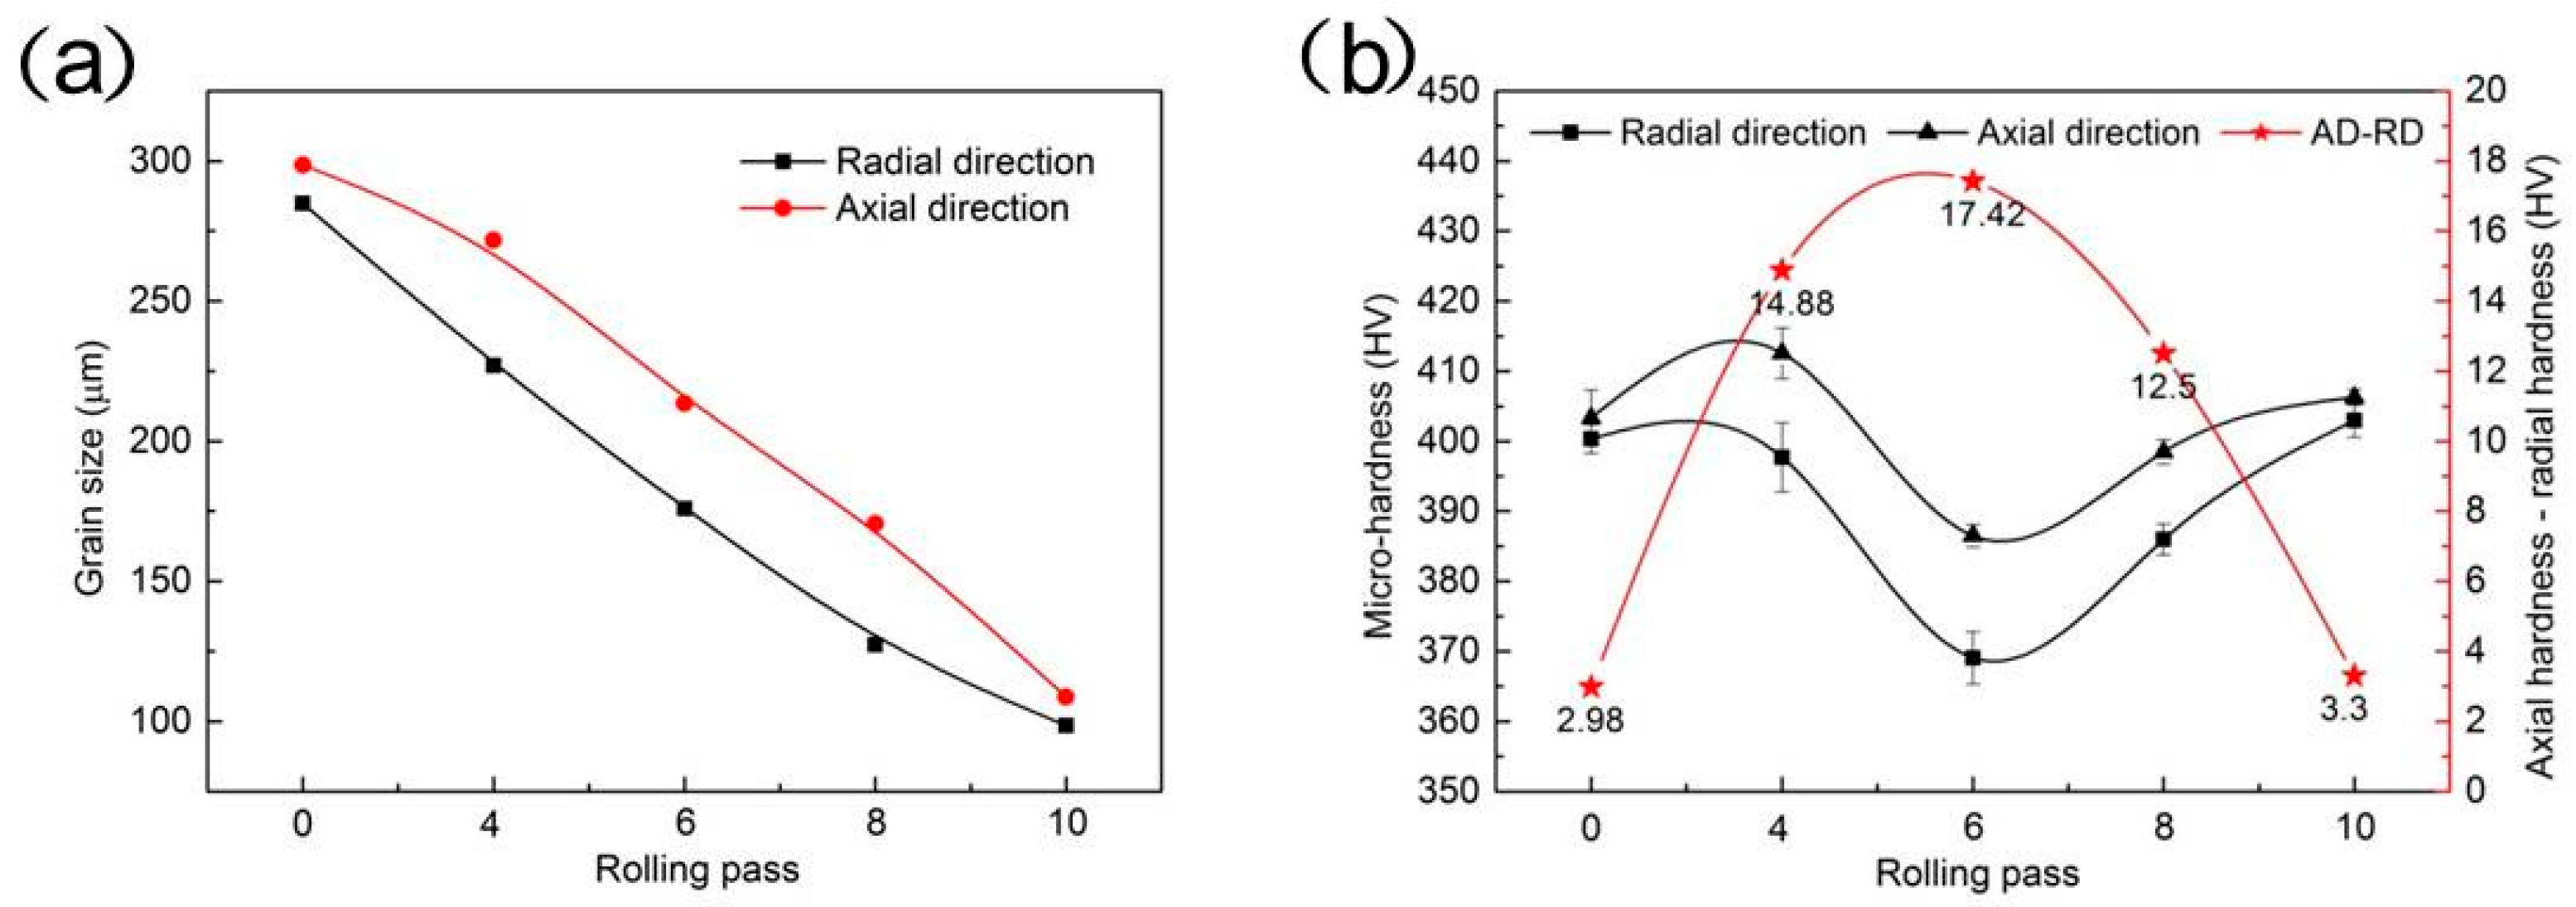
Figure 6 shows the variations in grain size and micro-hardness during hot bar rolling. It was observed that the grains were refined, decreasing from 285 to 98 μm along the RD, and from 300 to 108 μm along the AD, as represented in Figure 6a. Micro-hardness along both the RD and AD decreased slightly from 400 HV during the hot bar rolling, before increasing back to 400 HV by the final passes, as shown in Figure 6b. In particular, the value (AD micro-hardness–RD micro-hardness) increased from 3 HV to 17 HV by the sixth pass, before decreasing back to 3 HV by the final pass.
4.2. Texture Evolution
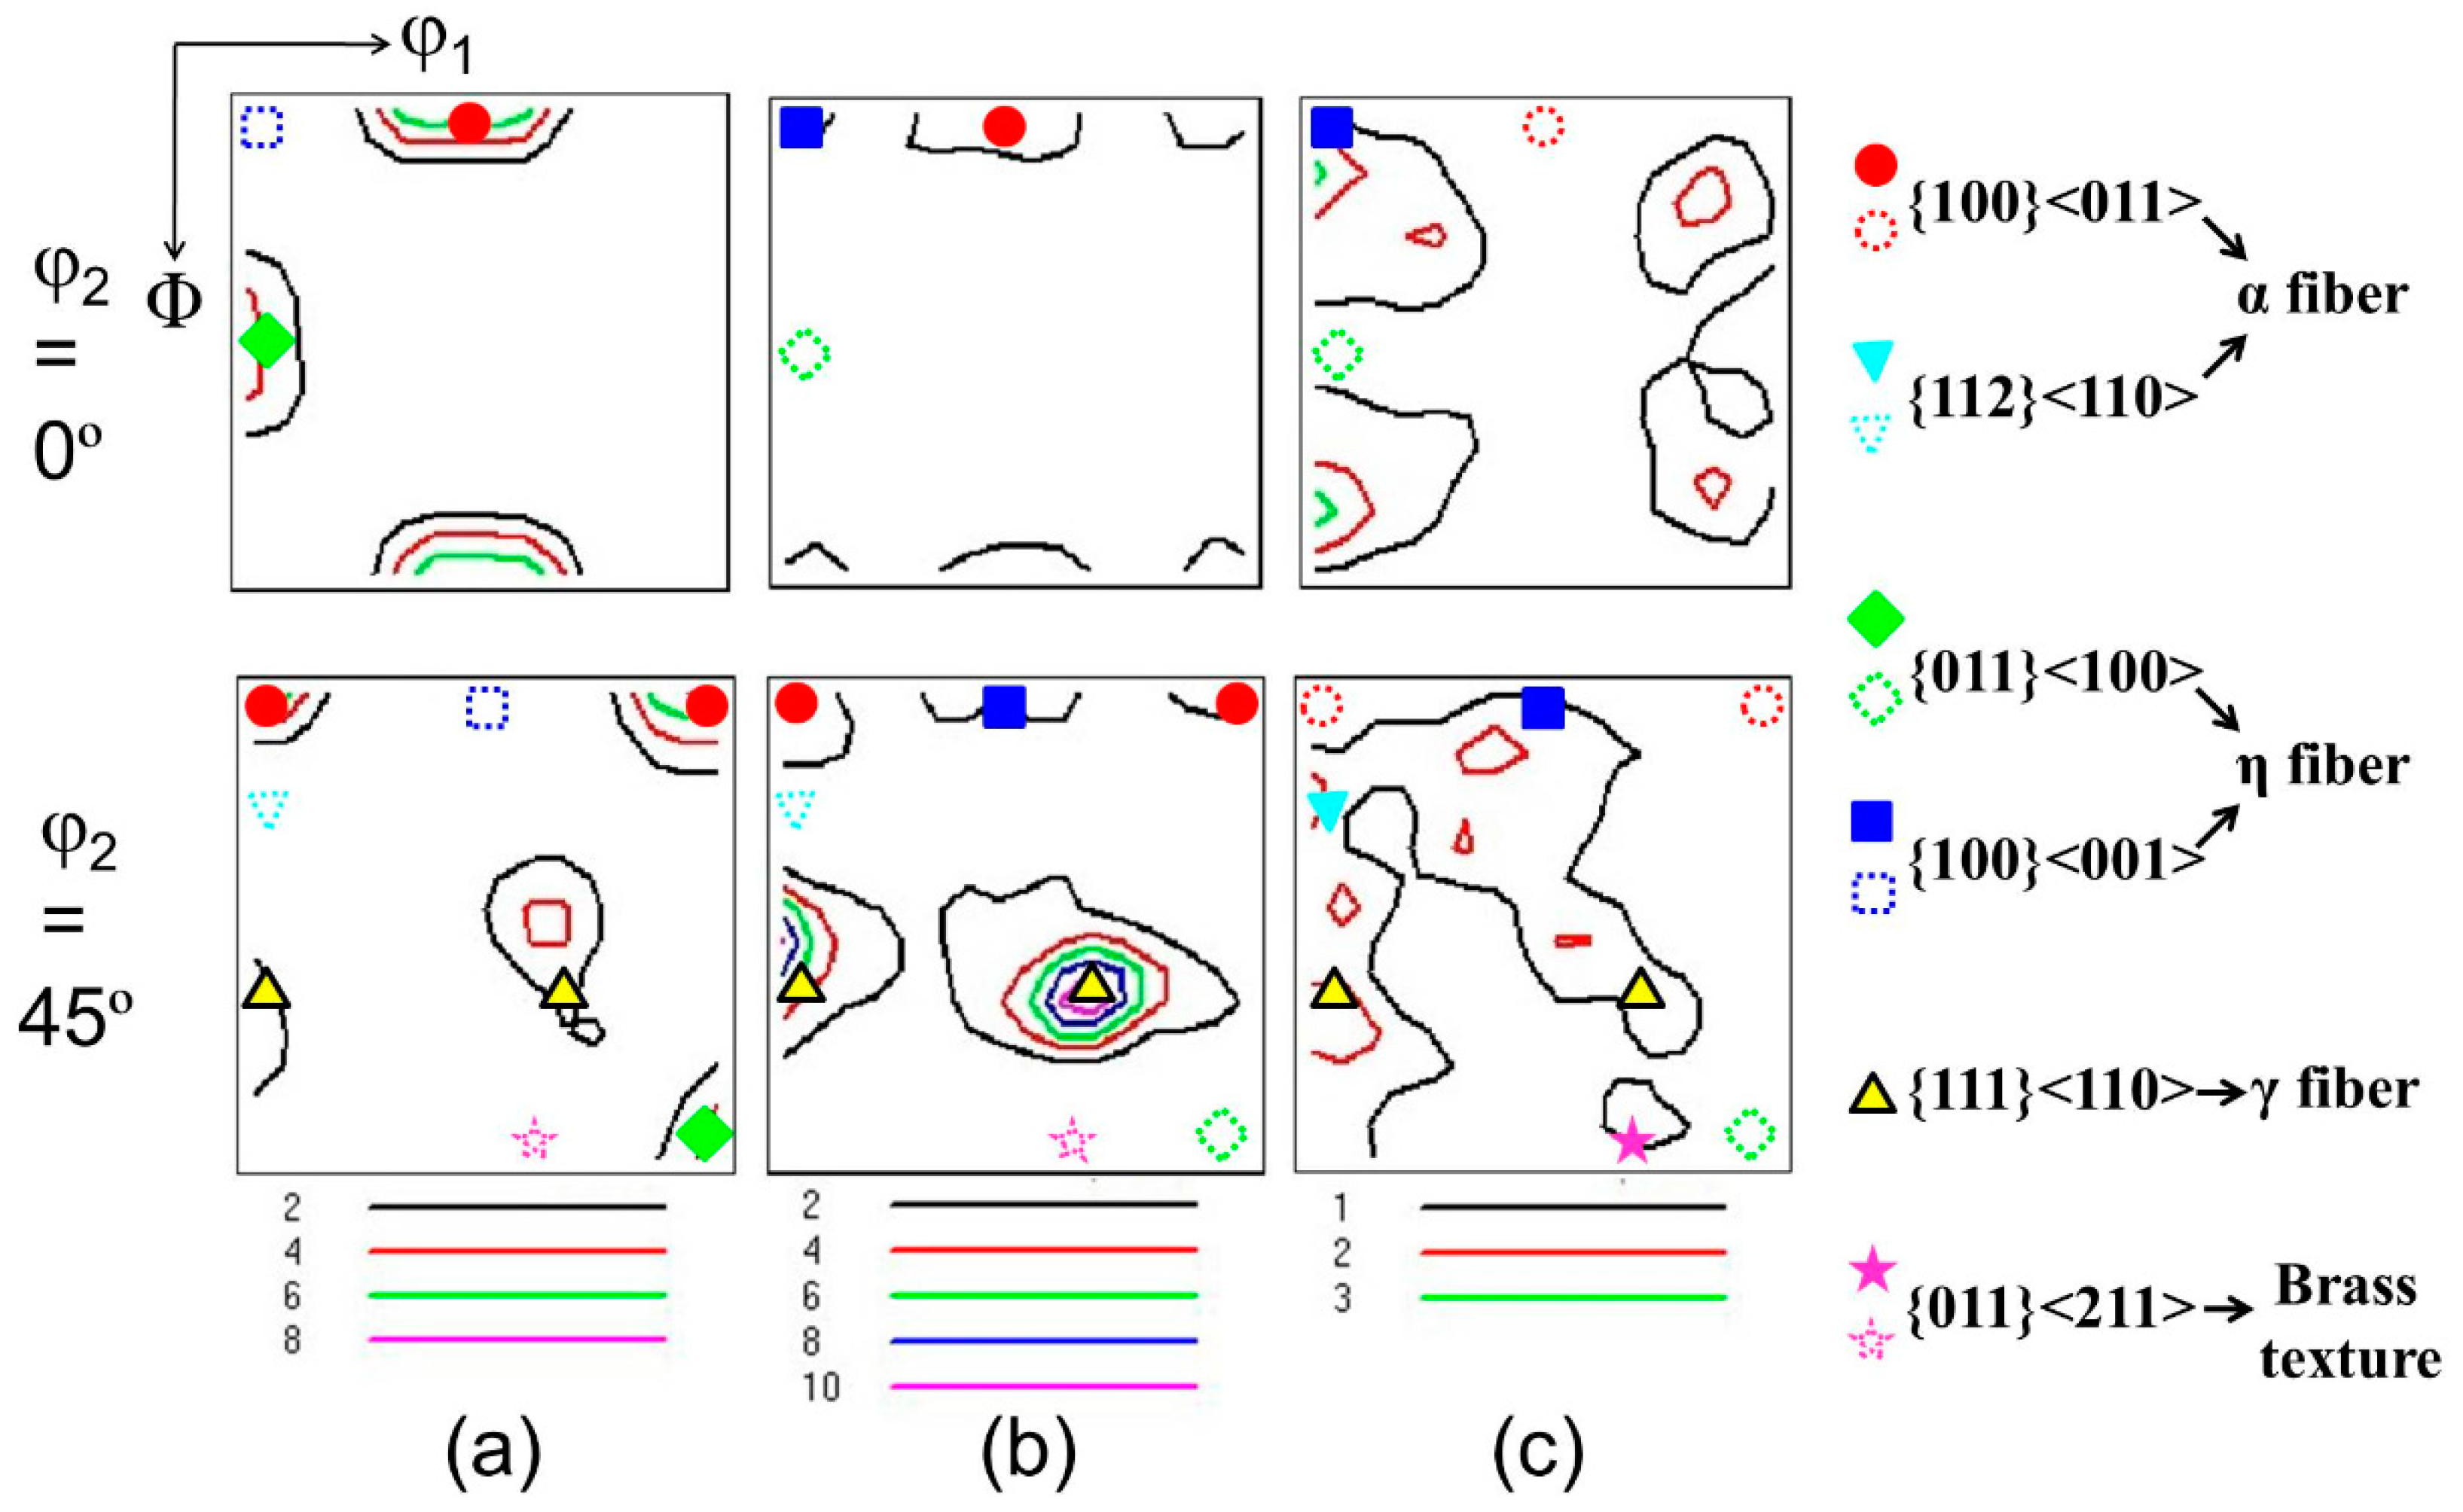
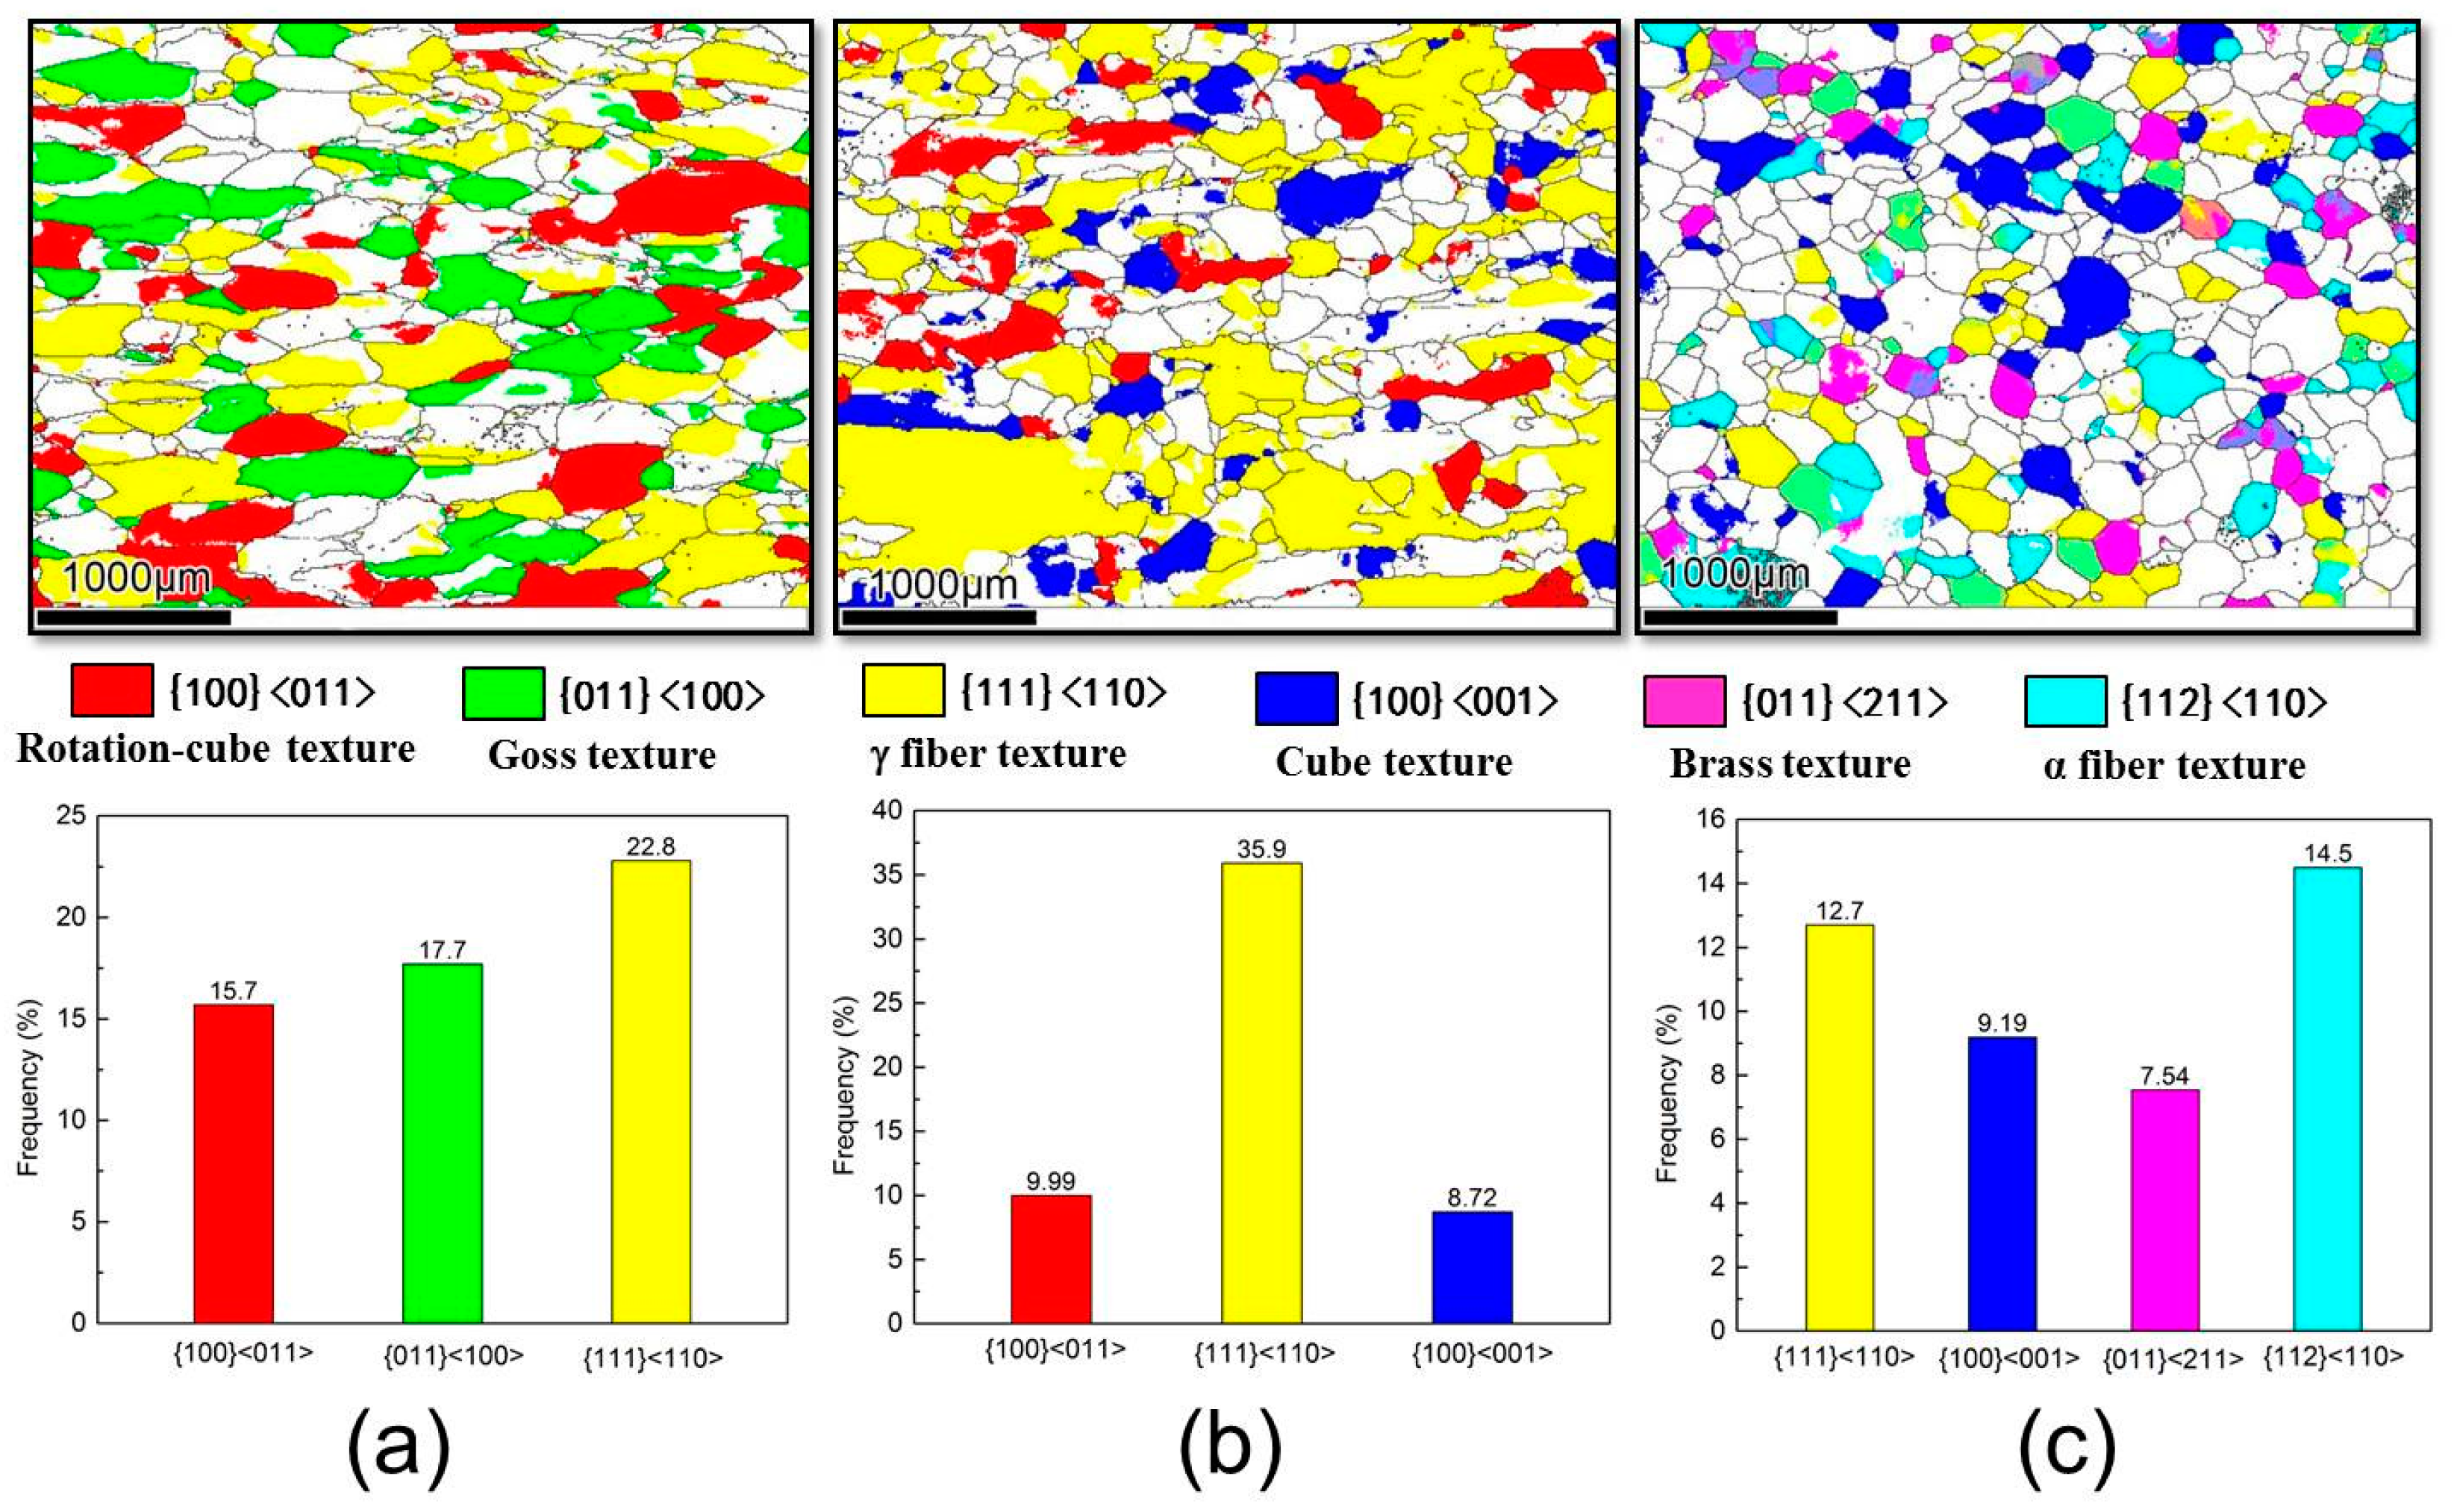
Figure 7 shows the φ2 = 0° and φ2 = 45° ODF sections of the Fe-6.5 wt. % Si alloy during hot bar rolling. Figure 8 summarizes the typical texture components, with a deviation of 15°. Combining the results shown in Figure 7a and Figure 8a, the sample exhibited the presence of the α fiber with {100}<011> component (rotation‒cube texture), the γ fiber with {111}<110> component, and the η fiber with {011}<100> component (Goss texture) after rough rolling (the fourth pass). Furthermore, the area fractions of the α-, the γ-, and the η-oriented grains were 15.7%, 22.8%, and 17.7%, respectively, as shown in Figure 8a.
After medium rolling (the eighth pass), the most striking feature was that the γ fiber was the dominant component, with a peak at {111}<110>, as shown in Figure 7b. Other textures were also observed, including the presence of the α fiber with a weak {100}<011> component, and the η fiber with a weak {100}<001> component (cube texture). The area fractions of the α-, the γ-, and the η-oriented grains were 8.7%, 35.9%, and 10.0%, respectively, as shown in Figure 8b.
Various textures were observed in the specimen after the finish rolling (the tenth pass; Figure 7c), such as the α fiber with {112}<110> component, the γ fiber with {111}<110> component, the η fiber with {100}<001> component, and a weak {011}<211> component (Brass texture). The area fractions of these textures were 14.5%, 12.7%, 9.2%, and 7.5%, respectively.
According to the cubic crystal symmetry and the nearly-orthotropic symmetry of hot bar rolling specimens, the α, the γ, and the η fibers were found to be the most relevant deformation textures in bcc metals during hot rolling [27,28]. In addition, slip was found to occur along the <111> directions within the {110} planes during deformation, and grain orientation evolved into the {100}<011> orientation. Finally, the {100}<011> orientation of the grains rotated to the {112}<110> orientation [29]. Hence, the fractions of the {100}<011> component decreased, and those of the {112}<110> component increased. The high rolling temperature and low deformation ratio resulted in full recrystallization and grain growth for the Fe-6.5 wt. % Si alloy in the finish rolling stage, which made the γ fiber content weaken slightly [29,30].
Based on the aforementioned indications, during rolling the area fractions of the {100}<011> and {011}<100> oriented grains decreased to 0%, while the area fractions of the {100}<001>, {011}<211>, and {112}<110> components all increased. Notably, the γ fiber with {111}<110> component was dominant during the hot bar rolling.
4.3. Ordered Structure Evolution
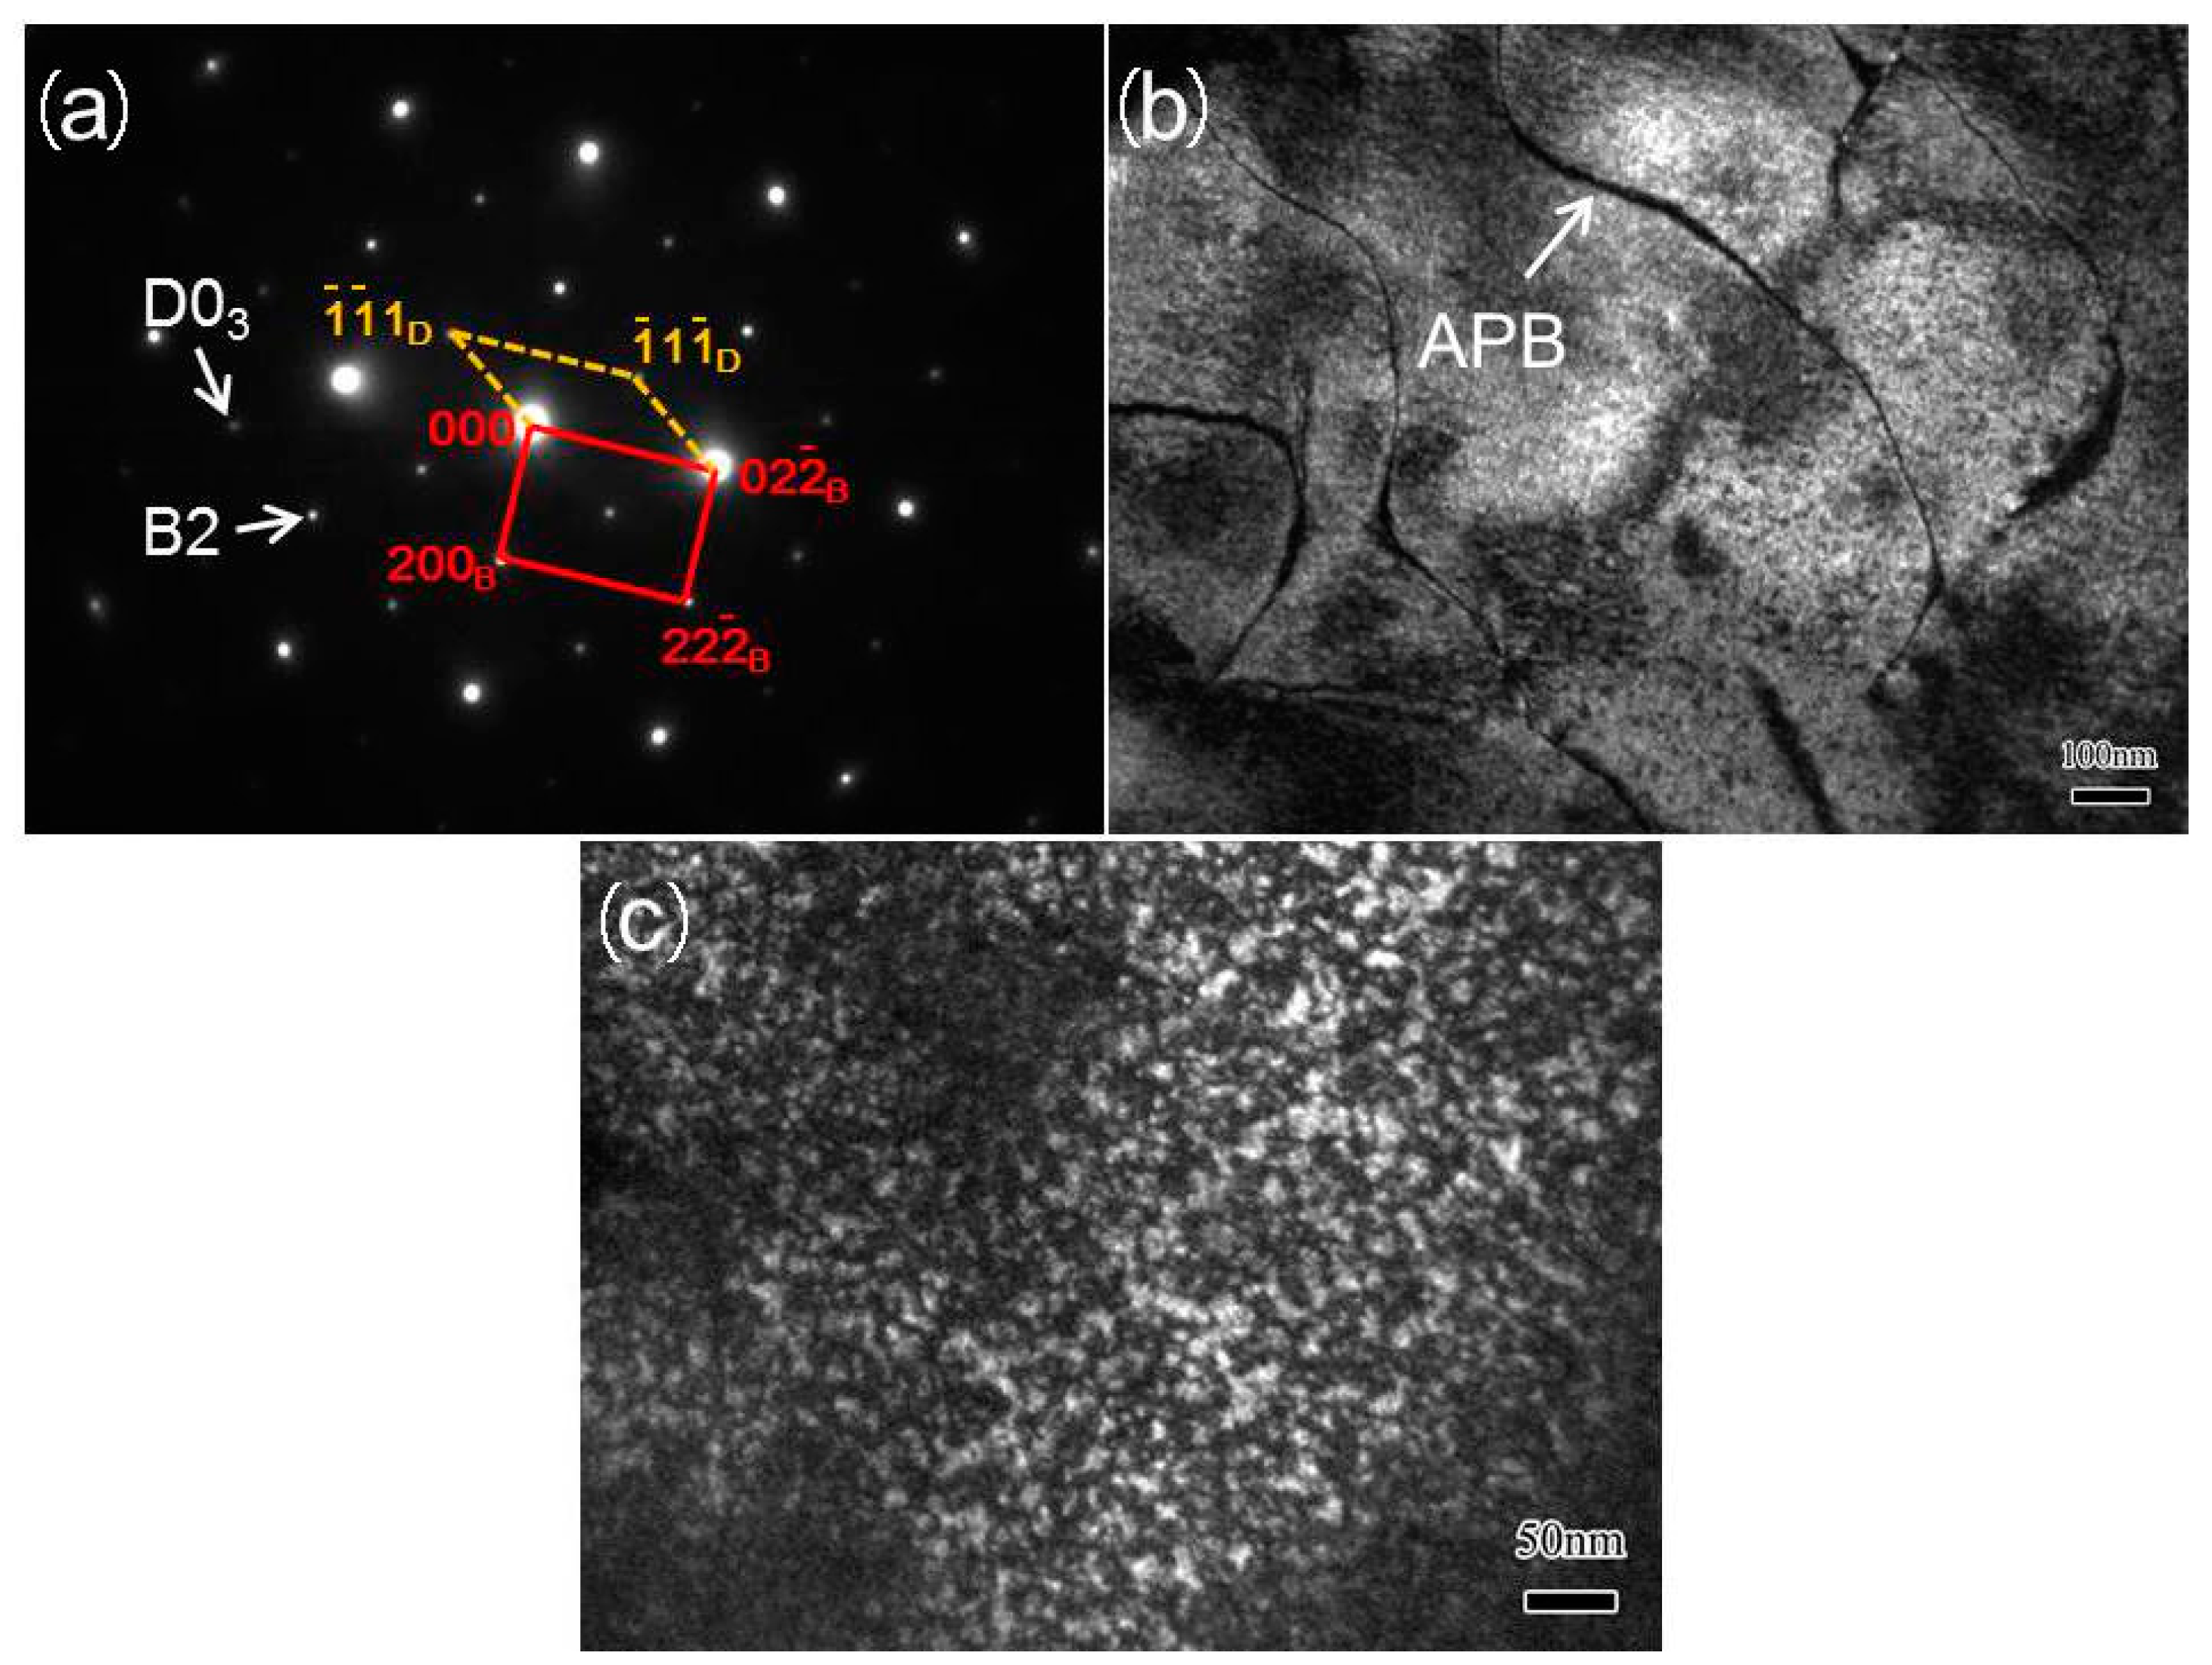
Figure 9 shows the diffraction pattern with [011] zone axes (Figure 9a), and the dark-field images of the B2 (Figure 9b) and DO3 (Figure 9c) domains in the as-forged Fe-6.5 wt. % Si alloy. The diffraction pattern indicated the presence of both B2 and DO3 ordered phases in the as-forged sample, as represented in Figure 9a. The B2 and DO3 domains were visible in the dark-field images using (200) and the (111) superlattice diffraction spots, respectively [31,32,33]. The sizes of the coarse B2 domains were 300‒500 nm, and those of the fine DO3 ordered domains were 20‒40 nm, as shown in Figure 9b,c, respectively. Furthermore, a smoothly curved a’/4 <111> anti-phase boundary (APB) was clearly observed in Figure 9b [34].
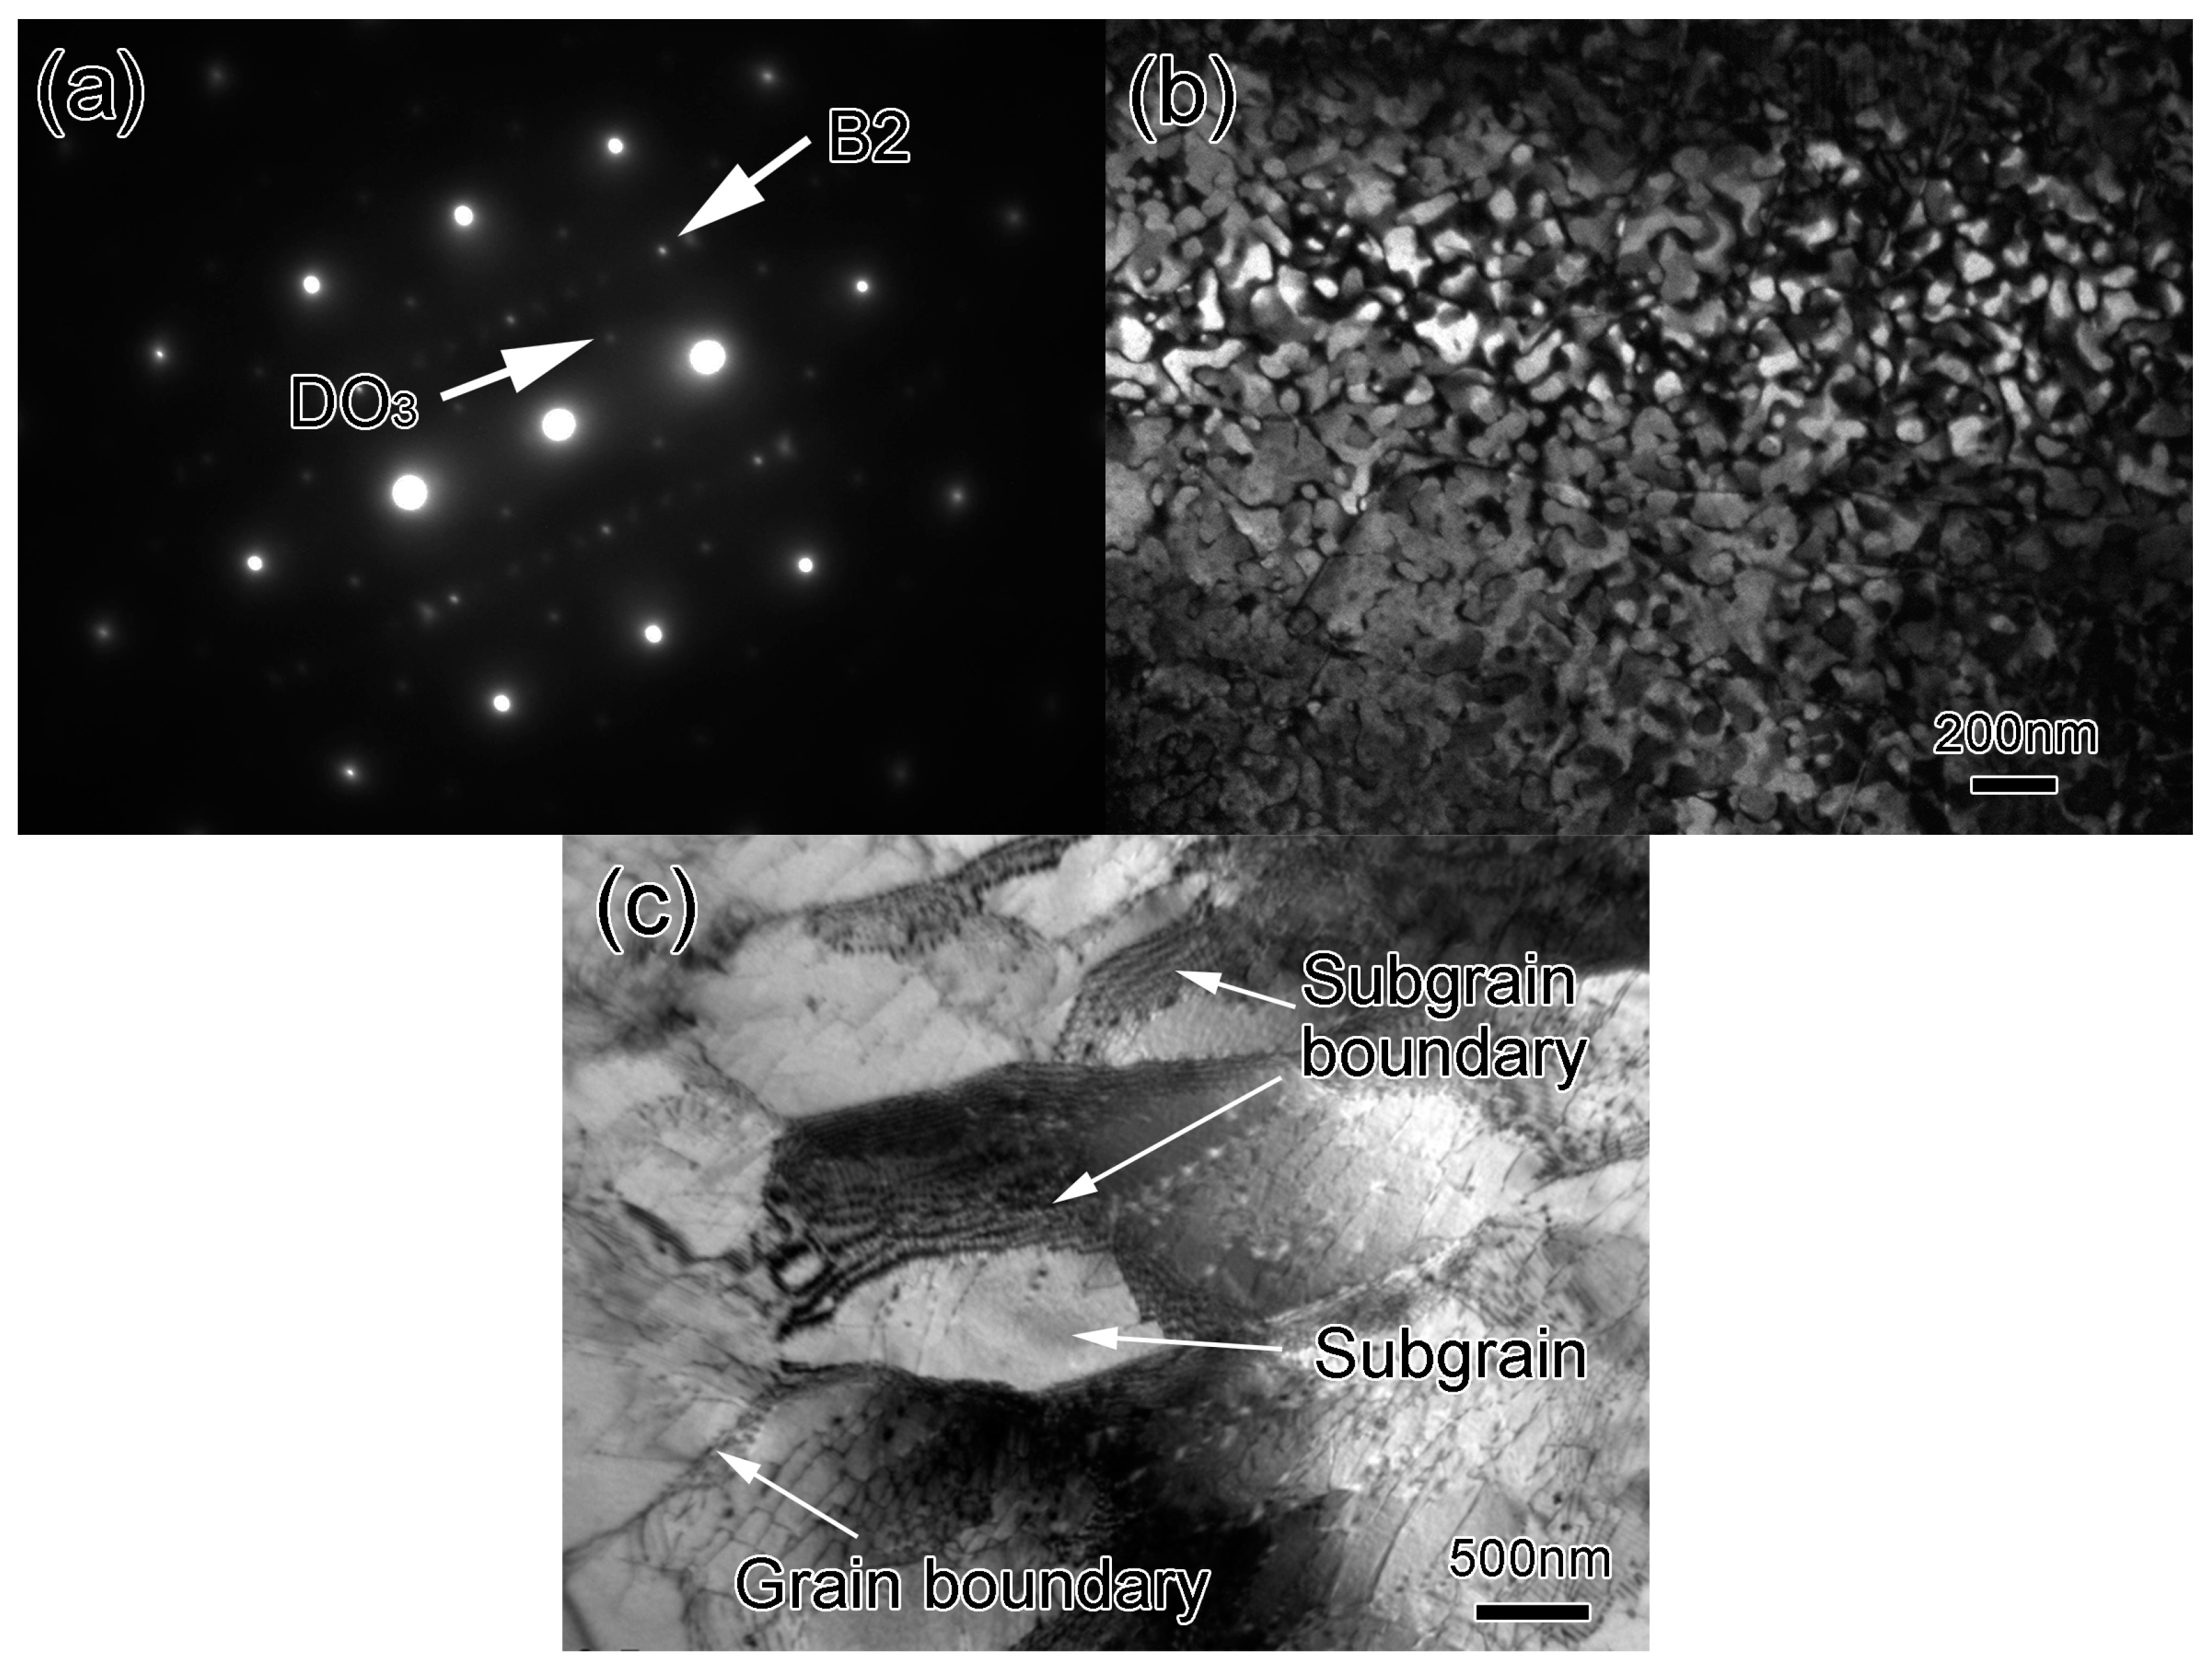
Figure 10 shows the diffraction pattern with the [011] zone axes (Figure 10a), the dark-field image for B2 domains (Figure 10b), and the bright-field image for the substructure (Figure 10c) in the bar after rough rolling. Diffraction spots could be indexed to the ordered DO3 and B2 phases, as well as the disordered A2 phase. The DO3 spots were too weak to obtain a dark-field image. The amount of the DO3 phase was reduced by rough rolling. The superlattice spots corresponding to the B2 structure seemed weak and obscure, signifying some variation in the B2 structure, as shown in Figure 10a. In the dark-field image (Figure 10b), the size of the B2 domains decreased to 100–150 nm, differing from that of the forged specimen. Dislocations and substructures were also observed, as shown in Figure 10c. Dislocation lines were visible, and subgrains appeared at the grain boundaries. Specifically, discontinuous dynamic recrystallization (DDRX) occurred during the rough rolling at a high deformation rate [35]. Ferrite recrystallization occurs through a mechanism analogous to DDRX at high strain rates, and new grains nucleate from the subgrains at the boundaries. The dynamic migration of grain boundaries is considered to be an indication of DDRX. Enough stored energy is accumulated during deformation at high strain-rates to promote the DDRX mechanism, i.e., the formation of new recrystallized grains through nucleation and growth [36].
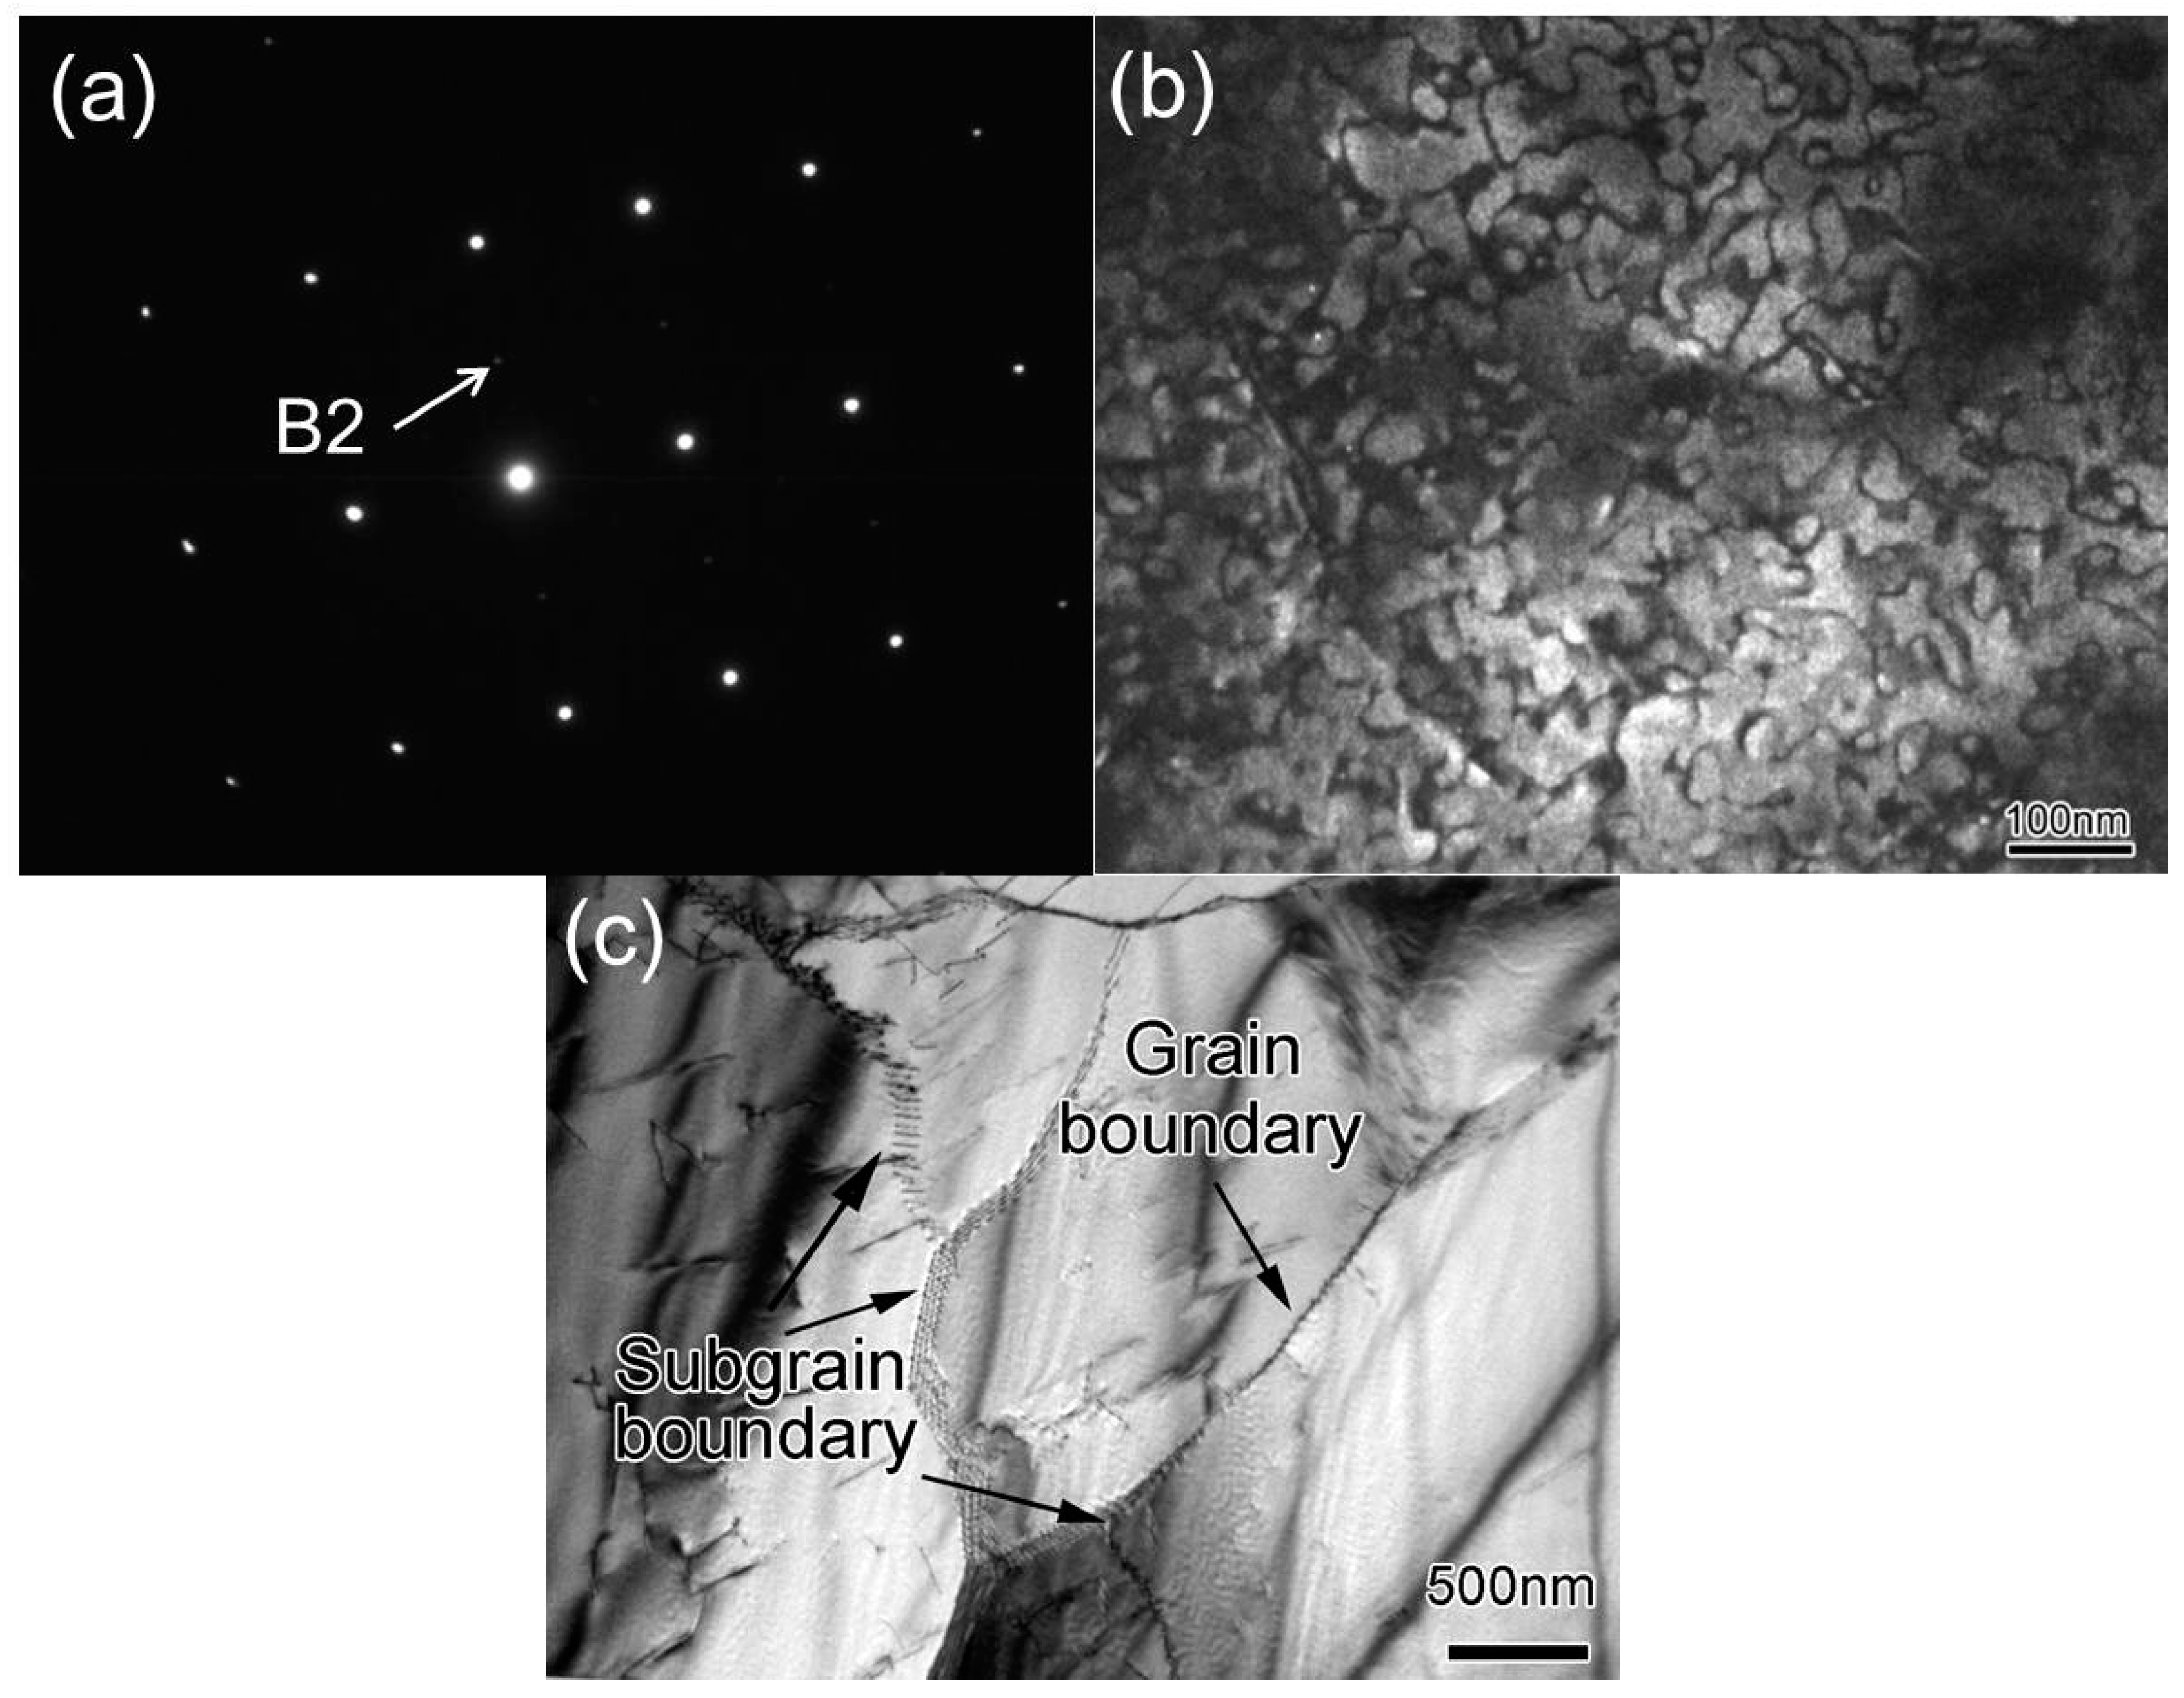
Figure 11 shows the diffraction pattern with the [011] zone axes (Figure 11a), the dark-field image for B2 domains (Figure 11b), and the bright-field image of the substructure (Figure 11c) of the bar after finish rolling. Only B2 diffraction spots were observed in the diffraction pattern. The characteristic diffraction spots of the DO3 ordered phase became so weak (as shown in Figure 11a) that a corresponding dark-field image could not be obtained. Moreover, the B2 ordered domains were refined to a size of 40‒80 nm, as represented in Figure 11b. This indicates that the degree of order decreased after the finish rolling. Subgrains were observed inside the grains (Figure 11c) during the finish rolling, at a low deformation rate. Furthermore, the subgrain boundaries partly evolved into grain boundaries. This is consistent with the mechanism of continuous dynamic recrystallization (CDRX) [35,36]. The occurrence of CDRX in the ferrite under low strain-rates is in excellent agreement with the model suggested by Gourdet and Montheillet, who claim that the low angle boundaries (LABs) created by DRV, and increasingly transformed by strain, become high angle boundaries (HABs) through the continuous absorption of dislocations during CDRX [37].
These observations demonstrate the transition from CDRX to DDRX with increasing strain rate, which agrees with the recent findings made by Haghdadi et al [36]. These authors proposed that deformation at lower strain rates provides sufficient time for significant DRV, thus leading to CDRX, whereas the magnitude of DRV is reduced under deformation at higher strain rates, instead promoting the DDRX mechanism with the formation of new recrystallized grains. However, the current work implies that DDRX in the Fe-6.5 wt. % Si alloy (considered a single-phase steel because of the low content of the B2 ordered phase) may exhibit some important differences when compared with two-phase steels. In fact, the initial HABs, which are the preferred sites for nucleation of new recrystallized grains, are always present in the Fe-6.5 wt. % Si alloy at high strain rates, but are rarely present in two-phase steels. Nonetheless, in two-phase steels, the interphase can assume this role through the formation of highly-strained regions [35]. Therefore, DDRX is probably occurs at ferrite-ferrite boundaries in single-phase steels (such as the Fe-6.5 wt. % Si alloy), but at interphase mantle regions in two-phase steels.
In conclusion, DDRX can occur at grain boundaries in the Fe-6.5 wt. % Si alloy with high stacking fault energy, through the nucleation and growth of subgrains at high deformation rates. However, CDRX appears inside the grains by continuous absorption of dislocations at low deformation rates.
4.4. Mechanical Properties
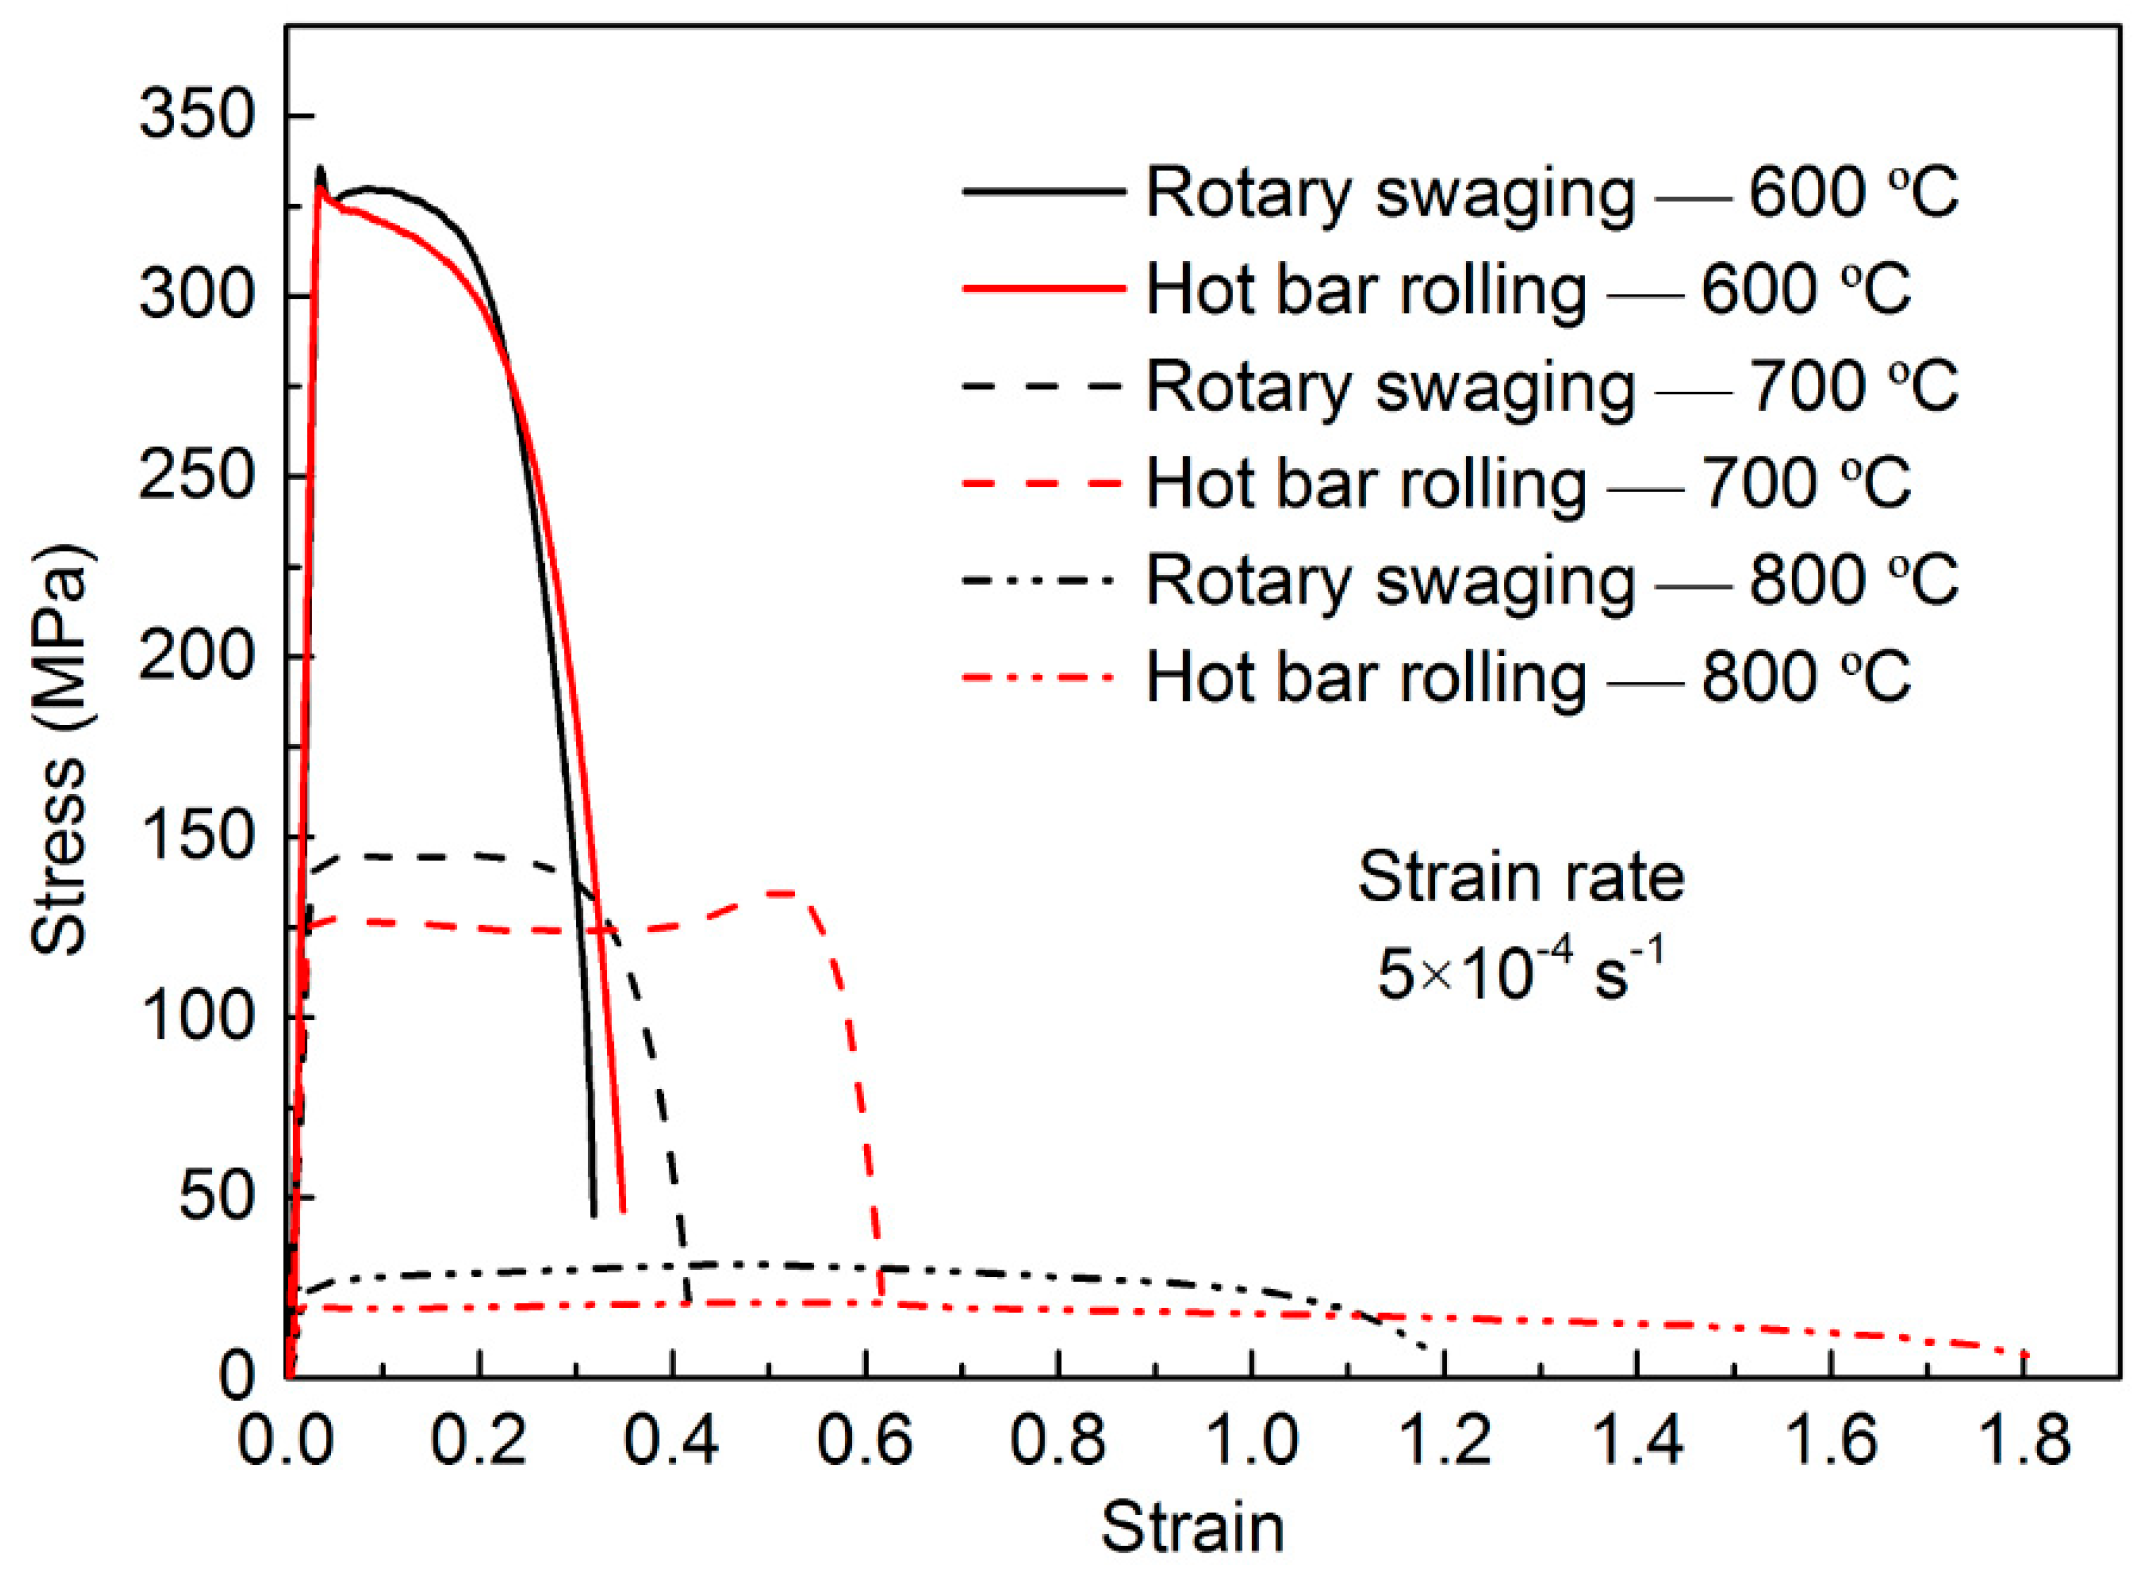
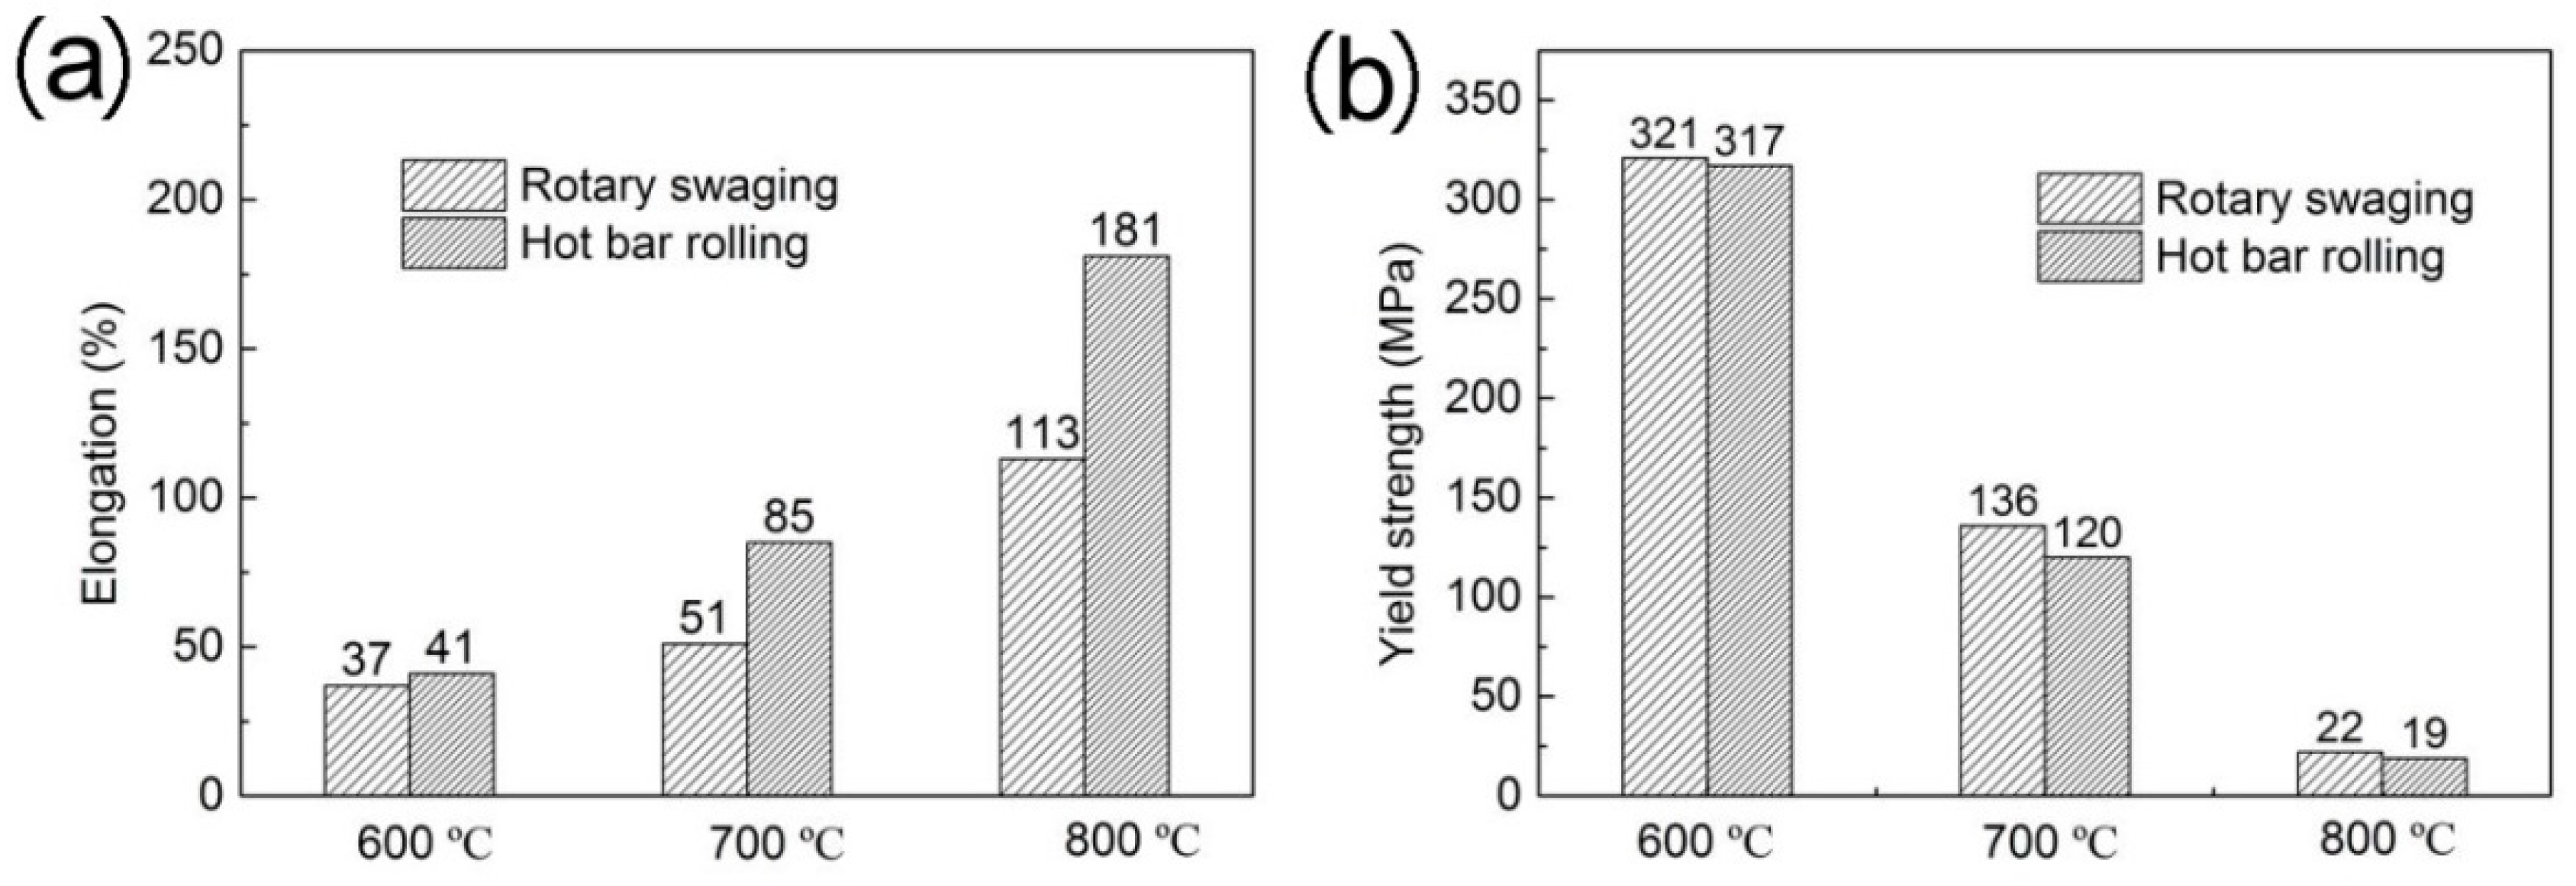
Figure 12 shows the stress–strain curves for both the rotary-swaged and hot-rolled bars of the Fe-6.5 wt. % Si alloy at a strain rate of 5 × 10⁻⁴ s−1, and at temperatures of 600 to 800 °C. The corresponding elongations and yield stresses are represented in Figure 13. The stress rarely increased with increasing strain after yielding during the tension in all stress–strain curves (Figure 12). The elongations (~40%) and yield stresses (~320 MPa) of the rotary-swaged and hot-rolled bars were similar at 600 °C.
At 700 °C, the stress remained constant (at 140 MPa for the rotary-swaged bar, and 125 MPa for the hot-rolled bar) after the yield point (which occurred at 136 MPa for the rotary-swaged bar and 120 MPa for the hot-rolled bar). Similarly, at 800 °C, the stress of the rotary-swaged specimen was maintained at around 30 MPa, and the stress of the hot-rolled specimen was constant at around 21 MPa (Figure 12). These observations indicate that the dynamic softening offset the work hardening, and consequently, that the stress remained stable during tension at 700 and 800 °C. Generally, as the deformation progressed, dislocation proliferation took place, leading to an increase in dislocation density, and resulting in the work hardening. However, due to the high temperature during the deformation, the dislocations cross slip and climb easily in high stacking fault energy materials, such as the Fe-6.5 wt. % Si alloy. This can reduce the dislocation density, causing dynamic recovery to occur. All of these factors led to the dynamic softening offsetting the work hardening [38]. Hence, the stresses remained stable during tension at 700–800 °C.
The yield stresses of the rotary-swaged and hot-rolled bars were similar, with values of around 130 MPa (at 700 °C) and 20 MPa (at 800 °C), respectively. However, the elongations of the rotary-swaged specimens were lower than those of the hot-rolled specimens at 700 and 800 °C, as shown in Figure 13a. Yang et al. [39] fabricated non-oriented Fe-6.5 wt. % Si bars by hot rotary swaging, and the size of the coarse grain reached 800 μm. In this study, both the coarse B2 ordered phase (500–1000 nm) and DO3 ordered phase (40–80 nm) were observed in the sample. Importantly, the DO3 ordered phase and the coarse grains caused a reduction in the ductility [40]. Although most of the grains in the as-rolled bars were of no specific orientation, fine grains were obtained, especially as the DO3 ordered phase was suppressed. All of these factors resulted in higher ductility in the hot-rolled specimen than the rotary swaged specimen. Thus, hot bar rolling is suggested to be a better method for fabrication of Fe-6.5 wt. % Si bars than rotary swaging.
Based on the design of the hot bar rolling technology and on the analysis of microstructures, textures, ordered structures, and mechanical properties, Fe-6.5 wt. % Si bars with fine equiaxed grains were successfully fabricated. With the absence of the DO3 ordered phase and fine grains in the as-rolled sample, a higher ductility can be obtained through hot bar rolling than through rotary swaging. Thus, hot bar rolling is a better method for fabricating Fe-6.5 wt. % Si bars, and improves processing efficiency of Fe-6.5 wt. % Si wires.
5. Conclusions
Hot bar rolling parameters for the Fe-6.5 wt. % Si alloy were optimized. The evolution of the microstructure, texture, and ordered structure were investigated, and the mechanical properties of the Fe-6.5 wt. % Si bars were studied. The following conclusions can be drawn:
(1) Φ7.5 mm Fe-6.5 wt. % Si bars with fine equiaxed grains were successfully fabricated through three rolling stages: rough rolling (hexagon-square-oval-square) at 850–900 °C; medium rolling (oval-square-oval-round) at 800–850 °C; finish rolling (oval-square-oval-round) at 800–850 °C.
(2) During the hot bar rolling, the area fractions of the {100}<011> and {011}<100> oriented grains decreased to 0, while the {100}<001>, {011}<211>, and {112}<110> components increased. Notably, the γ fiber with {111}<110> component were dominant.
(3) After hot bar rolling, the DO3 ordered phase was suppressed and the B2 ordered domains were refined, leading to a decrease in ordering degree. Moreover, DDRX occurred at a high deformation rate during rough rolling, and CDRX appeared at a low strain-rate during the finish rolling. Higher ductility was obtained for the hot rolled bar, as compared to the rotary swaged bar. Hot bar rolling technology is thus an excellent process for the fabrication of Fe-6.5 wt. % Si bars.
Author Contributions
S.W. conceived, designed, performed the experiments, and wrote the manuscript; S.X., C.H. and B.L. contributed to some experiments such as the EBSD and the hot bar rolling; Y.L. and F.Y. supervised the work.
Acknowledgments
Financial support from both the Natural Science Foundation of China (51471031, U1660115) and the State Key Laboratory for Advanced Metals and Materials (2016Z-17) are gratefully acknowledged.
Conflicts of Interest
The authors declare no conflict of interest.
References
- Arai, K.; Tsuya, N. Ribbon-form silicon-iron alloy containing around 6.5 percent silicon. IEEE. Trans. Magn. 1980, 16, 126–129. [Google Scholar] [CrossRef]
- Narita, K.; Teshima, N.; Mori, Y.; Enokizono, M. Recent researches on high silicon-iron alloys. IEEE. Trans. Magn. 1981, 17, 2857–2862. [Google Scholar] [CrossRef]
- Raviprasad, K.; Tenwick, M.; Davies, H.A.; Chattopadhyay, K. The nature of ordered structures in melt spun iron-silicon alloys. Scr. Metall. 1986, 20, 1265–1270. [Google Scholar] [CrossRef]
- Raviprasad, K.; Chattopadhyay, K. The influence of critical points and structure and microstructural evolution in iron rich Fe-Si alloys. Acta Metall. 1993, 41, 609–624. [Google Scholar] [CrossRef]
- Takada, Y.; Abe, M.; Masuda, S.; Inagaki, J. Commercial scale production of Fe-6.5 wt. % Si sheet and its magnetic properties. J. Appl. Phys. 1988, 64, 5367–5369. [Google Scholar] [CrossRef]
- Ros-Yanez, T.; Houbaert, Y.; Gómez Rodrı́guez, V. High-silicon steel produced by hot dipping and diffusion annealing. J. Appl. Phys. 2002, 91, 7857–7859. [Google Scholar] [CrossRef]
- He, X.D.; Li, X.; Sun, Y. Microstructure and magnetic properties of high silicon electrical steel produced by electron beam physical vapor deposition. J. Magn. Magn. Mater. 2008, 320, 217–221. [Google Scholar] [CrossRef]
- Machado, R.; Kasama, A.H.; Jorge, A.M.; Kiminami, C.S.; Fo, W.B.; Bolfarini, C. Evolution of the texture of spray-formed Fe-6.5 wt. % Si-1.0 wt. % Al alloy during warm-rolling. Mater. Sci. Eng. A 2007, 449–451, 854–857. [Google Scholar] [CrossRef]
- Lima, C.C.; Da Silva, M.C.A.; Sobral, M.D.C.; Coelho, R.E.; Bolfarini, C. Effects of order–disorder reactions on rapidly quenched Fe-6.5% Si alloy. J. Alloys Compd. 2014, 586, S314–S316. [Google Scholar] [CrossRef]
- Fish, G.E.; Chang, C.F.; Bye, R. Frequency dependence of core loss in rapidly quenched Fe-6.5 wt. % Si. J. Appl. Phys. 1988, 64, 5370–5372. [Google Scholar] [CrossRef]
- Liang, Y.F.; Wang, S.; Li, H.; Jiang, Y.M.; Ye, F. Fabrication of Fe-6.5 wt. % Si ribbons by melt spinning method on large scale. Adv. Mater. Sci. Eng. 2015, 2015, 1–5. [Google Scholar] [CrossRef]
- Wang, S.; Jiang, Y.M.; Liang, Y.F.; Ye, F.; Lin, J.P. Magnetic properties and core loss behavior of Fe-6.5 wt. % Si ribbons prepared by melt spinning. Adv. Mater. Sci. Eng. 2015, 2015, 1–6. [Google Scholar] [CrossRef]
- Li, R.; Shen, Q.; Zhang, L.; Zhang, T. Magnetic properties of high silicon iron sheet fabricated by direct powder rolling. J. Magn. Magn. Mater. 2004, 281, 135–139. [Google Scholar] [CrossRef]
- Liang, Y.F.; Ye, F.; Lin, J.P.; Wang, Y.L.; Chen, G.L. Effect of annealing temperature on magnetic properties of cold rolled high silicon steel thin sheet. J. Alloys Compd. 2010, 491, 268–270. [Google Scholar] [CrossRef]
- Patterson, E.E.; Field, D.P.; Zhang, Y. Characterization of twin boundaries in an Fe-17.5Mn-0.56C twinning induced plasticity steel. Mater. Charact. 2013, 85, 100–110. [Google Scholar] [CrossRef]
- Liang, Y.F.; Ye, F.; Lin, J.P.; Wang, Y.L.; Zhang, L.Q.; Chen, G.L. Effect of heat treatment on mechanical properties of heavily cold-rolled Fe-6.5 wt. % Si alloy sheet. Sci. China Technol. Sci. 2010, 53, 1008–1011. [Google Scholar] [CrossRef]
- Di Giulio, M. Transformer with Magnetic Core of Coiled Wires. International Patent Application No. WO 00/44006, 21 January 2000. [Google Scholar]
- Yang, W.; Li, H.; Yang, K.; Liang, Y.F.; Yang, J.; Ye, F. Hot drawn Fe-6.5 wt. %Si wires with good ductility. Mater. Sci. Eng. B 2014, 186, 79–82. [Google Scholar] [CrossRef]
- Lee, Y. Rod and Bar Rolling: Theory and Applications; CRC Press: Austin, TX, USA, 2004; ISBN 9780824756499. [Google Scholar]
- Liang, Y.F.; Lin, J.P.; Ye, F.; Li, Y.J.; Wang, Y.L.; Chen, G.L. Microstructure and mechanical properties of rapidly quenched Fe-6.5 wt. % Si alloy. J. Alloys Compd. 2010, 504, S476–S479. [Google Scholar] [CrossRef]
- Cheng, Z.Y.; Liu, J.; Zhu, J.C.; Xiang, Z.D.; Jia, J.; Bi, Y.J. Microstructure, texture evolution and magnetic properties of Fe-6.5 wt. %Si and Fe-6.5 wt. %Si-0.5 wt. %Cu alloys during rolling and annealing treatment. Metals 2018, 8, 144. [Google Scholar] [CrossRef]
- Said, A.; Lenard, J.G.; Ragab, A.R.; Elkhier, M.A. The temperature, roll force and roll torque during hot bar rolling. J. Mater. Process. Technol. 1999, 88, 147–153. [Google Scholar] [CrossRef]
- Kwon, H.C.; Im, Y.T. Interactive computer-aided-design system for roll pass and profile design in bar rolling. J. Mater. Process. Technol. 2002, 123, 399–405. [Google Scholar] [CrossRef]
- Song, R.B. The Technology of Rolling; Metallurgical Industry Press: Beijing, China, 2014; ISBN 978-7-5024-6506-3. [Google Scholar]
- Wen, S.B.; Han, C.Y.; Zhang, B.; Liang, Y.F.; Ye, F.; Lin, J.P. Flow behavior characteristics and processing map of Fe-6.5 wt. %Si alloys during hot compression. Metals 2018, 8, 186. [Google Scholar] [CrossRef]
- Zhang, H.; Li, H.; Yang, K.; Liang, Y.F.; Ye, F. Optimization of heat treatment process of Fe-6.5% Si sheet. Acta Metall. Sin. 2013, 49, 1445–1451. [Google Scholar] [CrossRef]
- Hölscher, M.; Raabe, D.; Lücke, K. Relationship between rolling textures and shear textures in fcc and bcc metals. Acta. Mater. 1994, 42, 879–886. [Google Scholar] [CrossRef]
- Dillamore, I.L.; Roberts, W.T. Rolling textures in fcc and bcc metals. Acta. Mater. 1964, 12, 281–293. [Google Scholar] [CrossRef]
- Dong, N.L. The evolution of recrystallization textures from deformation textures. Scr. Metall. Mater. 1994, 32, 1689–1694. [Google Scholar] [CrossRef]
- Li, K.; Yang, P. The formation of strong {100} texture by dynamic strain-induced boundary migration in hot compressed Ti-5Al-5Mo-5V-1Cr-1Fe alloy. Metals 2017, 7, 412. [Google Scholar] [CrossRef]
- Marcinkowski, M.J.; Brown, N. Direct observation of antiphase boundaries in the Fe3Al superlattice. J. Appl. Phys. 1962, 33, 537–552. [Google Scholar] [CrossRef]
- Yu, J.H.; Shin, J.S.; Bae, J.S.; Lee, Z.H.; Lee, T.D. The effect of heat treatments and Si contents on B2 ordering reaction in high-silicon steels. Mater. Sci. Eng. A 2001, 307, 29–34. [Google Scholar] [CrossRef]
- Jung, H.; Kim, J. Influence of cooling rate on iron loss behavior in 6.5 wt % grain-oriented silicon steel. J. Magn. Magn. Mater. 2014, 353, 76–81. [Google Scholar] [CrossRef]
- Li, H.; Liang, Y.F.; Yang, W.; Ye, F.; Lin, J.P.; Xie, J.X. Disordering induced work softening of Fe-6.5 wt. % Si alloy during warm deformation. Mater. Sci. Eng. A 2015, 628, 262–268. [Google Scholar] [CrossRef]
- Haghdadi, N.; Zarei-Hanzaki, A.; Farabi, E.; Cizek, P.; Beladi, H.; Hodgson, P.D. Strain rate dependence of ferrite dynamic restoration mechanism in a duplex low-density steel. Mater. Des. 2017, 132, 360–366. [Google Scholar] [CrossRef]
- Haghdadi, N.; Cizek, P.; Beladi, H.; Hodgson, P.D. A novel high-strain-rate ferrite dynamic softening mechanism facilitated by the interphase in the austenite/ferrite microstructure. Acta Mater. 2017, 126, 44–57. [Google Scholar] [CrossRef]
- Gourdet, S.; Montheillet, F. A model of continuous dynamic recrystallization. Acta Mater. 2003, 51, 2685–2699. [Google Scholar] [CrossRef]
- Callister, W.D., Jr.; Rethwisch, D.G. Fundamentals of Materials Science and Engineering: An Integrated Approach; John Wiley and Sons: Hoboken, NJ, USA, 2012; ISBN 0-471-39551-X. [Google Scholar]
- Yang, W. Fabrication and Properties of Wires of Fe-6.5% Si Electrical Steel. Master’s Thesis, University of Science and Technology, Beijing, China, 2013. [Google Scholar]
- Li, H.; Liang, Y.F.; Ye, F. Effect of heat treatment on ordered structures and mechanical properties of Fe-6.5 mass% Si alloy. Mater. Trans. 2015, 56, 759–765. [Google Scholar] [CrossRef]
Figure 1.
Process flow chart for production of various shapes of the Fe-6.5 wt. % Si alloy.

Figure 2.
Process flow chart for hot bar rolling of the Fe-6.5 wt. % Si alloy.

Figure 3.
Microstructures of the as-forged Fe-6.5 wt. % Si alloy along (a) the radial direction (RD) and (b) axial direction (AD).
Figure 3.
Microstructures of the as-forged Fe-6.5 wt. % Si alloy along (a) the radial direction (RD) and (b) axial direction (AD).

Figure 4.
Microstructure evolution of the Fe-6.5 wt. % Si alloy along the radial direction (RD) during various rolling passes: (a) the fourth pass; (b) the sixth pass; (c) the eighth pass; (d) the tenth pass.
Figure 4.
Microstructure evolution of the Fe-6.5 wt. % Si alloy along the radial direction (RD) during various rolling passes: (a) the fourth pass; (b) the sixth pass; (c) the eighth pass; (d) the tenth pass.

Figure 5.
Microstructure evolution of the Fe-6.5 wt. % Si alloy along the axial direction (AD) during various rolling passes: (a) the fourth pass; (b) the sixth pass; (c) the eighth pass; (d) the tenth pass.
Figure 5.
Microstructure evolution of the Fe-6.5 wt. % Si alloy along the axial direction (AD) during various rolling passes: (a) the fourth pass; (b) the sixth pass; (c) the eighth pass; (d) the tenth pass.

Figure 6.
Variations in (a) grain size and (b) micro-hardness of the Fe-6.5 wt. % Si alloy during hot bar rolling.
Figure 6.
Variations in (a) grain size and (b) micro-hardness of the Fe-6.5 wt. % Si alloy during hot bar rolling.

Figure 7.
φ2 = 0° and φ2 = 45° ODF sections of the Fe-6.5 wt. % Si alloy during hot bar rolling: (a) rough rolling; (b) medium rolling; (c) finish rolling.
Figure 7.
φ2 = 0° and φ2 = 45° ODF sections of the Fe-6.5 wt. % Si alloy during hot bar rolling: (a) rough rolling; (b) medium rolling; (c) finish rolling.

Figure 8.
Texture components of the Fe-6.5 wt. % Si alloy with a deviation of 15° during hot bar rolling: (a) rough rolling; (b) medium rolling; (c) finish rolling.
Figure 8.
Texture components of the Fe-6.5 wt. % Si alloy with a deviation of 15° during hot bar rolling: (a) rough rolling; (b) medium rolling; (c) finish rolling.

Figure 9.
TEM micrographs of the as forged Fe-6.5 wt. % Si alloy: (a) diffraction pattern with the [011] zone axes; (b) dark-field image for B2 domains using the (200) diffraction spot; (c) dark-field image for DO3 domains using the (111) diffraction spot.
Figure 9.
TEM micrographs of the as forged Fe-6.5 wt. % Si alloy: (a) diffraction pattern with the [011] zone axes; (b) dark-field image for B2 domains using the (200) diffraction spot; (c) dark-field image for DO3 domains using the (111) diffraction spot.

Figure 10.
TEM micrograph of the Fe-6.5 wt. % Si alloy after finish rolling: (a) diffraction pattern with the [011] zone axes; (b) dark-field image for B2 domains using the (200) diffraction spot; (c) bright-field image of the substructure.
Figure 10.
TEM micrograph of the Fe-6.5 wt. % Si alloy after finish rolling: (a) diffraction pattern with the [011] zone axes; (b) dark-field image for B2 domains using the (200) diffraction spot; (c) bright-field image of the substructure.

Figure 11.
TEM micrograph of the Fe-6.5 wt. % Si alloy after finish rolling: (a) diffraction pattern with the [011] zone axes; (b) dark-field image for B2 domains using the (200) diffraction spot; (c) bright-field image of the substructure.
Figure 11.
TEM micrograph of the Fe-6.5 wt. % Si alloy after finish rolling: (a) diffraction pattern with the [011] zone axes; (b) dark-field image for B2 domains using the (200) diffraction spot; (c) bright-field image of the substructure.

Figure 12.
Stress–strain curves for rotary-swaged and hot-rolled bars of the Fe-6.5 wt. % Si alloy at various tensile temperatures.
Figure 12.
Stress–strain curves for rotary-swaged and hot-rolled bars of the Fe-6.5 wt. % Si alloy at various tensile temperatures.

Figure 13.
(a) Elongation and (b) yield stress values for both the rotary-swaged and hot-rolled bars of the Fe-6.5 wt. % Si alloy at various tensile temperatures.
Figure 13.
(a) Elongation and (b) yield stress values for both the rotary-swaged and hot-rolled bars of the Fe-6.5 wt. % Si alloy at various tensile temperatures.


Table 1.
Chemical composition of Fe-6.5 wt. % Si alloy (wt. %).
| C | Si | Mn | S | P | Ti | B | Fe |
|---|---|---|---|---|---|---|---|
| 0.009 | 6.510 | 0.015 | 0.0009 | 0.054 | 0.005 | 0.0004 | Bal |
Table 2.
Roll pass, groove system, and deformation ratio for the hot bar rolling.
| Rolling Stage | Pass | Groove | Area (mm2) | Elongation Coefficient | Deformation Ratio |
|---|---|---|---|---|---|
| ‒ | 0 | Square | S0 = 576.0 | ‒ | ‒ |
| Rough rolling | 1 | Hexagon | S1 = 409.5 | μ1 = S0/S1 = 1.41 | L0/L1 = 41% |
| 2 | Square | S2 = 269.0 | μ2 = S1/S2 = 1.52 | L1/L3 = 52% | |
| 3 | Flat oval | S3 = 182.8 | μ3 = S2/S3 = 1.47 | L2/L3 = 47% | |
| 4 | Square | S4 = 136.9 | μ4 = S3/S4 = 1.33 | L3/L4 = 33% | |
| Medium rolling | 5 | Flat oval | S5 = 102.6 | μ5 = S4/S5 = 1.33 | L4/L5 = 33% |
| 6 | Square | S6 = 81 | μ6 = S5/S6 = 1.27 | L5/L6 = 27% | |
| 7 | Flat oval | S7 = 64.5 | μ7 = S6/S7 = 1.26 | L6/L7 = 26% | |
| 8 | Round | S8 = 56.7 | μ8 = S7/S8 = 1.14 | L7/L8 = 14% | |
| Finish rolling | 9 | Flat oval | S9 = 49.1 | μ9 = S8/S9 = 1.15 | L8/L9 = 15% |
| 10 | Round | S10 = 44.2 | μ10 = S9/S10 = 1.11 | L9/L10 = 11% |
© 2018 by the authors. Licensee MDPI, Basel, Switzerland. This article is an open access article distributed under the terms and conditions of the Creative Commons Attribution (CC BY) license (http://creativecommons.org/licenses/by/4.0/).
Share and Cite
MDPI and ACS Style
Wen, S.; Xue, S.; Han, C.; Liu, B.; Liang, Y.; Ye, F. Fabrication Technology and Material Characterization of Hot Rolled Cylindrical Fe-6.5 wt. % Si Bars. Metals 2018, 8, 371. https://doi.org/10.3390/met8050371
AMA Style
Wen S, Xue S, Han C, Liu B, Liang Y, Ye F. Fabrication Technology and Material Characterization of Hot Rolled Cylindrical Fe-6.5 wt. % Si Bars. Metals. 2018; 8(5):371. https://doi.org/10.3390/met8050371
Chicago/Turabian StyleWen, Shibo, Shaowei Xue, Chaoyu Han, Binbin Liu, Yongfeng Liang, and Feng Ye. 2018. "Fabrication Technology and Material Characterization of Hot Rolled Cylindrical Fe-6.5 wt. % Si Bars" Metals 8, no. 5: 371. https://doi.org/10.3390/met8050371
Note that from the first issue of 2016, this journal uses article numbers instead of page numbers. See further details here.