Article

Phosphorus-Containing Mineral Evolution and Thermodynamics of Phosphorus Vaporization during Carbothermal Reduction of High-Phosphorus Iron Ore

State Key Laboratory of Advanced Metallurgy, University of Science and Technology Beijing, Beijing 100083, China
*
Author to whom correspondence should be addressed.
Metals 2018, 8(6), 451; https://doi.org/10.3390/met8060451
Submission received: 29 May 2018 / Revised: 11 June 2018 / Accepted: 11 June 2018 / Published: 13 June 2018
(This article belongs to the Special Issue Ironmaking and Steelmaking)

Abstract

:
High-phosphorus iron ore is not used because of its high phosphorus content. Phosphorus is mainly present in fluorapatite. In this work, the phosphorus vaporization that occurs during the carbothermal reduction of fluorapatite was investigated. The thermodynamic principle of vaporization, which removes phosphorus during carbothermal reduction, was elucidated, and the mineral evolution of high-phosphorus iron ore was summarized. The results demonstrate that it was difficult to reduce fluorapatite when only carbon was added. When Al2O3, SiO2, and Fe2O3 were added, the dephosphorization of fluorapatite was stimulated, and the dephosphorization temperature decreased. A phosphorus-containing gas was generated during this process. SiO2 had the strongest effect on the dephosphorization of fluorapatite. The carbothermal reduction rate of fluorapatite accelerated when SiO2, Al2O3, and Fe2O3 were concurrently added. These oxides were advantageous for vaporization dephosphorization. The gas-phase volatiles were detected through gas-phase mass spectrometry. The volatiles were primarily P2 or PO. The temperature range of 1000–1100 °C was the optimum for vaporization dephosphorization. This article provides a theoretical and experimental basis for the development and utilization of high-phosphorus iron ore through vaporization dephosphorization.

1. Introduction

High-phosphorus oolitic hematite constitutes an important iron ore resource and is commonly found in central and northern Western Europe [1], Ukraine, and Canada. The high-phosphorus iron ore processing characteristics are based on the following: (1) The distribution of hematite and fluorapatite is embedded and finely grained. Both minerals are surrounded by layers that form a ring. This leads to difficulty during sorting and grinding. (2) The phosphorus-containing mineral and hematite interface are closely related. Harmful minerals of P could easily enter the iron, leading to difficult dephosphorization. (3) Oolite is a sedimentary iron deposit of low hardness and that contains many clay minerals. During the fine grinding, the oolite produces higher iron-bearing slime and increases the sorting difficulty. The development of smelting technology that is suitable for high-phosphorus iron ore is required in order to guarantee the supply of iron ore resources in China.
Rotary hearth coal-based direct reduction has potential for the efficient utilization of high-phosphorus iron ore [2]. At present, many studies exist regarding the direct reduction of high-phosphorus iron ore [3,4,5,6,7]. The key to the direct reduction of high-phosphorus ore is to increase the metallization rate while inhibiting phosphorus from entering the iron. Only the carbothermal reduction mechanism of iron oxides and fluorapatite in high-phosphorus iron ore can be determined. Consequently, the causes of the metallization degree increase during the iron and phosphorus content reduction in the iron for high-phosphorus ore can be achieved. Much research exists on the reduction mechanism of iron oxides. Adversely, as a result of the difficulty in the preparation of fluorapatite and incomplete thermodynamic data, only little research exists on the carbothermal mechanisms of fluorapatite [8,9,10,11,12,13,14,15,16]. The mechanism of fluorapatite reduction is not yet clear.
The mineral evolution of high-phosphorus iron ore and the migration of phosphorus have been studied during carbothermal reduction [17,18]. It was found that approximately 15–30% of phosphorus was volatilized as a gas during the carbothermal reduction, but the phosphorus gasification was never studied. In order to understand the phosphorus vaporization and to improve the thermodynamic data on fluorapatite, the thermodynamics of fluorapatite during carbothermal reduction are discussed here in detail. The effects of the main gangue phases (SiO2, Al2O3, and Fe2O3) on the gasification of phosphorus were analyzed. The phosphorus gasification was detected through quadrupole mass spectrometry. The purpose of this study was to provide a theoretical basis for the dephosphorization of high-phosphorus iron ore through vaporization, as well as to provide new insights for the utilization of high-phosphorus iron ore.

2. Experiments

2.1. Experimental Materials

The migration of phosphorus in high-phosphorus iron ore was studied in the authors’ laboratory. It was discovered that approximately 15–30% of the phosphorus was volatilized as a gas [19]. The purpose of this study was to define the phosphorus gasification and to determine the thermodynamic principles of fluorapatite dephosphorization through vaporization during the carbothermal reduction of high-phosphorous iron ore. The chemical composition of high-phosphorus iron ore is presented in Table 1. The mass fraction of materials constituting below 1% (CaO and MgO) was ignored in order to reduce the influencing factors. The mechanism of phosphorus vaporization during the carbothermal reduction of fluorapatite was studied through thermodynamic calculations and experiments. Therefore, the experimental raw-material ratio scheme was based on the molar ratio of the reactants in the reaction equation. The experimental materials were as follows: analytically pure Fe2O3, SiO2, and Al2O3, as well as custom-made high-purity fluorapatite. The raw-material ratio scheme is presented in Table 2.

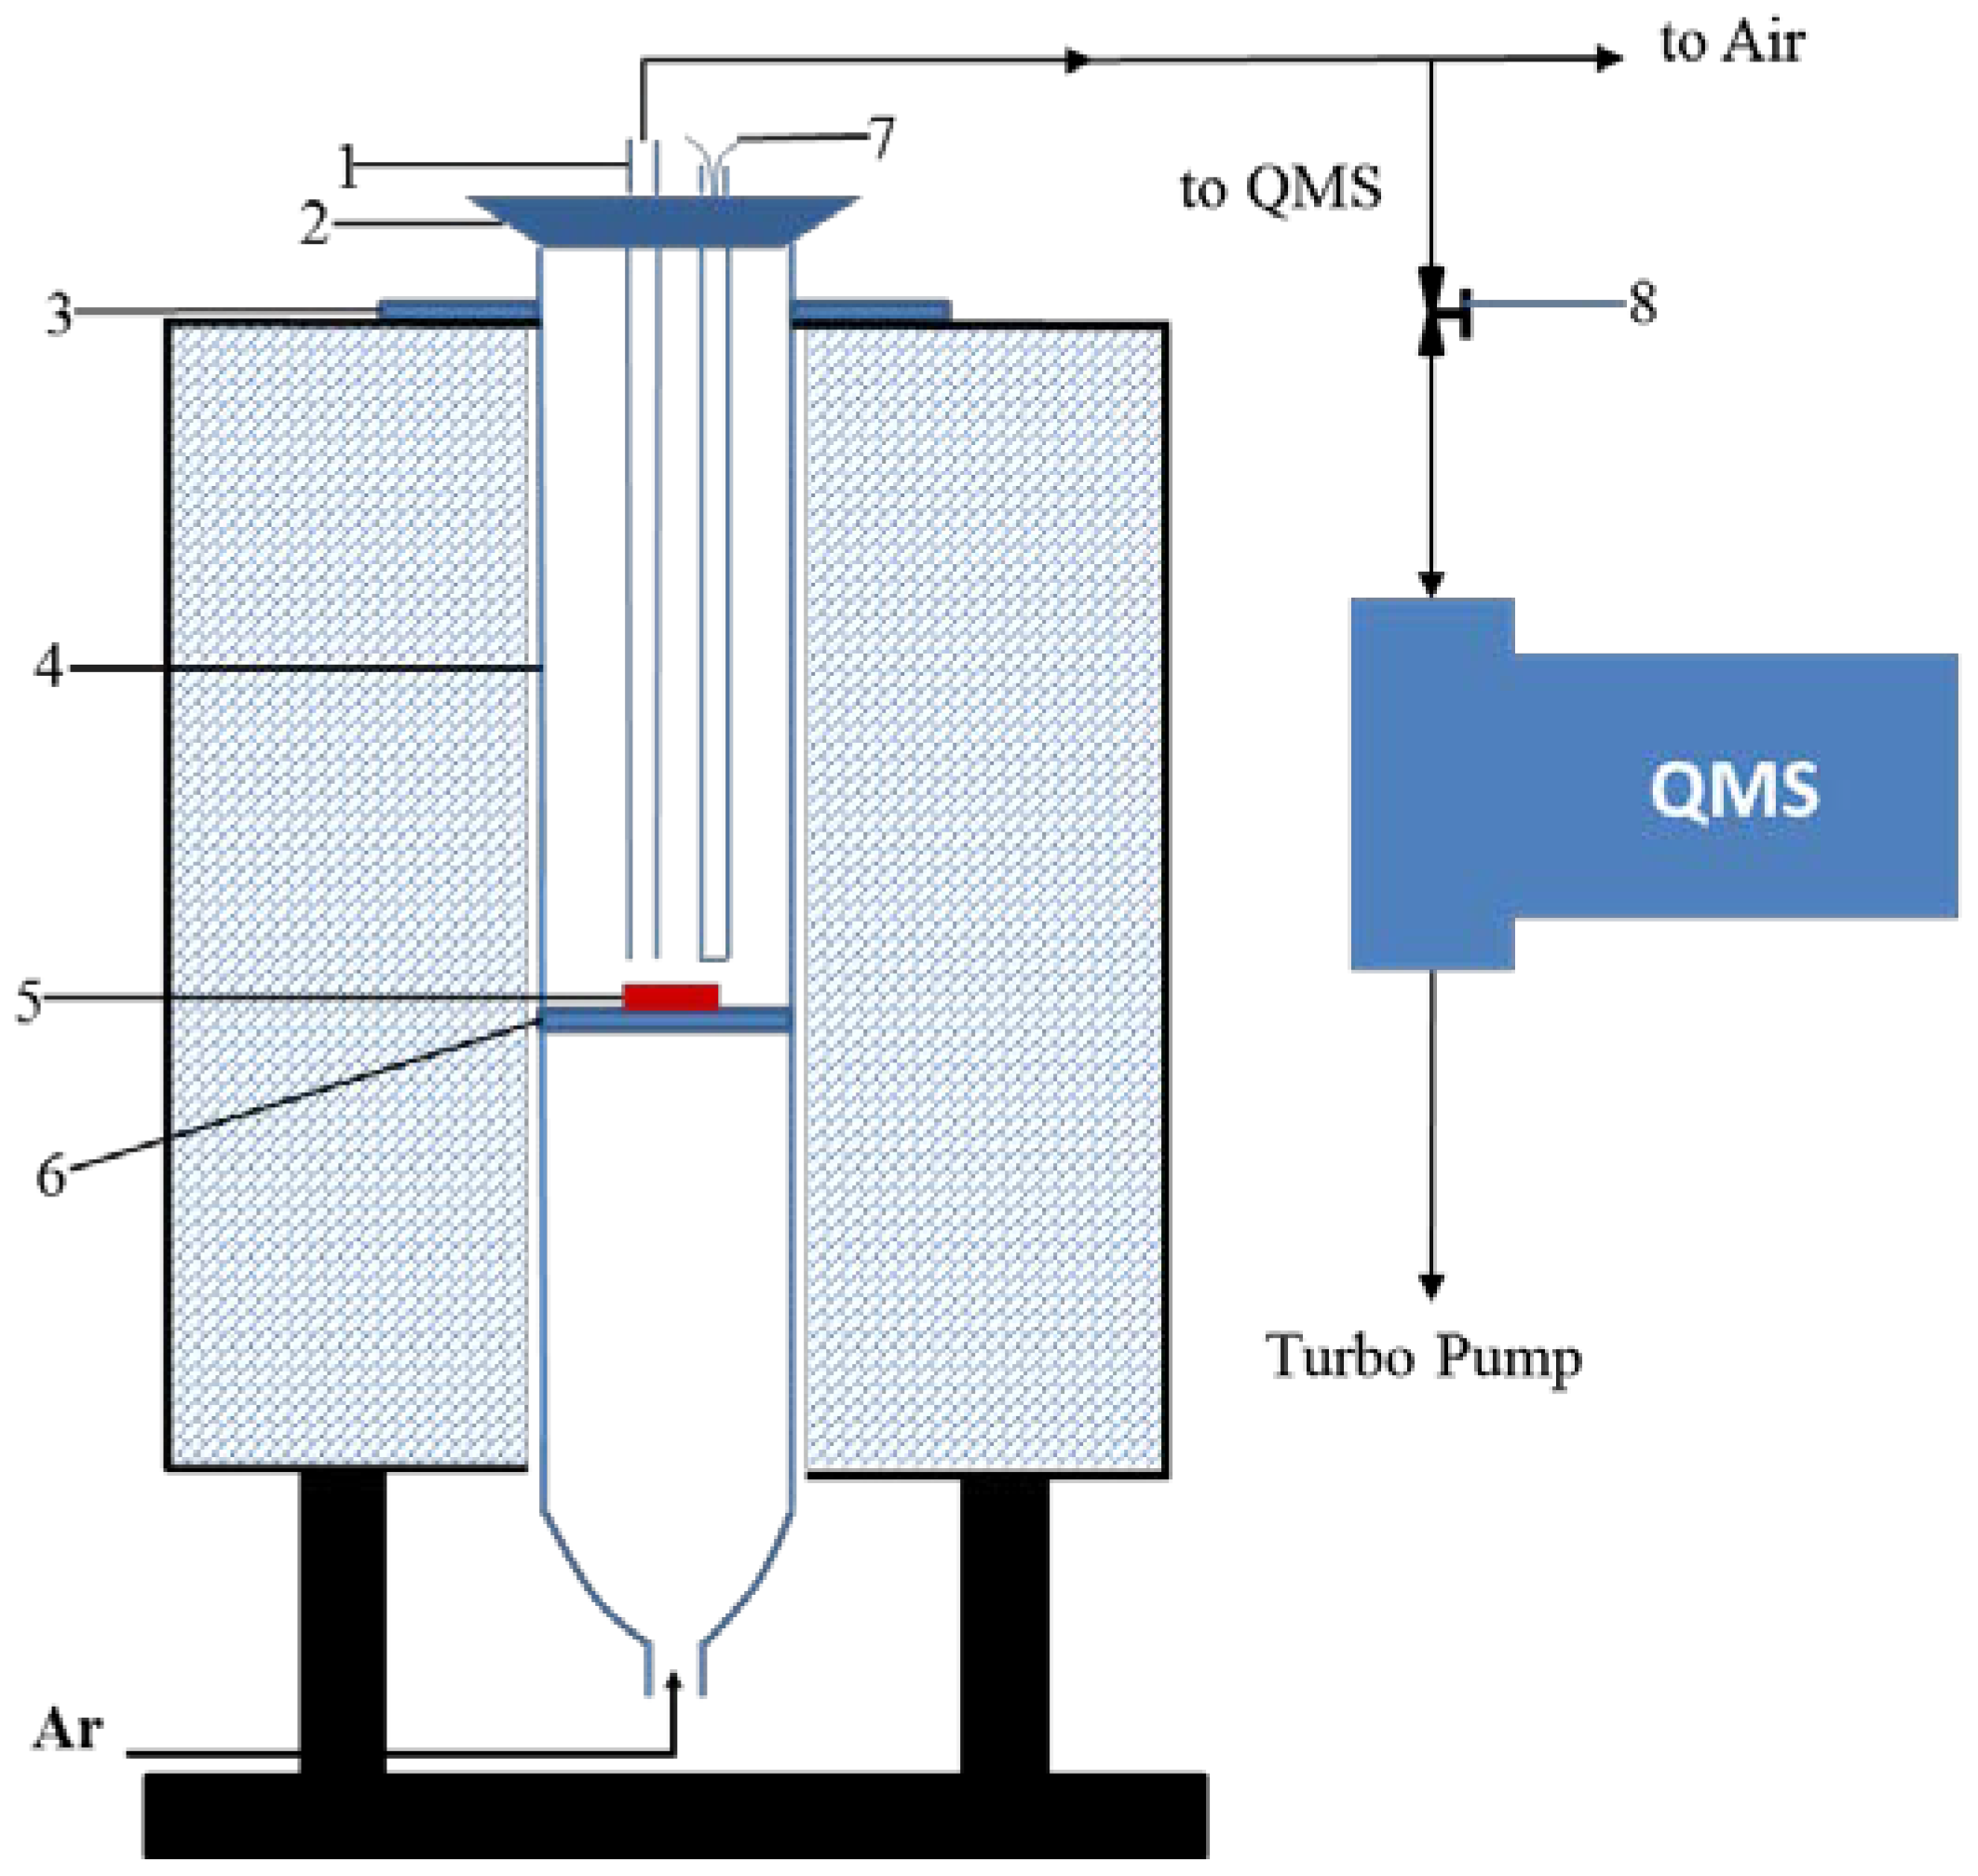
2.2. Experimental Procedure

The raw materials were mixed uniformly according to Table 2, and 1 g of the mixture was pressed into cylindrical pellets. The pellets were consequently dried for experimental use. The samples were placed in a tube furnace under an Ar gas atmosphere. The temperature was increased to 1200 °C at a rate of 10 °C/min. Beyond 400 °C, the reactor was connected to the quadrupole mass spectrometer (QMS). Figure 1 presents the schematic diagram of the experimental apparatus. The generated gas was detected. The thermodynamics of the carbofuran reduction of fluorapatite was calculated with FactSage7.0 software [20].

3. Results and Discussion

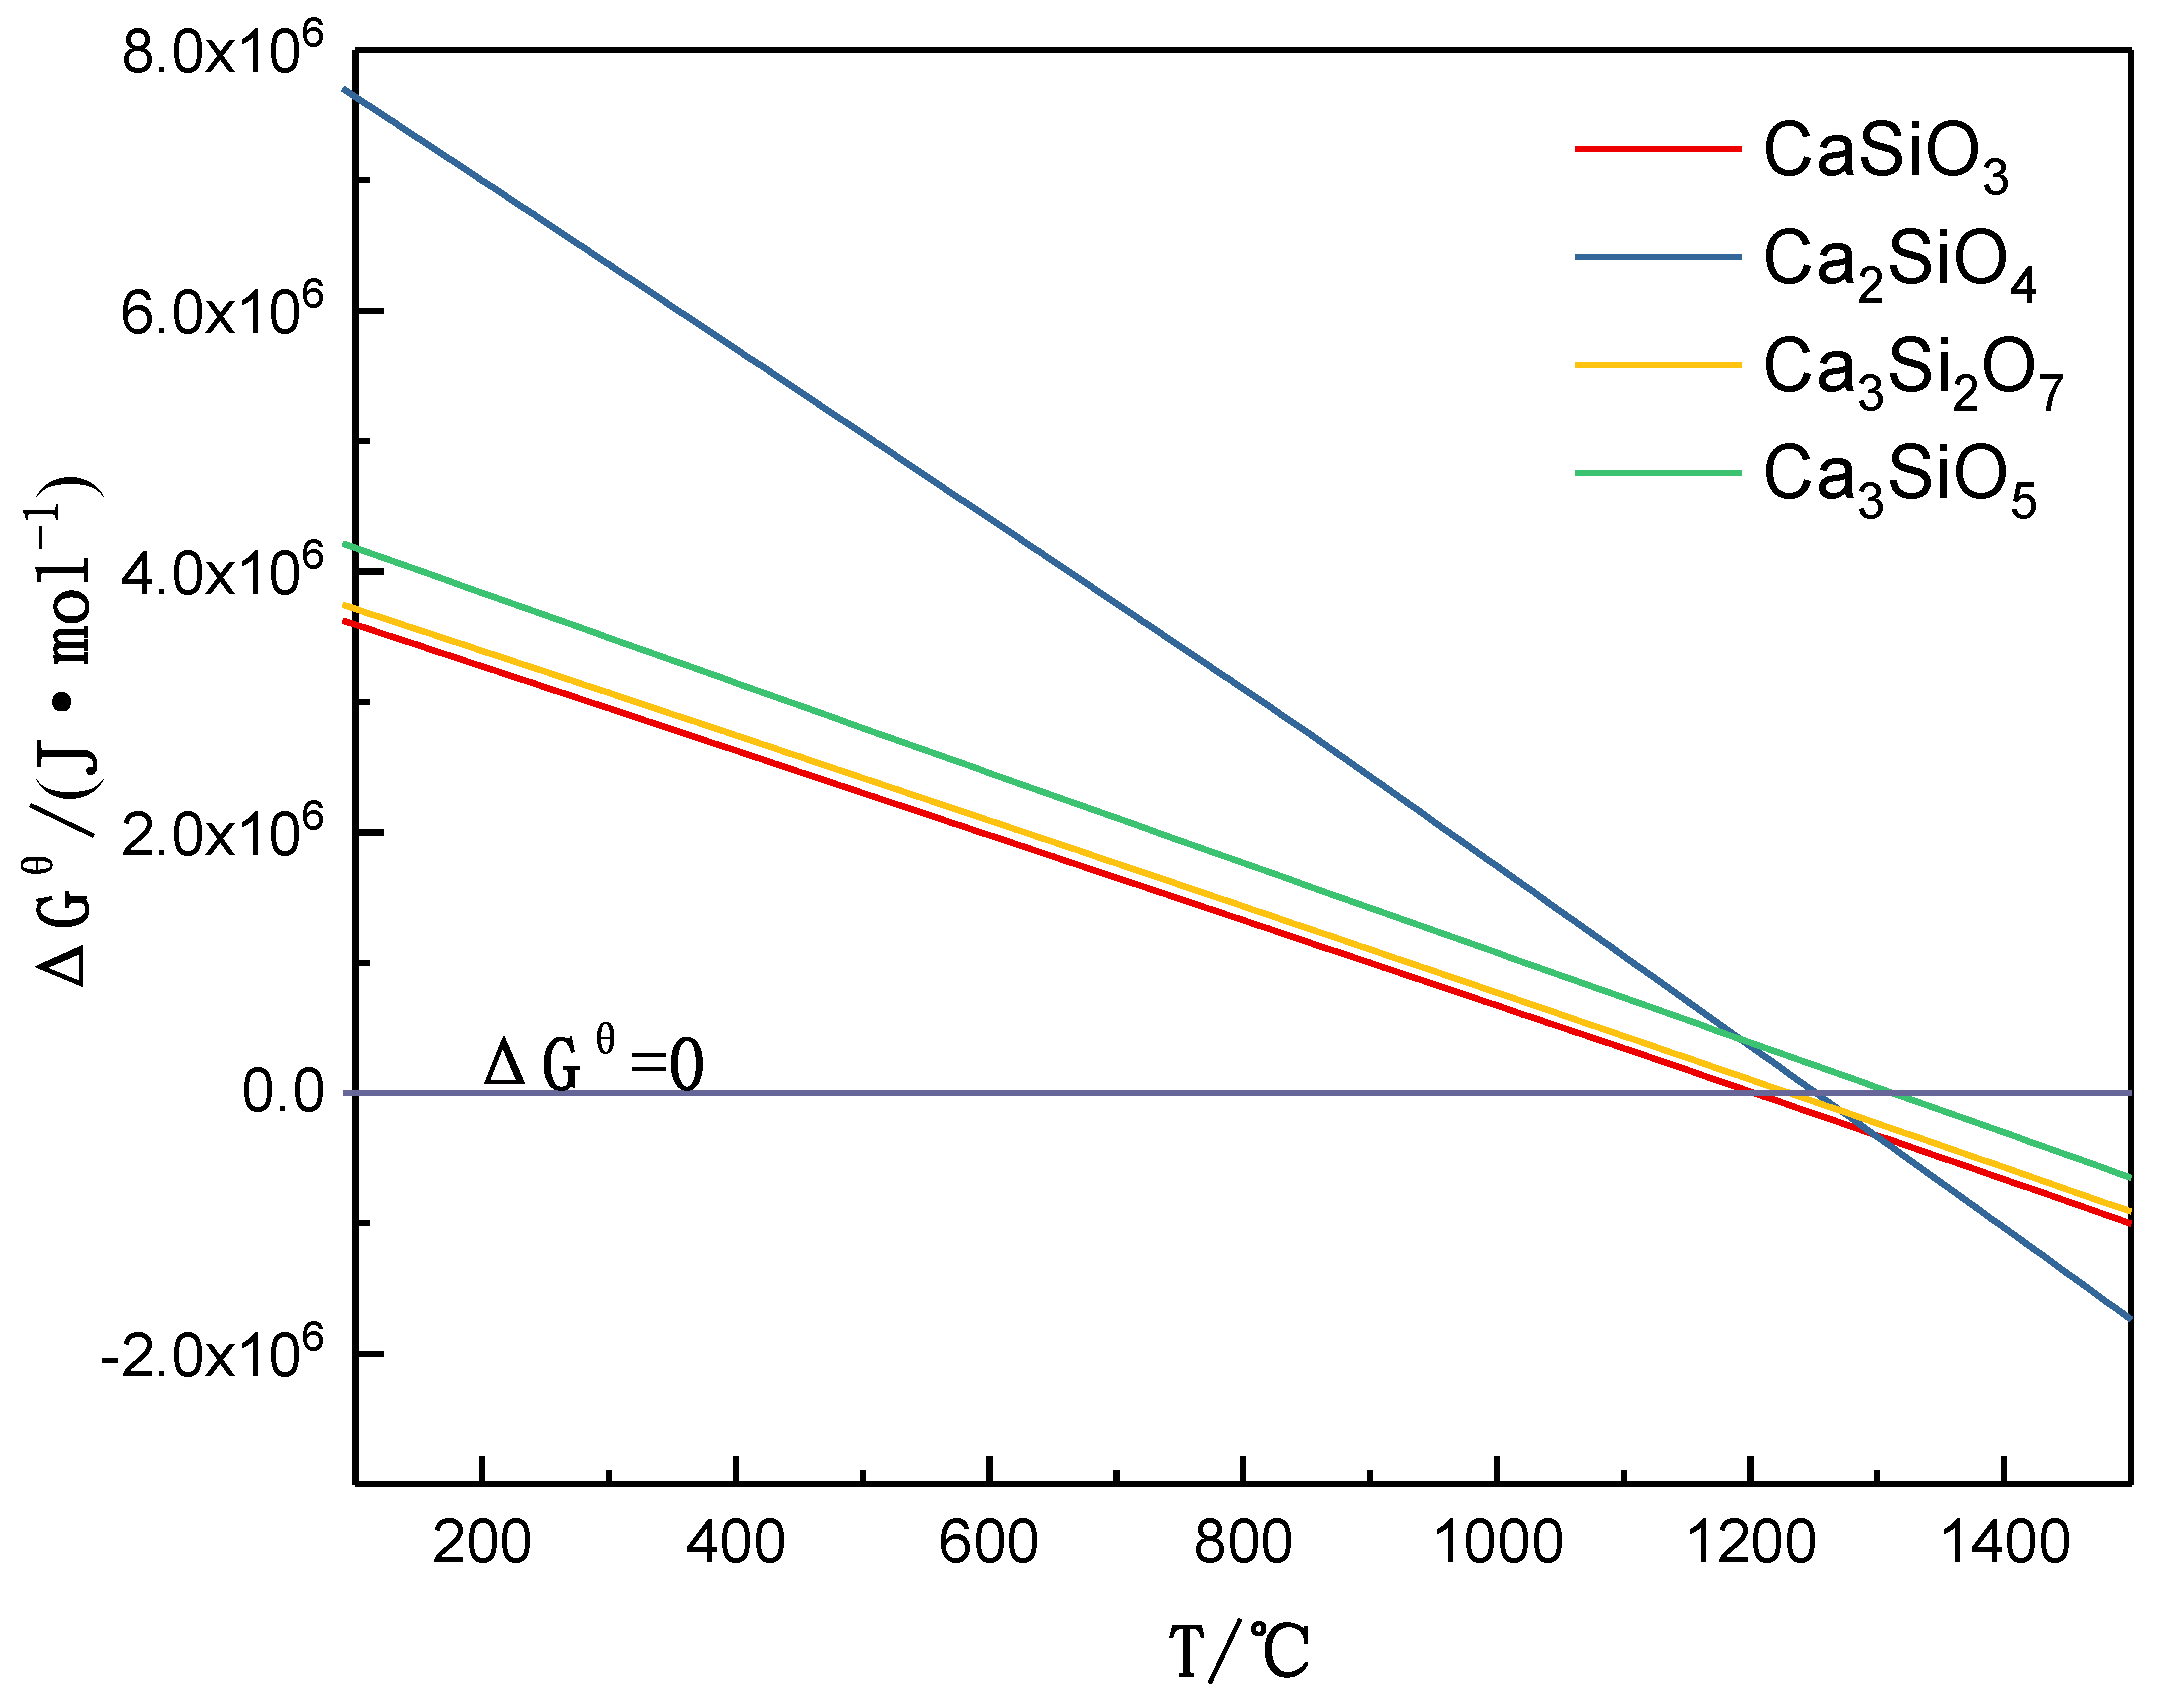
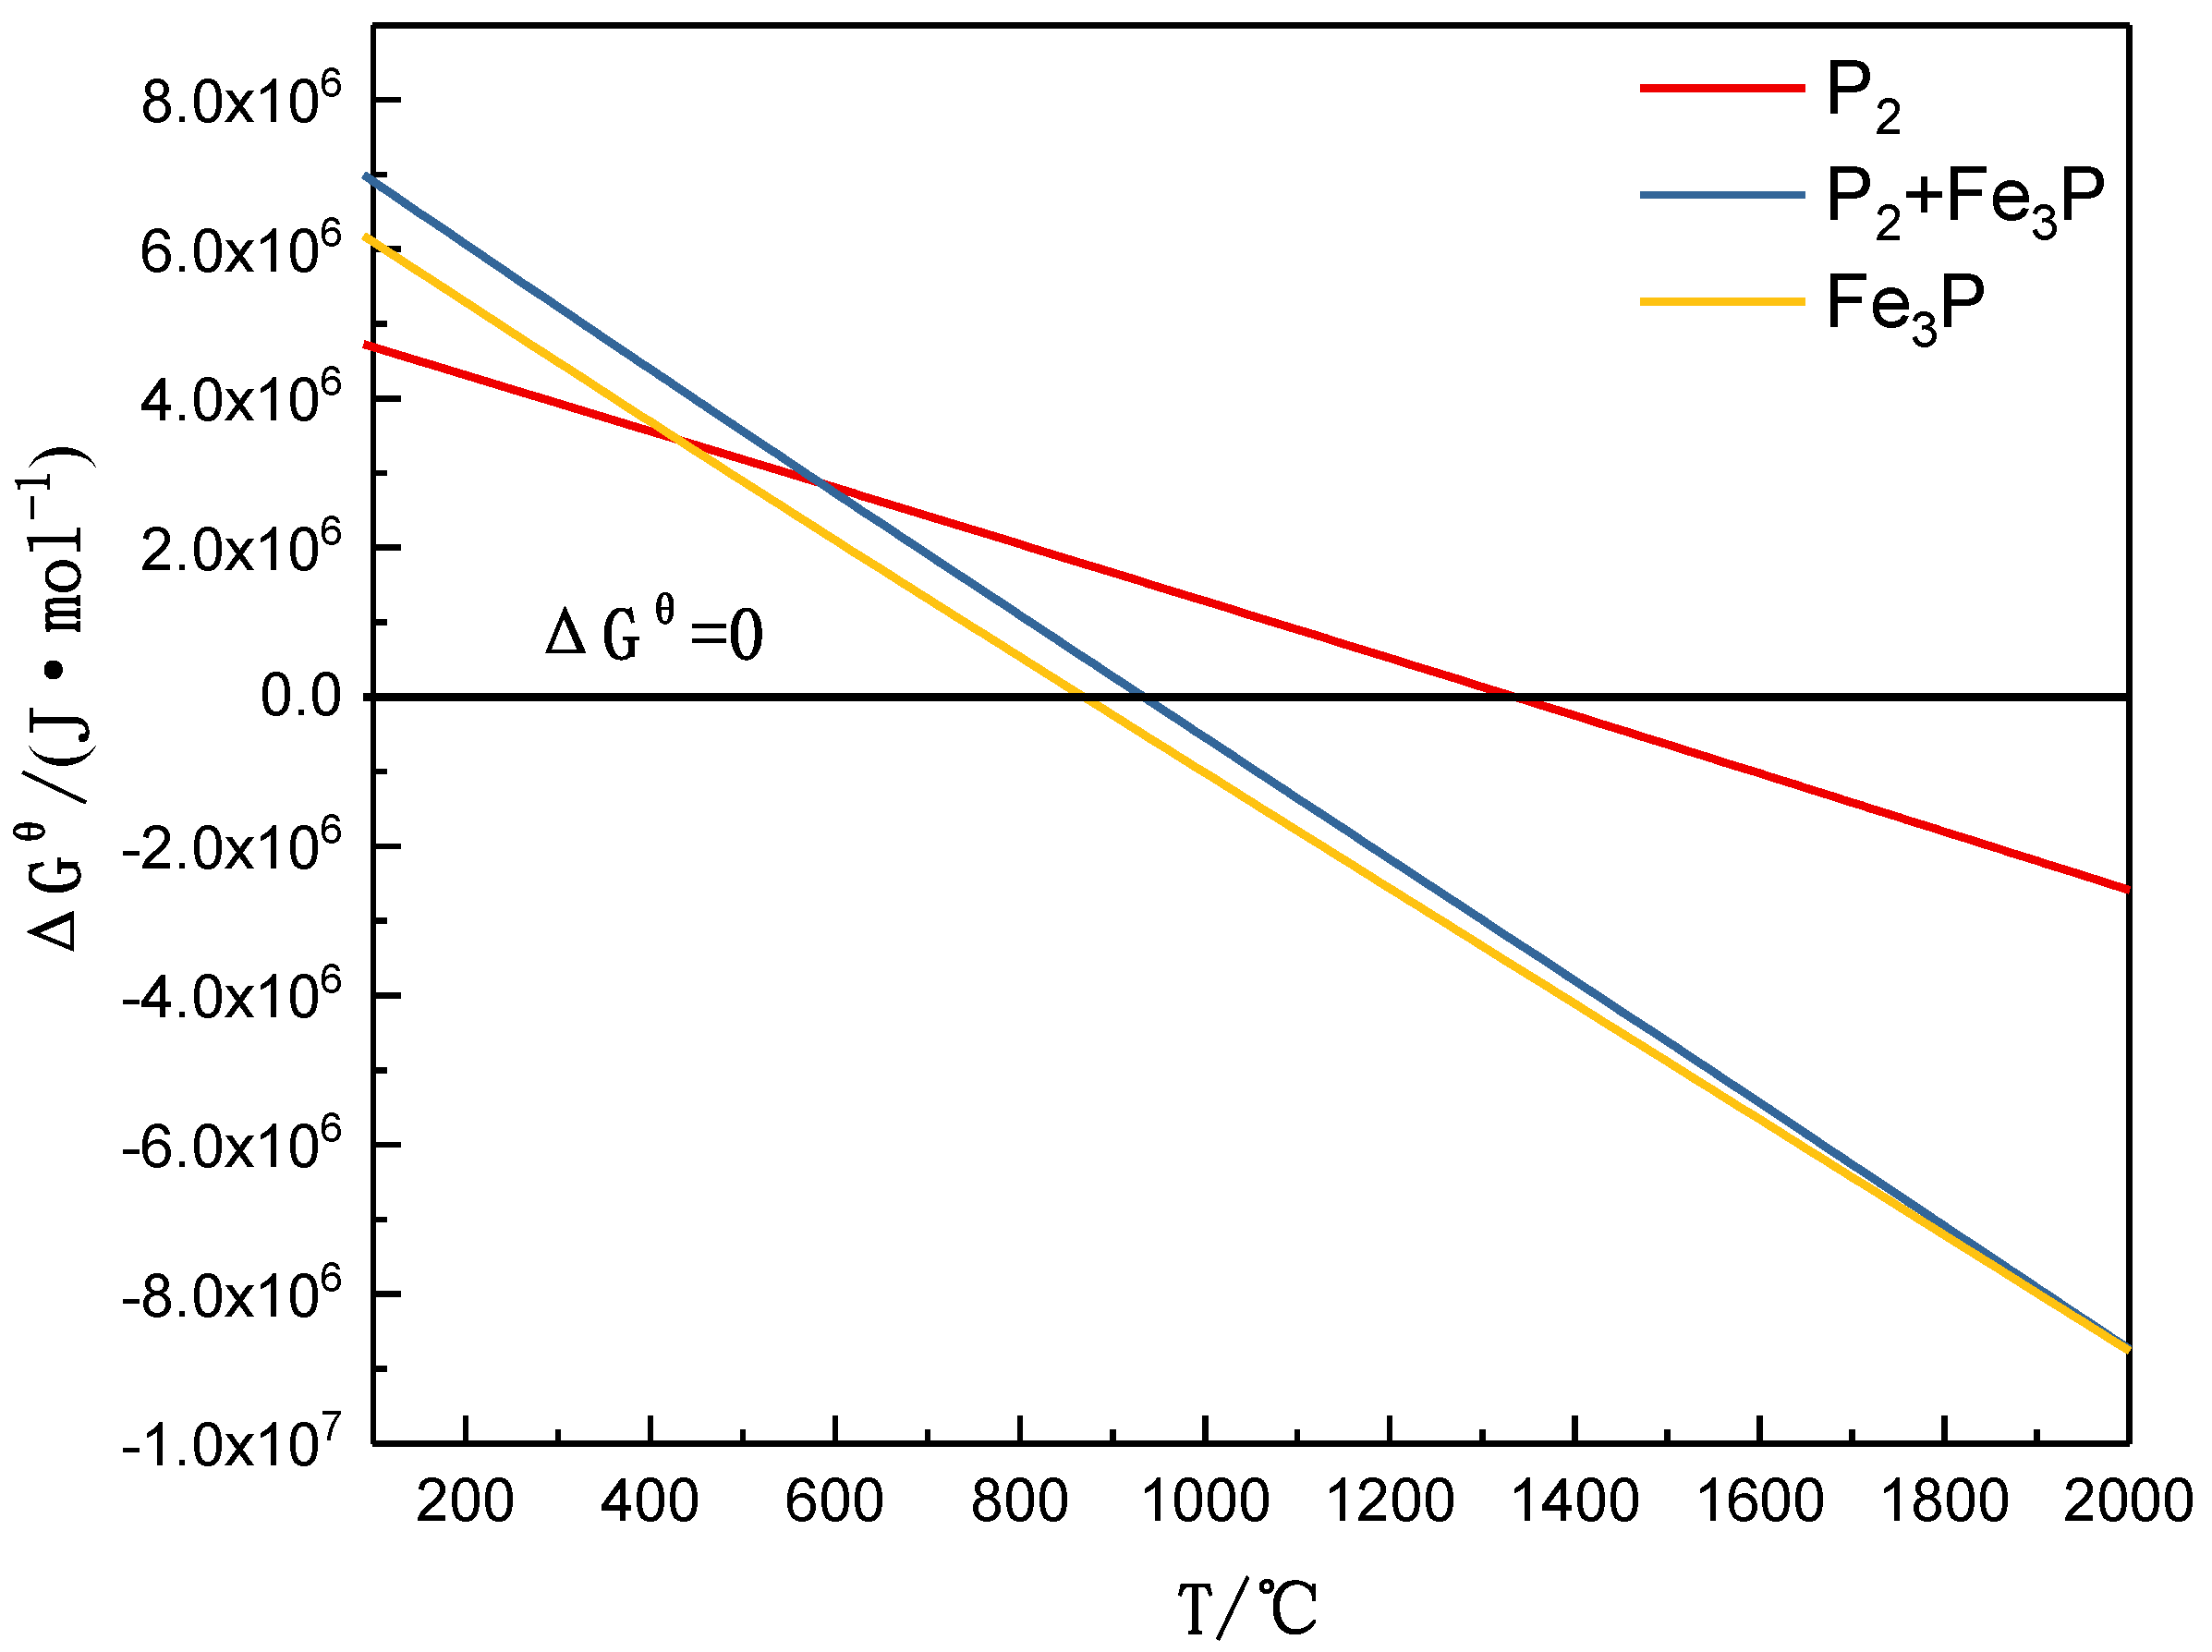
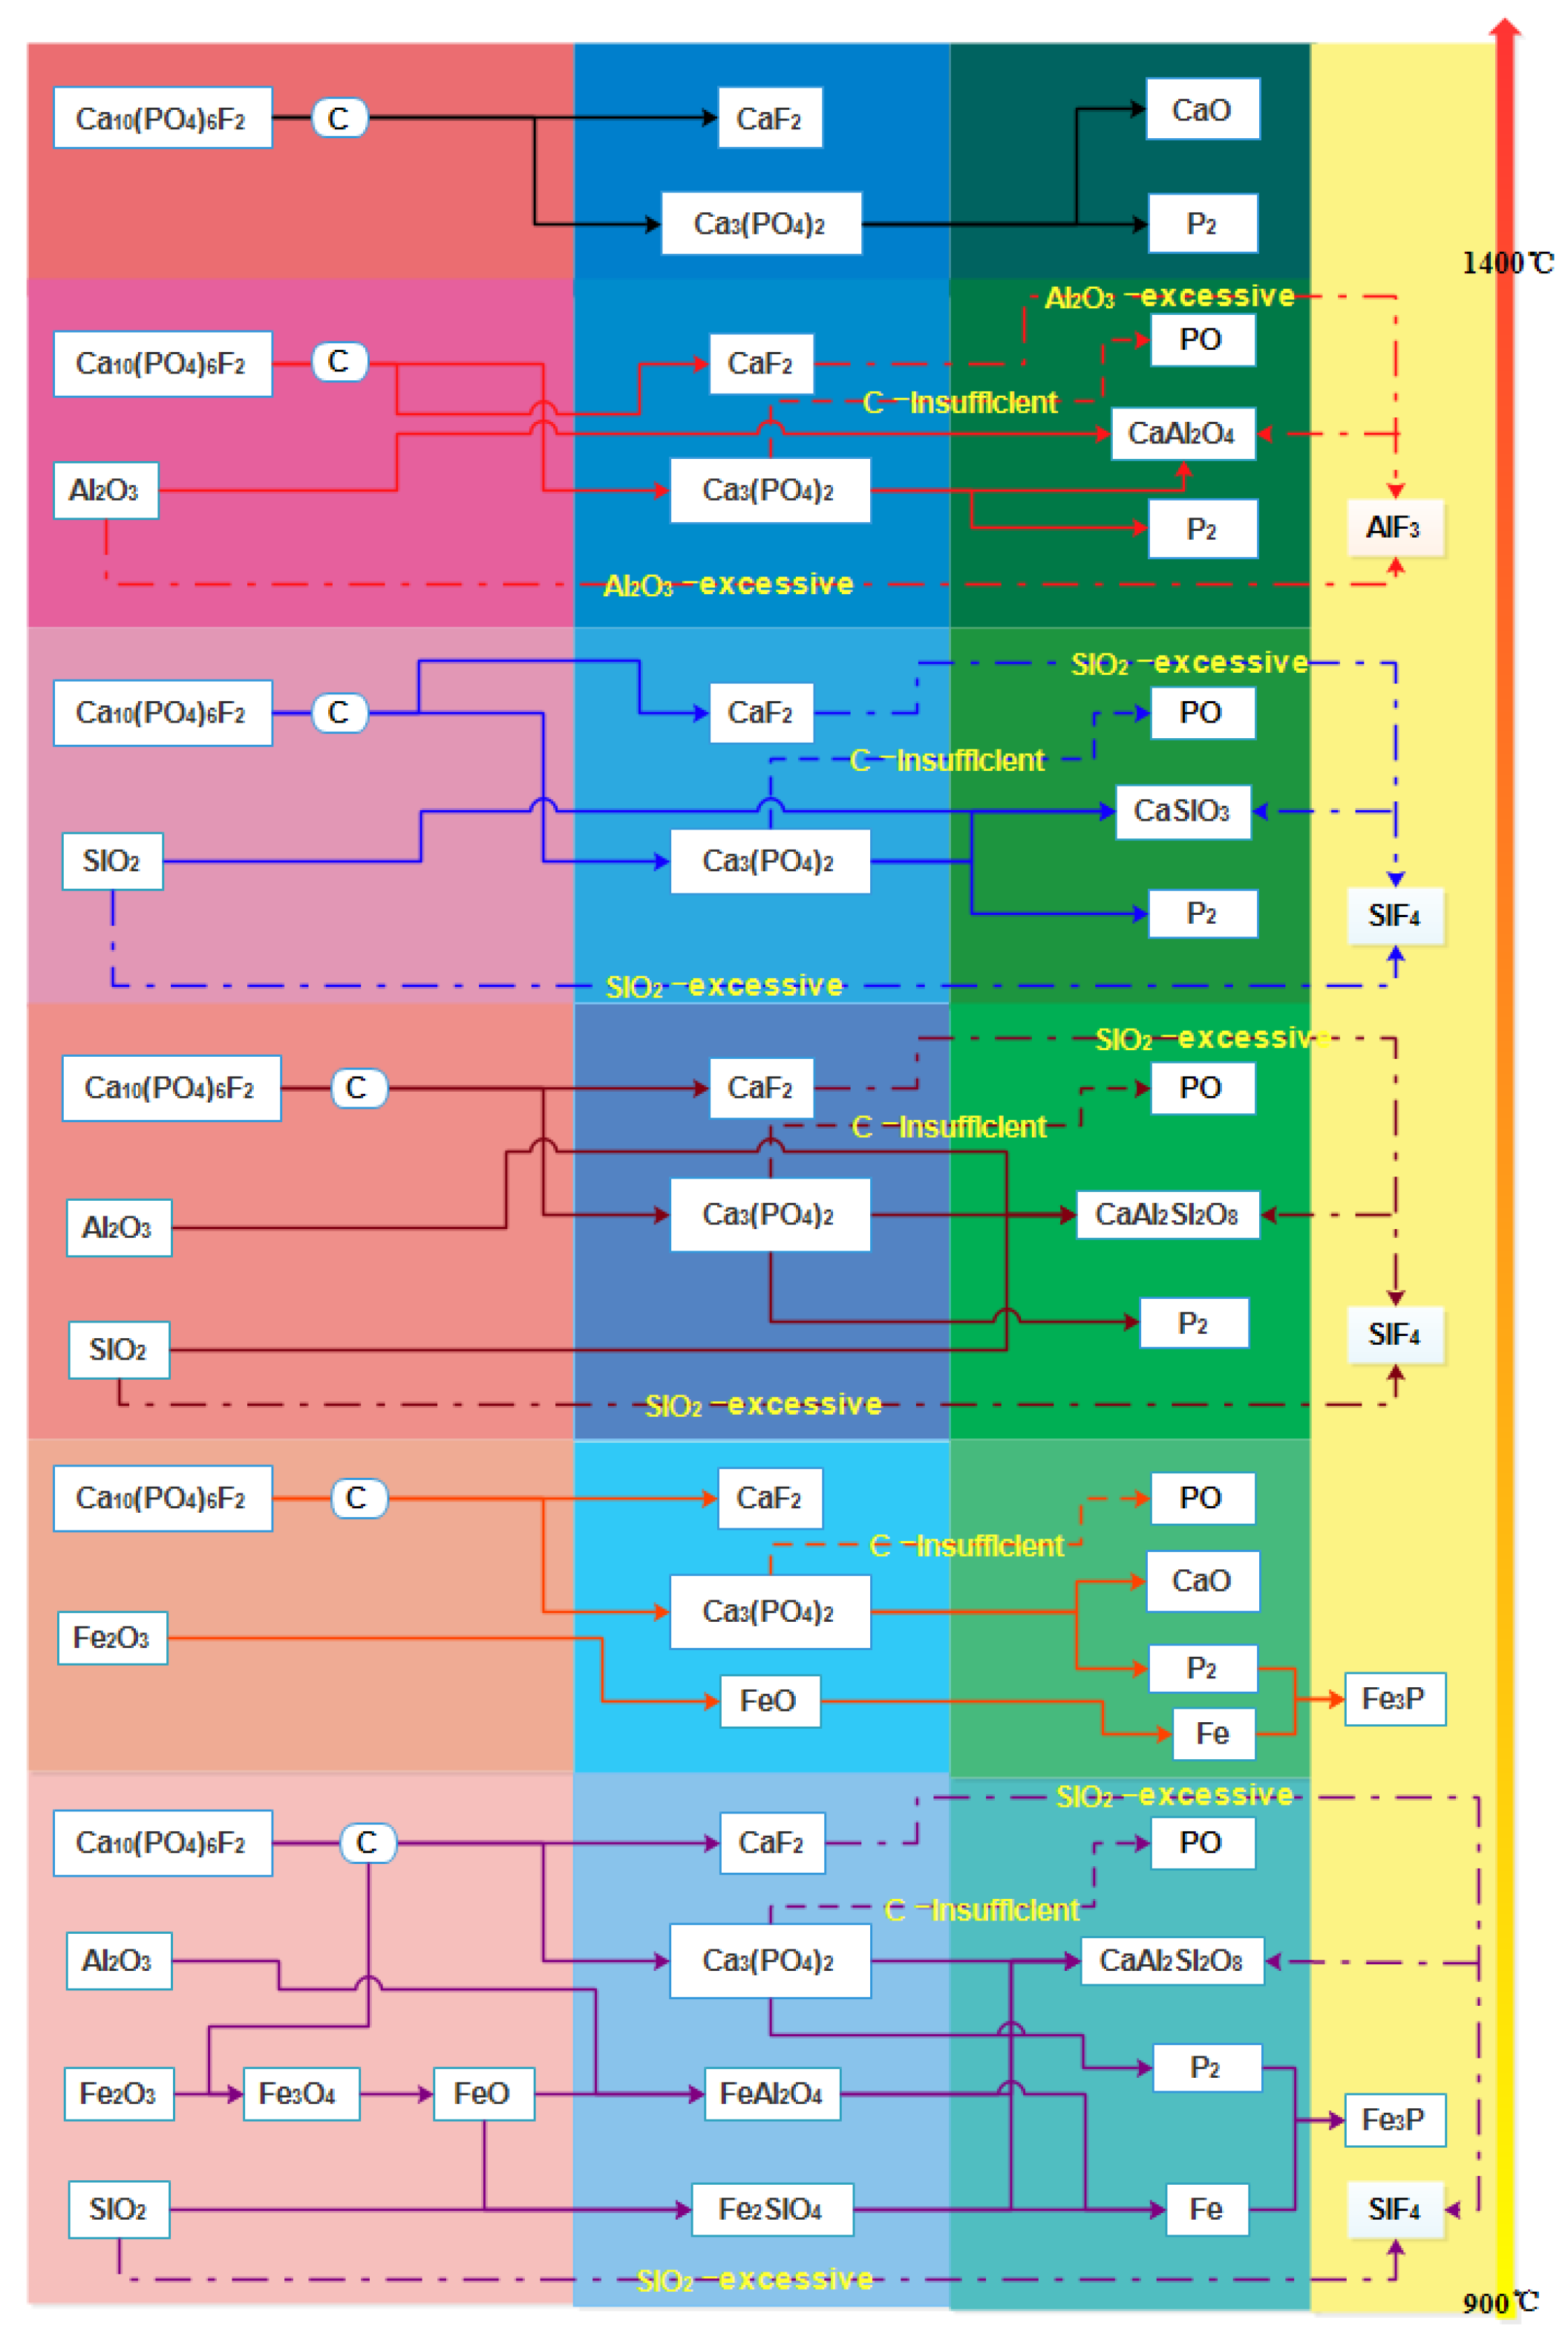
3.1. Mineral Reaction Summary and Thermodynamics Discussion of High-Phosphorus Iron Ore Reduction

In order to clarify the phosphorus vaporization, the thermodynamics of carbothermal reduction of fluorapatite is discussed in detail.
(1) Carbothermal reduction of Ca10(PO4)6F2: The possible dephosphorization reaction equations are the following:
Ca10(PO4)6F2(s) + 15C(s) = CaF2 + 15CO(g) + 3P2(g) + 9CaO,
2Ca10(PO4)6F2(s) + 30C(s) = 2CaF2 + 30CO(g) + 3P4(g) + 18CaO,
Ca10(PO4)6F2(s) + 9C(s) = CaF2 + 9CO(g) + 6PO(g) + 9CaO,
Ca10(PO4)6F2(s) + 3C(s) = CaF2 + 3CO(g) + 6PO2(g) + 9CaO.
Figure 2 presents the relationship between the standard Gibbs free energy and temperature for the aforementioned four equations. The thermodynamic calculations indicated that fluorapatite could be reduced beyond 1400 °C when carbon alone was added. According to the standard Gibbs free energy, the products of phosphorus vaporization were most likely P2 and P4. In the case of high temperature and no oxygen, P4 could be converted into P2. P2 is a small-sized molecule. Consequently, it was more likely to be volatilized. Therefore, the vaporization product of fluorapatite was mainly P2.
(2) Carbothermal reduction of Ca10(PO4)6F2 with gangue Al2O3: The possible dephosphorization reaction equations are the following:
Ca10(PO4)6F2(s) + 15C(s) + 9Al2O3(s) = CaF2 + 15CO(g) + 3P2(g) + 9CaAl2O4,
Ca10(PO4)6F2(s)+15C(s) + 18Al2O3(s) = CaF2 + 15CO(g) + 3P2(g) + 9CaAl4O7,
Ca10(PO4)6F2(s)+15C(s) + 3Al2O3(s) = CaF2 + 15CO(g) + 3P2(g) + 3Ca3Al2O6.
Figure 3 presents the relationship between the standard Gibbs free energy and temperature for different Ca–Al–O products. When Al2O3 was added, the Ca10(PO4)6F2 was reduced to form Ca–Al–O gangue to promote the dephosphorization of fluorapatite. According to thermodynamic calculations, the standard Gibbs free energy required for the formation of CaAl2O4 was the lowest. Therefore, when Al2O3 was present, the dephosphorization product of Ca10(PO4)6F2 was most likely CaAl2O4. CaAl2O4 as the product below is used to discuss the possible reduction of fluorapatite when additional Al2O3 (molar ratio of Al2O3/Ca10(PO4)6F2 > 10.3) was added:
3Ca10(PO4)6F2(s) + 45C(s) + 31Al2O3(s) = 2AlF3(g) + 45CO(g) + 9P2(g) + 30CaAl2O4,
ΔGθ = 1.67425E7 − 15945.22T.
From the aforementioned calculations, CaAl2O4 was observed to promote the dephosphorization of fluorapatite, particularly when the Al2O3 was in excess (molar ratio of Al2O3/Ca10(PO4)6F2 > 10.3); fluorapatite was defluorinated to produce more easily reduced Ca3(PO4)2, which promoted the dephosphorization of fluorapatite.
(3) Carbothermal reduction reaction of Ca10(PO4)6F2 with gangue SiO2: The possible dephosphorization reaction equations are the following:
Ca10(PO4)6F2(s) + 15C(s) + 9SiO2(s) = CaF2 + 15CO(g) + 3P2(g) + 9CaSiO3,
2Ca10(PO4)6F2(s) + 30C(s) + 9SiO2(s) = 2CaF2 + 30CO(g) + 6P2(g) + 9Ca2SiO4,
Ca10(PO4)6F2(s) + 15C(s) +6SiO2(s) = CaF2 + 15CO(g) +3P2(g) + 3Ca3Si2O7,
Ca10(PO4)6F2(s) + 15C(s) + 3SiO2(s) = CaF2 + 15CO(g) + 3P2(g) + 3Ca3SiO5.
Figure 4 presents the relationship between the standard Gibbs free energy and temperature for different Ca–Si–O products. When SiO2 was added, Ca10(PO4)6F2 was reduced to form Ca–Si–O gangue to promote the dephosphorization of fluorapatite. According to thermodynamic calculations, the standard Gibbs free energy required for the formation of CaSiO3 was the lowest. Therefore, when SiO2 was present, the dephosphorization product of Ca10(PO4)6F2 was most likely CaSiO3. CaSiO3 as the product below is used to discuss the possible reduction of fluorapatite when additional SiO2 (molar ratio of SiO2/Ca10(PO4)6F2 > 10.5) was added:
2Ca10(PO4)6F2(s) + 30C(s) + 21SiO2(s) = SiF4(g) + 30CO(g) + 6P2(g) + 20CaSiO3,
ΔGθ = 7.14216E6 − 7002.12T.
From the calculation results of Equation (13), it could be observed that when the SiO2/Ca10(PO4)6F2 molar ratio was greater than 10.5, fluorapatite was more easily reduced. This occurred because the defluorination of fluorapatite was promoted by SiO2 to generate more easily reduced Ca3(PO4)2, which promoted the reduction of fluorapatite. The partial pressure of the phosphorus-containing gas was decreased by the generated SiF4 gas, and the dephosphorization of fluorapatite was further promoted.
(4) Carbothermal reduction reaction of Ca10(PO4)6F2 with gangue Al2O3 and SiO2: The possible dephosphorization reaction equations are the following:
Ca10(PO4)6F2(s) + 15C(s) + 3SiO2(s) + 9Al2O3(s) = CaF2(s) + 15CO(g) + 3P2(g) + 9CaAl2Si2O8(s),
Ca10(PO4)6F2(s) + 15C(s) + 9SiO2(s) + 3Al2O3(s) = CaF2(s) + 15CO(g) + 3P2(g) +
3Ca3Al2Si3O12(s),
Ca10(PO4)6F2(s) + 15C(s) + 9SiO2(s) + 9Al2O3(s) = CaF2(s) + 15CO(g) + P2(g) + 9CaAl2SiO6(s).
Figure 5 presents the relationship between the standard Gibbs free energy and temperature for different Ca–Al–Si–O products. The thermodynamic calculations demonstrated that when Al2O3 and SiO2 were simultaneously added, the standard Gibbs free energy required for the reduction of fluorapatite was further decreased. When the product was CaAl2Si2O8, the required standard Gibbs free energy was the lowest. Therefore, when Al2O3 was present along with SiO2, fluorapatite was more easily reduced to produce CaAl2Si2O8.
(5) Carbothermal reduction reaction of Ca10(PO4)6F2 with gangue Fe2O3: The possible dephosphorization reaction equations are the following:
Ca10(PO4)6F2(s) + 18C(s) + Fe2O3(s) = CaF2 + 18CO(g) + 3P2(g) + 9CaO + 2Fe(s),
Ca10(PO4)6F2(s) + 18C(s) + Fe2O3(s) = CaF2 + 45CO(g) + 2P2(g) + 9CaO + 2Fe3P + 14Fe(s),
Ca10(PO4)6F2(s) + 45C(s) + Fe2O3(s) = CaF2 + 45CO(g) + 9CaO + 6Fe3P + 2Fe(s).
Figure 6 presents the relationship between the standard Gibbs free energy and temperature for the previous three reaction equations. It could be observed that the standard Gibbs free energy required for the reduction of fluorapatite was decreased by Fe2O3. In contrast, the mechanism promoted by Fe2O3 was different compared to the Al2O3 and SiO2 mechanisms. The iron formed by reduction had a strong absorption capacity for phosphorus to generate Fe3P. Therefore, the dephosphorization of fluorapatite was promoted, but it was not favorable for the separation of iron and phosphorus. For the high-phosphorus iron ore, to achieve dephosphorization, the diffusion of phosphorus into iron should be inhibited.
The process of the carbothermal reduction of Ca10(PO4)6F2 with three types of gangue was complex. Taking into account the previous analysis and the composition of high-phosphorus iron ore, the possible overall reaction equation is the following:
Ca10(PO4)6F2(s) + 18C(s) + 18SiO2(s) + 9Al2O3(s) + Fe2O3(s) = CaF2 + 18CO(g) + 3P2(g) +
9CaAl2Si2O8 + 2Fe(s) + Fe3P,
ΔGθ = 4.53867E6 − 4890.81T.
Through the thermodynamic analysis, it was found that when only carbon was present, fluorapatite dephosphorization was difficult to achieve. The starting temperature (temperature at ΔGθ = 0) for the dephosphorization of fluorapatite exceeded 1400 °C. It was also discovered that the higher the C/O (O from Ca10(PO4)6F2), the lower the dephosphorization temperature of fluorapatite. Following the SiO2 or Al2O3 addition, the oxides reacted with Ca10(PO4)6F2 to form CaAl2O4 and CaSiO3, which promoted the vaporization dephosphorization reaction. The effect of SiO2 was stronger than that of Al2O3. When the amount of SiO2 was sufficient, fluorapatite was defluorinated to Ca3(PO4)2, and it was easier to reduce Ca3(PO4)2 than Ca10(PO4)6F2. In addition, the partial pressure of the phosphorus-containing gas was decreased by the generation of fluorine-containing gas, which improved the thermodynamic conditions of dephosphorization. This promoted the decomposition of fluorapatite and resulted in an acceleration of the vaporization dephosphorization rate of fluorapatite. As the gangue-phase amount increased, the dephosphorization temperature of fluorapatite was gradually reduced. When three gangue oxides were simultaneously present, the gangue phase first transformed into the new gangue phase, and fluorapatite was dephosphorized through gasification in the role of the new gangue phase. The starting temperature (temperature at ΔGθ = 0) for dephosphorization of fluorapatite was 928 °C.
According to the previous thermodynamic analysis, the evolution of fluorapatite during the carbothermal reduction was summarized and is presented in Figure 7. When only carbon was added, fluorapatite was not easily dephosphorized by vaporization. This occurred because fluorapatite was not easily decomposed. The starting temperature (temperature at ΔGθ = 0) for dephosphorization of fluorapatite was 1442 °C. When Al2O3, SiO2, and Fe2O3 were added, the dephosphorization temperature of fluorapatite was decreased. When low amounts of Al2O3 (molar ratio of Al2O3/Ca10(PO4)6F2 < 10.3) were added, fluorapatite began to be dephosphorized at 1306 °C. In this time frame, the products were mainly CaAl2O4, CaF2, P2, and CO. When a sufficient amount of Al2O3 (molar ratio of Al2O3/Ca10(PO4)6F2 > 10.3) was added, fluorapatite was defluorinated to form AlF3 gas, which improved the thermodynamic conditions of the reaction and caused fluorapatite to be dephosphorized at approximately 1050 °C. The resulting products were mainly CaAl2O4, P2, CO, and AlF3. When low amounts of SiO2 (molar ratio of SiO2/Ca10(PO4)6F2 < 10.5) were added, fluorapatite was dephosphorized at 1200 °C. The subsequent products were mainly CaSiO3, CaF2, P2, and CO. When a sufficient amount of SiO2 (molar ratio of SiO2/Ca10(PO4)6F2 > 10.5) was added, the melting point of the system was reduced, which promoted the mass transfer conditions to accelerate the dephosphorization of fluorapatite. Fluorapatite was dephosphorized at 1019 °C. At this point, the decomposed CaF2 was consumed. The main products were CaSiO3, CO, P2, and SiF4. When only Fe2O3 was added, the phosphorus was absorbed by the iron phase to form Fe3P, which promoted the dephosphorization of fluorapatite. When SiO2, Al2O3, and Fe2O3 were added, the reduction route of the iron oxide was changed. Certain amounts of FeO and gangue generated intermediate products (Fe2SiO4 and FeAl2O4), which were difficult to reduce. Fluorapatite was dephosphorized under the combined action of Fe2SiO4 and FeAl2O4. When a sufficient amount of carbon was available (molar ratio of C/O > 1, where O was from fluoroapatite and Fe2O3), fluorapatite was completely reduced, and the phosphorus vaporization product was P2. When the amount of carbon was insufficient (molar ratio of C/O < 1, where O was from fluorapatite and Fe2O3), fluorapatite was not completely reduced and was primarily volatilized as phosphorus oxides.

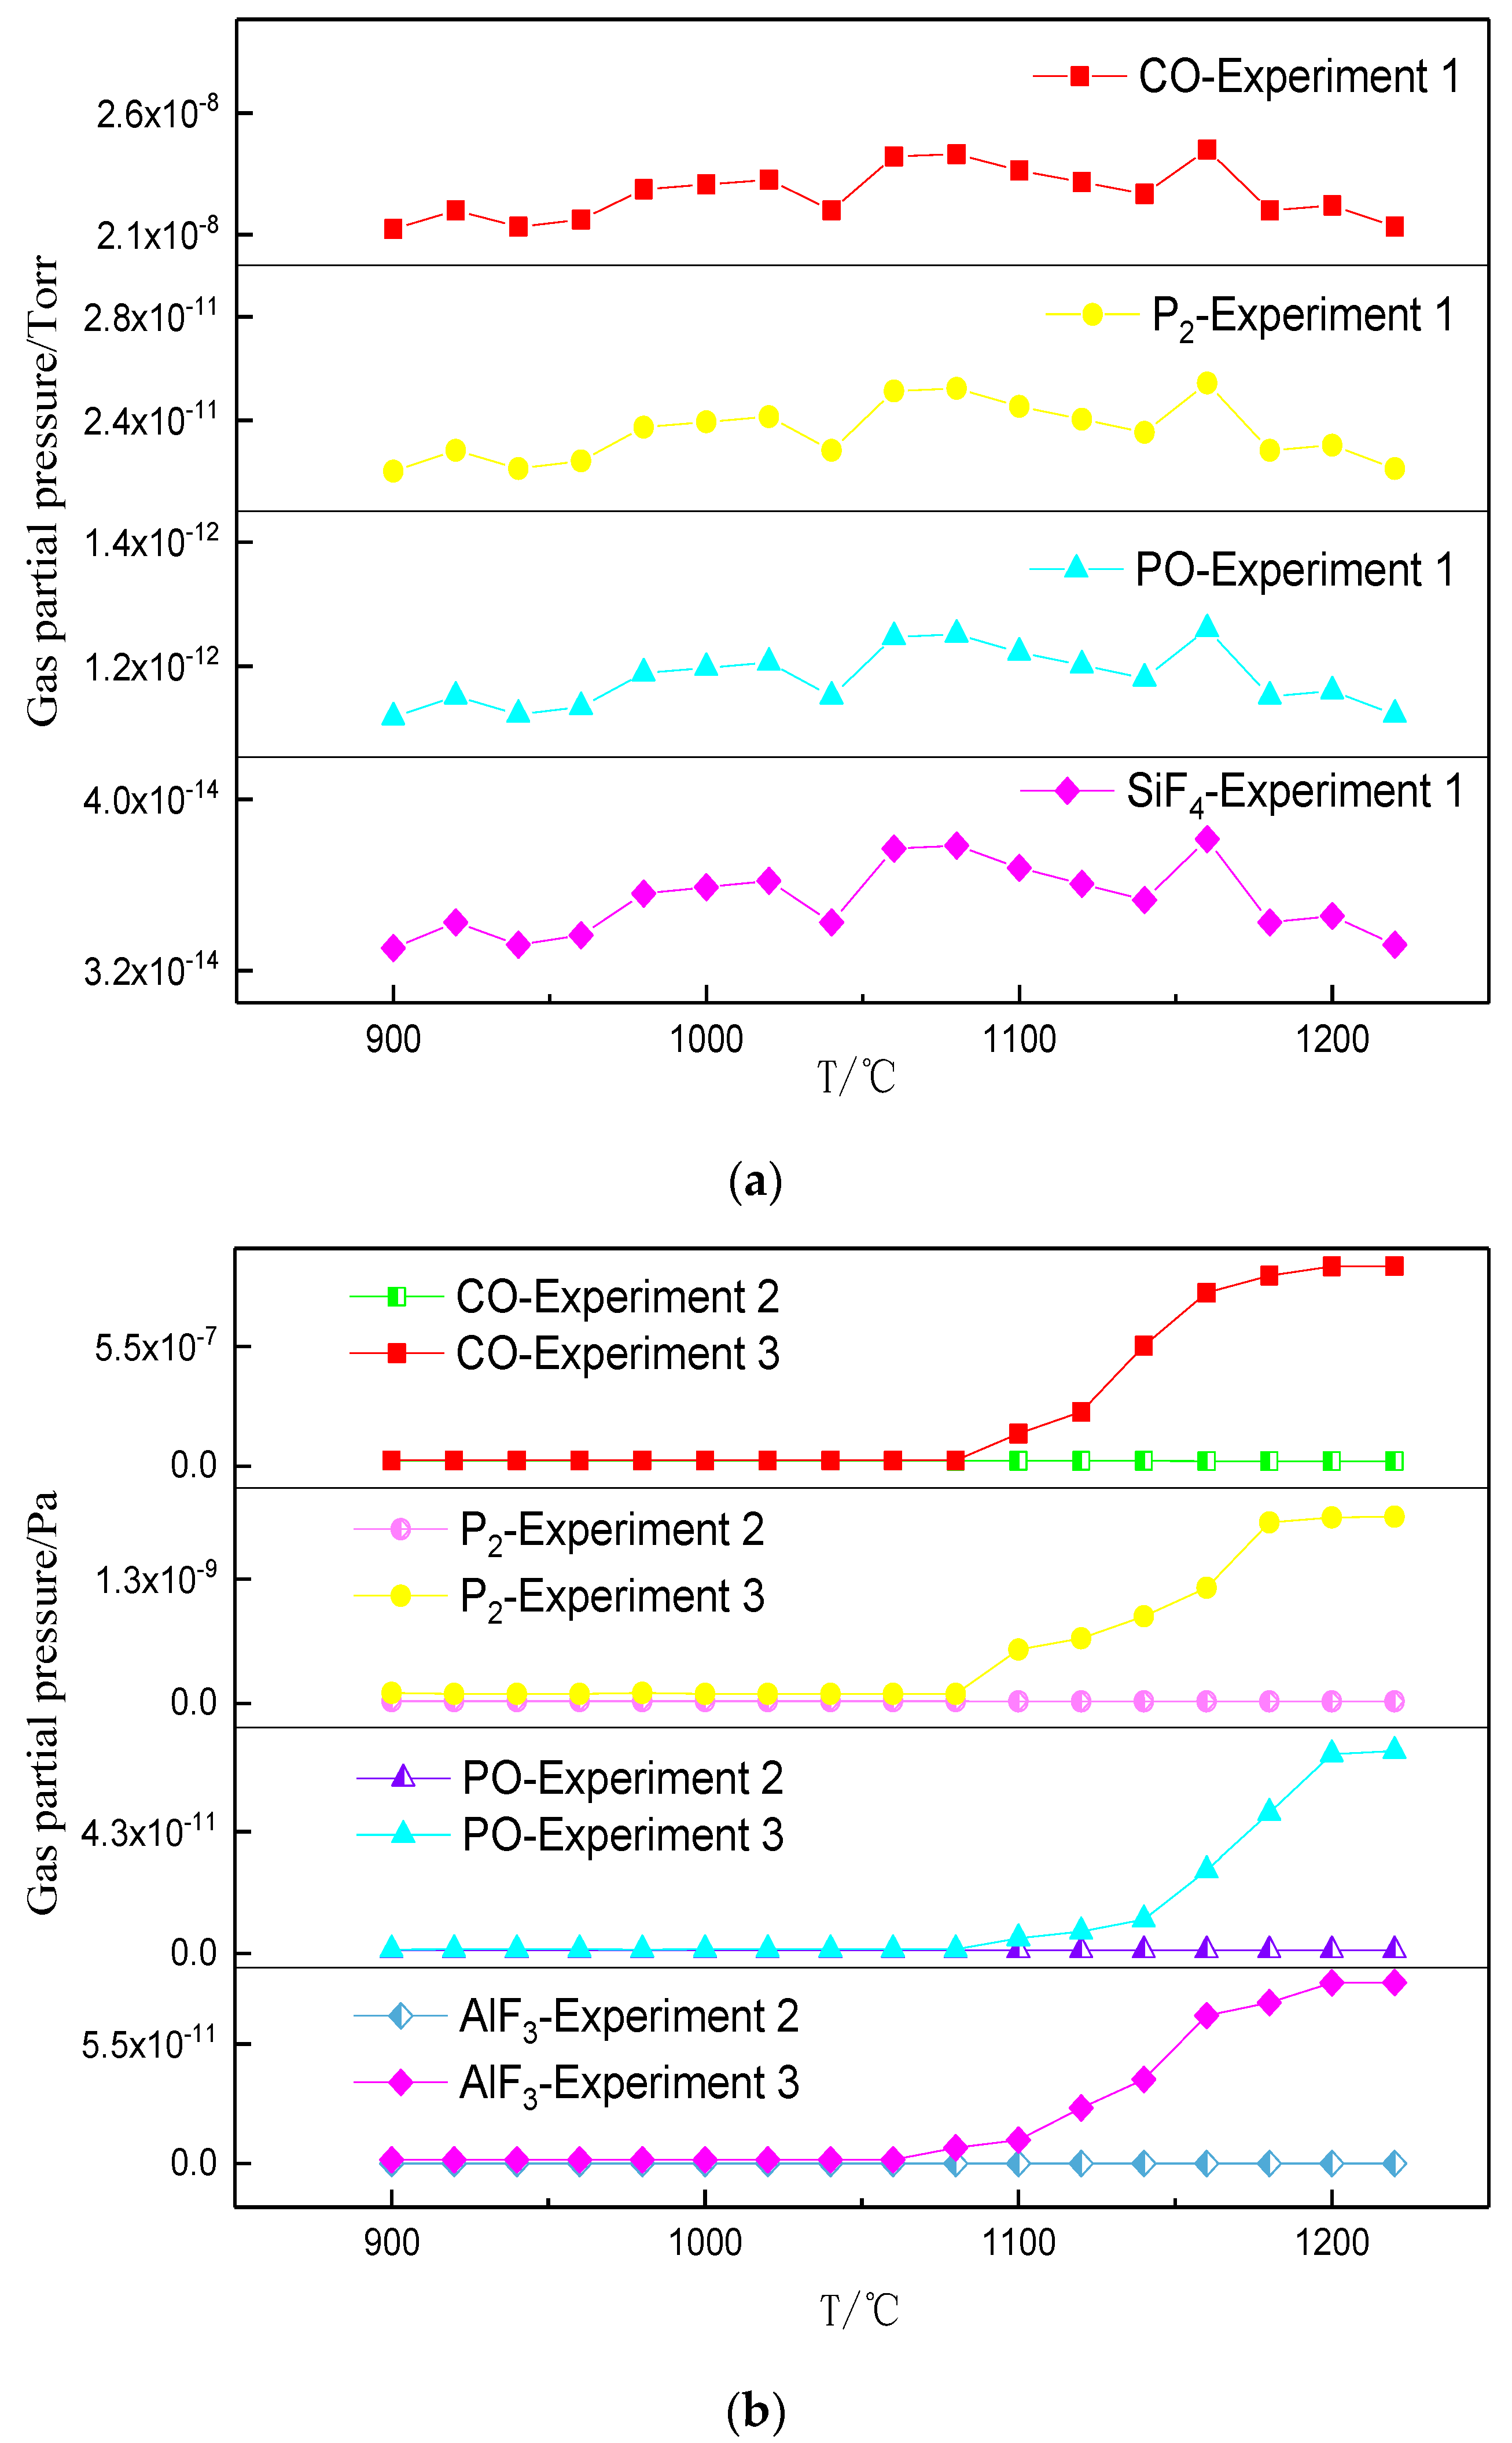
3.2. Phosphorus Vaporization in Carbothermal Reduction under Different Conditions

From thermodynamic analysis, it is known that fluorapatite is dephosphorized by gasification. The gasification of fluorapatite has not been studied. In order to clarify the gasification process of phosphorus, the gas in the carbothermal reduction was detected by quadrupole mass spectrometry. The results are presented in Figure 8. Figure 8a presents that no gas was generated within the reduction temperature range (900–1200 °C). The result confirmed that fluorapatite was difficult to reduce when only carbon was present (experiment 1).
Figure 8b presents that when the molar ratio of Al2O3 to Ca10(PO4)6F2 was below 10.3 (experiment 2), the thermodynamic conditions of reduction were not obtained at 1200 °C. Fluorapatite was not reduced. When the molar ratio of Al2O3 to Ca10(PO4)6F2 exceeded 10.3 (experiment 3), CO was generated at approximately 1100 °C. This meant that fluorapatite was reduced. Phosphorus was volatilized in the form of P2 and PO, but the amount of P2 was higher compared to PO. AlF3 gas was also detected. The reaction equation is presented as Equation (8). As the temperature increased, the amount of phosphorous gas constantly increased. The limiting factor of the reaction at this time was the temperature. When the temperature increased beyond 1150 °C, the phosphorus gas was generated slower. The limiting factor of the reaction at this time was the number of reactants. Additional amounts of Al2O3 reduced the melting point of the system, improving its mass transfer conditions. Fluorapatite was reduced at a lower temperature. During the reduction, fluorapatite was defluorinated to form AlF3 gas, which improved the thermodynamic conditions of the reaction.
Figure 8c presents that PO, P2, CO, and SiF4 gases were detected when the molar ratio of SiO2 to Ca10(PO4)6F2 was higher than 10.5 (experiment 5) and the temperature exceeded 1000 °C. The reaction equation is presented as Equation (11). There was no gas generation detected when a low amount of SiO2 (molar ratio of SiO2/Ca10(PO4)6F2 < 10.5) was added (experiment 4), indicating that fluorapatite was not substantially reduced. The contact area with fluorapatite increased, and the melting point of the gangue phase decreased to form a liquid phase when the SiO2 amount was sufficient, which improved the diffusion conditions. When the molar ratio of SiO2 to Ca10(PO4)6F2 exceeded 10.5, fluorapatite was defluorinated to produce SiF4 and Ca3(PO4)2, which were more easily reduced. The thermodynamic conditions of dephosphorization of fluorapatite were optimized, and the dephosphorization temperature was reduced.
Through the thermodynamic calculation results’ comparison of reaction Equations (1)–(4), it was found that the C/O molar ratio had a high effect on the dephosphorization of fluorapatite. The effect of C/O on the dephosphorization of fluorapatite was studied through experiments 6 and 7. Figure 9 presents that when the amount of carbon was sufficient (experiment 6; C/O = 1), fluorapatite was reduced at 980 °C. The reduced phosphorus was primarily volatilized in the form of P2. When the carbon amount was insufficient (experiment 7; C/O < 1), fluorapatite was reduced beyond 1080 °C. The reduced phosphorus was primarily volatilized as PO. This was consistent with the above thermodynamic calculations. When an adequate amount carbon was present, fluorapatite came into closer contact with carbon, which provided good reduction conditions for fluorapatite. The dephosphorization of fluorapatite was accompanied by electron transfer, while the conditions favoring electron transfer were provided by the sufficient amount of carbon, which allowed P5+ to obtain enough electrons to form P2. When the carbon amount was insufficient, the number of electrons was not sufficient to be supplied to P5+ to form P2. Consequently, the dephosphorization product was phosphorus oxide.
Figure 10 presents the results of the quadrupole mass spectrometry detection following the addition of Fe2O3 during the carbothermal reduction (experiment 8). It was discovered that when the temperature exceeded 950 °C, CO was generated, which indicated that Fe2O3 began to be reduced. P2 was generated beyond 1050 °C as the temperature increased. At this point, fluorapatite began to be dephosphorized. The reduction order of the iron oxide was Fe2O3 → Fe3O4 → FeO → Fe. The generated iron was wrapped on the surface of fluorapatite, and P2 was easily absorbed by the iron phase, which presented an uneven distribution. The phosphorus distribution in the iron phase following a carbothermal reduction is depicted in Figure 11. The corresponding reaction is given as Equation (21). As the temperature increased, liquid iron was gradually formed. The mass transfer kinetic conditions were improved by liquid iron. The unreacted graphite particles were adhered to the fluorapatite surface, while the contact area of graphite and fluorapatite increased, which prompted the dephosphorization of fluorapatite. Adversely, when the temperature exceeded 1150 °C, the amount of volatilized P2 began to decrease, which may have been caused by the increase in liquid iron and the high amount of P2 entering the iron phase. In order to prevent liquid iron from inhibiting phosphorus to enter the iron phase, the reduction temperature should be reduced.
Fe(s) + P2(g) = Fe3P(s)
Figure 12 presents the gas formation during the carbothermal reduction when three gangue oxides were added. It was observed that the CO, P2, PO, and SiF4 gases were generated initially at 900 °C, which indicated that fluorapatite had begun to be dephosphorized through vaporization. When Al2O3, SiO2, and Fe2O3 (experiment 9) were added, the FeO reduction product reacted with SiO2 and Al2O3 to form Fe2SiO4 and FeAl2O4. Fe2SiO4 is a low-melting-point material; it combined with SiO2 to form Fe2SiO4.SiO2 with a lower melting point, resulting in the pellets melting. A high amount of Fe–Si–Al gangue phase was formed to improve the mass transfer kinetics conditions. This resulted in a further decrease in the dephosphorization temperature of fluorapatite.
When the temperature was below 1000 °C, only a low amount of fluorapatite was dephosphorized, and less phosphorus-containing gas was produced. As the temperature increased, the generated amount of phosphorus-containing gas gradually increased. The latter analysis demonstrated that the dephosphorization of fluorapatite underwent two stages. The first stage occurred during the carbothermal reduction, in which the dephosphorization of fluorapatite was promoted by SiO2 and Al2O3. Only a low amount of fluorapatite was dephosphorized at this stage, and the dephosphorization ratio was low. As the reaction progressed, high amounts of Fe2SiO4 and FeAl2O4 were formed from SiO2, Al2O3, and FeO, leading to the second phase initiation. At this stage, the reaction thermodynamics and the kinetic conditions were improved, and the dephosphorization of fluorapatite primarily occurred during this stage.

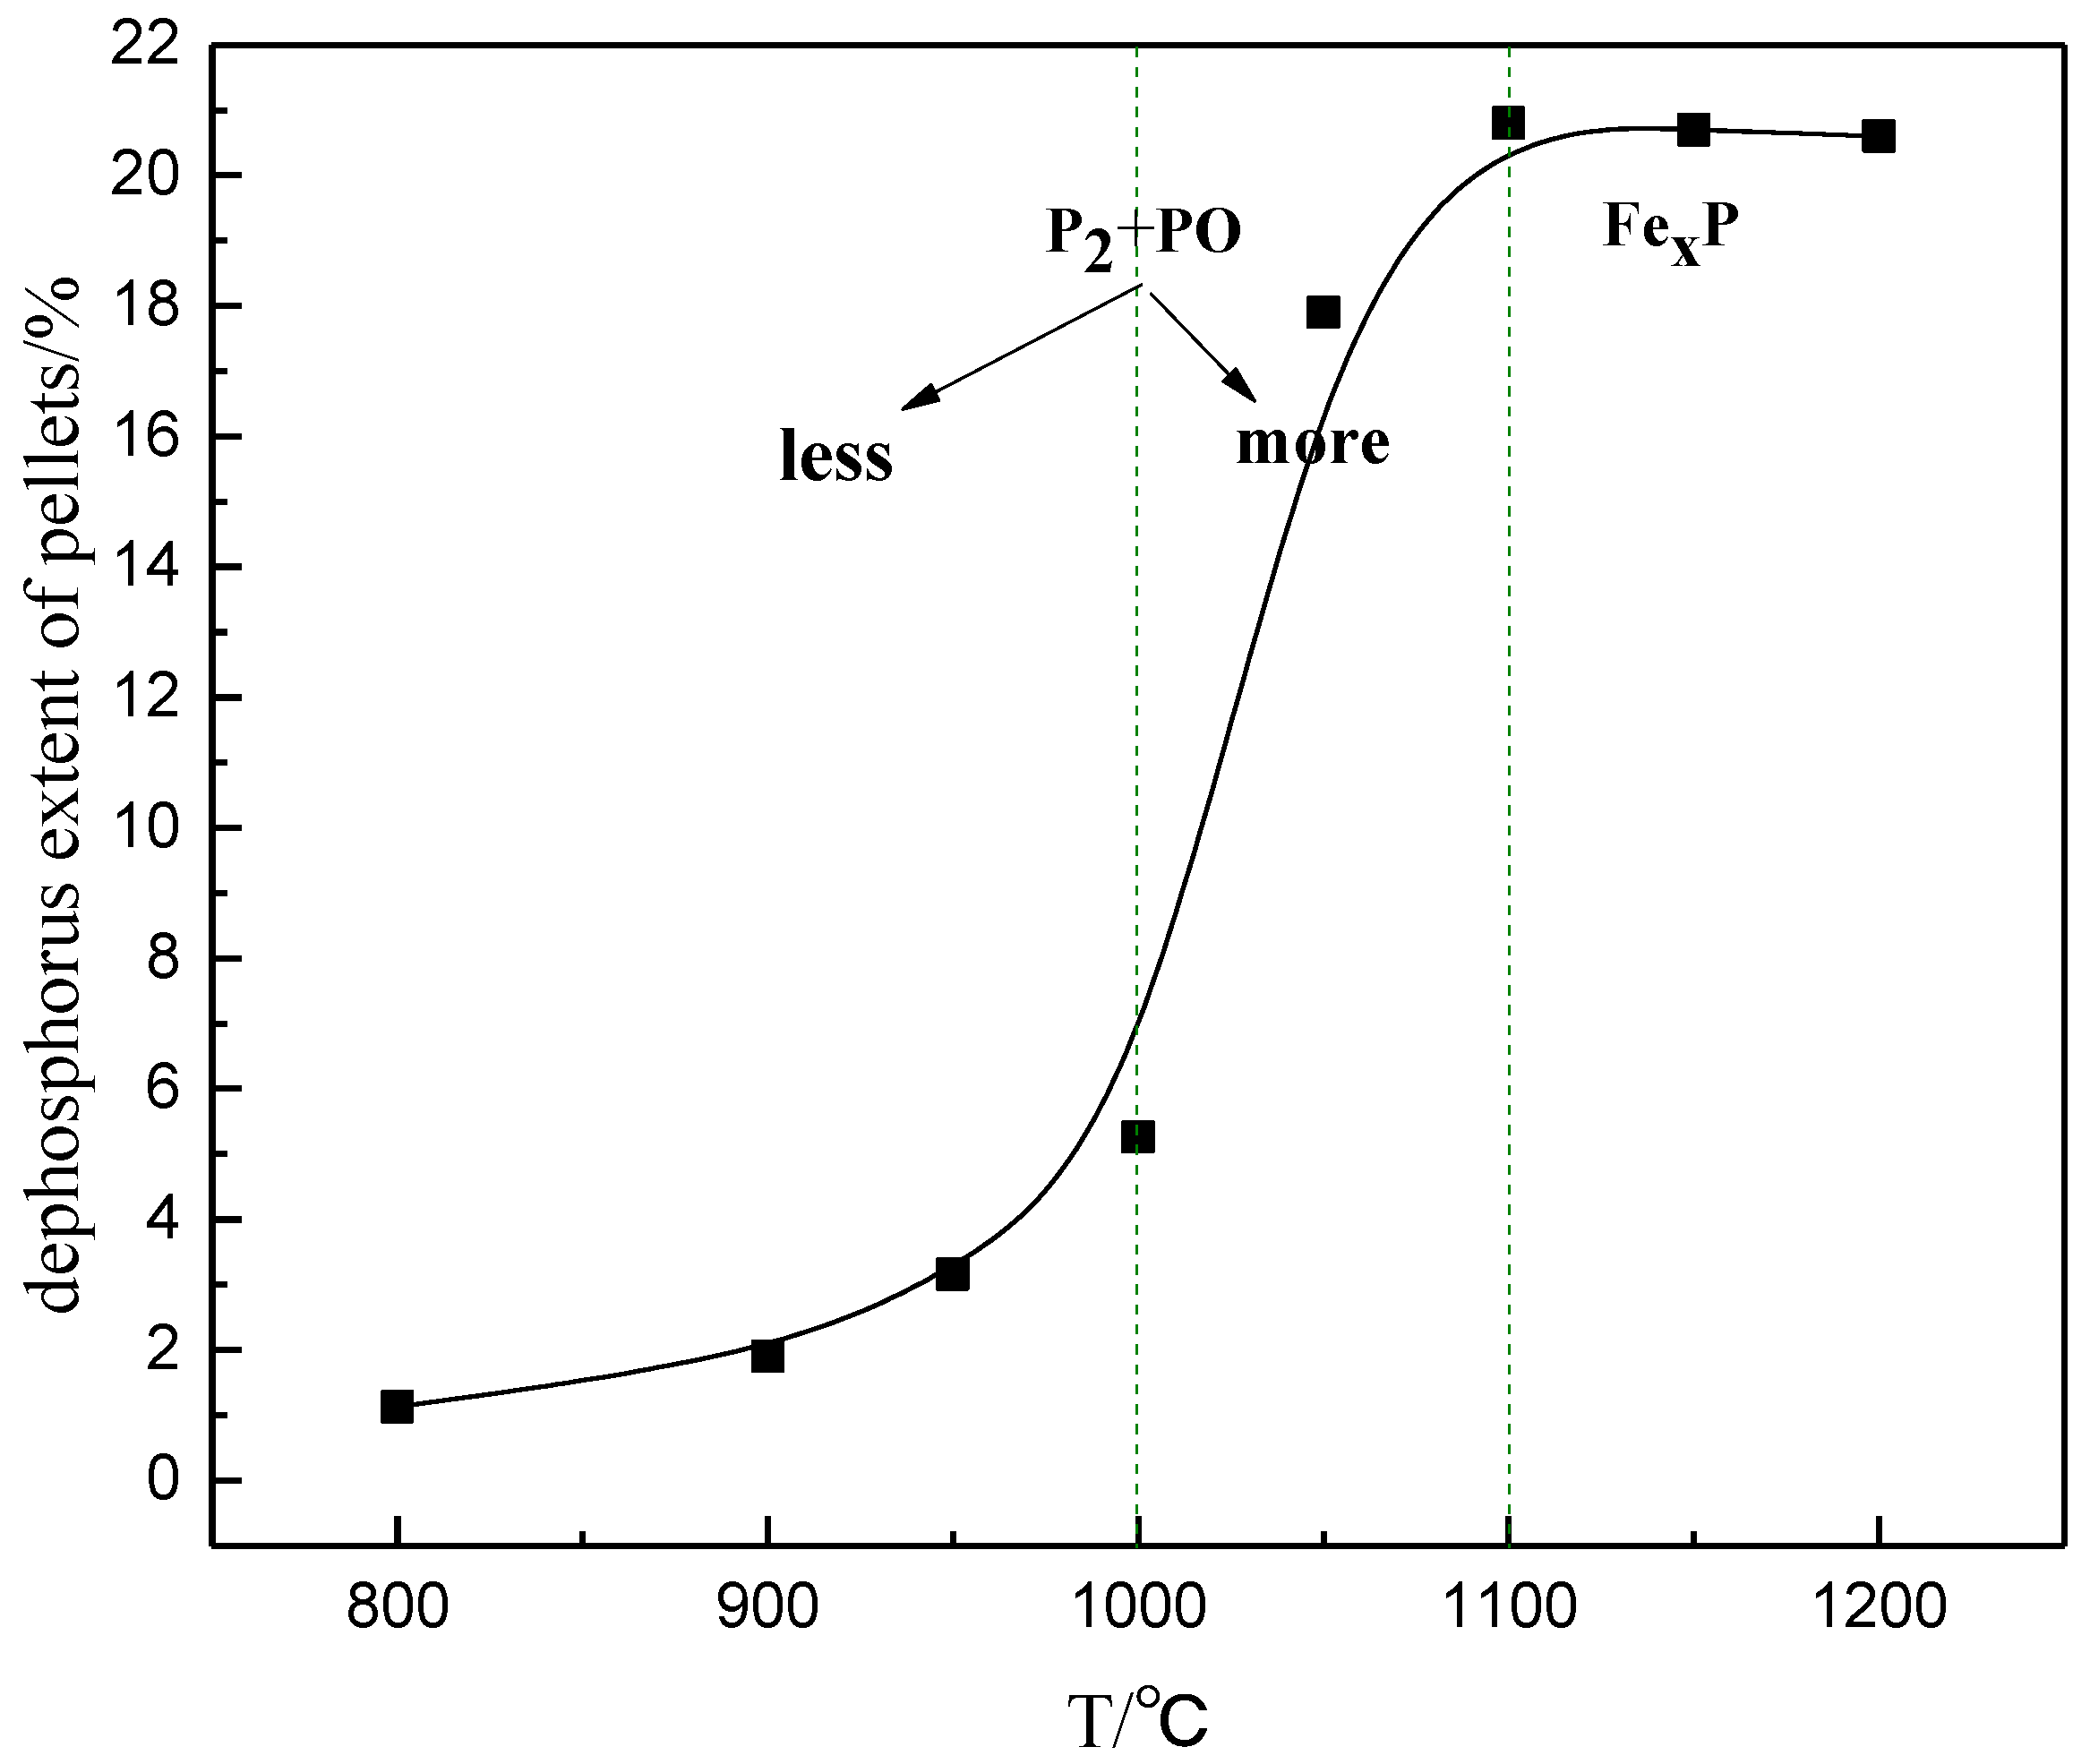
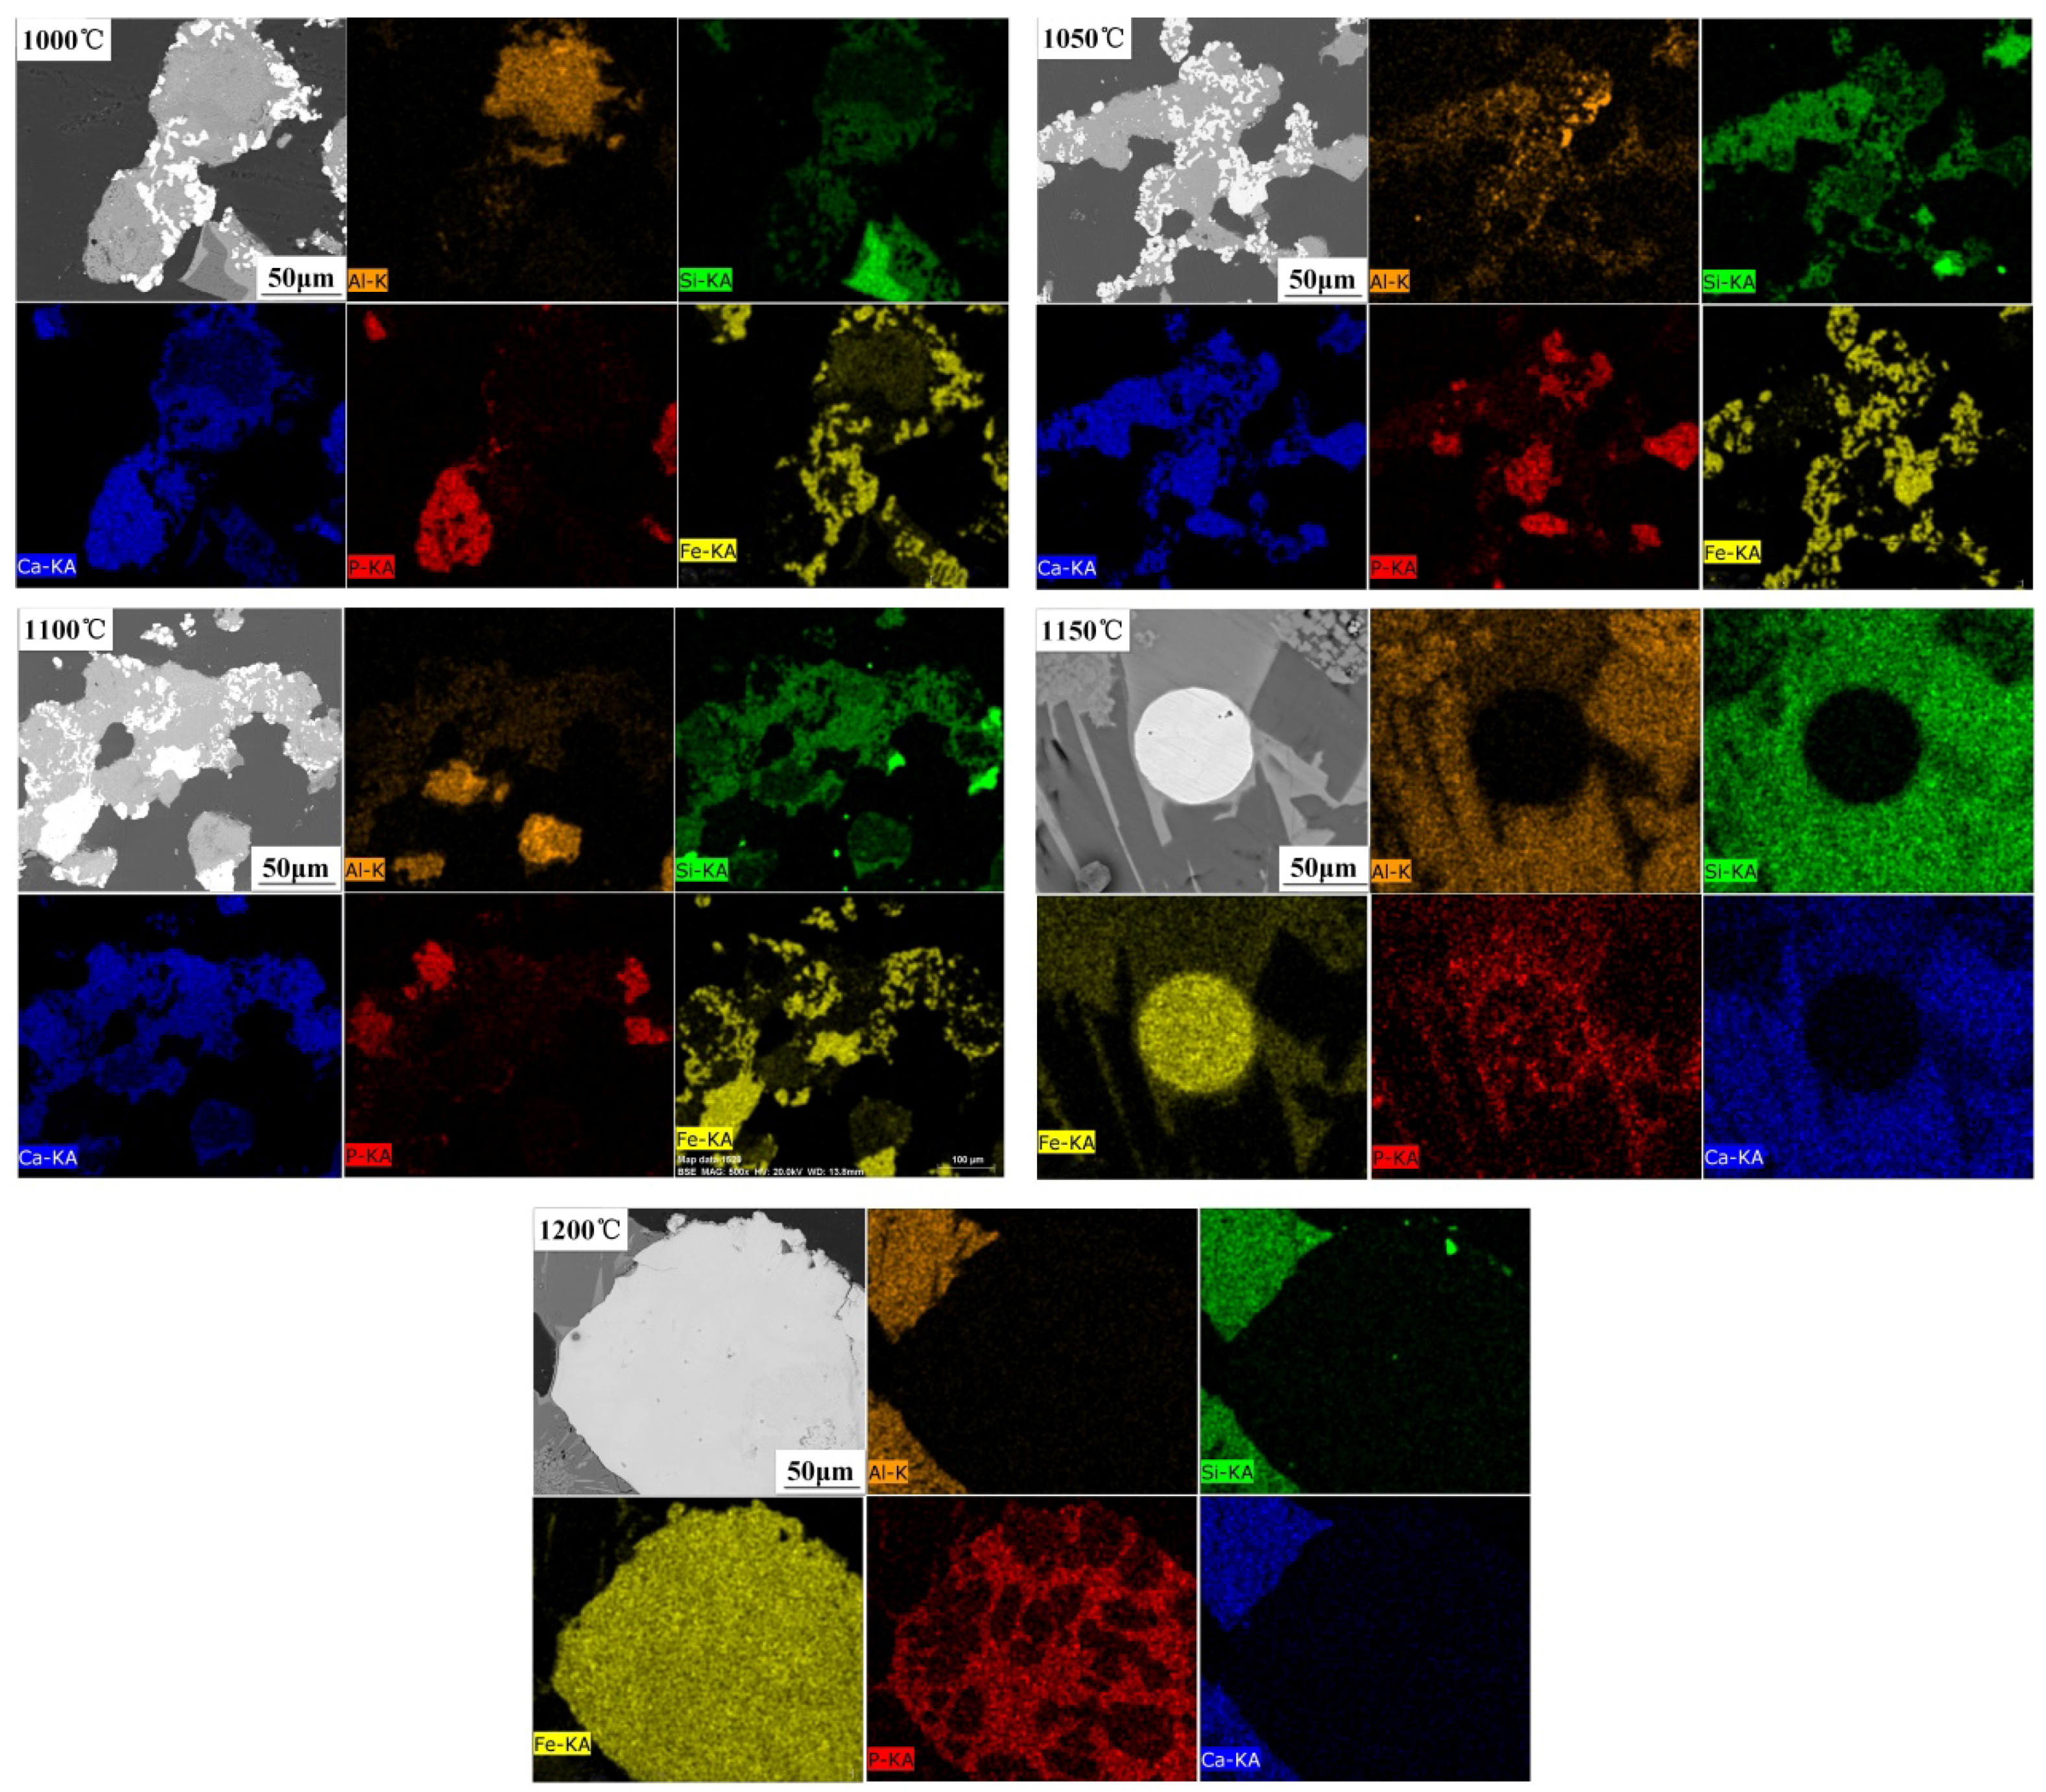
3.3. Effect of Temperature on Dephosphorization Extent and Distribution of Phosphorus in High-Phosphorus Iron Ore

The effect of gangue oxides on the dephosphorization of fluorapatite was investigated through the aforementioned experiments. When the composition of the sample was fixed, the temperature became a factor that limited the dephosphorization of fluorapatite. Consequently, the effect of temperature on the dephosphorization extent was studied. In order to study the effect of temperature on the dephosphorization of high-phosphorus iron ore, the pure substance was used to simulate the chemical composition of high-phosphorus iron ore. In order to reduce the influencing factors, the substances with a mass fraction of <1 (CaO and MgO) were ignored. The raw-material ratio is presented in Table 1 (C/O = 1). The sample was reduced at a temperature range of 800–1200 °C, and the phosphorus content of the reduced sample at different temperatures was determined through chemical analysis. Figure 13 presents the dephosphorization extent of the sample subsequent to reduction at different temperatures. The dephosphorization extent was very low in the temperature range of 800–1000 °C. When the temperature was in the range of 1000–1100 °C, the dephosphorization extent rapidly increased. Beyond 1100 °C, the dephosphorization extent was essentially unchanged or even slightly decreased. When the temperature was lower than 1100 °C, liquid iron was not formed, and the solubility of phosphorus in the solid-phase iron was low. Additionally, almost all generated P2 was volatilized. As the temperature increased, the iron phase appeared in the liquid phase. Because the solubility of phosphorus in the liquid iron was relatively high, generated P2 was absorbed by the liquid iron, resulting in the stability or even decrease of the dephosphorization extent. In the analysis, the 1000–1100 °C temperature range was considered the best period for the vaporization dephosphorization.
To further understand the migration of phosphorus, the evolution of fluorapatite at different temperatures was studied through SEM (Scanning Electron Microscope). Figure 14 presents the distribution of elements following reduction at different temperatures. At 1000 °C, the distributions of Ca and P were similar. The distributions of Ca, Si, and Al overlapped to a low degree, but no overlapping region existed between Fe and P. It was revealed that most fluorapatite particles were still intact, while a low amount of fluorapatite was dephosphorized to form a Ca–Al–Si gangue phase. The entire reduced phosphorus amount was volatilized at 1000 °C. The distributions of Fe, Si, and Al also overlapped. This was because the Al2O3 and SiO2 gangue phases reacted with iron oxides. Additionally, Fe2SiO4 and FeAl2O4 were formed on the surfaces of Al2O3 and SiO2. As the temperature increased to 1050 °C, the Ca–Al–Si gangue phase grew in size, and no overlapping region existed between Fe and P. The reduced phosphorus was still discharged as a gas, and still high amounts of FeAl2O4 and Fe2SiO4 existed. At 1100 °C, a high amount of iron was generated and gathered. Phosphorus was present around the iron phase. Adversely, phosphorus was inhibited from entering the metal iron, and no phosphorus was detected inside the metal iron. As the temperature continued to increase, the reduced iron was carburized and the metallic iron began to melt. At 1150 °C, a high amount of fluorapatite was dephosphorized, and generated P2 was rapidly absorbed by the liquid iron and consequently distributed within the iron phase in a network. At 1200 °C, the amount of liquid iron increased, the phosphorus in the iron phase increased, and the distribution tended to be uniform. In this time frame, the gangue phase was uniform CaAl2Si2O8. The study revealed that when the reduction temperature reached 1150 °C, the phosphorus started to enter the iron phase, and a reduction temperature below 1150 °C was favorable for the dephosphorization of the high-phosphorus iron ore.

4. Conclusions

In summary, in the carbothermal reduction process, fluorapatite was dephosphorized, and the dephosphorization product was mainly P2 gas. In contrast, PO was generated when the carbon amount was insufficient. All gangue oxides (Al2O3, SiO2, and Fe2O3) in the high-phosphorus iron ore promoted the dephosphorization of fluorapatite, while the promotion effect of SiO2 was the strongest. Although the P2 could be absorbed by the iron phase, this mainly occurred at high temperatures (>1150 °C). In the 1000–1100 °C range, gasification dephosphorization was possible. In future studies, the feasibility of gasification dephosphorization will be studied in detail. The results of the study are summarized as follows:
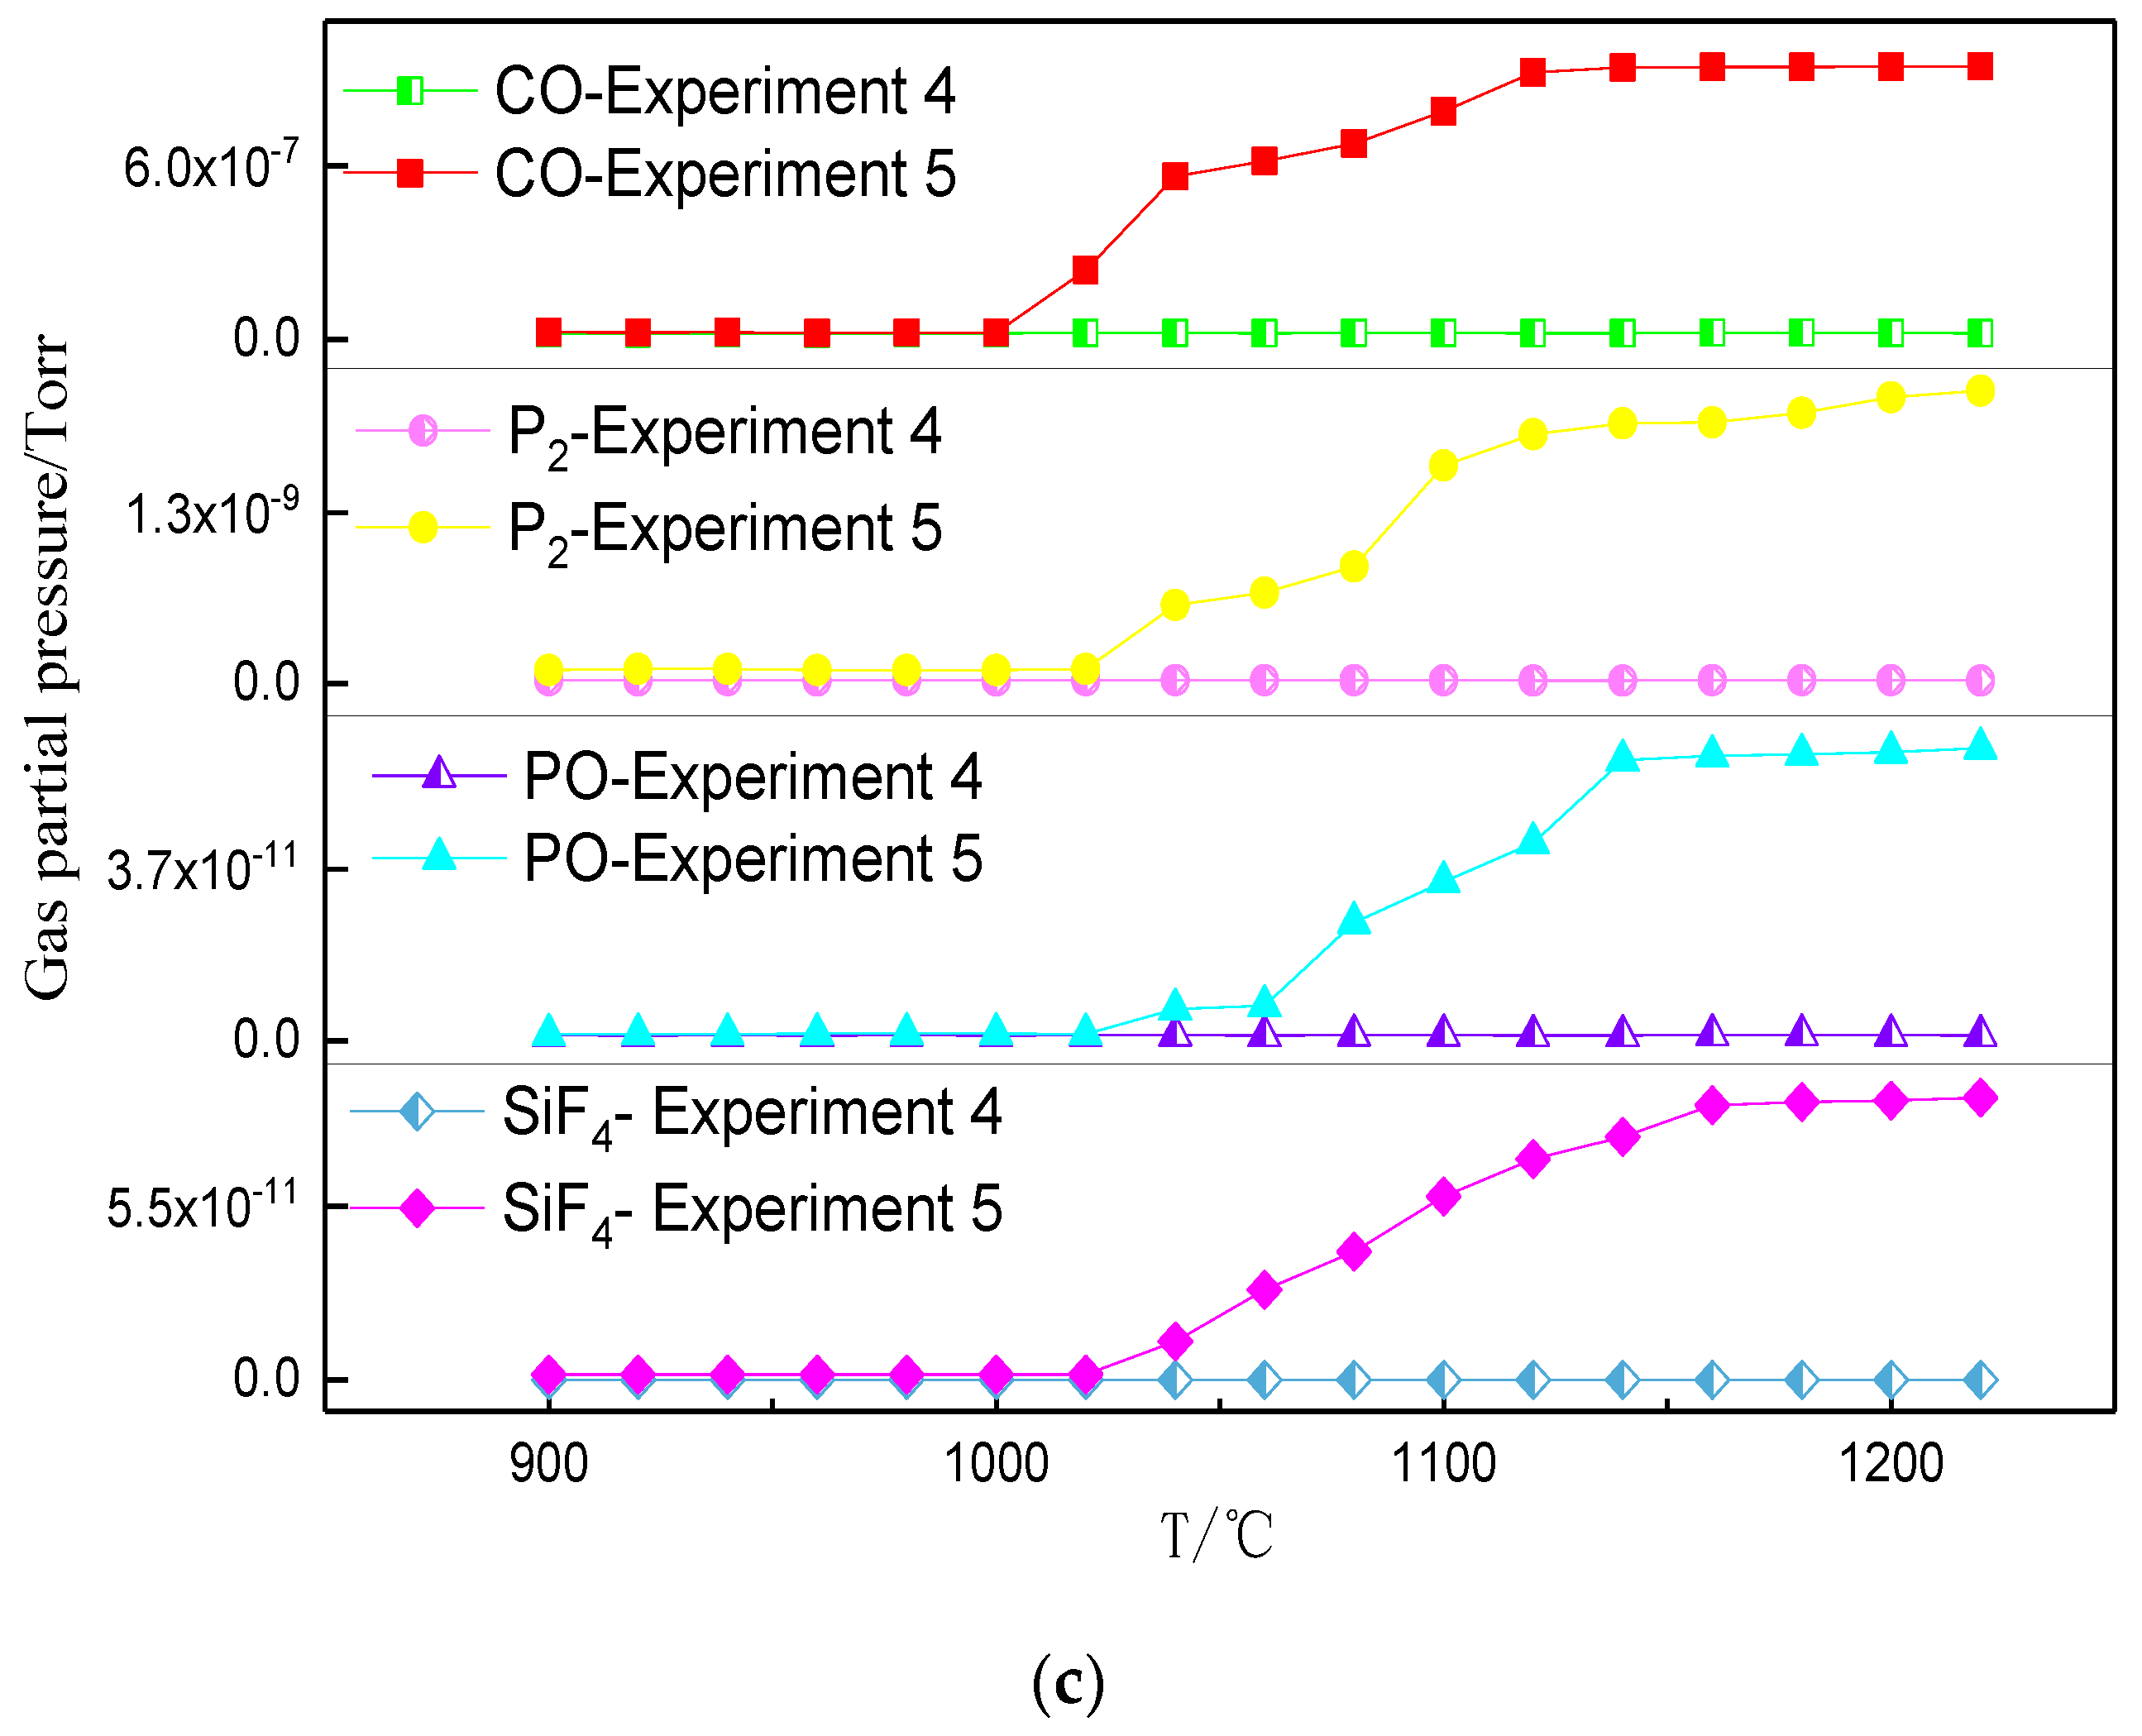
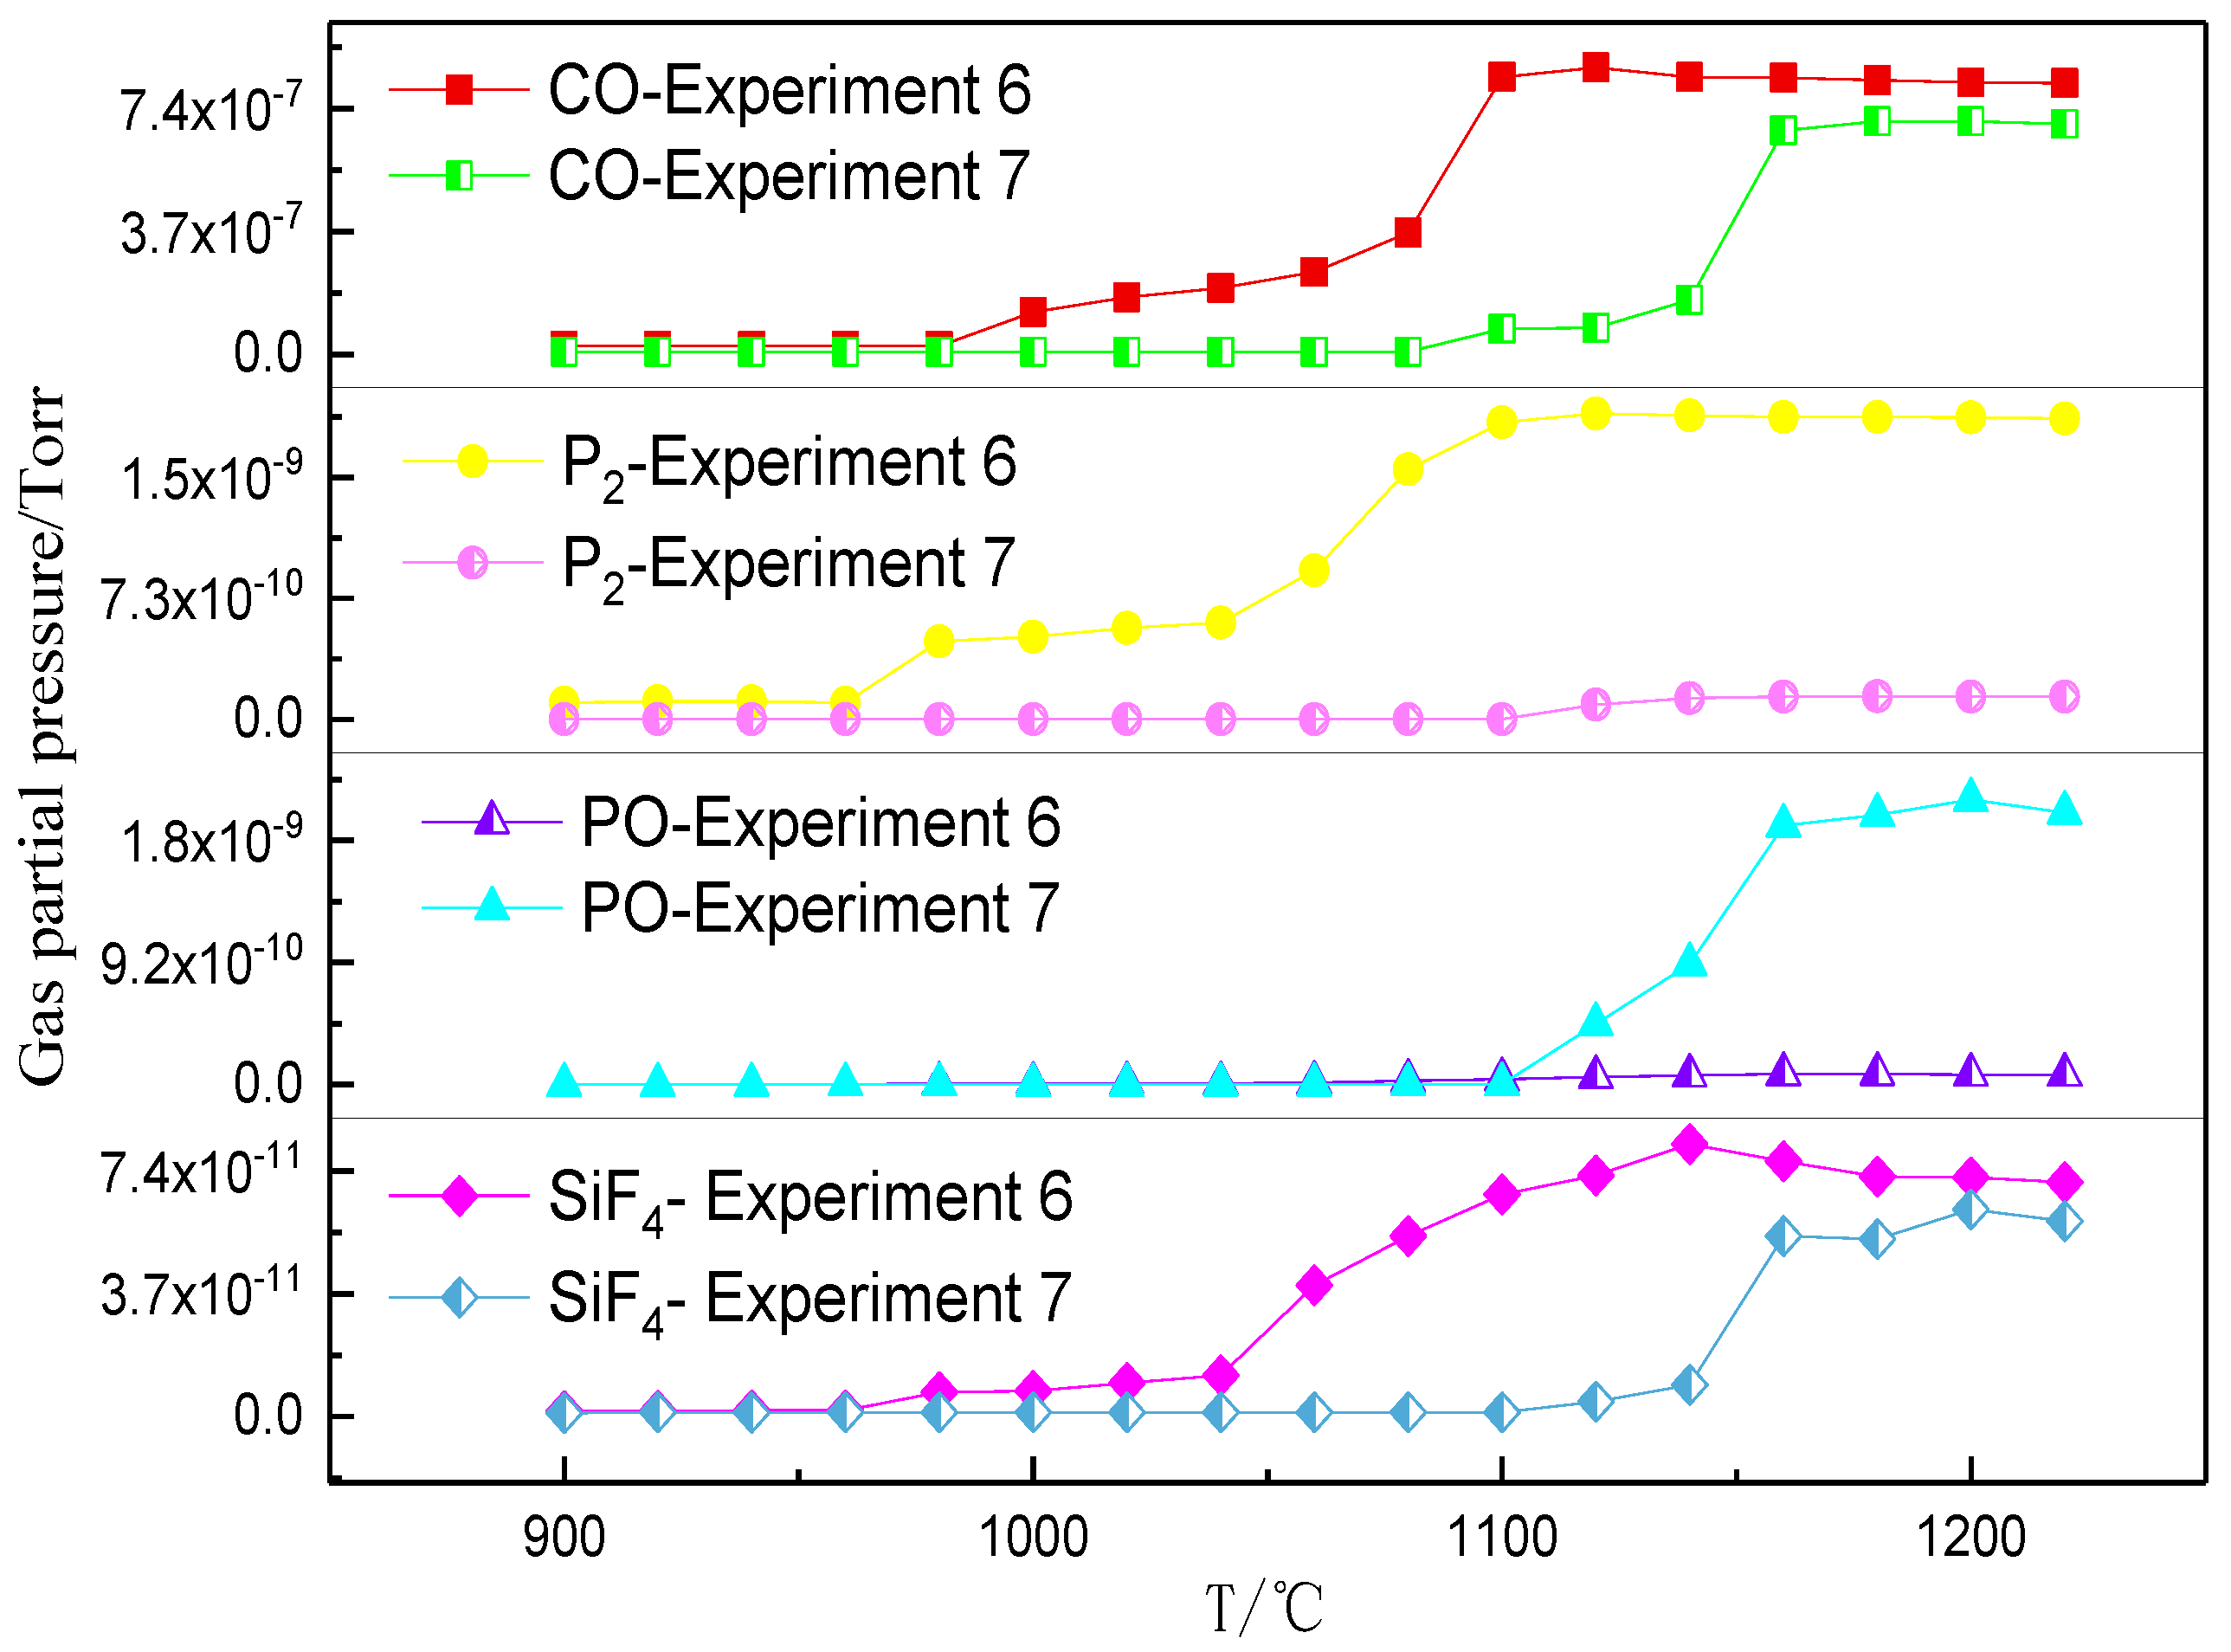
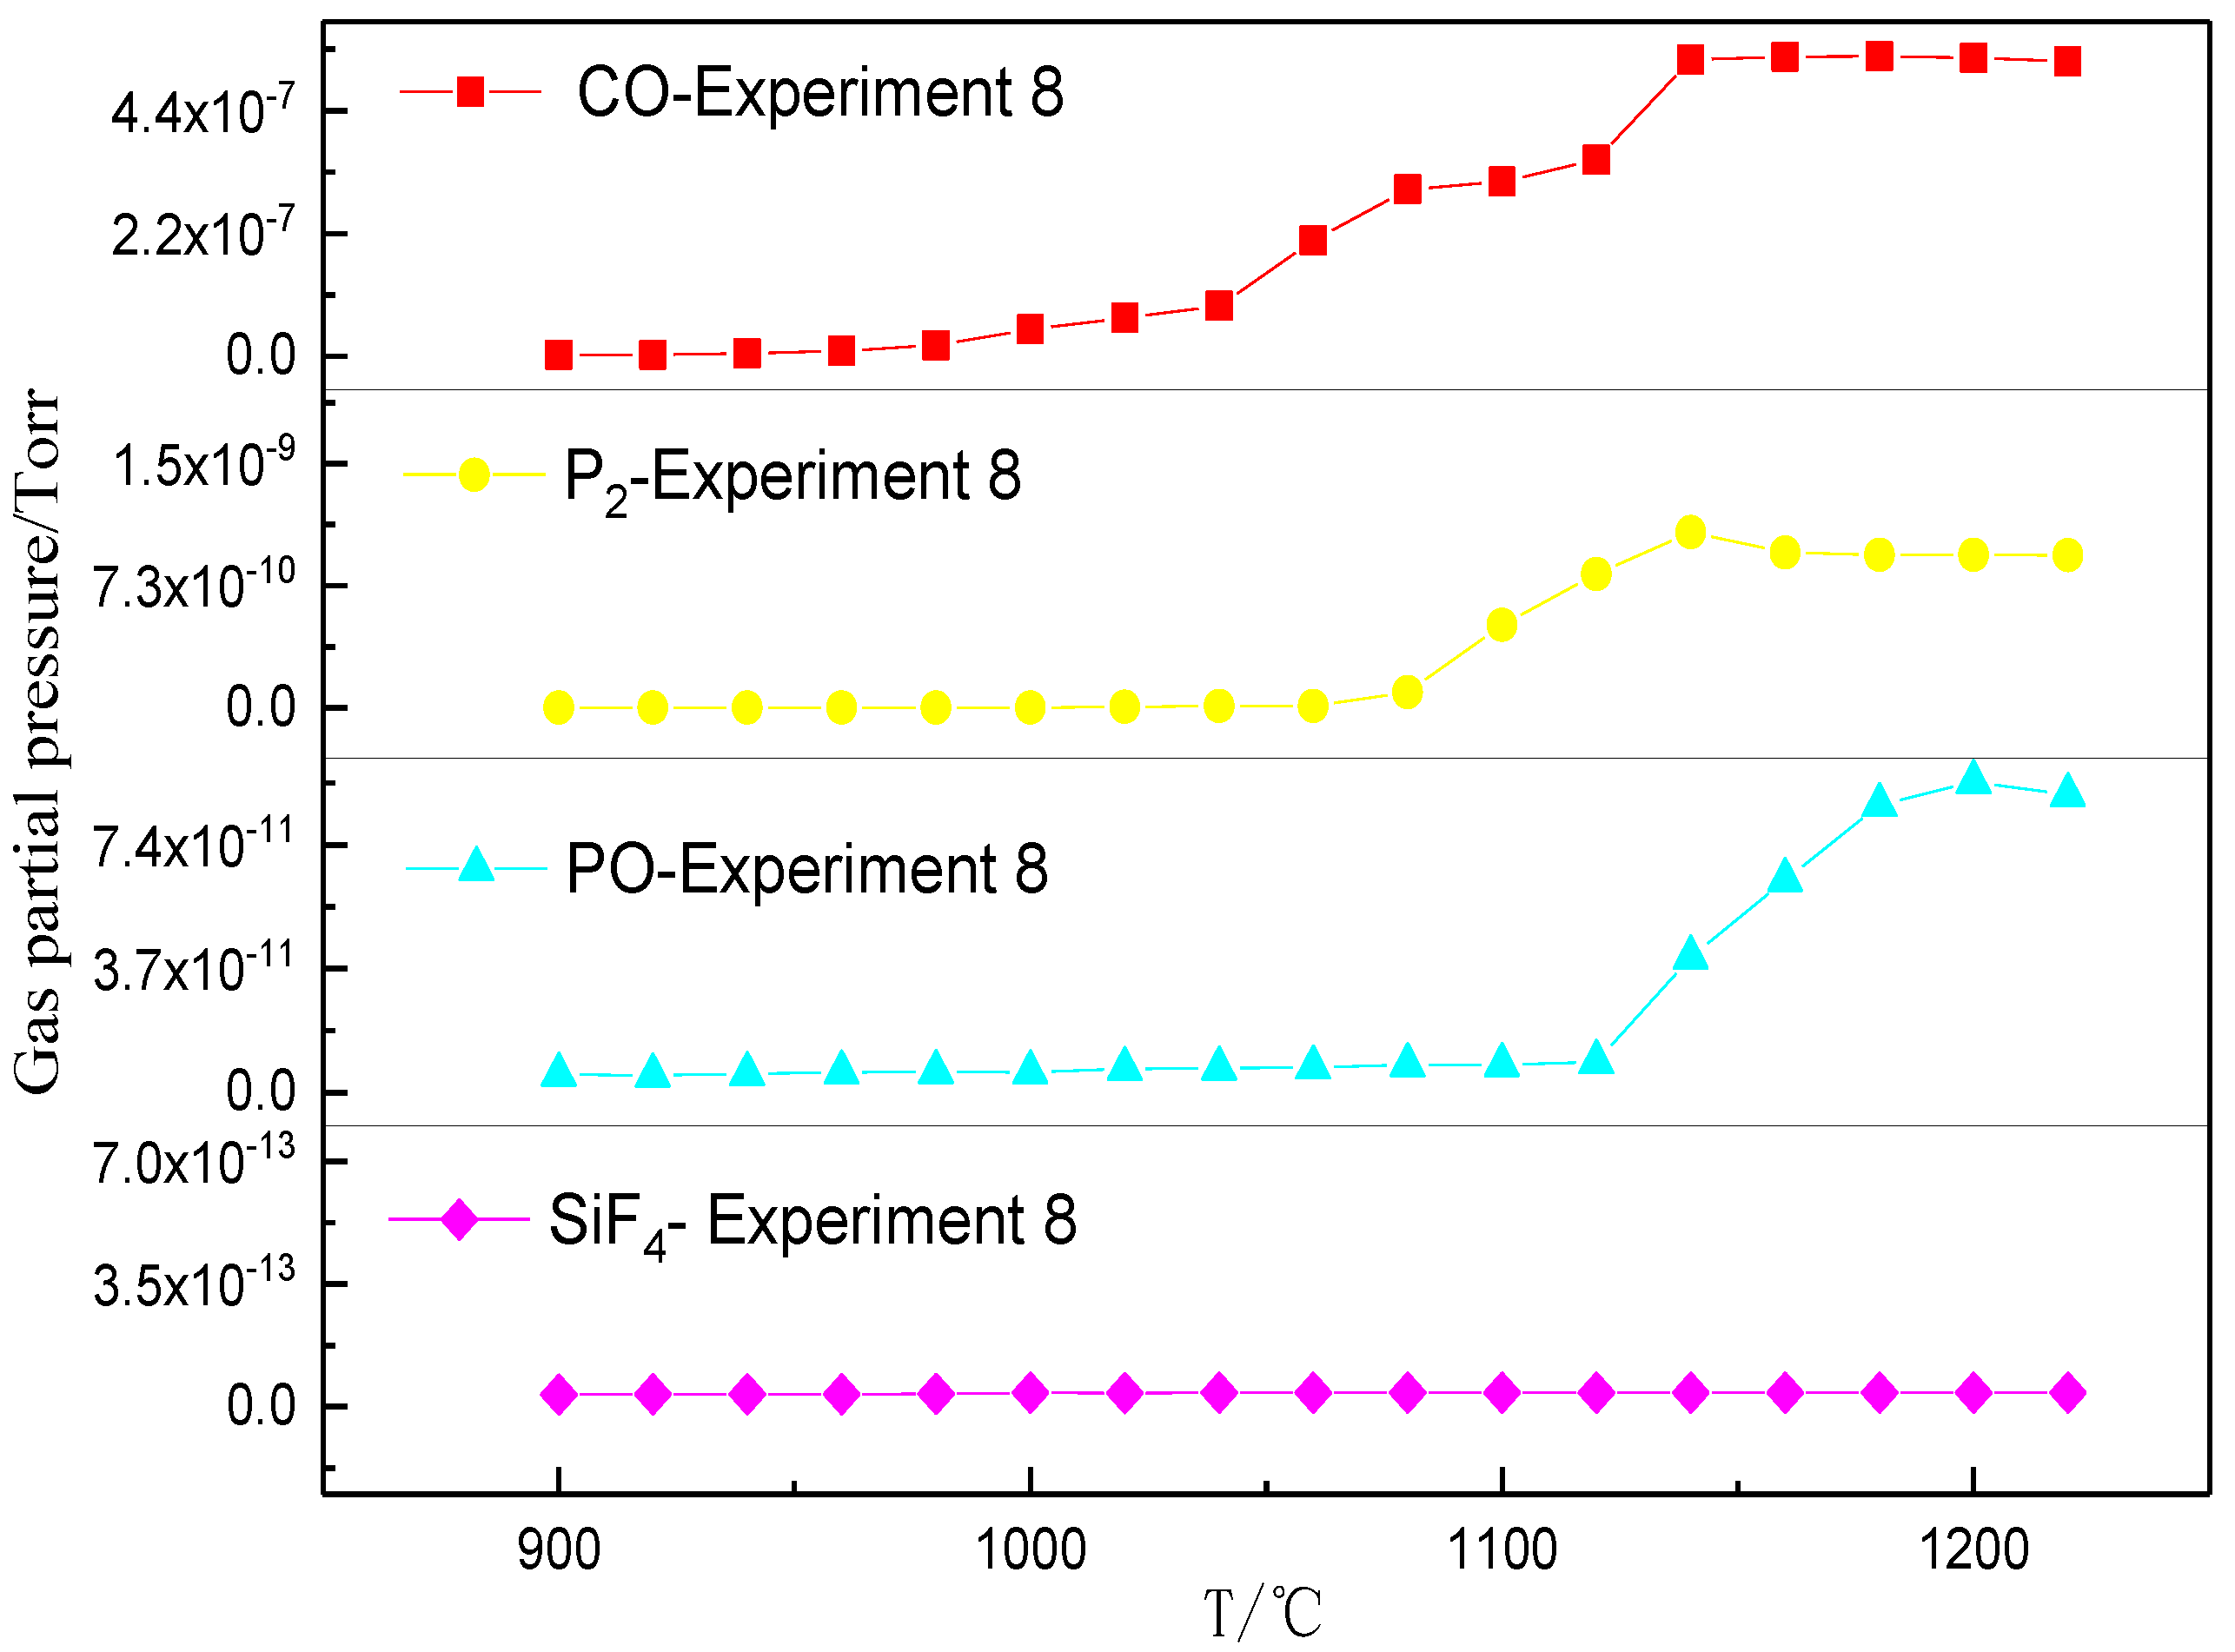
  • Without the additives’ contribution, the fluoroapatite reduction was difficult to achieve. The theoretical reduction temperature exceeded 1400 °C. When Al2O3 or SiO2 were added, the dephosphorization of fluorapatite was promoted, and the phosphorus-containing gas was generated. The effect of SiO2 was stronger compared to Al2O3. When a sufficient amount of Al2O3 or SiO2 was added, the defluorination reaction of fluorapatite occurred, which accelerated the vaporization dephosphorization of fluorapatite.
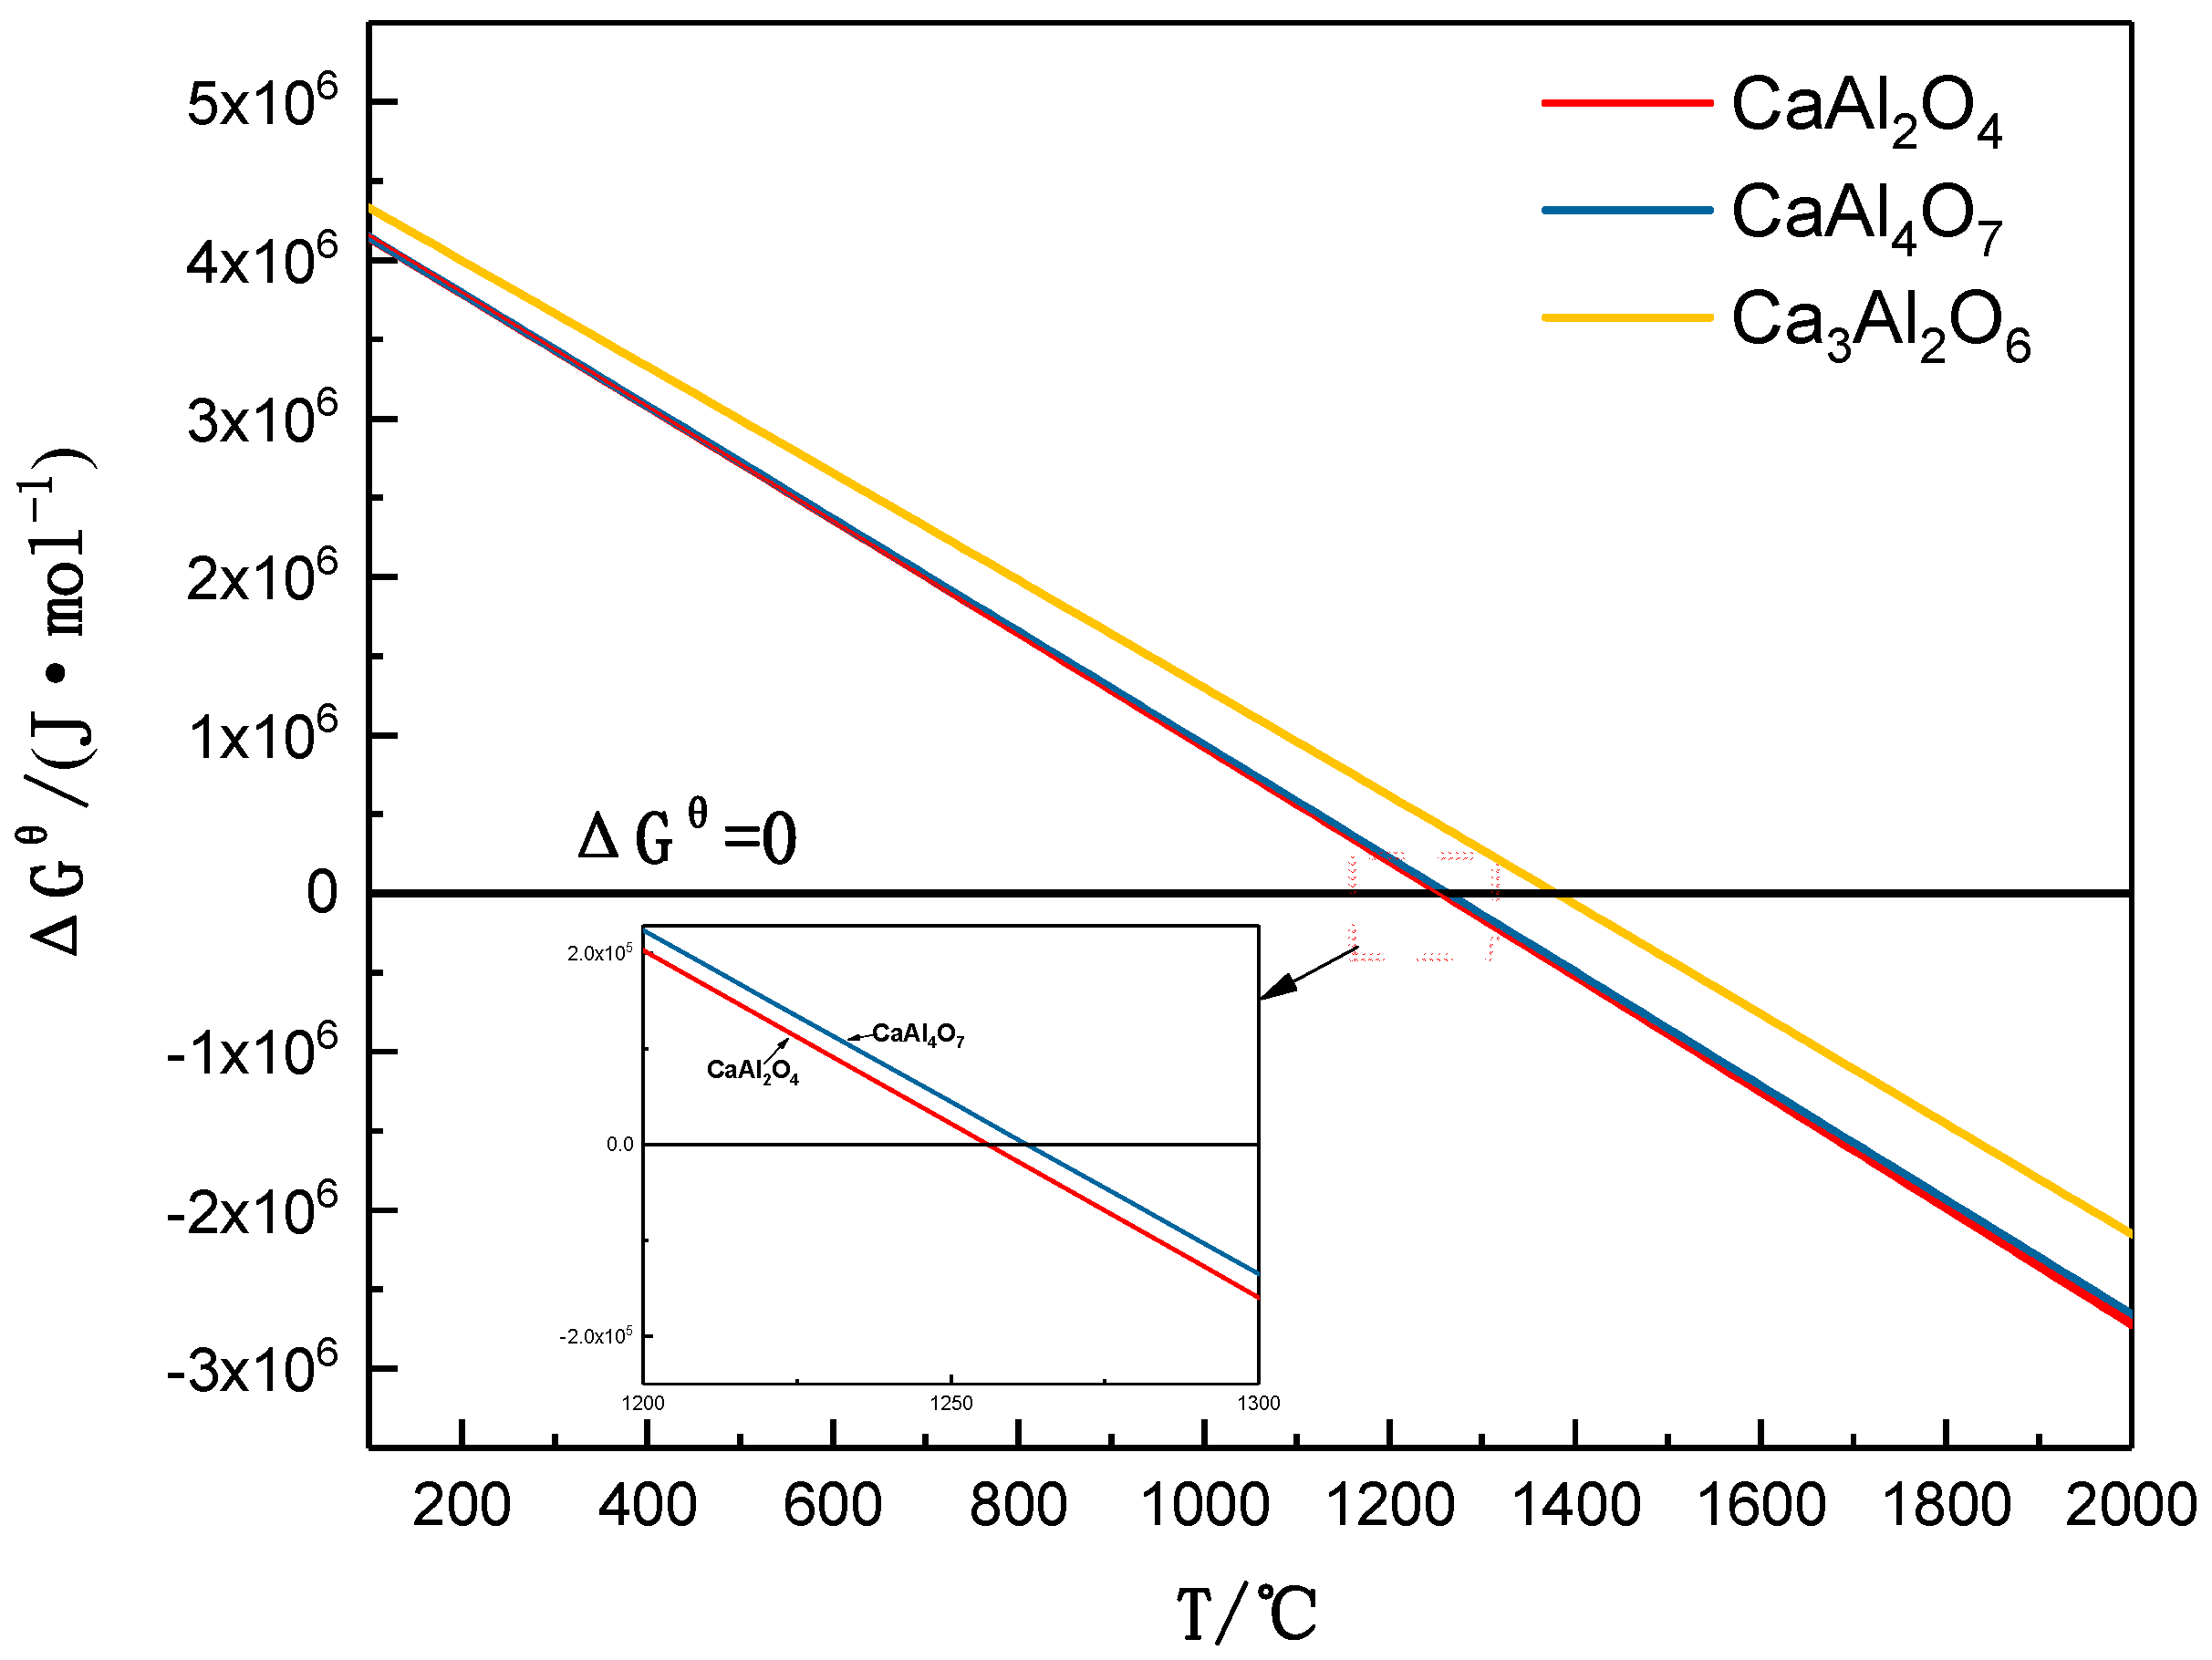
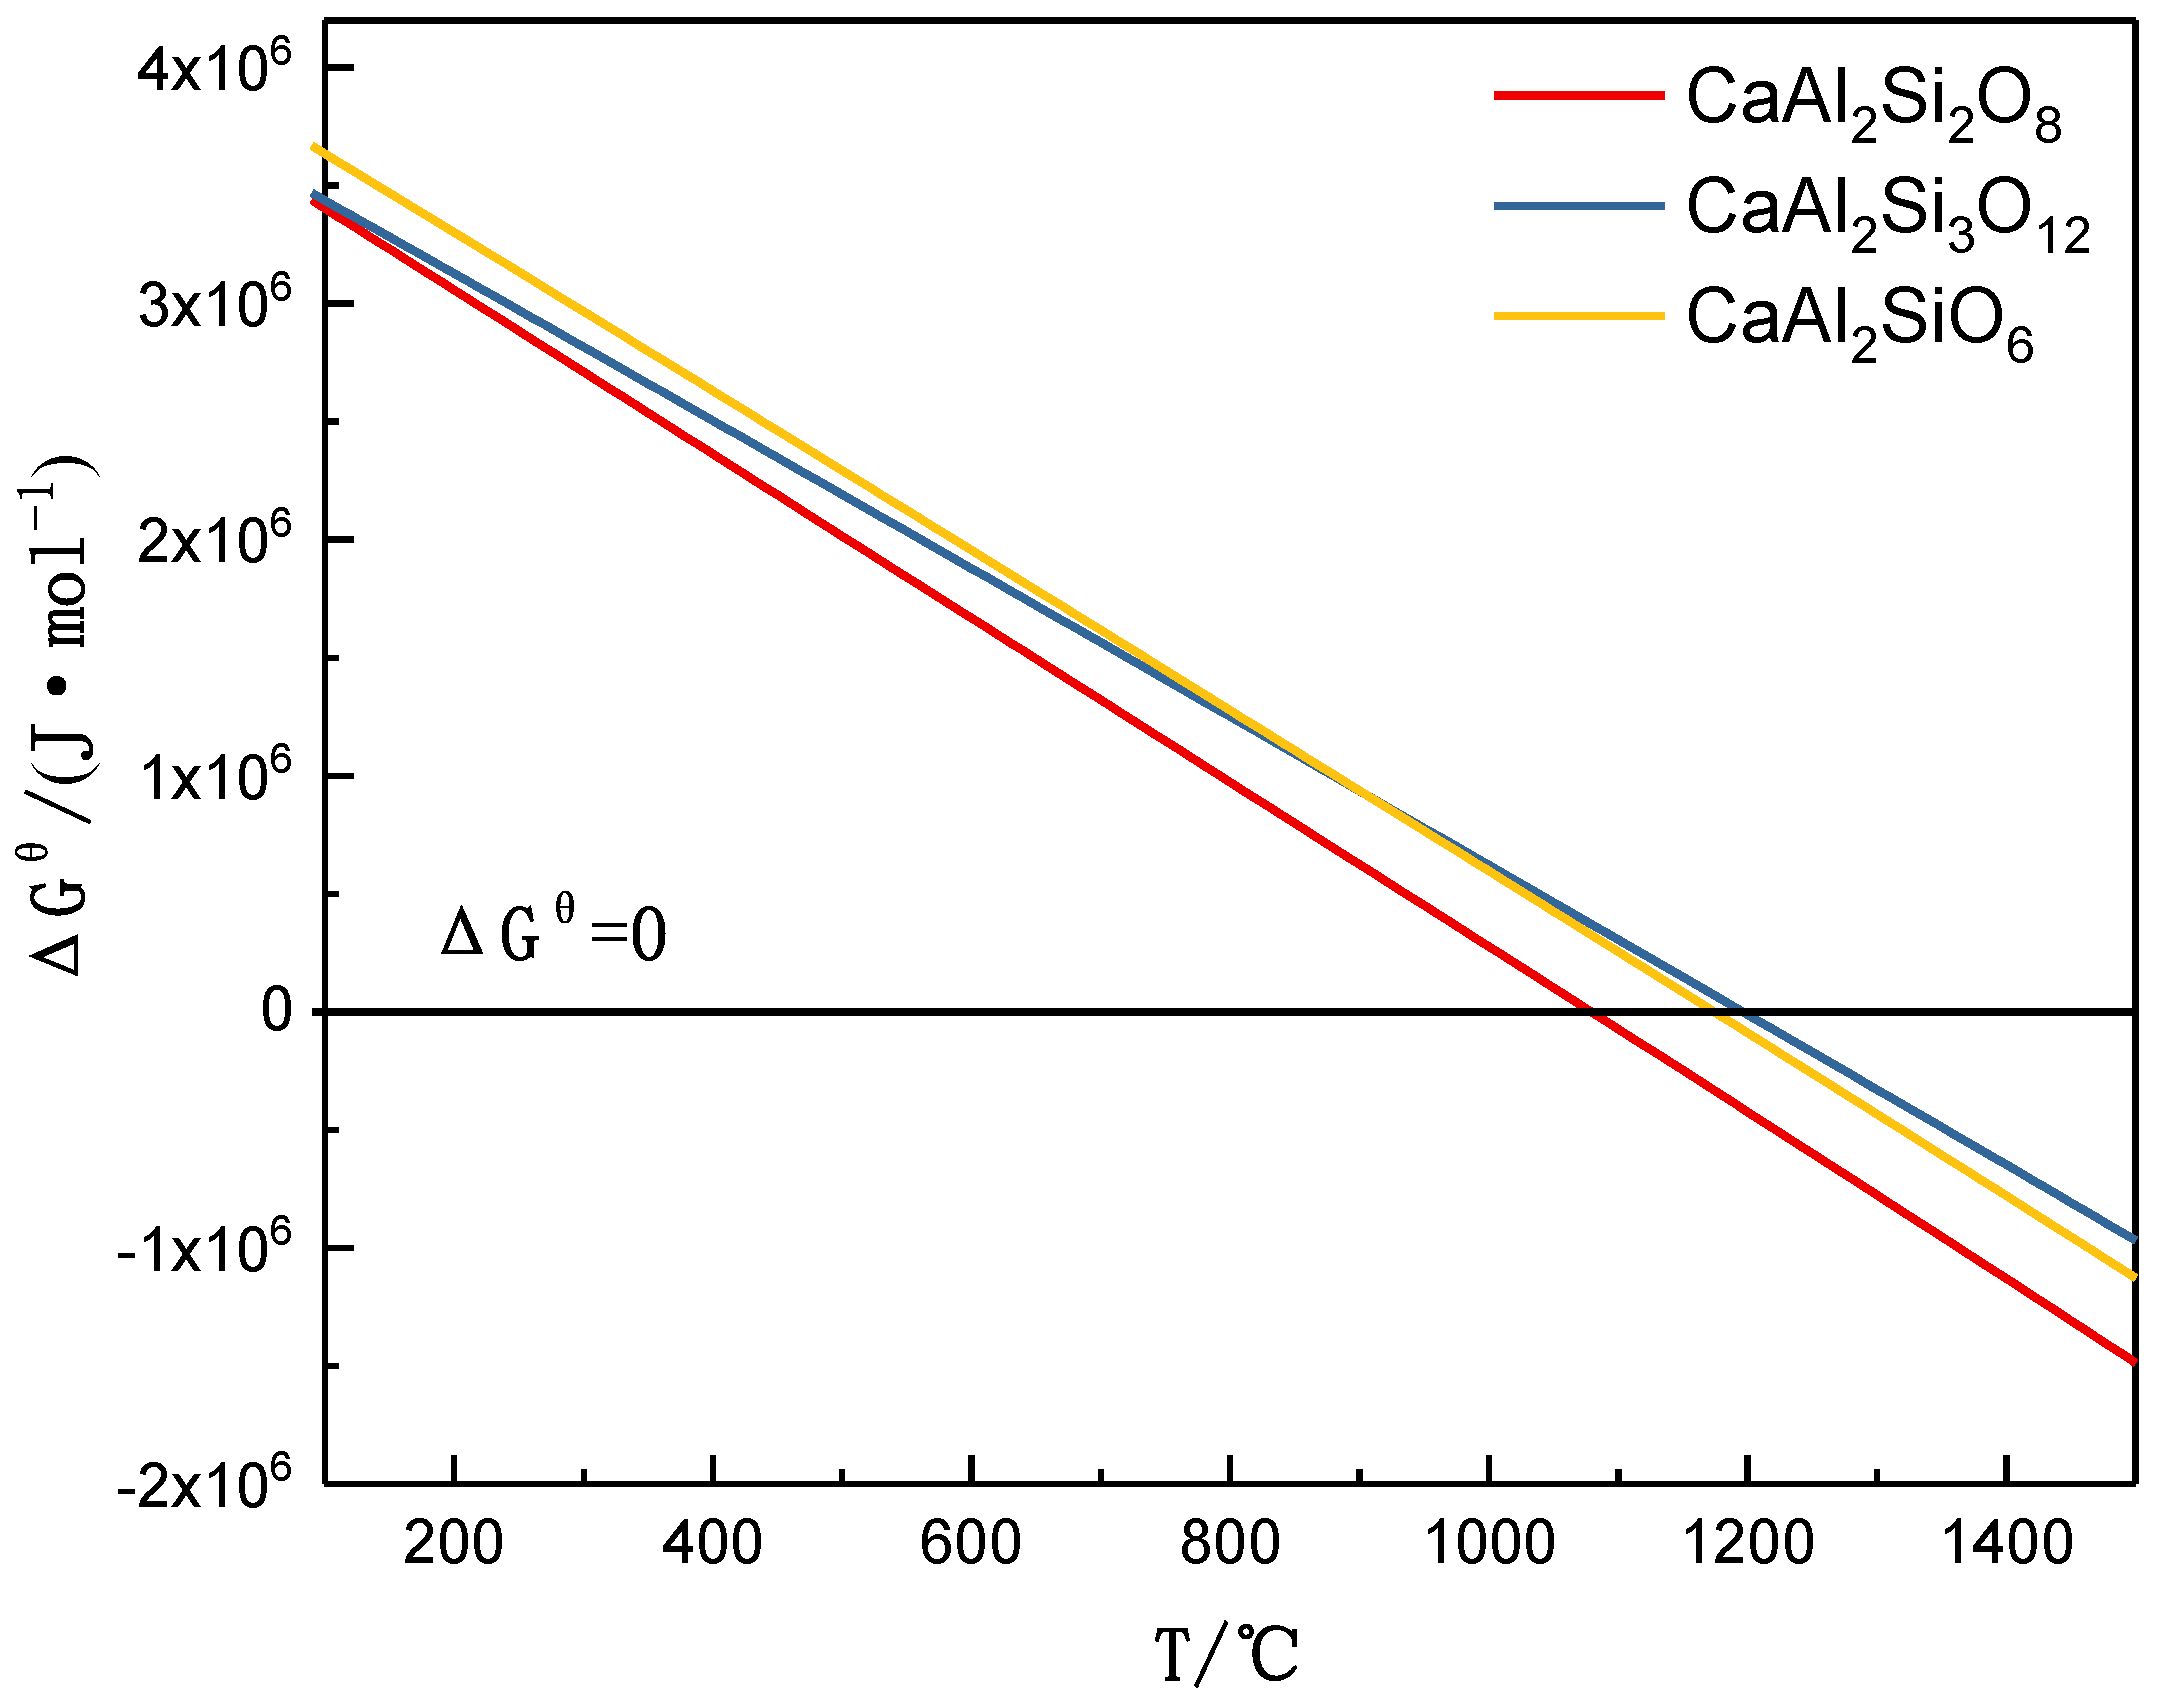
  • Fluorapatite was reduced when the molar ratio of Al2O3 to Ca10(PO4)6F2 was below 10.3 and the reduction temperature exceeded 1350 °C. Fluorapatite was reduced at 1050 °C when the molar ratio of Al2O3 to Ca10(PO4)6F2 exceeded 10.3. Fluorapatite was reduced at temperatures beyond 1250 °C when the molar ratio of SiO2 to Ca10(PO4)6F2 was below 10.5. Fluorapatite was reduced at 1019 °C when the molar ratio of SiO2 to Ca10(PO4)6F2 exceeded 10.5, which reduced the reduction temperature of fluorapatite. These results indicated that it was possible for gasification dephosphorization to occur at lower temperatures.
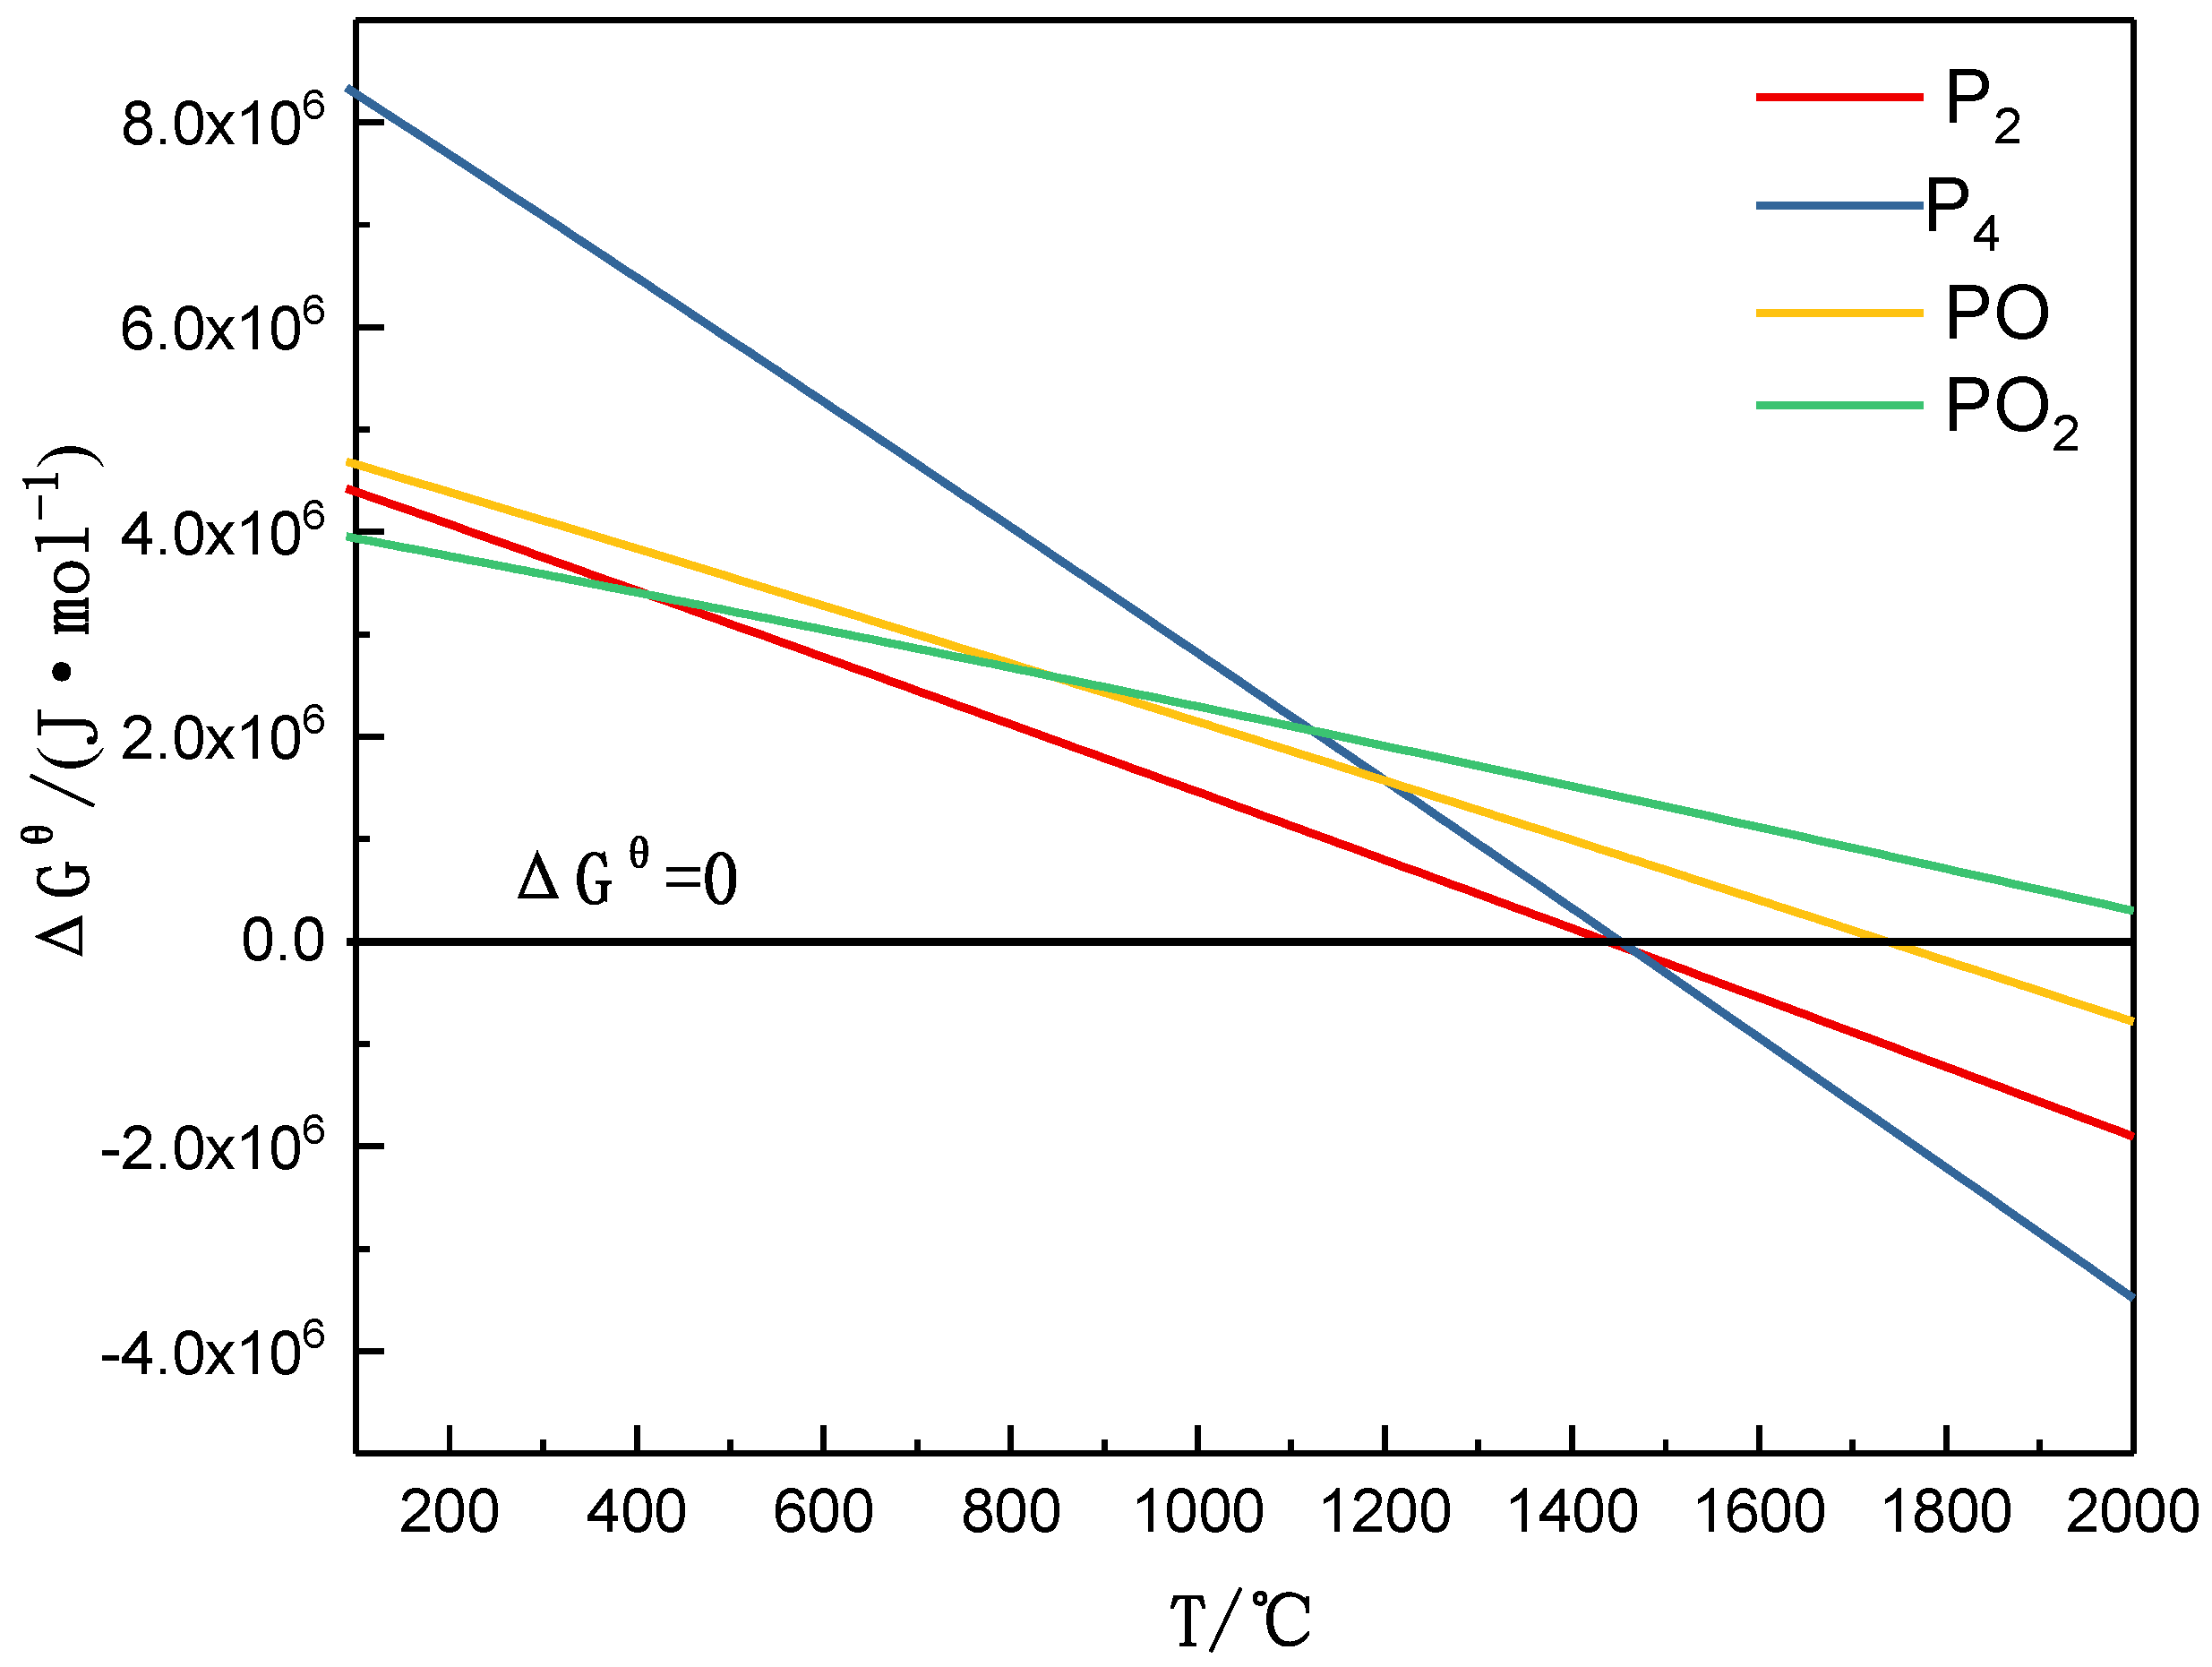
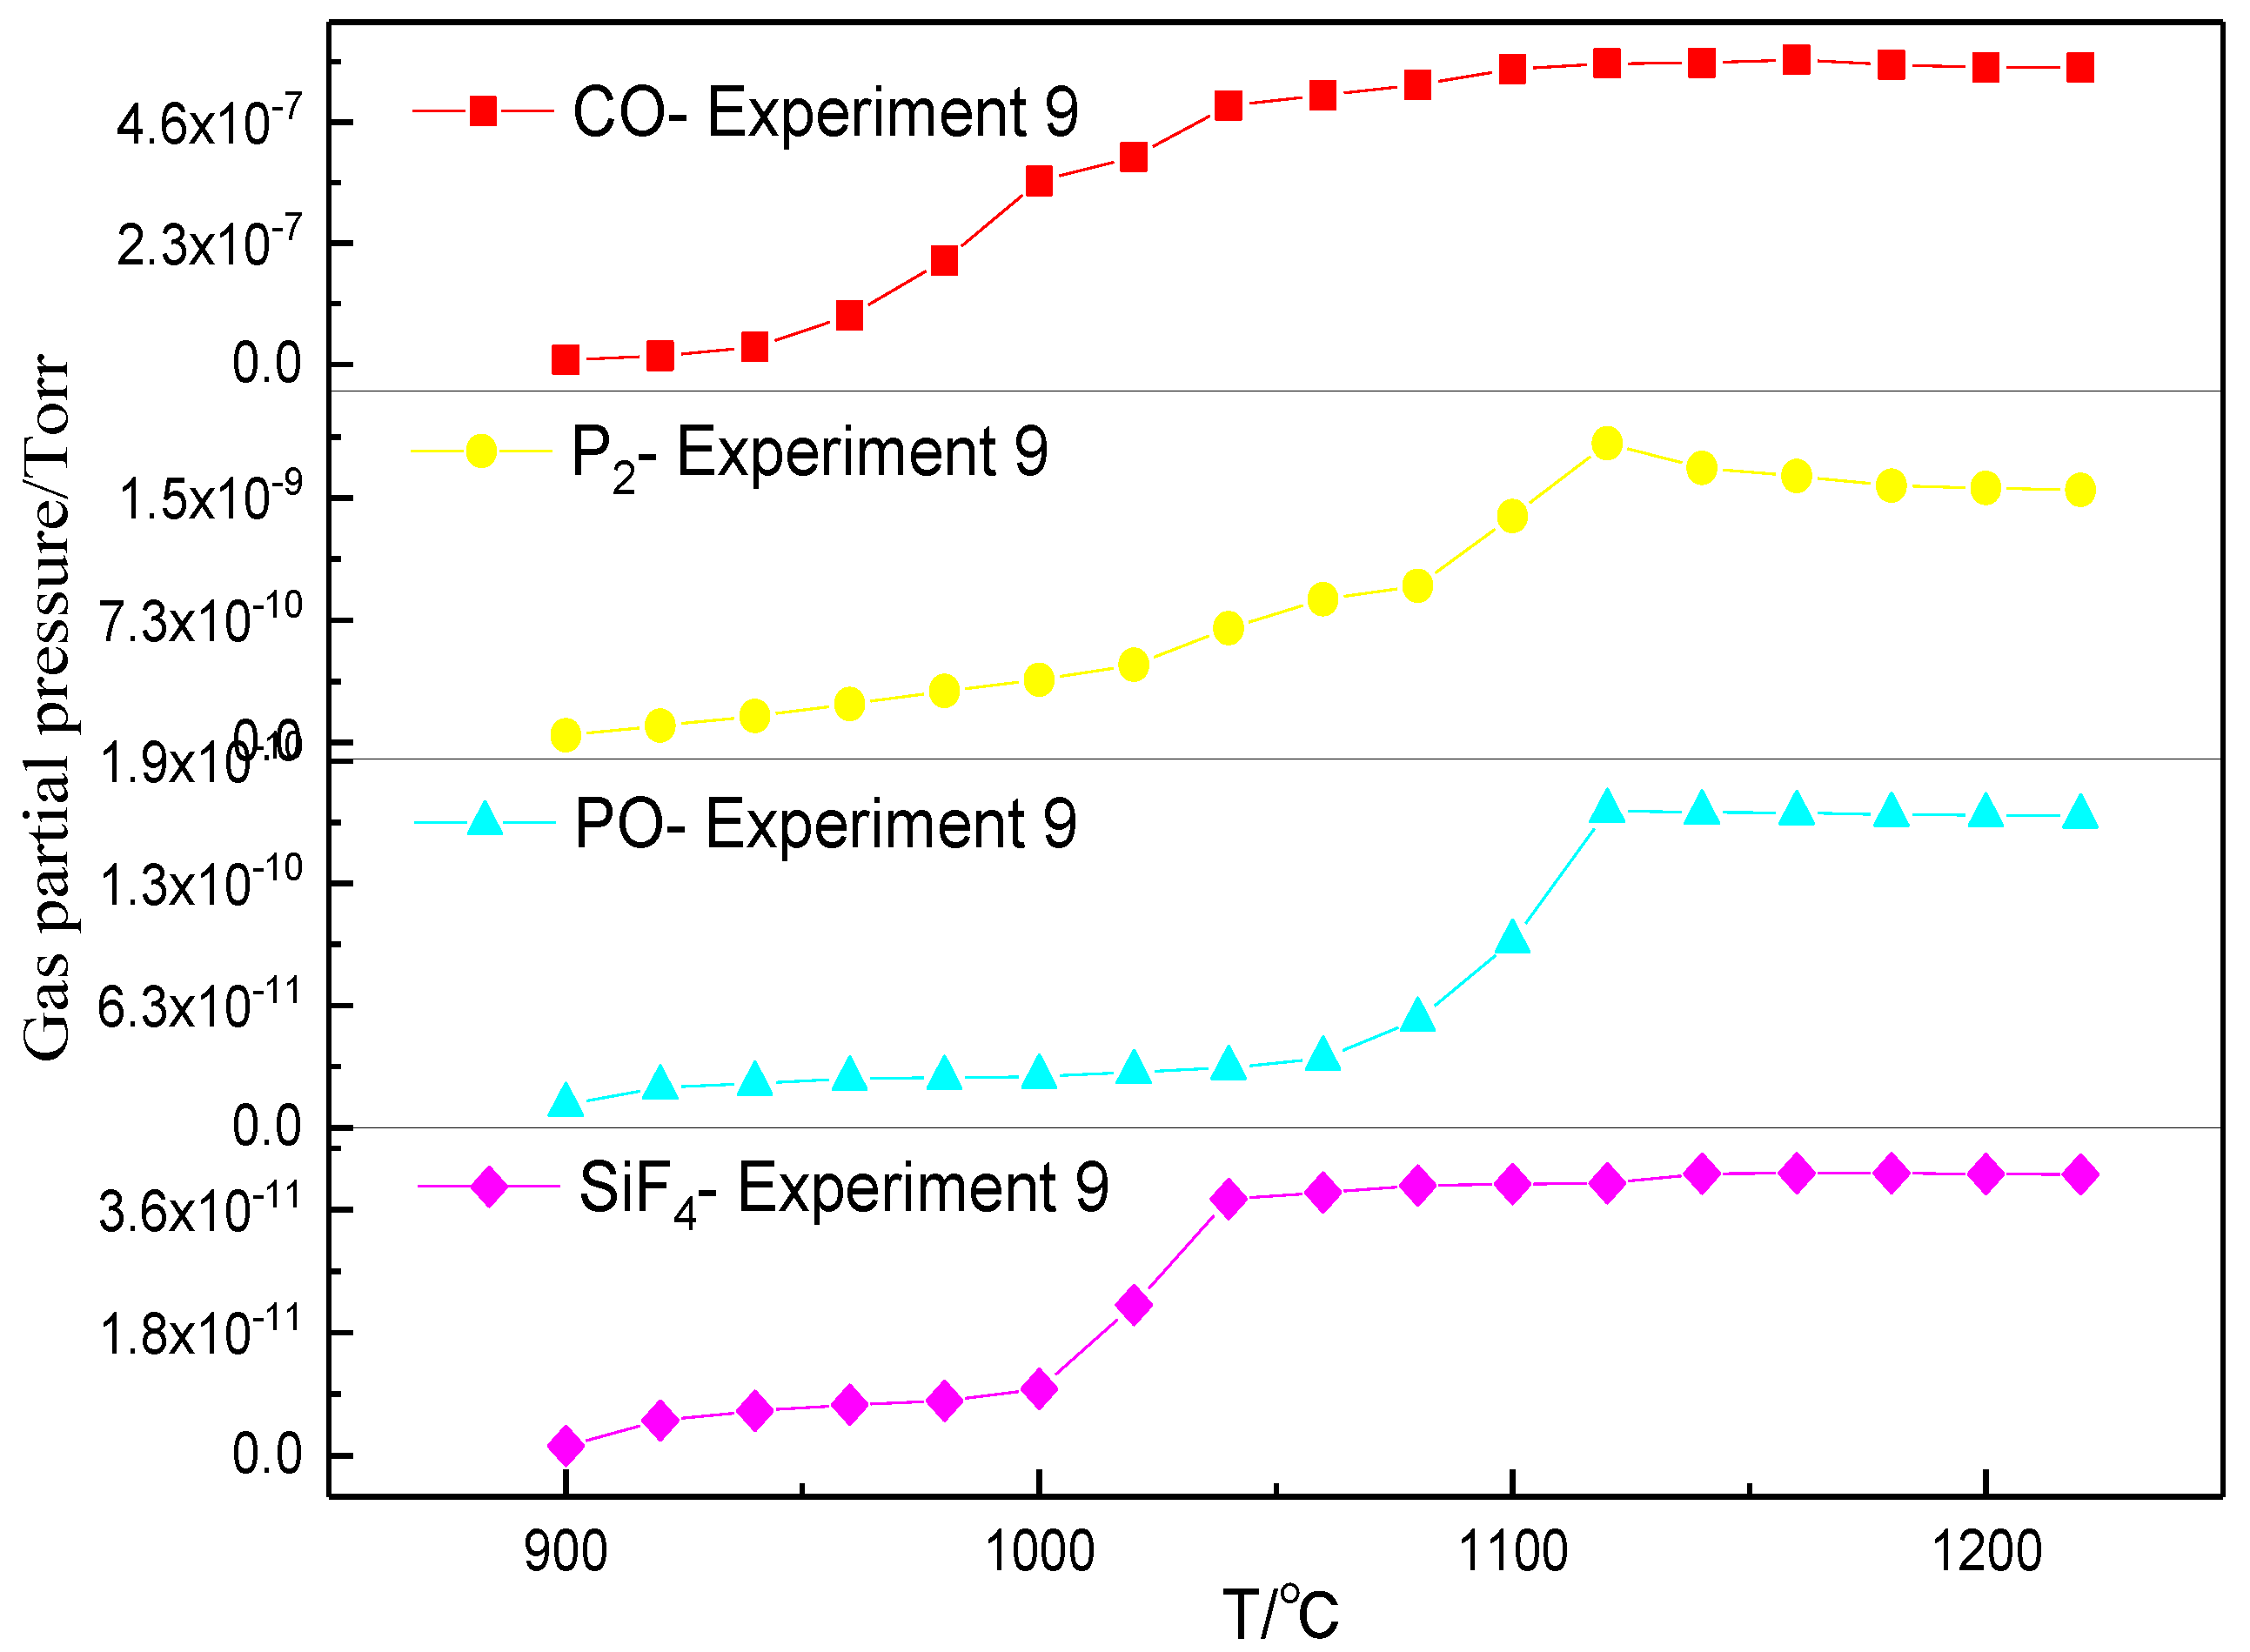
  • The amount of carbonhad a significant effect on the gas-phase products of phosphorus. When a sufficient amount of carbon was added, the phosphorus-containing gas was primarily produced as P2, and the dephosphorization temperature was low. When inadequate amounts of carbon were present, the phosphorus-containing gas primarily produced PO, and the dephosphorization temperature was high.
  • The dephosphorization ratio was very low within the temperature range of 800–1000 °C. When the temperature was in the range of 1000–1100 °C, the dephosphorization ratio rapidly increased. Beyond 1100 °C, the dephosphorization ratio was essentially unchanged or even slightly decreased. The temperature range of 1000–1100 °C was the optimum for gasification dephosphorization.
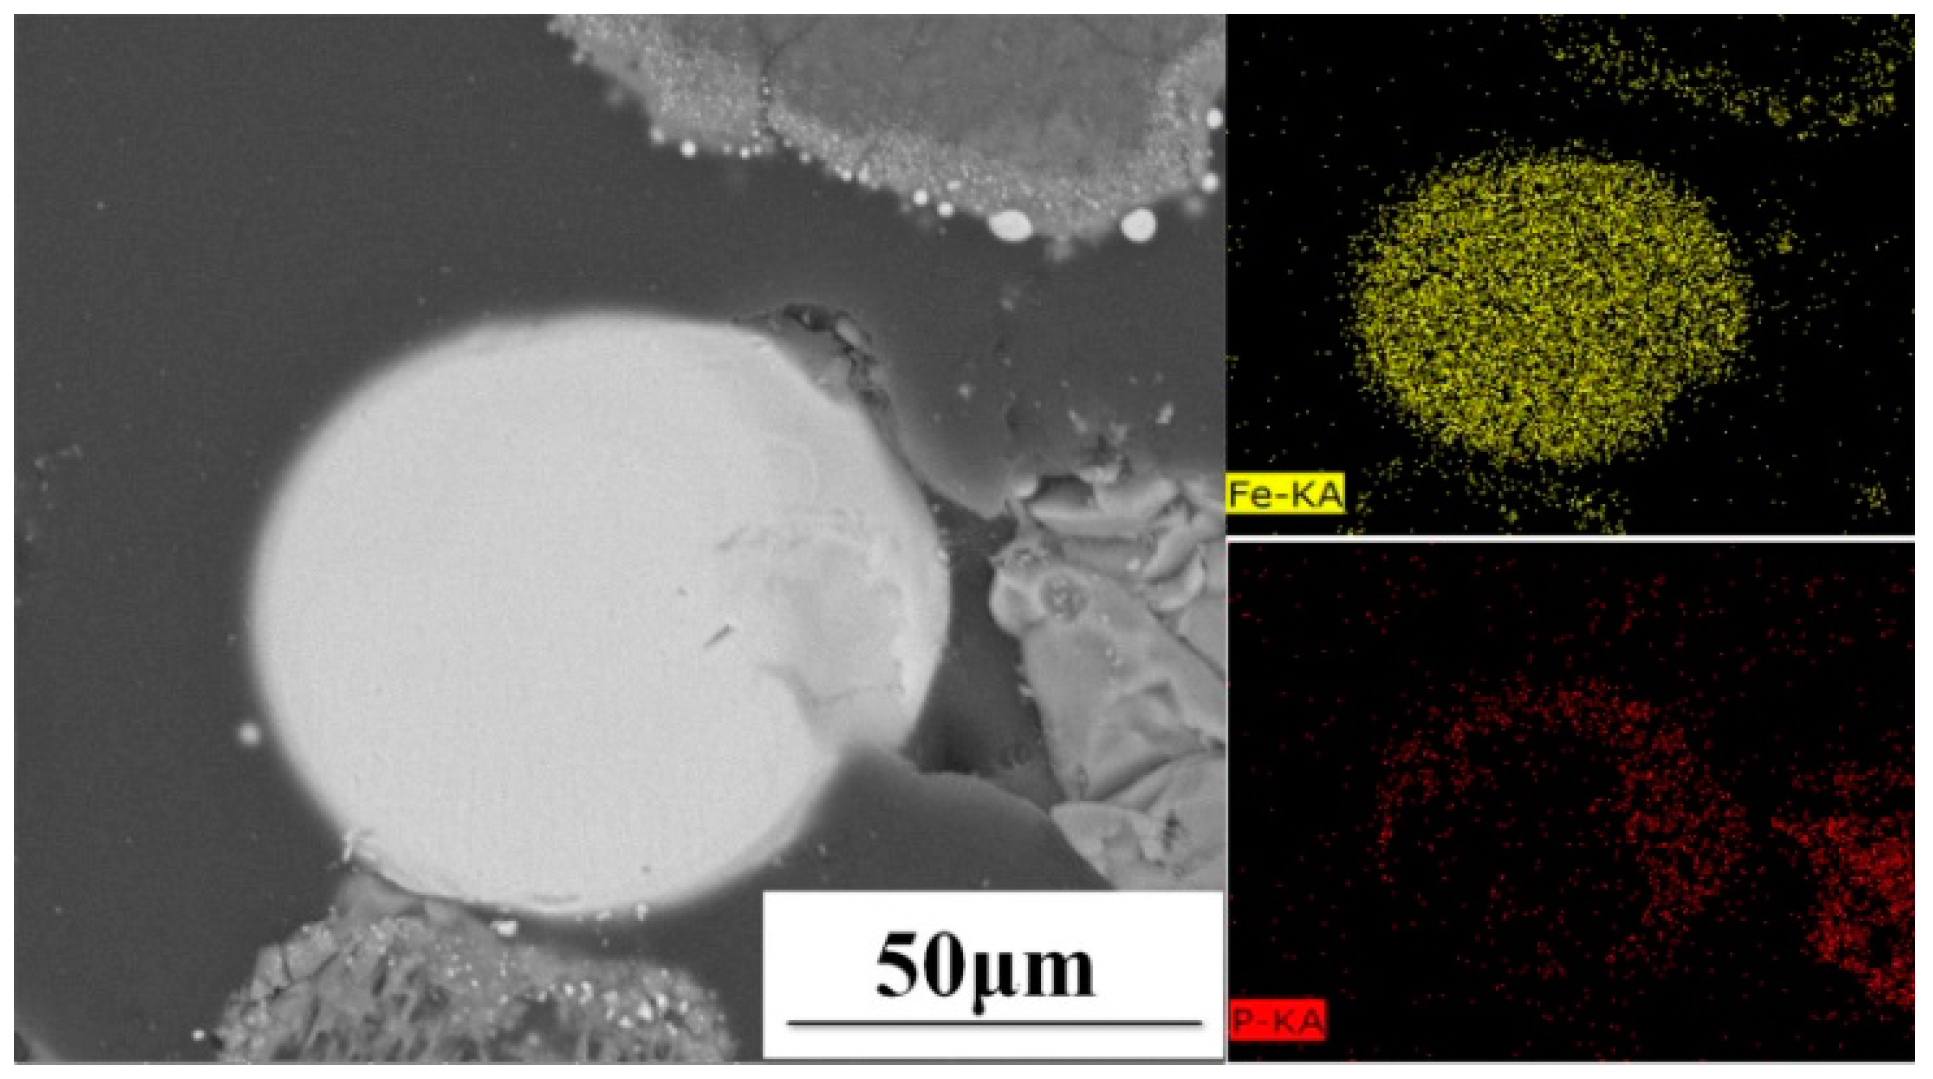
  • During the carbothermal reduction process of high-phosphorus iron ore, the most effective means of dephosphorization was to volatilize phosphorus as a gas, which could prevent phosphorus from entering the iron in the subsequent process. This paper provides a theoretical basis for the dephosphorization of high-phosphorus iron ore by vaporization and provides new insights for the utilization of high-phosphorus iron ore.

Author Contributions

Conceptualization: J.W.; data curation: Y.Z.; formal analysis: Y.Z.; funding acquisition: J.W., Q.X., and G.W.; investigation: Y.Z.; methodology: Y.Z.; project administration: J.W., Q.X., and G.W.; resources: J.W., Q.X., and G.W.; supervision: J.W., Q.X., and G.W.; validation: Y.Z.; writing of original draft: Y.Z.; writing of review and editing: J.W.

Acknowledgments

The authors acknowledge the support by the National Natural Science Foundation of China (51374024), Fundamental Research Funds for the Central Universities (FRF-TP-16-019A1), and the China Postdoctoral Science Foundation (2016M600919).

Conflicts of Interest

The authors declare no conflict of interest.

References

  1. Baioumy, H.; Omran, M.; Fabritius, T. Mineralogy, geochemistry and the origin of high-phosphorus oolitic iron ores of Aswan, Egypt. Ore Geol. Rev. 2017, 80, 185–199. [Google Scholar] [CrossRef]
  2. Zhu, D.; Guo, Z.; Xue, Q.G.; Zhang, F. Synchronous upgrading iron and phosphorus removal from high phosphorus oolitic hematite ore by high temperature flash reduction. Metals 2016, 6, 123. [Google Scholar] [CrossRef]
  3. Matinde, E.; Hino, M. Dephosphorization treatment of high phosphorus iron ore by pre-reduction, air jet milling and screening methods. Int. ISIJ 2011, 51, 544–551. [Google Scholar] [CrossRef]
  4. Huang, D.B.; Zong, Y.B.; Wei, R.F.; Gao, W.; Liu, X.M. Direct reduction of high phosphorus oolitic hematite ore based on biomass pyrolysis. J. Iron Steel Res. Int. 2016, 23, 874–883. [Google Scholar] [CrossRef]
  5. Sun, Y.S.; Han, Y.X.; Gao, P.; Wang, Z.H.; Ren, D.Z. Recovery of iron from high phosphorus oolitic iron ore using coal-based reduction followed by magnetic separation. Int. J. Miner. Metall. Mater. 2013, 20, 411–419. [Google Scholar] [CrossRef]
  6. Lei, Y.; Li, Y.; Chen, W. Microwave carbothermic reduction of oolitic hematite. Int. ISIJ 2017, 57, 791–794. [Google Scholar] [CrossRef]
  7. Matinde, E.; Hino, M. Dephosphorization treatment of high phosphorus iron ore by pre-reduction, mechanical crushing and screening methods. Int. ISIJ 2011, 51, 220–227. [Google Scholar] [CrossRef]
  8. Yu, W.; Tang, Q.Y.; Chen, J.A.; Sun, T.C. T Thermodynamic analysis of the carbothermic reduction of a high-phosphorusoolitic iron ore by FactSage. Int. J. Miner. Metall. Mater. 2016, 23, 1126–1132. [Google Scholar] [CrossRef]
  9. Mu, J.; Leder, F.; Park, W.C. Reduction of phosphate ores by carbon: Part 1 process variables for design of rotary kiln system. Metall. Trans. B 1986, 17, 861–868. [Google Scholar] [CrossRef]
  10. Mu, J.; Leder, F.; Park, W.C. Reduction of phosphate ores by carbon: Part 2 rate limiting steps. Metall. Trans. B 1986, 17, 869–877. [Google Scholar] [CrossRef]
  11. L’vov, B.V. Mechanism of carbothermal reduction of iron, cobalt, nickel and copper oxides. Thermochim. Acta 2000, 360, 109–120. [Google Scholar] [CrossRef]
  12. Jiang, L.K.; Qiu, L.Y.; Liang, B. Solid reaction mechanism for the thermal reduction of fluorapatite by carbon. J. Chengdu Univ. Sci. Technol. 1995, 5, 1–7. [Google Scholar]
  13. Tang, X.L.; Zhang, Z.T.; Guo, M. Viscosities behavior of CaO-SiO2-MgO-alumina slag with low mass ratio of CaO to SiO2 and wide range of alumina content. J. Iron Steel Res. Int. 2011, 18, 1–6. [Google Scholar] [CrossRef]
  14. Williams, Q.; Knittle, E. Infrared and Raman spectra of Ca5(PO4)3F2-fluorapatite at high pressures: Compression-induced changes in phosphate site and Davydov splittings. Phys. Chem. Solids 1996, 57, 417–422. [Google Scholar] [CrossRef]
  15. Ning, X.Y.; Xue, Q.G.; Wang, G. Mechanism of direct reduction carbon and melting separation for carbon-bearing pellets. Chin. J. Eng. 2014, 36, 1166–1173. [Google Scholar]
  16. Liu, Y.C.; Li, Q.X.; Liu, Y.C. Preparation of phosphorus by carbothermal reduction mechanism in vacuum. Adv. Mater. Res. 2012, 49, 268–274. [Google Scholar] [CrossRef]
  17. Cheng, C.; Xue, Q.G.; Wang, G.; Zhang, Y.Y.; Wang, J.S. Phosphorus migration during direct reduction of coal composite high-phosphorus iron ore pellets. Metall. Mater. Trans. B 2016, 47, 154–163. [Google Scholar] [CrossRef]
  18. Zhang, Y.Y.; Xue, Q.G.; Wang, G.; Wang, J.S. Intermittent microscopic observation of structure change and mineral reactions of high phosphorus oolitic hematite in carbothermic reduction. ISIJ Int. 2017, 57, 1149–1155. [Google Scholar] [CrossRef]
  19. Cheng, C.; Xue, Q.G.; Zhang, Y.Y. Dynamic migration process and mechanism of phosphorus permeating into metallic iron with carburizing in coal-based direct reduction. ISIJ Int. 2015, 55, 2576–2581. [Google Scholar] [CrossRef]
  20. Bale, C.W.; Bélisle, E.; Chartrand, P. FactSage thermochemical software and databases, 2010–2016. Calphad-Comput. Coupling Phase Diagr. Thermochem. 2016, 54, 35–53. [Google Scholar] [CrossRef]
Figure 1. Schematic diagram of experimental apparatus (1: quartz tube; 2: sealing cover; 3: fixed bracket; 4: quartz reaction tube; 5: sample; 6: quartz sieve; 7: thermocouple; 8: variable leak valve).
Metals 08 00451 g001
Figure 2. Relationship between standard Gibbs free energy and temperature when only carbon was added.
Metals 08 00451 g002
Figure 3. Relationship between standard Gibbs free energy and temperature following Al2O3 addition.
Metals 08 00451 g003
Figure 4. Relationship between standard Gibbs free energy and temperature following SiO2 addition.
Metals 08 00451 g004
Figure 5. Relationship between standard Gibbs free energy and temperature following Al2O3 and SiO2 addition.
Metals 08 00451 g005
Figure 6. Relationship between standard Gibbs free energy and temperature following Fe2O3 addition.
Metals 08 00451 g006
Figure 7. Schematic diagram of mineral evolution during fluorapatite direct reduction.
Metals 08 00451 g007
Figure 8. Gas analysis for gas species that were vaporized during solid-state carbothermic reduction reaction (a) without additives, (b) with Al2O3, and (c) with SiO2.
Metals 08 00451 g008aMetals 08 00451 g008b
Figure 9. Effect of carbon content on phosphorus-containing gas products.
Metals 08 00451 g009
Figure 10. Gas-phase products during direct reduction with Fe2O3.
Metals 08 00451 g010
Figure 11. Distribution of Fe and P in the DRI phase microstructure.
Metals 08 00451 g011
Figure 12. Gas-phase products present during direct reduction with three additives.
Metals 08 00451 g012
Figure 13. Effect of reduction temperature on dephosphorization extent.
Metals 08 00451 g013
Figure 14. SEM-EDS(Scanning Electron Microscope—Energy Dispersive Spectrometer analysis of reduced pellets at different temperatures.
Metals 08 00451 g014
Table 1. Chemical composition of high-phosphorus iron ore (wt %).
CompositionFe2O3Ca10(PO4)6F2SiO2Al2O3CaOMgO
Chemical composition of raw ore73.466.237.775.070.790.74
Table 2. Substance mixing ratio of fluorapatite carbothermal reduction experiments (molar ratio).
Experiment No.Ca10(PO4)6F2Al2O3SiO2Fe2O3C
1100015
2190015
33310045
4109015
52021030
622041030
722041018
8100118
922041236

