Effect of Turning and Surface Polishing Treatments on Surface Integrity and Fatigue Performance of Nickel-Based Alloy GH4169

The Key Laboratory of Contemporary Design and Integrated Manufacturing Technology, Ministry of Education, Northwestern Polytechnical University, Xi’an 710072, China
*
Author to whom correspondence should be addressed.
Metals 2018, 8(7), 549; https://doi.org/10.3390/met8070549
Submission received: 19 June 2018
/
Revised: 1 July 2018
/
Accepted: 11 July 2018
/
Published: 18 July 2018
Abstract
:In this paper, the effects of turning and surface polishing treatments on surface integrity and fatigue properties of superalloy GH4169 were investigated. Finish turning (FT), surface circumferential polishing treatment (TCP), surface oblique texture (TCPO), and surface axial texture (TCPA) were applied to GH4169 superalloy. The surface roughness, surface topography, residual stress, microhardness, and microstructure after different processes were studied. Rotating bending fatigue tests were carried out to investigate the effects of surface integrity and surface texture direction on the fatigue performance of GH4169. The experiments reveal that the TCPA specimens present the longest fatigue life of 15.01 × 10⁴ cycles. By comparison with the FT, TCP, and TCPO specimens, the fatigue lives of TCPA specimens are increased by 134.2%, 183.7%, and 96.2%, respectively. Single crack initiation source is observed for TCPA specimen. It is mainly attributed to the small surface stress concentration factor and surface axial texture.
1. Introduction
Because of the good mechanical properties, the GH4169 superalloy is widely used to manufacture the hottest end parts of aero-engines and various industrial gas turbines, such as the turbine blades, guide vanes, turbine disks, and combustion chambers. Fatigue fracture is the most extensive failure mode for the aerospace components. The component surface is the boundary between the contact components and its surroundings, and many fatigue cracks initiate from the machined surface of the component. So the surface state of component has been found to be the dominant factor affecting the fatigue performance. In recent years, the surface integrity and fatigue properties of GH4169 alloy have received extensive attention from scholars in various countries. Kamata et al. [1] reported that MQL cutting Inconel 718 with TiCN/Al2O3/TiN coated tools at cutting speed of 1.0 m/s showed optimal cutting performances. Thakur et al. [2] revealed that the surface roughness of Inconel 718 decreased with the increased cutting speed and the reduced feed. And the optimal surface finish obtained at feed rate of 0.08 mm/rev, cutting depth of 0.5 mm and cutting speed of 45–55 m/min. Akhtar et al. [3] found that the best surface integrity of GH4169 alloy were observed at the lowest cutting feed, medium cutting speed, and depth. Devillez et al. [4] found that the largest tensile stress occurs on the dry cutting surface of GH4169. A shallow tensile stress layer appears near the surface, followed by a deeper compressive stress layer. Li et al. [5] found that by comparison with the 200# CBN EB wheel, 300# CBN RB wheel grinding GH4169 could obtain lower surface microhardness and compressive residual stresses. Liu et al. [6] found that the roughness and compressive residual stress in cutting direction of GH4169 were mainly affected by feed rate. The tensile residual stress in the feed direction was mainly affected by the depth of cut, and the microhardness was mainly affected by the cutting speed. Huang et al. [7] indicated that the fatigue life improved as compressive residual stress increased, whereas the tensile residual stress has the opposite effect on fatigue life. Hood et al. [8] found that at the cutting speed of 25 m/min, compressive residual stress of 120 MPa could be obtained when milling Udimet 720 superalloy with a new tool, while tensile stress of 50–75 MPa near the surface could be obtained with the worn tools. Wang et al. [9] reported that the surface roughness, hardness, and tensile residual stress of the Inconel 718 increased with the increasing feed rate. And the high feed rate result in a low fatigue life. It can be seen that cutting feed has been found to be the dominant factor affecting the surface integrity. Chomienne et al. [10] reported that by comparison with the turning specimen, the turning-burnishing specimen showed a thick compressive stress layer in both axial and circumferential directions with a peak stress situated 0.1 mm below the surface. López de Lacalle et al. [11] reported that ball burnishing could significantly reduce the surface roughness. González Rojas et al. [12] proposed an analytical method for estimating the polishing time of different metallic alloys in the removal of surface texture. Avilés et al. [13] reported that by comparison with the non-treated specimens, the surface roughness of ball-burnished AISI 1045 steel specimens reduced, and the fatigue lives increased to 3.25 × 10⁶ cycles. Wu et al. [14] reported that post-peening polishing treatment greatly reduced the surface roughness (from 2.423 µm to 0.041 µm) of GH4169 alloy, and the fatigue life increased by 48.9%. These comparisons indicate that surface integrity has a significant impact on the fatigue life of components.
Although many papers have studied the machined surface integrity of GH4169 superalloy and its effects on fatigue life, the effect of surface integrity and surface texture direction on fatigue performance has not been studied deeply. In this article, the surface polishing treatment applied to the turning specimen surface to remove the machining marks. Sandpaper grinding in different directions was applied to the polished specimen surface to obtain the surface texture with different directions. Surface roughness, topography, residual stress, microhardness and microstructure after the four processes were obtained and analyzed. Then, the rotating bending fatigue tests were carried out at a fixed stress level. By analyzing and comparing the fatigue life and fracture morphology after the different processes, the comprehensive effects of surface integrity and surface texture direction on fatigue performance were revealed.
2. Materials and Methods
2.1. Material and Experimental Details
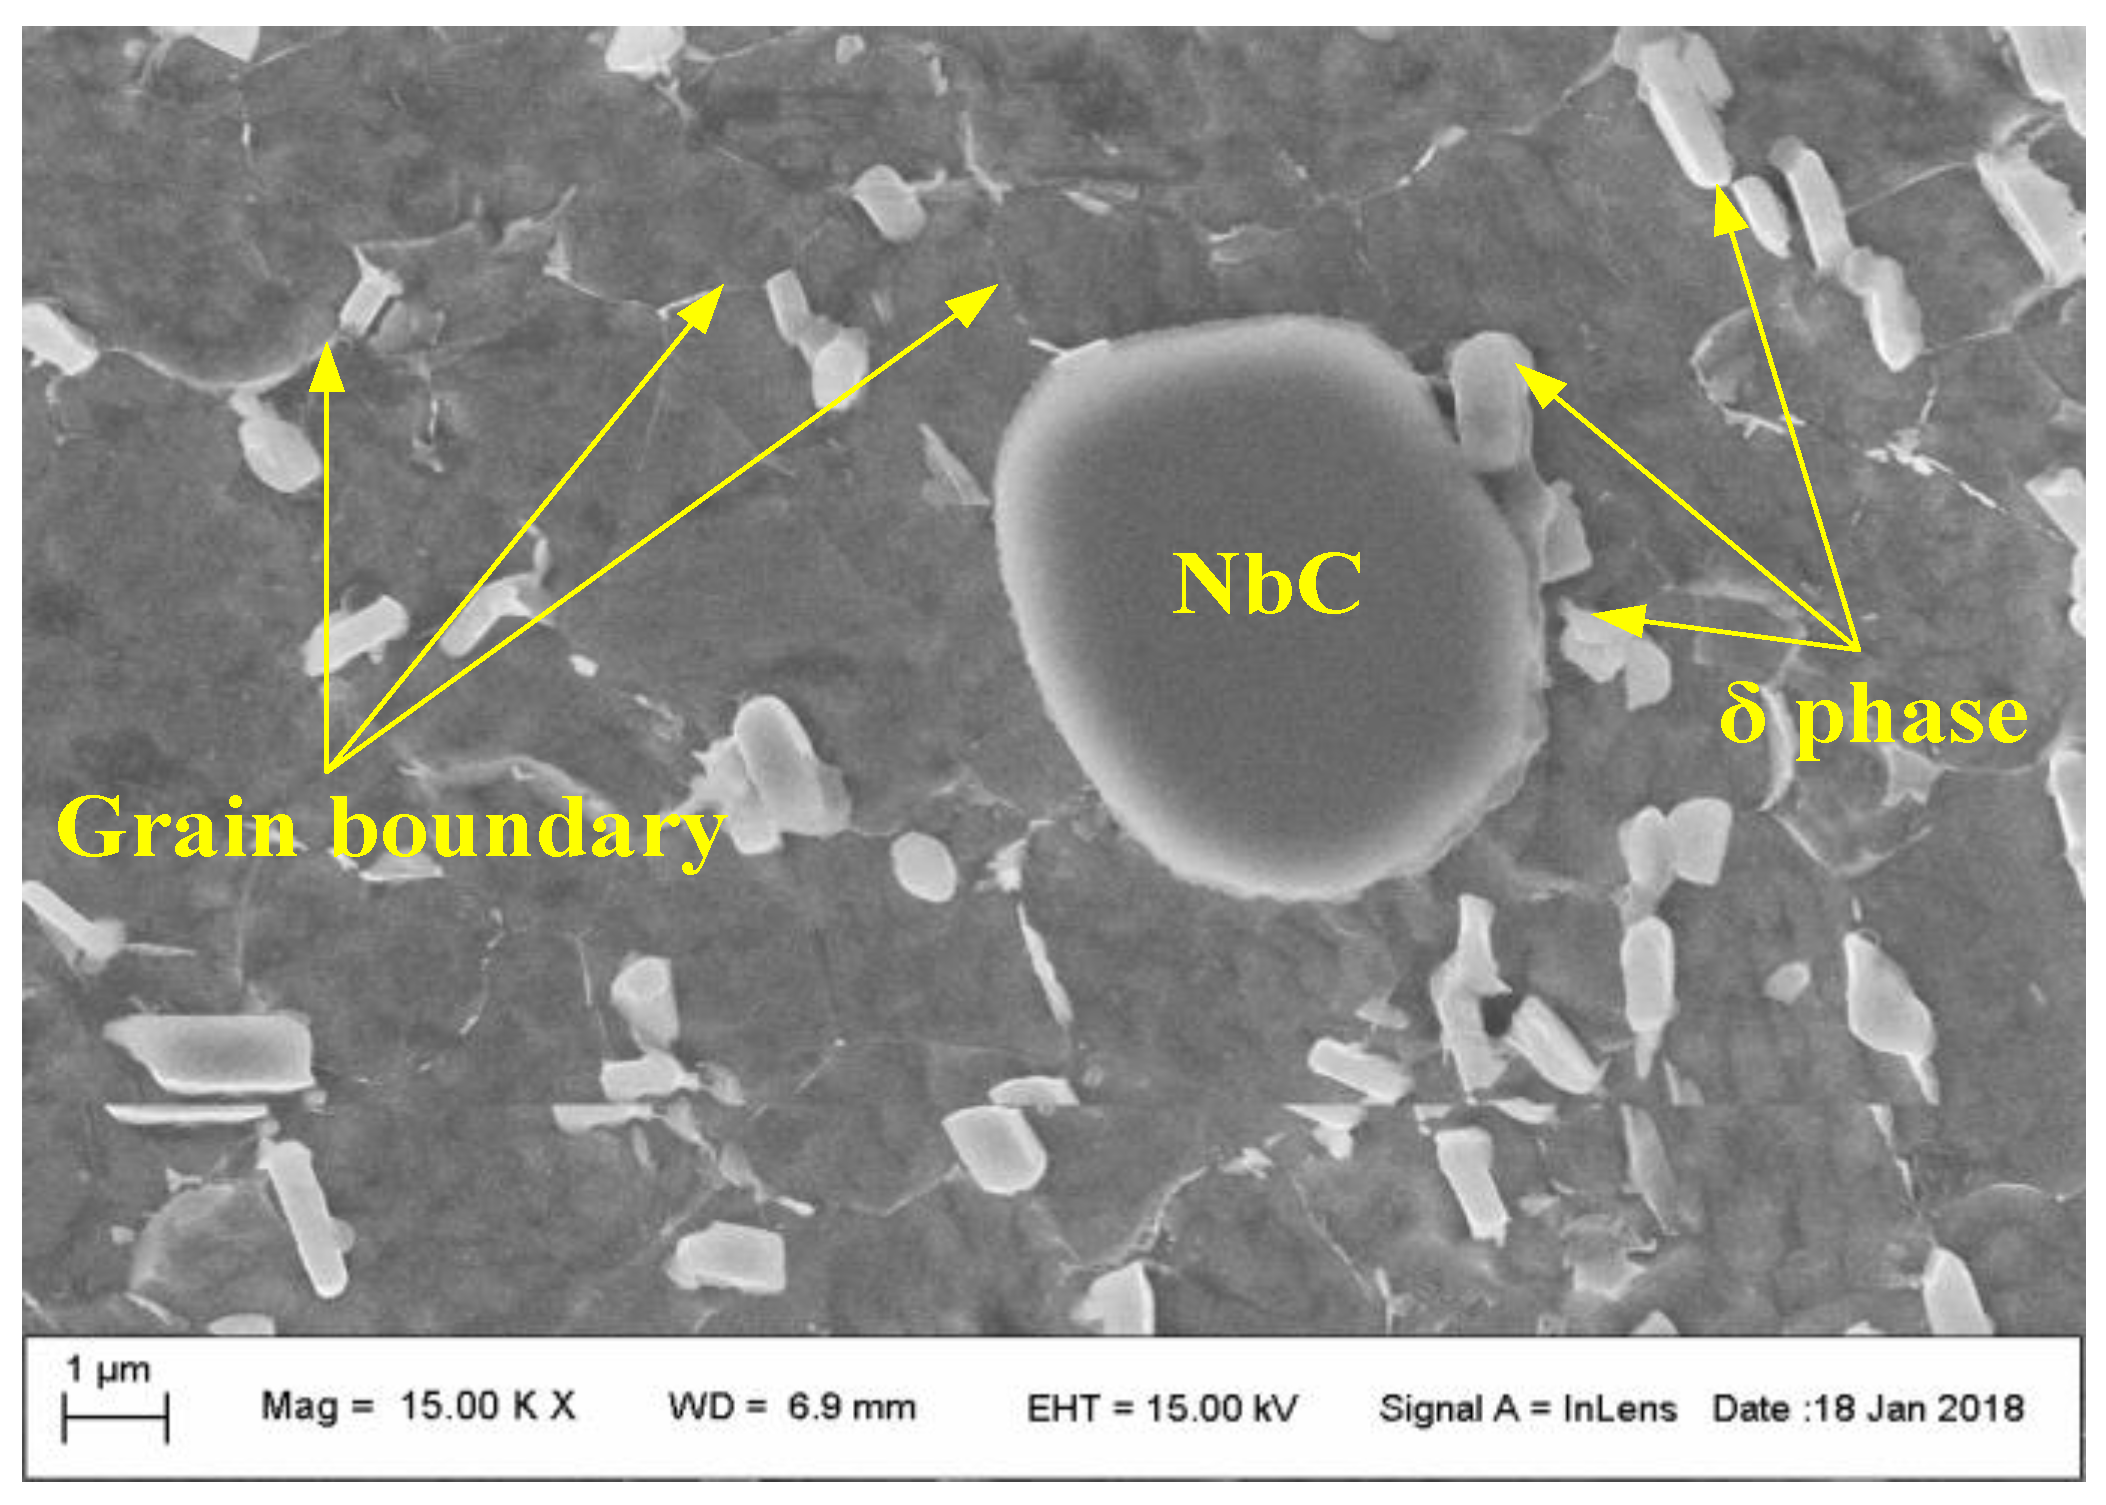
The material used in present investigation was nickel-base superalloy GH4169 with a chemical composition of 52.3% Ni, 0.04% C, 0.52% Al, 1.06% Ti, 18.9% Cr, 3.08% Mo, 5.3% Nb, <0.2% Ta, <0.2% Co, <0.2% Si, <0.2% Mn, <0.015% P, <0.001% S, <0.2% Cu, <0.005% Mg, and Bal Fe (weight percent). The as received GH4169 has a yield strength of 1336 MPa at room temperature. The nominal chemical composition and the mechanical properties of GH4169 alloy are the same as those employed in the previous studies [14,15]. GH4169 superalloy heat treatment procedure: at 720 °C for 8 h, furnace cooled to 620 °C at a cooling rate of 50 °C/h, and holding at 620 °C for 8 h, air cool. The GH4169 alloy microstructure is consists of δ-Ni3Nb phase and a small amount of NbC carbides, as shown in Figure 1. The geometry of the fatigue specimen presented in Figure 2.
Four different series were investigated in this paper: FT (finish turning), TCP (finish turning, and surface polishing along circumferential direction), TCPO (finish turning, surface polishing along circumferential direction, and sandpaper grinding along oblique direction), and TCPA (finish turning, surface polishing along circumferential direction, and sandpaper grinding along axial direction). The finish turning experiments were performed on a computer numerically controlled lathe. The VBMT160408-F1, CP200 (SECO, Fagersta, Sweden) turning tool with corner radius of 0.8 mm were used. In order to remove the machining marks of the turning specimen surface, surface polishing treatments were applied on the turned specimen. The specific method of surface polishing is sequentially using 600#, 800#, 1200#, 1500#, 2000#, and 2500# sandpaper to grind the turning induced surface along the circumferential direction.
In order to obtain the surface oblique texture and surface axial texture, the polished specimen surface was ground by using 800# sandpaper along the oblique and axial direction, respectively. Table 1 shows machining processes for each series. Specimen preparation for each series is presented in Figure 3. The TCP process included 3 fatigue specimens. For the FT, TCPO, and TCPA processes, each series included 4 specimens.
In order to investigate the effect of different processes on the fatigue life, the room temperature fatigue tests were carried out using a cantilever-type rotating bending fatigue testing machine QBWP-10000. The frequency was 100 Hz, stress ratio was −1, and the stress level was 900 MPa.
2.2. Surface Integrity and Fracture Surface Testing
Surface topographies were measured using wykoNT1100 optical profiler (Veeco, Tucson, AZ, USA). The resolution was 736 × 480, and the measuring area was 302.1 × 339.8 μm2. Surface roughness wasmeasured by a profilometer MarSurf XT 20 (Mahr, Göttingen, Germany). The cut off was 0.8 mm, and evaluation length was 4 mm. The measuring intervalswas 0.5 μm, and measuring speed was 0.5 mm/s.
Residual stress nondestructive testing techniques typically include X-ray diffraction, neutron diffraction, and synchrotron radiation [16,17]. X-ray diffraction technology is simpler and more efficient to operate, so X-ray diffraction technology was applied in this study. Residual stresses measurements were performed using LXRD MG2000 test system (Proto, Ontario, ON, Canada) with Mn_K-Alpha radiation and a Bragg angle of 151.88° in the {FCC, hkl-311} plane. D-spacing was 1.0840460 Å. The sin2ψ method was used, and the aperture size was 1 mm2. Peak location method was 85% Gaussian fitting. The tube voltage was 25 kV, and the current was 20 mA. The exposure time was 1 s, and the number of exposures was 10. In order to test the residual stress of the subsurface layer of the specimen, electrolytic polishing used to remove a very thin layer of material.
Microhardness measurements were conducted using micro-hardness testing system FM-800 (FUTURE-TECH, Tokyo, Japan). The test force was 25 g, and the dwell time was 10 s. In the subsurface, the hardness test was performed on the cut section at intervals of 5–10 μm until the hardness of substrate materials was obtained. The cut section must be coarse ground, precise ground, and polished. Five microhardness tests were performed at each depth to calculate the average value.
In order to examine the microstructure of the GH4169 alloy, which is perpendicular to the machined surface, the polished cross section of specimen was corroded by a solution of 8 g FeCl3 + 18 mL HCl + 20 mL H2O. The microstructure observations for the base GH4169 alloy were carried out using scanning electron microscope SUPRA 55 (Zeiss, Oberkochen, Germany), and the micro-structure for other specimens were observed with SEM of JSM-6360 (JEOL/EO, Tokyo, Japan).
To study the fatigue crack initiation and propagation under different surface states, fracture morphologies of fatigue specimens were observed with scanning electron microscopy of Sigma 500 (Zeiss, Oberkochen, Germany).
3. Results and Discussion
3.1. Surface Topographies and Roughness
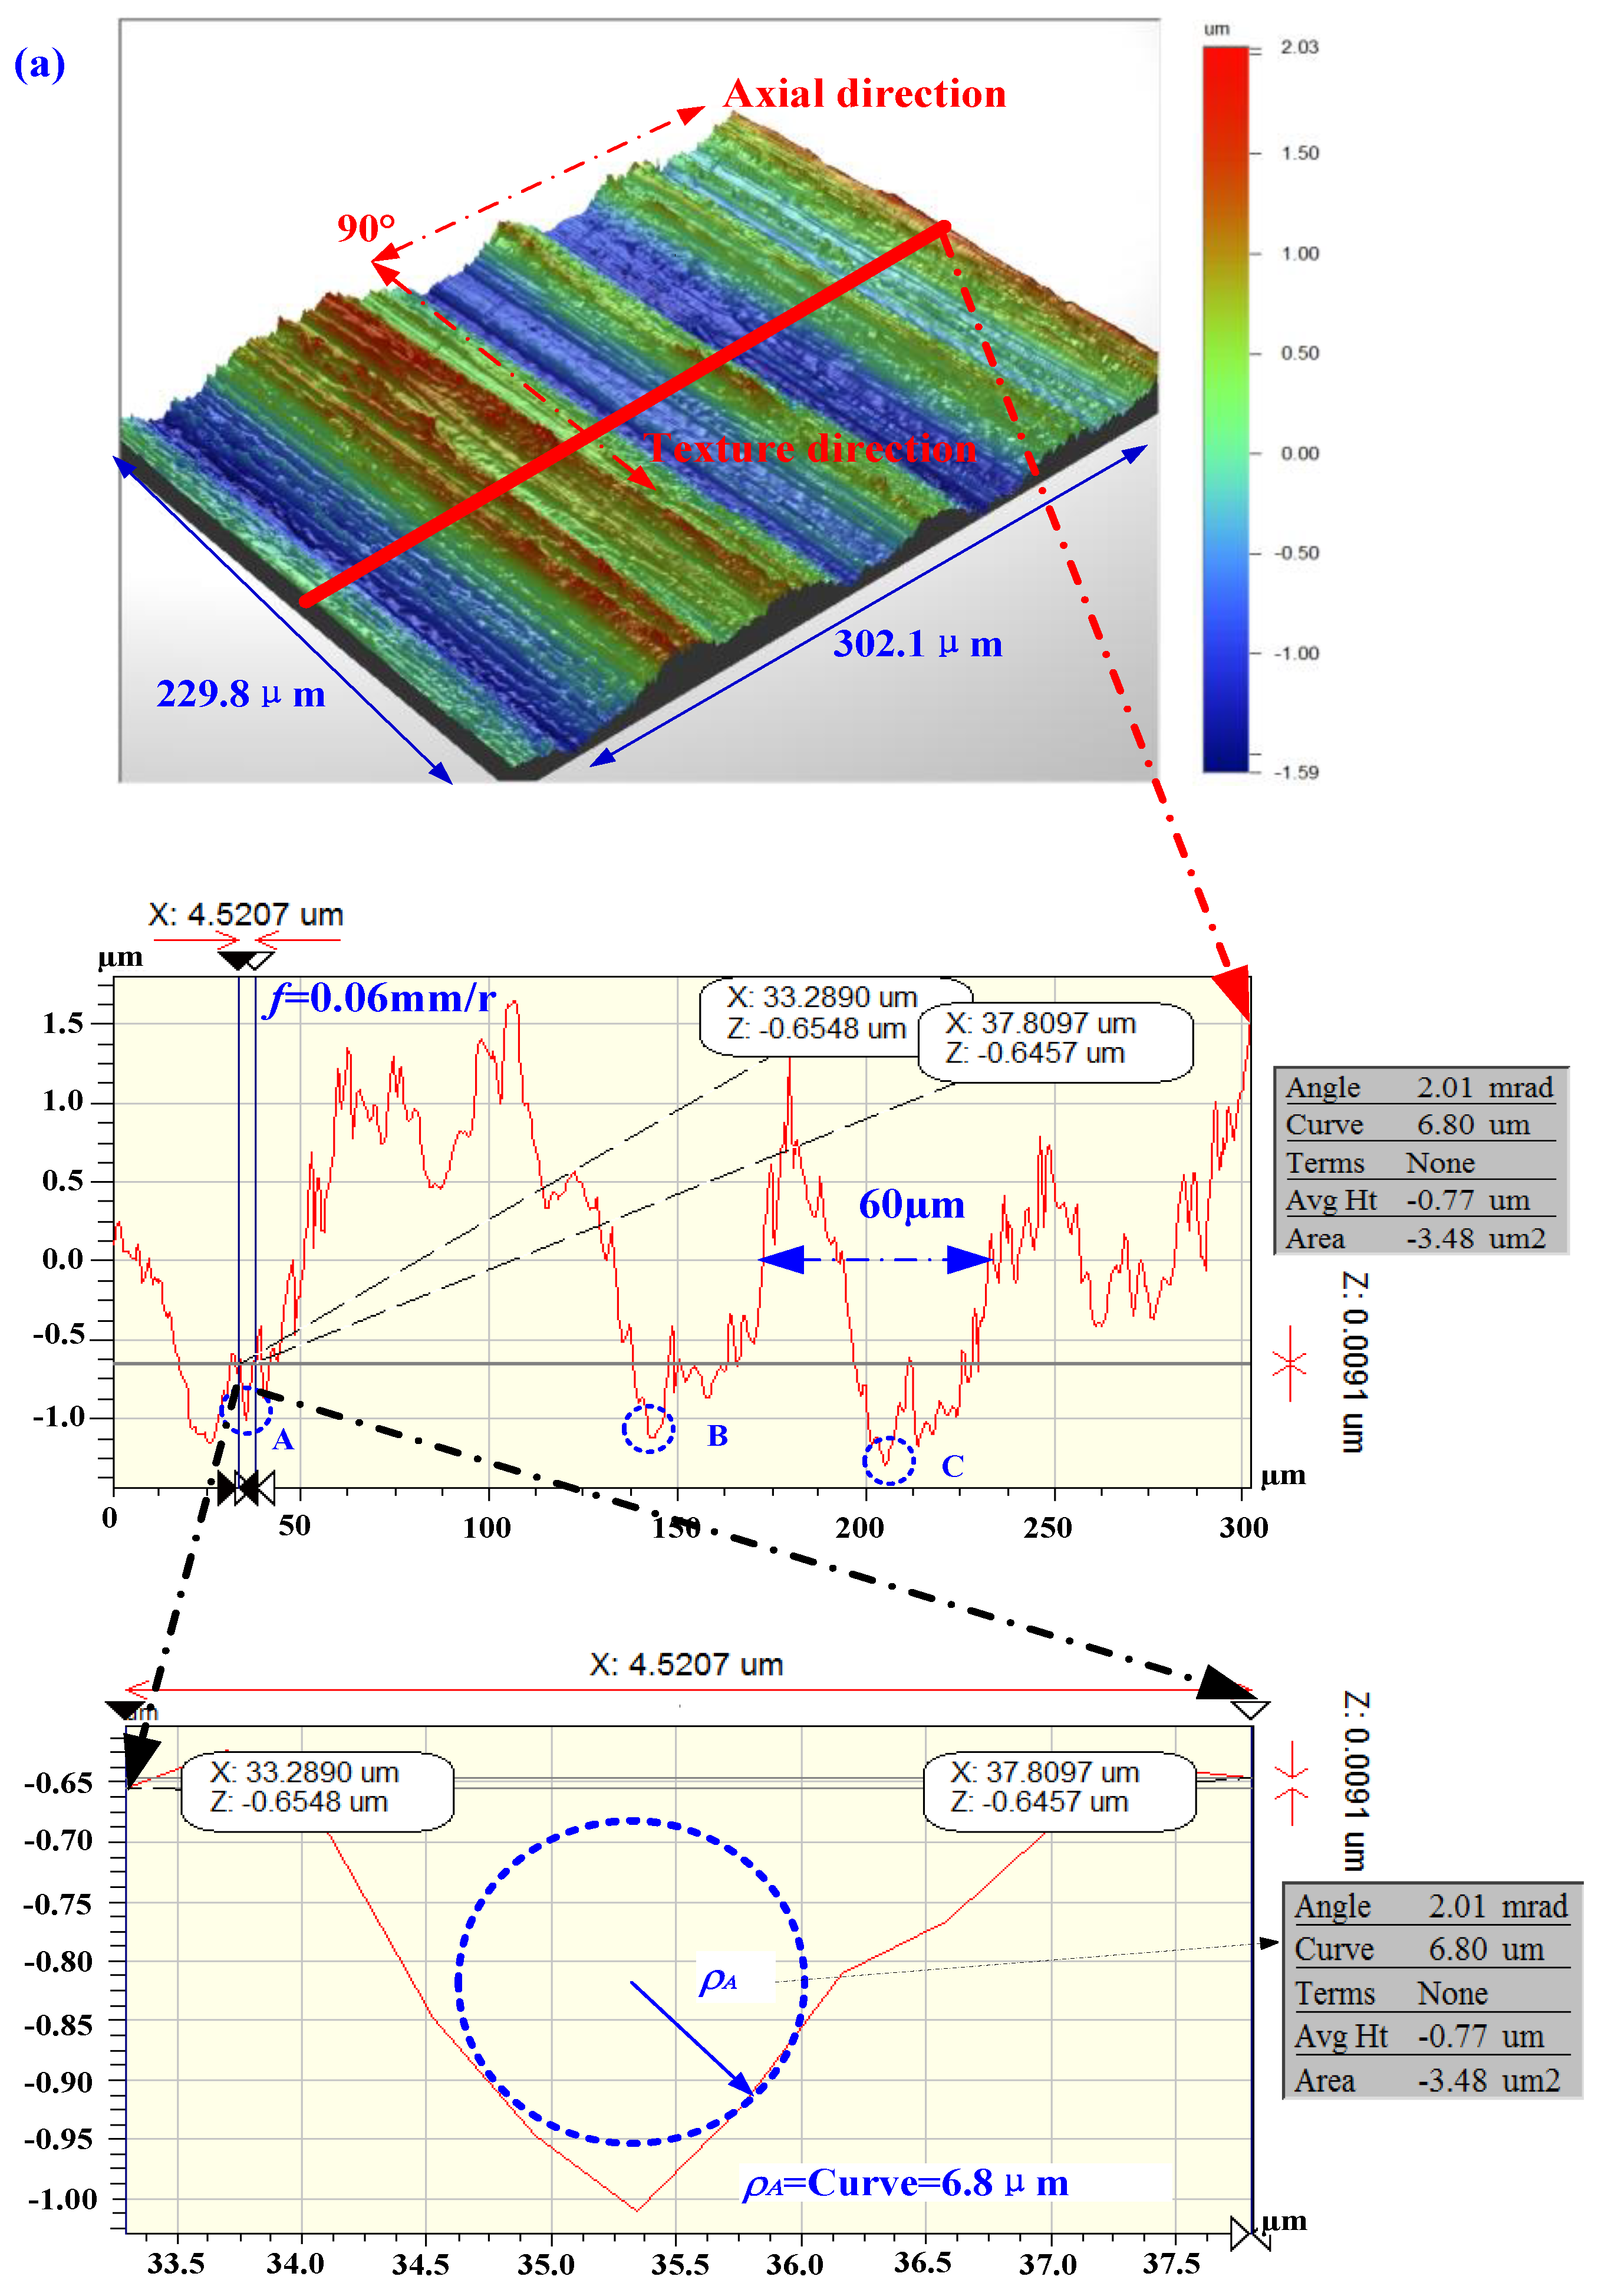
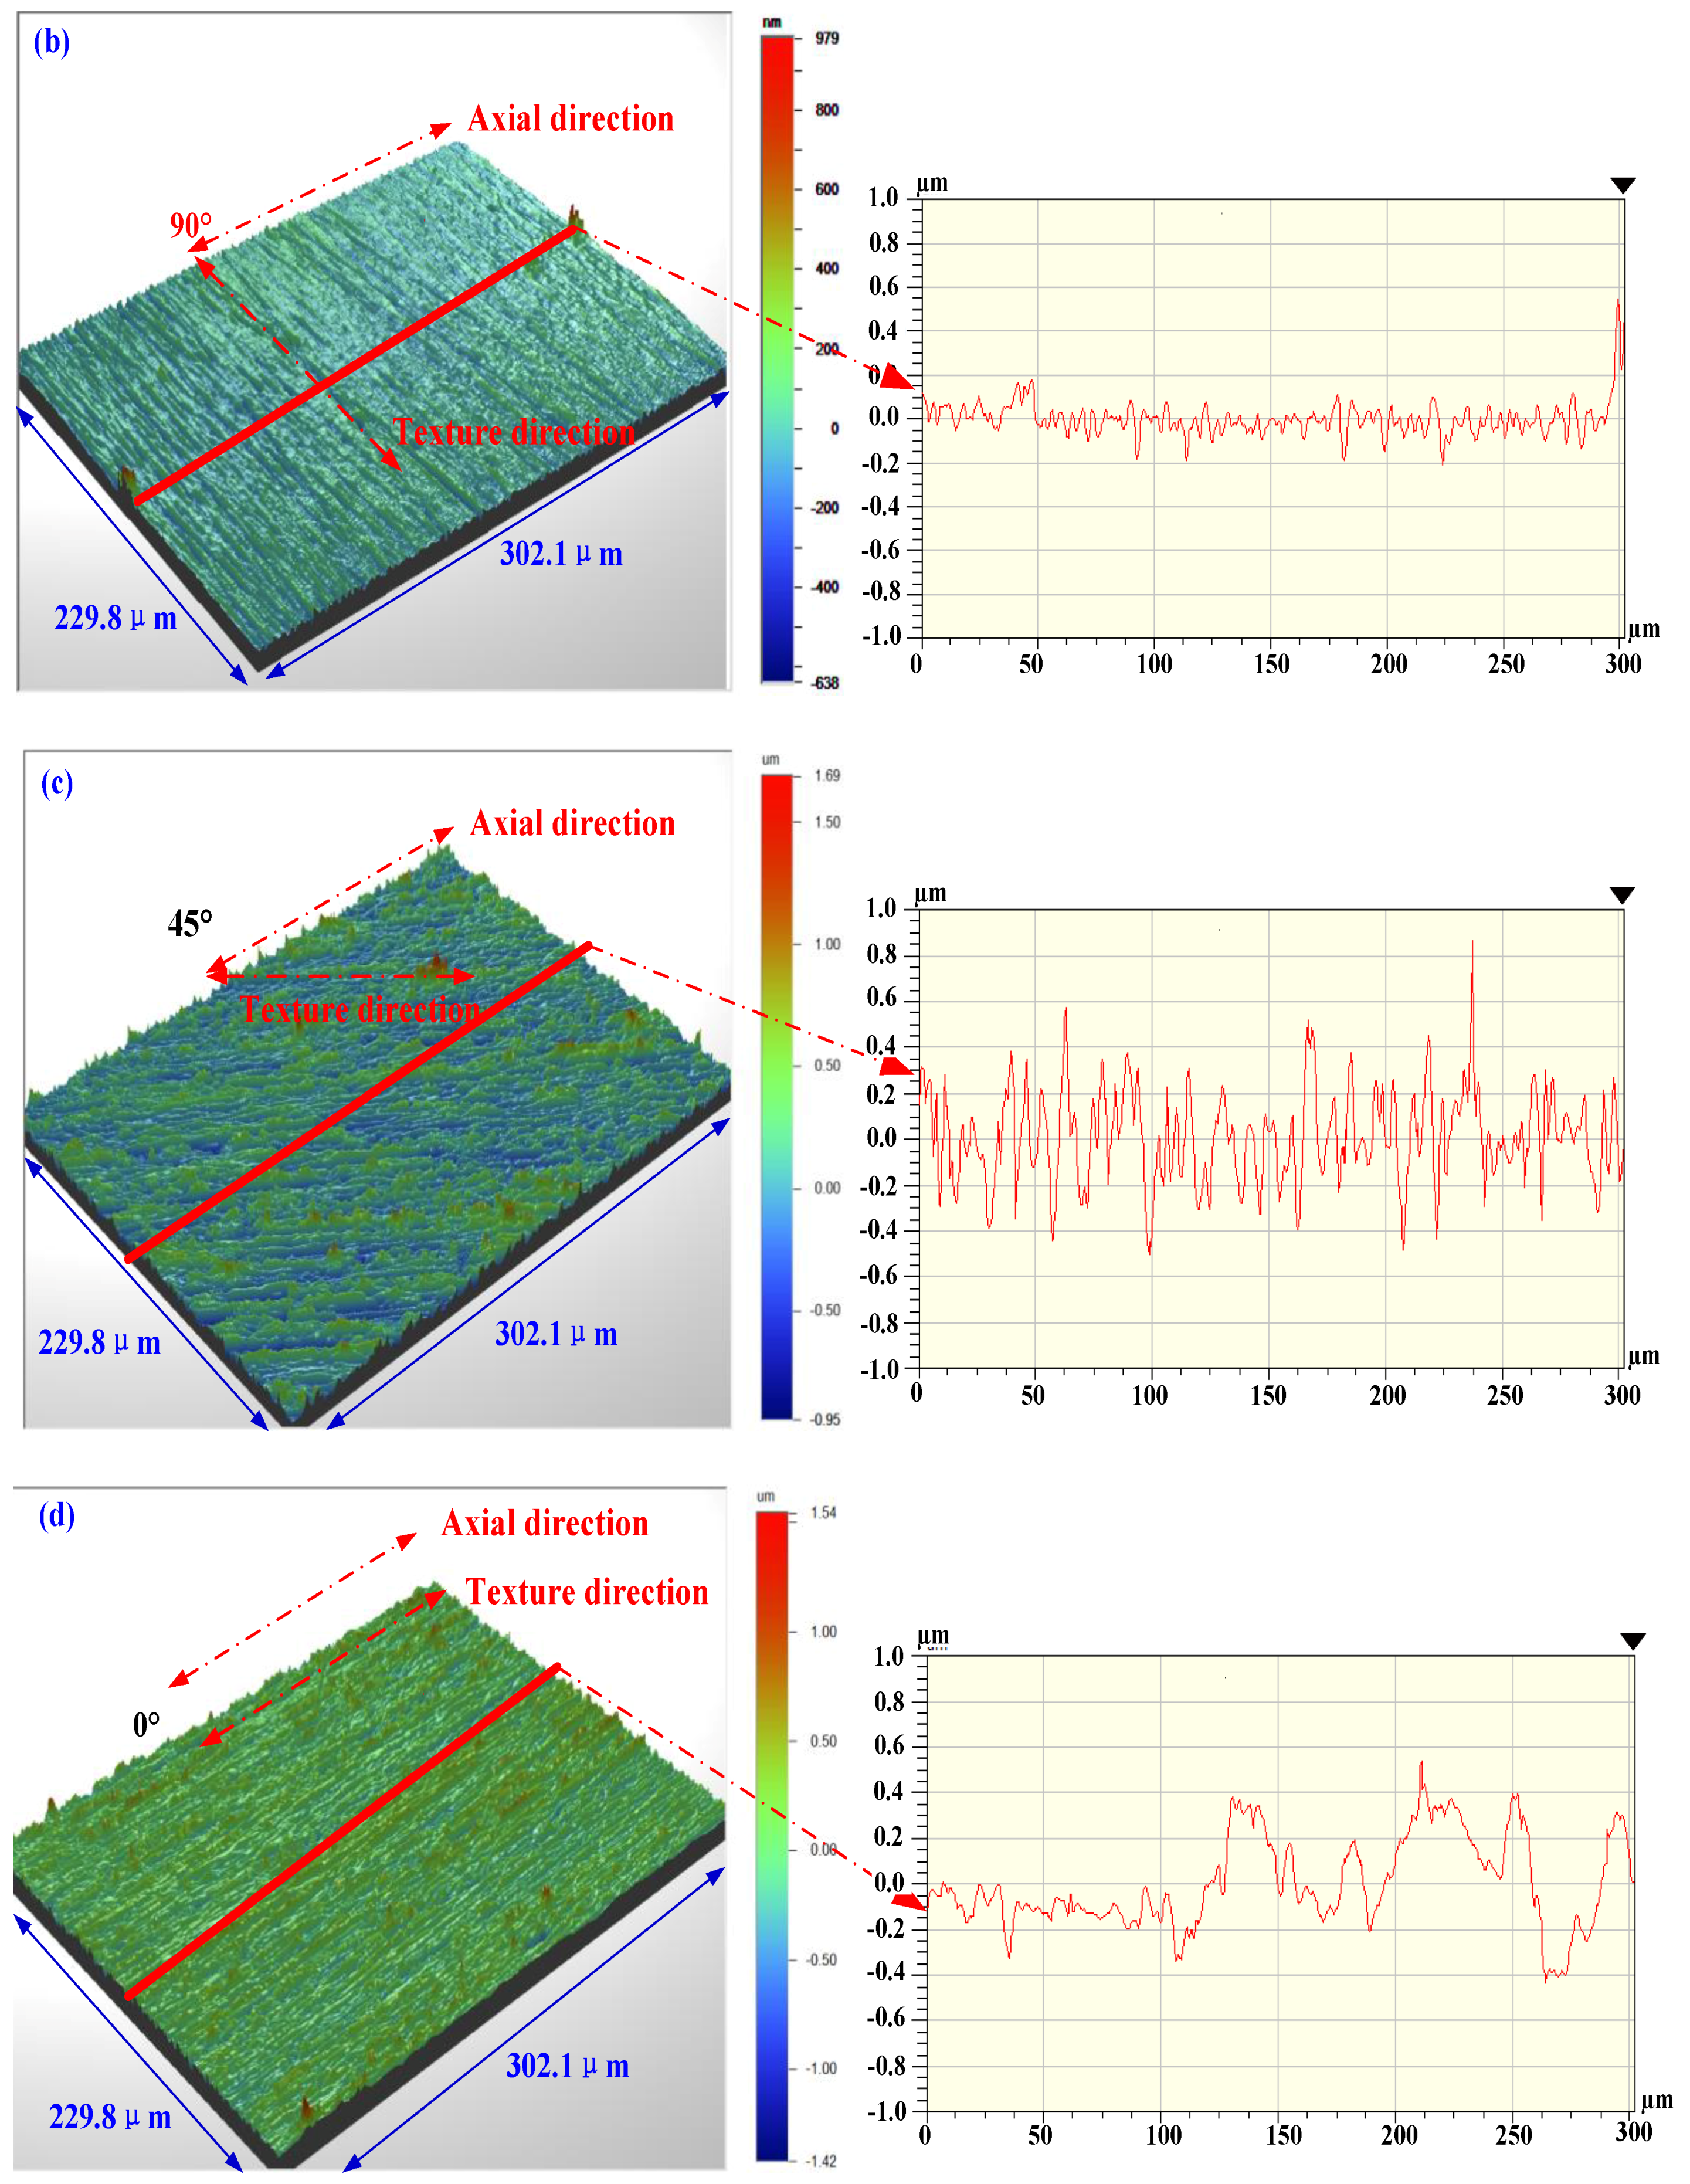
Surface topographies and surface profiles along the specimen axial direction are presented in Figure 4. Corresponding specific test values of surface roughness and fatigue life are listed in Table 2. Surface topography and surface profile of GH4169 alloy after FT process are shown in Figure 4a. It can be seen that the machined surface is rough, and the obvious machining marks can be observed. The corresponding surface roughness is larger, and the values of Ra, Rz, Ry, Rt, Rsm are 0.567 μm, 3.37 μm, 4.51 μm, 4.662 μm and 141.693 μm, respectively. The surface profile shows that the distance between adjacent peaks is about 60 μm. Grzesik et al. [18] reported that the roughness Rsm produced by turning is approximately equal to the turning feed. Surface topography at TCP process is presented in Figure 4b, it can be seen that the turning marks disappear, and the surface is smooth. The corresponding surface roughness is significantly reduced, and the values of Ra, Rz, Ry, Rt, Rsm are 0.024 μm, 0.271 μm, 0.445 μm, 0.455 μm and 77.258 μm, respectively. This is mainly attributed to the surface polishing process completely removes the turning surface texture. The surface profile of the TCP specimen shows that the texture is closely distributed perpendicular to the sample axial direction. In Figure 4c, the surface texture direction has an angle of approximately 45° with the specimen axial direction. In Figure 4d, the surface texture direction is consistent with the axial direction of specimen. The corresponding surface profile shows random peaks and valleys distribute along axial direction. In Figure 4, surface induced by FT process with feed rate 0.06 mm/r produce the highest values of peaks and valley. While the TCP, TCPO, and TCPA processes produce very small peak height and valley height, which is attributed the polishing process removal the peak-valley induced by FT process.
Arola et al. [19] proposed a calculation method for predicting the surface-equivalent stress concentration Kst which caused by machining, as Equation (1). The model mainly includes roughness parameters Ra, Ry, Rz and the effective profile valley radius .
where: n = 1 for shear loads, n = 2 for uniform tension. Due to the rotating bending fatigue tests were conducted in this paper, the n = 2 is taken here. In this paper, in order to obtain the maximum stress concentration on the machined surface, the Ry in Equation (1) is replaced by Rt. This is because that the maximum height of the profile Rt can reflect the worst defect of machined surface. So the Kst in this article is mainly influenced by Ra, Rt, Rz and .
The acquisition process of the effective profile valley radius is shown in Figure 4a (Taking FT specimen as an example). It can be seen from Figure 4a, a surface topography picture of FT specimen was obtained by wyko NT1100. Then a surface profile is randomly extracted from the 3D topography along the axial direction. The valleys A, B, and C were selected to calculate the average value of valley radius for this profile. The valley radius ρA for A valley is 6.8 μm, which is given directly by the wyko NT1100. Therefore, the valley radius for this profile is the average value of ρA, ρB and ρC. The effective valley radius for the FT specimen is the average of the valley radius for several profiles. The same method can be employed to obtain the values of at other different processes.
In order to obtain the TCPO and TCPA specimen, the TCP specimen surface was ground by using the 800# sandpaper. Therefore, the surface topographies of TCPO and TCPA specimens are extremely different from that of TCP specimens. While the subsurface characteristics of TCPO and TCPA specimens show almost no change with respect to TCP. So in the Section 3.2, we only studied the subsurface characteristics of the FT and TCP processes. The fatigue properties of the specimens are affected by both surface topography and subsurface features. In the Section 3.3, the effects of surface integrity on the fatigue properties for the four processes were investigated.
3.2. Subsurface Characteristics
Residual stresses distributions for FT and TCP conditions are given in Figure 5. For the two conditions, as the depth below the surface increase, the compressive residual stress rapidly increase from a lower value to the maximum value, then gradually reduce to zero stress value. The depth of compressive residual stress layers for the two conditions are all 30 μm. After FT process, surface residual stress σrsur is −231.37 MPa. The maximum compressive stress σrmax is around −390.84 MPa, situated at 10 μm below the surface. After TCP process, surface residual stress σrsur is −86.9 MPa. The σrmax is around −108.22 MPa, situated at 10 μm below the surface. The surface residual stress σrsur and maximum compressive residual stress σrmax after TCP process is much small than that of FT process. It is attributed to a very thin layer of plastic deformation was removed by the surface polishing treatment. Similar results were presented in our previous work [14,20]. Gao et al. [21] reported that surface residual stress of grinding 40CrNi2Si2MoVA steel was −400 MPa and decreased to −80 MPa after electro-polishing.
The microhardness distributions for FT and TCP conditions are given in Figure 6. Surface microhardness after FT process is around 409 HV0.025. While, the surface microhardness after TCP process is about 389 HV0.025. The hardness near the surface is smallest, and then increased with the increasing of depth. Finally, the hardness tends to a stable fluctuation range, in which the hardness of the matrix is around 490 HV0.025. Under the two processes, the machined surface has a distinct softening phenomenon. The depth of softening layer are all about 25 μm. It is attributed to the small thermal conductivity of GH4169 alloy. During processing, the surface area of the material is too hot, resulting in a decrease in hardness.
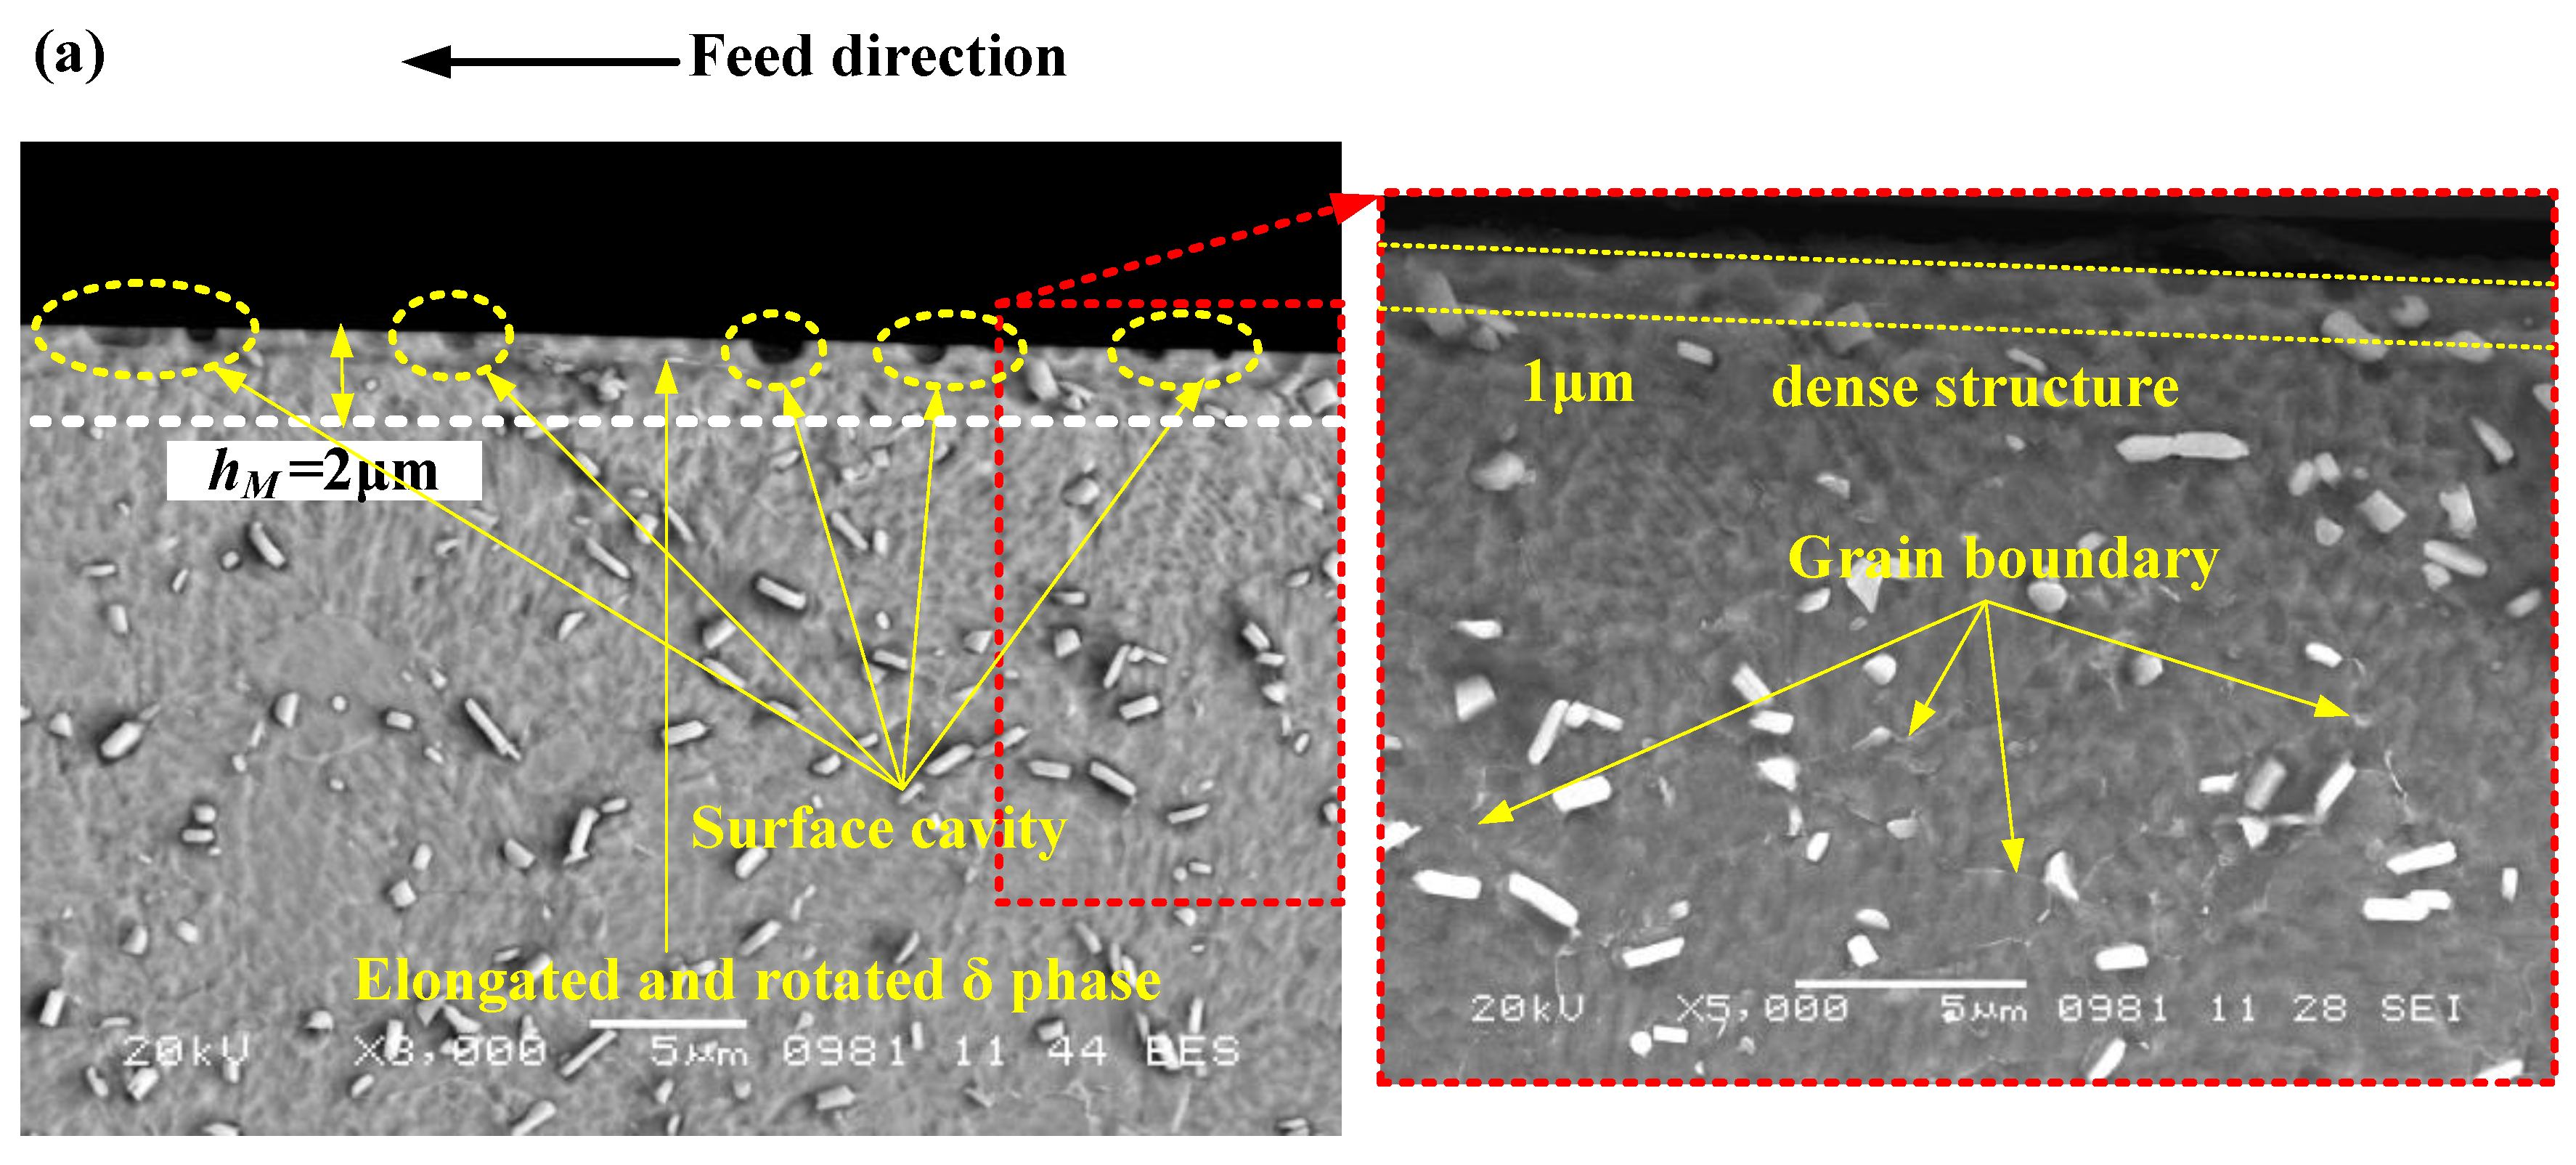
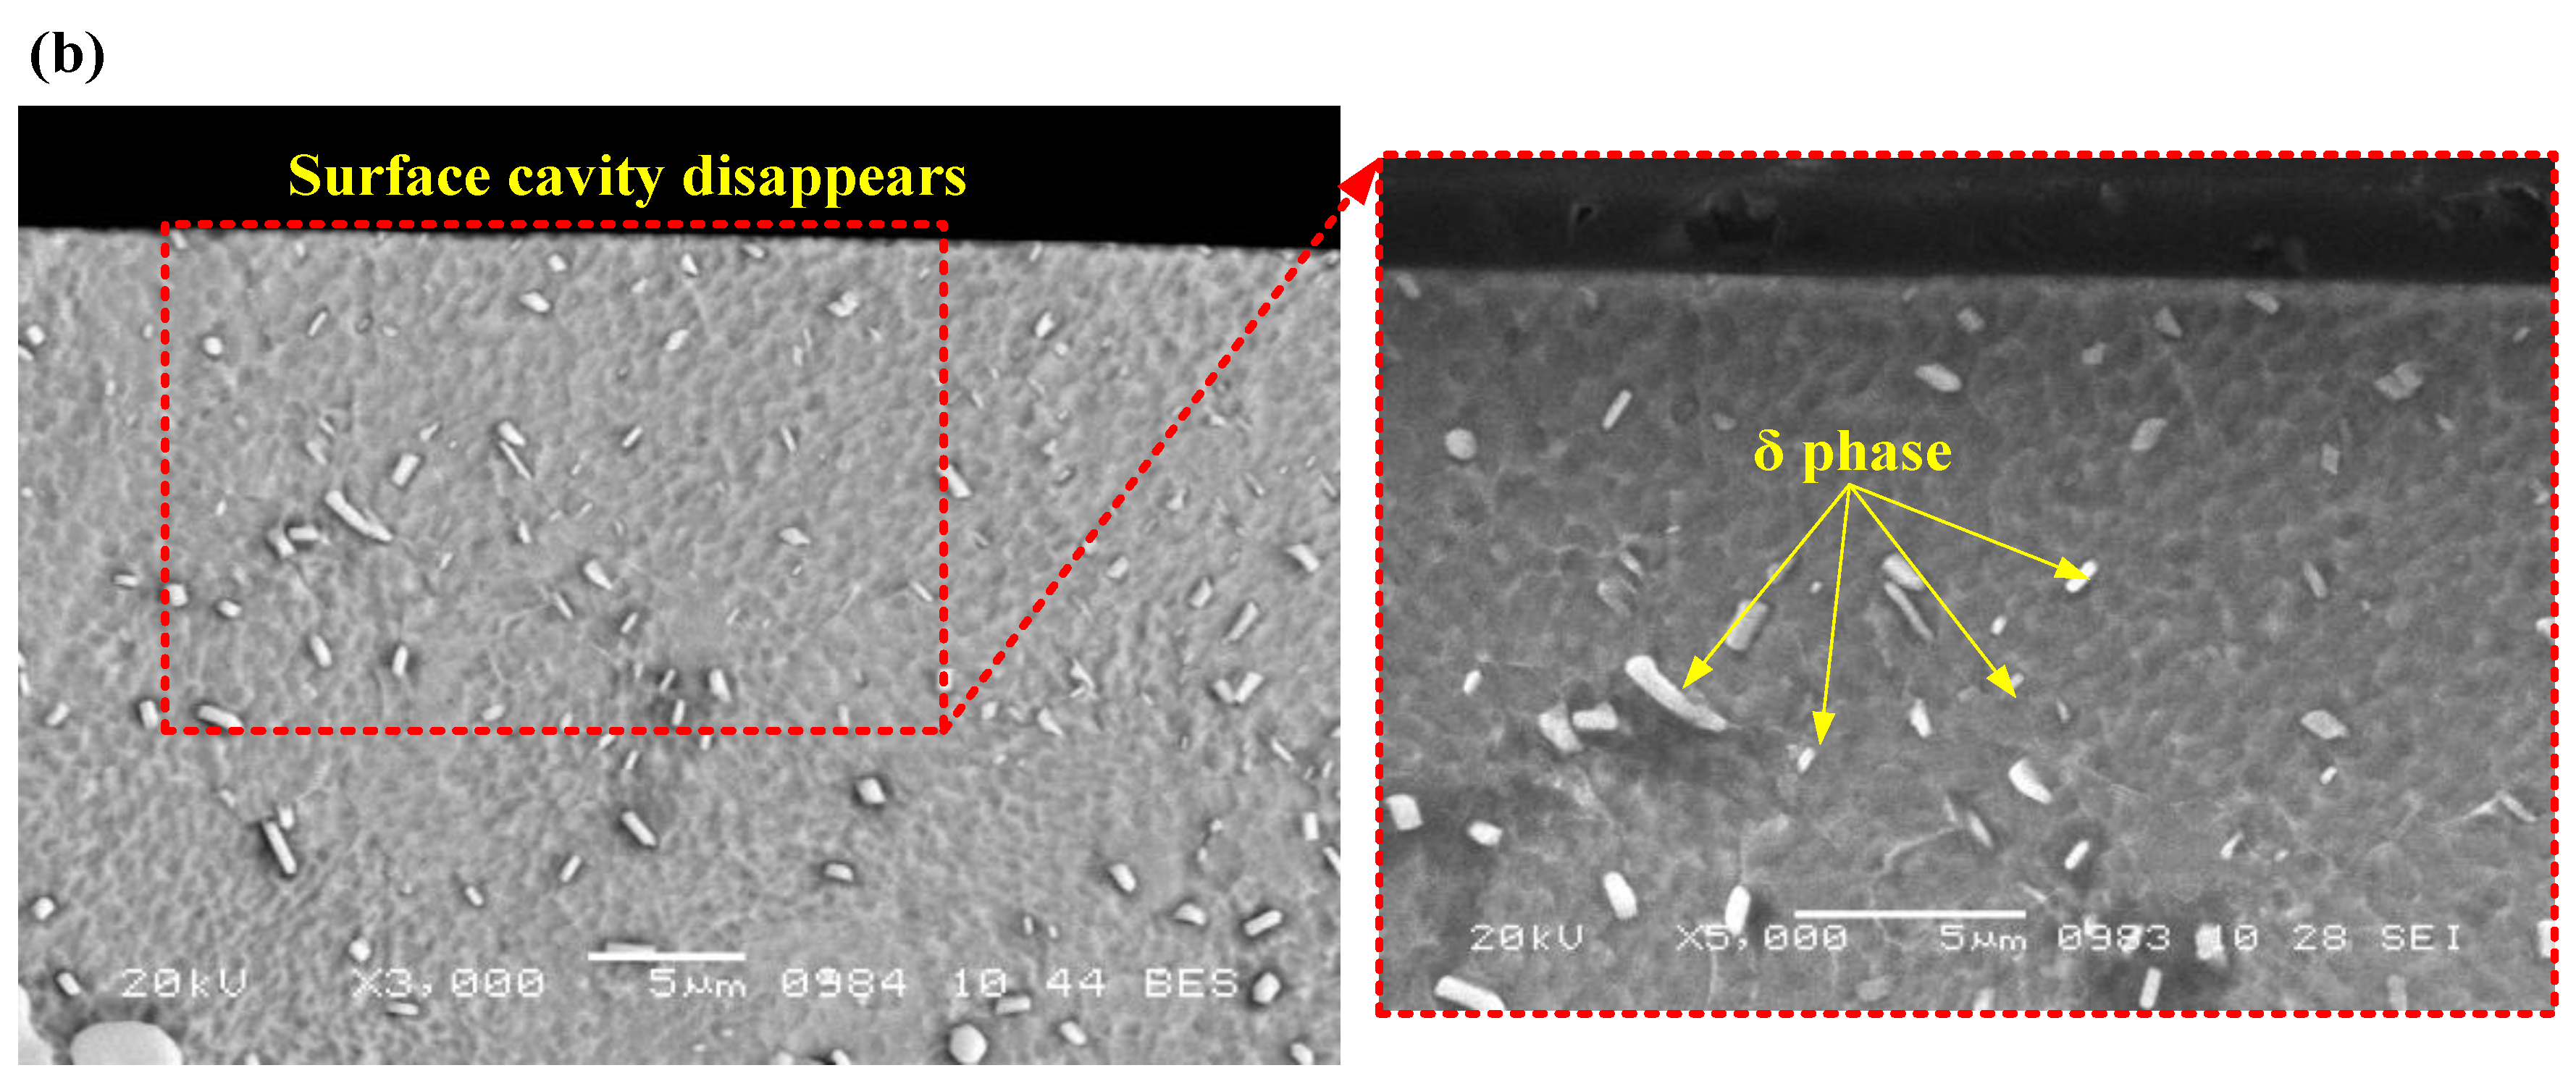
Figure 7 shows the microstructures for FT and TCP processes. In Figure 7a, the plastic deformation layer and surface cavities can be observed. The rotated and elongated δ-Ni3Nb phase can be observed along the turning feed direction in the plastic deformation zone. The turning surface cavities are mainly caused by carbide particles (NbC) peeling. When they are present in the processing feed direction, the carbides are too hard to flow with the plastic layer metal of the specimen, resulting in cracking, which will be removed as the chips, then leave “cavity” on the machined surface. Klotz et al. [22] reported that the machined Inconel 718 surface appears damaged carbide. After the FT process, the depth of plastic deformation layer hM is approximately 2 μm. At the 5000× magnification, the dense tissue can be observed on the top surface with the thickness of 1 μm. Due to the polishing process has removed a very thin layer of plastic deformation, the plastic deformation is absent after TCP process, as shown in Figure 7b.
3.3. Effect of Surface Integrity on Fatigue Life
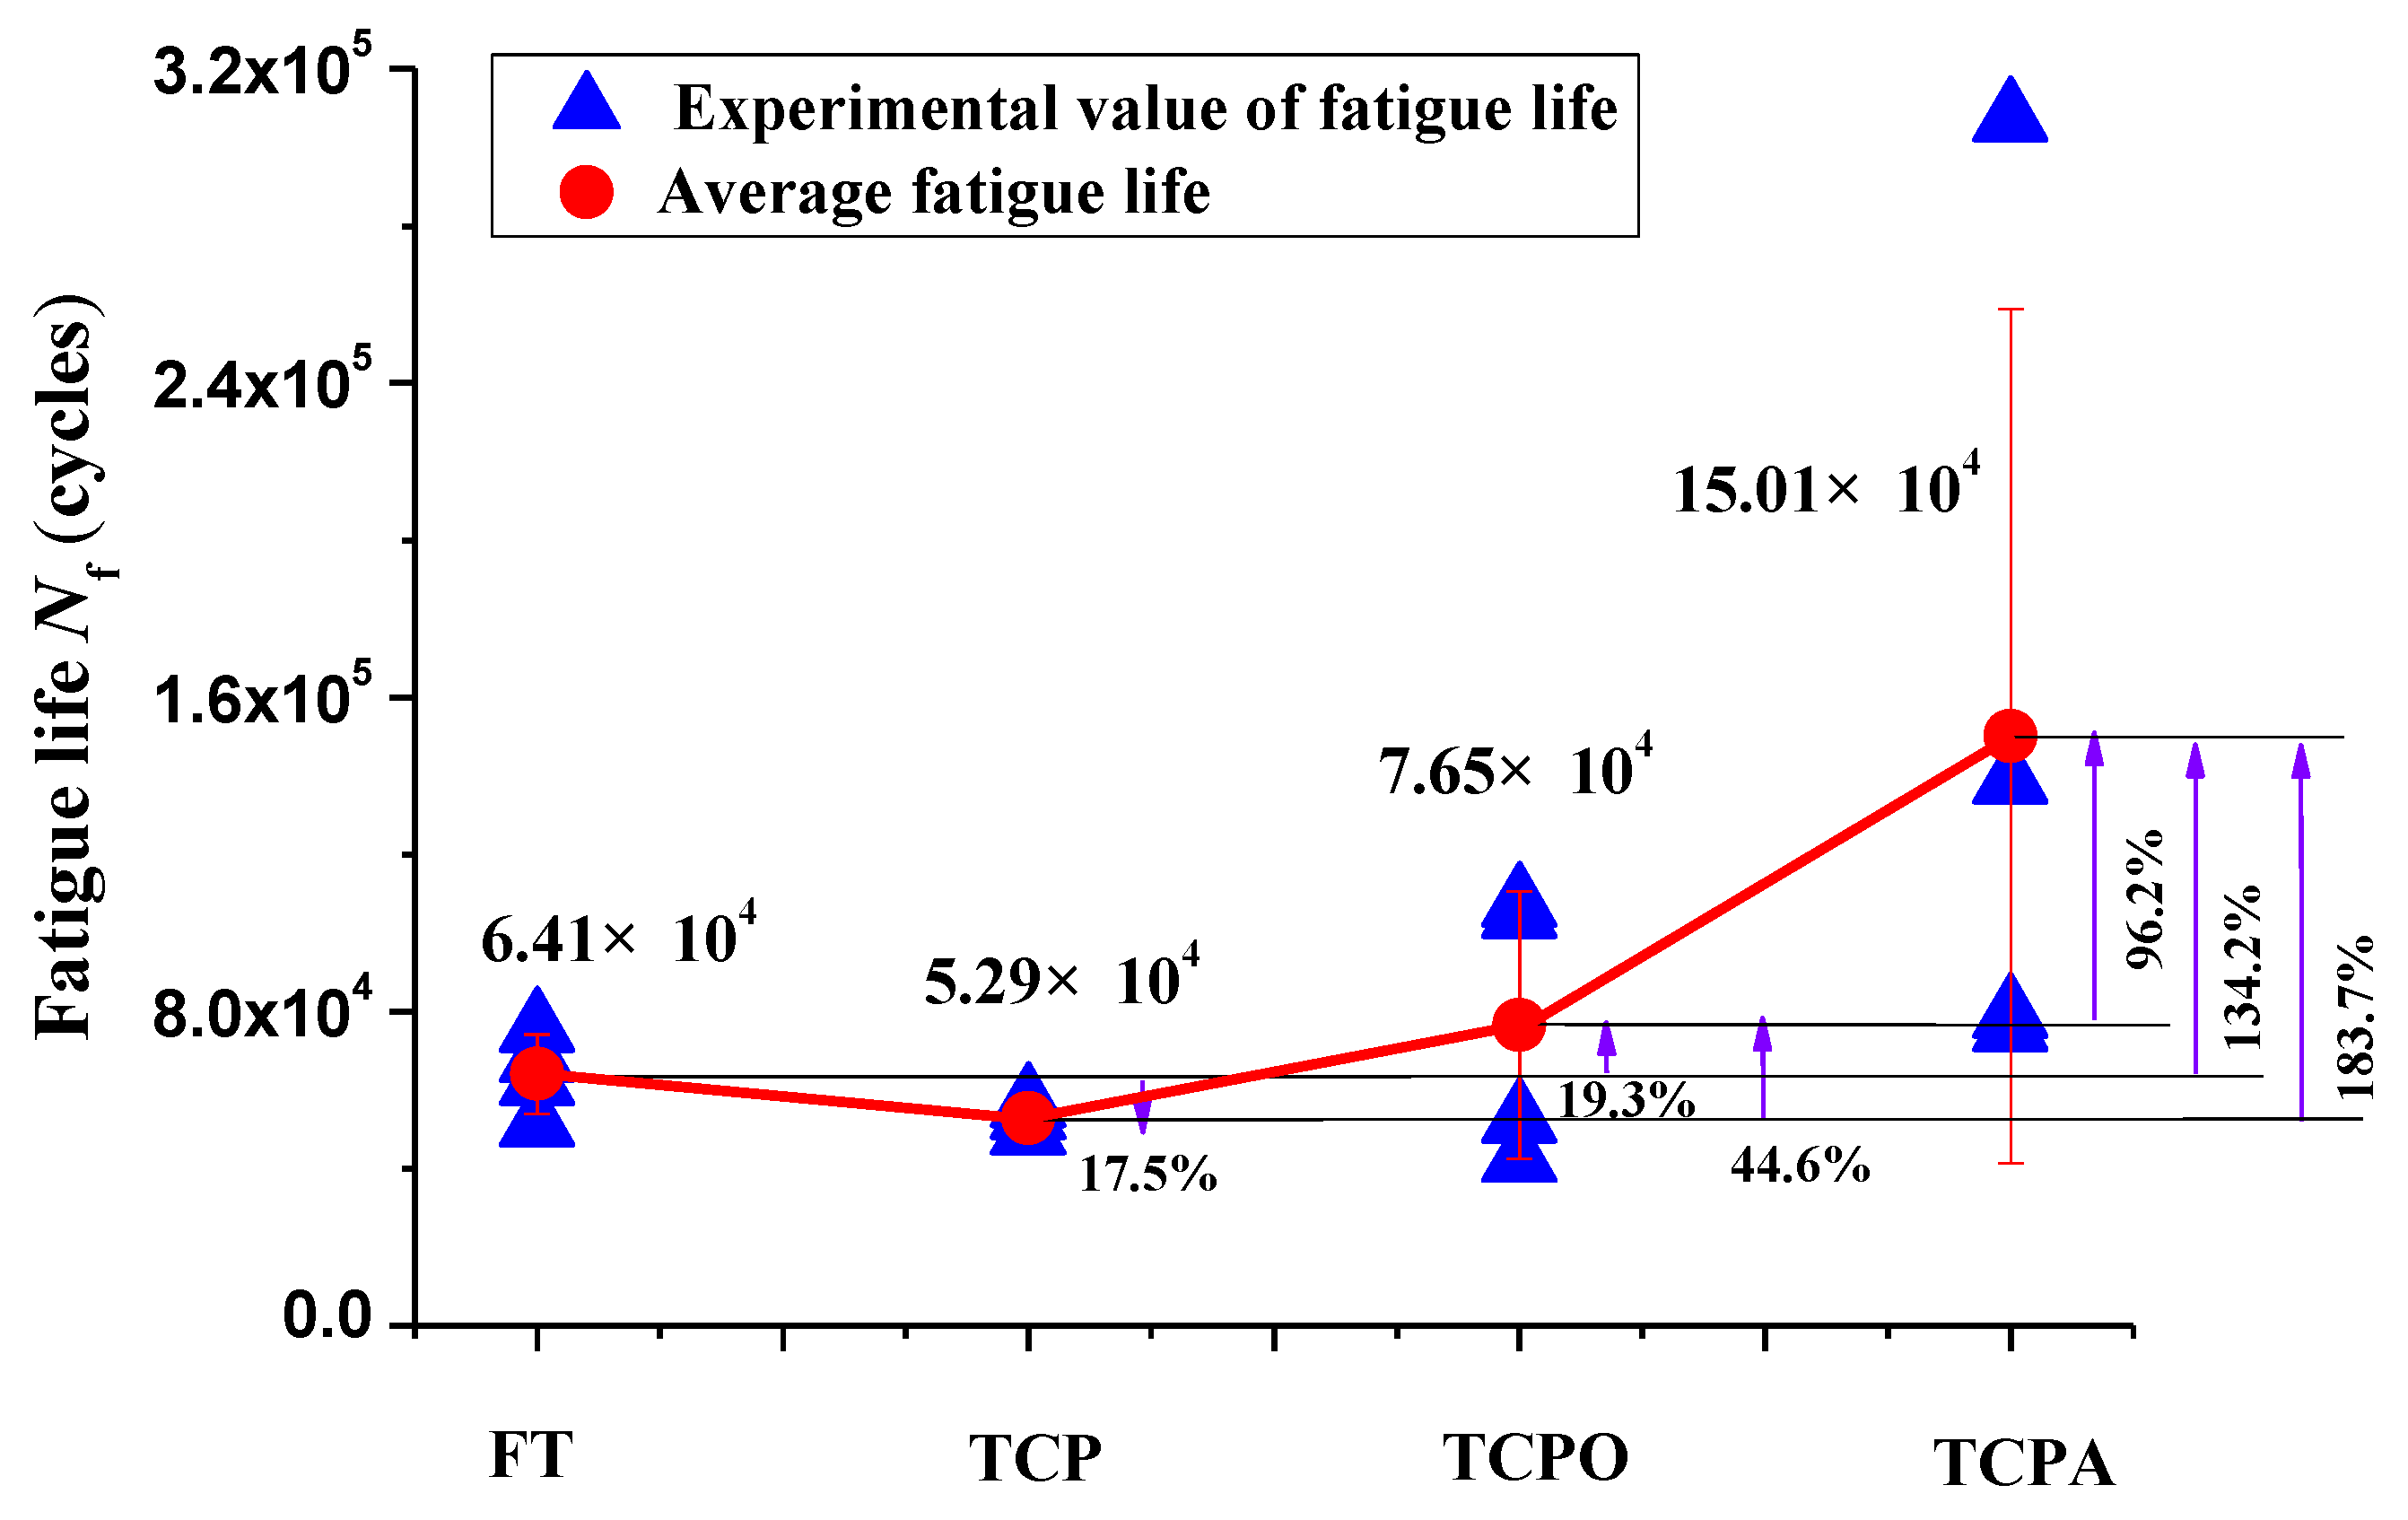
Average fatigue lives at different conditions are shown in Figure 8. The TCP process included 3 fatigue specimens. For the FT, TCPO, and TCPA processes, each series included 4 specimens. The average fatigue lives after FT, TCP, TCPO, and TCPA processes are 6.41 × 10⁴, 5.29 × 10⁴, 7.65 × 10⁴, and 15.01 × 10⁴ cycles, respectively. The specimen with surface axial texture (TCPA) present the longest average fatigue life. By comparison with the FT, TCP, and TCPO specimens, the fatigue lives of TCPA specimen are increased by 134.2%, 183.7%, and 96.2%, respectively.
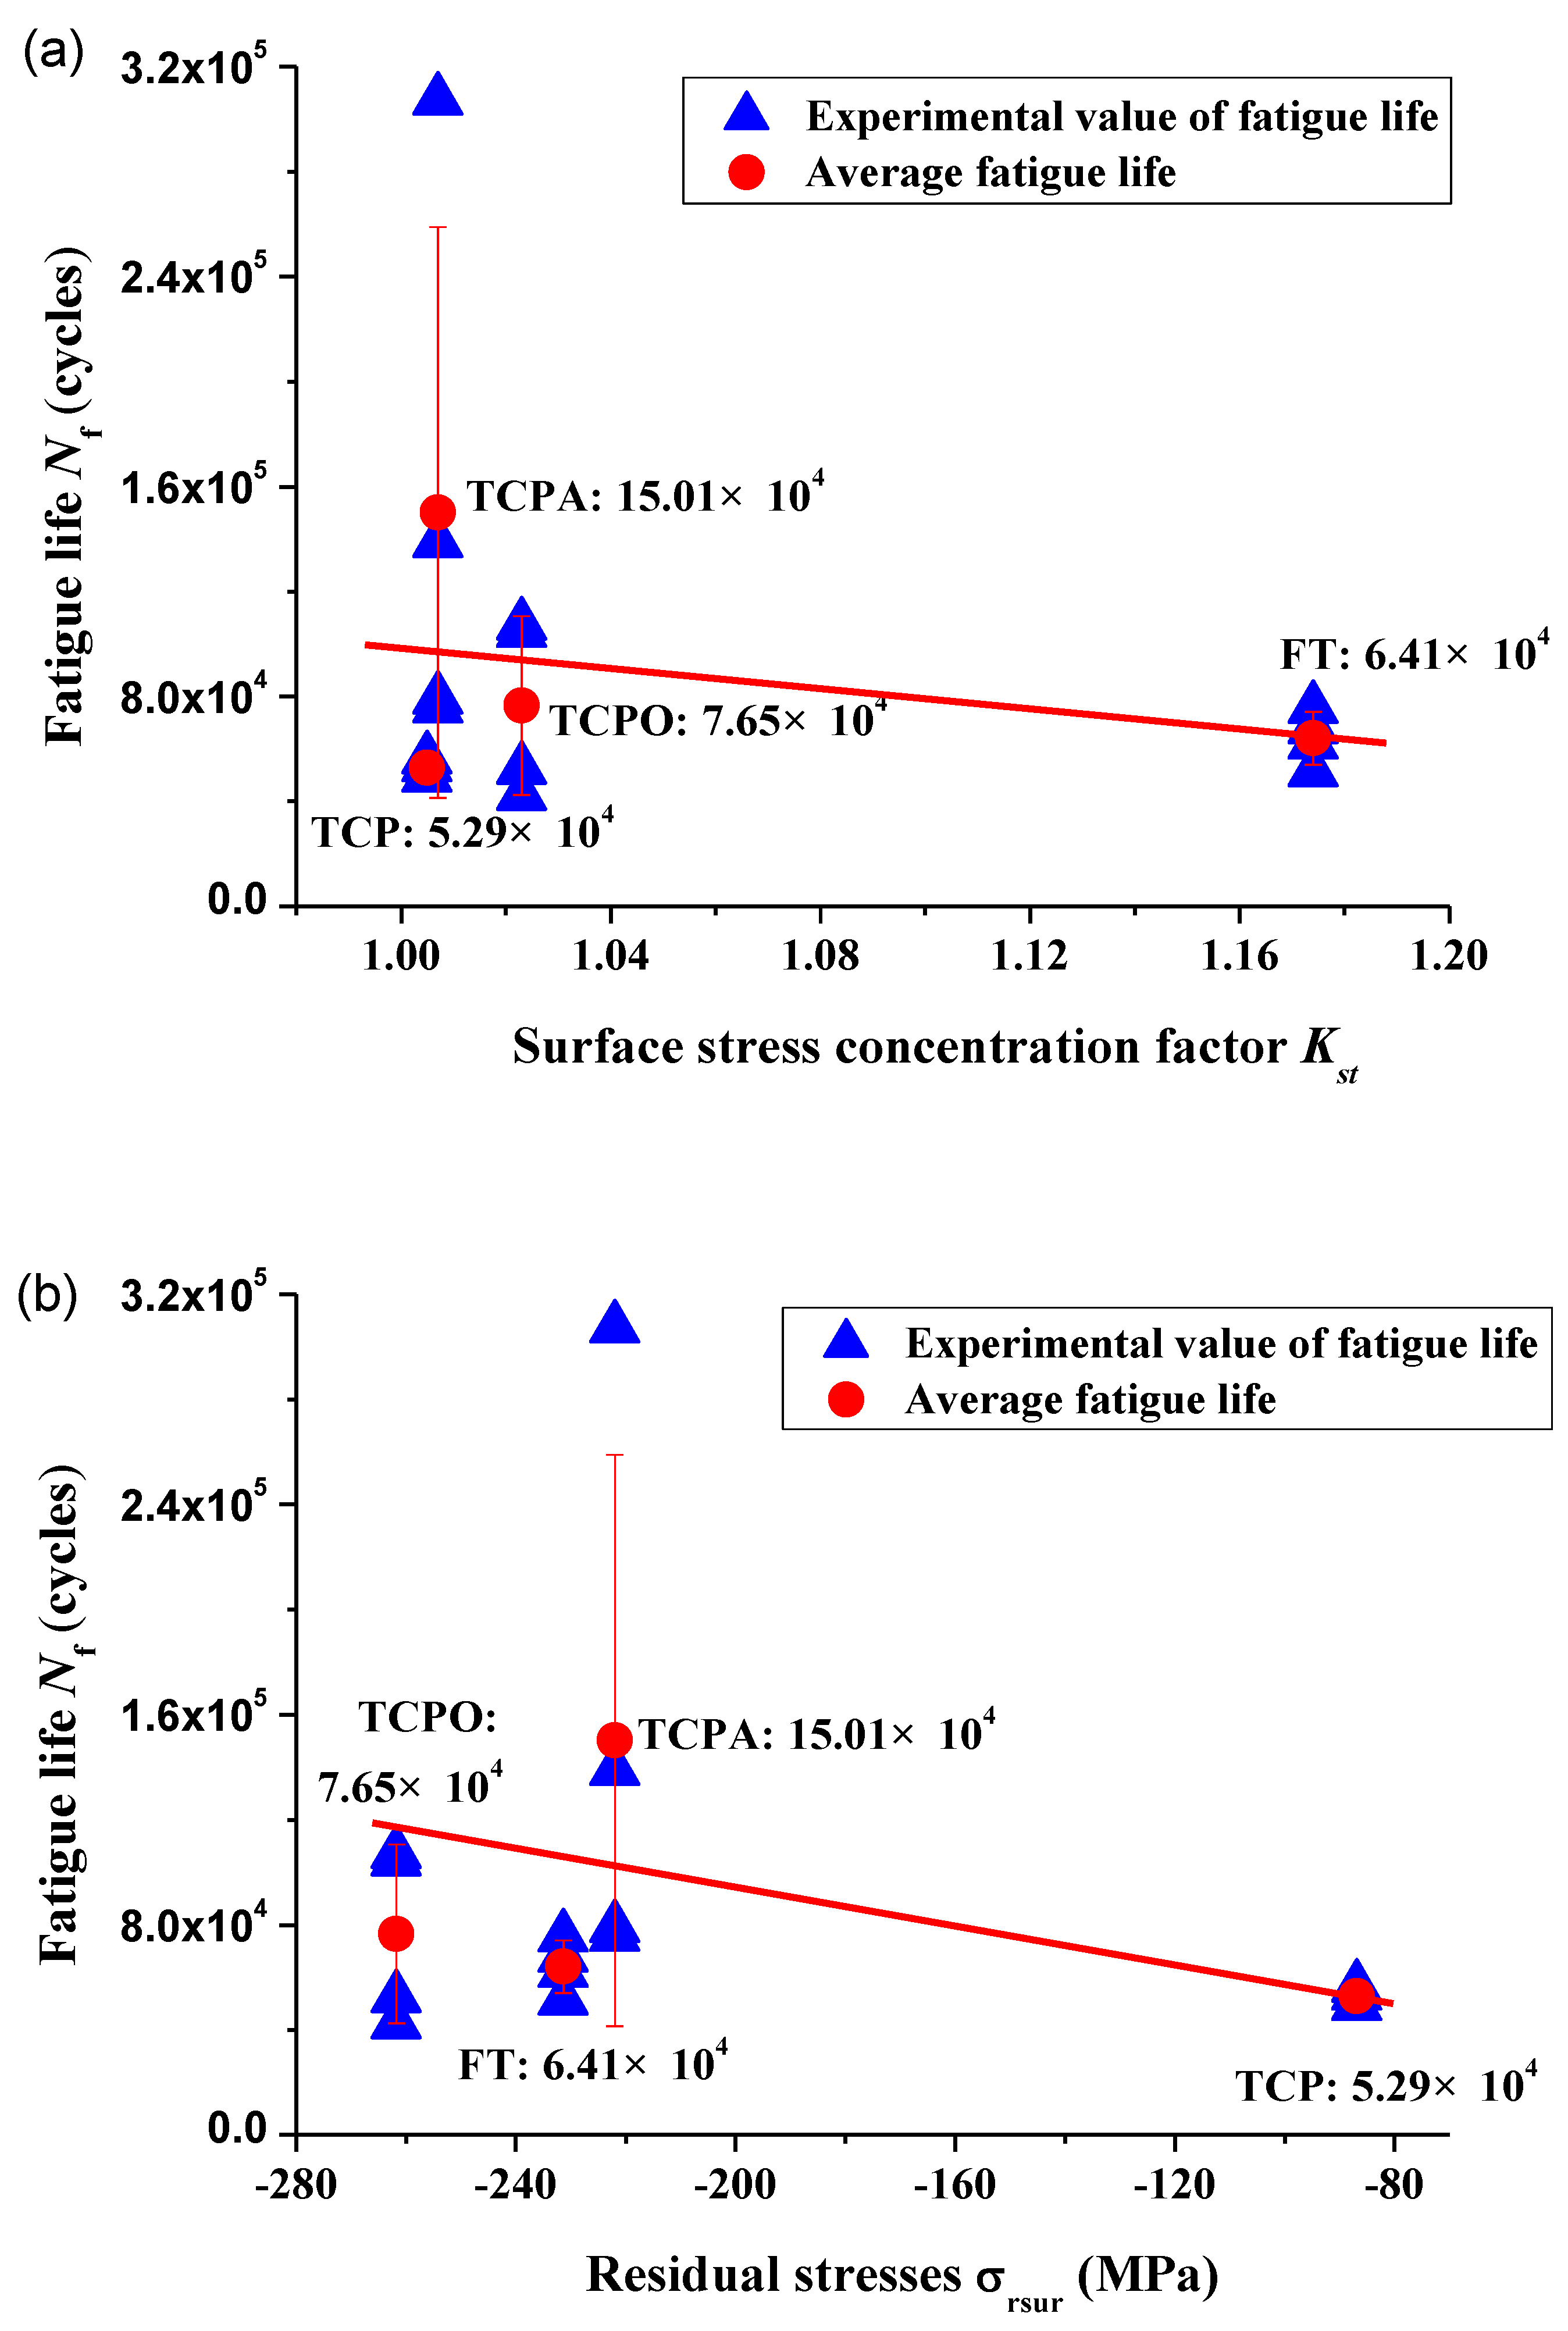
The effects of Kst and σrsur on fatigue life are shown in Figure 9. In Figure 9a, the fatigue life decreases with the increasing of Kst. This is mainly because that the larger the Kst is, the larger the fatigue stress concentration coefficient Kf is, larger surface local stress and strain caused, and the fatigue life reduced. In Figure 9b, the fatigue life reduced with the decreasing of compressive residual stress. Which is mainly because that the effect of residual stress on fatigue life is equivalent to the effect of the average stress.
The effects of surface integrity on fatigue life are shown as follows:
- (1)
- After the FT process, surface stress concentration factor Kst is 1.174. Surface residual stress is −231.37 MPa, and surface microhardness is 409HV0.025. The corresponding fatigue life is 6.41 × 10⁴ cycles.
- (2)
- After the TCP process, surface stress concentration factor Kst is 1.005. Surface residual stress is −86.9 MPa, and surface microhardness is 389HV0.025. The corresponding fatigue life is 5.29 × 10⁴ cycles. Compared with FT process, the fatigue life of TCP specimens is decreased by about 17.5%. After the TCPO process, surface stress concentration factor Kst is 1.023. Surface residual stress is −261.8 MPa and the fatigue life is 7.65 × 10⁴ cycles. Compared with FT and TCP process, the fatigue life of TCPO specimens is increased by about 19.3% and 44.6%, respectively.
- (3)
- After the TCPA process, surface stress concentration factor Kst is 1.007. Surface residual stress is −221.94 MPa and the fatigue life is 15.01 × 10⁴ cycles. TCPA specimen present the longest fatigue life. By comparison with the FT, TCP, and TCPO specimens, the fatigue lives of TCPA specimen are increased by 134.2%, 183.7%, and 96.2%, respectively. Which is attributed to the low Kst, large surface compressive residual stress, and surface axial texture. The surface texture direction for TCPA specimen is consistent with the direction of fatigue stress, which makes the surface fatigue crack not easy to initiate. Wang et al. [23] found that three factors dominate the fatigue strength with crack initiation from the surface: surface fatigue strength, surface compressive residual stress, and surface stress concentration.
3.4. Fatigue Fracture Analysis
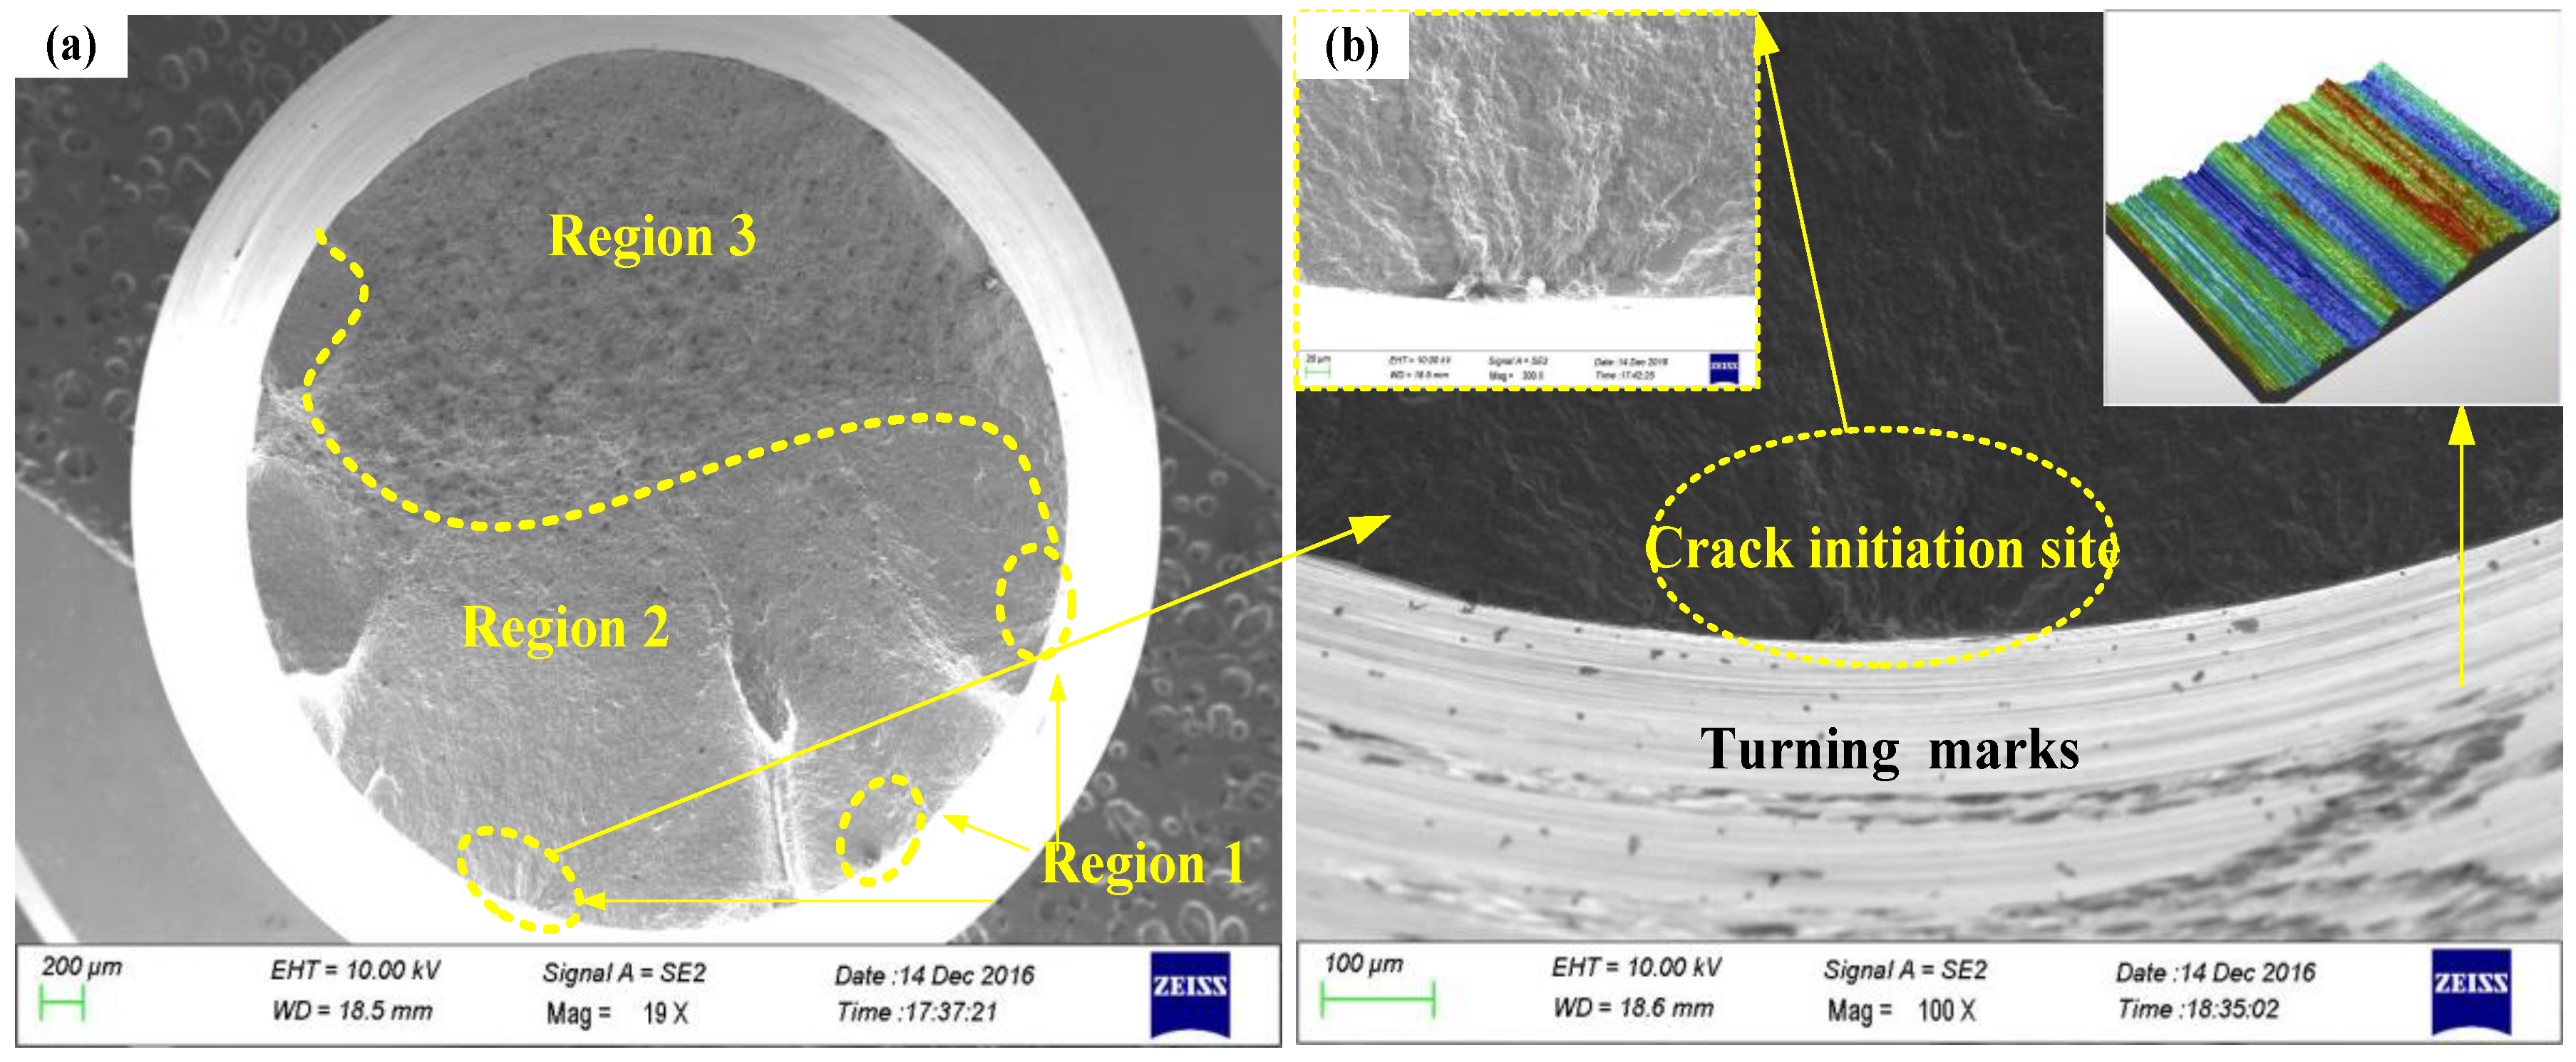
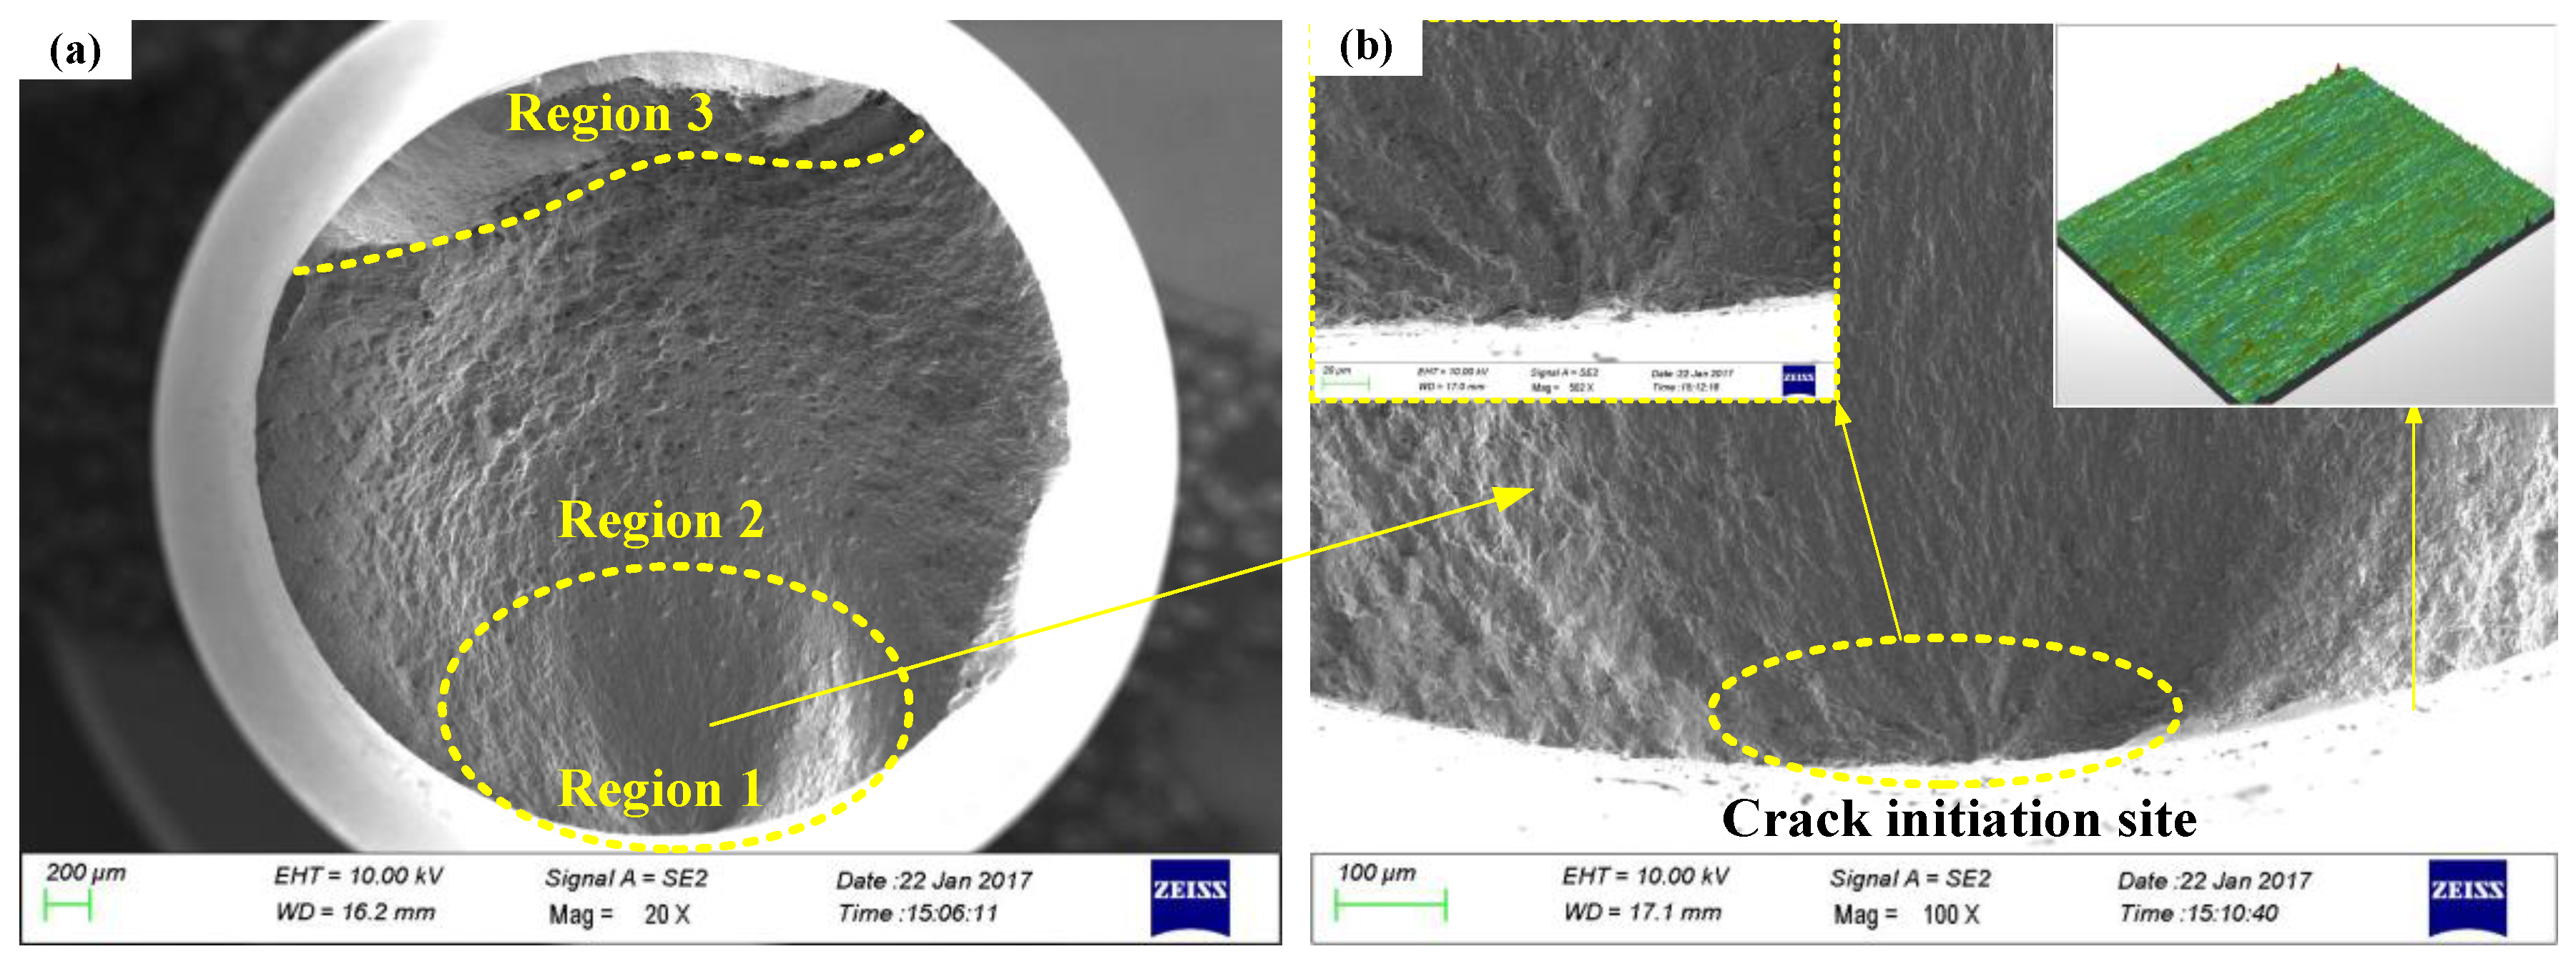
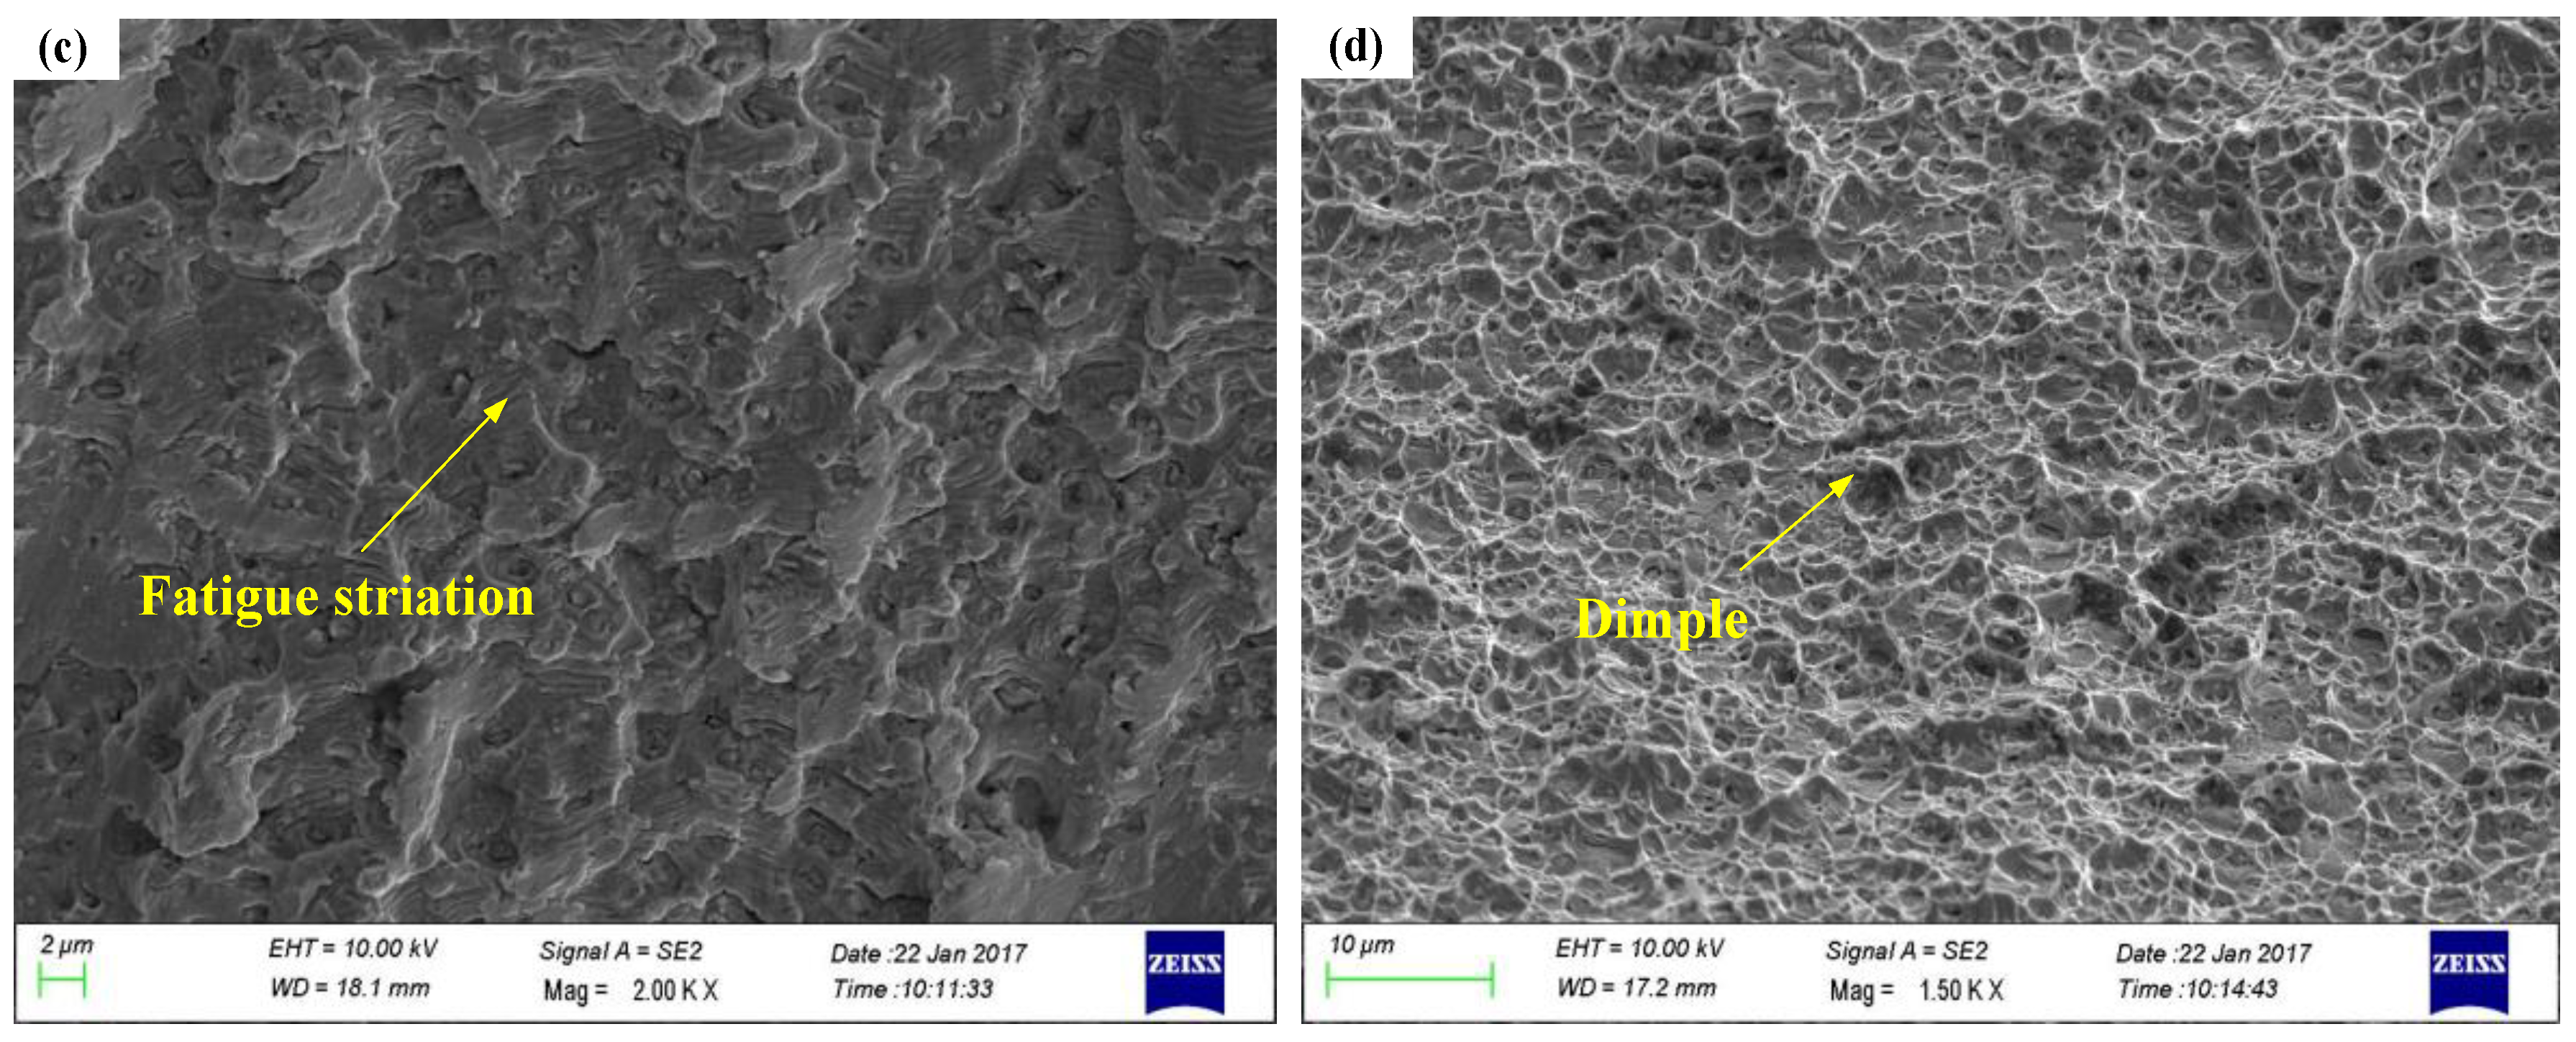
Fatigue morphology after different processes is presented in Figure 10, Figure 11, Figure 12 and Figure 13. Fractography under different processes are shown in Figure 10a, Figure 11a, Figure 12a and Figure 13a. Overview of fracture surface includes crack initiation region (Region 1), crack propagation region (Region 2), and collapse fracture region (Region 3). The smooth and delicate fan-shaped small area can be observed in the Region 1. Fatigue cracks extend to the internal in multiple directions at the same time. All fatigue cracks are nucleated on the machined specimen surface. Klotz et al. [22] found that the carbide or machining marks on machined Inconel 718 surface could result in fatigue cracks. The fractographies of FT, TCP, and TCPO specimens have multi-source fatigue fracture characteristics. However, TCPA specimen has only one fatigue source. In Figure 10b, the clear and deeper machining marks appear on specimen surface (Ra = 0.567 µm), which could result in a high stress concentration factor (Kst = 1.174). In Figure 11b, Figure 12b and Figure 13b the fatigue specimen surfaces are smooth, and the surface roughness for those three specimens are similar (Ra = 0.024 µm for TCP specimen; Ra = 0.087 µm for TCPO specimen; Ra = 0.053 µm for TCPA specimen). Single crack initiation source is obtained from the TCPA specimen. This is mainly attributed to the surface texture direction for TCPA specimen is parallel to the fatigue stress direction, which lead the cracks are not easy to initiation. The fatigue striations and dimples can be observed at all the conditions.
The relationship between the specimen fatigue stress direction and surface texture direction is shown in Figure 14. In the rotating bending fatigue test, the fatigue stress direction is along the axial direction of the fatigue specimen. The maximum stress appears on the specimen surface. In Figure 14a, the circumferential texture is perpendicular to the fatigue stress direction. The grooves distributed in the circumferential direction are prone to initiation cracks and led to multiple crack sources. Those multiple crack sources are easily connected to form a line crack sources. In Figure 14b, the axial texture is parallel to the fatigue stress direction. The bottom of the groove still has the maximum stress concentration factor, and easily form fatigue crack, but the fatigue crack of different grooves were difficult to connect. Thus, the TCPA specimen presented one crack source.
4. Conclusions
Based on the experimental results, the surface roughness, topography, surface stress concentration factor, residual stress, microhardness, and microstructure were obtained under different processes. The effect of the surface integrity and texture direction on fatigue life was investigated. In general, the following conclusions can be formulated:
- (1)
- Under room temperature service conditions, for GH4169 alloy turning and polishing processing, the surface stress concentration factor, and the surface texture direction dominate the fatigue life. The TCPA process present the longest fatigue life of 15.01 × 10⁴ cycles. By comparison with the FT, TCP, and TCPO specimens, the fatigue lives of TCPA specimen are increased by 134.2%, 183.7%, and 96.2%, respectively. The long life for specimen TCPA is mainly attributed to the small stress concentration factor of 1.007 and surface axial texture.
- (2)
- The overview of the fracture surface of GH4169 alloy includes crack initiation region, crack propagation region, and collapse fracture region. Multiple crack sources are observed after FT, TCP, and TCPO processes. While, a single crack initiation source is observed after the TCPA process.
Author Contributions
D.W., D.Z., and C.Y. conceived and designed the experiments; D.W. performed the experiments, analyzed the data, and wrote the paper; D.Z. and C.Y. contributed to writing-review & editing of the paper.
Acknowledgments
The authors wish to thank the support of the National Natural Science Foundation of China (Grant No. 51375393), and the Natural Science Basic Research Plan in Shaanxi Province of China (Grant No. 2017JM5031).
Conflicts of Interest
The authors declare no conflicts of interest.
References
- Kamata, Y.; Obikawa, T. High speed MQL finish-Turning of Inconel 718 with different coated tools. J. Mater. Process. Technol. 2007, 192, 281–286. [Google Scholar] [CrossRef]
- Thakur, D.G.; Ramamoorthy, B.; Vijayaraghavan, L. Study on the machinability characteristics of superalloy Inconel 718 during high speed turning. Mater. Des. 2009, 30, 1718–1725. [Google Scholar] [CrossRef]
- Akhtar, W.; Sun, J.; Chen, W. Effect of machining parameters on surface integrity in high speed milling of super alloy GH4169/Inconel 718. Mater. Manuf. Process. 2016, 31, 620–627. [Google Scholar] [CrossRef]
- Devillez, A.; Le Coz, G.; Dominiak, S.; Dudzinski, D. Dry machining of Inconel 718, workpiece surface integrity. J. Mater. Process. Technol. 2011, 211, 1590–1598. [Google Scholar] [CrossRef]
- Li, X.; Ma, S.; Meng, F. Surface integrity of GH4169 affected by cantilever finish grinding and the application in aero-Engine blades. Chin. J. Aeronaut. 2015, 28, 1539–1545. [Google Scholar] [CrossRef]
- Liu, W.; Li, X.; W, X.; Li, F.; Shan, C. The effects of turning parameters on machining surface integrity in high speed turning GH4169. Mech. Sci. Technol. Aerosp. Eng. 2013, 32, 1093–1097. [Google Scholar]
- Huang, X.; Zhang, D.; Shi, K.; Ren, J. Research on the mechanism of residual stress and its influence on fatigue life in grinding superalloy. DEStech Trans. Eng. Technol. Res. 2016. [Google Scholar] [CrossRef]
- Hood, R.; Morris, J.; Soo, S.L. Workpiece surface integrity when milling Udimet 720 superalloy. Proced. CIRP. 2016, 45, 283–286. [Google Scholar] [CrossRef]
- Wang, X.; Huang, C.; Zou, B.; Liu, G.; Zhu, H.; Wang, J. Experimental study of surface integrity and fatigue life in the face milling of Inconel 718. Front. Mech. Eng. 2018, 13, 243–250. [Google Scholar] [CrossRef]
- Chomienne, V.; Valiorgue, F.; Rech, J.; Verdu, C. Influence of ball burnishing on residual stress profile of a 15-5PH stainless steel. CIRP J. Manuf. Sci. Technol. 2016, 13, 90–96. [Google Scholar] [CrossRef]
- López de Lacalle, L.N.; Rodríguez, A.; Lamikiz, A.; Celaya, A.; Alberdi, R. Five-Axis machining and burnishing of complex parts for the improvement of surface roughness. Mater. Manuf. Process. 2011, 26, 997–1003. [Google Scholar] [CrossRef]
- González Rojas, H.A.; Sánchez Egea, A.J.; Travieso-Rodríguez, J.A.; Llumài Fuentes, J.; JorbaPeiró, J. Estimation of the polishing time for different metallic alloys in surface texture removal. Mach. Sci. Technol. 2018, 22, 729–741. [Google Scholar] [CrossRef]
- Avilés, R.; Albizuri, J.; Rodríguez, A.; López de Lacalle, L.N. Influence of low-Plasticity ball burnishing on the high-Cycle fatigue strength of medium carbon AISI 1045 steel. Int. J. Fatigue 2013, 55, 230–244. [Google Scholar] [CrossRef]
- Wu, D.; Yao, C.; Zhang, D. Surface characterization and fatigue evaluation in GH4169 superalloy: Comparing results after finish turning; shot peening and surface polishing treatments. Int. J. Fatigue 2018, 113, 222–235. [Google Scholar] [CrossRef]
- Wu, D.; Zhang, D.; Yao, C. Effect of surface integrity of turned GH4169 superalloy on fatigue performance. J. Aeronaut. Mater. 2017, 37, 59–67. [Google Scholar]
- Withers, P.J.; Turski, M.; Edwards, L.; Bouchard, P.J.; Buttle, D.J. Recent advances in residual stress measurement. Int. J. Press. Vessels Pip. 2008, 85, 118–127. [Google Scholar] [CrossRef]
- Haque, R. Residual Stress in self-Piercing riveting (SPR) joints—A review. Mater. Perform. Charact. 2018, 7. [Google Scholar] [CrossRef]
- Grzesik, W.; Zak, K. Modification of surface finish produced by hard turning using superfinishing and burnishing operations. J. Mater. Process. Technol. 2012, 212, 315–322. [Google Scholar] [CrossRef]
- Arola, D.; Williams, C.L. Estimating the fatigue stress concentration factor of machined Surfaces. Int. J. Fatigue 2002, 24, 923–930. [Google Scholar] [CrossRef]
- Yao, C.; Wu, D.; Ma, L.; Tan, L.; Zhou, Z.; Zhang, J. Surface integrity evolution and fatigue evaluation after milling mode, shot-peening and polishing mode for TB6 titanium alloy. Appl. Surf. Sci. 2016, 387, 1257–1264. [Google Scholar] [CrossRef]
- Gao, Y.; Li, X.; Yang, Q.; Yao, M. Influence of surface integrity on fatigue strength of 40CrNi2Si2MoVA steel. Mater. Lett. 2007, 61, 466–469. [Google Scholar] [CrossRef]
- Klotz, T.; Delbergue, D.; Bocher, P.; Lévesque, M.; Brochu, M. Surface characteristics and fatigue behavior of shot peened Inconel 718. Int. J. Fatigue 2018, 110, 10–21. [Google Scholar] [CrossRef]
- Wang, S.; Li, Y.; Yao, M.; Wang, R. Fatigue limits of shot-Peened metals. J. Mater. Process. Technol. 1998, 73, 57–63. [Google Scholar] [CrossRef]
Figure 1.
SEM observation of GH4169 alloy microstructure.

Figure 2.
Geometry of fatigue specimen.

Figure 3.
Specimen preparation for each series.

Figure 4.
Surface topographies and surface profiles of GH4169: (a) FT process; (b) TCP process; (c) TCPO process and (d) TCPA process.
Figure 4.
Surface topographies and surface profiles of GH4169: (a) FT process; (b) TCP process; (c) TCPO process and (d) TCPA process.


Figure 5.
Residual stresses distributions.

Figure 6.
Microhardness distributions.

Figure 7.
Microstructures of GH4169 alloy: (a) FT process and (b) TCP process.


Figure 8.
Average fatigue lives.

Figure 9.
The effects of Kst and σrsur on fatigue life: (a) effect of Kst on fatigue life and (b) effect of σrsur on fatigue life.
Figure 9.
The effects of Kst and σrsur on fatigue life: (a) effect of Kst on fatigue life and (b) effect of σrsur on fatigue life.

Figure 10.
Fracture surface of FT specimen (Ra = 0.567 µm): (a) overview of fracture surface; (b) Crack nucleation site; (c) fatigue striations and (d) dimples.
Figure 10.
Fracture surface of FT specimen (Ra = 0.567 µm): (a) overview of fracture surface; (b) Crack nucleation site; (c) fatigue striations and (d) dimples.


Figure 11.
Fracture surface of TCP specimen (Ra = 0.024 µm): (a) overview of fracture surface; (b) Crack nucleation site; (c) fatigue striations and (d) dimples.
Figure 11.
Fracture surface of TCP specimen (Ra = 0.024 µm): (a) overview of fracture surface; (b) Crack nucleation site; (c) fatigue striations and (d) dimples.

Figure 12.
Fracture surface of TCPO specimen (Ra = 0.087 µm): (a) overview of fracture surface; (b) Crack nucleation site; (c) fatigue striations and (d) dimples.
Figure 12.
Fracture surface of TCPO specimen (Ra = 0.087 µm): (a) overview of fracture surface; (b) Crack nucleation site; (c) fatigue striations and (d) dimples.

Figure 13.
Fracture surface of TCPA specimen (Ra = 0.053 µm): (a) overview of fracture surface; (b) Crack nucleation site; (c) fatigue striations and (d) dimples.
Figure 13.
Fracture surface of TCPA specimen (Ra = 0.053 µm): (a) overview of fracture surface; (b) Crack nucleation site; (c) fatigue striations and (d) dimples.


Figure 14.
Relationship between fatigue stress direction and surface texture direction: (a) TCP specimen and (b) TCPA specimen.
Figure 14.
Relationship between fatigue stress direction and surface texture direction: (a) TCP specimen and (b) TCPA specimen.


Table 1.
Machining processes for each series.
| Symbol | Machining Operation |
|---|---|
| FT | Finish turning: feed rate f = 0.06 mm/r, ap = 0.2 mm, n = 1000 r/min |
| TCP | Finish turning + surface polishing along circumferential direction |
| TCPO | Finish turning + surface polishing along circumferential direction+sandpaper grinding along oblique direction |
| TCPA | Finish turning + surface polishing along circumferential direction +sandpaper grinding along axial direction |
Table 2.
The average value of surface roughness and fatigue life at different processes. Av.Nf: average fatigue life. Std: standard deviation.
Table 2.
The average value of surface roughness and fatigue life at different processes. Av.Nf: average fatigue life. Std: standard deviation.
| Symbol | Ra (μm) | Std(μm) | Rz (μm) | Std(μm) | Ry (μm) | Std(μm) | Rt (μm) | Std(μm) | Rsm (μm) | Std(μm) | Av. Nf (×104Cycles) | Std (×104Cycles) |
|---|---|---|---|---|---|---|---|---|---|---|---|---|
| FT | 0.567 | 0.07 | 3.37 | 0.36 | 4.51 | 0.61 | 4.662 | 0.33 | 141.693 | 27.28 | 6.41 | 1.01 |
| TCP | 0.024 | 0.01 | 0.271 | 0.26 | 0.445 | 0.47 | 0.455 | 0.46 | 77.258 | 60.35 | 5.29 | 0.35 |
| TCPO | 0.087 | 0.002 | 0.874 | 0.04 | 1.083 | 0.15 | 1.156 | 0.09 | 36.97 | 3.11 | 7.65 | 3.4 |
| TCPA | 0.053 | 0.004 | 0.61 | 0.1 | 0.955 | 0.14 | 1.081 | 0.23 | 78.488 | 15.34 | 15.01 | 10.87 |
© 2018 by the authors. Licensee MDPI, Basel, Switzerland. This article is an open access article distributed under the terms and conditions of the Creative Commons Attribution (CC BY) license (http://creativecommons.org/licenses/by/4.0/).
Share and Cite
MDPI and ACS Style
Wu, D.; Zhang, D.; Yao, C. Effect of Turning and Surface Polishing Treatments on Surface Integrity and Fatigue Performance of Nickel-Based Alloy GH4169. Metals 2018, 8, 549. https://doi.org/10.3390/met8070549
AMA Style
Wu D, Zhang D, Yao C. Effect of Turning and Surface Polishing Treatments on Surface Integrity and Fatigue Performance of Nickel-Based Alloy GH4169. Metals. 2018; 8(7):549. https://doi.org/10.3390/met8070549
Chicago/Turabian StyleWu, Daoxia, Dinghua Zhang, and Changfeng Yao. 2018. "Effect of Turning and Surface Polishing Treatments on Surface Integrity and Fatigue Performance of Nickel-Based Alloy GH4169" Metals 8, no. 7: 549. https://doi.org/10.3390/met8070549
Note that from the first issue of 2016, this journal uses article numbers instead of page numbers. See further details here.