A Simple and Efficient Method for Obtaining the Whole-Range Uniaxial Tensile Properties of Pipeline Steel


1
School of Oil and Natural Gas Engineering, Southwest Petroleum University, Sichuan 610500, China
2
State Key Laboratory of Oil and Gas Reservoir Geology and Exploitation, Southwest Petroleum University, Sichuan 610500, China
*
Author to whom correspondence should be addressed.
Metals 2018, 8(7), 555; https://doi.org/10.3390/met8070555
Submission received: 25 June 2018
/
Revised: 12 July 2018
/
Accepted: 17 July 2018
/
Published: 19 July 2018
Abstract
:To obtain the whole-range true stress-true strain curves of API X65, a method is proposed based on the equal proportion principle and digital images. The tensile elongation was obtained by tracing the gauge points on the specimen surface, and the true strain and true stress of API X65 were calculated according to the formulae. The obtained true stress-true strain curves were validated by a 3-D finite element model. The true stress-true strain curve was set as the input data, while the engineering stress-engineering strain curve was set as the output data. The output data of the finite element model was the same as that of the experiment test. The findings imply that the proposed method could acquire reliable, whole-range true stress-true stain curves. These curves, which depict the material behavior of pipeline steel from initial elongation to fracture, could provide basic data for pipeline defect tolerance limit analysis and fracture assessment.
1. Introduction
In pipeline safety evaluations, such as defect tolerance analysis and fracture assessment, the numerical finite element method is widely adopted [1,2,3]. The stress-strain curve of the pipeline forms the basic data for the full-size finite element simulation. The stress and strain data obtained by a traditional strain gauge could meet the requirements of ordinary strength evaluation, but it is not applicable for pipeline fracture assessments. Pipeline steel is a ductile material, and the crack tip will be in a large scale yielding and a large strain state, when crack propagation occurs. The traditional stress-strain curve only contains the data before the onset of necking, and the whole fracture process of the pipeline cannot be accurately described. Therefore, it is necessary to test the whole-range true stress-true strain curve of the pipeline steel.
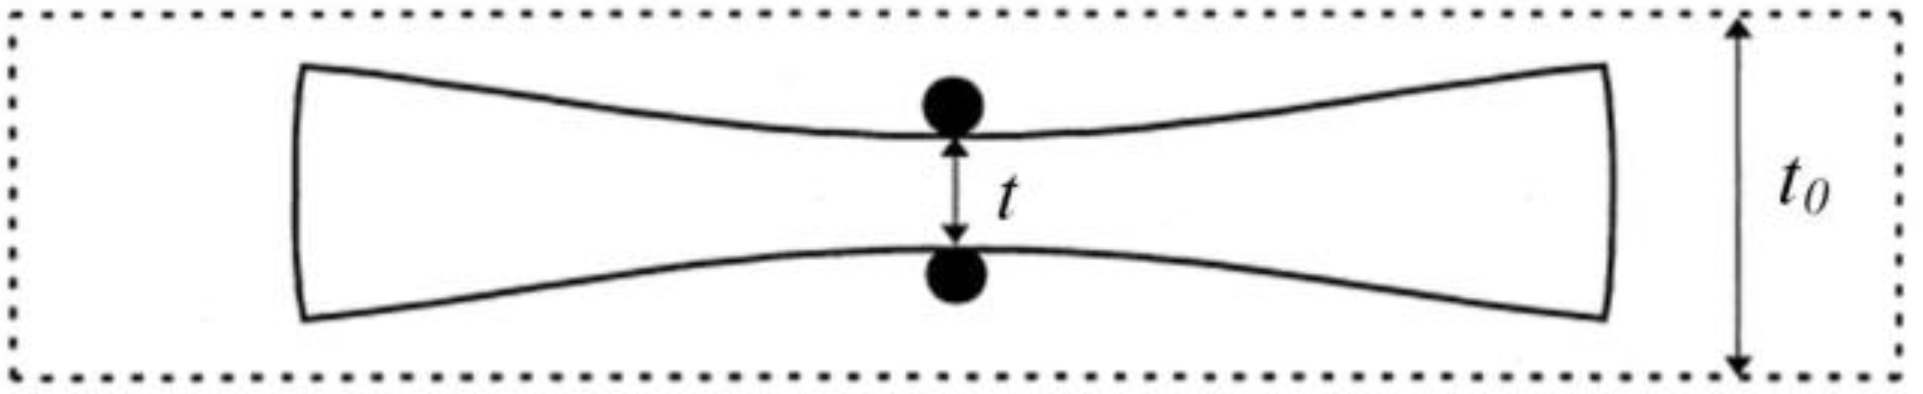
There are many methods for testing and calculating the true stress and true strain, which are divided into three types: the special strain gauge method, the numerical finite element method, and the DIC-based method. The specimens adopted in the special strain gauge method are mainly straight rectangular cross-section specimens. In a safety analysis of pipeline steel, Xin et al. [4] used displacement sensors to measure both axial and lateral displacements, and then obtained the true stress-true strain curves of X65, X80, and other pipeline steels. However, the study did not illustrate how to get the true stress-true strain curve through the axial and lateral displacements. Based on the principle of volume incompressibility, Wang [5] proposed a true stress-true strain calculation formula for round bar specimens. Zhang et al. [6] proposed a method to test the true stress-true strain curve of rectangular cross-section specimens. He quantified the relationship between the area reduction rate and the thickness reduction rate for rectangular cross-section specimens under a tensile load. In the experiment, only three parameters (the load, displacement, and thickness) need to be tested. The thickness parameter could be tested by the special strain gauge shown in Figure 1. On this basis, Zhang et al. [7] also proposed a method to test the material properties of a weld area through a concave circular cross-section specimen. However, he did not provide a way to get the strain either.
Yao et al. [8] developed a method to obtain material uniaxial constitutive properties by combining a tensile test and a finite element method, calling it the Test-Finite element method. Kamaya et al. [9] and Joun and Kawakubo [10] also combined an experimental method and a finite element method to obtain the true stress-true strain curves. The iterative process in the combined method aimed at the equivalence of the ultimate load-displacement curves for the experiment and finite element results. However, the required iterative computation is tedious and time-consuming.
With the development of computer technology and the improvement of camera lens resolution, methods utilizing DIC (Digital Image Correlation) technology to test the material true stress-true strain curve have been widely used [11,12,13,14,15]. Based on DIC technology, Poulain et al. [16] proposed three methods to get a true stress-true strain curve: VSE (Video-based Surface Extensometry), VRE (Video-based Radial Extensometry), and local DIC. These three methods are all based on the principle of incompressible volume, and the true stress-true strain curves were tested through a virtual strain gauge. Grytten et al. [17] also proposed a method for testing the true stress-true strain curve of polymer materials based on DIC technology.
Methods using a special strain gauge are difficult to implement because special equipment is required [6,7], while the numerical finite element method is cumbersome because it requires iterative calculation [10]. The DIC-based method could accurately obtain the true strain value of the material, even if it has undergone severe necking. However, it also has large drawbacks: the erection of DIC equipment requires certain space and conditions [18]; the specimens need to be sprayed with powder before the test, and the speckle’s quality directly affects the accuracy of the final results [19]; and the operation of DIC equipment requires specialized training and learning. In addition, DIC equipment costs more than hundred thousand dollars, and the general laboratory is likewise difficult to afford. Therefore, building on the concept of DIC technology and a traditional extensometer test method, this paper develops a method to test the true stress and true strain of ductile material, pipeline steel, using only a digital camera, gauge point and equal proportion principle. Digital imaging was used to record the length during the stretching process, CAD (Computer Aided Design) software was used to extract the real extension length, and the true stain and true stress were calculated according to the formulae.
2. Experiment Preparation
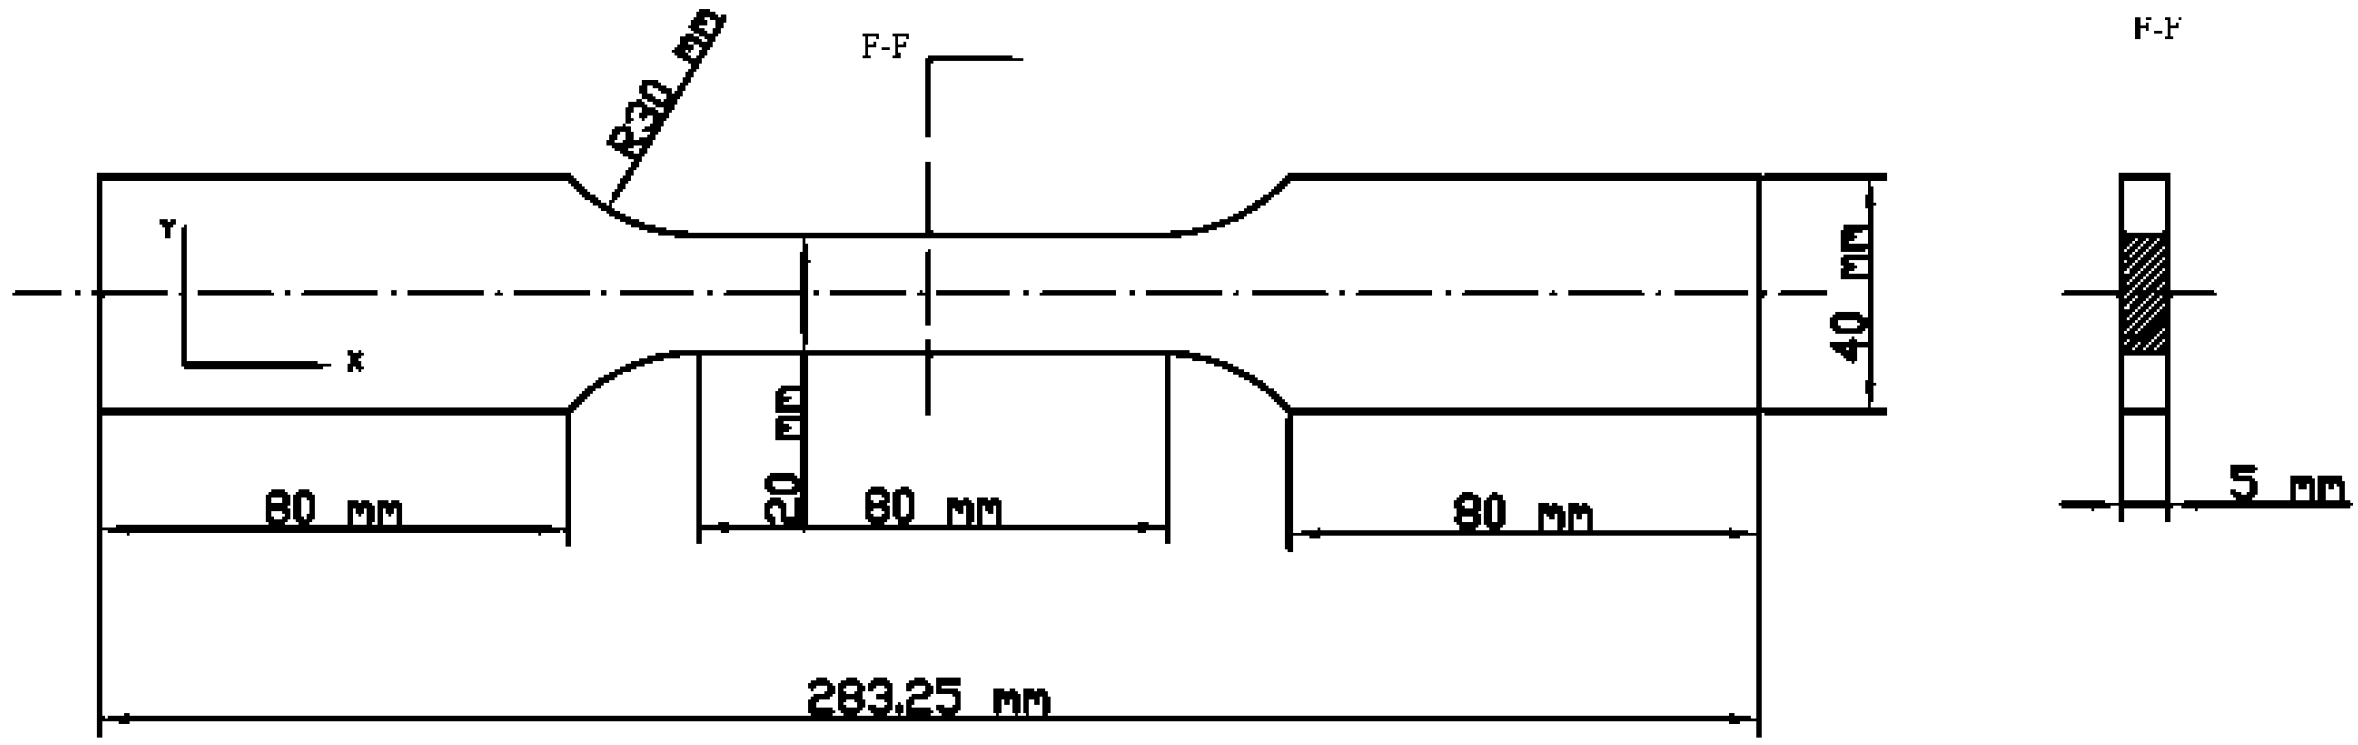
The experimental material is the pipeline steel API-5L X65, and the specimen design matches the international standards ISO 6892-1-2009 [20] and GB/T 228-2002 [21]. The specific specimen size for the uniaxial tensile test is shown in Figure 2. The specimen’s thickness is 5 mm and the width is 20 mm. In this experiment, six L-T specimens were processed: L is the axial direction of the pipeline, and T is the hoop direction of the pipeline. Two specimens form a group, and three groups of specimens were tested: I1, I2, M1, M2, O1, and O2. Two specimens in the same group were machined in adjacent positions. I, M, and O stand for internal, middle, and outside, respectively, and indicate the position of material from the inner wall, the middle, and the outer wall of the pipeline. I1, M1 and O1 were tested by the method, while I2, M2, and O2 were tested by the traditional strain gauge method. Two kinds of results were used for comparison and analysis.
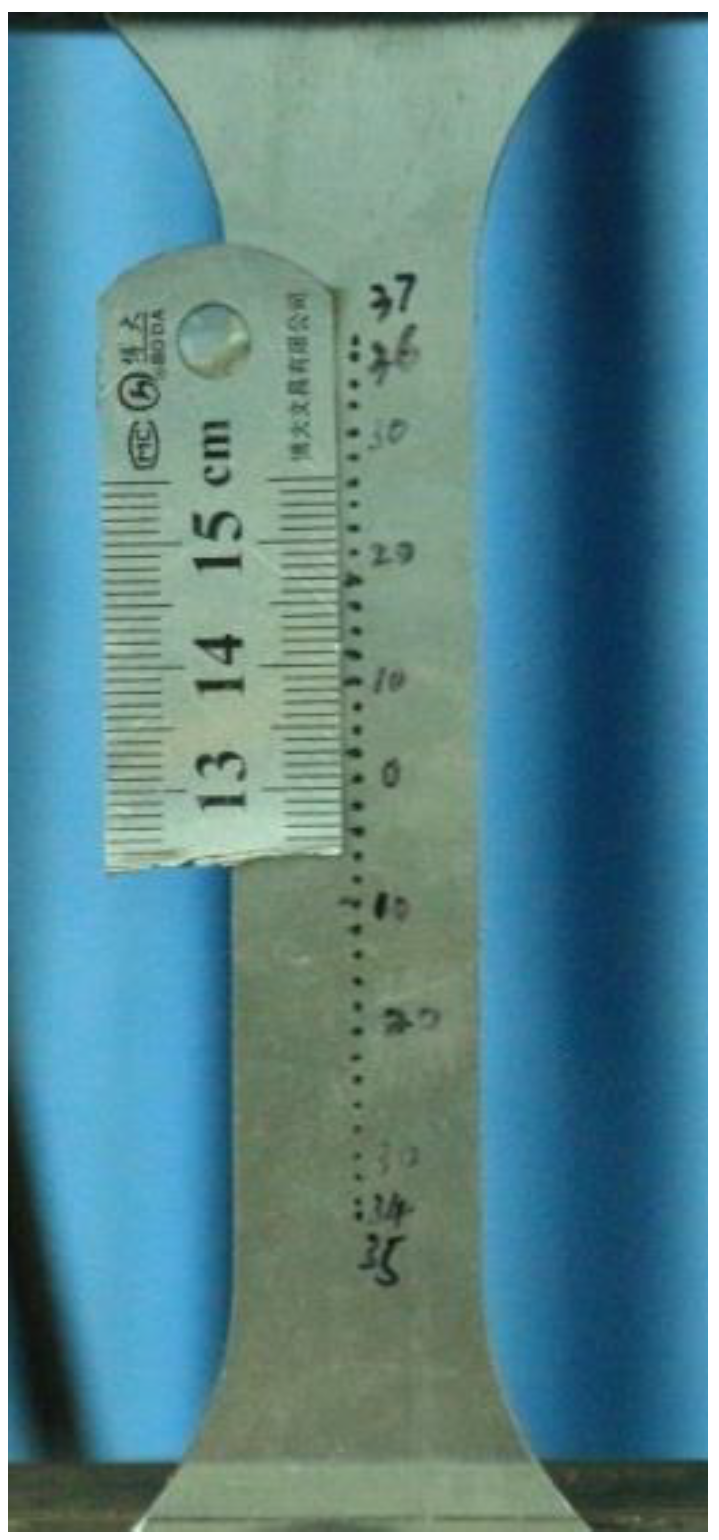
After the specimen was machined, the gauge points were marked with marking pen; the distance between gauge points was 2 mm. These gauge points were distributed along the longitudinal symmetry line of the specimen. After that, the steel ruler with a scale was cut to a shorter length, and the upper part of the steel ruler was fixed on the specimen surface with the glue. The marked specimen is shown in Figure 3. The position of the steel ruler can be adjusted up and down or left and right, if it does not block the gauge points and can be fixed firmly.
3. Experimental Processes
Uniaxial tensile experiments were processed on the MTS-810 type universal material testing machine (MTS System Corporation, Eden Prairie, MN, USA), at a temperature of 22 °C. The specimen was fixed on the 250 KN tensile unit with a hydraulic unit. The stretching process was controlled by a displacement mode of 1 mm/min. The specimen was loaded until it broke. The displacement and load data were recorded and accessed through the MTS control software 793.10 multipurpose TestWare (4.0, MTS System Corporation, Eden Prairie, MN, USA). The traditional strain gauge was mounted on the middle of the specimen and was fixed using rubber band. The gauge length of the strain gauge is 10 mm, and the strain range is ±15%.
To keep the load and the strain of device in synchronization, the time interval to store data was 2 s for MTS, and the time interval to take digital images was 30 s. The initial time for taking the image was set as the moment when the instrument began to stretch. In this way, the corresponding load data can easily be found according to the moment of shooting. The first, second, and third images correspond to row 1, 16, and 31, respectively, in the recorded MTS data. Finally, the true stress-true strain curve was obtained through subsequent data processing and calculation formulae.
4. Data Processing
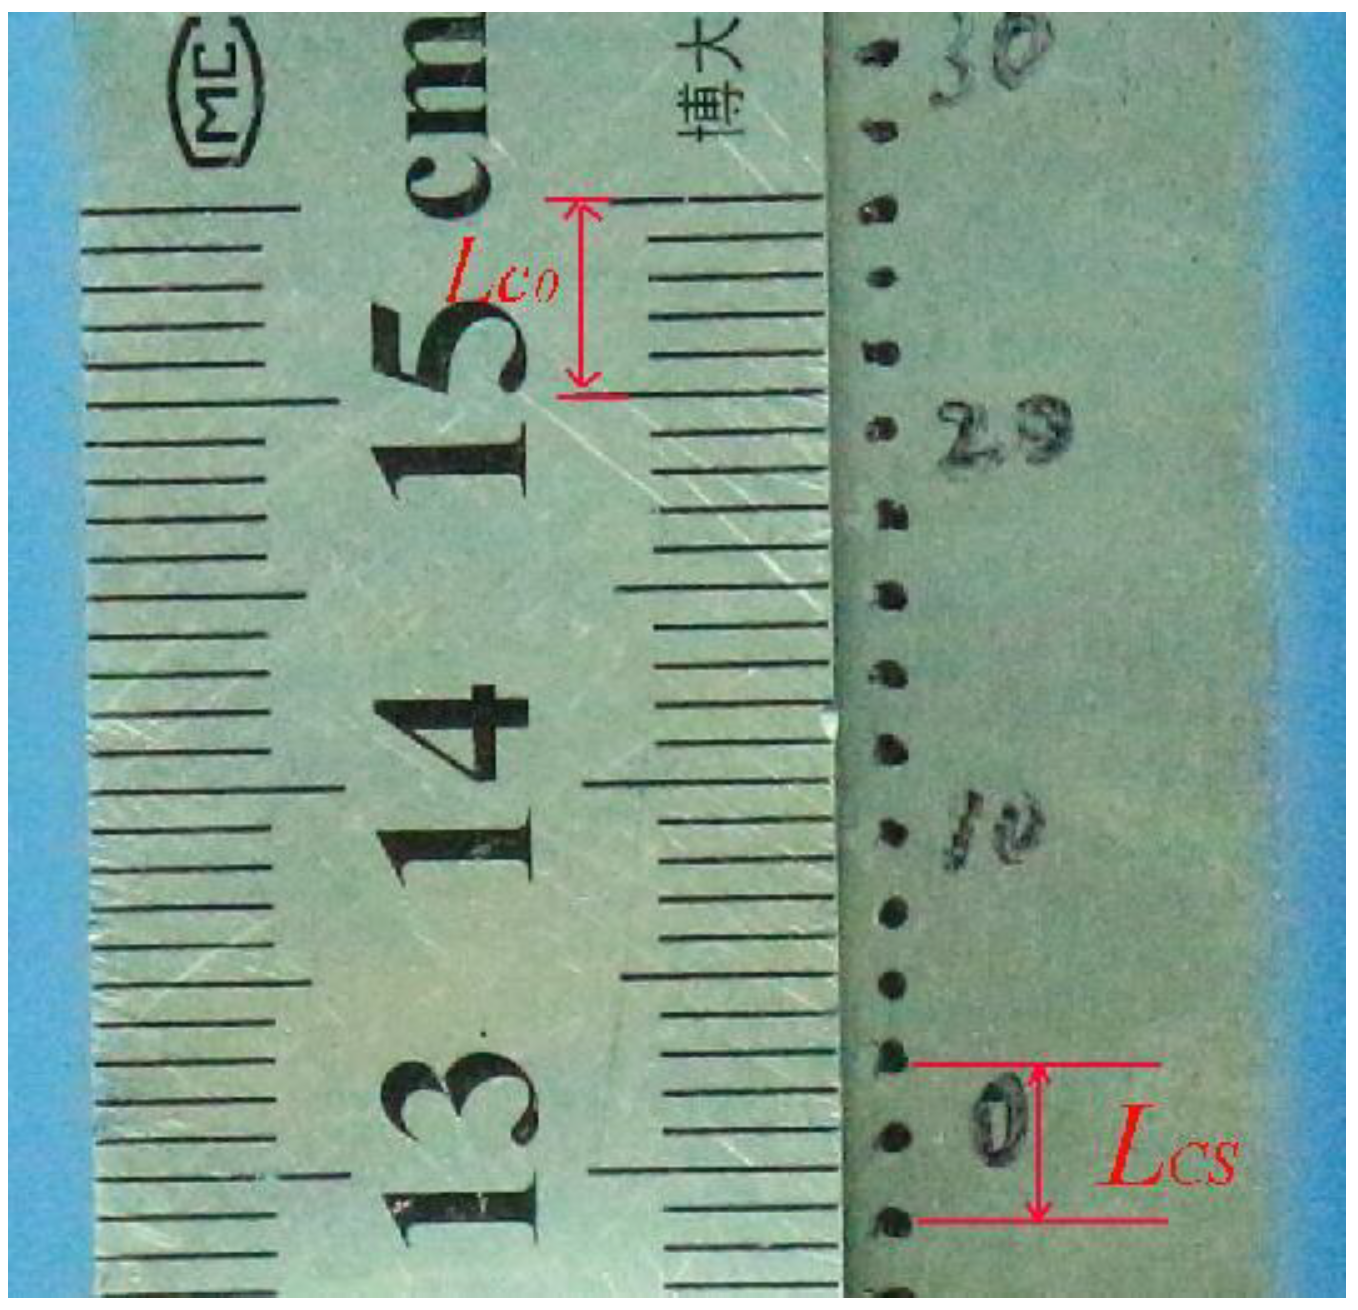
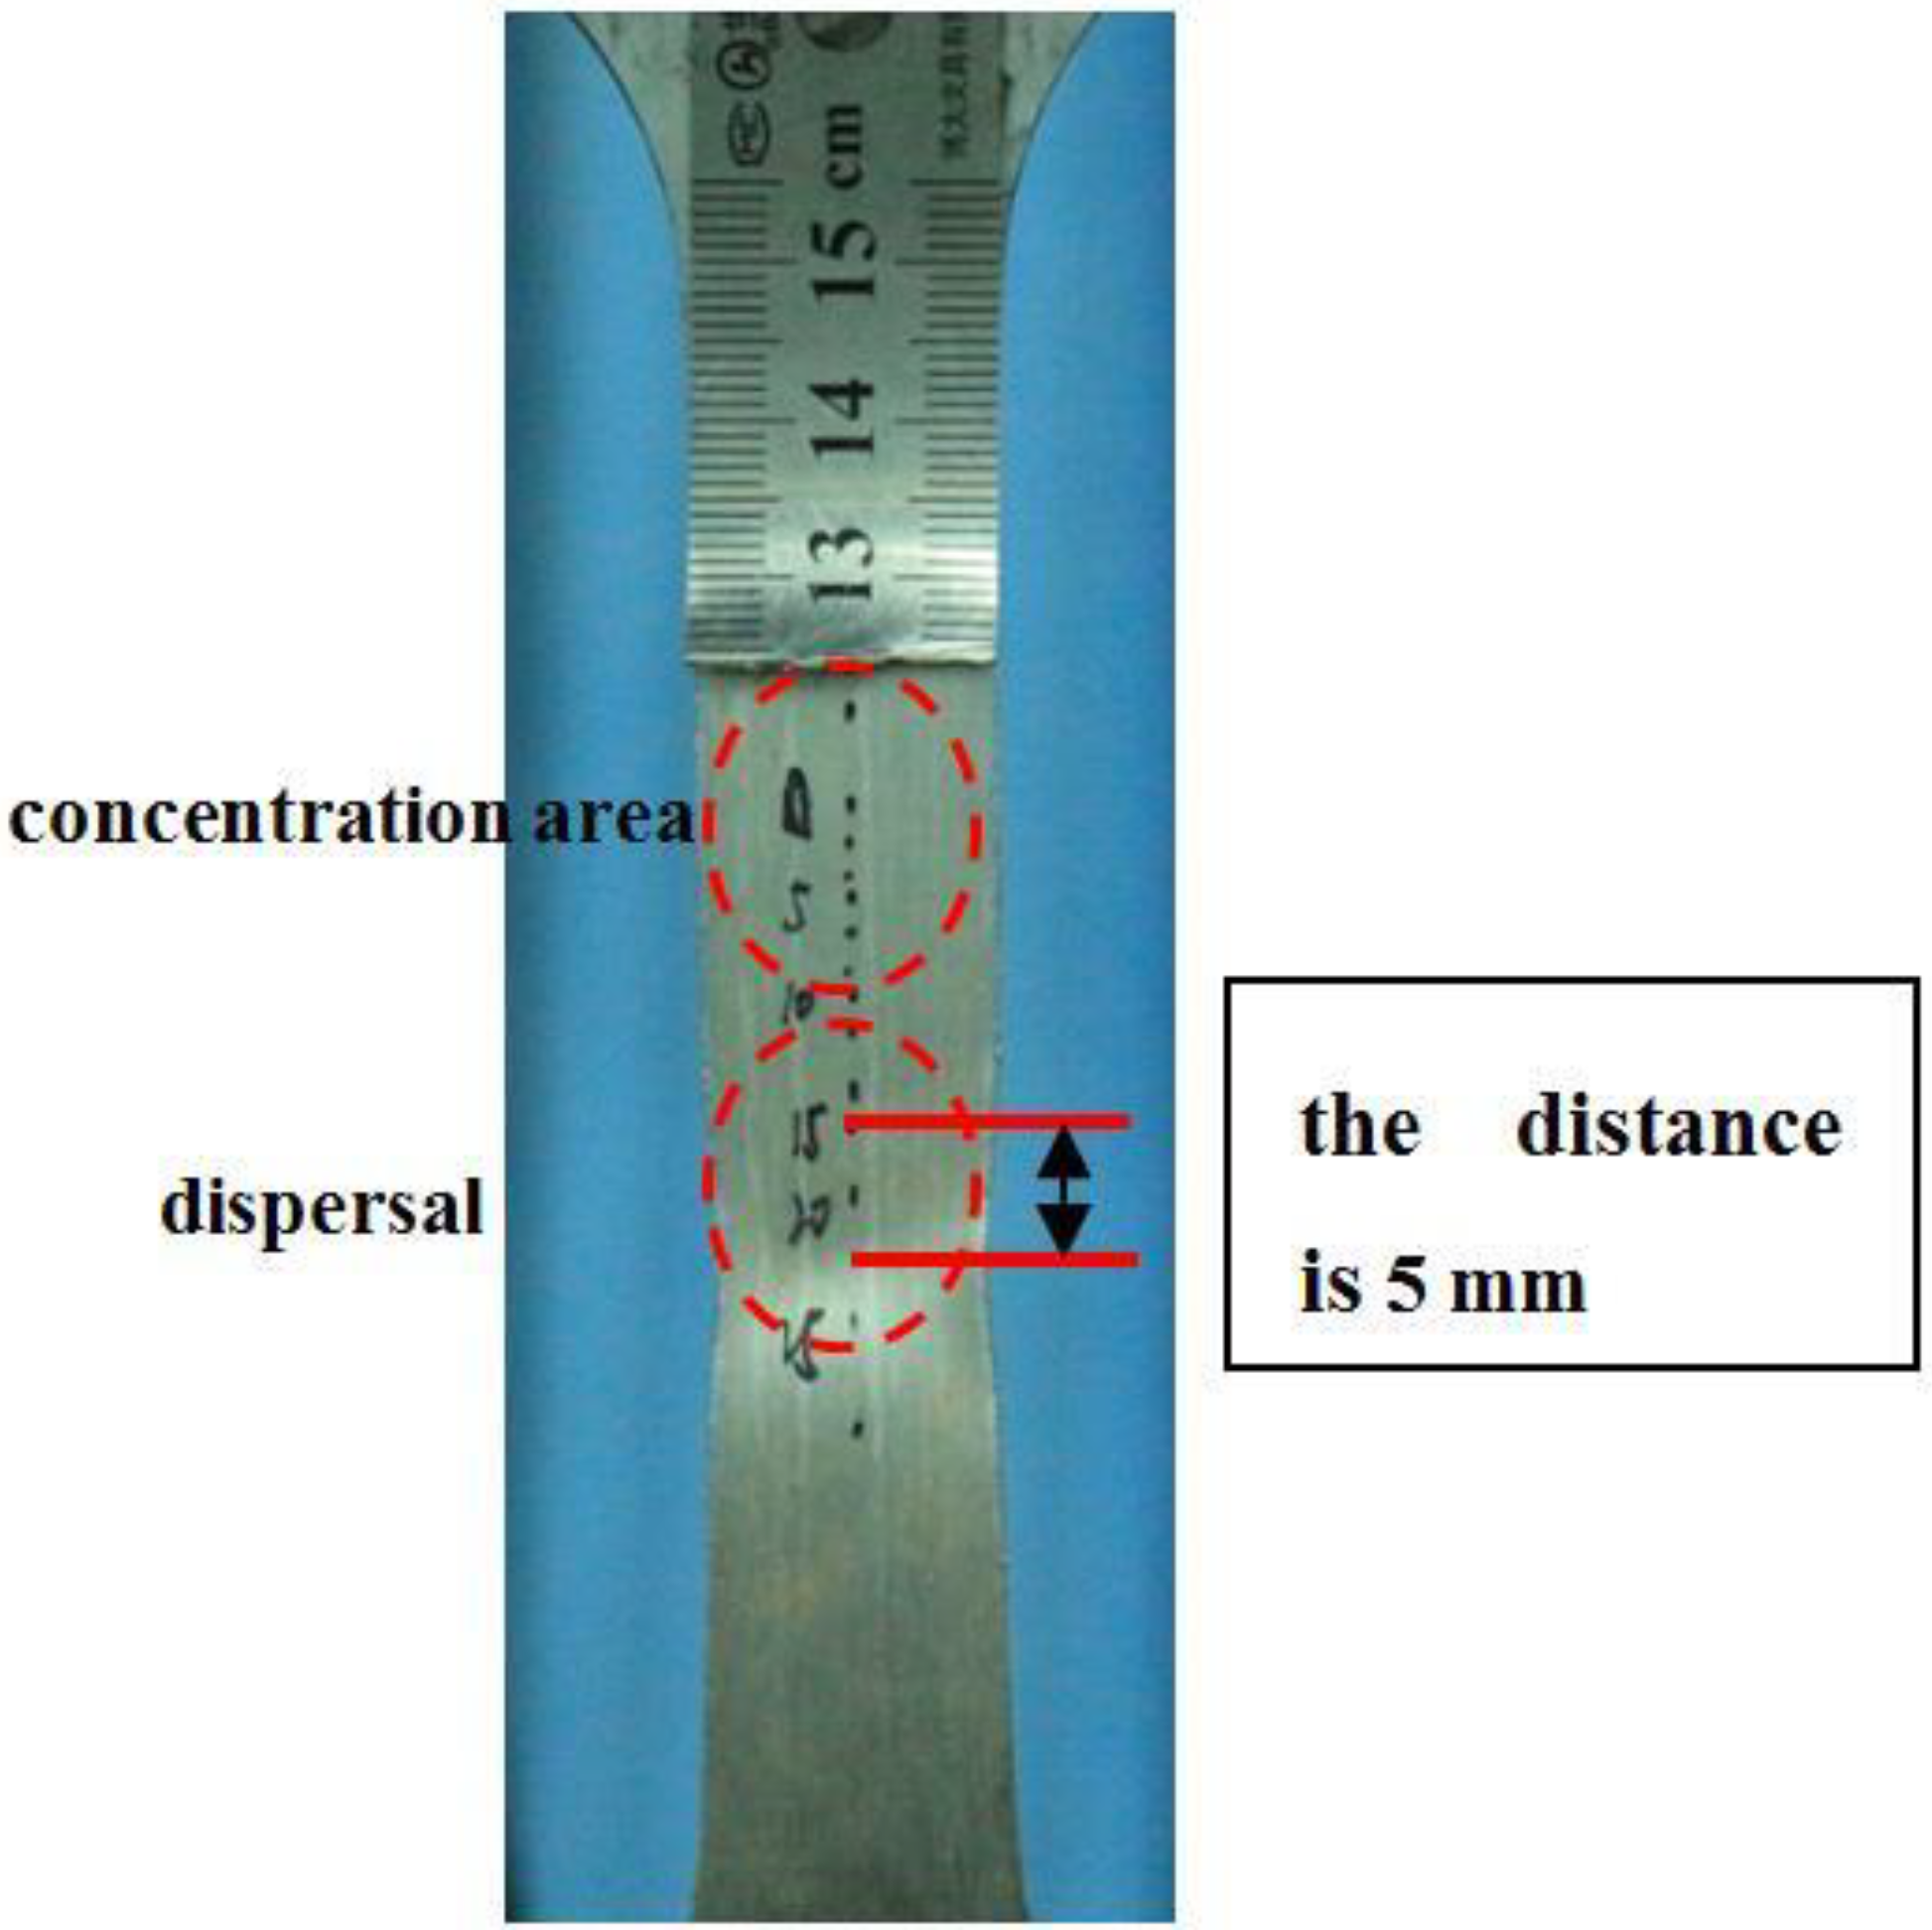
In the stretching process of the specimen, only the upside of steel ruler was connected to the specimen, so that the length of the graduated part was not elongated when the specimen stretched (Figure 4). We defined the distance of the actual length (5 mm) as the gauge length and marked it as L0. The length of the steel ruler, 5mm in the image, can be measured by CAD software (2007, Autodesk, San Rafael, CA, USA) to obtain the length data defined as LC0. Similarly, the distance between the two points above and below the necking position can be measured by CAD software to obtain the length data defined as LCS. The actual distance between the two points above and below the necking position, LS, can be obtained according to the principle of equal proportion:
The strain value at this moment can be obtained by Equation (2). This strain is the Green-Lagrange strain, or engineering strain, which nee10ds to be converted to logarithmic strain according to Equation (3).
Finally, the true stress value of the specimen can be obtained according to the hypothesis of incompressible volume and the calculation formula proposed by Kong et al. [12]. In this way, the true stress-true strain curve of the specimen can be obtained:
5. Results
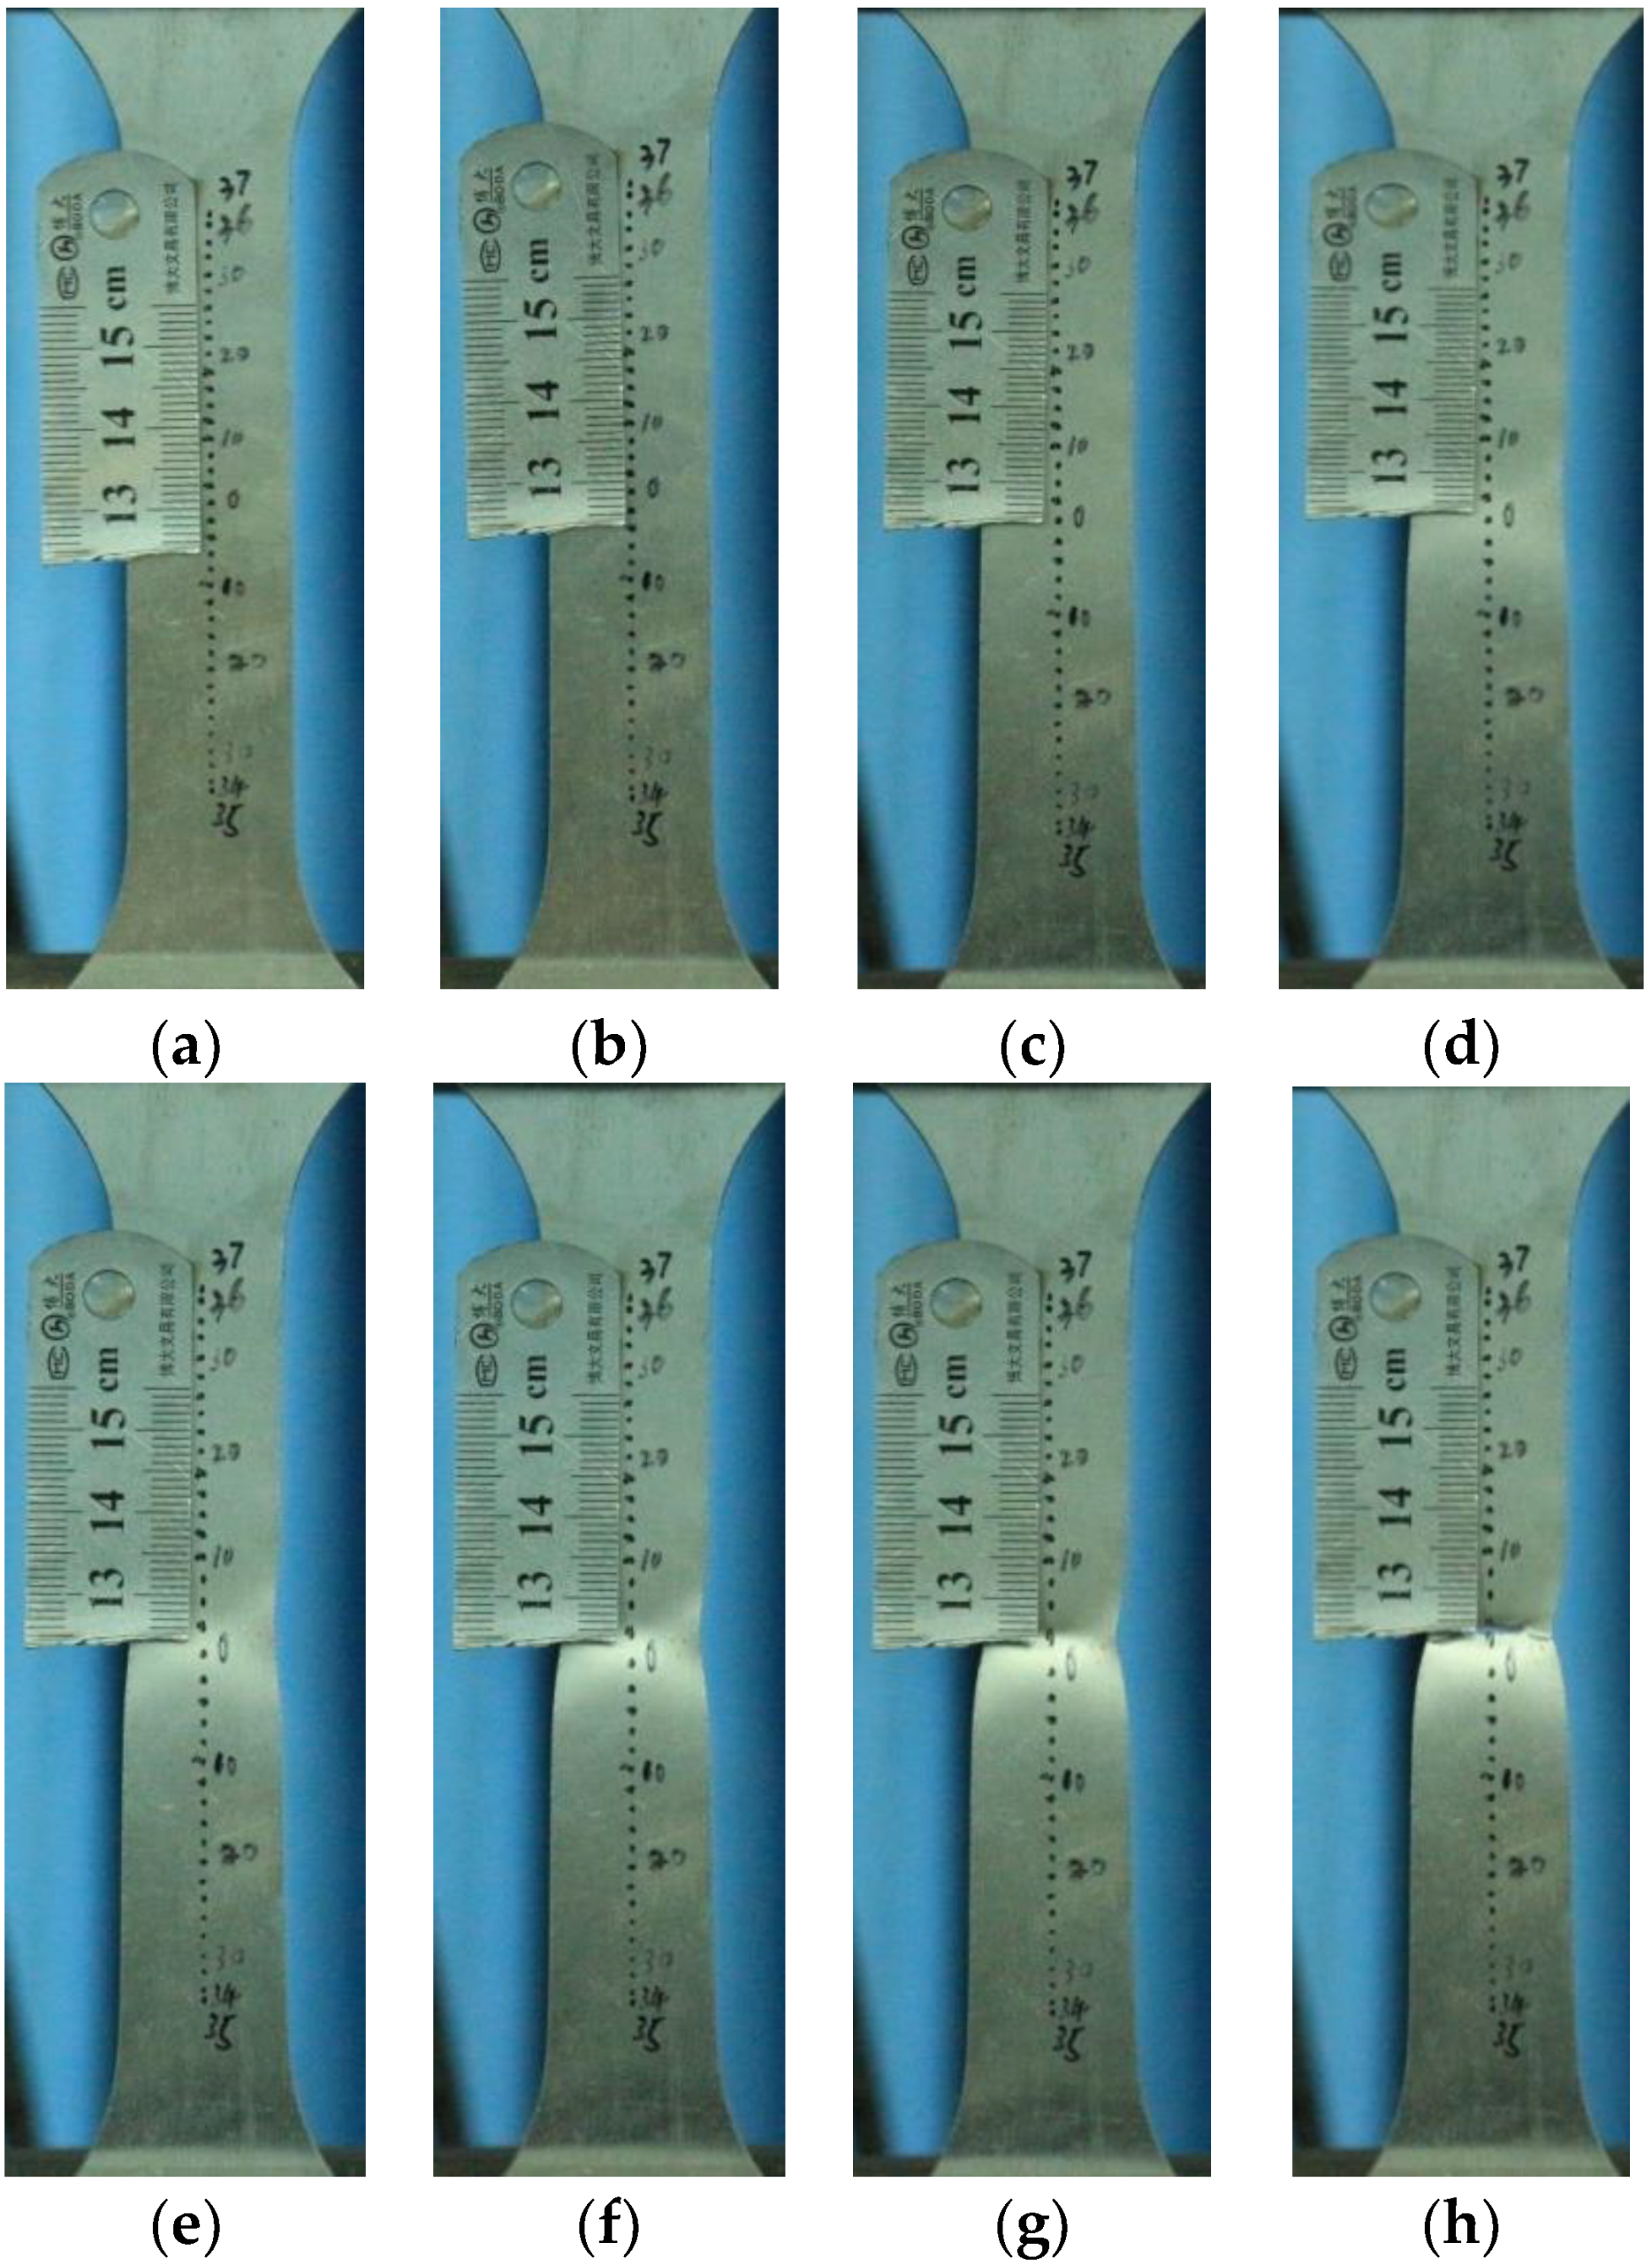
The first specimen of each group was tested by the proposed method, and the entire stretching process of specimen is shown in Figure 5. Figure 5 demonstrates that the specimen was stretched evenly at first, and then necking occurred between Figure 5c,d, with the position of the necking near the gauge point "0". As the load was continuously applied, Figure 5e–g show the rapid development stage of necking. Finally, the specimen fractured, as shown in Figure 5h.
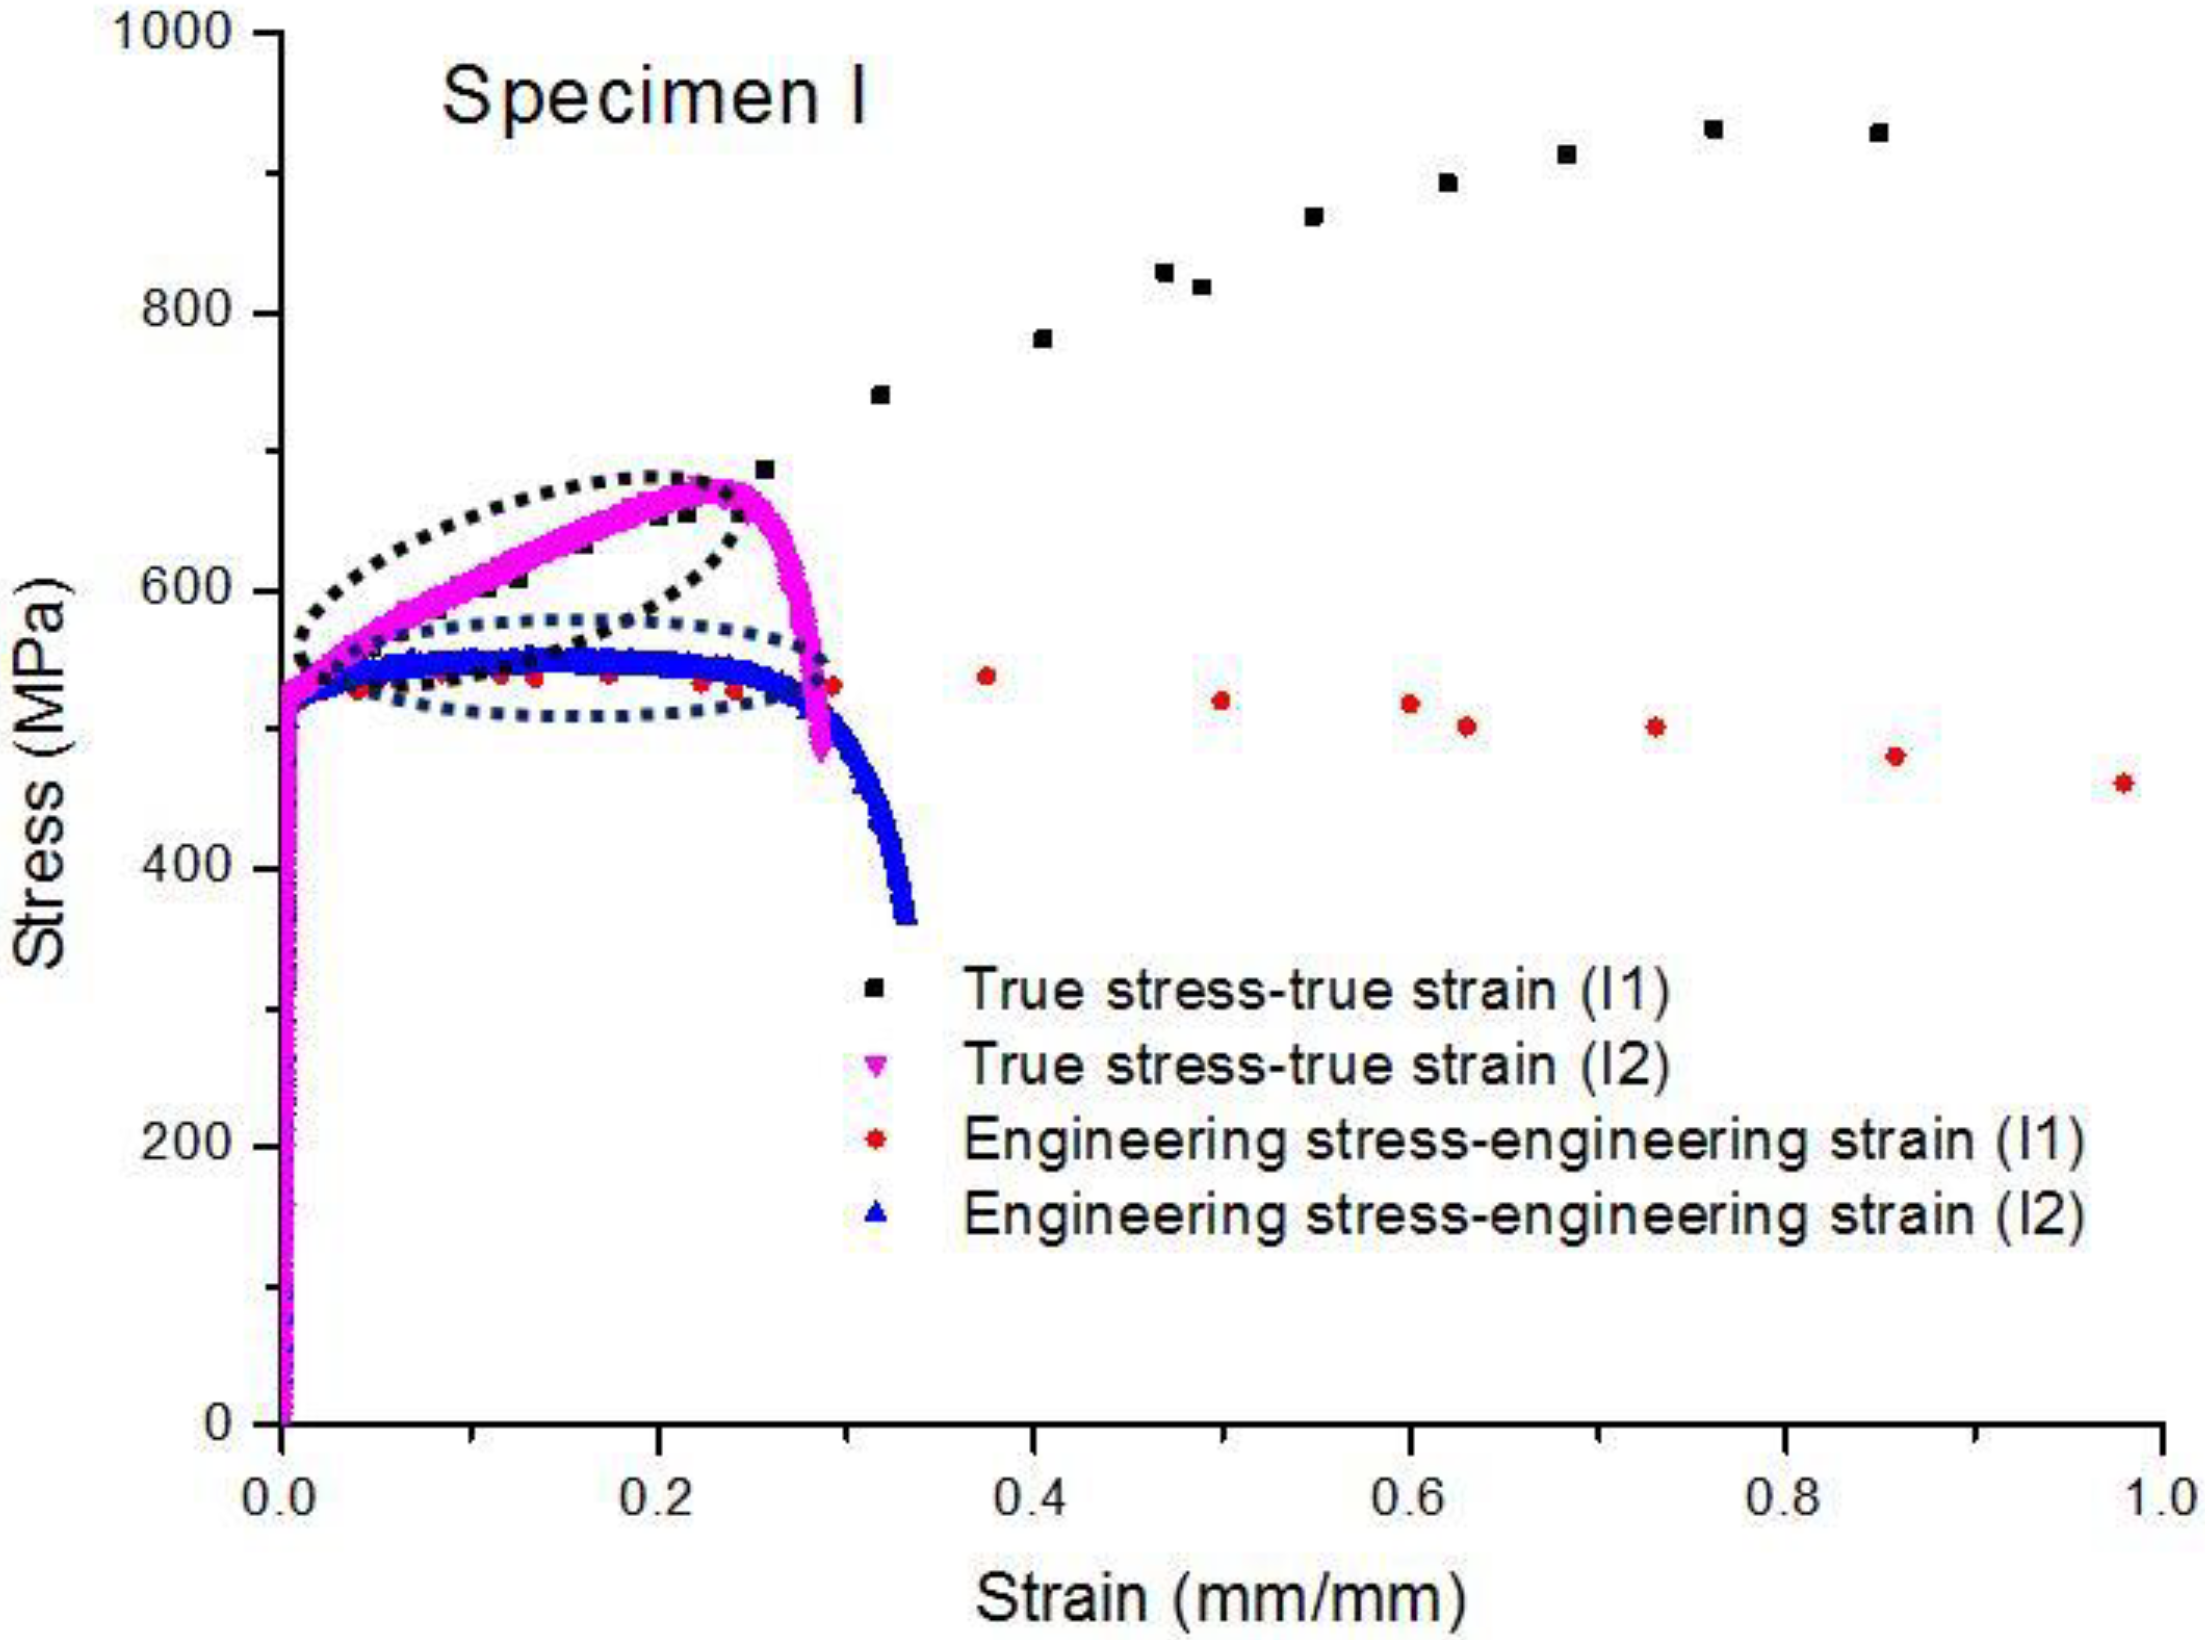
The test results of the two methods for specimen I were compared, and the comparison shows that the true stress-true strain curves obtained by the two methods were essentially coincident before necking. When the true strain value was 0.22, the true stress tested by the proposed method and the strain gauge were 655.0 MPa and 673.3 MPa, respectively, and the error was 2.7%. Similarly, the engineering stress-engineering strain curves of the two methods were also basically coincident before necking. When the engineering strain value was 0.24, the engineering stress value measured by the proposed method and the strain gauge were 527.8 MPa and 539.4 MPa, respectively, and the error was 2.2%.
After reaching the maximum load point, the true stress tested by the strain gauge began to decrease. The true stress obtained through the proposed method continued to increase with the strain increase, until the specimen broke. This result is consistent with the test results of Xin et al. [4], Yao et al. [8] and Kong et al. [12]. The true stress and true strain continued to increase with the displacement load after the necking of the specimen.
The engineering stress-engineering strain curves of I1 and I2 were compared (Figure 6), showing that the increase of the strain tested by the strain gauge slowed after the onset of necking. This is mainly because the strain gauge result is an average value. Although the strain at the necking position increased rapidly after the onset of necking, the growth of the average strain value was not obvious in the range of the strain gauge. In addition, the test results were also affected by the measuring range of the strain gauge, which means that the strain gauge cannot obtain accurate data when the deformation of the specimen exceeds the strain gauge range.
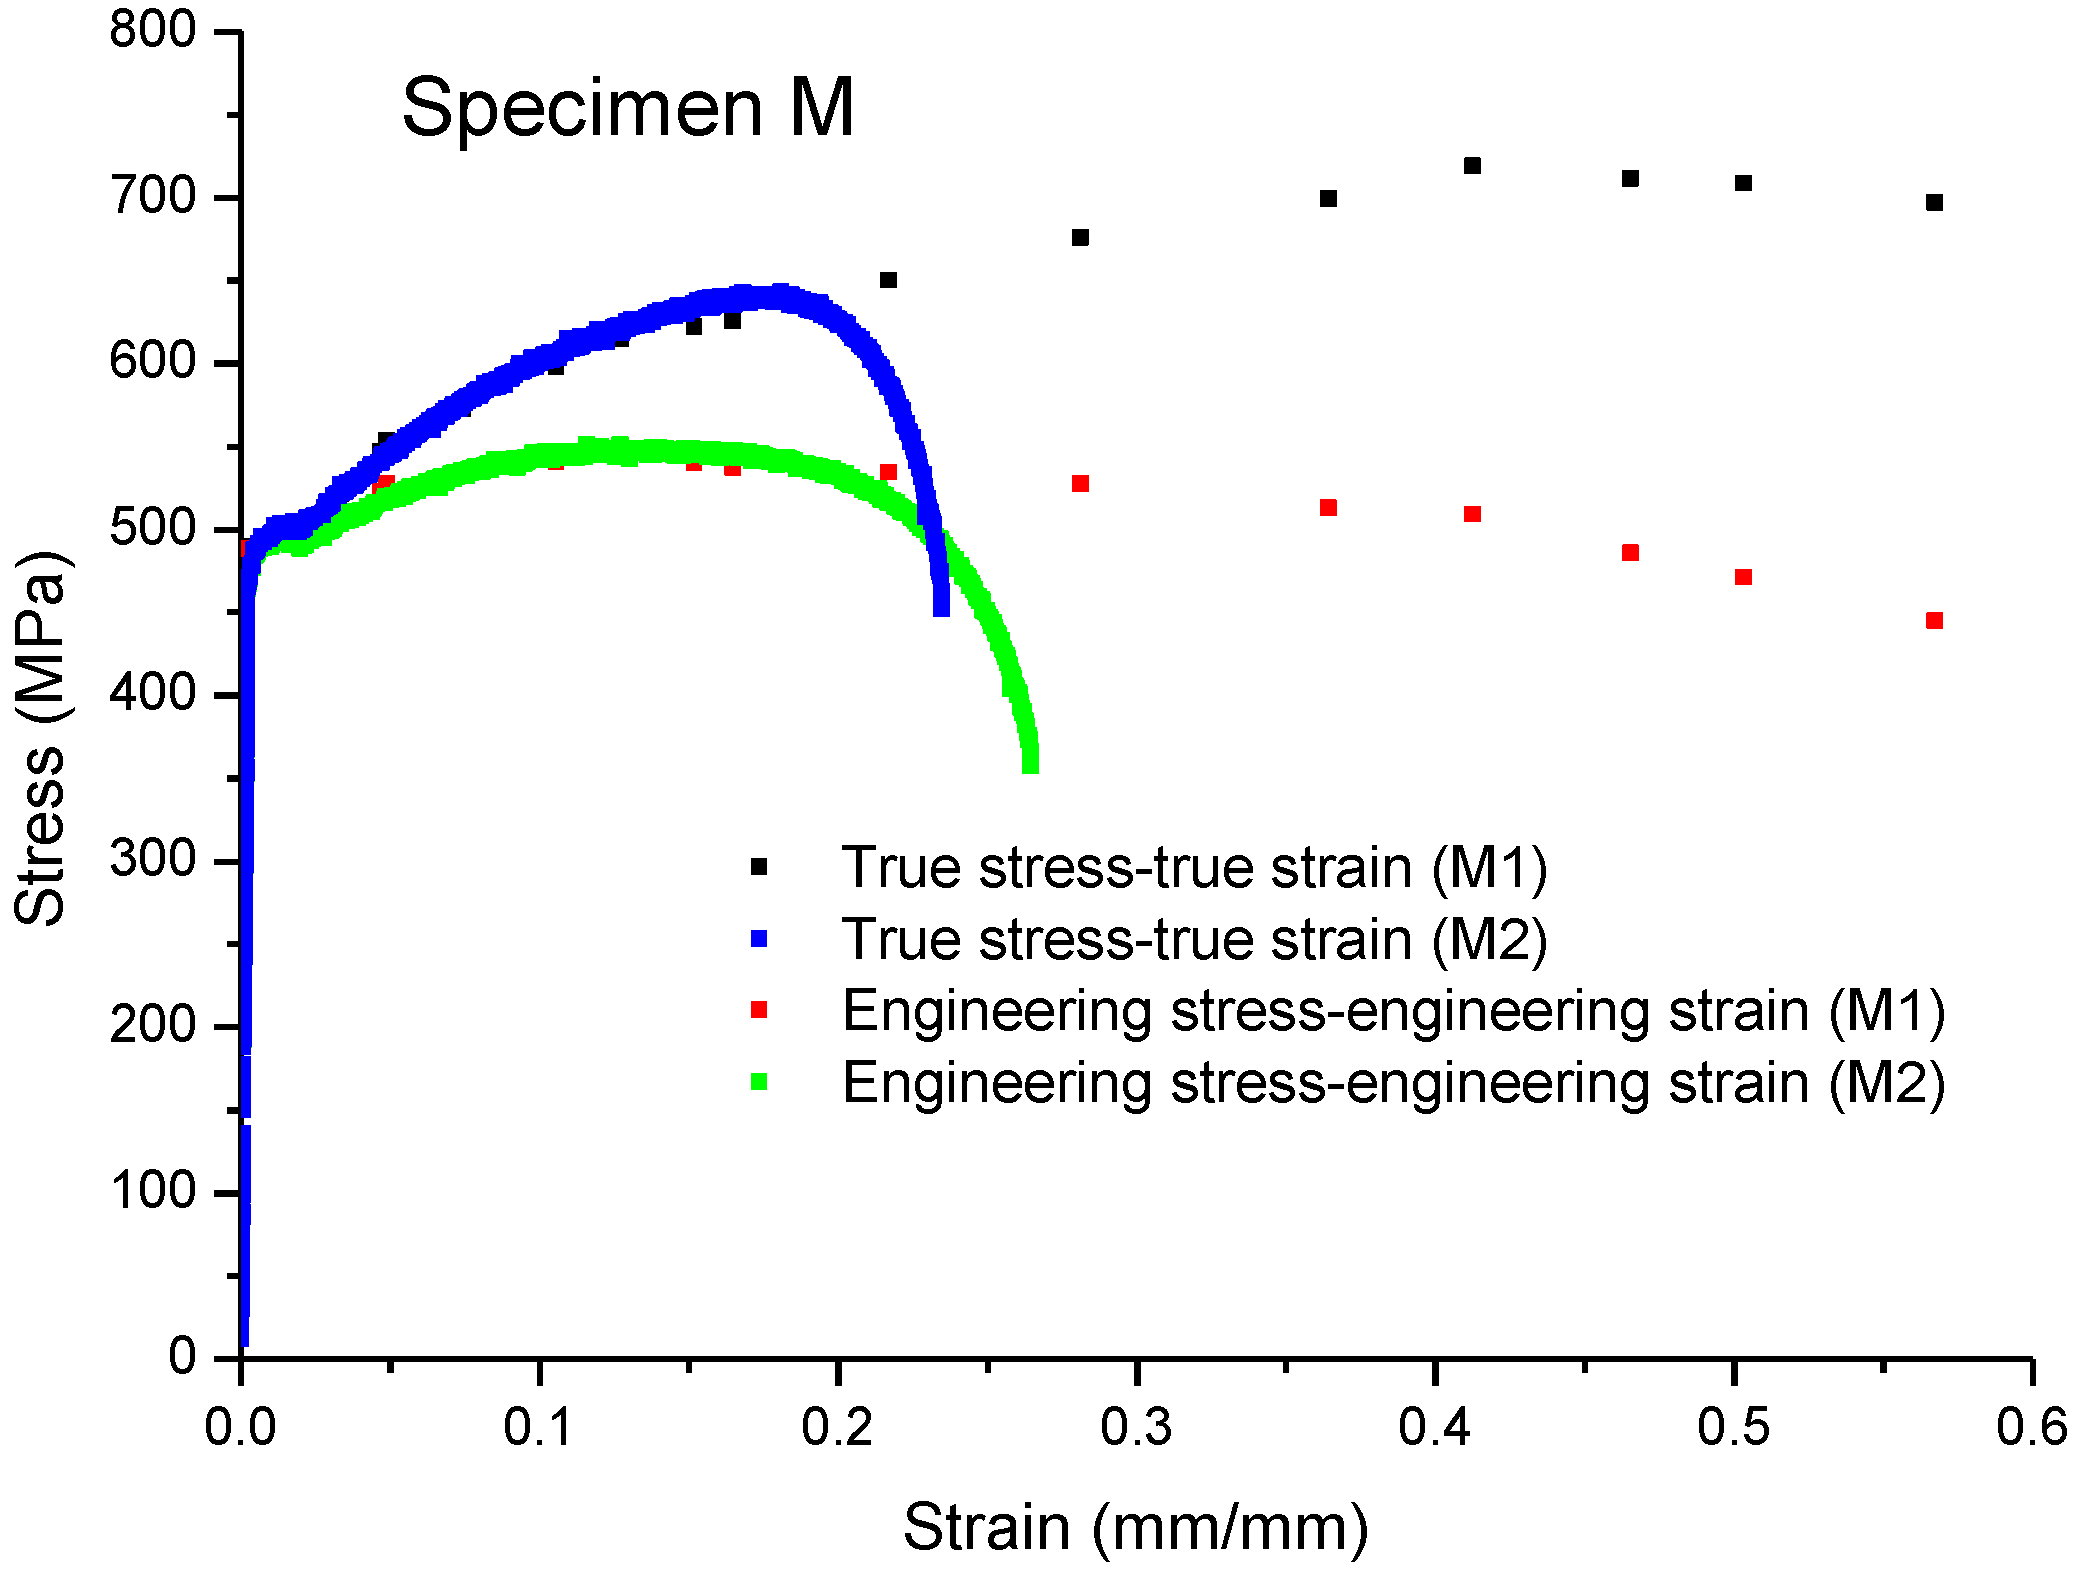
The test results of specimens M1, M2, O1, and O2 are presented in Figure 7 and Figure 8. The results show the same law as specimens I1 and I2. However, compared with the test result of specimen I1, there was a significantly lower end for the true stress-true strain curves of specimens M1 and O1. This is mainly because the initial distance between the gauge points in the middle part of the specimen was 2 mm, while it was 5 mm at the upper and lower parts of the specimens, as shown in Figure 9. Meanwhile, the necking and the final fracture positions of specimens M1 and O1 were either upper or lower and deviated from the center (dense markers) of the specimen. As a result, at the end of the specimen stretching, the large distance between gauge points was unable to accurately capture the local strain of the severe necking part.
6. Verification of the Results
To verify the results of the proposed method, an FEM (Finite Element Method) model of I1 was established using Abaqus 6.11 (Dassault Simulia Company, Providence, RI, USA) for comparative analysis. The 3D FEM was meshed with the C3D8R element. In addition, the intermediate part of the specimen was refined, as shown in Figure 10. The element size in the refines zone is 0.125 mm. The transition from a coarse mesh away from the middle region to a fine mesh in the middle region is achieved by using a structured transitional mesh pattern. As the mesh in the middle section of the specimen was refined, there is no geometric imperfection implied to induce the necking. Total number of elements and nodes are 8204 and 10,285, respectively.
GTN model was chosen as the material’s model. The failure criterion is Equation (5) [22].
For the API X65 pipeline steel, both Sandvik et al. [24] and Dybwad et al. [25] found that when fc = 0.13, the results of numerical simulations and experiments are in good agreement. fF = 0.15 + 2f0. In addition, f0 was chosen as 0.00015 according to Han et al. [18].
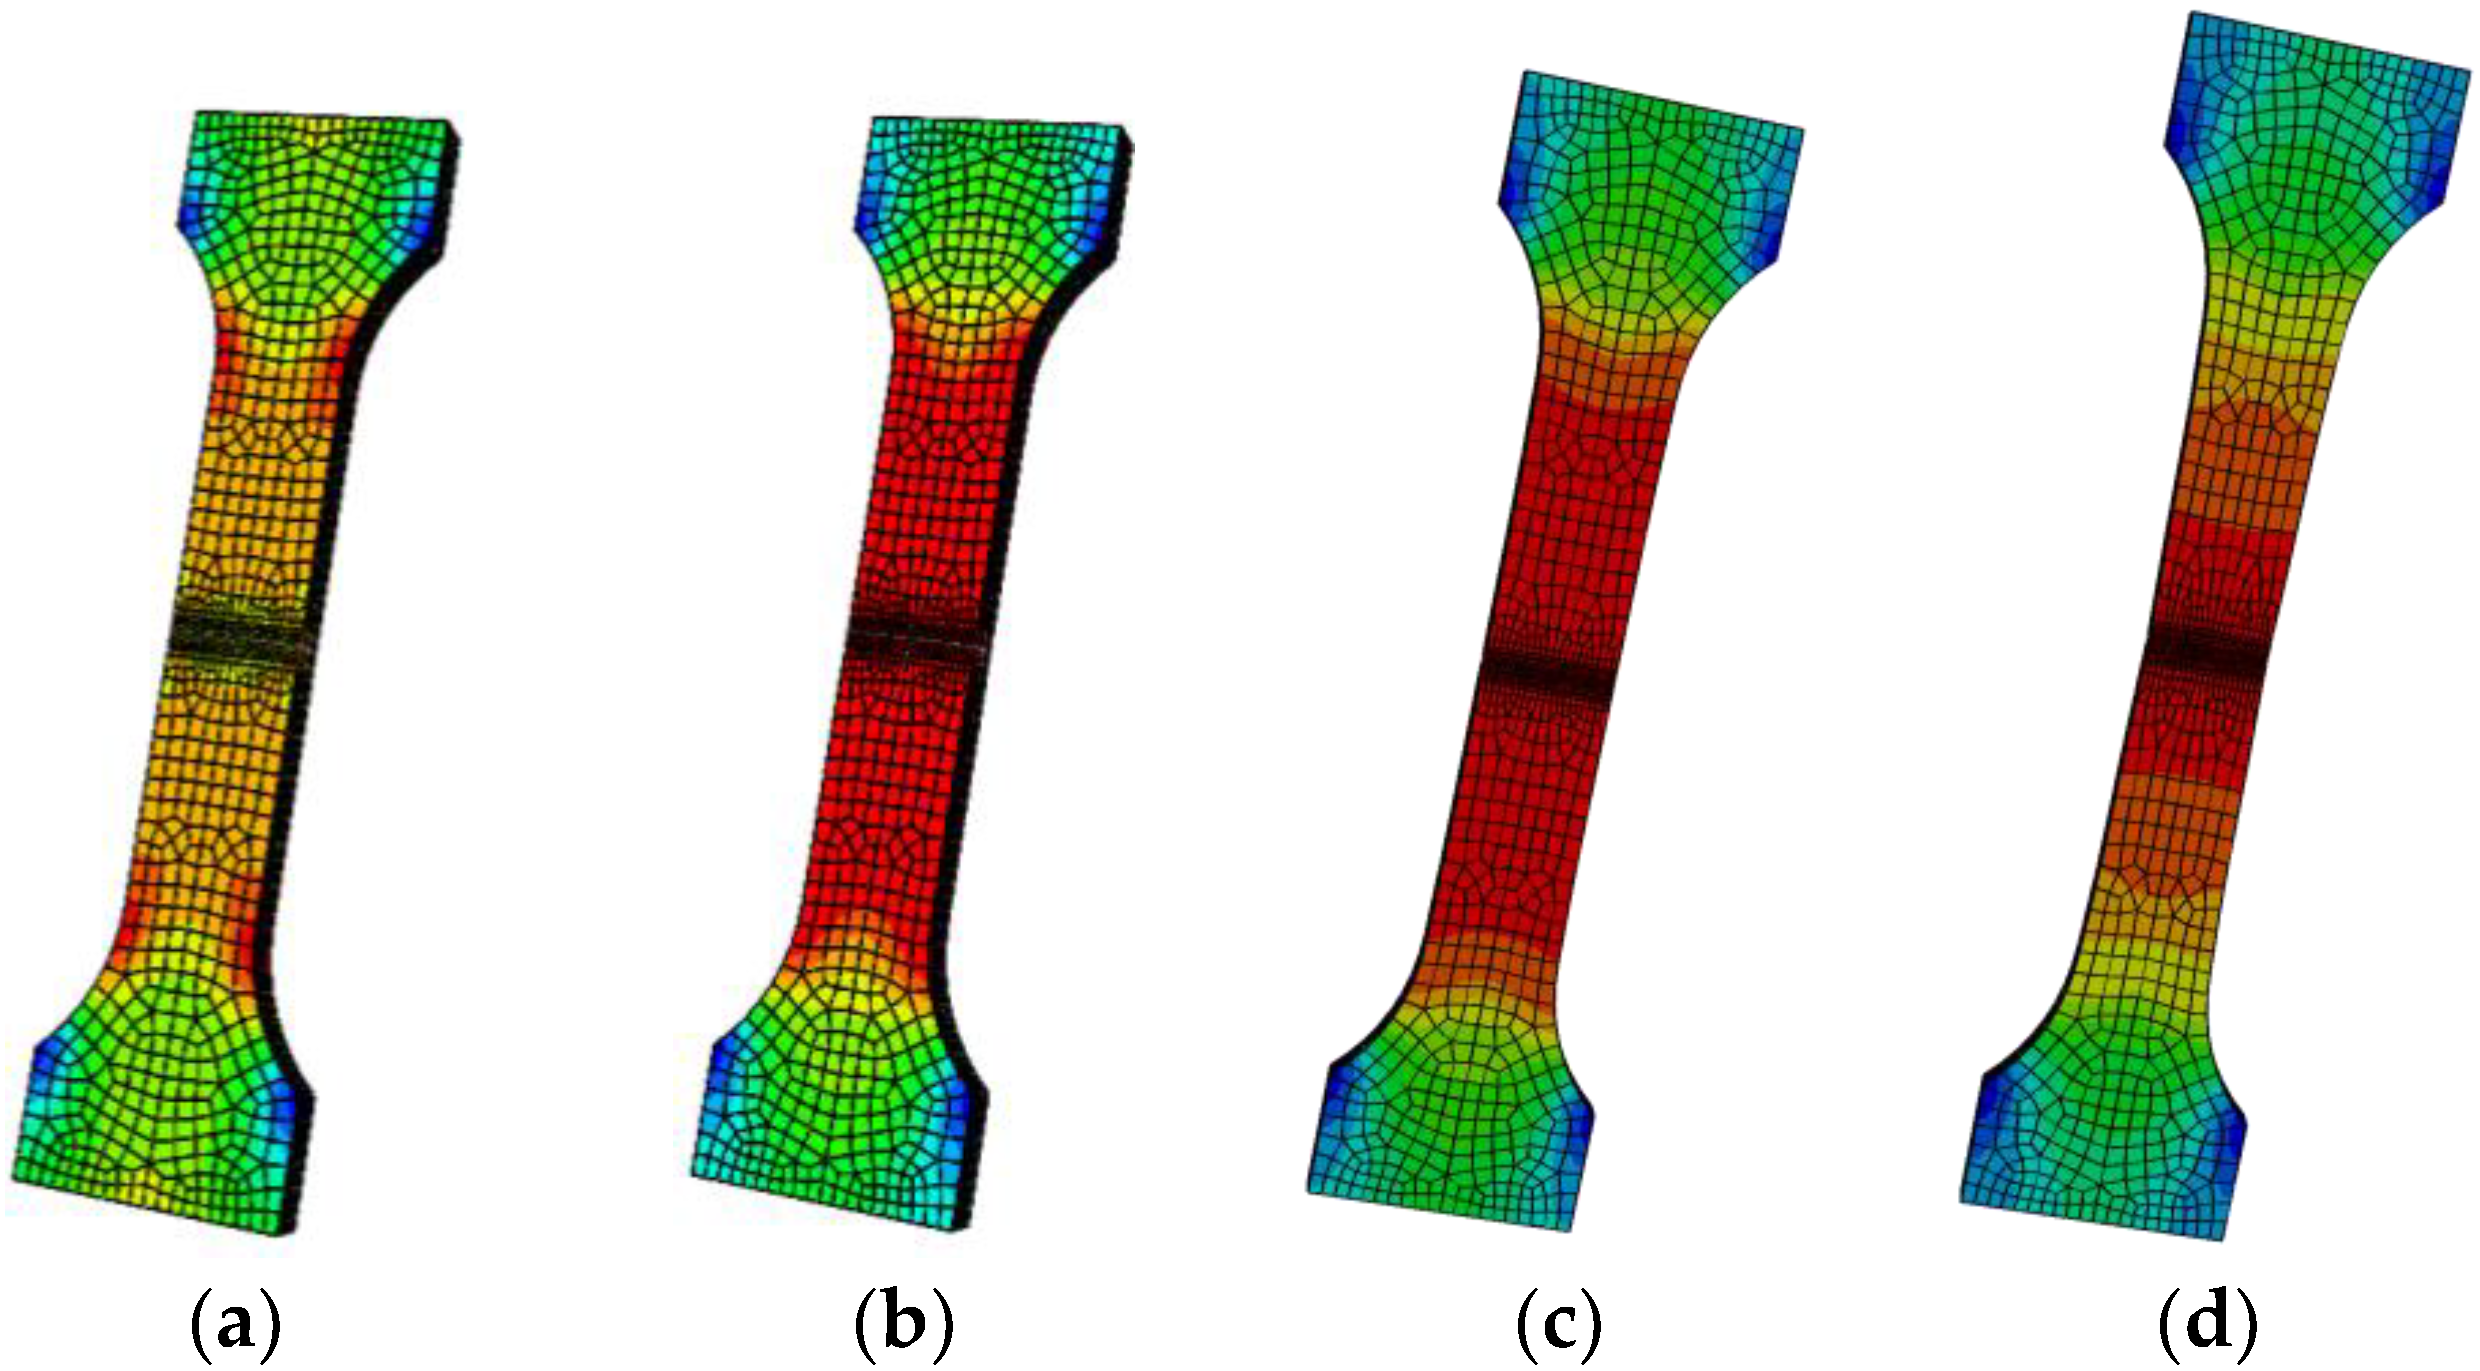
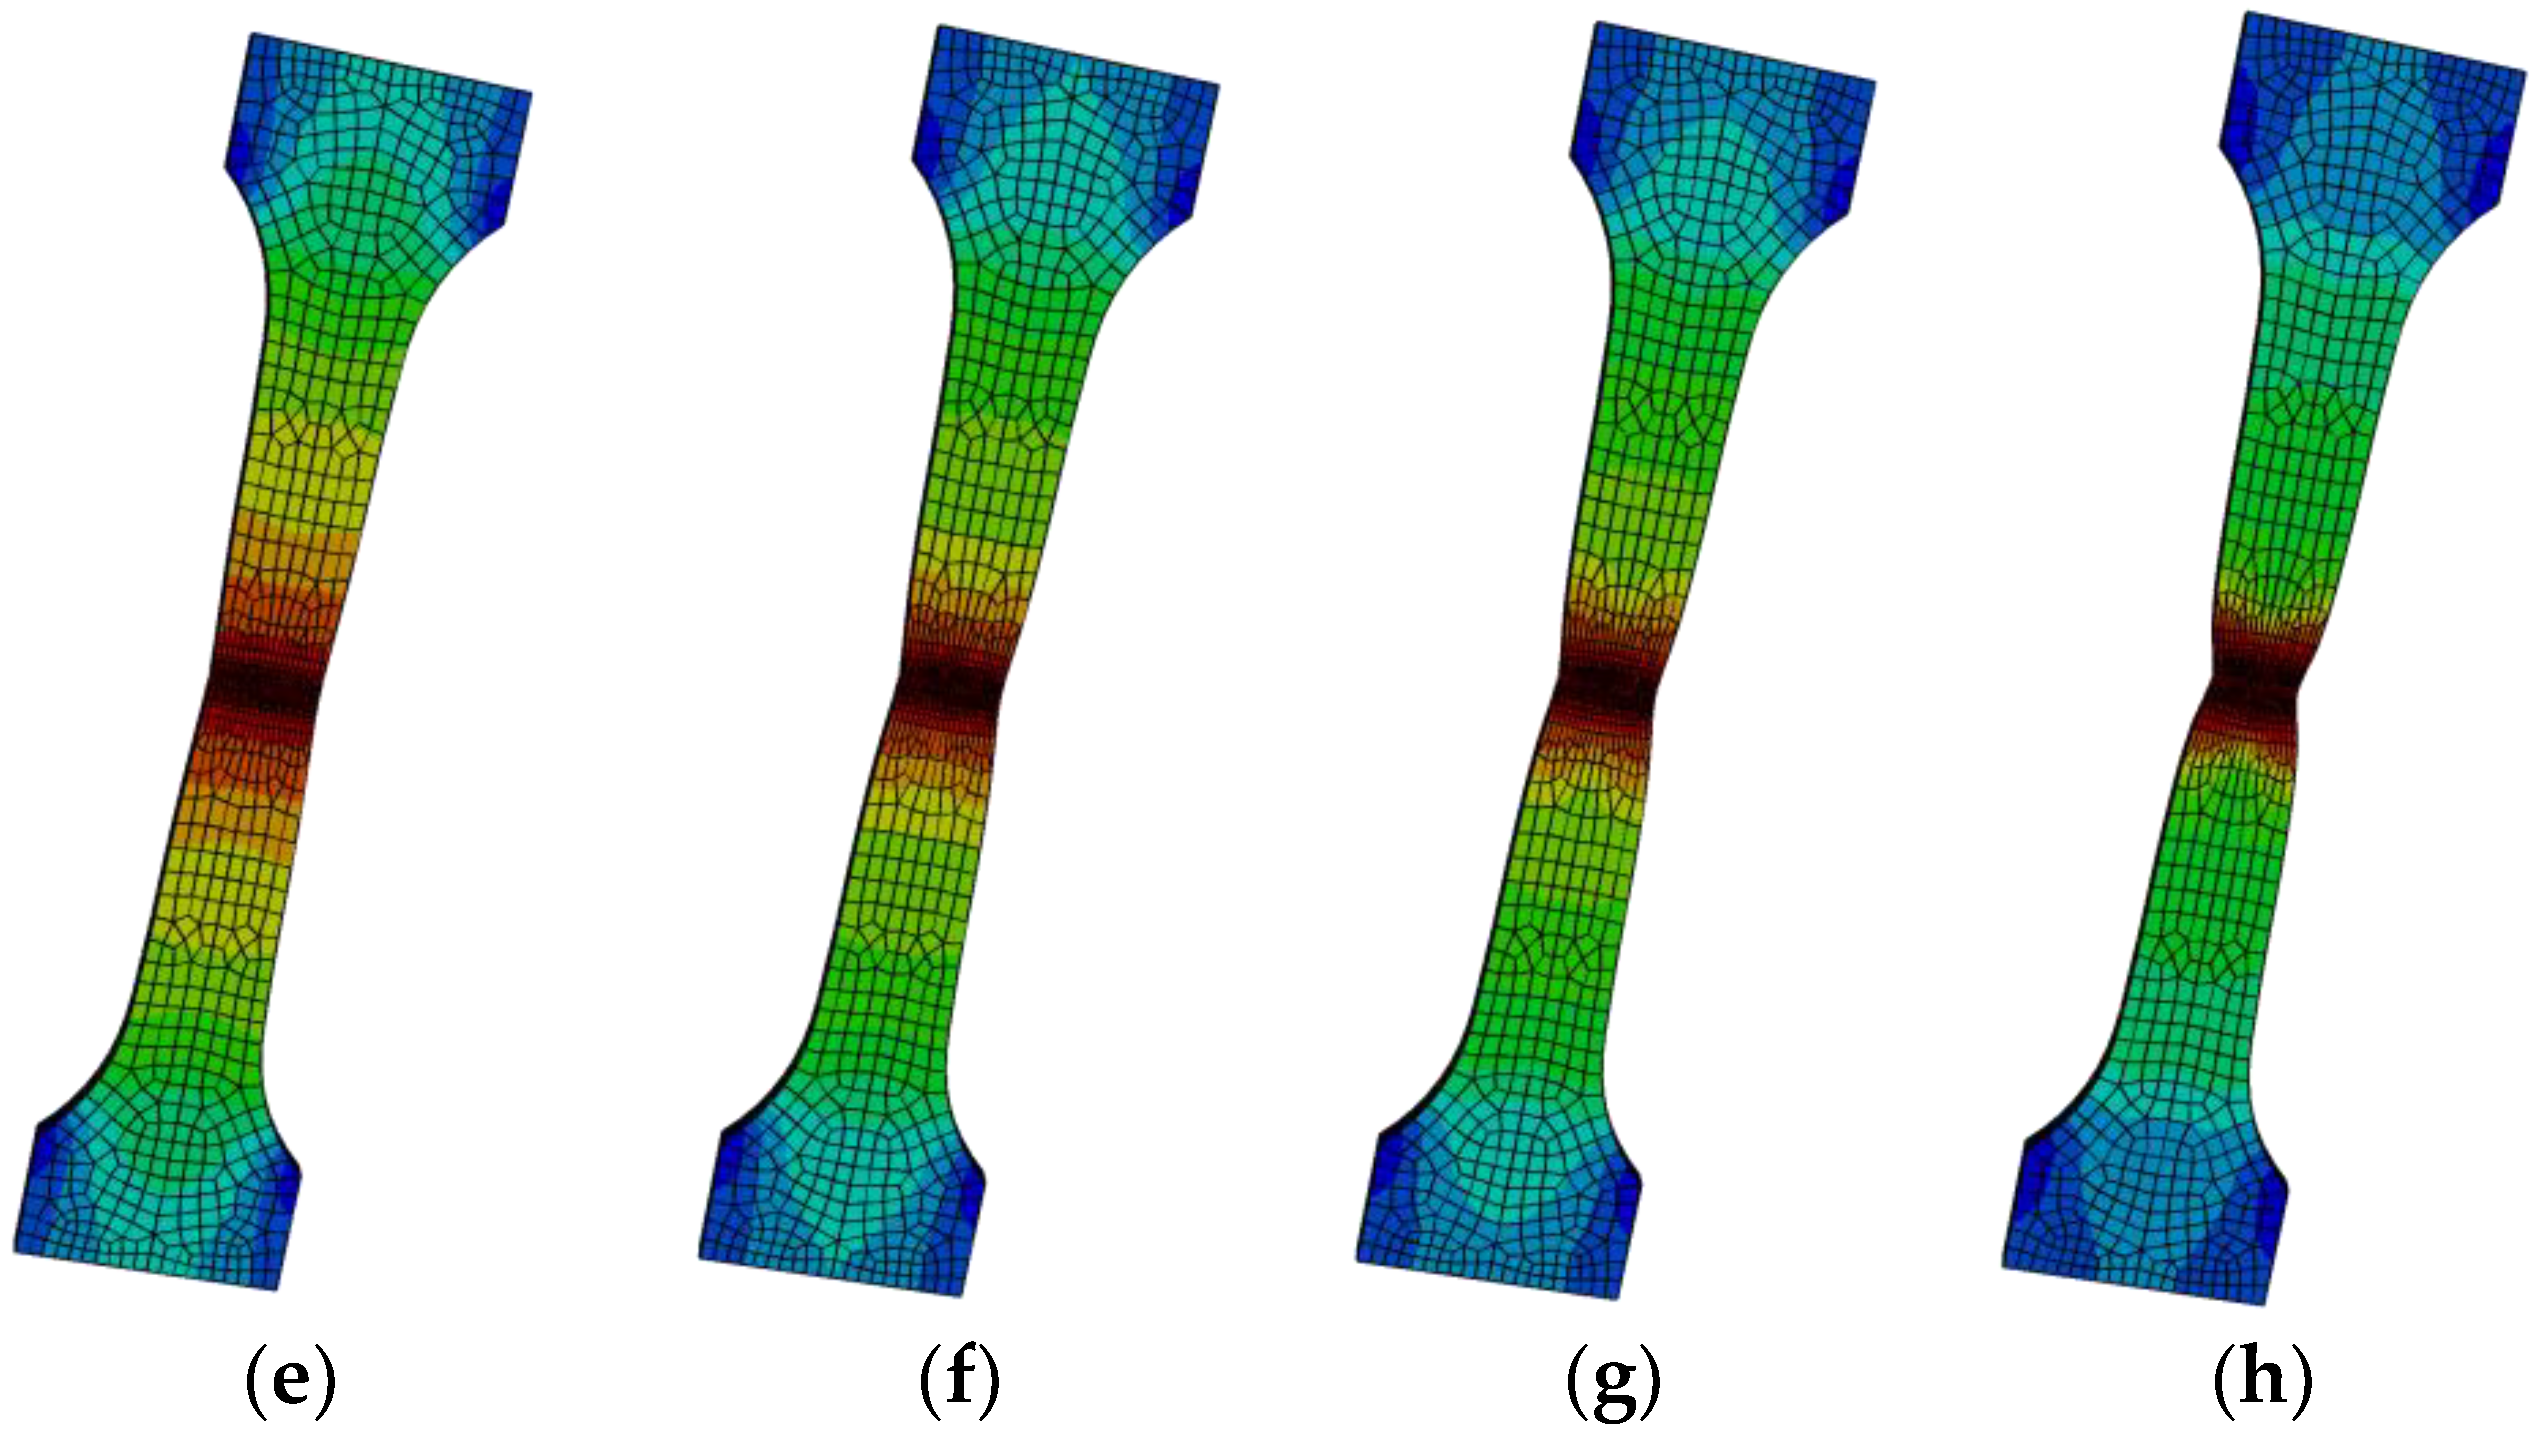
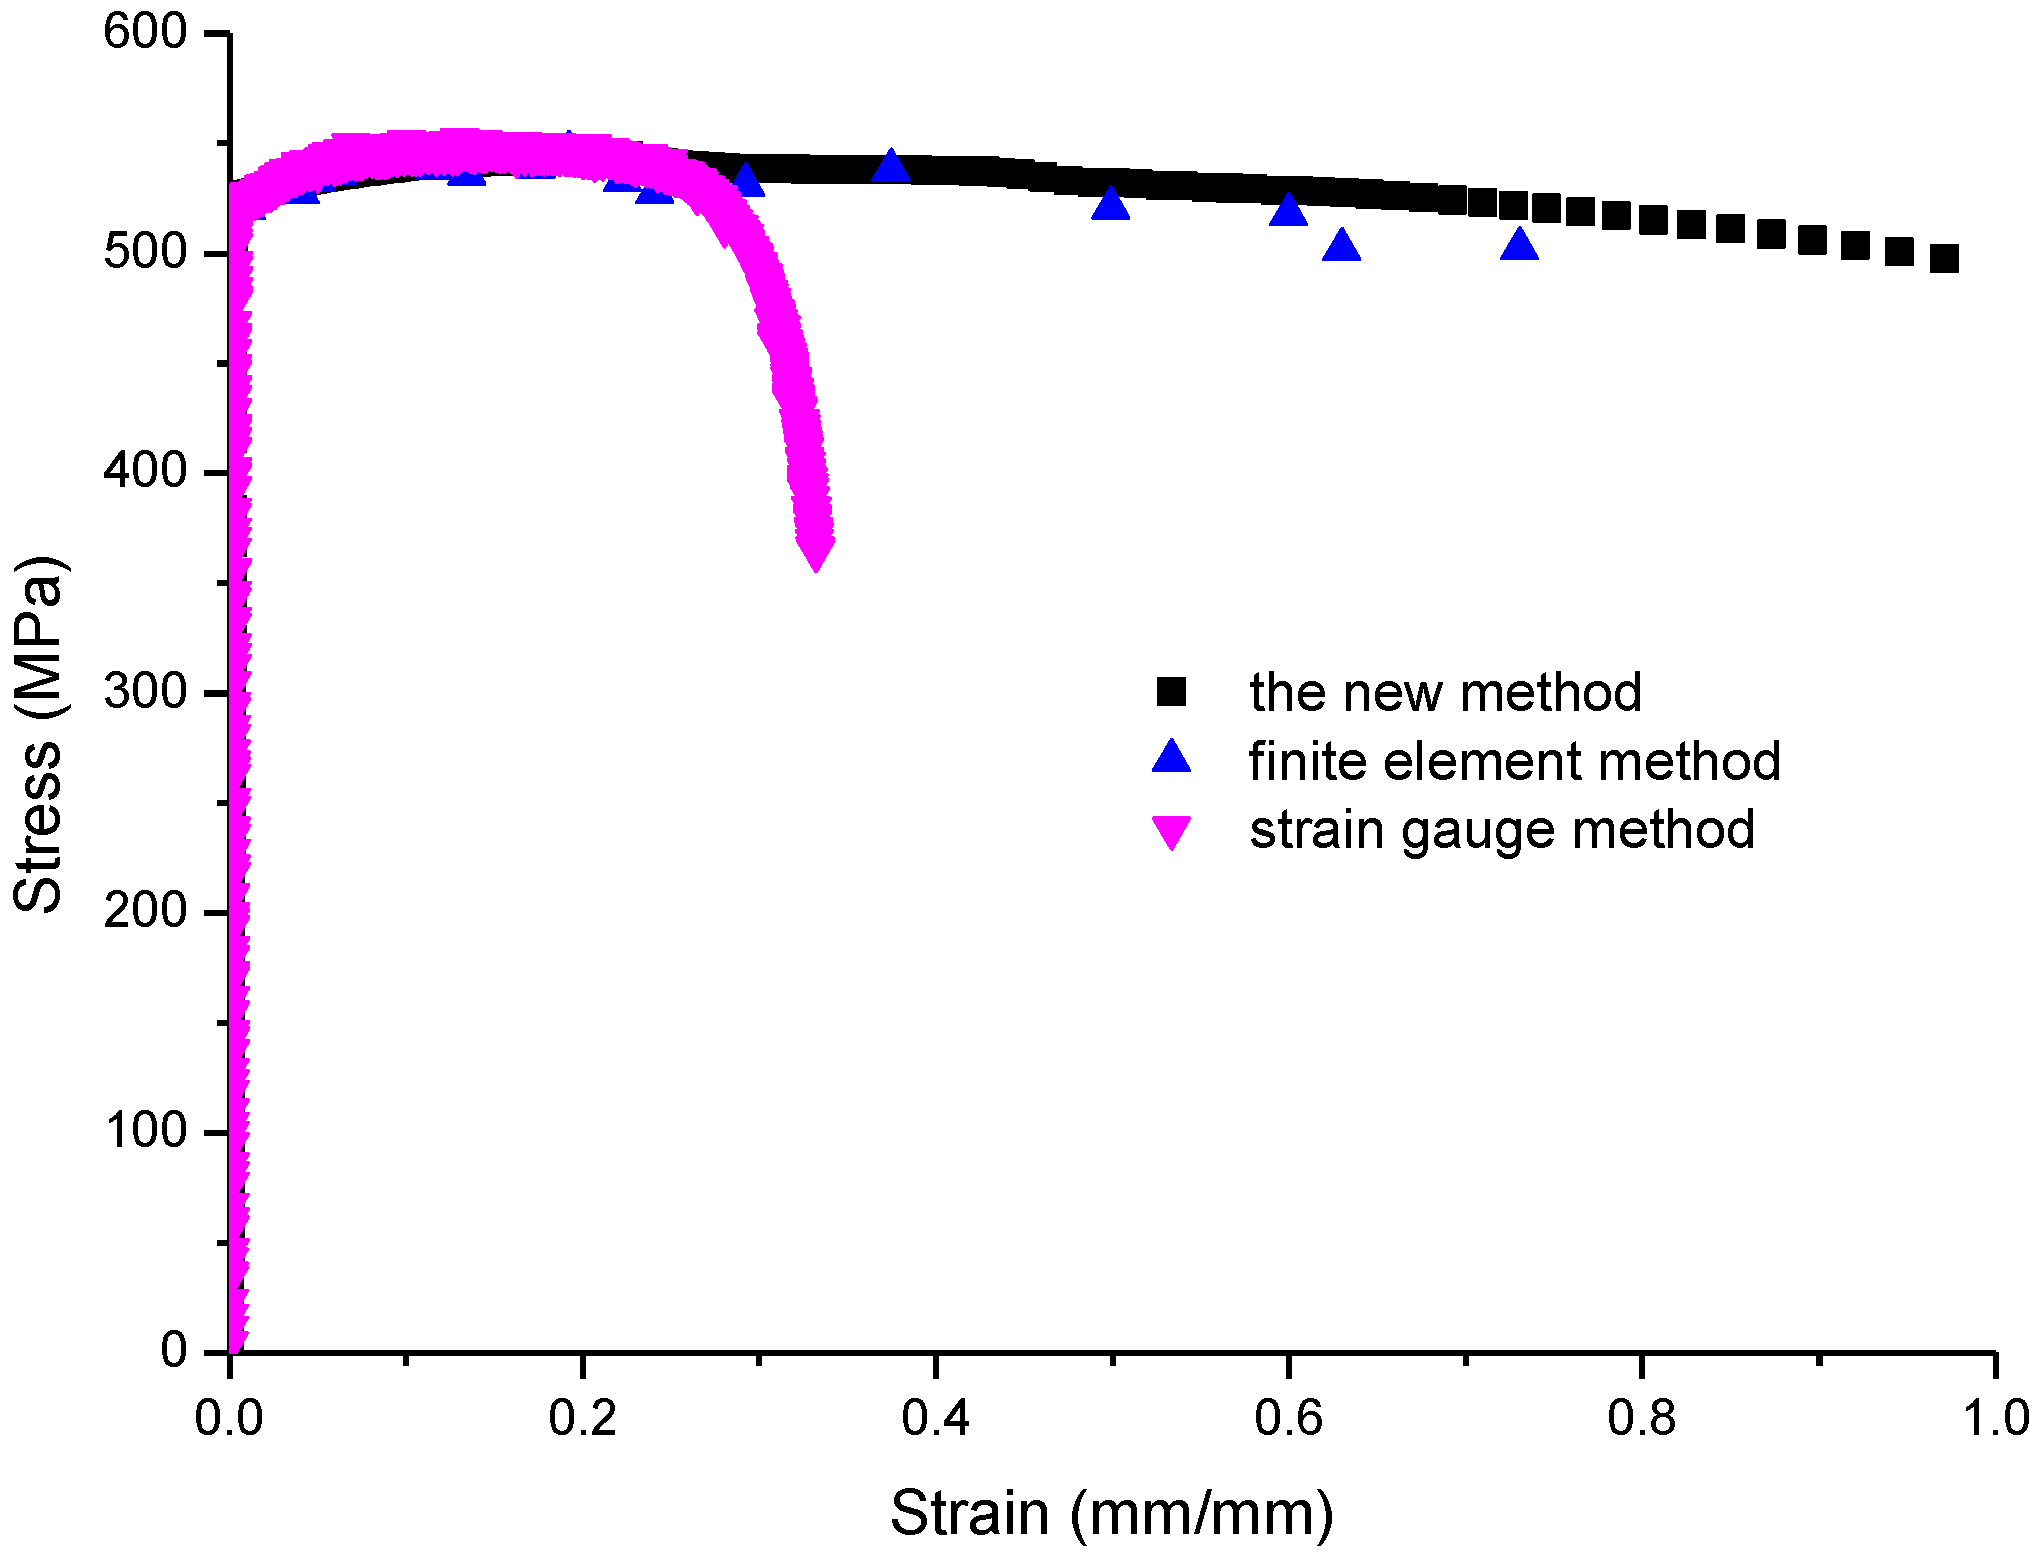
The load is displacement-controlled. The specimen was loaded by applying a load on one end while the other end was fixed. The stretching process is displayed in Figure 11. The processes of uniform stretching, necking, rapid necking development, and fracture are accurately simulated. The engineering stress and the load are in a proportional relationship, as are the engineering strain and the displacement, so the engineering stress-engineering strain curves (as an alternative of the load-displacement curve) obtained by the FEM and the proposed method (Figure 12) were compared. If the error is small, the test results of the proposed method are reliable.
Before necking occurs, the three results are basically coincident. After the onset of necking, the test results of the strain gauge decreased rapidly, while the results of the proposed method and the FEM decreased gently. Before the engineering strain reached 0.8, the engineering stress of the proposed method and the FEM were still relatively close. When the engineering strain reached 0.74, the error of the engineering stresses between the two methods was 3.5%, which is still within an acceptable range. The comparison results show that the proposed method is feasible.
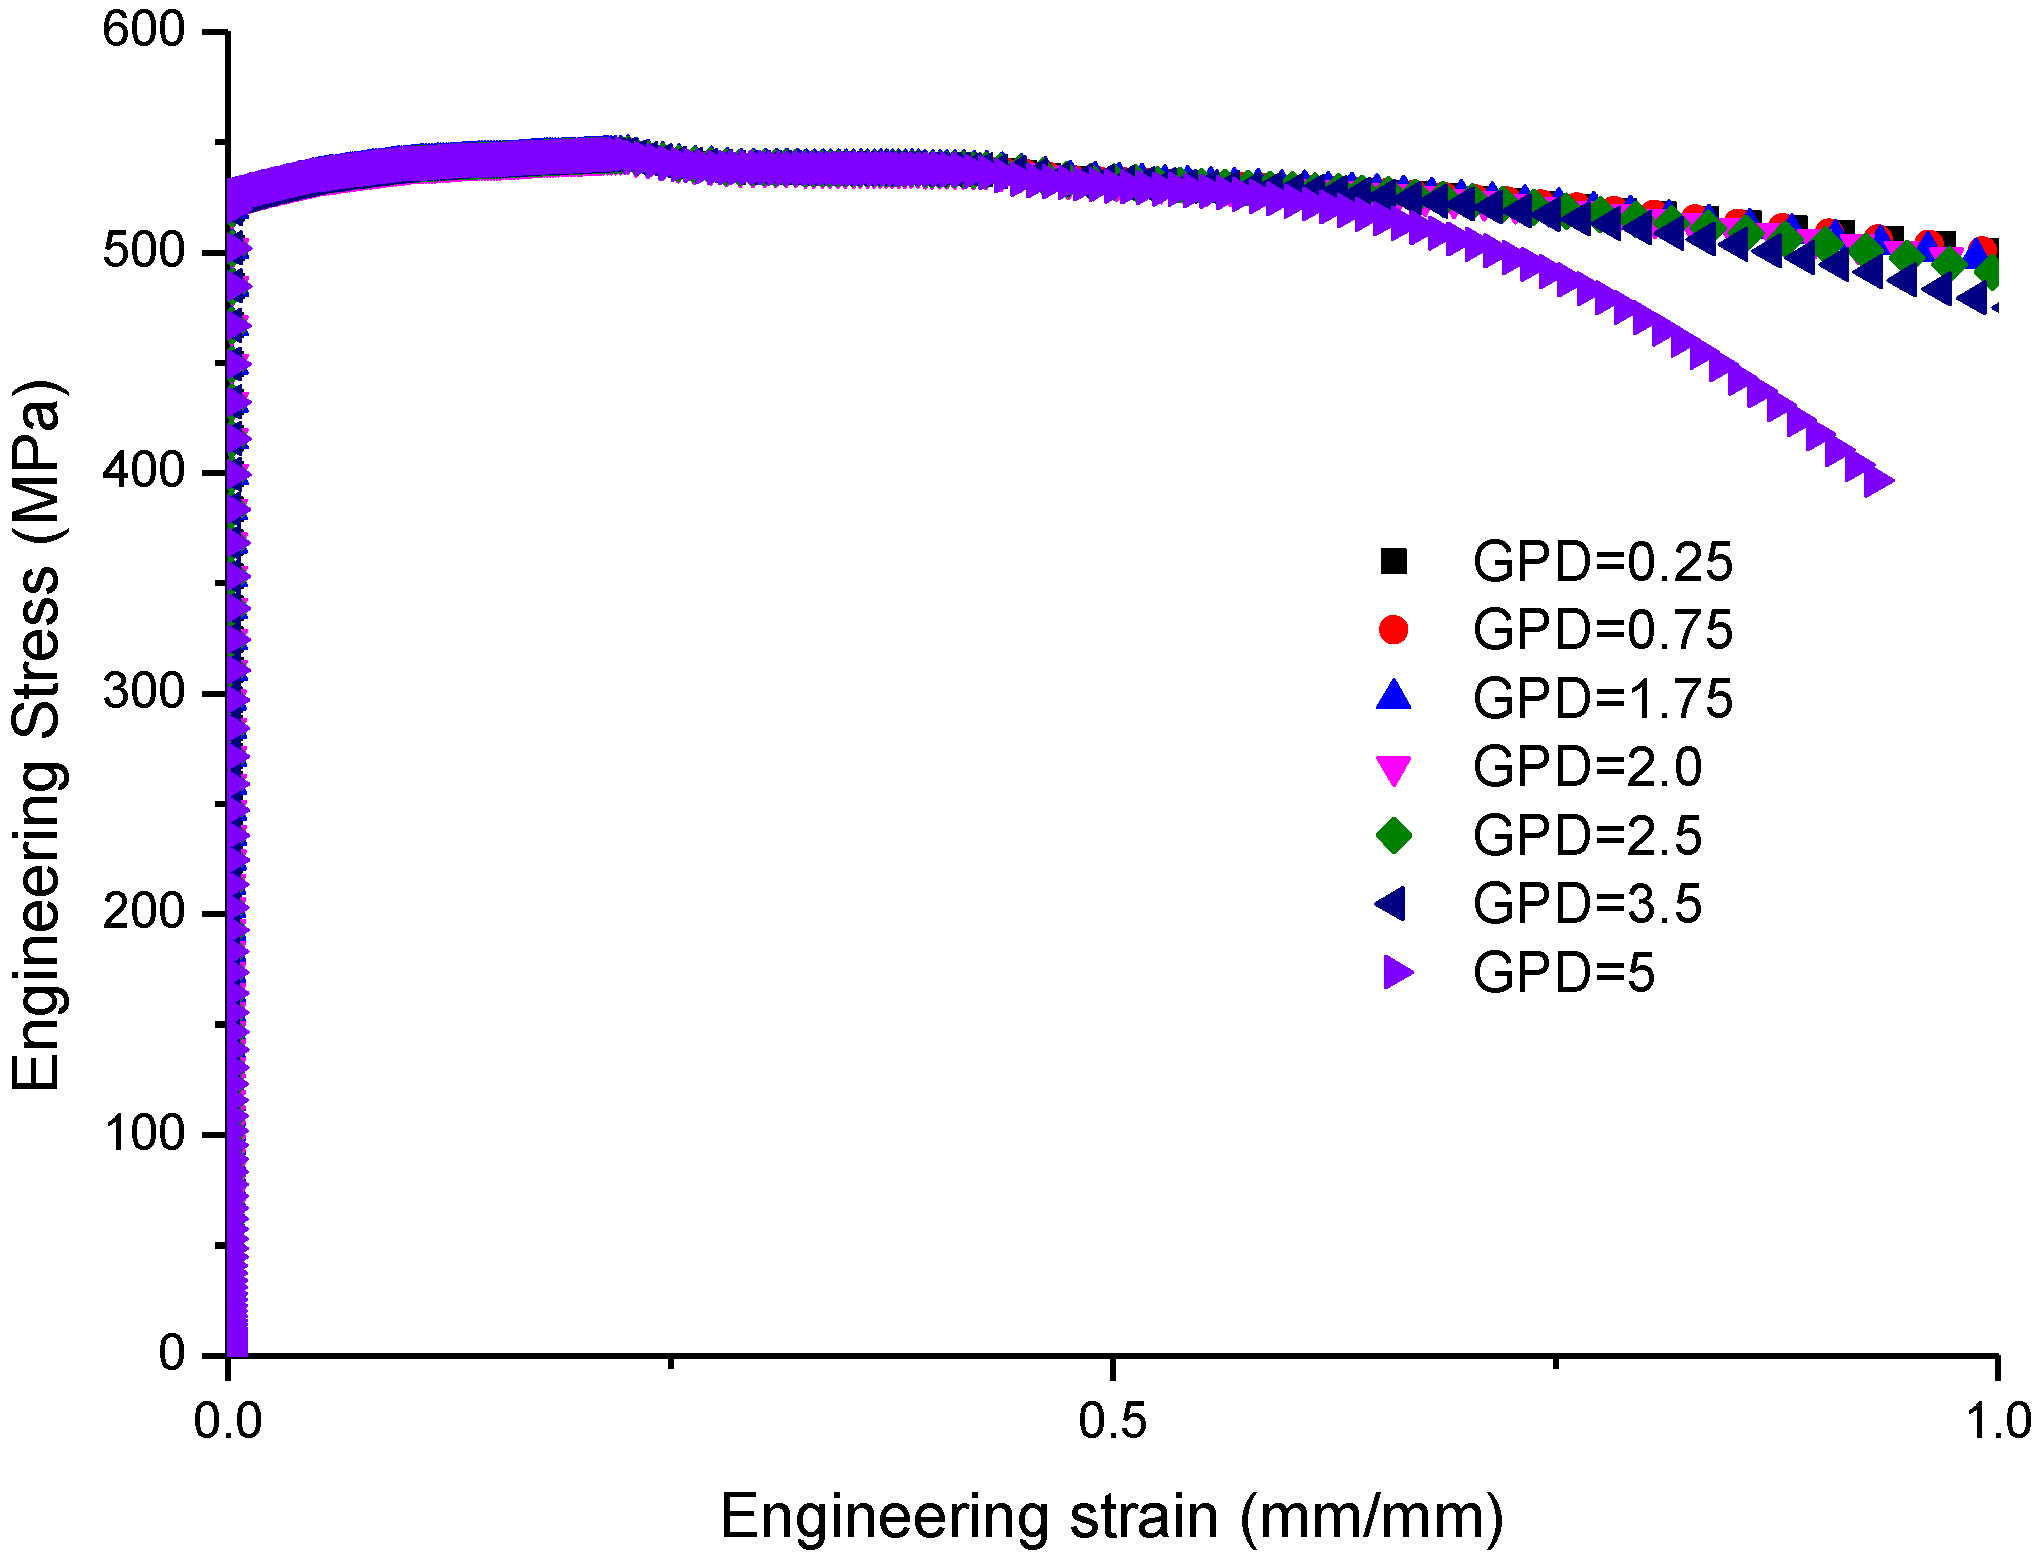
For further illustrating the effect of gauge point distance on the test results, seven values of gauge point distance (GPD) were studied. The values of GPD are 0.25 mm, 0.75 mm, 1.75 mm, 2.0 mm, 2.5 mm, 3.5 mm, and 5 mm, respectively. The engineering strain-engineering stress curves for different GPD values are presented in Figure 13. As shown in Figure 13, except that the GPD is 5mm, the engineering stress-engineering strain curves of different GPD values are almost coincident. Even when the engineering strain reached 0.92, the differences between those engineering stress-engineering strain curves are very small. Thus, the GPD should be less than or equal to 3 mm (2 mm are recommended) when the proposed method is used for obtaining the whole-range uniaxial tensile properties of pipeline steel.
7. Conclusions
In a traditional uniaxial tensile experiment, a strain gauge is generally used to measure the strain value, with a gauge distance of 10 mm. In this paper, a method for testing the true stress-true strain curves of pipeline steel was proposed using a scale distance of 2 mm, which could capture subtler stress and strain values. The proposed method and the traditional strain gauge method were both used to test the engineering stress-engineering strain curves and true stress-true strain curves of six specimens in three groups. Next, the true stress-true strain curves obtained by the proposed method were verified and checked by the established finite element model. Finally, the test results of both methods were compared and analyzed. The main conclusions are as follows:
(1) The true stress-true strain curve and engineering stress-engineering strain curve are basically coincident in the results of the proposed method and the traditional strain gauge method before the onset of necking. This indicates that the pre-necking data obtained by the proposed method is effective and reliable.
(2) After the onset of necking, the true stress and true strain values obtained through the proposed method continued to increase with load displacement. However, the true strain value obtained by the traditional strain gauge grew slowly and the true stress value showed a decreasing trend, which is obviously illogical. The traditional strain gauge could not get effective data after the onset of necking, but the proposed method could still capture the true stress and the true strain.
(3) The true stress-true strain curve of the proposed method was verified by the established finite element model. The engineering stress-engineering strain curves of these two methods were compared, and the results show that they are very close when the strain is less than 0.74.
(4) The layout of gauge points in the proposed method has a great influence on the accuracy of the test results, and the smaller the distance between gauge points, the more accurate the test results will be. The gauge points should be evenly distributed along a symmetric line, and the distance is recommended to be less than 3 mm.
Author Contributions
Conceptualization, L.K. and L.S.; Methodology, X.Z.; Software, L.C.; Validation, X.Z., J.C. and C.M.; Formal Analysis, L.C.; Investigation, L.K.; Resources, L.S.; Data Curation, L.C.; Writing-Original Draft Preparation, L.K.; Writing-Review and Editing, X.Z.; Visualization, J.C.; Supervision, X.Z.; Project Administration, L.C.; Funding Acquisition, L.K.
Acknowledgments
The authors gratefully acknowledge the sponsorship of this work by the Young Scholars Development Fund of SWPU (Grant No. 201699010002), PetroChina Innovation Foundation (Grant No. 2016D-5007-0602), Scientific Research Starting Project of SWPU (No. 2017QHZ003), and National Key R&D Program of China (Grant No. 2016YFC0802100).
Conflicts of Interest
The authors declare no conflict of interest. The founding sponsors had no role in the design of the study; in the collection, analyses, or interpretation of data; in the writing of the manuscript, and in the decision to publish the results.
References
- Shuai, J.; Tu, S.; Wang, J.; Ren, X.; He, J.; Zhang, Z. Determining critical CTOA from energy-load curves with DWTT specimen. Eng. Fract. Mech. 2017, 186, 47–58. [Google Scholar] [CrossRef]
- Paredes, M. Plastic limit load and its application to the fracture toughness testing for heterogeneous single edge notch tension specimens. Fatigue Fract. Eng. Mater. Struct. 2014, 37, 265–279. [Google Scholar] [CrossRef]
- Dadfarnia, M.; Sofronis, P.; Somerday, B.P.; Balch, D.K.; Schembri, P.; Melcher, R. On the environmental similitude for fracture in the SENT specimen and a cracked hydrogen gas pipeline. Eng. Fract. Mech. 2011, 78, 2429–2438. [Google Scholar] [CrossRef]
- Xin, X.X.; Yao, Y.Z.; Zhang, K.L.; Fan, Y.G. Analysis on security of pipeline steel with high yield ratio. Weld. Pipe Tube 2006, 29, 36–39. (In Chinese) [Google Scholar]
- Wang, C.L. The calculation model and test system for true stress-true strain. CN 101319977A, 10 December 2008. [Google Scholar]
- Zhang, Z.L.; Hauge, M.; Ødegård, J.; Thaulow, C. Determining material true stress–strain curve from tensile specimens with rectangular cross-section. Int. J. Solids Struct. 1999, 36, 3497–3516. [Google Scholar] [CrossRef]
- Zhang, Z.L.; Hauge, M.; Thaulow, C.; Ødegård, J. A notched cross weld tensile testing method for determining true stress–strain curves for weldments. Eng. Fract. Mech. 2002, 69, 353–366. [Google Scholar] [CrossRef]
- Yao, D.; Cai, L.X.; Bao, C. An approach for full-range uniaxial constitutive relationships of ductile materials. Chin. Meas. Test 2014, 40, 5–13. (In Chinese) [Google Scholar]
- Joun, M.S.; Eom, J.G.; Min, C.L. A new method for acquiring true stress–strain curves over a large range of strains using a tensile test and finite element method. Mech. Mater. 2008, 40, 586–593. [Google Scholar] [CrossRef]
- Kamaya, M.; Kawakubo, M. A procedure for determining the true stress–strain curve over a large range of strains using digital image correlation and finite element analysis. Mech. Mater. 2011, 43, 243–253. [Google Scholar] [CrossRef]
- Kong, L.; Shuai, J.; Zhou, X.; Chao, Y.; Han, K. A Universal Method for Acquiring the Constitutive Behaviors of API-5 L X90 Welds. Exp. Mech. 2016, 56, 165–176. [Google Scholar] [CrossRef]
- Kong, L.Z.; Shuai, J.; Zhou, X.Y.; Huang, K.; Yu, G.J. True stress-logarithmic strain curves test of pipeline steels using 3D digital image correlation. Optoelectron. Adv. Mater. Rapid Commun. 2015, 9, 1380–1388. [Google Scholar]
- Devivier, C.; Pierron, F.; Wisnom, M.R. Impact damage detection in composite plates using deflectometry and the Virtual Fields Method. Composites Part A 2013, 48, 201–218. [Google Scholar] [CrossRef]
- Brown, R.; Tang, W.; Reynolds, A.P. Multi-pass friction stir welding in alloy 7050-T7451: Effects on weld response variables and on weld properties. Mater. Sci. Eng. A 2009, 513, 115–121. [Google Scholar] [CrossRef]
- Scintilla, L.D.; Tricarico, L.; Brandizzi, M.; Satriano, A.A. Nd:YAG laser weldability and mechanical properties of AZ31 magnesium alloy butt joints. J. Mater. Process. Technol. 2010, 210, 2206–2214. [Google Scholar] [CrossRef]
- Poulain, X.; Kohlman, L.W.; Binienda, W.; Roberts, G.D.; Goldberg, R.K.; Benzerga, A.A. Determination of the intrinsic behavior of polymers using digital image correlation combined with video-monitored testing. Int. J. Solids Struct. 2013, 50, 1869–1878. [Google Scholar] [CrossRef]
- Grytten, F.; Daiyan, H.; Polanco-Loria, M.; Dumoulin, S. Use of digital image correlation to measure large-strain tensile properties of ductile thermoplastics. Polym. Test. 2009, 28, 653–660. [Google Scholar] [CrossRef]
- Han, K.J.; Shuai, J.; Deng, X.M.; Kong, L.Z.; Zhao, X.; Sutton, M. The effect of constraint on CTOD fracture toughness of API X65 steel. Eng. Mech. Fract. 2014, 124, 167–181. [Google Scholar] [CrossRef]
- Boyce, B.L.; Reu, P.L.; Robino, C.V. The constitutive behavior of laser welds in 304L stainless steel determined by digital image correlation. Metall. Mater. Trans. A 2006, 37, 2481–2492. [Google Scholar] [CrossRef]
- ISO 6892-1-2009. Metallic Materials—Tensile Testing—Part 1: Method of Test at Room Temperature; ISO: Geneva, Switzerland, 2009. [Google Scholar]
- GB/T 228-2002. Metallic Materials—Tensile Testing at Ambient Temperature; General Administration of Quality Supervision, Inspection and Quarantine of the People’s Republic of China: Beijing, China, 2002. [Google Scholar]
- Tvergaard, V. Influence of Voids on Shear Band Instabilities Under Plane Strain Conditions. Int. J. Fract. 1981, 17, 389–407. [Google Scholar] [CrossRef]
- Tvergaard, V.; Needleman, A. Analysis of the Cup-Cone Fracture in a Round Tensile bar. Acta Metall. 1984, 32, 157–169. [Google Scholar] [CrossRef]
- Sandvik, A.; Østby, E.; Thaulow, C. A probabilistic fracture mechanics model including 3D ductile tearing of bi-axially loaded pipes with surface cracks. Eng. Fract. Mech. 2008, 75, 76–96. [Google Scholar] [CrossRef]
- Dybwad, J.; Østby, E.; Törnqvist, R.; Thaulow, C. Simulations of Ductile Tearing at Large Strains of Biaxially Loaded Pipes. In Proceedings of the 28th International Conference on Ocean, Offshore and Arctic Engineering, Honolulu, HI, USA, 31 May–5 June 2009. [Google Scholar]
Figure 1.
Special strain gauge for testing the specimen thickness variation.

Figure 2.
Geometrical dimension of specimen.

Figure 3.
Marked specimen.

Figure 4.
Diagrammatic sketch of measured range on the specimen.

Figure 5.
Stretching process of the specimen. (a) chuck displacement 1.3 mm; (b) chuck displacement 6.4 mm; (c) chuck displacement 15.6 mm; (d) chuck displacement 17.6 mm; (e) chuck displacement 18.3 mm; (f) chuck displacement 19.3 mm; (g) chuck displacement 20.3 mm; (h) chuck displacement 21.1 mm.
Figure 5.
Stretching process of the specimen. (a) chuck displacement 1.3 mm; (b) chuck displacement 6.4 mm; (c) chuck displacement 15.6 mm; (d) chuck displacement 17.6 mm; (e) chuck displacement 18.3 mm; (f) chuck displacement 19.3 mm; (g) chuck displacement 20.3 mm; (h) chuck displacement 21.1 mm.

Figure 6.
Comparison of the test results of specimens I1 and I2.

Figure 7.
Comparison of the test results of specimens M1 and M2.

Figure 8.
Comparison of the test results of specimens O1 and O2.

Figure 9.
Distribution diagram of gage points on specimen O.

Figure 10.
Specimen′s finite element model.

Figure 11.
Stretching process of the specimen in finite element simulation. (a) chuck displacement 1.3 mm; (b) chuck displacement 6.4 mm; (c) chuck displacement 15.6 mm; (d) chuck displacement 17.6 mm; (e) chuck displacement 18.3 mm; (f) chuck displacement 19.3 mm; (g) chuck displacement 20.3 mm; (h) chuck displacement 21.1 mm.


Figure 12.
Comparison of the engineering stress-engineering strain of three methods.

Figure 13.
Comparison of engineering strain-engineering stress curves for different gauge point displacements.
Figure 13.
Comparison of engineering strain-engineering stress curves for different gauge point displacements.

© 2018 by the authors. Licensee MDPI, Basel, Switzerland. This article is an open access article distributed under the terms and conditions of the Creative Commons Attribution (CC BY) license (http://creativecommons.org/licenses/by/4.0/).
Share and Cite
MDPI and ACS Style
Kong, L.; Su, L.; Zhou, X.; Chen, L.; Chen, J.; Mao, C. A Simple and Efficient Method for Obtaining the Whole-Range Uniaxial Tensile Properties of Pipeline Steel. Metals 2018, 8, 555. https://doi.org/10.3390/met8070555
AMA Style
Kong L, Su L, Zhou X, Chen L, Chen J, Mao C. A Simple and Efficient Method for Obtaining the Whole-Range Uniaxial Tensile Properties of Pipeline Steel. Metals. 2018; 8(7):555. https://doi.org/10.3390/met8070555
Chicago/Turabian StyleKong, Lingzhen, Lingbo Su, Xiayi Zhou, Liqiong Chen, Jie Chen, and Cheng Mao. 2018. "A Simple and Efficient Method for Obtaining the Whole-Range Uniaxial Tensile Properties of Pipeline Steel" Metals 8, no. 7: 555. https://doi.org/10.3390/met8070555
Note that from the first issue of 2016, this journal uses article numbers instead of page numbers. See further details here.