Article

Speciation of Ruthenium(III) Chloro Complexes in Hydrochloric Acid Solutions and Their Extraction Characteristics with an Amide-Containing Amine Compound

1
Environmental Management Research Institute, National Institute of Advanced Industrial Science and Technology (AIST), 16-1 Onogawa, Tsukuba, Ibaraki 305-8569, Japan
2
Materials Sciences Research Center, Japan Atomic Energy Agency (JAEA), 1-1-1 Koto, Sayo, Hyogo 679-5148, Japan
*
Author to whom correspondence should be addressed.
Metals 2018, 8(7), 558; https://doi.org/10.3390/met8070558
Submission received: 29 June 2018 / Revised: 14 July 2018 / Accepted: 16 July 2018 / Published: 20 July 2018
(This article belongs to the Special Issue Solvent Extraction of Critical Metals)

Abstract

:
The refining of platinum group metals is based mainly on solvent extraction methods, whereas Ru is selectively recovered by distillation as RuO4. Replacement of distillation by extraction is expected to simplify the purification process. To develop an effective extraction system for Ru, we analyzed the Ru species in HCl with ultraviolet-visible (UV-Vis) and Ru K-edge extended X-ray absorption fine structure (EXAFS) spectroscopies, and we examined the properties of Ru extracted with N-2-ethylhexyl-bis(N-di-2-ethylhexyl-ethylamide) amine (EHBAA) and trioctylamine (TOA). EXAFS and UV-Vis spectra of Ru in HCl solutions revealed that the predominant Ru species in 0.5–10 M HCl solutions changed from [RuCl4(H2O)2] to [RuCl6]3− with the HCl concentration. The extraction percentages (E%) of Ru in the EHBAA system increased with increasing HCl concentration, reached 80% at [HCl] = 5 M, and decreased at higher HCl concentrations; the corresponding E% for TOA were low. EXAFS analysis of the extracted complex indicated that the Ru3+ had 5 Cl and 1 H2O in its inner coordination sphere. The similarity of the dependence on HCl concentrations of the E% in the EHBAA system and the distribution profile of [RuCl5(H2O)]2− on [RuCln(H2O)6n]3−n suggested that the EHBAA extracted the pentachlorido species.

1. Introduction

Since ruthenium (Ru) is used in semiconductors and catalysts, the demand for and price of Ru have increased greatly in recent years. Recycling of Ru from spent products is therefore valuable. In the well-known refining process, Ru is selectively recovered by distillation as RuO4 [1,2]. In contrast, the refining of platinum group metals is based mainly on solvent extraction methods. The replacement of distillation by extraction is expected to simplify the purification process. However, there has not been an effective solvent extraction system for Ru [1,2].
Knowledge of Ru species in acidic chloride solutions is important for developing effective extractants. Nevertheless, reliable knowledge is rather limited because of the long time required for equilibration of the aquation/chloridation of Ru ions and the variety of Ru chloride complexes [1,2,3,4,5,6,7,8,9,10]. The properties of Ru species in HCl were precisely summarized in the thesis of Viljoen [9]. Connick and Fine [6] have reported that the equilibration times for Ru(III) in 0.05 and 0.1 M HCl solutions are 64 and 74 days, respectively. The Ru(III) in the 0.05–0.1 M HCl forms [RuCln(H2O)6−n]3−n (n = 1–4) [7]. In contrast, Ru(III) in 10 M HCl exists primarily as [RuCl6]3− [8]. Although stability constants and absorbtivities (ε, M−1 cm−1) of [RuCln(H2O)6−n]3−n (n = 1–6) have been estimated through polarographic and ultraviolet-visible spectroscopy (UV-Vis) measurements of Ru species separated by ion-exchange resins [9], the constants are scattered. Viljoen [9] has recently verified the K value for [RuCl6]3−/[RuCl5(H2O)]2−, but no effort has been made to determine the K values for [RuCln(H2O)6−n]3−n/[RuCln−1(H2O)5−n] with lower n and to obtain structural parameters for the complexes in aqueous HCl solutions.
Because of the inert properties of aqua-chlorido or hexachlorido complexes with trivalent platinum group metal ions [1,2], few extraction studies of Ru(III) in HCl solutions have been reported, as is also true for studies of Rh(III). The mechanism of extraction and structural knowledge of Ru(III) are also lacking. However, we have already found that Rh(III) can be successfully extracted with amide-containing amine compounds [11,12].
In the present study, we analyzed Ru complexes in 0.5–10 M HCl solutions by means of UV-Vis and extended X-ray absorption fine structure (EXAFS) spectroscopies, and we compared Ru(III) extraction properties for N-2-ethylhexyl-bis(N-di-2-ethylhexyl-ethylamide) amine (EHBAA, Figure 1), which is an amide-containing amine compound, with those for trioctylamine (TOA, Figure 1). The structural properties of the Ru(III) complex extracted with EHBAA were also studied using EXAFS spectroscopy.

2. Materials and Methods

2.1. Reagents

EHBAA and TOA were purchased from Chemicrea Inc. (Tokyo, Japan) and Wako Pure Chemical Industries, Ltd. (Osaka, Japan), respectively, and used without further purification. All HCl solutions containing Ru were prepared by using RuCl3 dihydrate (Soekawa Chemicals Inc., Sendai, Japan) and concentrated HCl (Wako Pure Chemical Industries, Ltd., Osaka, Japan). The solutions were kept in the dark at room temperature. All chemicals were of reagent grade.

2.2. Measurement of UV-Vis Absorption Spectra

Hydrochloric acid solutions (0.5–10 M) containing 0.9 mM Ru were prepared and allowed to stand for 1 day to 3 months. Absorption spectra of the sample solutions were collected using a UV-Vis spectrometer (UV-2500PC, Shimadzu Corporation, Kyoto, Japan) and quartz cells with a 0.20 cm optical path length. Spectra in the range 300–600 nm were analyzed using the Hyperquad program (Protonic Software) [13] to determine the K and ε values of Ru chloride complexes. Fitting quality was checked using a least-squares minimization function defined as S = ∑[(AbsobsAbsfit)/(Absobs)]2, where Abs denotes the absorbance of the UV-Vis spectra. The stepwise stability constants of Ru(III) chloride complexes are defined as follows:
  K n = y n [ RuCl n ( H 2 O ) ( 6 n ) ] 3 n y n 1 [ RuCl n 1 ( H 2 O ) ( 7 n ) ] 4 n y Cl [ Cl ]    
where yn is activity coefficients of [RuCln(H2O)6−n]3−n, and yCl is the mean activity coefficient of HCl determined previously [14]. The yn is defined on basis of the modified Debye-Hückel model which was proposed by Partanen et al. as follows [15,16]:
  log y n = A z n 2 I 1 + B å n I + b 1 I + b 2 I 2 + b 3 I 7 2 + Γ y  
where zn is the valence of [RuCln(H2O)6−n]3−n, ån is the distance of closest approach between the aqueous Ru species and hydrogen ions, b1, b2, and b3 are adjustable parameters, I is ionic strength (mol/kg), and Γy is a molarity conversion factor. The A and B are the Debye-Hückel parameter A = 0.5108 (mol/kg)−1/2 and the electrolyte-dependent parameters B = 1.4 (mol/kg)−1/2, respectively. Since the b and Γy terms in Equation (2) are independent of aqueous Ru species, the yn/yn−1 is expressed as follows:
  log y n y n 1 = A z n 2 I 1 + B å n I + A z n 1 2 I 1 + B å n 1 I    
The 4 for å4, 5 for å5, and 9 for å6 were used in order to estimate the logarithmic yn/yn−1 [17]. In contrast, the y4/y3yCl was assumed to be 1 since the K value for [RuCl4(H2O)2]/[RuCl3(H2O)3] without involving the y4/y3yCl is constant regardless ionic strength [6].

2.3. Extraction Procedure

Solutions of 0.5 M EHBAA or TOA dissolved in chloroform and aqueous HCl solutions were contacted in 10 mL glass tubes with a vertical shaker (Yayoi, Tokyo, Japan) (amplitude: 100 mm and frequency: 200 strokes/min). After centrifugation, 1 mL of the pre-equilibrated organic phase and an equal volume of HCl solution containing 1 mM Ru were shaken and then centrifuged. Metal concentrations in the aqueous solution were determined using an inductively coupled plasma atomic emission spectrometer (Ultima2, Horiba, Ltd., Kyoto, Japan). Extraction percentages were calculated on the basis of the mass balance of Ru in the aqueous phases.

2.4. XAFS Measurements

HCl solutions (0.7–10 M) containing 0.1 M Ru(III) were allowed to stand for two weeks. A dodecane solution containing Ru(III) and 0.5 M EHBAA were prepared by extraction of Ru (0.1 M) in 5 M HCl with a 6-h shaking time. The XAFS measurements were carried out on the BL11XU beamline at the SPring-8 synchrotron radiation facility. The synchrotron radiation was monochromatized using a Si(111) crystal. The Ru K-edge absorption spectra were collected in transmission mode using a plastic cell with a path length of 5 or 10 mm. Energy calibrations were performed using Ru metal (22117 eV) [18]. The EXAFS signal was extracted from the raw absorption spectra by spline approximation for atomic absorption background using the ATHENA software package (version 0.8.056) [19], and then the signals, weighted by k3, were windowed using the Hann function. Data fitting was performed with the ARTHEMIS software package (version 0.8.012) [19]. The theoretical phases and amplitudes were calculated with FEFF6 on the basis of the structure of [Ru(H2O)6]3+ and [RuCl6]3− [20,21,22]. Since the coordination number of Ru3+ in aqueous solution has been reported to be 6 [9,21,22], that of Ru in the sample solutions was fixed at 6. The number of Cl (NCl) in the 10 M HCl system was fixed at 6 on the basis of the similarity of the UV-Vis spectra of 8–10 M HCl solutions in our system and the NCl of [RuCl6]3− assigned by Jorgensen [8]. The amplitude reduction factor was determined in the fit of Ru3+ in the 10 M HCl solution, and the obtained value (1.0) was applied in all the data fits. The values of the square of the Debye-Waller factor (σ2) of the Ru-Cl (0.0039) and Ru-O (0.0014) shells obtained in the fit of the 10 M HCl solution and 1 M HCl systems, respectively, were also fixed in the fits of the aqueous system. The standard deviations were determined with an F test (95% confidence) [23], and fitting quality was checked using the R-factor defined as R = {∑([Refit]2 + [Imfit]2)/ ∑([Reobs]2 + [Imobs]2), where Re and Im denote the real and imaginary parts of EXAFS.

2.5. Fourier-Transform Infrared (FT-IR) Spectroscopy Measurements

Dodecane solution containing Ru(III) and 0.5 M EHBAA were prepared in a similar manner as the XAFS sample. The FT-IR spectrum of the sample solution was recorded in the range 600–4000 cm−1 with a resolution of 4 cm−1 using an attenuated total reflection method with an FT-IR spectrometer (Spectrum 100, Perkin Elmer, Waltham, MA, USA). The data collection was repeated 16 times, and the results were merged.

3. Results and Discussion

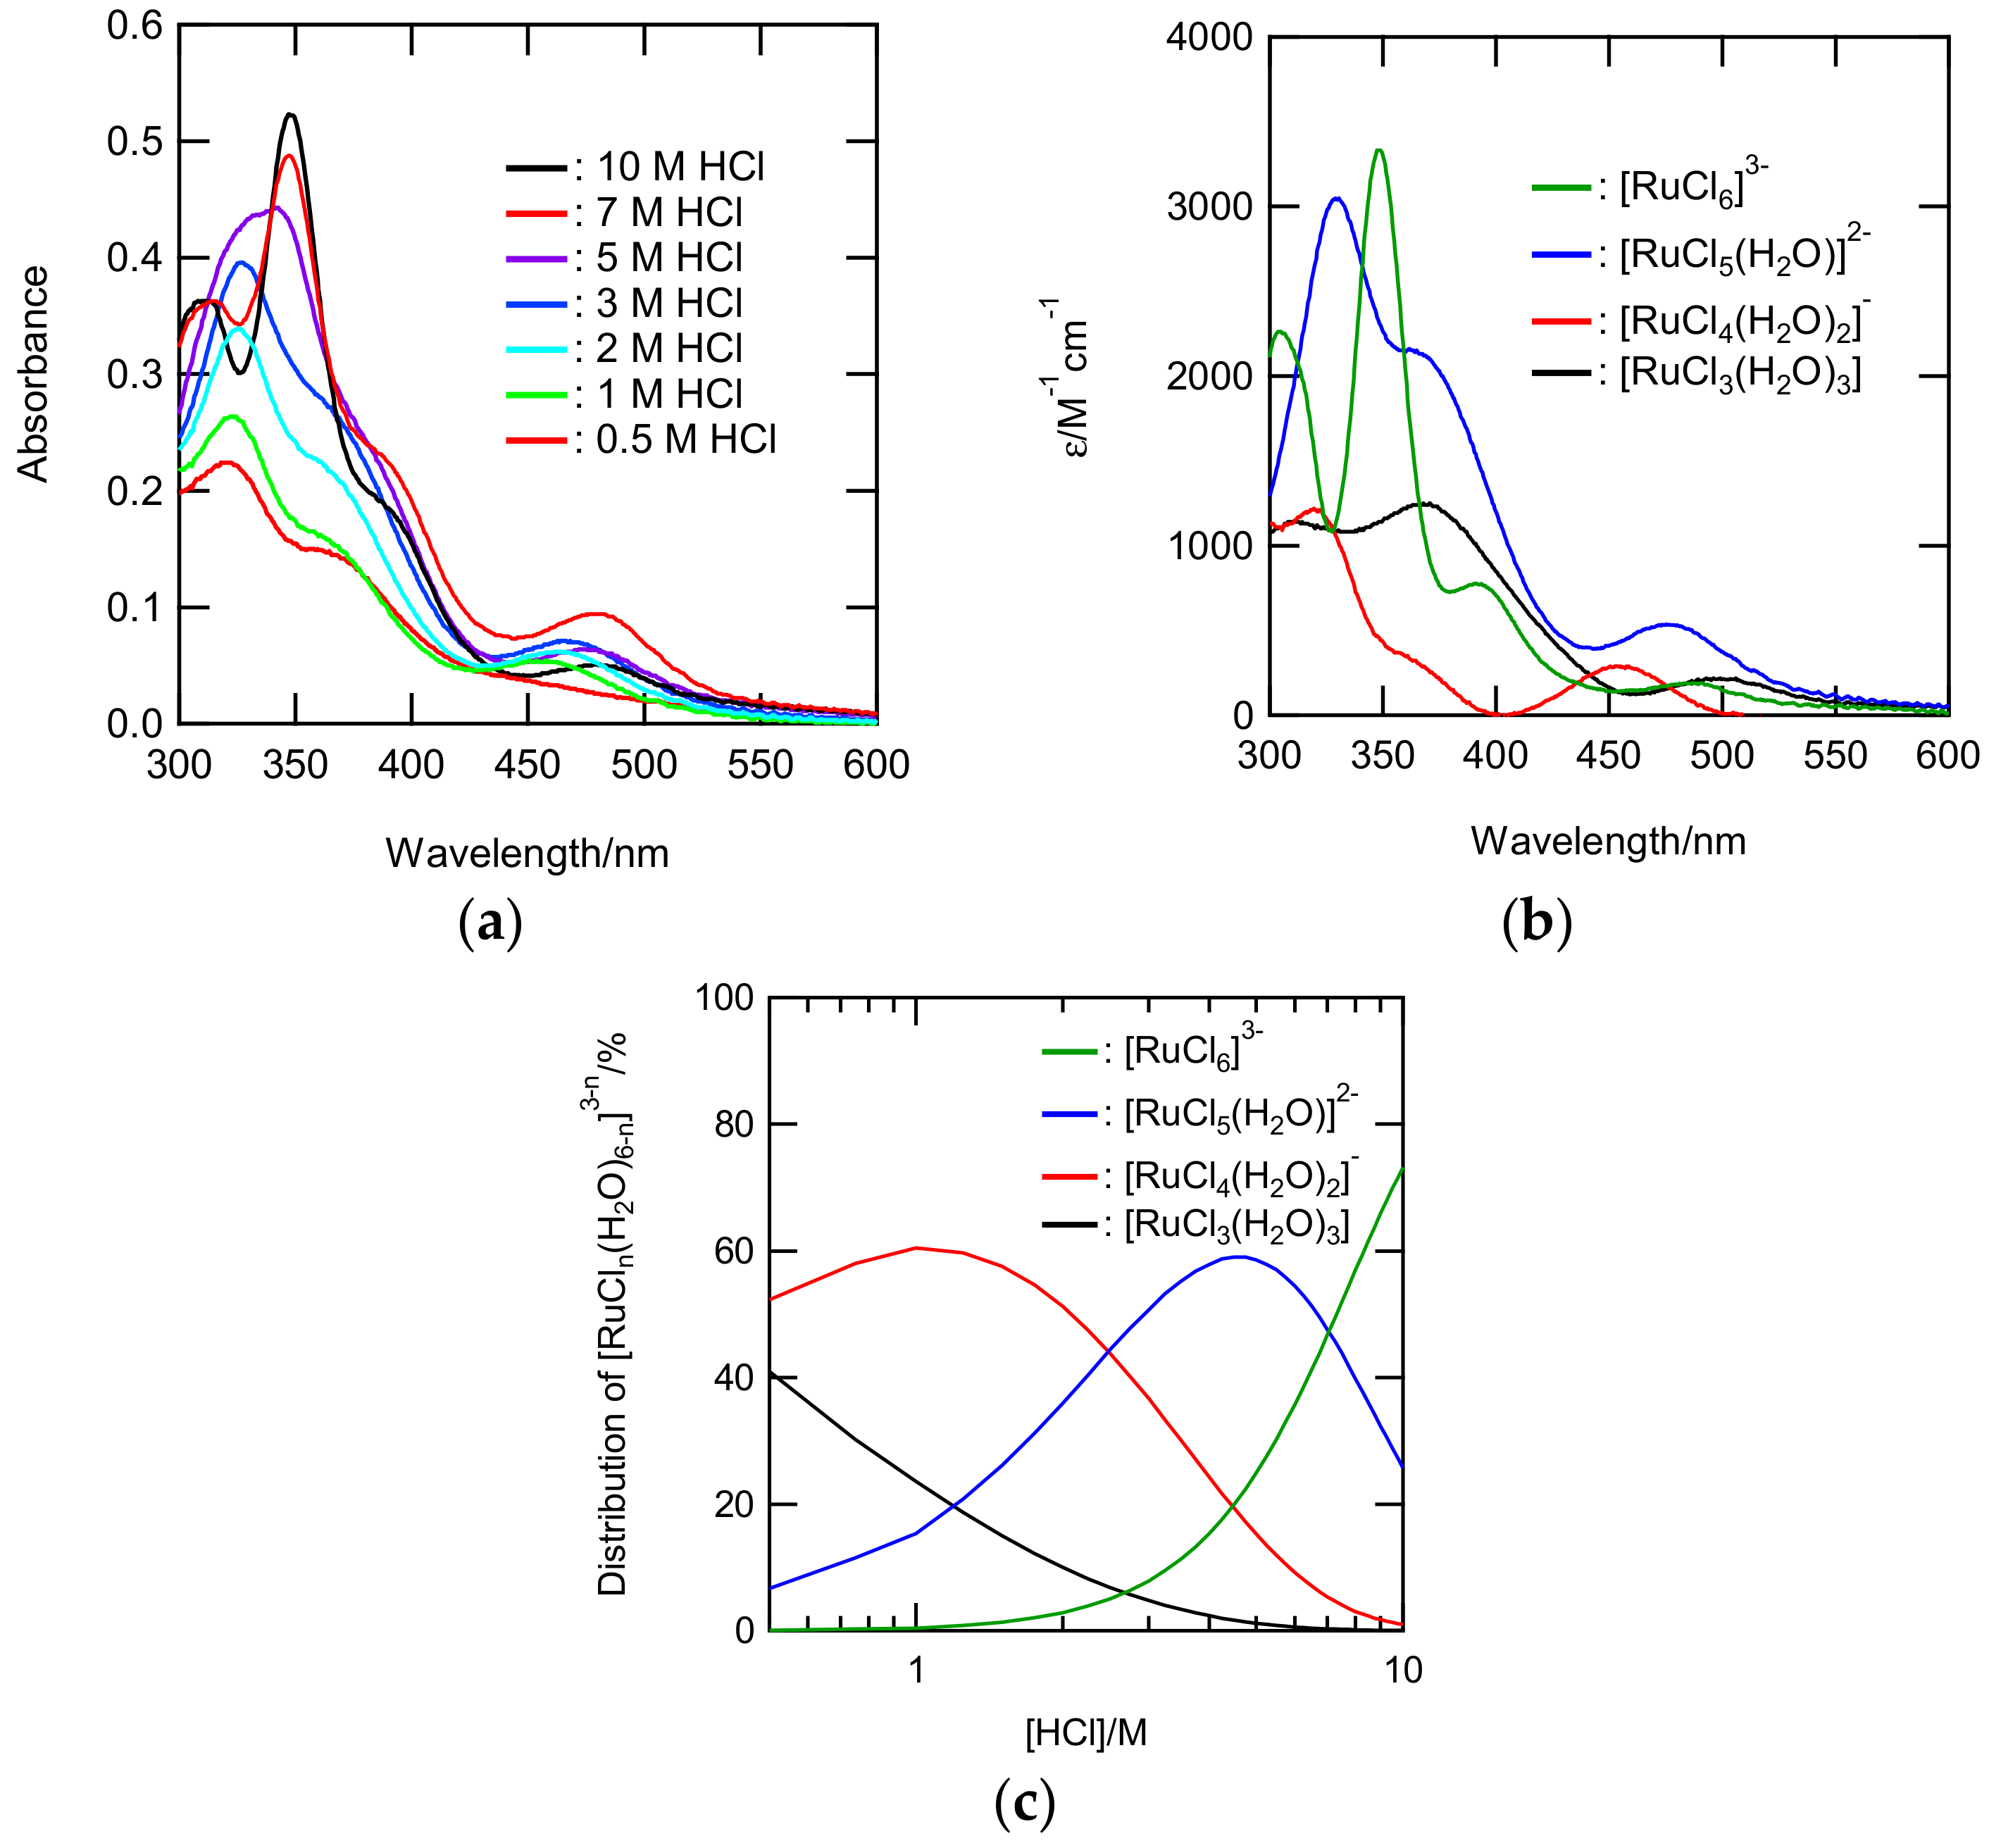
3.1. Analysis of Ru Species in Aqueous HCl

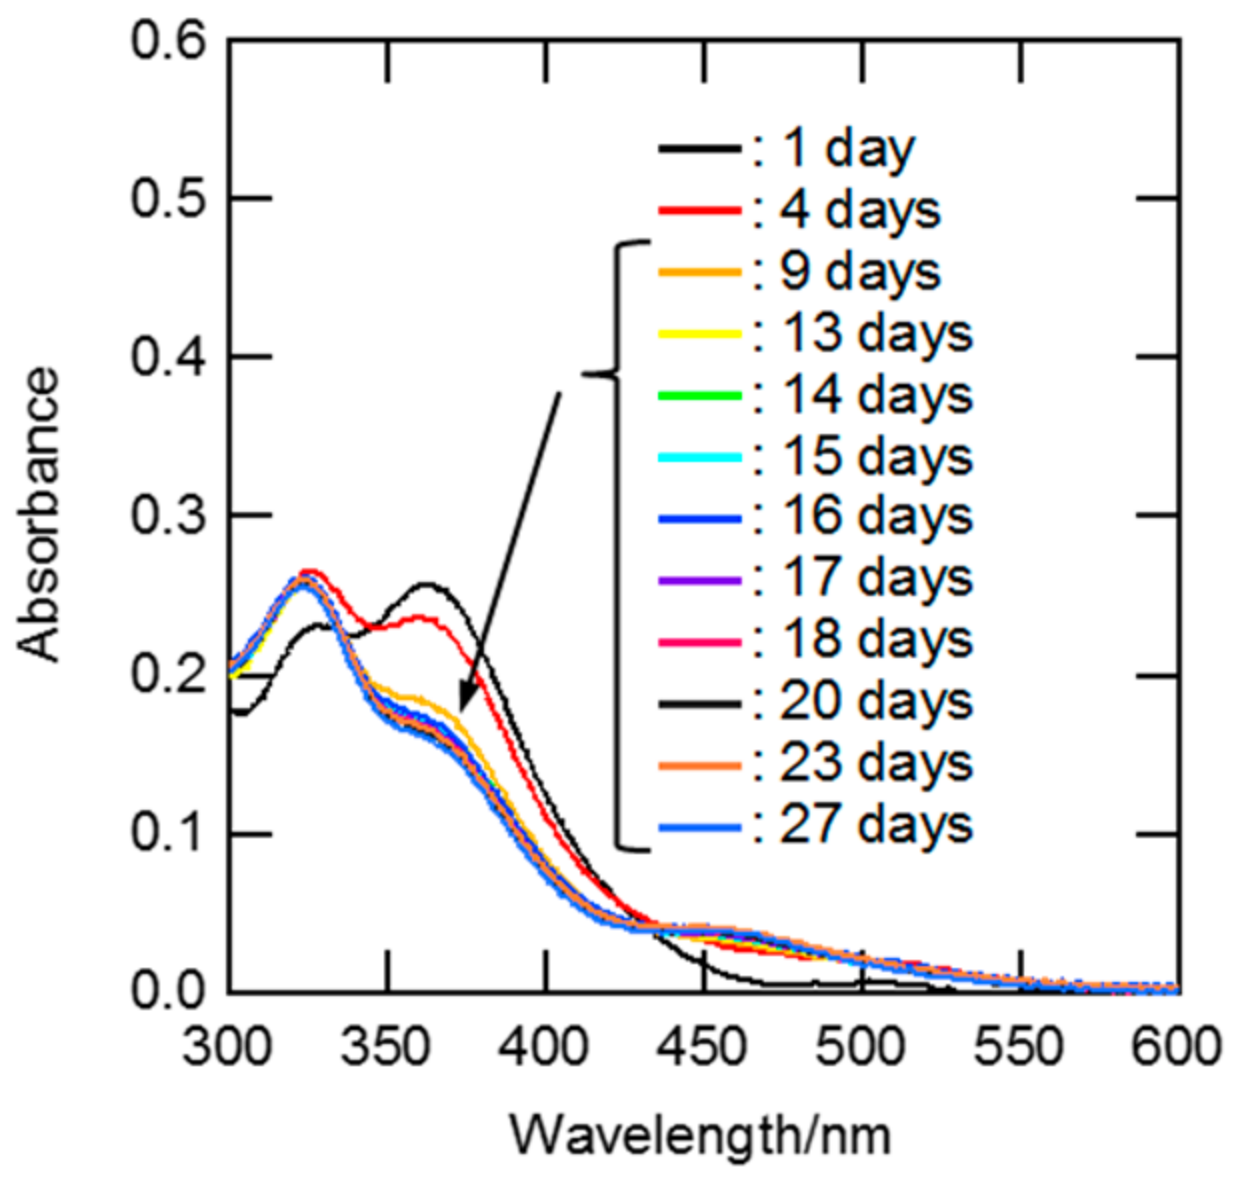
3.1.1. Estimation of Equilibration Time for Aquation/Chloridation of Ru

The equilibration times for the ligand exchange reactions of Ru between H2O and Cl after the dissolution of RuCl3 dihydrate into aqueous HCl solutions were estimated from the time-dependent UV-Vis spectra. The results at 1 M HCl are shown in Figure 2. An absorption band around 360 nm appeared in the spectrum after a storage time of one day, and it became weaker with increasing storage time. The similarity of the UV-Vis spectral shapes on days 13–27 indicated that the aquation/chloridation of Ru in 1 M HCl solution attained equilibrium within 13 days. The same approach was used to investigate the equilibration times at various HCl concentrations. Figures S1–S7 show time-dependent UV-Vis spectra for Ru solutions of 0.5, 0.7, 2, 3, 5, 7, and 10 M HCl. The time required for equilibration was drastically shortened with increasing HCl concentration. This phenomenon is likely to be due to the fact that the anation rate is much faster for [RuCl5(H2O)]2 than for [RuCln(H2O)6−n]3−n with lower n [9,24].

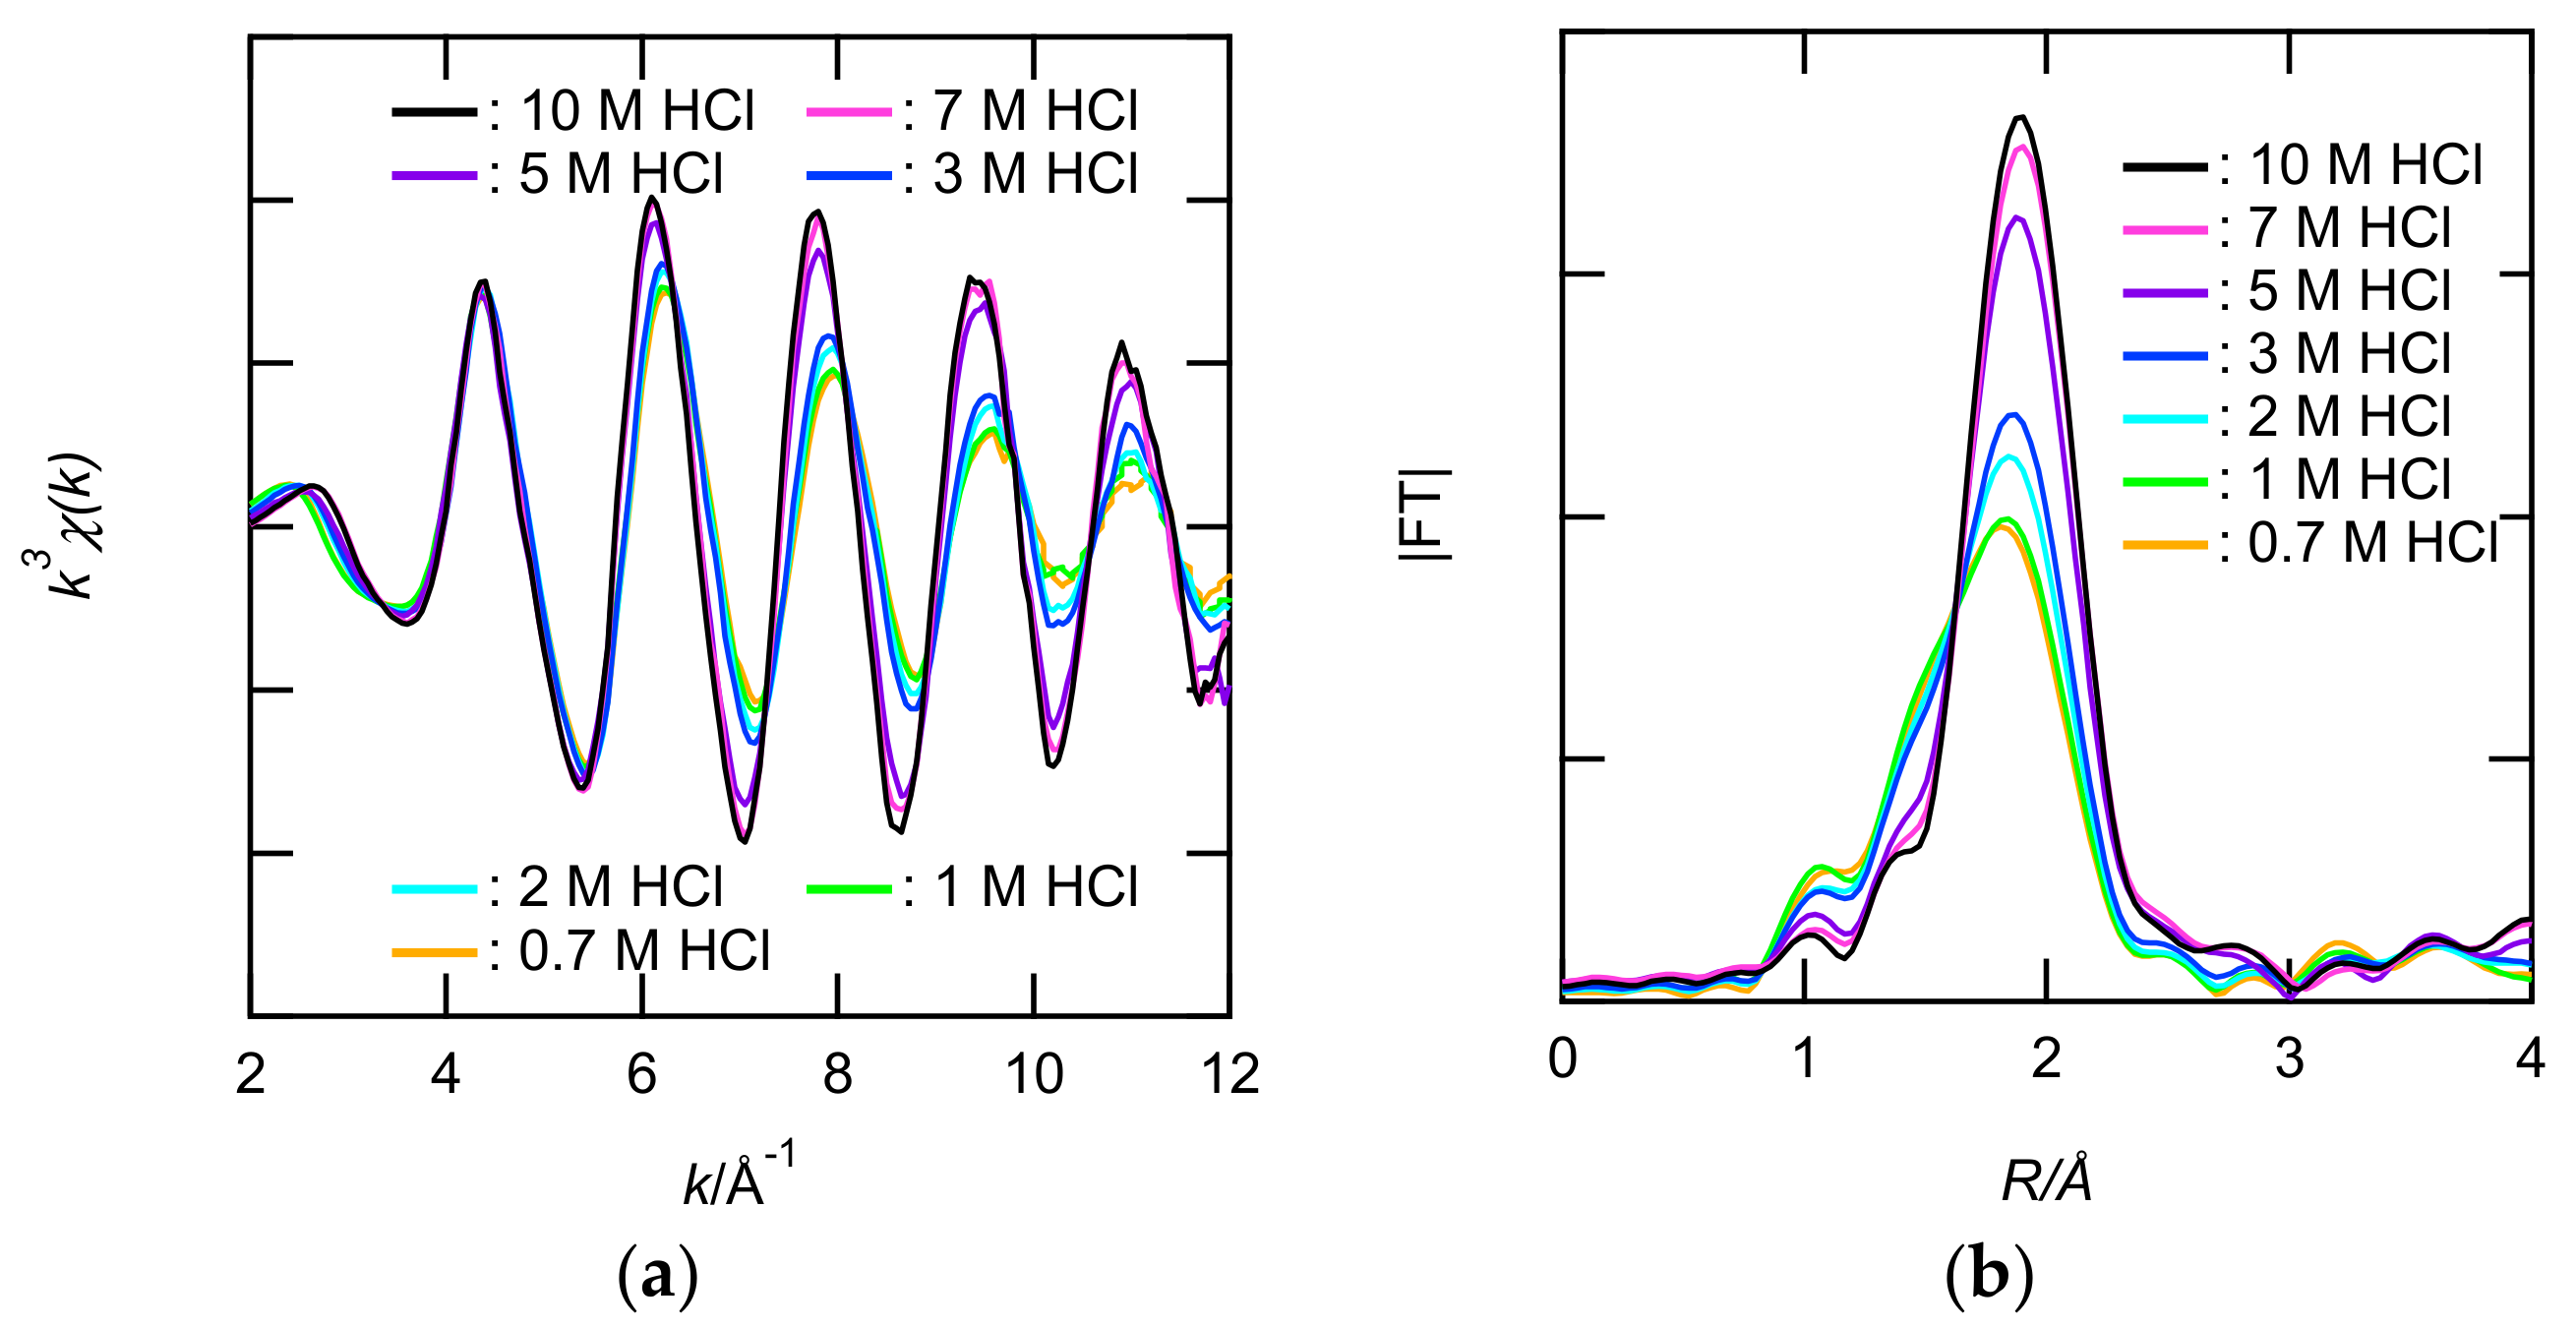
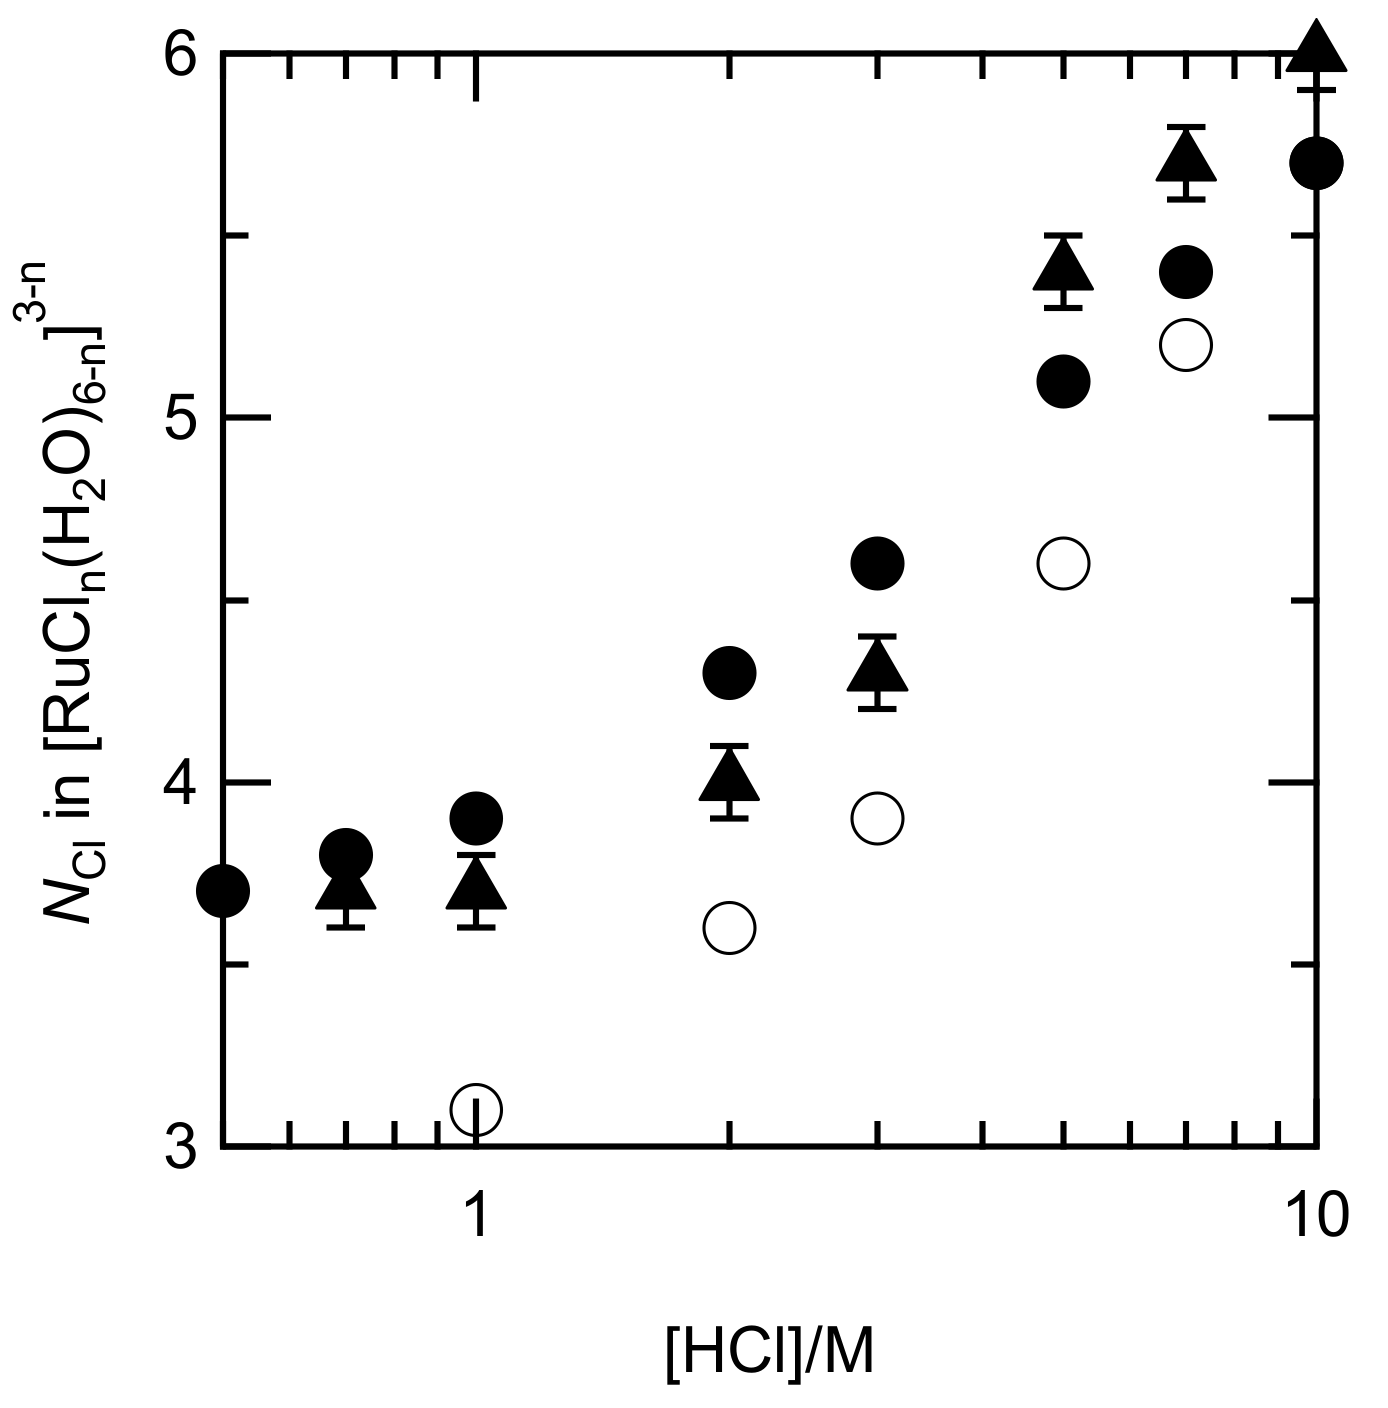
3.1.2. Speciation of Ru Species

XAFS measurements of 0.1 M Ru solutions at 0.7–10 M HCl were performed to clarify the inner coordination sphere of the Ru. The X-ray absorption near edge structure (XANES) spectra in the Ru solutions were similar to that in solid RuCl3 dihydrate, whereas those of Ru metal and RuO2 were different (see Figure S8). These results clearly indicated that Ru in the 0.7–10 M HCl solutions was trivalent. Figure 3a,b and Figure S9 show the Ru K-edge k3-weighted EXAFS and their FT spectra. In the FT spectra shown in Figure 3b, the intense peak (1.9 A) gradually changed with increasing HCl concentration. The absence of other peaks in the longer R range indicated that the Ru(III) in the sample solutions were mononuclear complexes but not polynuclear. The intense peak was broader for 0.7 M HCl than for 10 M HCl. To clarify the presence of Cl and H2O in the inner coordination sphere of Ru3+, 2-shell fit (Cl and O) was performed. Table 1 lists the structural parameters obtained from the fits. The number of oxygens (NO) and NCl decreased and increased, respectively, with increasing HCl. The EXAFS fitting results revealed that the anionic species in [RuCln(H2O)6−n]3−n (n = 4–6) were present primarily in the 0.7–10 M HCl solutions.
The speciation of Ru was also investigated by means of UV-Vis spectroscopy. Figure 4a shows UV-Vis spectra for Ru(III) solutions in 0.5–10 M HCl. All the sample solutions were allowed to stand for 3 months. Three characteristic bands in the range 300–360 nm appeared in the spectra shown in Figure 4a. According to ref. 9, [RuCl4(H2O)2] and [RuCl5(H2O)]2− have an adsorption band around 320 nm, whereas [RuCl6]3− has bands around 310 and 350 nm. The stepwise stability constants of [RuCln(H2O)6−n]3−n were estimated using spectra shown in Figure S10. Reasonable results with a lower S value and positive ε were obtained through calculations involving the equilibrium of K4, K5, and K6. The obtained constants were 0.408 ± 0.005 for log K4, −0.642 ± 0.005 for log K5, and −1.48 ± 0.02 for log K6. Figure 4b shows the ε values for each of the Ru(III) chloride complexes. The wavelength of the band and ε for the [RuCl4(H2O)2], [RuCl5(H2O)]2−, and [RuCl6]3− were consistent with those determined in the previous studies [9], whereas the ε for [RuCl3(H2O)3] resembled the ε for the facial complex rather than the meridional complex. The speciation diagram of Ru(III) species shown in Figure 4c were produced on the basis of the stability constants found in this study.
The distribution profile was slightly different from those in the former report, i.e., the portion of [RuCl5(H2O)]2− in our diagram was higher, around 5 M HCl [9]. Figure 5 shows the NCl numbers in [RuCln(H2O)6−n]3−n, which were evaluated using the fractions of each Ru species, and those of the EXAFS fits along with those calculated by Viljoen [9]. The NCl in our systems had an analogous dependence on the HCl concentrations and were higher than those in the other system. The similarity of NCl indicated that the assumption of y4/y3yCl is reasonable.

3.2. Ru(III) Extraction Studies

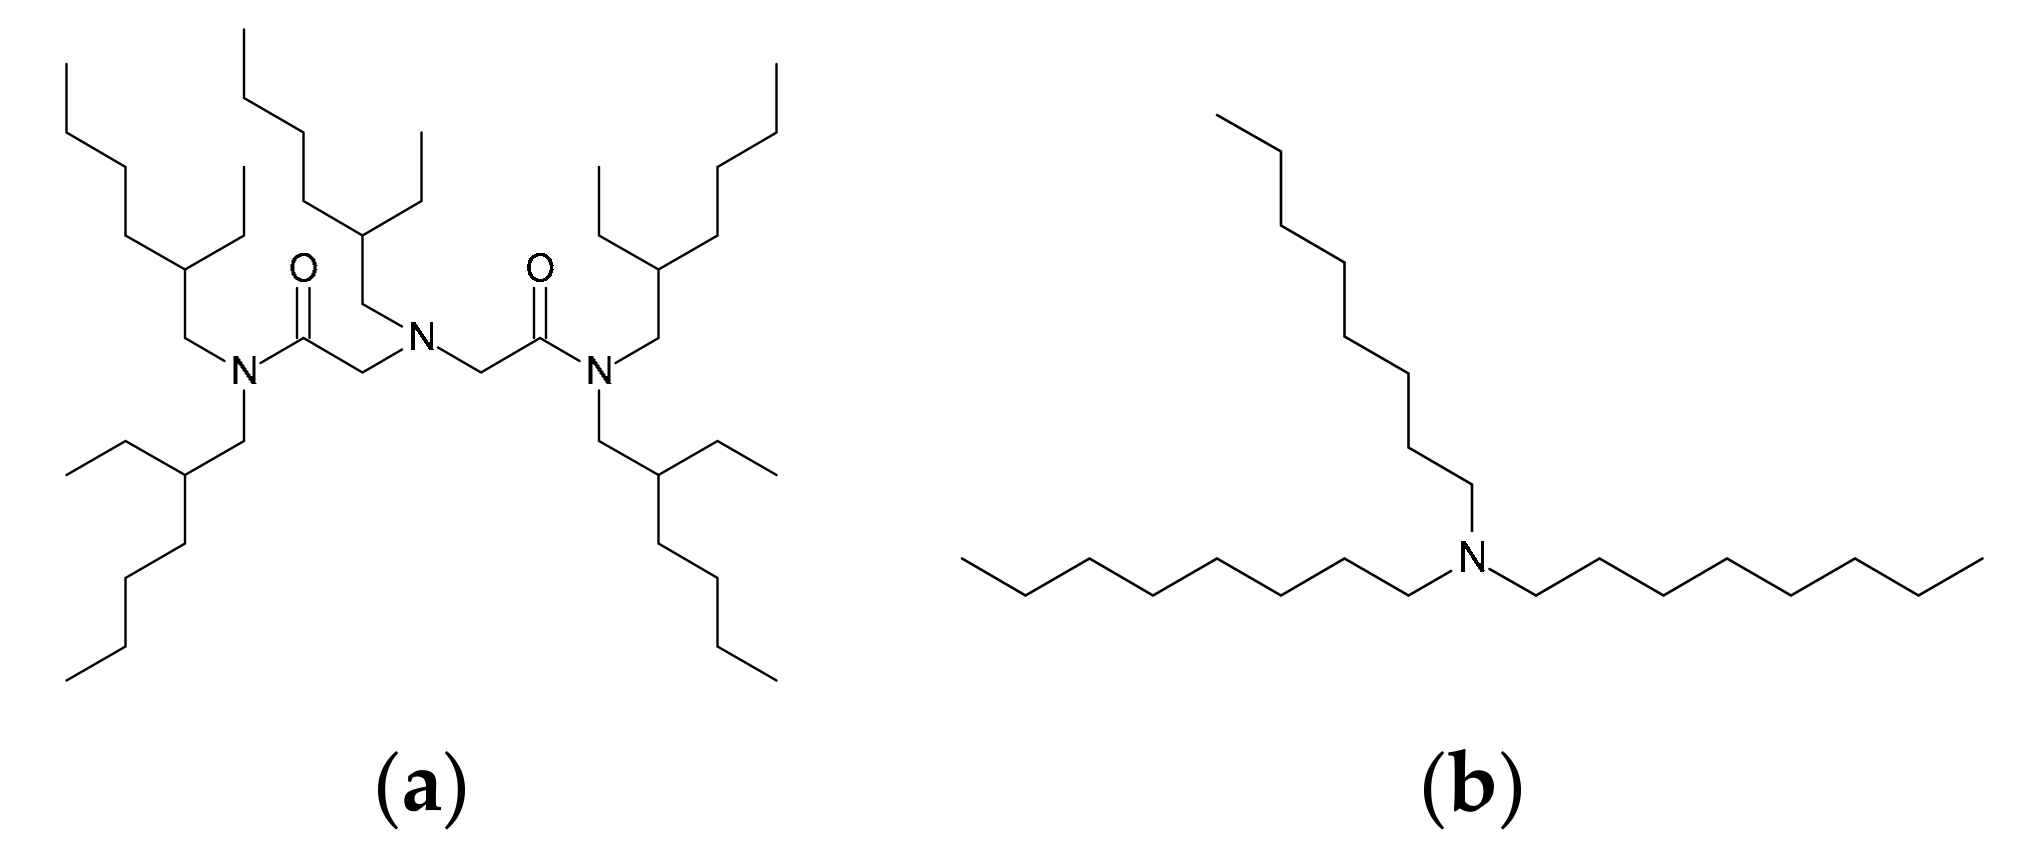
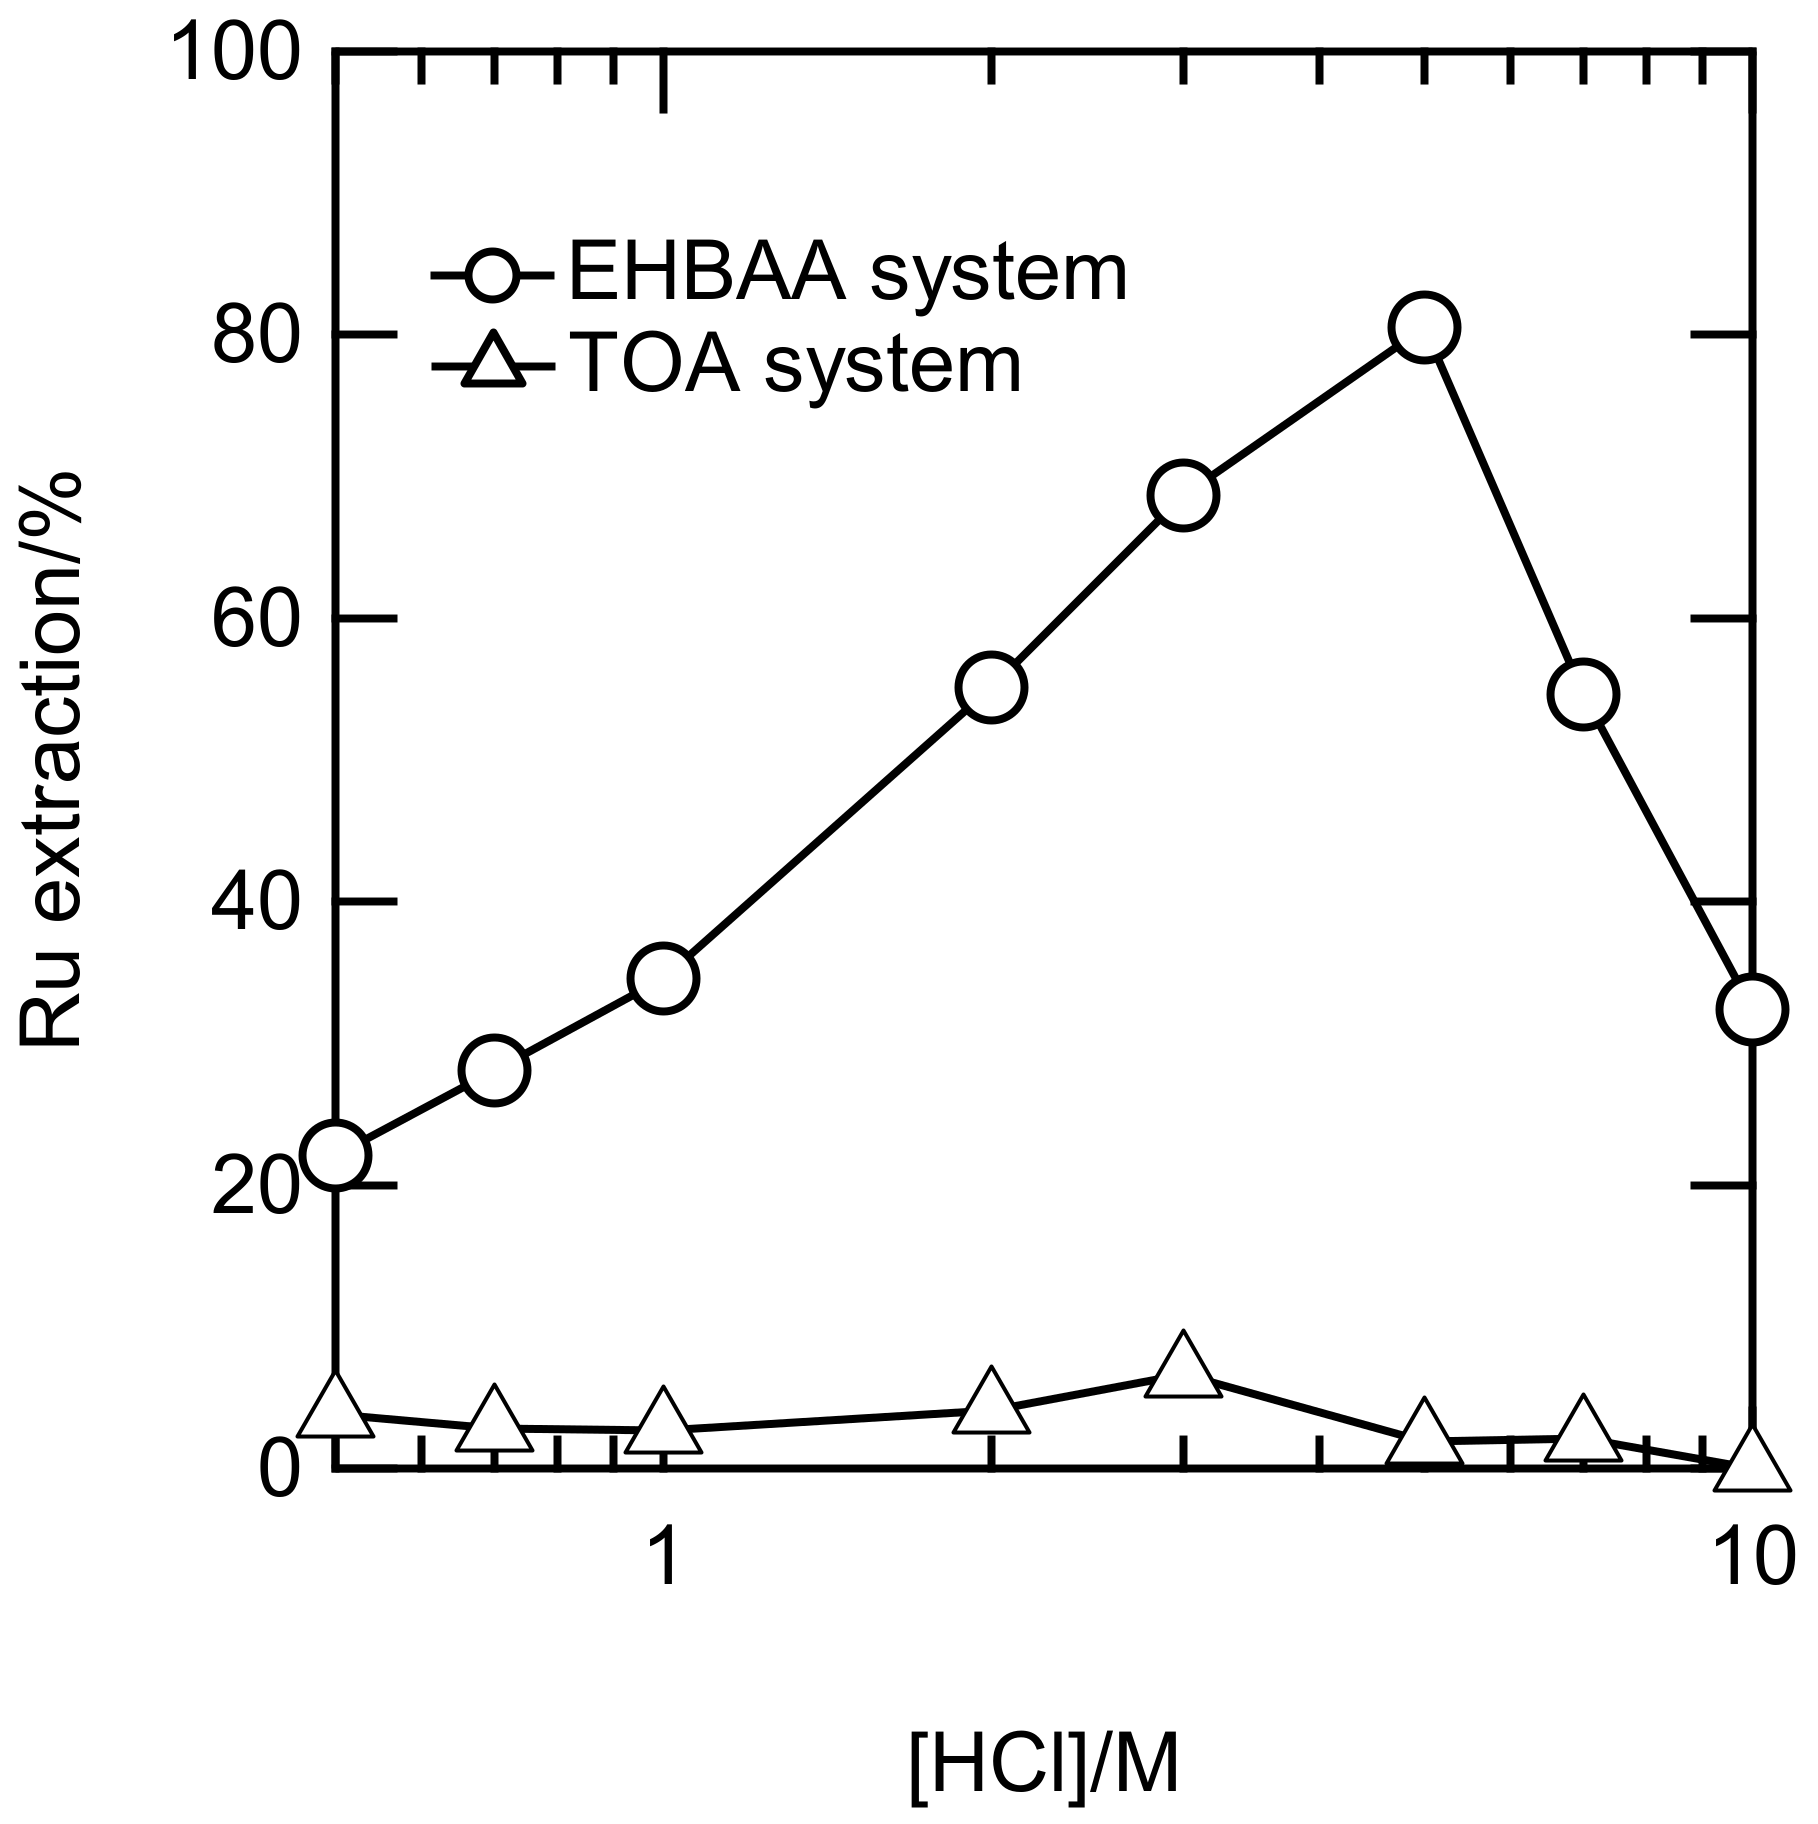
3.2.1. Extraction Ability of EHBAA

The EXAFS and UV-Vis studies revealed that predominant Ru(III) complexes in 0.5–10 M HCl were anionic. We attempted to extract the Ru(III) complexes using EHBAA, which has a high affinity for the Rh(III)-chlorido anion [11,12]. The shaking time was 6 h, a time sufficient for the Ru(III) extraction in the EHBAA system to reach equilibrium (see Figure S11). Figure 6 shows Ru extraction percentages (E%) in the EHBAA and TOA systems at 0.5–10 M HCl. The E% for the EHBAA gradually increased with HCl concentration, reached a maximum at 5 M, and then decreased, whereas the E% for the TOA was small over the entire range of HCl concentrations. The amide groups in the EHBAA may strongly affect the Ru(III) chlorido anion. This effect has been observed in the study of Rh(III) extraction using amide-containing amine compounds [11,12]. The profile of E% in the EHBAA system versus HCl concentration closely resembled that of the distribution percentages in the [RuCl5(H2O)]2− in Figure 4. Therefore, the EHBAA may preferentially extract the pentachlorido anion.

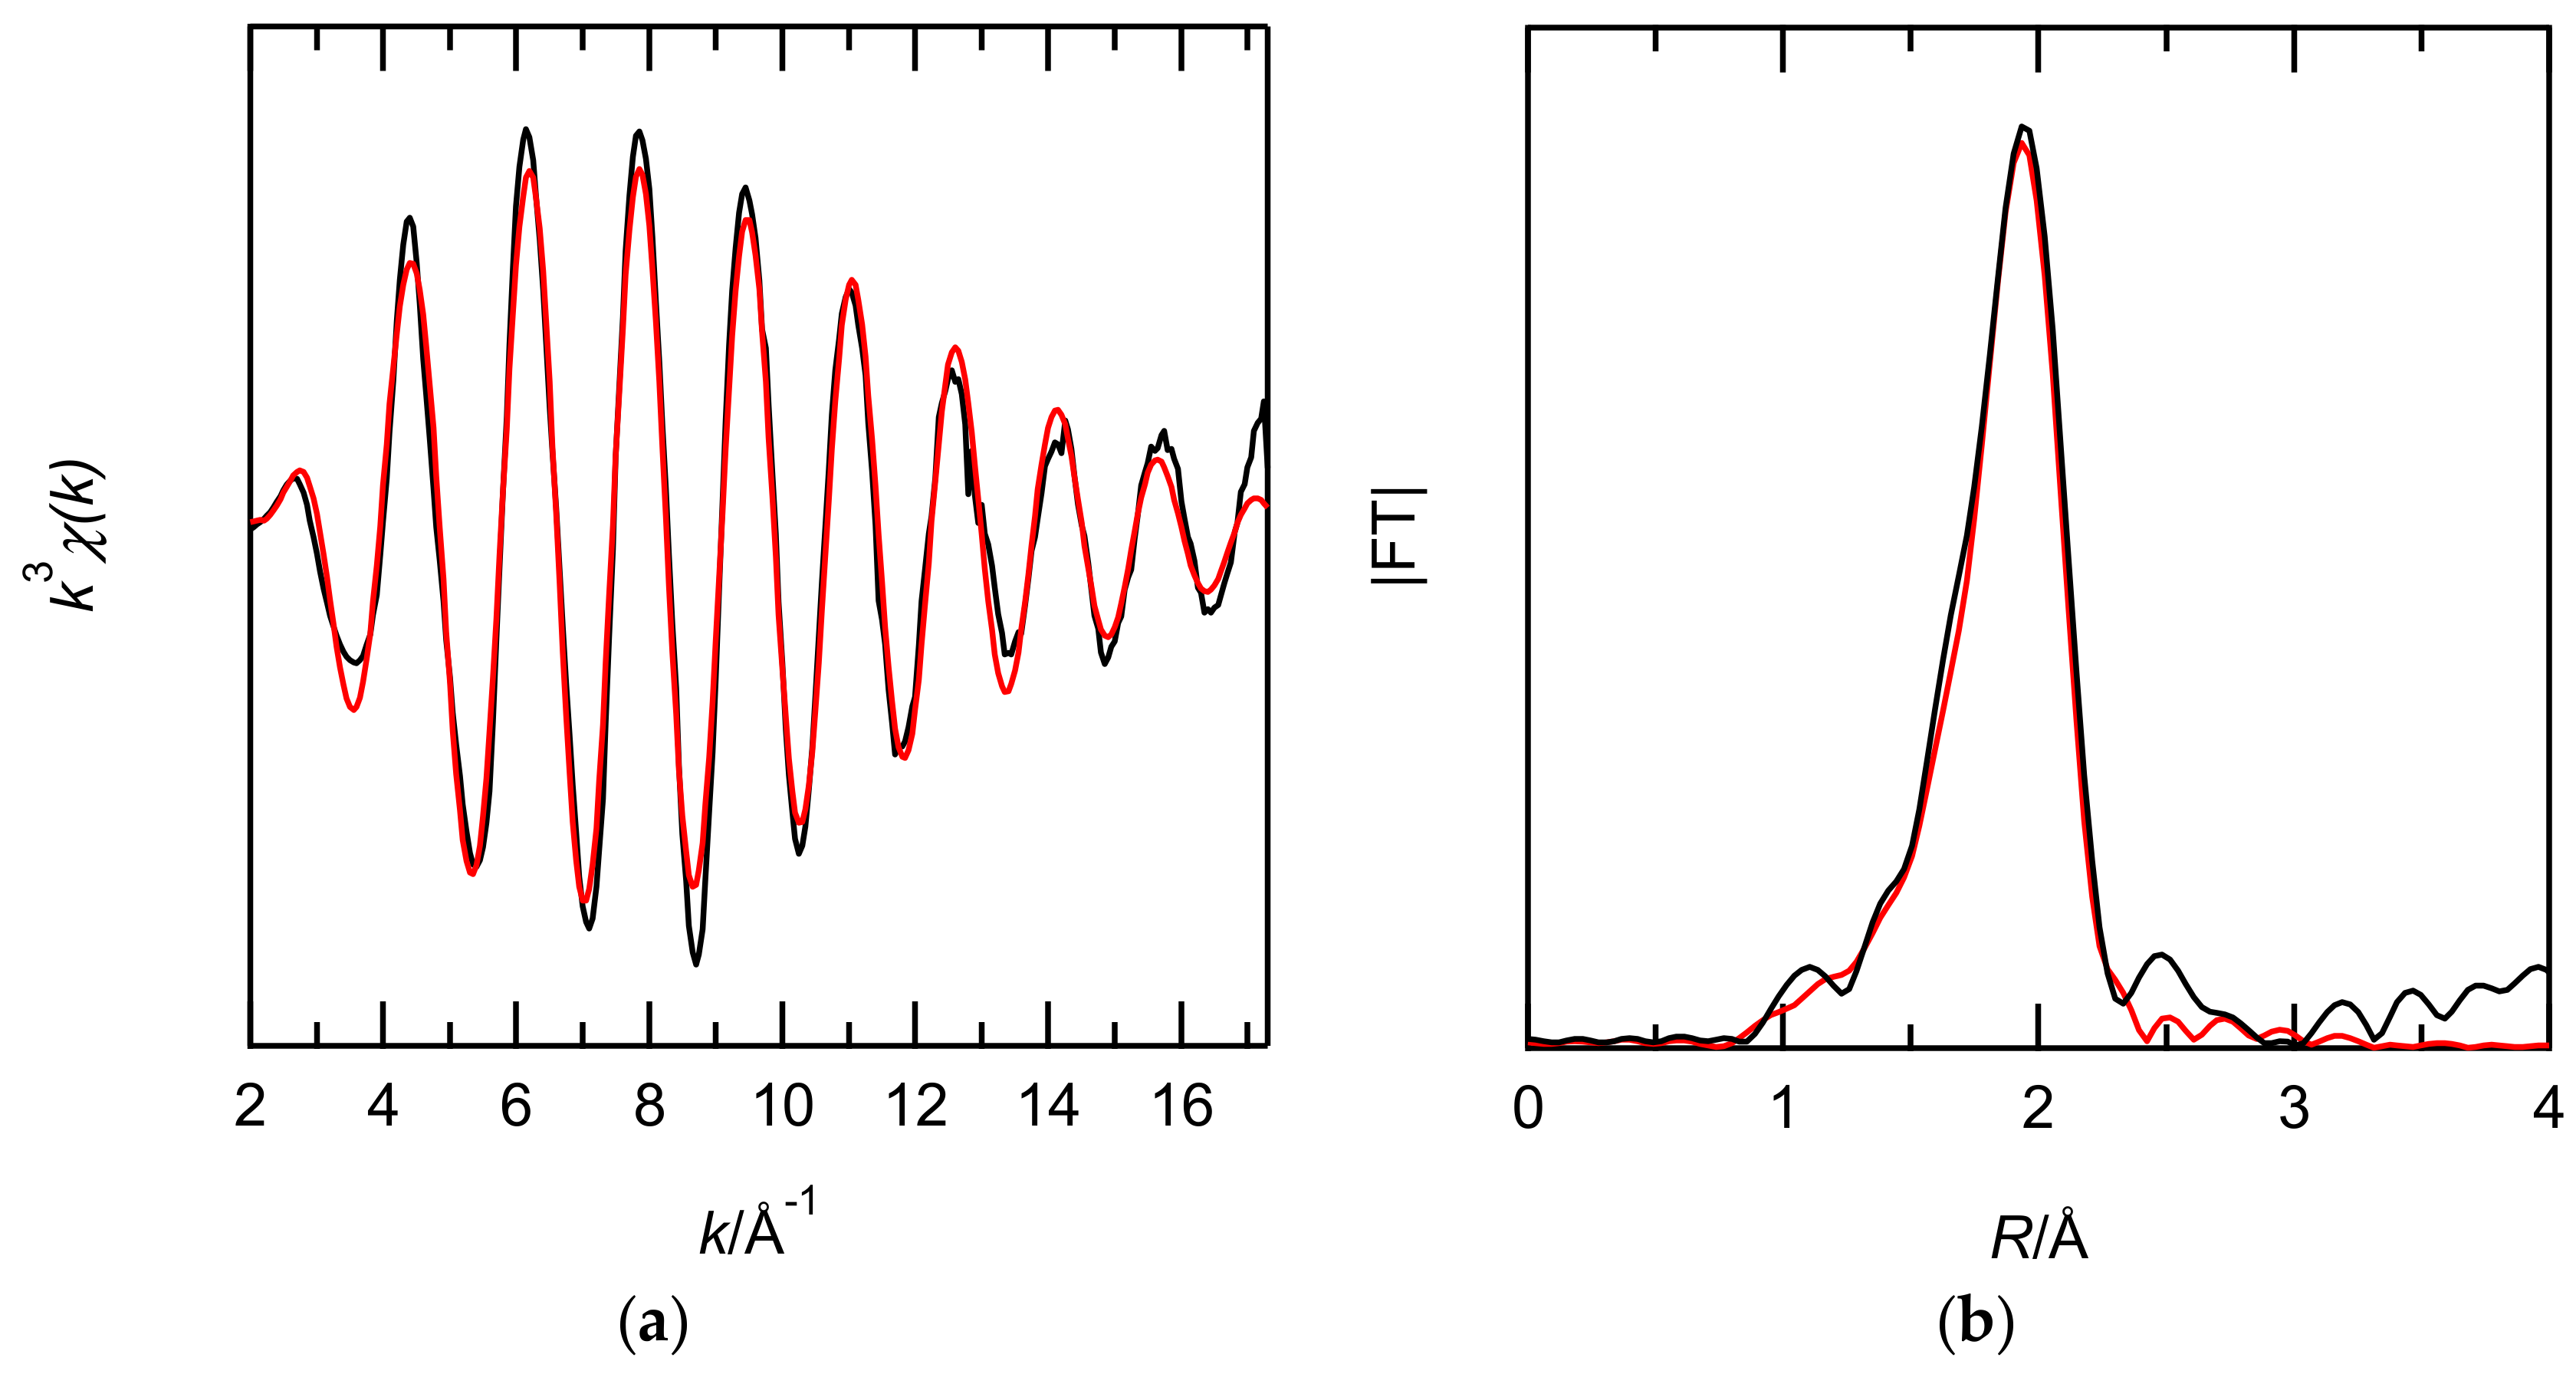
3.2.2. Structural Study of Ru Extracted by EHBAA

EXAFS studies of Ru(III) complexes extracted with EHBAA were performed to obtain data relevant to the extraction mechanism. The diluent of the XAFS sample was dodecane because of the high absorptivity of CHCl3 for X-rays. Figure 7 shows the FT spectra of the Ru K-edge k3-weighted EXAFS for the extracted complex. One-shell fits (Cl) and 2-shell fits (Cl and O) were performed to verify the inner coordination sphere of the extracted complexes. The 2-shell fits gave reasonable structural parameters and the low R-factor listed in Table 2. Since the N was 4.7 for Cl and 1.3 for O, the Ru(III) complex in the EHBAA phase is likely a pentachloride anion.
FT-IR measurements of the extracted Ru(III) complex were performed to confirm whether amide groups in the EHBAA coordinate to Ru3+ or not. No significant shifts of the peak corresponding to amide groups were observed with the extraction of Ru(III) (see Figure S12). Considering the EHBAA are protonated by the HCl extraction [25], the following equation can be proposed:
  [ RuCl 5 ( H 2 O ) ] 2   +   2 [ EHBAA · HCl ] [ RuCl 5 ( H 2 O ) ] ( H · EHBAA ) 2 + 2 Cl    
Outer-sphere interactions between the Ru complex anion and the protonated ligands can contribute the formation of stable Ru complex in the organic phase as in the previous study regarding Pt(IV) extractions [26].

4. Conclusions

The properties of the Ru complexes in HCl solutions and the EHBAA phases were investigated by means of UV-Vis and Ru K-edge EXAFS spectroscopies. Although the equilibration of Ru after the dissolution of RuCl3 dihydrate into aqueous HCl solution was achieved in 30 days at 0.5 M HCl, that time became considerably shorter with increasing HCl concentrations. Spectral changes in the Ru K-edge EXAFS and its FT spectra as well as those in its UV-Vis spectra were observed with increasing HCl concentration. The Ru in HCl solutions forms anionic chlorido complexes, and the predominant species in 0.5–10 M HCl solutions are [RuCl4(H2O)2] at 0.5–2 M HCl, [RuCl5(H2O)]2− at 3–5 M HCl, and [RuCl6]3− at 7–10 M HCl.
The inner coordination sphere of the Ru complex extracted with EHBAA in 5 M HCl was also investigated on the basis of the Ru K-edge EXAFS spectra. The curve fit indicated that the N were 4.7 for Cl and 1.3 for O. The pattern of the E% of Ru in the EHBAA system was similar to that of the percentages of [RuCl5(H2O)]2− on [RuCln(H2O)6−n]3−n; those percentages increased with HCl concentration, reached a maximum at 5 M HCl, and decreased at higher HCl concentrations. Therefore, the Ru in the EHBAA system is probably extracted through formation of ion-pair complexes between the pentachlorido ruthenate anion and two protonated EHBAAs.

Supplementary Materials

The following are available online at https://www.mdpi.com/2075-4701/8/7/558/s1. Figure S1: UV-Vis spectra for a 0.5 M HCl–Ru solution at various standing times. Figure S2: UV-Vis spectra for a 0.7 M HCl–Ru solution at various standing times. Figure S3: UV-Vis spectra for a 2.0 M HCl–Ru solution at various standing times. Figure S4: UV-Vis spectra for a 3.0 M HCl–Ru solution at various standing times. Figure S5: UV-Vis spectra for a 5.0 M HCl–Ru solution at various standing times. Figure S6: UV-Vis spectra for a 7.0 M HCl–Ru solution at various standing times. Figure S7: UV-Vis spectra for a 10 M HCl–Ru solution at various standing times. Figure S8: Comparison of XANES spectra for Ru complexes in aqueous and organic solutions with those of Ru metal, RuCl3 dihydrate, and RuO4. Figure S9: (a) The Ru K-edge k3-weighted EXAFS spectra and (b) the corresponding Fourier transforms for the Ru(III) in 0.7–10 M HCl solutions. Figure S10: The UV-Vis spectra of HCl solutions (0.5–10 M) containing 0.9 mM Ru(III). Figure S11: Extraction percentages of Ru with 0.5 M EHBAA and TOA in CHCl3 against shaking time. Figure S12: The FT-IR spectra of dodecane containing 0.5 M EHBAA with pre-equilibrium by HCl and that medium posterior to extraction of Ru(III) in 5 M HCl.

Author Contributions

T.S., T.O., M.T., and H.N. contributed the data analysis of UV-Vis and EXAFS spectra and discussion about the Ru extraction behaviors and speciation of Ru species in the aqueous and organic species; T.K., H.S., and T.Y. contributed the XAFS measurements; T.S. and H.N. performed all the experiments and wrote the paper.

Funding

This research was supported by the Environment Research and Technology Development Fund (3K163010) of the Environmental Restoration and Conservation Agency of Japan.

Acknowledgments

The authors thank Hiroko Niiyama for her technical assistance. A part of this work was performed under the Shared Use Program of the Japan Atomic Energy Agency (JAEA) Facilities (proposal nos. 2015A-E05, 2016B-E01, and 2017B-E01) supported by the JAEA Advanced Characterization Nanotechnology Platform as a program of “Nanotechnology Platform” of the Ministry of Education, Culture, Sports, Science and Technology (MEXT), Japan. The synchrotron radiation experiments were performed at the JAEA Beamline BL11XU in SPring-8 (proposal nos. 2015A3515, 2016B3512, and 2017B3531).

Conflicts of Interest

The authors declare no conflict of interest.

References

  1. Cox, M. Solvent Extraction in Hydrometallurgy. In Solvent Extraction Principles and Practice, 2nd ed.; Rydberg, J., Cox, M., Musikas, C., Choppin, G.R., Eds.; Marcel Dekker, Inc.: New York, NY, USA, 2004; pp. 455–506. ISBN 0-8247-5063-2. [Google Scholar]
  2. Bernardis, F.L.; Grant, R.A.; Sherrington, D.C. A review of methods of separation of the platinum-group metals through their chloro-complexes. React. Funct. Polym. 2005, 65, 205–217. [Google Scholar] [CrossRef]
  3. Rechnitz, G.A.; Goodkin, S.C. Some properties of ruthenium(III) and (IV) in acid solution. Platin. Met. Rev. 1963, 7, 25–29. [Google Scholar]
  4. Pantani, F. The behaviour of ruthenium trichloride in aqueous solutions. J. Less-Common Met. 1962, 4, 116–123. [Google Scholar] [CrossRef]
  5. Cady, H.H.; Connick, R.E. The determination of the formulas of aqueous ruthenium(III) species by means of ion-exchange resin: Ru+3, RuCl+2 and RuCl2+. J. Am. Chem. Soc. 1958, 80, 2646–2652. [Google Scholar] [CrossRef]
  6. Connick, R.E.; Fine, D.A. The identification of neutral ruthenium(III) chloride complexes: Equilibria involving neutral and cationic species. J. Am. Chem. Soc. 1960, 83, 3414–3416. [Google Scholar] [CrossRef]
  7. Taqui Khan, M.M.; Ramachandraiah, G.; Prakash, R. Ruthenium(III) chloride in aqueous solution: Electrochemical and spectral studies. Inorg. Chem. 1986, 25, 665–670. [Google Scholar] [CrossRef]
  8. Jorgensen, C.K. Complexes of the 4d- and 5d-groups II. Crystal field and electron transfer spectra of ruthenium(II) and (III), iridium(IV) and platinum(IV). Acta Chem. Scand. 1956, 10, 518–534. [Google Scholar] [CrossRef]
  9. Viljoen, K. Ruthenium(III) Aqua-Chloro Complex Chemistry: The Interconversion of the Hexachlororuthenate(III) and Aquapentachlororuthenate(III) Species. Master’s Thesis, University of Stellenbosch, Stellenbosch, South Africa, December 2003. [Google Scholar]
  10. Rard, J.A. Chemistry and thermodynamics of ruthenium and some of its inorganic compounds and aqueous species. Chem. Rev. 1985, 85, 1–39. [Google Scholar] [CrossRef]
  11. Narita, H.; Morisaku, K.; Tanaka, M. The first effective extractant for trivalent rhodium in hydrochloric acid solution. Chem. Commun. 2008, 5921–5923. [Google Scholar] [CrossRef] [PubMed]
  12. Narita, H.; Morisaku, K.; Tanaka, M. Highly efficient extraction of rhodium(III) from hydrochloric acid solution with amide-containing amine compounds. Solvent Extr. Ion Exch. 2015, 33, 407–417. [Google Scholar] [CrossRef]
  13. Gans, P.; Sabatini, A.; Vacca, A. Investigation of equilibria in solution. Determination of equilibrium constants with the HYPERQUAD suite of programs. Talanta 1996, 43, 1739–1753. [Google Scholar] [CrossRef]
  14. Lobo, V.M.M. Handbook of Electrolyte Solutions Part A; Elsevier: New York, NY, USA, 1989; pp. 515–572. ISBN 0-444-98847-5. [Google Scholar]
  15. Partanen, J.I.; Juusola, P.M.; Vahteristo, K.P.; de Mendonca, A.J.G. Re-evaluation of activity coefficients of aqueous hydrochloric acid solutions up to a molality of 16.0 mol·kg−1 using the Hückel and Pitzer equations at temperatures from 0 to 50 °C. J. Solut. Chem. 2007, 36, 39–59. [Google Scholar] [CrossRef]
  16. Uchikoshi, M. Determination of the distribution of cupric chloro-complexes in hydrochloric acid solutions at 298 K. J. Solut. Chem. 2017, 46, 704–719. [Google Scholar] [CrossRef]
  17. Kielland, J. Individual activity coefficients of ions in aqueous solutions. J. Am. Chem. Soc. 1937, 59, 1675–1678. [Google Scholar] [CrossRef]
  18. Mo, Y.; Antonio, M.R.; Scherson, D.A. In situ Ru K-edge X-ray absorption fine structure studies of electroprecipitated ruthenium dioxide films with relevance to supercapacitor applications. J. Phys. Chem. B 2000, 104, 9777–9779. [Google Scholar] [CrossRef]
  19. Ravel, B.; Newville, M. ATHENA, ARTEMIS, HEPHAESTUS: Data analysis for X-ray absorption spectroscopy using IFEFFIT. J. Synchrotron Radiat. 2005, 12, 537–541. [Google Scholar] [CrossRef] [PubMed]
  20. Rehr, J.J.; de Leon, J.M.; Zabinsky, S.I.; Albers, R.C. Theoretical X-ray absorption fine structure standards. J. Am. Chem. Soc. 1991, 113, 5135–5140. [Google Scholar] [CrossRef]
  21. Cotton, S.A. Chemistry of Precious Metals; Blackie Academic and Professional: London, UK, 1997; pp. 1–77. ISBN 0-7514-0413-6. [Google Scholar]
  22. Kahrovic, E.; Orioli, P.; Bruni, B.; Vaira, M.D.; Messori, L. Crystallographic evidence for decomposition of dimethylformamide in the presence of ruthenium(III) chloride. Inorg. Chim. Acta 2003, 355, 420–423. [Google Scholar] [CrossRef]
  23. Klementev, K.V. Statistical evaluations in fitting problems. J. Synchrotron Radiat. 2001, 8, 270–272. [Google Scholar] [CrossRef] [PubMed] [Green Version]
  24. Taqui Khan, M.M.; Ramachandraiah, G.; Shukla, R.S. Ruthenium(III) chloride in aqueous solution: Kinetics of the aquation and anation reactions of the chloro complexes. Inorg. Chem. 1988, 27, 3274–3278. [Google Scholar] [CrossRef]
  25. Maeda, M.; Narita, H.; Tokoro, C.; Tanaka, M.; Motokawa, R.; Shiwaku, H.; Yaita, T. Selective extraction of Pt(IV) over Fe(III) from HCl with an amide-containing tertiary amine compound. Sep. Purif. Technol. 2017, 177, 176–181. [Google Scholar] [CrossRef]
  26. Bell, K.J.; Westra, A.N.; Warr, R.J.; Chartres, J.; Ellis, R.; Tong, C.C.; Blake, A.J.; Tasker, P.A.; Schröder, M. Outer-sphere coordination chemistry: Selective extraction and transport of the [PtCl6]2− Anion. Angew. Chem. Int. Ed. 2008, 47, 1745–1748. [Google Scholar] [CrossRef] [PubMed]
Figure 1. Structures of (a) N-2-ethylhexyl-bis(N-di-2-ethylhexyl-ethylamide) amine (EHBAA) and (b) trioctylamine (TOA).
Metals 08 00558 g001
Figure 2. UV-Vis spectra for the Ru solution of 1.0 M HCl at various standing times. [Ru] = 0.9 mM, standing time: 1, 4, 9, 13, 14, 15, 16, 17, 18, 20, 23, and 27 days, and optical path length: 0.20 cm.
Metals 08 00558 g002
Figure 3. (a) The Ru K-edge k3-weighted extended X-ray absorption fine structure (EXAFS) spectra and (b) the corresponding Fourier transforms (FTs) for the Ru(III) in 0.7–10 M HCl solutions. The phase shifts are not corrected.
Metals 08 00558 g003
Figure 4. (a) The UV-Vis spectra of HCl solutions (0.5–10 M) containing 0.9 mM Ru(III); (b) the ε, and (c) distribution percentages of [RuCln(H2O)6−n]3−n (n = 3–6) obtained from their spectra.
Metals 08 00558 g004
Figure 5. Correlation between the NCl in [RuCln(H2O)6−n]3−n and HCl concentration. Calculated data from our stability constants (filled circles); fitting results in the EXAFS analysis (filled triangles); and calculated data by Viljoen [9] (circles).
Metals 08 00558 g005
Figure 6. Extraction percentages of Ru with 0.5 M EHBAA and TOA in CHCl3 versus HCl concentration. [Ru] = 1 mM; shaking time = 6 h.
Metals 08 00558 g006
Figure 7. Comparison of the Ru K-edge k3-weighted EXAFS (a) and its FT spectra (b) for the EHBAA phase obtained after extraction with 0.1 M Ru(III) in 5 M HCl solutions. Experimental data (black line) and theoretical fit (red line) are shown. The phase shifts are not corrected.
Metals 08 00558 g007
Table 1. The Ru K-edge EXAFS structural parameters for Ru3+ in HCl solutions.
HCl Conc.PathN aR (Å)σ22)bΔE (eV)cR-Factor
0.7 MRu-Cl3.7(1)2.343(3)0.0039 d–1.50.018
Ru-O2.3(1)2.055(6)0.0014 d
1.0 MRu-Cl3.7(1)2.342(3)0.0039 d–1.80.018
Ru-O2.3(1)2.056(6)0.0014(8)
2.0 MRu-Cl4.0(1)2.350(3)0.0039 d0.10.011
Ru-O2.0(1)2.065(7)0.0014 d
3.0 MRu-Cl4.3(1)2.351(3)0.0039 d0.20.010
Ru-O1.7(1)2.062(8)0.0014 d
5.0 MRu-Cl5.4(1)2.367(2)0.0039 d0.70.007
Ru-O0.6(1)2.10(1)0.0014 d
7.0 MRu-Cl5.7(1)2.374(2)0.0039 d2.30.009
Ru-O0.3(1)2.13(3)0.0014 d
10 MRu-Cl6.02.371(2)0.0039(2)1.30.009
[RuCl6]3– eRu-Cl62.378 g
[Ru(H2O)6]3+ fRu-O62.029
[Ru] = 0.1 M. a Set as a sum equal to 6 (N of Ru-Cl + N of Ru-O). b Parameter due to thermal or structural disorder. c Energy shift parameter d Fixed parameter. e Ref. [22]. f Ref. [21]. g Average bond distances. The amplitude reduction factor was fixed at 1.0. Estimated errors in parentheses. The k-range for the Fourier transformation: 2.0–12.0 Å−1; the curve-fitting R-range: 1–3 Å.
Table 2. The Ru K-edge EXAFS structural parameters for extracted Ru3+ complex in dodecane solution.
SamplePathN aR (Å)σ22)ΔE (eV)R-Factor
EHBAA phaseRu-Cl4.7(2)2.370(3)0.0036(3)3.30.016
Ru-O1.3(2)2.20(1)0.0010 b
[EHBAA] = 0.5 M, [Ru] = 0.096 M, and Solvent: dodecane. a Set as a sum equal to 6 (N of Ru-Cl + N of Ru-O). b Fixed parameter. The amplitude reduction factor was fixed at 1.0. Estimated errors in parentheses. The k-range for the Fourier transformation: 2.0–17.3 Å−1; the curve-fitting R-range: 1–3 Å.

