The Effect of Tellurium on the Formation of MnTe-MnS Composite Inclusions in Non-Quenched and Tempered Steel


1
State Key Laboratory of Advanced Special Steel, Shanghai Key Laboratory of Advanced Ferrometallurgy, School of Materials Science and Engineering, Shanghai University, Shanghai 200444, China
2
School of Metallurgical and Ecological Engineering, University of Science and Technology Beijing, Beijing 100083, China
*
Author to whom correspondence should be addressed.
Metals 2018, 8(8), 639; https://doi.org/10.3390/met8080639
Submission received: 24 July 2018
/
Revised: 9 August 2018
/
Accepted: 11 August 2018
/
Published: 14 August 2018
Abstract
:Te is a seldom-used alloying element, which is mainly used in free-machining steel. The Te content in this kind of steel is relatively low, and only a small amount of MnTe is generated. In previous studies, the effect of Te on the formation of inclusions was not fully studied. In order to clarify the mechanism, different amounts of tellurium were added into 38MnVS6 steel to form a certain amount of MnTe. The MnTe wrapped the MnS, forming a composite inclusion. With the increase of Te content in the steel, the diameter of inclusion increased, while the aspect ratio of inclusion varied little. The aspect ratio of most inclusions was in the range of 1~3. Besides, the MnS in the MnTe-MnS composite inclusions gradually changed from one big particle to several small particles. The solidification of the steel, as well as the precipitation of MnS and MnTe, was the main factor that affecting the formation of the composite inclusion. The mechanism of the process was systematically expressed in the current study.
1. Introduction
In some resulfurized steels, Te has been used as an additive to improve the machinability of steel [1,2,3]. A small amount of Te can significantly reduce the aspect ratio of MnS inclusion, leading to the globularization of MnS inclusion, which remarkably improves the machinability of the steel, and prevents the anisotropy of the steel property [4,5,6]. Usually, Te is the key alloying element for the production of ultra-free machining steel.
The solubility of Te in steel is very small [7,8], even at 833 °C and the solubility of Te in α-Fe is only 1.5 at % [9]. At room temperature, the solubility can be nearly ignored. Te is mainly used to modify the MnS inclusion. According to the Te content added into the steel, Te may dissolve into MnS inclusions, or exist in the form of MnTe. Te has many similarities to S in steel, and no reaction occurs between telluride and sulfide. When the Te/S value in the MnS exceeds 0.07 [8], MnTe starts to generate, and this will envelop the MnS. There is a eutectic point at 810 °C for the MnTe-MnS binary phase. Above this temperature, a liquid phase can form. Below 810 °C, the solubility of MnS and MnTe in each opposite phase gradually decreases, and it finally reaches a very low value at room temperature. During the solidification of the steel, MnTe and MnS may precipitate and form MnTe-MnS binary inclusions. With the increase of Te content in the steel, the structures of the MnTe-MnS inclusions vary.
In most Te-containing free machining steels, the Te content was very low [10,11]. Only a thin MnTe layer was generated on the surface of the MnS inclusion. The formation of MnTe in the high Te-containing steel was seldom studied. It was different from that of low Te-containing steel. Besides, the lack of thermodynamic data also limited the study of the formation mechanism of the MnTe-MnS binary composite inclusion, which was really important to determine how Te made the MnS inclusion spheroidization. In the current study, different amounts of Te were added into a non-quenched and tempered 38MnVS6 steel, and the effect of Te on the formation of the composite inclusion was studied. In addition, the formation mechanisms in both low and high Te-containing steel were proposed.
2. Materials and Methods
The composition of the 38MnVS6 steel is listed in Table 1. In each experiment, approximately 500 g of the steel sample was used. The steel sample was put in a corundum crucible and placed in the constant temperature zone of a vertical tube furnace. Ar gas was purged to the reaction tube during the entire experiment. The sample was heated to 1000 °C at a heating rate of 8 °C/min, then changed to 4 °C/min to 1550 °C.
The purity of Te powder was 99.999%. Te powder was wrapped in iron foil. After the complete melting of the steel at 1550 °C, Te powder was added into the molten steel, followed by stirring with a quartz tube. The Te content in the steel varied with the amount of Te that was added into the steel. The temperature was held at 1550 °C for 30min. After cooling, the Te content in the steel as measured by ICP (inductively coupled plasma) is shown in Table 2.
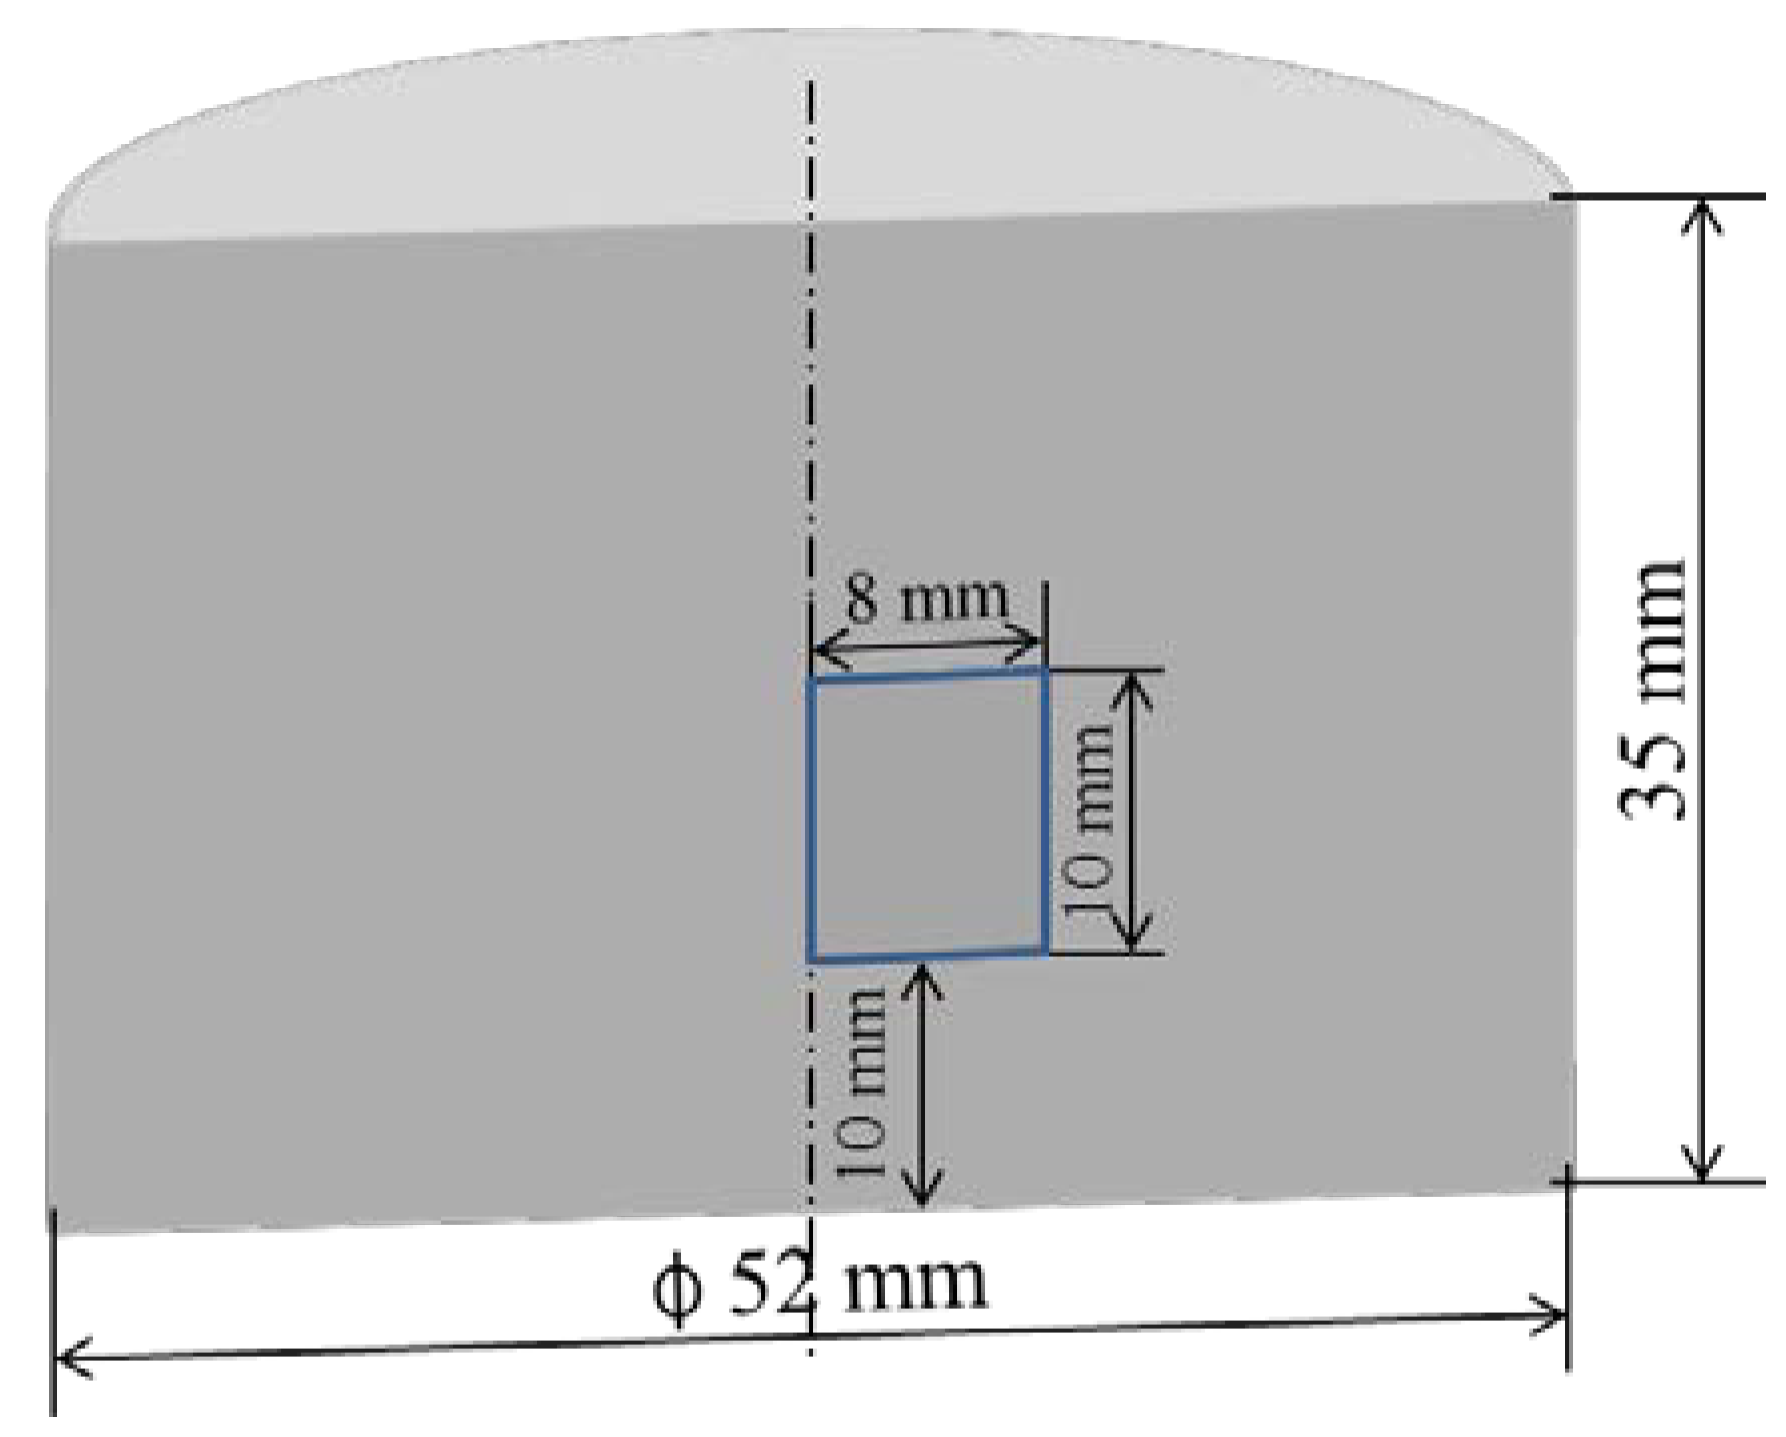
A steel sample with 10 mm in height and 8 mm in width was machined from the center of the steel ingot. Figure 1 shows the position of the steel sample that was taken from the ingot. The steel sample was polished and cleaned in ethanol by ultrasonic cleaner, and prepared for the optical microscope (Carl Zeiss, Oberkochen, Germany) and SEM-EDS (Scanning Electron Microscope-Energy Dispersive Spectrometer, Phenom, Eindhoven, Netherlands) analysis. Images captured with the optical microscope at a magnification of 200× were used to analyze the morphology and distribution of inclusions for each sample. Then, 20 optical images at a magnification of 100× were captured for statistics, including diameter, area fraction, and aspect ratio of the inclusions by using Image Pro Plus 6.0 software. After that, SEM-EDS was used to analyze the structure and composition of the inclusions. Four elements, Mn, S, Fe, and Te were selected to measure the content. In order to further clarify the morphology of the inclusions, a non-aqueous electrolyte method was employed to prepare the inclusions embedded in the steel for the SEM-EDS analysis.
3. Results
3.1. Optical and SEM-EDS Analysis
Figure 2 shows the typical morphology of inclusions in steels with different Te contents captured with an optical microscope. The inclusions were mainly circles or ellipse shapes. In the steel with low Te contents, inclusions were distributed along grain boundaries and showed a chain-like pattern. With the increase of Te content, the inclusions gradually distributed separately, the size of the inclusion increased, and the number of chain-like inclusions decreased. In larger inclusions, there were some composition differences shown with different colors, the light grey and the dark grey.
The steel samples were then analyzed by SEM-EDS. Figure 3 shows the SEM image of typical inclusions in steels. The color differences were much clearer. The dark areas acting as the cores of the composite inclusion were mainly MnS, while the white areas enveloping the core were MnTe. The composition of some selected areas are shown in Table 3. There was a small solubility of Te in MnS, and S in MnTe, that was 5.0% and 2.3% respectively. When the Te content in the steel was 130 ppm, only trace MnTe could be observed. With the increase of Te content, more MnTe was generated. When the Te content was 2400 ppm, in some inclusions, MnTe occupied the main part of the inclusion. Certainly, there were still many inclusions that were mainly composed of MnS.
Except for the MnTe-MnS composite inclusions, there were also a few oxide inclusions. It ought to be in the original inclusions in the raw material. In the current study, this was not the main topic and was not discussed in detail.
3.2. Statistics of Inclusions
In each sample, 20 optical images at the magnification of 100× were captured. The images were processed with an image analyzer (Image Pro Plus 6.0) to obtain the equivalent diameter and the aspect ratio of the inclusions. The diameter of most inclusions was larger than 1 μm. Thus, in order to prevent the statistical error due to the definition of the image or the defects that were formed during the polishing, the inclusion with a diameter smaller than 1 μm was not considered. Figure 4 shows the number percentage of inclusions in different diameter ranges. With the increase of Te content in the steel, the number of inclusions with small diameters decreased, while the number with large diameters increased. The average equivalent diameter of the total inclusions in each sample was shown in Figure 5. The average equivalent diameter of inclusions increased with the increase of Te content. Besides, the area fraction of inclusions also increased with the increase of Te content, as shown in Figure 6.
The solubility of Te in solid steel was limited. A small amount of Te caused the saturation of Te in the steel; thus, most Te existed in the form of telluride. The increase of Te content caused the increase of total volume percentage of telluride; thus the area fraction of inclusions was increased. The telluride precipitated around the sulfide or adhered to the sulfide instead of distributing separately in the steel, which caused an increase of equivalent diameter.
3.3. Analysis of the Three-Dimensional Morphology of Inclusions
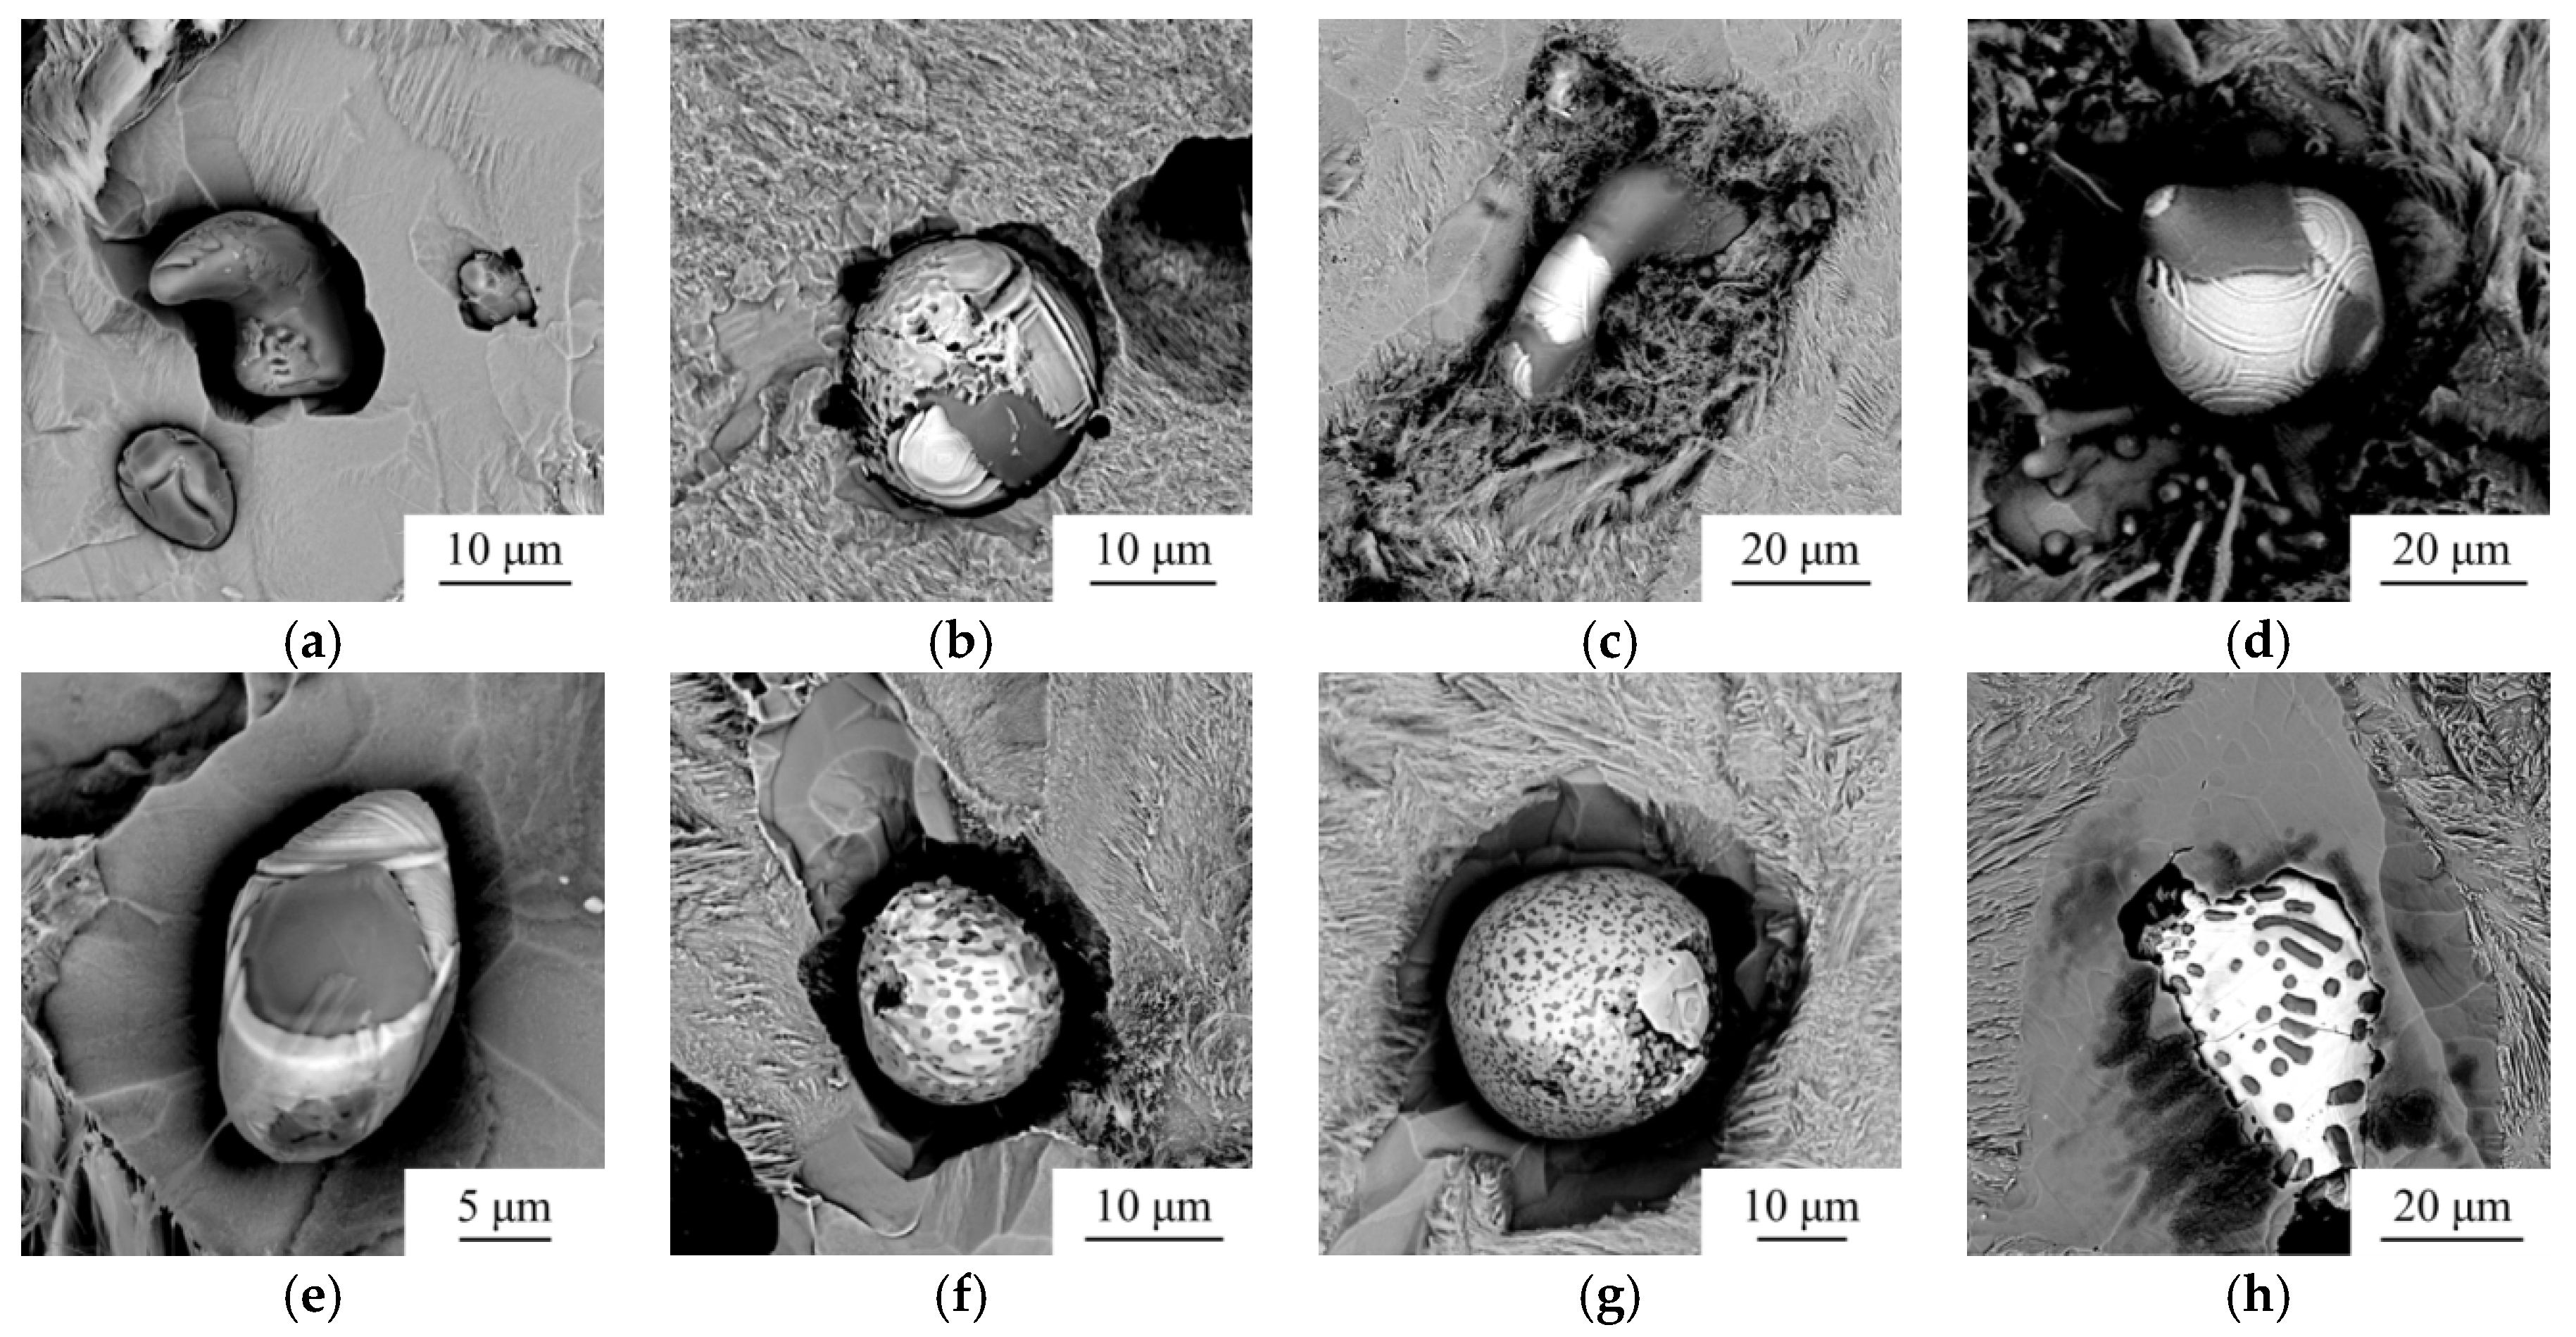
The non-aqueous electrolyte method is an excellent method to extract the inclusions from steel or leave inclusions embedded in steel by etching the steel matrix. The MnS and MnTe did not dissolve into the solution; thus the inclusions kept the morphology as they were present in the steel. By using SEM, the three-dimensional morphology of inclusions could be observed. Figure 7 shows the inclusions that were embedded in the steel. The white color and the dark color of the inclusions showed similar information as in Figure 3. The MnS was enveloped by MnTe, where only part of MnS could be observed. The composite inclusions showed spherical or spheroidicity shapes. With the increase of Te content, more small MnS particles embedded in MnTe could be observed.
Except for the inclusions discussed above, there was also a kind of inclusion that was quite different from the MnTe-MnS composite inclusion, not only in the morphology, but also in the composition. As shown in Figure 8, there were some dendritic inclusions in the steels. The EDS result indicated that these were MnS inclusions, and no MnTe could be detected. This kind of inclusion mainly existed in the steels with low Te content. With an increase of Te content, the amount of this kind of inclusion was reduced.
4. Discussion
4.1. The Effect of Te on the Aspect Ratio of the Inclusion
The aspect ratio of the inclusion is an important parameter for the steel property. The morphology of inclusion with an aspect ratio of 1~3 is beneficial for the steel properties [1,12,13]. It not only increases the machinability, but also prevents the anisotropy of the steel. Figure 9 shows the number percentage of inclusions in different aspect ratio ranges. After adding Te to the steel, the aspect ratio of most inclusions is in the range of 1~3; few inclusions have a big aspect ratio, and no big differences exist among these samples. Taking all of the inclusions into consideration, the average aspect ratio of all inclusions are calculated. The effect of Te/S value in different samples on the aspect ratio of the inclusions is shown in Figure 10. With the increase of Te content from 130 ppm to 2400 ppm, the average aspect ratio varies a little. According to the references, once the Te/S value in steel exceeds 0.07, MnTe will be generated [8]. When the Te/S value exceeds 0.2, the Te content has little influence on the aspect ratio of the MnS inclusion. Katoh et al. [14] measured the aspect ratio of inclusions in steel with different Te/S values after hot rolling, and the result is also shown in Figure 10. The steel sample in the current was not rolled under high temperature, however, it is reported that with the presence of Te, MnS inclusions become more globular, not only in as-cast steel, but also in hot-rolled steel [1]. In the current study, the Te/S values in all steels are larger than 0.2, while the aspect ratio is nearly the same, with the variation trend of the aspect ratio being consistent with the result that was provided by Katoh et al.
The aspect ratio corresponding to the Te/S value that is smaller than 0.2 is not included in the current study. In that case, most of the Te dissolves into the MnS inclusion, and few MnTe are generated. The mechanism of the modification of MnS inclusions are different [15] and will be discussed elsewhere.
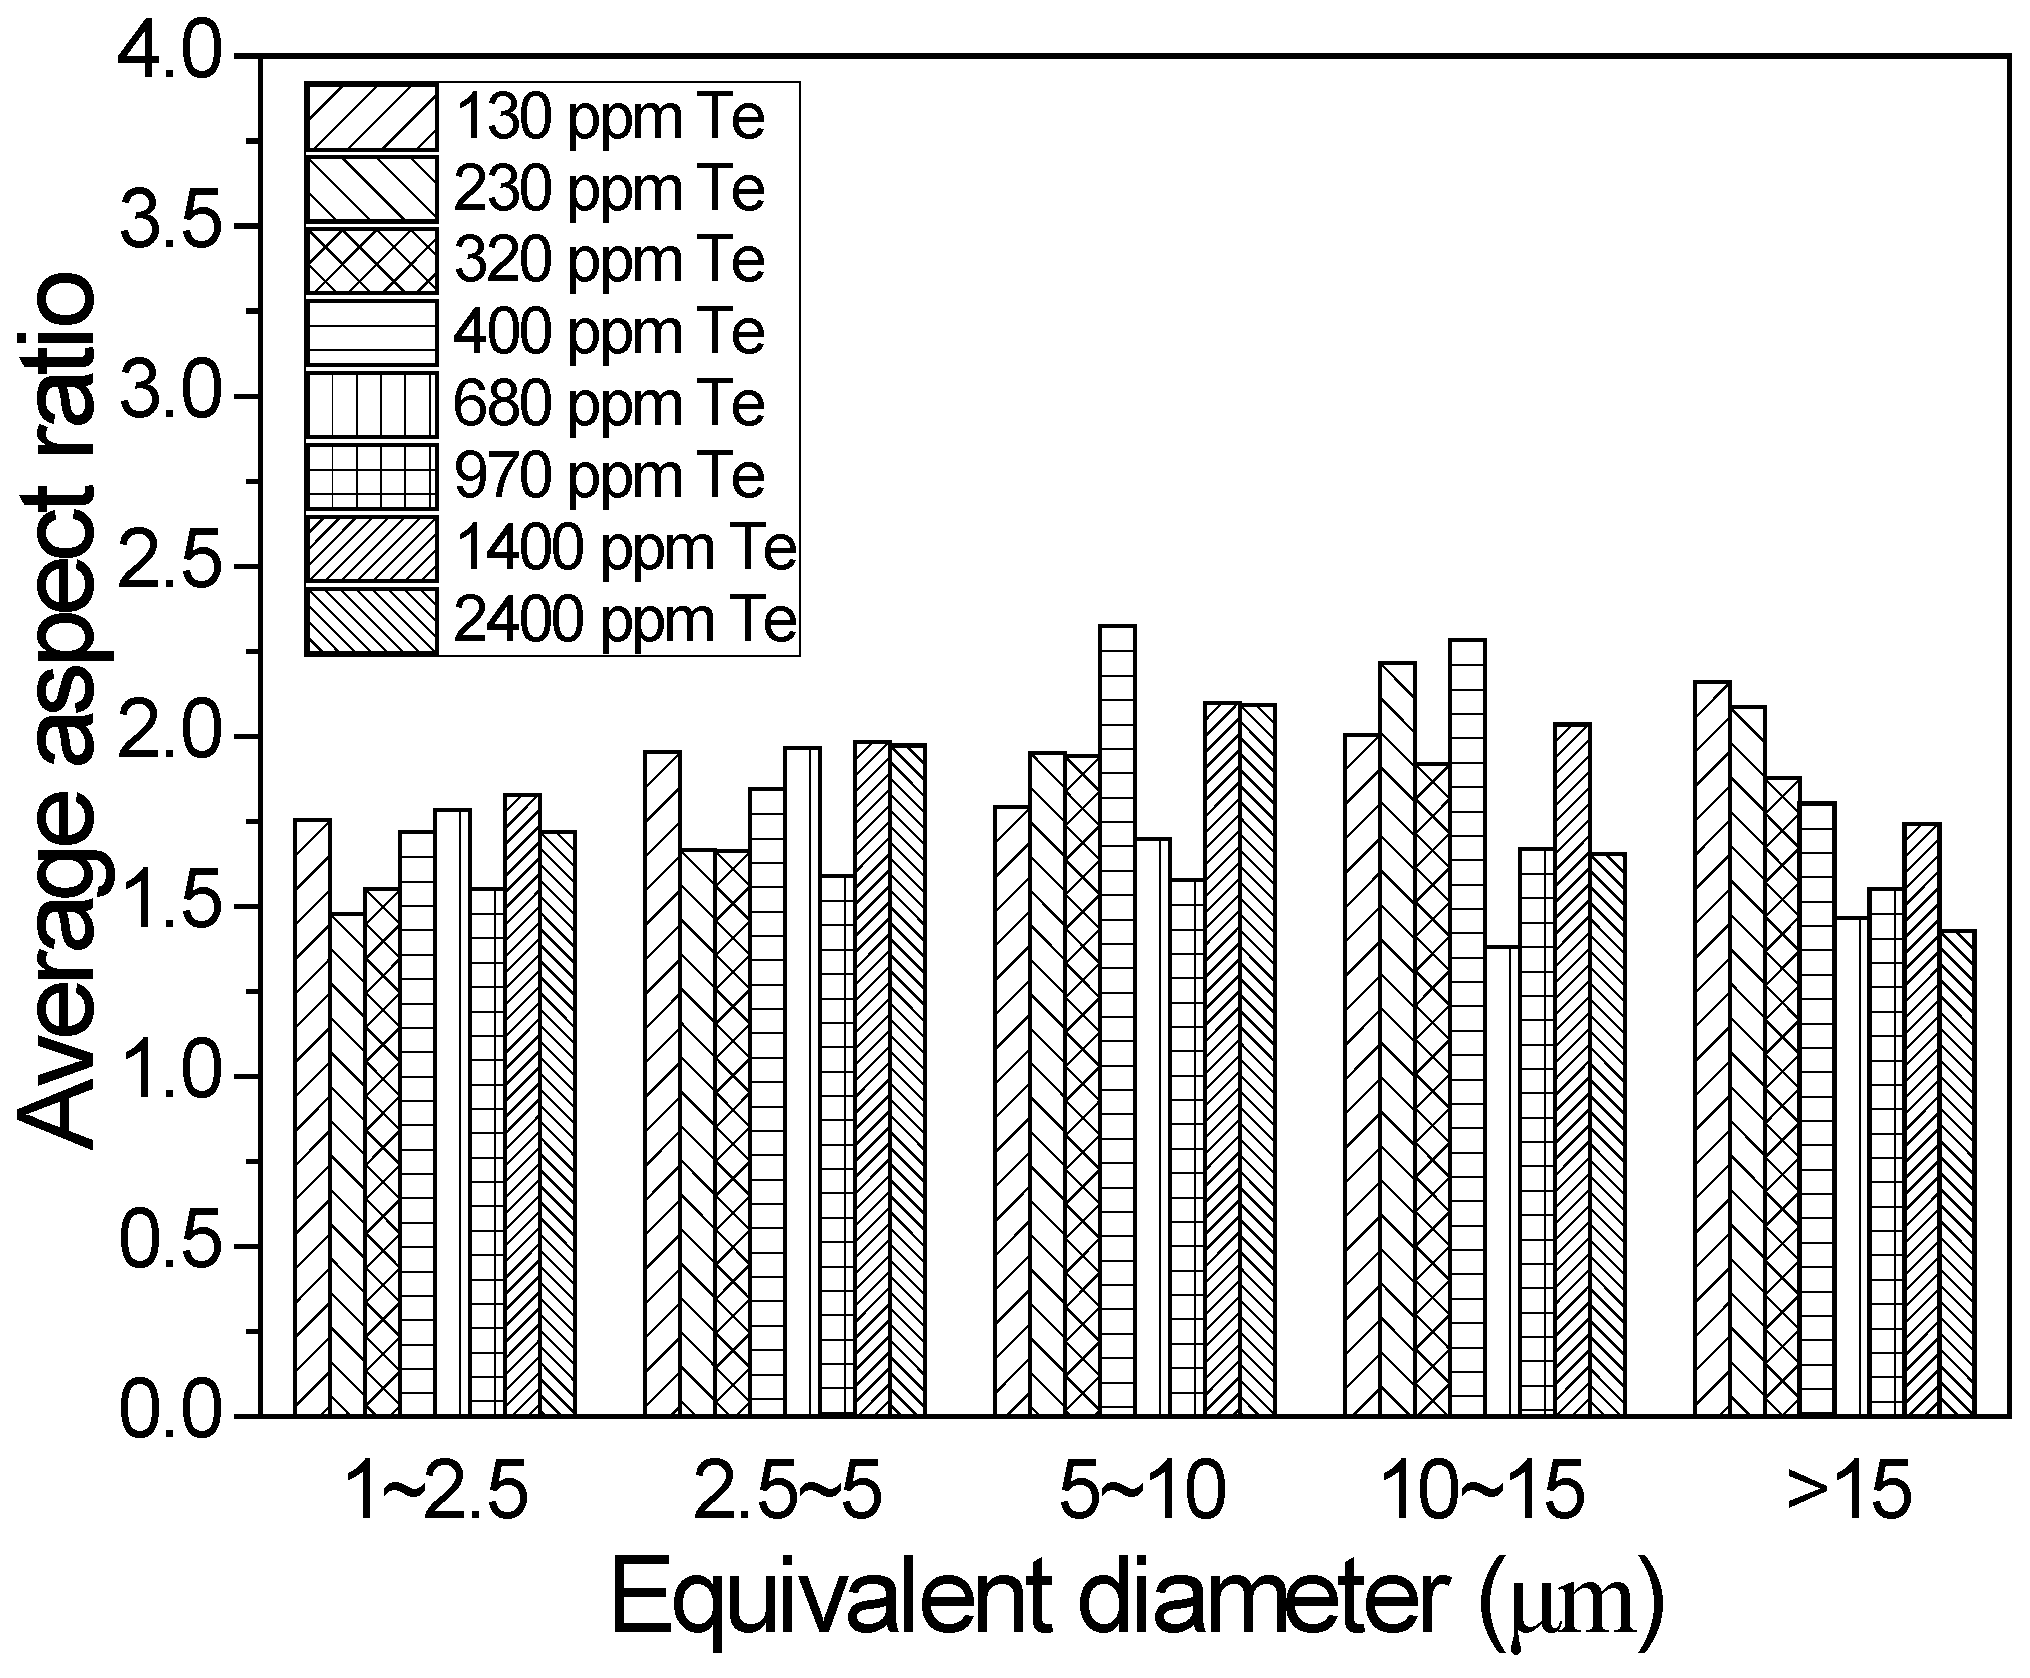
Figure 11 shows the average aspect ratio of inclusions in different equivalent diameter ranges. Te has the same effect on the inclusion of different diameters. With the increase of Te content in the steel, no big differences can be observed.
As mentioned above, the Te/S values in these samples are all larger than 0.2, with most MnS inclusions being saturated with Te, and MnTe being generated. In the current conditions, the Te has the same effect on all inclusions, no matter what the size of the inclusion is. There is no big difference of the aspect ratio among these inclusions with different diameters and among these samples with different Te contents.
4.2. The Precipitation of the MnTe-MnS Binary Phase from Steel
In the current study, few single MnTe inclusions can be observed; MnTe mainly exists in accompany with MnS. MnTe precipitates from the molten steel together with MnS inclusion in the solidification process. In the steel with low Te content, there are some dendritic inclusions distributed along grain boundaries, as shown in Figure 8, indicating that these inclusions are precipitated in the interdendritic regions from the molten steel. With the increase of Te content, the inclusions become larger, with fewer distributes along grain boundaries.
The equilibrium solidification of the original 38MnVS6 sample from 1550 °C to 1350 °C was calculated by FactSage 7.0. The result is shown in Figure 12. The molten steel starts to solidify at 1488 °C, δ-Fe generates first, and then it gradually transforms to γ-Fe. With the solidification process occurring, MnS starts to precipitate from the molten steel at 1434 °C. When the temperature decreases to 1412 °C, the steel is almost completely solidified. In the temperature range from 1434 °C to 1412 °C, 94.8% of the total MnS is precipitated. After that, only a small amount of MnS precipitates from the solid steel.
The FactSage software does not include the entire Te database. Although the solidification of 38MnVS6 containing different Te contents can still be calculated when taking Te into account, the result is unreliable; thus, it is not presented or discussed here.
Figure 13 shows the MnTe-MnS binary phase diagram [16]. At a high temperature, the MnTe-MnS binary phase can form a liquid solution, the temperature of the eutectic point is 810 °C, and the mole ratio of MnS corresponding to the eutectic point is close to 10%. In the current study, the mole ratio of MnS ranges from 32% to 94%, as shown in Figure 13. The solidus temperature and the liquidus temperature of 38MnVS6 are also presented in Figure 13. The higher Te content, the closer to the eutectic point. The addition of Te may affect the solidification of the steel. However, in order to facilitate the analysis, the affection is not considered, since the Te content is not so high. According to the result calculated by FactSage, MnS mainly precipitates during the solidification of steel. The solubility of Te in solid steel is very limited, thus assuming that MnTe also precipitates in this temperature range.
When the Te content in the steel is lower than 970 ppm, a liquid phase containing MnTe-MnS and a solid MnS phase will generate in the temperature range from 1488 °C to 1412 °C. The solid MnS phase contains few MnTe and precipitates in the interdendritic regions, and it finally becomes the dendritic MnS inclusion, as shown in Figure 8. The liquid MnTe-MnS phase keeps a spherical shape for minimum surface free energy. After the complete solidification of the steel, the MnS continuously precipitates from the liquid MnTe-MnS phase until the composition of the liquid phase reaches the eutectic point. Finally, both MnS and MnTe precipitate from the liquid phase. During this solidification process, the MnTe-MnS composite inclusion and the dendritic MnS inclusion forms.
When the Te content in the steel is higher than 1400 ppm, the MnTe-MnS binary phase keeps the liquid phase, and there is no solid MnS phase that is generated in the temperature range from 1488 °C to 1412 °C. After the solidification of steel, the liquid phase gradually transforms to the composite MnTe-MnS inclusion, as stated above. Actually, the solidification of the steel and the precipitation of the inclusions are not uniformly performed. In the high Te-containing steel, there are still small numbers of dendritic MnS inclusions.
4.3. The Precipitation of MnS and MnTe from the MnTe-MnS Binary Phase
As shown in Figure 3, there are two kinds of composite inclusion. One contains a big MnS core, while the other contains many small MnS cores. The later was usually not observed in previous studies, since the Te/S value was very low in the steel.
If MnS precipitates from the steel first and became the nucleation point for MnTe, then MnTe precipitates from the steel and wraps MnS, a composite inclusion with MnS core and the MnTe outer layer will form. However, the composite inclusion with many MnS cores cannot be explained by this mechanism. According to the MnTe-MnS binary phase diagram, there is a MnTe-MnS solution in the steel at high temperature. After the solidification of the steel, the liquid solution may still exist. In further cooling processes, both MnS and MnTe precipitate from the MnTe-MnS solution, instead of the steel. The formation processes of the composite inclusions observed in the current study are described as follows.
When the Te content is low, the composition of MnTe-MnS solution is far from the eutectic point. With a decrease in temperature, MnS precipitates from the MnTe-MnS solution first, and gradually grows. At the same time, the composition of the MnTe-MnS solution tends to the eutectic point. Once the temperature reaches the eutectic temperature, MnS and MnTe precipitate simultaneously. Since the initial precipitated MnS inclusion already exists, the newly precipitated MnS adheres to the surface of MnS core, while MnTe is pushed out and precipitates alone, leading to a distinct interface between the MnS phase and the MnTe phase. Finally, a composite inclusion with the MnS core and the MnTe outer layer is generated. The generation of the composite inclusion from the MnTe-MnS solution is a divorced eutectic. The whole solidification process is shown in Figure 14a.
When the Te content is high, the composition of MnTe-MnS solution is close to the eutectic point. During the initial solidification process, only a small amount of fine MnS is generated. Compared with the rest MnTe-MnS solution, the MnS core is too small to provide enough surface for the adhesion of newly precipitated MnS. In the following eutectic reaction, part of the MnTe-MnS solution precipitates MnS and MnTe in the form of divorced eutectic, while another part precipitates due to the eutectic reaction, that is, MnS and MnTe precipitates alternately, seeming like a lot of small MnS particles are embedded in the MnTe phase. Finally, a composite inclusion with several MnS particles embedded in MnTe phase is generated, just as shown in Figure 14b.
According to the MnTe-MnS binary phase diagram given in Figure 13, there ought to be a eutectoid point. The further precipitation may be similar to that which is mentioned above. Thus, the structure of the composite inclusion should not change too much.
5. Conclusions
- After adding a certain amount of Te in the 38MnVS6 steel, MnTe was generated and wrapped the MnS inclusion. With the increase of Te content from 130 ppm to 2400 ppm, the diameter of the inclusion increased. The aspect ratio of inclusions in all steels was nearly the same. Most inclusions were in the aspect ratio range of 1~3.
- The 38MnVS6 steel solidified in the temperature range of 1488~1412 °C, and MnTe and MnS were precipitated from the liquid steel and formed a MnTe-MnS binary liquid phase. In the steel with low Te content, a small amount of dendritic MnS inclusion was first precipitated in the interdendritic regions. With the increase of Te content, few dendritic MnS inclusions were observed. After the solidification of the steel, the MnTe-MnS binary phase kept a liquid state and maintained a spherical shape for the minimum surface free energy.
- When the temperature fell down from 1412 °C to 810 °C, MnS was precipitated from the MnTe-MnS binary liquid phase. Once the temperature reached 810 °C, both MnTe and MnS precipitated from the MnTe-MnS binary liquid phase. In the steel with low Te content, the MnTe and MnS precipitated in the form of the divorced eutectic, forming a composite inclusion with one MnS core. In the steel with high Te content, both divorced eutectic reactions and eutectic reactions occurred, leading to the inclusion containing many small MnS particles.
Author Contributions
P.S., S.Y. and J.F. conceived and designed the experiments; Q.Y. and D.Z. performed the experiments; P.S. and Q.Y. analyzed the data; P.S. wrote the paper.
Funding
This research was funded by the National Key Research and Development Program of China (No. 2018YFB0704400), the National Natural Science Foundation of China (No. 51474142, 51671124), the China Postdoctoral Science Foundation (No. 2018M632082), and the Open Project of State Key Laboratory of Advanced Special Steel (No. SKLASS 2017-05).
Conflicts of Interest
The authors declare no conflict of interest.
References
- Zheng, L.; Malfliet, A.; Wollants, P.; Blanpain, B.; Guo, M. Effect of surfactant te on the formation of MnS inclusions in steel. Metall. Mater. Trans. B 2017, 48, 1–12. [Google Scholar] [CrossRef]
- Yaguchi, H.; Onodera, N. The effect of tellurium on the machinability of AISI 12L14+Te steel. Trans. Inst. Iron Steel Inst. Jpn. 1988, 28, 1051–1059. [Google Scholar] [CrossRef]
- Popova, I.V.; Nasibov, A.G.; Gulei, G.G.; Sveshnikova, G.A. Nonmetallic inclusions and austenite grains of steel containing tellurium. Met. Sci. Heat Treat. 1986, 28, 52–55. [Google Scholar] [CrossRef]
- Mahmutoviü, A.; Rimac, M. Modification of non-metallic inclusions by tellurium in austenitic stainless. J. Trands Dev. Mach. Assoc. Technol. 2015, 19, 53–56. [Google Scholar]
- Costa, E.; Luiz, N.; Silva, M.D.; Machado, A.; Ezugwu, E. Influence of tellurium addition on drilling of microalloyed steel (DIN 38MnS6). Ind. Lubr. Tribol. 2011, 63, 420–426. [Google Scholar] [CrossRef]
- Luiz, N.E.; Machado, Á.R. Development trends and review of free-machining steels. Proc. Inst. Mech. Eng. Part B J. Eng. Manuf. 2008, 222, 347–360. [Google Scholar] [CrossRef]
- Smith, T.B.; Clayton, D.B. Distribution of tellurium in free-cutting steels. Nature 1963, 198, 380–381. [Google Scholar] [CrossRef]
- Li, D.; Gao, S.; Zhang, L.; Wang, Z.; Dong, X. Formation and behavior of telluride in free cutting steels. Iron Steel 1987, 22, 38–44. [Google Scholar] [CrossRef]
- Gupta, G.; Robertson, D.G.C.; Schlesinger, M.E. Tellurium thermodynamics in austenitic iron. Can. Metall. Q. 2013, 44, 351–356. [Google Scholar] [CrossRef]
- Abeyama, S.; Nakamura, S. An ultra-free maching stainless steel “DSR6F”. Jpn. Inst. Met. 2011, 21, 363–365. [Google Scholar] [CrossRef]
- Kimura, A.; Nishikiori, K. Nitrided super free-machining steel “SFC3FT-N”. Denki Seiko (Electr. Furn. Steel) 1989, 59, 59–64. [Google Scholar] [CrossRef]
- Speich, G.R.; Spitzig, W.A. Effect of volume fraction and shape of sulfide inclusions on through-thickness ductility and impact energy of high-strength 4340 plate steels. Metall. Trans. A 1982, 13, 2239–2258. [Google Scholar] [CrossRef]
- Luyckx, L.; Bell, J.R.; Mclean, A.; Korchynsky, M. Sulfide shape control in high strength low alloy steels. Metall. Trans. 1970, 1, 3341–3350. [Google Scholar]
- Katoh, T.; Abeyama, S.; Kimura, A.; Nakamura, S. A study on resulfurized free-machining steel containing a small amount of tellurium. Denki Seiko (Electr. Furn. Steel) 1982, 53, 195–202. [Google Scholar] [CrossRef]
- Watson, J.D. Microscopy and the development of free-machining steels. In Applied Metallography; Vander Voort, G.F., Ed.; Springer: New York, NY, USA, 1986; pp. 211–236. [Google Scholar]
- Tien, T.Y.; Van Vlack, L.H.; Martin, R.J. The System MnTe-MnS: Progress Report; The University of Michigan: New York, NY, USA, September 1967. [Google Scholar]
Figure 1.
The position of the steel sample in the ingot.

Figure 2.
Morphology of inclusions in steels with different Te contents. (a) 130 ppm; (b) 230 ppm; (c) 320 ppm; (d) 400 ppm; (e) 680 ppm; (f) 970 ppm; (g) 1400 ppm; (h) 2400 ppm.
Figure 2.
Morphology of inclusions in steels with different Te contents. (a) 130 ppm; (b) 230 ppm; (c) 320 ppm; (d) 400 ppm; (e) 680 ppm; (f) 970 ppm; (g) 1400 ppm; (h) 2400 ppm.

Figure 3.
SEM (Scanning Electron Microscope, Phenom, Eindhoven, Netherlands) image of typical inclusion in steels with different Te contents. (a) 130 ppm; (b) 230 ppm; (c) 320 ppm; (d) 400 ppm; (e) 680 ppm; (f) 970 ppm; (g) 1400 ppm; (h) 2400 ppm. ① MnS; ② MnS; ③ MnTe; ④ MnS; ⑤ MnTe; ⑥ MnTe; ⑦ MnS
Figure 3.
SEM (Scanning Electron Microscope, Phenom, Eindhoven, Netherlands) image of typical inclusion in steels with different Te contents. (a) 130 ppm; (b) 230 ppm; (c) 320 ppm; (d) 400 ppm; (e) 680 ppm; (f) 970 ppm; (g) 1400 ppm; (h) 2400 ppm. ① MnS; ② MnS; ③ MnTe; ④ MnS; ⑤ MnTe; ⑥ MnTe; ⑦ MnS
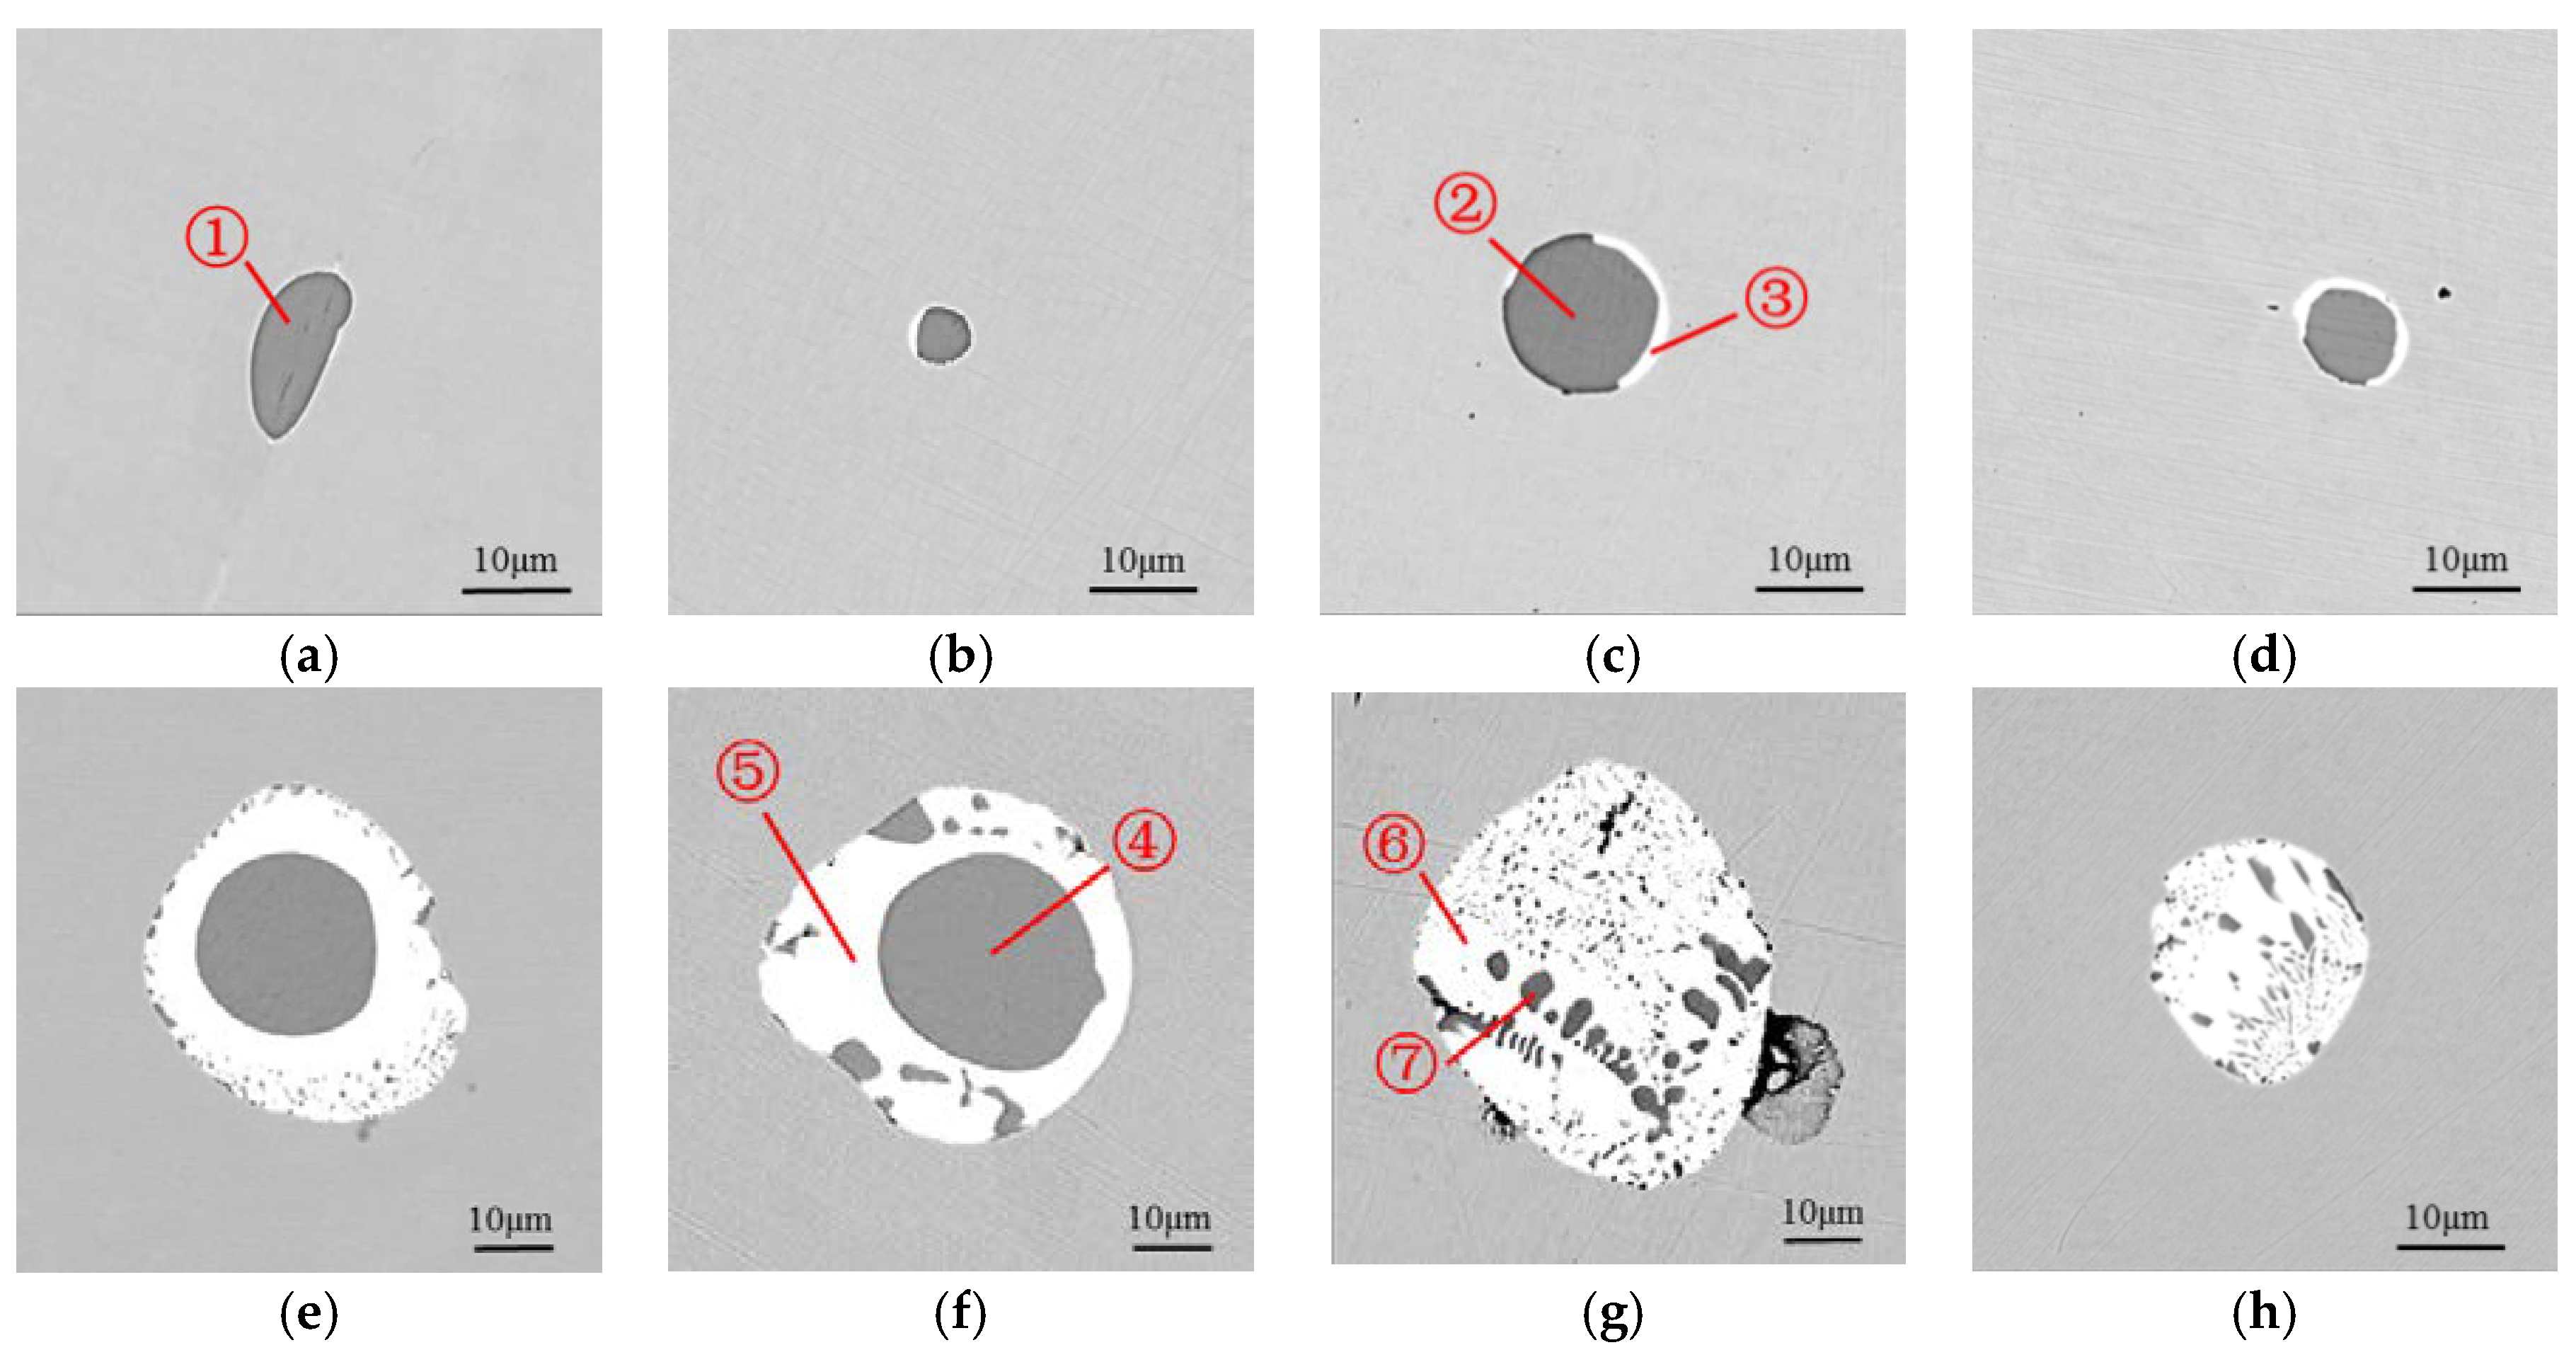
Figure 4.
Number percentage of inclusions in different diameter ranges.

Figure 5.
Average equivalent diameters.

Figure 6.
The area fractions of inclusions.

Figure 7.
Three-dimensional morphology of the composite inclusion in steels with different Te content (a) 130 ppm; (b) 230 ppm; (c) 320 ppm; (d) 400 ppm; (e) 680 ppm; (f) 970 ppm; (g) 1400 ppm; (h) 2400 ppm.
Figure 7.
Three-dimensional morphology of the composite inclusion in steels with different Te content (a) 130 ppm; (b) 230 ppm; (c) 320 ppm; (d) 400 ppm; (e) 680 ppm; (f) 970 ppm; (g) 1400 ppm; (h) 2400 ppm.

Figure 8.
Three-dimensional morphology of the dendritic inclusions. (a) typical dendritic inclusion 1; (b) typical dendritic inclusion 2; (c) typical dendritic inclusion 3.
Figure 8.
Three-dimensional morphology of the dendritic inclusions. (a) typical dendritic inclusion 1; (b) typical dendritic inclusion 2; (c) typical dendritic inclusion 3.

Figure 9.
Number percentage of inclusions in different aspect ratio ranges.

Figure 10.
The aspect ratio of inclusions in steels with different Te/S values.

Figure 11.
Average aspect ratio of inclusions in different equivalent diameter ranges.

Figure 12.
Equilibrium phase diagram during solidification of steel.

Figure 13.
The MnTe-MnS binary phase diagram.

Figure 14.
Precipitation of MnTe and MnS from the liquid phase (a) low Te content; (b) high Te content.
Figure 14.
Precipitation of MnTe and MnS from the liquid phase (a) low Te content; (b) high Te content.


Table 1.
The composition of 38MnVS6 steel (wt %).
| Composition | C | Si | Mn | P | S | Cr | V | Al | Ti | Nb | Ni |
|---|---|---|---|---|---|---|---|---|---|---|---|
| Content | 0.383 | 0.574 | 1.399 | 0.01 | 0.051 | 0.179 | 0.099 | 0.018 | 0.017 | 0.016 | 0.123 |
Table 2.
Te content in each steel sample (ppm).
| No. | 1 | 2 | 3 | 4 | 5 | 6 | 7 | 8 |
|---|---|---|---|---|---|---|---|---|
| Content | 130 | 230 | 320 | 400 | 680 | 970 | 1400 | 2400 |
Table 3.
Composition of different points (wt %).
| Element | 1 | 2 | 3 | 4 | 5 | 6 | 7 |
|---|---|---|---|---|---|---|---|
| Mn | 56.53 | 55.87 | 23.00 | 59.35 | 26.15 | 25.45 | 56.41 |
| S | 28.64 | 29.14 | 2.33 | 30.38 | 2.52 | 2.18 | 28.51 |
| Fe | 11.35 | 9.62 | 13.00 | 5.97 | 5.51 | 6.93 | 8.23 |
| Te | 3.47 | 5.37 | 61.67 | 4.29 | 65.82 | 65.43 | 6.85 |
© 2018 by the authors. Licensee MDPI, Basel, Switzerland. This article is an open access article distributed under the terms and conditions of the Creative Commons Attribution (CC BY) license (http://creativecommons.org/licenses/by/4.0/).
Share and Cite
MDPI and ACS Style
Shen, P.; Yang, Q.; Zhang, D.; Yang, S.; Fu, J. The Effect of Tellurium on the Formation of MnTe-MnS Composite Inclusions in Non-Quenched and Tempered Steel. Metals 2018, 8, 639. https://doi.org/10.3390/met8080639
AMA Style
Shen P, Yang Q, Zhang D, Yang S, Fu J. The Effect of Tellurium on the Formation of MnTe-MnS Composite Inclusions in Non-Quenched and Tempered Steel. Metals. 2018; 8(8):639. https://doi.org/10.3390/met8080639
Chicago/Turabian StyleShen, Ping, Qiankun Yang, Dong Zhang, Shufeng Yang, and Jianxun Fu. 2018. "The Effect of Tellurium on the Formation of MnTe-MnS Composite Inclusions in Non-Quenched and Tempered Steel" Metals 8, no. 8: 639. https://doi.org/10.3390/met8080639
Note that from the first issue of 2016, this journal uses article numbers instead of page numbers. See further details here.