1. Introduction
As known, the standard analysis for traditional seismic design is Linear Dynamic Procedure (LDP) with assigned response spectrum (Response Spectrum Analysis). More complex procedures, such as non-linear time history analysis (NDP), are seldom used because of the difficulties in the definition of an accurate hysteretic model to describe the behaviour of the materials under cyclic actions and the choice of a set of accelerograms that describes the real site conditions. Moreover, as it is well-known, NDP analyses present convergence difficulties and require major computational effort.
Non-linear static analysis is instead becoming the key method to evaluate the seismic response of existing structures. This method, which is able to evaluate the collapse mechanism of structures, is suitable for the analysis of existing structures, including the ones not explicitly designed for seismic actions.
However, non-linear static procedures can lead to unsuitable results when applied to irregular structures because of the difficulties in taking into account dynamic lateral-torsional effects and higher mode effects. As it is known, an asymmetric distribution of mass and stiffness, or of strength in plan, leads to high ductility demand for the elements near the soft or weak edge [
1,
2,
3]. In recent years, several proposals have been put forward to extend traditional pushover analysis, calibrated on plan systems, to the assessment of three-dimensional models behavior [
4,
5,
6,
7,
8,
9,
10,
11,
12,
13,
14,
15]. At present no simplified procedure which can adequately account for the torsional behaviour of asymmetric structures has been implemented. The main questions concern the combination of the forces in the two directions, and the best way to consider extra ductility demand for the elements near the edges [
16,
17,
18,
19,
20,
21,
22,
23,
24].
This report presents and discusses the main results of the new methodology to assess the seismic response of irregular structures by means of capacity domains which allow us to evaluate the direction of least seismic capacity of the investigated buildings and the polar spectrum which represents the seismic demand in the plan. In particular, the capacity domains, represented in terms of strength and displacement capacities, are evaluated using traditional pushover analyses by applying load distributions, triangular and uniform, at different angles in the plan to search for the least seismic-resistant direction. The polar spectrum, instead, is a new spectral representation which is able to investigate the seismic demand of each in-plane direction. In particular, this tool is based on the spatial spectral surface obtained by the spectral seismic response evaluated for different in-plan directions and the in-plan projection is defined “Polar Spectrum”.
Both polar spectrum and capacity domains allow researchers to investigate the non-linear seismic capacities of irregular structures. As is well-known, indeed, the collapse conditions for a three-dimensional system are also governed by the spatial features of the seismic event. Therefore, the goal of the presented results is to investigate the seismic behavior of irregular structures by considering the least seismic-resistant directions of the investigated structure and the spatial features of the seismic event.
2. Description of the Benchmark Structures
For the scope of this report the benchmark structure proposed in the ReLUIS project (Earthquake Engineering Test Labs Network) is considered [
25].
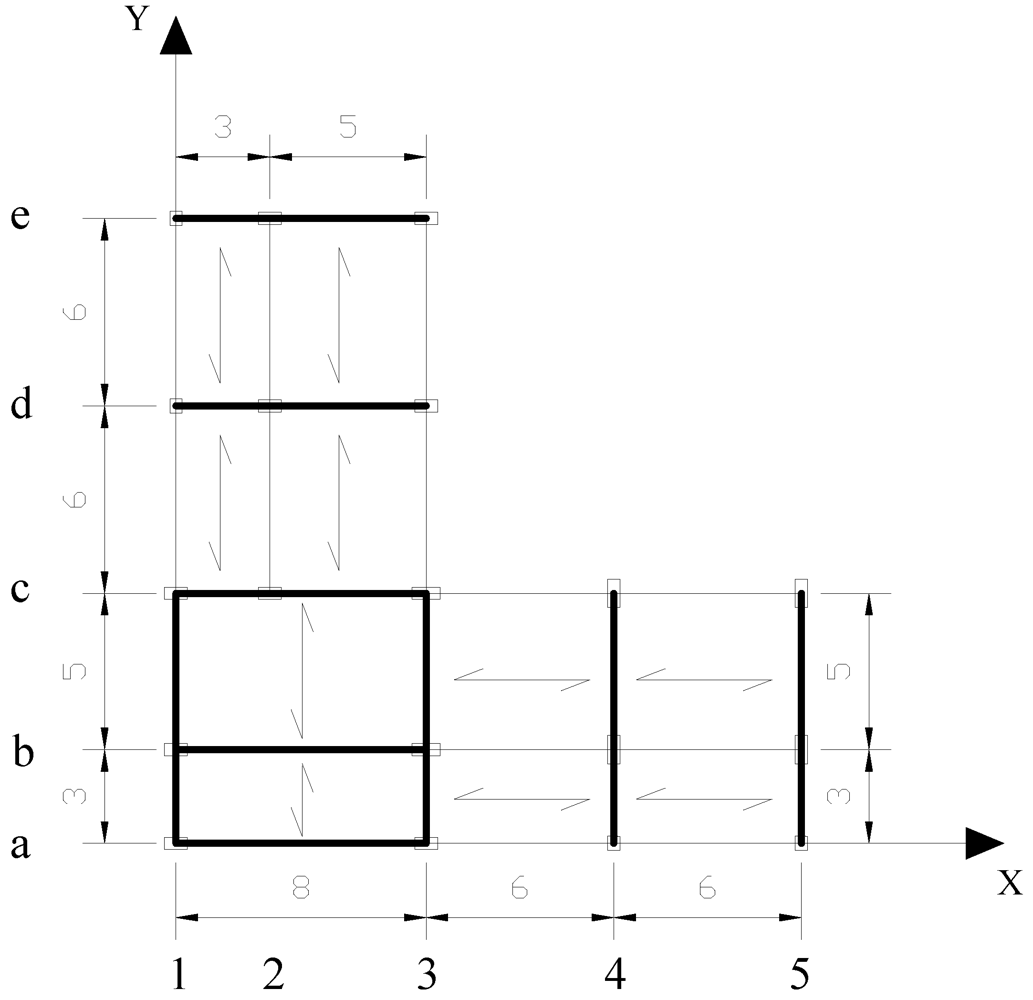
The structure, designed without seismic actions, is a five-storey L-shaped building with RC moment frames in two orthogonal directions, as represented in
Figure 1. Details of the benchmark structure are contained in the ReLUIS project.
Figure 1.
Benchmark structure plan.
Figure 1.
Benchmark structure plan.
A finite-element model has been implemented in Opensees software [
26]. The floors are modeled by means of 50 mm elastic shells and the elastic modulus is set to the value of 30,000 MPa. Beams and columns are modeled by spread plasticity non-linear elements with fiber sections applied.
The collapse condition for the generic section is defined in terms of section curvature, evaluated by imposing limit strain values for the concrete fibers (εc = 0.006 in compression) and for the reinforced steel fibers (εs = 0.03 in tension).
The main dynamical properties of the model are reported in
Table 1. In particular, each mode shape is described by the vibration period (T), the mass participation ratios (M%) and the sum of the participation ratios up to the considered modal shape (SUM).
Table 1.
Modal properties for the Benchmark Structure.
Table 1.
Modal properties for the Benchmark Structure.
| Mode | T(s) | M%x | M%y | SumX | SumY |
|---|
| 1 | 1.35 | 10.9% | 52.1% | 10.9% | 52.1% |
| 2 | 1.22 | 56.9% | 19.6% | 67.8% | 71.8% |
| 3 | 0.99 | 10.8% | 9.2% | 78.6% | 80.9% |
| 4 | 0.42 | 0.9% | 8.5% | 79.4% | 89.4% |
| 5 | 0.38 | 9.4% | 1.9% | 88.8% | 91.2% |
| 6 | 0.31 | 1.5% | 1.1% | 90.3% | 92.4% |
| 7 | 0.23 | 0.1% | 4.1% | 90.4% | 96.5% |
| 8 | 0.20 | 4.2% | 0.5% | 94.6% | 97.0% |
| 9 | 0.17 | 0.9% | 0.5% | 95.5% | 97.5% |
The modal analysis shows a flexible behavior and, moreover, the plan irregularity leads to latero-torsional behaviour for modes 1 and 2.
3. The Concept of Capacity Domains
In order to assess the non-linear static response of irregular structures it is possible to obtain capacity domains, in terms of control node displacement or base shear. In particular, such domains are obtained from the results of non-linear static procedures (pushover) carried out by varying the in-plan direction of the applied load distribution. The domains, represented in the following, depict the displacement of the control node or the base shear up to collapse.
The analyses are carried out by applying two load distributions along the height of the structure. The first one is a triangular distribution, taking into consideration the inertial masses and the height above the ground. The second one considers only the floor masses. The forces are applied at beam-column joints, proportionally to the joints mass.
For each applied load distribution, 24 capacity curves have been obtained by rotating the direction of action in the x-y plane, 15° at each step. The control node is assumed to be the centre of mass on the top floor in all the pushover analyses carried out.
Using the described limit values for section curvature, the global collapse is assumed when the first primary element exceeds its limit. Each pushover curve is bi-linearized according to the FEMA 356 procedure [
27].
The capacity domains are compared to the non-linear dynamic response to recorded earthquakes, selected among those proposed by ReLUIS [
28]. The records, considering both NS and EW components, are suitably scaled to study the structural response by varying ground acceleration as in the case of non linear incremental dynamical analysis.
The main results, for the considered accelerogram, are represented in the following. In particular,
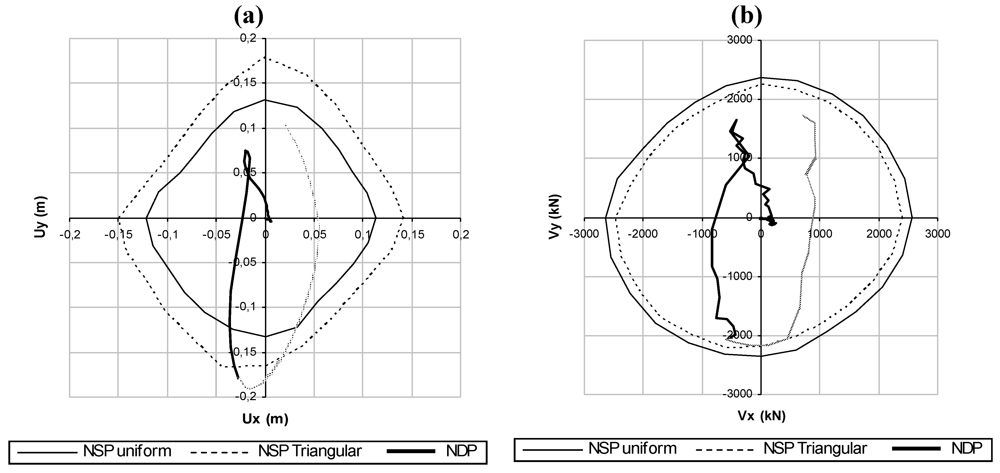
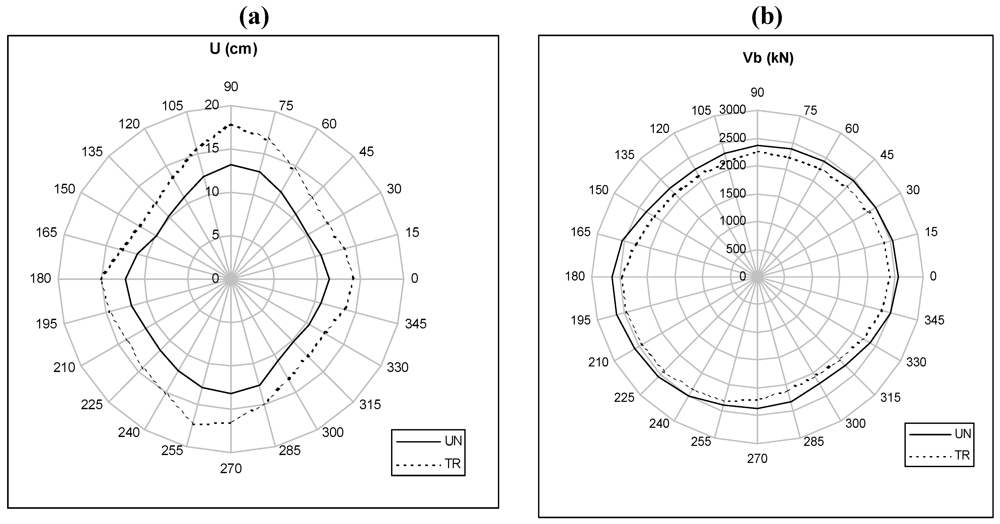
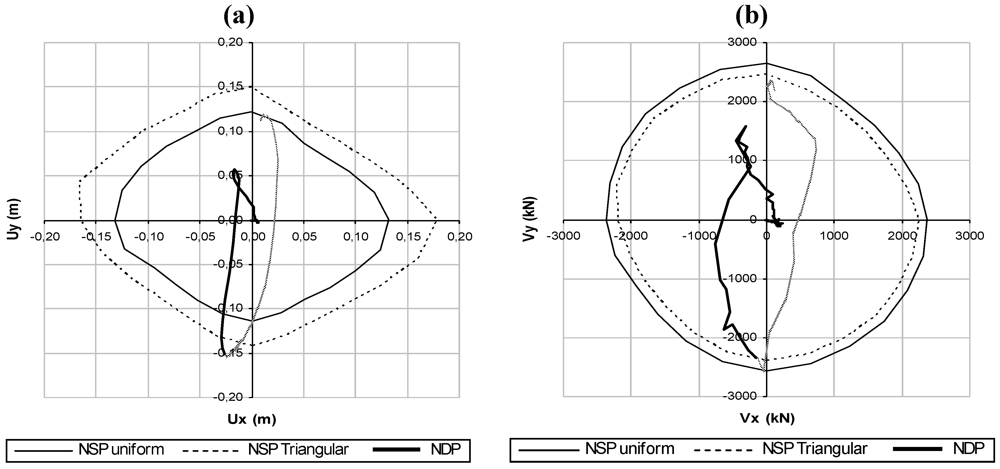
Figure 2 refers to the collapse of the analyzed benchmark structure by varying the direction of action in the plan in the case of triangular (TR) and uniform (UN) load distributions and represents the capacity domains. These domains are plotted in terms of displacement of the control node (U) and base shear (Vb). It is possible to observe for both domains a non-regular behaviour of the structure, above all in terms of limit displacements. In particular, the analyses show that the benchmark structure presents lower displacement capacities in the 150°–330° direction. Otherwise, structural behaviour seems to be more regular in terms of strength.
In order to evaluate the applicability of the capacity domains to accurately describe the collapse state of a structure, incremental dynamic analyses have been performed. For both the considered in-plan dispositions of the structures, 0° and 90°, the analyses have been carried out considering the Iceland 2000 earthquake (code 06334, maximum PGA equal to 7.07 m/s2). The
Figure 3 and
Figure 4 show the dynamic response (NDP) for the analyzed cases.
Figure 2.
(a) Capacity Domains in terms of node control displacements at collapse; b Capacity Domains in terms of base shear.
Figure 2.
(a) Capacity Domains in terms of node control displacements at collapse; b Capacity Domains in terms of base shear.
Figure 3.
(a) Comparison between capacity domains and NDP-Collapse amplification factor 0.40-In plan orientation of benchmark structure 0°; (b) Comparison between capacity domains and NDP-Collapse amplification factor 0.40-In plan orientation of benchmark structure 0°.
Figure 3.
(a) Comparison between capacity domains and NDP-Collapse amplification factor 0.40-In plan orientation of benchmark structure 0°; (b) Comparison between capacity domains and NDP-Collapse amplification factor 0.40-In plan orientation of benchmark structure 0°.
Figure 4.
(a) Comparison between capacity domains and NDP-Collapse amplification factor 0.35-In plan orientation of benchmark structure 90°; (b) Comparison between capacity domains and NDP-Collapse amplification factor 0.35-In plan orientation of benchmark structure 90°.
Figure 4.
(a) Comparison between capacity domains and NDP-Collapse amplification factor 0.35-In plan orientation of benchmark structure 90°; (b) Comparison between capacity domains and NDP-Collapse amplification factor 0.35-In plan orientation of benchmark structure 90°.
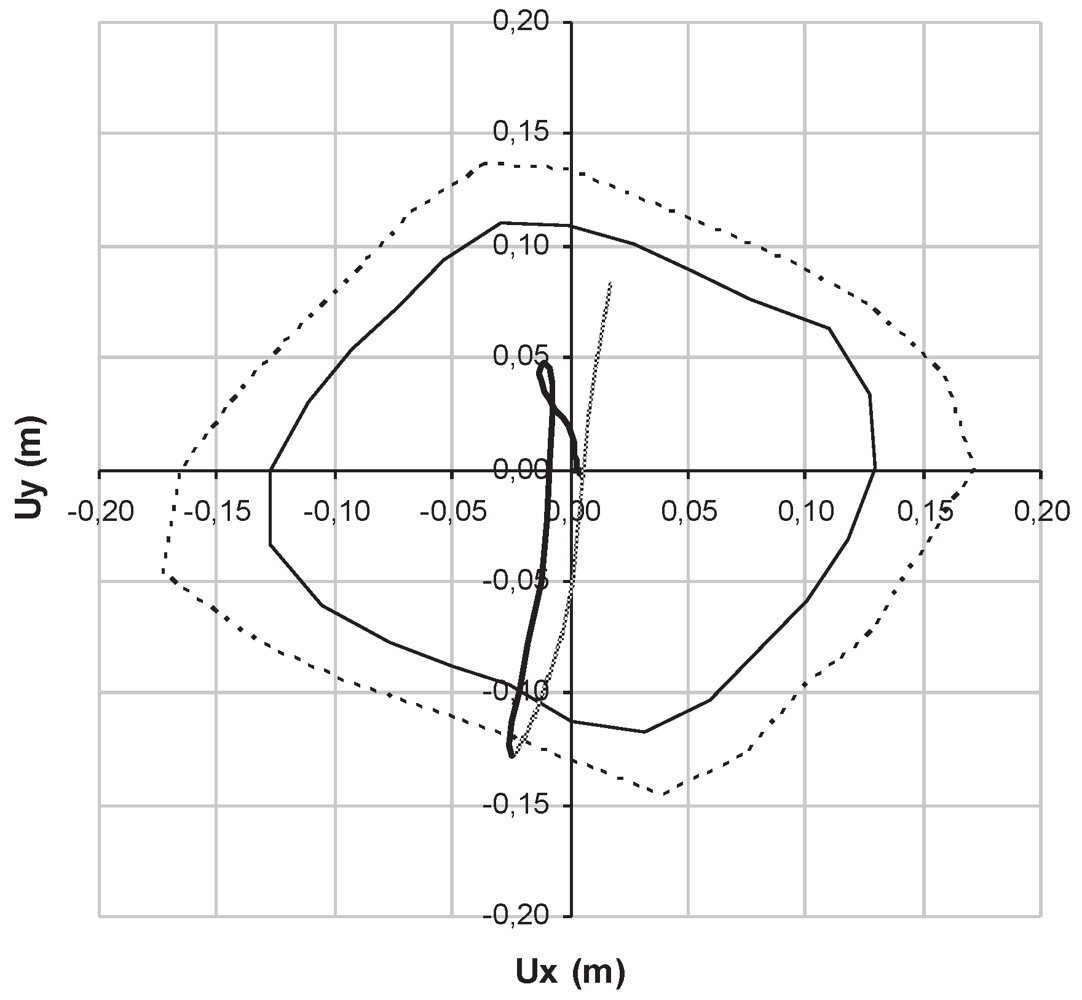
As it is apparent, the collapse is attained in the direction of about 255° independently of plan orientation of benchmark structure. Moreover, the collapse occurs in correspondence with the capacity domain for triangular load distribution, and the collapsed element, column b-1 (
Figure 1), the second column located along the longer side in direction y, at ground level, is the same for both dynamic and static analyses. For both analyses the collapse amplification factor in the case of NDP is represented. In the figures, the capacity domains are indicated with NSP (Non-linear Static Procedure) for the uniform and triangular load distributions.
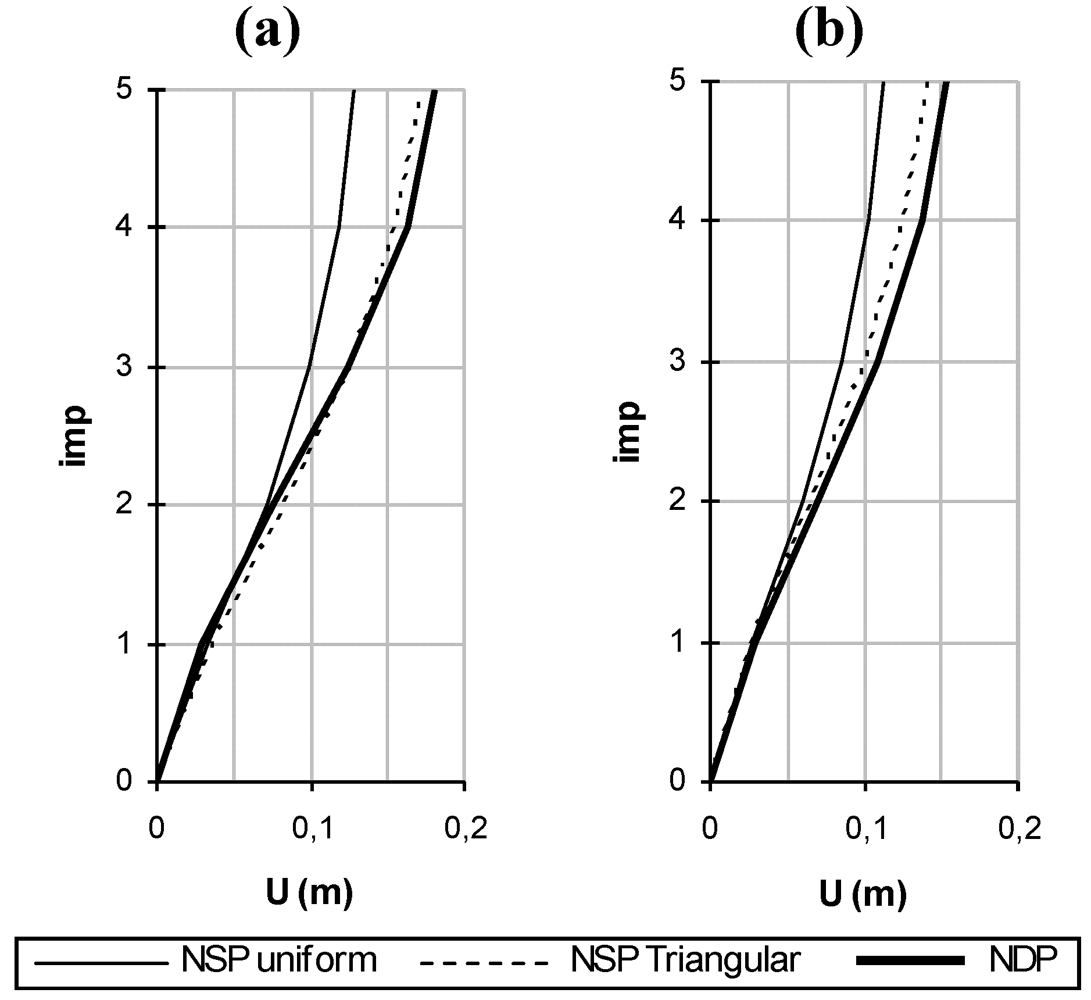
As a further comparison between static and dynamic responses,
Figure 5 shows storey displacements at collapse for both analyses in the considered plan directions of benchmark structure (0° and 90°).
Results show that the collapse mechanism is a global one, being the displacement path carried out by NDP well described by the one obtained by NSP with triangular load distribution. Moreover, as is apparent, the collapse as well as when read with the NDP procedure always intercepts the capacity domains corresponding to the triangular load distribution (
Figure 3 and
Figure 4).
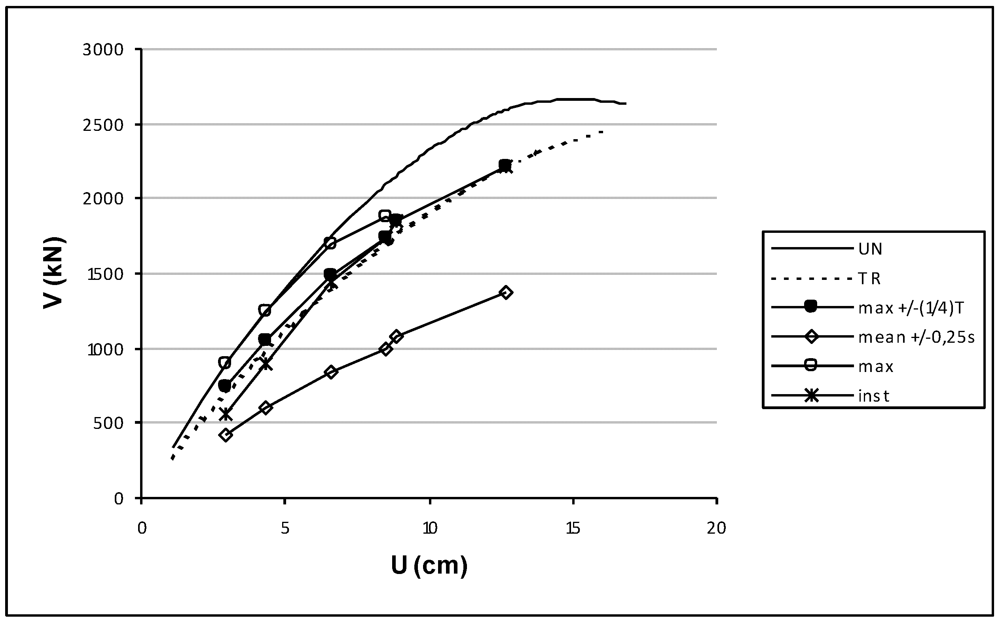
Figure 6 shows the comparison between the behaviour evaluated by means of pushover analyses and that obtained by incremental dynamic analysis.
Figure 5.
(a) Storey Displacement Comparison at collapse for in plan directions 0°; (b) at 90°.
Figure 5.
(a) Storey Displacement Comparison at collapse for in plan directions 0°; (b) at 90°.
Figure 6.
Comparison between Incremental Dynamical Analysis and static non linear analyses-In plan orientation of benchmark structure 0°.
Figure 6.
Comparison between Incremental Dynamical Analysis and static non linear analyses-In plan orientation of benchmark structure 0°.
In particular, the figures show the comparison between pushover curves obtained by static non linear analyses in the least resistance direction considering the uniform and triangular load distributions and the pushover curves obtained by incremental dynamic analyses considering several criteria for the graphical representation. Regarding the representation of the time history data, several proposals can be found in the literature [
29]. Among these, in the present study, several criteria have been considered: maximum displacement
vs. maximum base shear (max), maximum displacement
vs. corresponding base shear (inst) and maximum displacement
vs. mean base shear within the interval +/−0.25 s (mean +/−0.25 s). Moreover, a new criterion has been proposed herein: the maximum displacement
vs. maximum base shear within the interval +/−(1/4) T (max +/−(1/4)T) with T the dominant natural period of vibration in the direction under examination. The proposed criterion leads to catching the maximum response in a semi-period of oscillation.
The results (
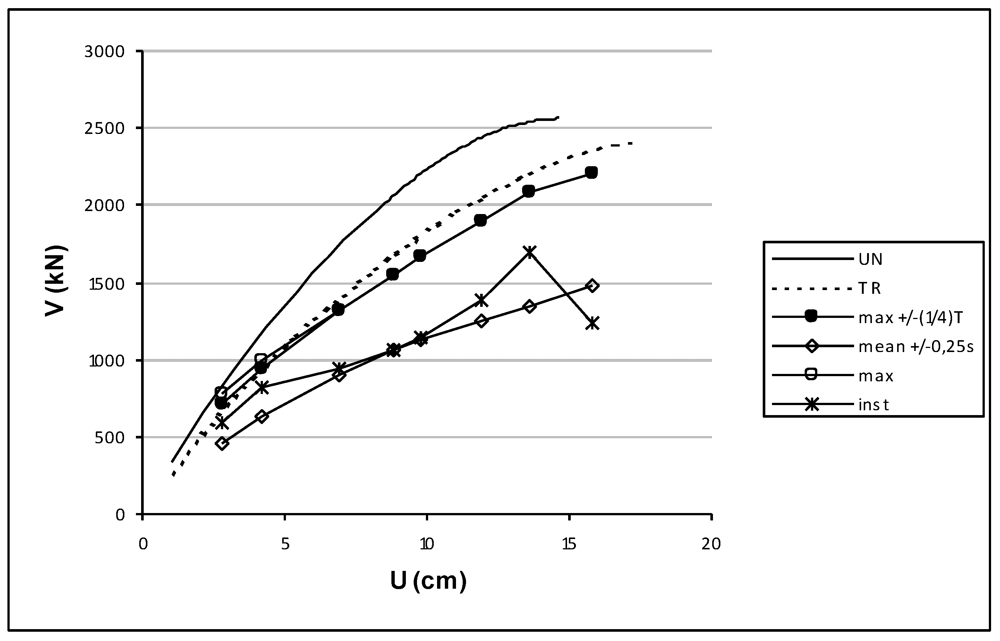
Figure 6 and
Figure 7) show that the static non-linear analyses carried out in the least seismic resistant direction will effectively describe the dynamic non-linear response for the investigated structure and considered seismic event. Moreover, the proposed criteria for comparing incremental dynamic and static non linear analysis seems to supply us with the best results for all investigated displacements.
Figure 7.
Comparison between Incremental Dynamical Analysis and static non linear analyses-In plan orientation of benchmark structure 90°.
Figure 7.
Comparison between Incremental Dynamical Analysis and static non linear analyses-In plan orientation of benchmark structure 90°.
4. The Concept of Polar Spectrum
As is known, seismic events generally present strong directivity effects due to site geo-morphological conditions, the source mechanism and the path from the source to the site of the seismic waves.
To take into account the directivity and site effects it is possible to consider the polar spectrum, a new tool, proposed by the authors, which is able to investigate each in-plan direction. In particular, this tool is based on the spatial spectral surface obtained by the spectral seismic response evaluated for different in-plan directions. The in-plan projection of this surface is defined “Polar Spectrum”.
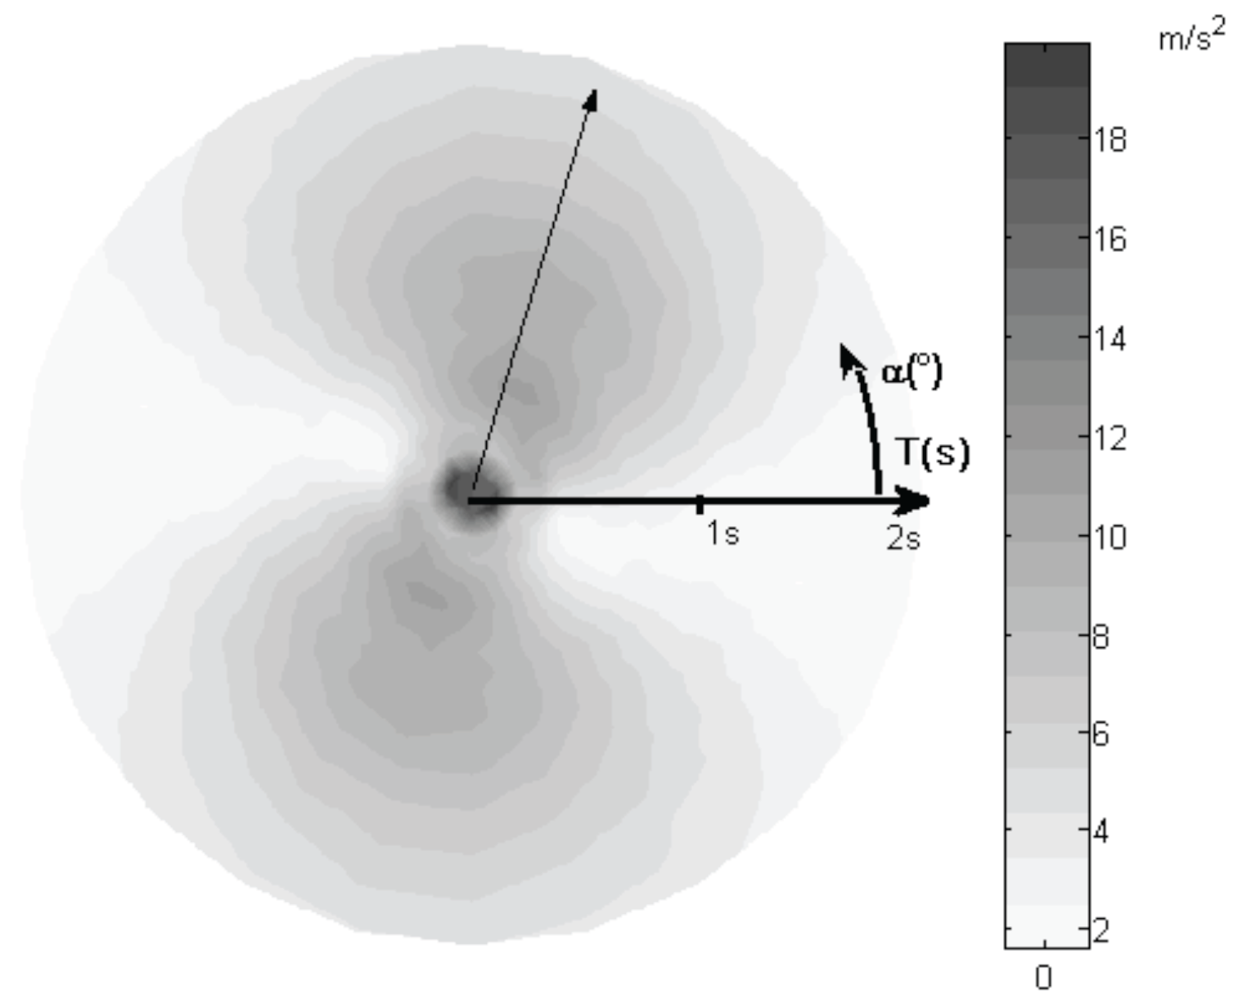
Figure 8 shows the polar spectrum in terms of pseudo-acceleration for the seismic event South Iceland aftershock (code 006334) with a damping factor ξ = 0.05 in the range of periods 0–2 seconds. The polar spectrum represents the projection on the horizontal plan of the spectral surface obtained by evaluating the spectra in each horizontal direction by considering the ground acceleration time histories only in these directions. For the scope, of each considered direction the accelerograms were evaluated by considering the NS and EW recorded components of the seismic event. Each radius of the polar spectrum thus represents, the response evaluated in that direction and each circumference, instead, the spectral demand for a fixed period in each direction. The origin corresponds to a 0 sec period. As it is easy to observe, the polar spectrum is a polar-symmetric figure.
Figure 8.
Polar Spectrum in terms of pseudo-acceleration for the South Iceland aftershock (code 006334).
Figure 8.
Polar Spectrum in terms of pseudo-acceleration for the South Iceland aftershock (code 006334).
The analysis of the polar spectrum shows that the considered seismic event presents a peak demand along the direction (75°–255°) regardless of the vibration period value.
The comparison between the polar spectrum of the considered seismic event and the results of Non-Linear Dynamic Procedure (NDP) is shown clearly, as the collapse of the benchmark structure is controlled in this case by the directivity effects more than by the seismic capacity of the analyzed structure.
6. Conclusions
In the field of seismic engineering, an existing open issue is the need to define a feasible procedure to evaluate the seismic performance of irregular structures. In this article, new tools, devised in order to assess the non-linear behaviour of an irregular building and the spectral seismic demand in the plan, have been presented. In particular, capacity domains are evaluated by means of pushover analyses by varying the load distribution in the plan and lead to the search for less seismic resistant directions. The polar spectra lead to full assessment of the spatial features of the seismic demand and represent an opportunity to investigate thoroughly the seismic demand and the event characteristics, being able to clearly evaluate directivity and site effects.
The results, for the investigated structure and the considered earthquake, show that the collapse condition, assessed by means of non linear dynamic procedures, turns out to be coherent with the capacity domains based on the results of traditional non linear procedures carried out by varying the angle of the application of the load distribution.
The non-linear dynamic analyses have shown that the directional components of the seismic event govern the collapse direction. Therefore, the worst condition for an investigated structure is obtained by aligning its least resistance capacity direction, evaluated on the basis of the capacity domains, with the maximum response demand direction identified by the polar spectrum.
Moreover, the study proposes a new criterion to compare incremental dynamic and static non linear analysis which seems to supply the best results for all investigated cases.


