1. Introduction
The purpose of this paper is to ascertain the range of added steel chips for optimum compressive strength value of hardened sandcrete building hollow blocks and cubes with steel chips; in the process, establish how compressive strength can be improved using steel chips. For clarity, sandcrete is a composite material consisting of fine aggregate (sand), cement, and water at an appropriate ratio. The material can be used in the manufacture of blocks and also as a binder for precast units in early stages before they set and harden. Sandcrete blocks are used predominantly in partition or load bearing walls. They transmit structural loads from the overlaying structural element down to foundations for stability. For this reason, sandcrete blocks are globally considered appropriate and very adaptable in the building materials industry.
However, for some time now, the majority of sandcrete blocks used in developing countries, especially in sub-Saharan Africa, have often fallen short of local and global specification standards. In the Nigerian building industry, for example, the majority of the sandcrete blocks in use do not meet specification standards recommended by the Nigerian Federal Ministry of Works [
1,
2,
3]. Earlier investigations in Nigeria have also revealed the very poor performance of these sandcrete blocks as they exhibit compressive strength far below the standard requirements [
4]. Some of these blocks frequently fail due to their own weight, even when being transported. Therefore, it is not surprising to see frequent cases of building failure, in particular failures of walls made from these blocks. Several studies have also shown that poor quality control and the use of sub-standard building materials are chiefly responsible for the high failure rates of building structures in Nigeria [
1,
2,
3,
5,
6,
7].
As cited in [
1,
8] structural failure is a direct function of constituent material failures and the interactions of materials within structural units. To this end, several factors, which include the influence of fine aggregate combinations on particle size distribution, grading parameters, and compressive strength of sandcrete blocks, have been investigated [
2]. The impact of vibration time on the compressive strength of hardened sandcrete building blocks has also been assessed [
3]. The sole objective of this paper is to show how steel chips (a waste industrial product from mechanical workshops and factories) can be used to improve the compressive strength of sandcrete hollow blocks and cubes and obtain the range of steel chips percent for optimum compressive strength for these blocks and cubes. At this stage it is important to present the program of study for this investigation.
2. Program of Investigation
The program of investigation is subdivided into two phases. The first phase involves the addition of some proportions of steel chips, by weight (percentage of steel chips in relation to the weight of cement), to the sandcrete mix. These proportions are 5%, 10% and 15% respectively. However, it is important to mention here that these proportions were arbitrarily chosen at the beginning, and not informed by previous work or research. Then, blocks and cube samples are produced using each of these proportions. It is important to indicate that none of the proportions of steel chips used affects the proportion of the sandcrete constituents (sand, cement, water). So the added steel chips’ proportions were only additions to the sandcrete mix.
The second phase of this investigation is based on the experimental compressive strength results obtained during the first phase (where the influence of 5%, 10% and 15% steel chips were investigated). In other words, the first phase investigation helped determine whether to increase or decrease the proportion of steel chips used in the second phase. For instance, if the first phase results show an increase in compressive strength due to the increase in the amount of added steel chips; then in the second phase investigation an additional set of increased steel chips proportions has to be investigated to ascertain the range of the optimum compressive strength. In this instance, the highest compressive strength obtained out of the three percentages of added steel chips above was 5% followed by 10% and then 15%. This suggests that the position of the optimum compressive strength value is likely at the 5% added steel chips; it could also be slightly less, or far less, than 5%. So there is need to further investigate the influence of lower proportions of added steel chips
i.e., 1%, 2%, 3%, and 4% respectively to ascertain the range of steel chips percent additions for optimum compressive strength value for both hollow sandcrete blocks and cubes. A total of 162 samples were used (produced and tested) in this investigation: 36 blocks and 36 cubes for the first phase and another 36 blocks and 36 cubes for the second phase investigation; totaling 144 samples. The remaining 18 samples (comprising nine blocks and nine cubes) were used for the wet compressive strength test. “Wet compressive strength is the strength test conducted after 28 day cured blocks are submerged in water for another 14 days before undergoing the compressive strength test” [
2]. See
Table 1,
Table 2,
Table 3 below for the number of the samples (blocks and cubes) at various testing periods (7-day, 14-day, 28-day).
Table 1.
Number of blocks at the various testing periods.
Table 1.
Number of blocks at the various testing periods.
| Aggregate | 7-day | 14-day | 28-day | Number of samples |
|---|
| Sand + Steel Chips (0%) | 3 | 3 | 3 | 9 |
| Sand + Steel Chips (1%) | 3 | 3 | 3 | 9 |
| Sand + Steel Chips (2%) | 3 | 3 | 3 | 9 |
| Sand + Steel Chips (3%) | 3 | 3 | 3 | 9 |
| Sand + Steel Chips (4%) | 3 | 3 | 3 | 9 |
| Sand + Steel Chips (5%) | 3 | 3 | 3 | 9 |
| Sand + Steel Chips (10%) | 3 | 3 | 3 | 9 |
| Sand + Steel Chips (15%) | 3 | 3 | 3 | 9 |
| Total number of blocks tested | 24 | 24 | 24 | 72 |
Table 2.
Number of cubes at the various testing periods.
Table 2.
Number of cubes at the various testing periods.
| Aggregate | 7-day | 14-day | 28-day | Number of samples |
|---|
| Sand + Steel Chips (0%) | 3 | 3 | 3 | 9 |
| Sand + Steel Chips (1%) | 3 | 3 | 3 | 9 |
| Sand + Steel Chips (2%) | 3 | 3 | 3 | 9 |
| Sand + Steel Chips (3%) | 3 | 3 | 3 | 9 |
| Sand + Steel Chips (4%) | 3 | 3 | 3 | 9 |
| Sand + Steel Chips (5%) | 3 | 3 | 3 | 9 |
| Sand + Steel Chips (10%) | 3 | 3 | 3 | 9 |
| Sand + Steel Chips (15%) | 3 | 3 | 3 | 9 |
| Total number of cubes tested | 24 | 24 | 24 | 72 |
Table 3.
Numbers of blocks and cubes for wet compressive strength test.
Table 3.
Numbers of blocks and cubes for wet compressive strength test.
| Aggregate combinations | Type of sample | 14-day test |
|---|
| Sand + Steel Chips (5%) | Block | 3 |
| Sand + Steel Chips (10%) | Block | 3 |
| Sand + Steel Chips (15%) | Block | 3 |
| Sand + Steel Chips (5%) | Cube | 3 |
| Sand + Steel Chips (10%) | Cube | 3 |
| Sand + Steel Chips (15%) | Cube | 3 |
| Total number of blocks tested | - | 18 |
4. Discussion
From the compressive strength results tables and the plotted graphs for all the various sand and steel chip combination samples; the highest compressive strengths were recorded at the 28-day test (see
Figure 6,
Figure 7 below;
Table 5 above).
Figure 6.
Blocks Compressive Strength at 0, 1%, 2%, 3%, 4%, 5%, 10% & 15% Steel Chips.
Figure 6.
Blocks Compressive Strength at 0, 1%, 2%, 3%, 4%, 5%, 10% & 15% Steel Chips.
Figure 7.
Cubes Compressive Strength at 0, 1%, 2%, 3%, 4%, 5%, 10% & 15% Steel Chips.
Figure 7.
Cubes Compressive Strength at 0, 1%, 2%, 3%, 4%, 5%, 10% & 15% Steel Chips.
It was observed that the addition of steel chips led to an increase in compressive strength of the blocks and cube samples compared to non-inclusion of steel chips. However, it was interesting to discover in the first phase of this investigation that with an increasing percentage of steel chips, beyond the 5% margin, there was a corresponding decrease in compressive strength values. In the first phase, the 5% steel chip and sand combination gave the highest compressive strength at seven days, 14 days and 28 days respectively. The likely reasons for this finding include the aggregate grading or particle size distribution, rusting, stresses on the steel chips due to fabrication or machining, and possibly workmanship. The workmanship factor is the human factor (the possibility for experimental errors).
Waste steel chips, from the cutting and drilling of steel, are usually the product of fabrication by manually operated machining techniques in both developed and developing countries. In steel machining processes, cutting tools would normally travel along the surface of a workpiece and shear away part of the workpiece ahead of it. It is an energy intensive process and a sizeable portion of the energy expended is transformed into heat energy through mechanical-thermal interaction. This interaction excites the microscopic constituents of the interacting bodies. Most of this heat energy is stored or carried away by the chips, the waste product of the interaction of the cutting tool, and the workpiece, while the remaining smaller fraction of heat energy is shared between the tool and workpiece [
17]. The resulting thermal equilibrium due to microscopic atomic interaction between the cutting tool, workpiece, and chips allow the various atoms to negotiate different energy levels from where they actually started (a spontaneous and irreversible process). In view of the fact that the bulk of the heat is carried by the steel chip a significant atomic displacement occurs within the material which leaves the steel chips severely stressed. Having been stressed by the processes of cutting and drilling during initial fabrication and working, in addition to the molding operations undertaken, the steel chips’ ability to withstand further stress is greatly reduced. This could potentially lead to failure zones within the steel chips, even under low loads. Therefore, the higher the percentage of added steel chips, the higher the number of failure zones within the structural unit (sample). Equally pervasive, is the rate of corrosion in the steel chips, encouraged during the curing of the samples through the sprinkling/spraying of water.
In electrochemistry, corrosion is an electrochemical oxidation of metals in the presence of oxygen. The developmental process of iron oxide (rusting) is one of the well-known examples of electrochemical corrosion. In this process, water droplets in contact with the metal function as a voltaic cell with the potential to precipitate two simultaneous corrosive reactions. These reactions are oxidation and reduction reactions (commonly known as the redox reaction). It is important to mention here that it is practically impossible to have an oxidation reaction without a simultaneous reduction reaction. While oxidation is the loss of electrons, reduction refers to the gain of electrons. Thus, when a water droplet is in contact with a steel chip at the surface of the block or cubes, oxidation is induced automatically. This oxidation of metal (steel chip) takes place at the anode which is the corroded portion or pitting surface of the metal that releases iron (II) ions and negatively charged electrons [Fe(solid) = Fe
2+(aq) + 2e
−]. These electrons flow within the metal to the outside or immediate edges of the water droplet (the cathode) to effect a corresponding reduction reaction. The reduction reaction occurs when released electrons from the anode are received at the cathode in the presence of oxygen and water to form hydroxide ions: [O
2(gas) + 2H
2O(liquid) + 4e
− = 4OH
-(aq)]. The hydroxyl ions now move into the water droplets to react with the iron (II) ions from oxidation and which results in the precipitation of Iron (II) hydroxide. The Iron (II) hydroxide quickly oxidizes to form what is known as rust [
18]. So rusting is the action of water on the steel in the presence of oxygen. It is an irreversible electrochemical process that reduces the strength properties of the steel with time. This accumulatively destructive phenomenon creates rust patches, which affect the binding matrix and the thorough adhesion of cement material. However, a far more likely reason for strength reduction as the steel chip percentage increases is the aggregate grading factor.
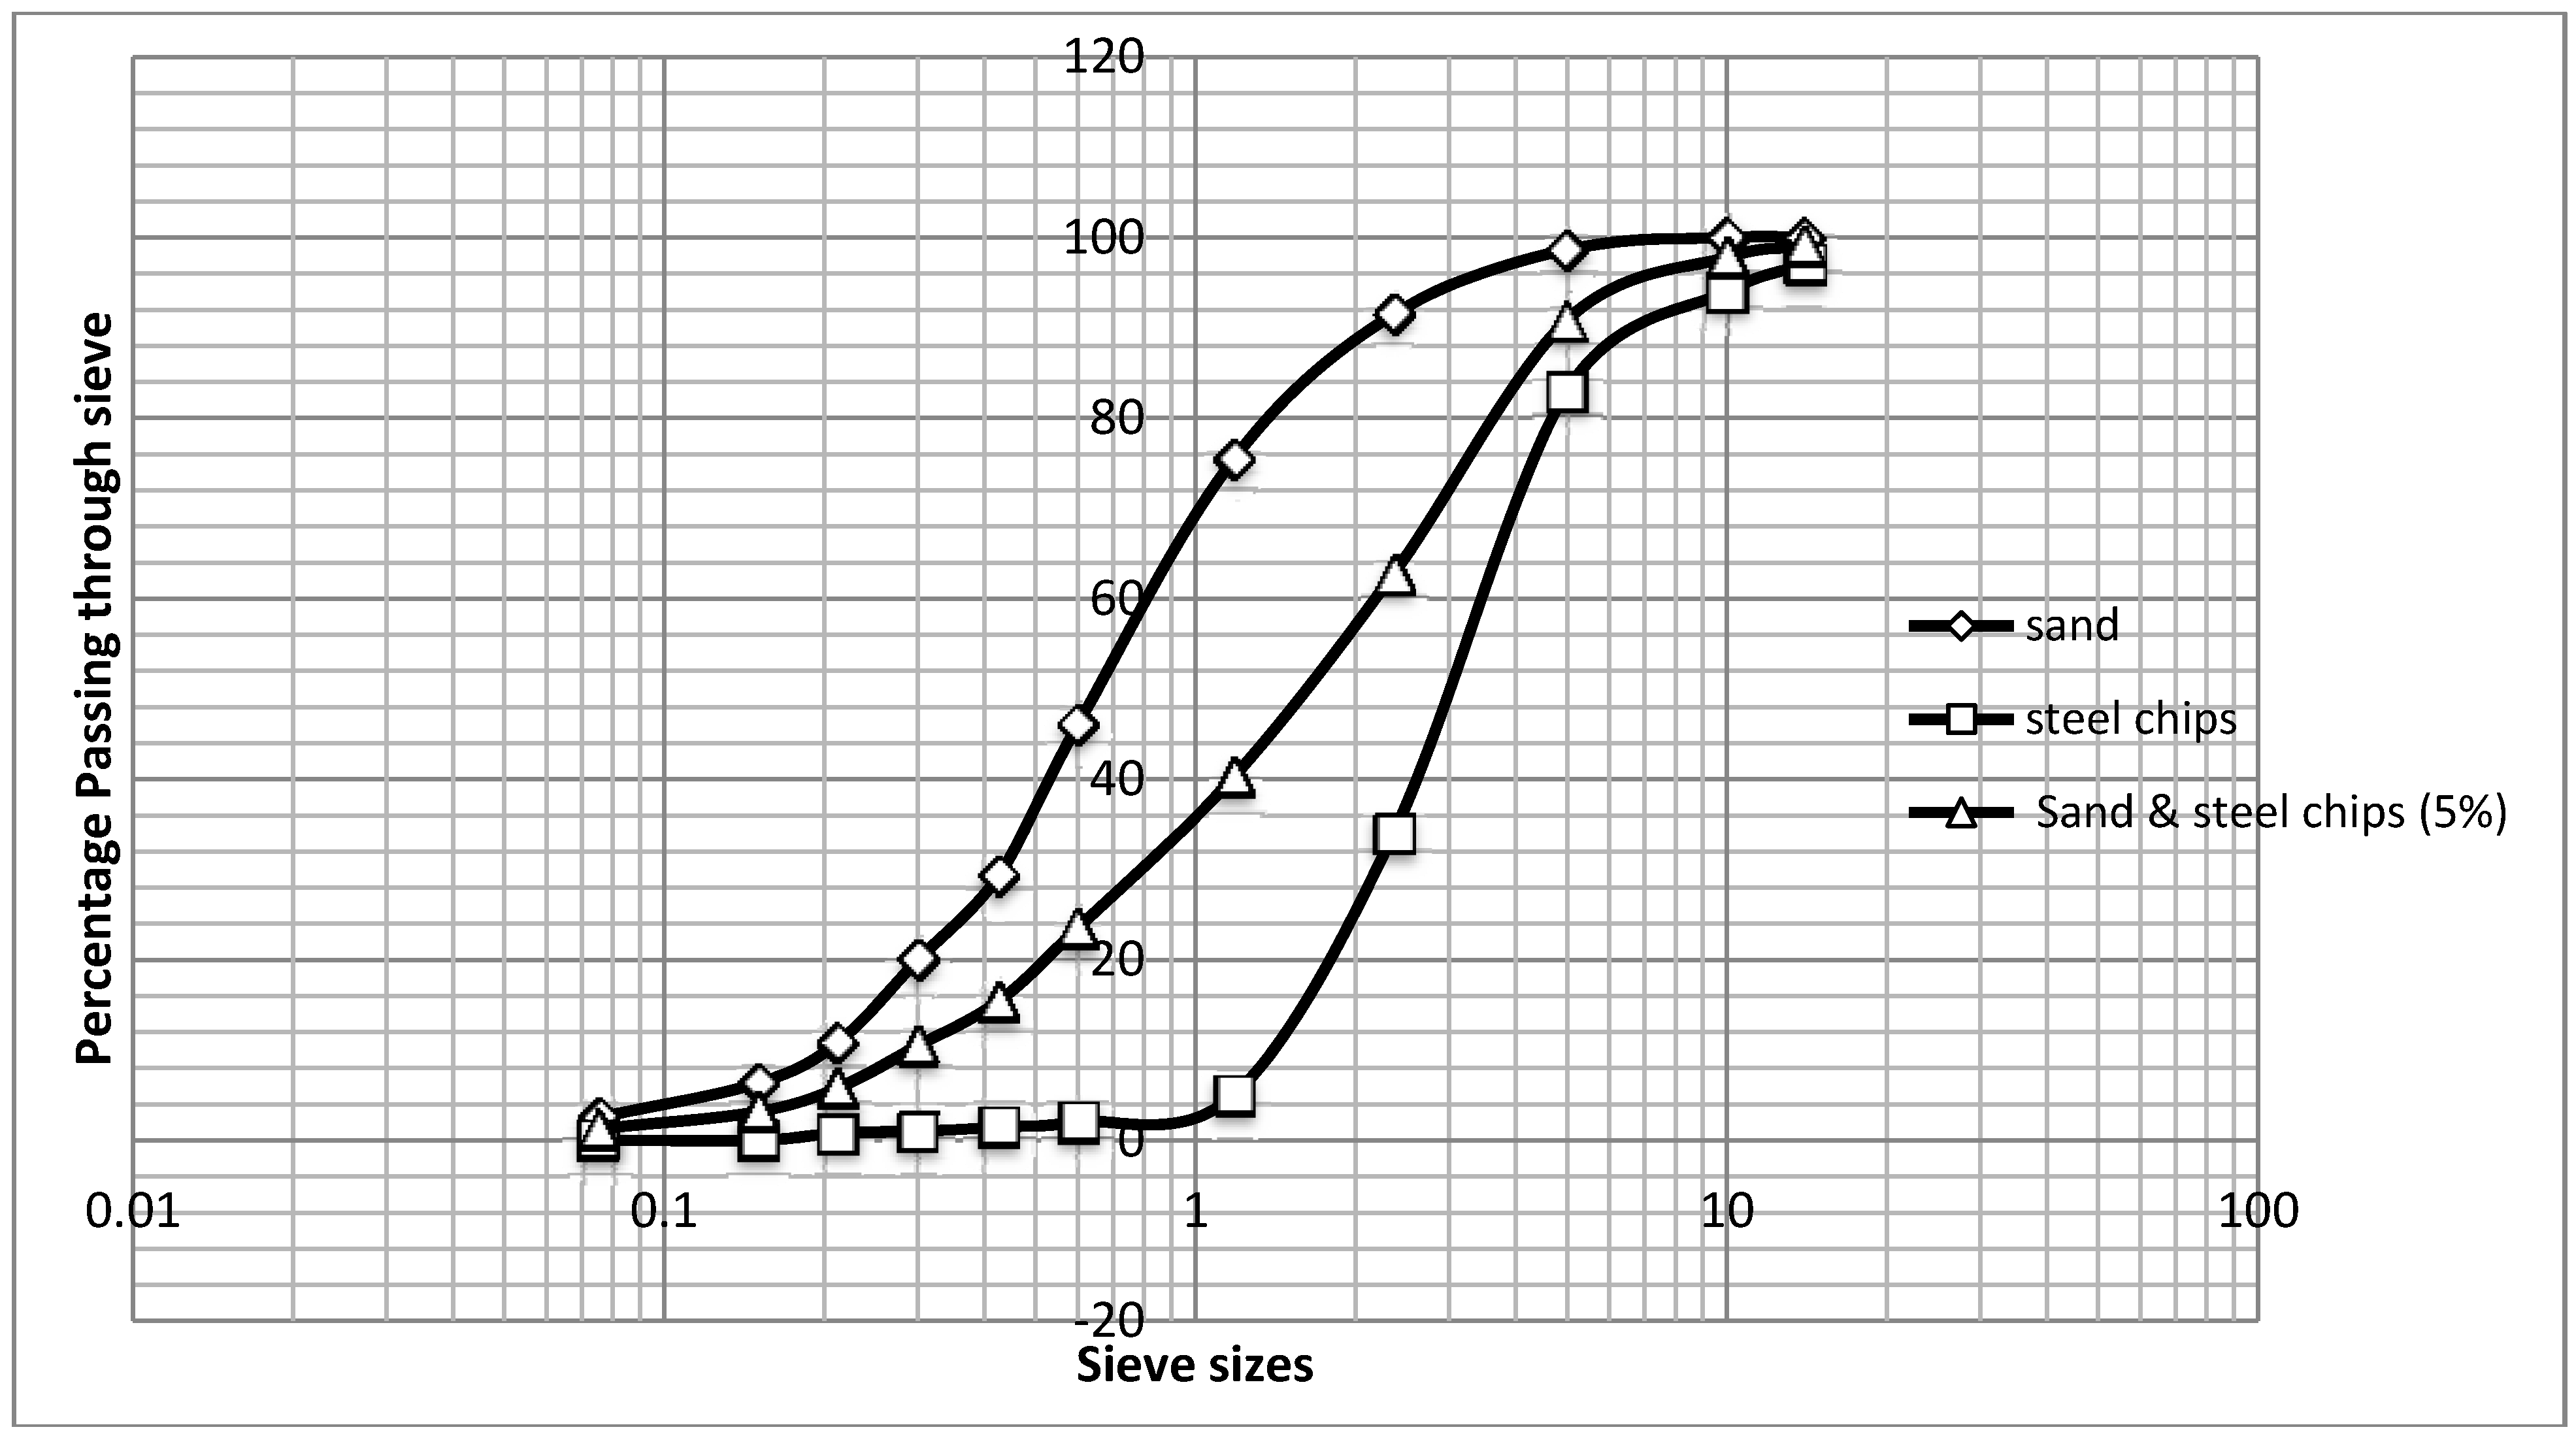
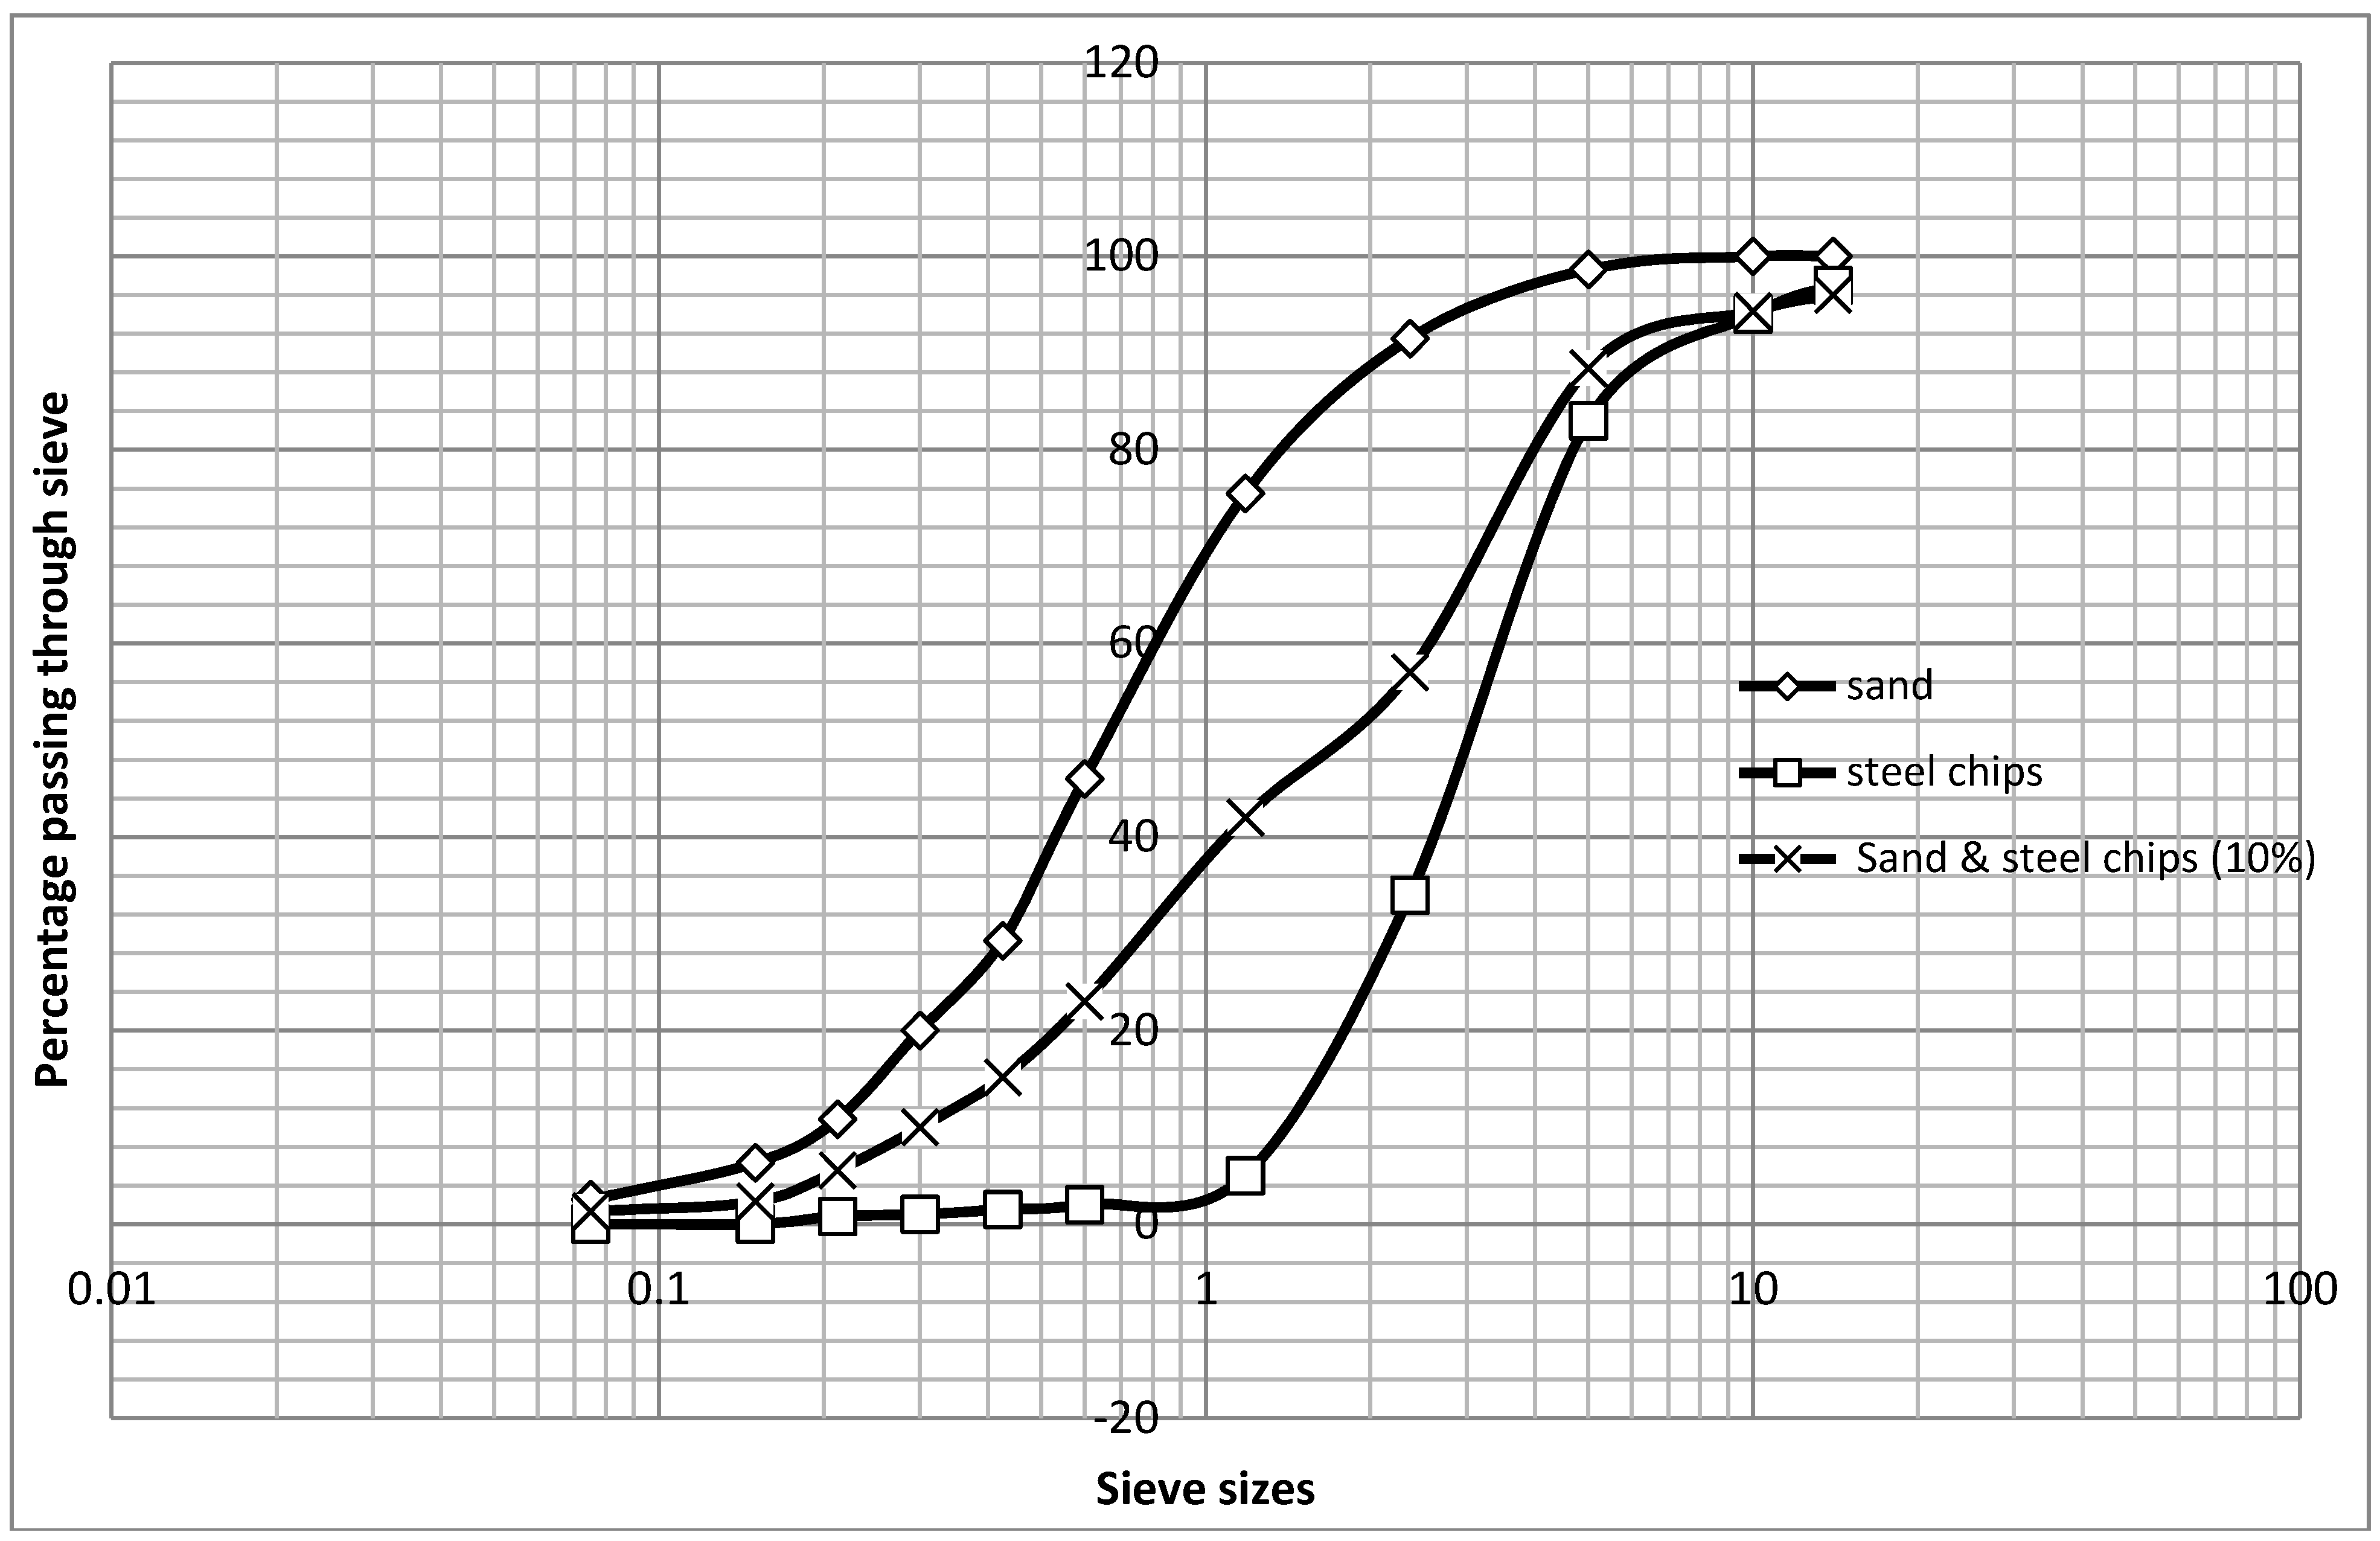
Ideally, the particle size distribution (variation in aggregate sizes) should be such that the finer particles fit into the spaces between the large particles leaving a minimum percentage of voids to be filled by the matrix in cementing the whole mass together. These voids—wherever they exist—are potential failure zones within the unit sample. The particle size distribution test (
i.e., sieve analysis) carried out to ascertain the grading parameters of each of these aggregates showed that the combination of sand and 5% steel chips was the best in comparison to the others during the first phase investigation (see
Table 5 above,
Figure 1,
Figure 2,
Figure 3,
Figure 4,
Figure 5). Generally, the grading performance (particle size distribution) of each of these combinations corresponded to their relative positions or performance during the compressive strength test. A sample of fine aggregate in grading zone one, implies sand with large particles, and the tendency for lower workability due to a slight reduction in the range of intermediate particles that could enhance bonding or dense packing. Arguably however, the larger the particle sizes the higher the specific surface area of these particles. This therefore means more particle contact area with the bonding or cementious material. Superficially, this appears to favor bonding. But there is a high tendency for the mix to become sticky and difficult to finish due to the reduction in intermediate particles [
19]. A sticky mix is slightly difficult for placing and this impacts on its workability. This type of mix requires greater compaction to be effective. In view of the increase in numbers of voids within the mix matrix, if not addressed via the compaction process, these can significantly affect the compressive strength and finishing quality of the mix. On the other hand, finer sands lead to an increase in the water/cement ratio for a given workability, which in turn reduces the compressive strength. But the amount of water used in this investigation was fixed and a function of the difference between the optimum moisture content and the moisture content of the sand. So the likely variations of water/cement ratio due to the grading zone of the sand were not the subject of this investigation. However, the tendency for high compaction could have impacted on the compressive strength as all samples were subjected to a 20-second vibration time. Thus, strength can be partly related to the grading of sands. It is partly related because several other factors outside constituent materials affect strength
i.e., method of preparation, curing, and test conditions [
3,
13,
17,
20]. However, the coefficient of uniformity (C
U) grading parameter for 15% steel chip and sand combination is “7” (an indication of a greater range of particle size in sand). But the coefficient of curvature (C
C ) which defines the possibility of a dense packing was “0.8”. This value falls short of the range for well-graded soil (1≤ C
C ≤ 3). Thus, the tendency for dense packing in the 15% steel chip and sand combination was lowest in this investigation (see
Table 5).
It is also notable that the steel chip sandcrete hollow blocks achieved an average compressive strength of 5.44 N/mm2 with a 5% steel chip and sand combination. These samples were also able to achieve 58.6% and 66.9% strength value at the 7- and 14-day crushing tests respectively.
Of particular interest was the wet compressive strength at the 14-day test. These results were within the range of 49% to 56%, less than their dry compressive strength values (see
Table 4). This comparison was necessary in view of the prevalent exposure conditions these blocks might be subjected to in the future, for example, if subjected to natural flooding. Information such as this would assist developers or builders in how to use these blocks in particular in the riverine areas and water-logged soils. It should also be noted that blocks used for external cladding and boundary walls, which are subject to driving rain or water-logged soil, are either partially of fully soaked with water. This could affect their compressive strength and this was why the wet compressive strength of the blocks after soaking in water for 14 days was determined [
4].
Having seen and understood the compressive strength profiles for the sandcrete blocks and cubes samples with steel chips obtained during the first phase investigation, it became very important to ascertain the range or likely value of the steel chips for optimum compressive strengths for the blocks and cubes. This is to enhance the utility value of these products and in essence forms the crux of this investigation. As stated previously, lower proportions of added steel chips (1%, 2%, 3% and 4%) to the sandcrete mix were investigated in this regard. Surprisingly, the results obtained revealed that the compressive strength produced at 4% added steel chips were slightly higher than that of 5%, earlier verified in the first phase investigation (see
Figure 6,
Figure 7 above). However what was also significant was the fact that at 3% added steel chips compressive strength was lower than that of 4% and 1% added steel chips produced compressive strength values lower than that of 3%.
Therefore, the position of the optimum compressive strength values on the combined profile of both the first and second phase investigations (showing 0, 1%, 2%, 3%, 4%, 5%, 10%, and 15%) for both sandcrete hollow blocks and cubes is actually positively skewed towards 4% level—or somewhere between 4% and 5% added steel chips to the sandcrete mix (see
Figure 6,
Figure 7 above).

