Article

Challenges in Getting Building Performance Monitoring Tools for Everyday Use: User Experiences with A New Tool

1
Granlund Oy, Malminkaari 21, PL 59, FI-00701 Helsinki, Finland
2
VTT Technical Research Centre of Finland, P.O. Box 1000, FI-02044 VTT, Finland
*
Author to whom correspondence should be addressed.
Buildings 2014, 4(2), 222-243; https://doi.org/10.3390/buildings4020222
Submission received: 27 February 2014 / Revised: 1 April 2014 / Accepted: 21 May 2014 / Published: 27 May 2014
(This article belongs to the Special Issue Building Automation Systems)

Abstract

:
There is a need for building performance monitoring because it is common that buildings do not perform as intended. A number of advanced tools for the purpose have been developed within the last tens of years. However, these tools have not been widely adopted in real use. A new tool presented here utilizes building automation data and transforms the data into a set of performance metrics, and is capable of visualizing building performance from energy, indoor conditions, and HVAC (heating, ventilation and air conditioning) system perspectives. The purpose of this paper is to study the users’ perceptions of the use of tool. The research method was semi-structured interviews. Although the users were satisfied with the solution in general, it was not taken into operative use. The main challenges with the use of the solution were related to accessibility, trust, and management practices. The interviewees were struggling to manage with numerous information systems and therefore had problems in finding the solution and authenticating to it. All the interviewees did not fully trust the solution, since they did not entirely understand what the performance metrics meant or because the solution had limitations in assessing building performance. Management practices are needed to support the performance measurement philosophy.

1. Introduction

Several countries have set ambitious goals for greenhouse gas reductions for the coming decades. For example, the European Union is committed to reducing its overall emissions by at least 20% by 2020 and by 80%–95% by 2050 compared with 1990 levels [1]. Buildings account for a third of global carbon emissions [2] and are, therefore, in a central role in reaching the carbon dioxide reduction goals. Various strategies are needed to reduce carbon emissions, such as energy efficiency, renewable energy, and carbon capture and storage. However, especially the energy efficiency measures may have negative effects on the indoor environment. This should be avoided, since indoor environment affects health, productivity, and comfort of the building occupants. Even so, indoor air quality and other quality problems are not uncommon in today’s buildings. On the contrary, it is widely recognized that buildings quite often do not perform as intended (e.g., [3,4,5]). Term performance gap is sometimes used in describing the difference between designed and actual building performance. This is associated with designers’ lack of feedback from built and occupied buildings [6,7]. As the development trend is towards low and zero-energy buildings equipped with new and complex technologies, there is a danger that the performance gap will be even greater.
One approach for improving the quality and performance of buildings is continuous performance monitoring [8]. The approach aims at reducing energy use and improving indoor environmental quality by continuously tracking and analyzing issues mainly related to heating, ventilation, and air-conditioning (HVAC). Several studies, such as [5,9,10], have shown that building performance can be improved with this approach. Essential part of the approach is the tool used for performance monitoring. Since current building automation systems, systems used to manage and control HVAC equipment, have limited data collection, archiving, and visualization capabilities [7,11], there has been a need for more advanced performance monitoring tools. During the years these tools have been developed from the perspectives of fault detection and diagnostics (FDD), commissioning and performance measurement. Despite the significant research work in this area, there are still many issues to be addressed. For instance, although FDD and continuous commissioning tools have been developed for years in research institutes, they have failed to be adopted in the marketplace. On the other hand, there exists numerous commercial performance measurement products but they have focused merely on energy measures. In addition, non-energy measures should be measured to avoid sub-optimization, such as improving energy performance at the expense of indoor conditions.
The study concentrates on evaluating a new solution from the users’ perspective. This is seen to be important since many of the earlier solutions have not gained success on the market.

2. Tools for Building Performance Monitoring

Advanced information systems in building operation and maintenance have concentrated on assessing building and system performance rather than on condition monitoring or prognostics of single equipment. The aim of these tools has been in optimizing building operation, reducing energy costs, and improving indoor environmental quality whereas the prevention of breakdowns, the estimation of the remaining useful life of components and the determination of maximum interval between repairs has not raised interest.

2.1. Categorization of the Tools

The subject of building performance optimization has been approached from different perspectives during the years. As a result of this, there are various names for the tools used to optimize building performance. Scholars have also described and categorized the tools in different manners.
One of the terms used in this context is fault detection and diagnostics (FDD). Much of the research and development work in this field was conducted during the 1990s in two International Energy Agency (IEA) initiated annexes, Annex 25 and Annex 34. The FDD tools are often divided into manual and automated tools. Manual tools only assist in fault detection and diagnosis and the identification of the abnormal behavior and the localization of the fault are left to the user of the tool. Automated tools, on the other hand, use software to automate the different steps of fault detection and diagnostics. However, the distinction between manual and automated FDD tools is not always straightforward, since tools have various levels of automation in their data collection, processing, and diagnostics procedures [12].
Another approach to the subject is building commissioning. Many commissioning tools were developed in Annexes 40 and 47 during the years 2001‒2009. Tools exploiting metering and trending software for continuous tracking and performance monitoring were called as continuous, monitoring based or ongoing commissioning tools. Many of the tools developed in Annexes 40 and 47 were the same that were introduced during the Annexes 25 and 34 [13].
Performance monitoring is also a term used in describing tools similar to the ones presented above. Brambley et al. [11] define performance monitoring as “a process of continuous measurement to support building energy analysis and control”. They also state that performance monitoring tools are intended for manual or visual analysis, in contrast to automated fault detection and diagnostic tools that provide a notification when a fault occurs. Thus, there is analogy with this definition and the definition of manual FDD tools.
In addition, these tools are sometimes referred as Energy Information Systems (EIS). EIS are software, data acquisition hardware and communication systems that collect, analyze, and display building information to aid in reducing energy use and costs in buildings [14]. EIS typically process energy consumption data and therefore concentrate on analyzing the energy performance of the building. Some EIS offer building level anomaly detection but automated FDD functionalities are not common on the lower levels of energy metering [15].
Furthermore, information dashboard is one of the terms related to building performance visualization. Few [16] describes information dashboards as single-screen displays presenting the most important information people need to do a job illustrated in a way that allows the users to monitor what’s going on in an instant. Usually information dashboards are applied in the building sector for displaying energy use figures.
Finally, Lehrer [17] uses the term building visualization products for tools that have been developed primarily to visually display trend data and to enable historical and normative comparison. Many of these tools visualize building energy and water use in various formats providing tailored interfaces for building owners, operators, and occupants. For example, users can choose whether the energy use is displayed in kilowatt hours, costs, or carbon dioxide equivalents. There are noticeable similarities with the products Lehrer [17] refers to and energy information systems and information dashboards. All of them are primarily used for assessing building energy performance.
As described above, several different terms are used in referring to very similar kind of tools. There is some overlap between the tools that the terms refer to, yet there are also differences. Common to all of these tools is that they collect, process, and visualize data using data acquisition and information techniques beyond the standard building automation. Variation can be found in what degree the tools assist users in fault detection and diagnostics. Some tools have automated parts of the FDD process whereas others rely on the knowledgeable tool users. Differences can be found also in the data sources the tools use. Some tools concentrate on energy use data where as others utilize data from a variety of data sources including building automation systems, utility meters, or separate sensors dedicated for this purpose.

2.2. Challenges in Adopting the Tools

Performance monitoring tools that concentrate on visualizing energy consumption data are widely used in the building industry. There exist several guides (e.g., [18,19]) that provide best practices for the use of the tools. However, more advanced tool features such as fault detection and diagnostics are still in its infancy [20,21,22]. There are several reasons for the lack of widespread availability of fault detection and diagnostics tools:
  • Lack of quantified evidence on the benefits of fault detection and diagnostics;
  • Faults in HVAC systems rarely cause considerable economical losses or danger to safety or health;
  • Lack of adequate sensors installed on HVAC systems;
  • The sensitivity and robustness of FDD methods need more investigation;
  • The time and cost of installing a FDD tool can be significant;
  • Intelligent algorithms are often neglected in practice;
  • The benefits of FDD are not realized since sufficient resources may not be available for the use of the FDD tools.
There is only little quantified information available on the benefits of FDD. Possibly due to this, there is lack of demand for FDD tools from building owners and operations and maintenance community [23]. The users of the FDD tools want to be confident that the tools will save them money and therefore more demonstrations in real-buildings and well documented case-studies with savings calculations are needed [24].
Fault detection and diagnostics was first established in the aerospace and nuclear industries, where early identification of small malfunctions would save lives [25]. In other industries, such as process and automotive, unnecessary production line stoppages can cause significant economic losses. However, high reliability and safety are not as important in building operations where processes are less critical. As a consequence of this, FDD has not generated the same level of interest among building researchers, owners, and operators [11].
Typically only a small number of sensors are installed in HVAC systems to keep the system costs low [26]. In addition, the quality (accuracy, precision, and reliability) of the sensors installed can be inadequate [19]. This makes it difficult to develop fault detection and diagnostics methods to HVAC systems.
The detection sensitivity of the methods and occurrence rates for false alarms have not been thoroughly investigated in real buildings [23]. Setting fault thresholds is a challenging task since a balance between sensitivity in detecting faults and robustness in minimizing false alarms must be found [27]. If the threshold is too low, normal variation in the data may trigger false alarm. On the other hand, if the threshold is too high, only the most severe faults will be detected [28]. In addition, many of the present FDD tools are able to detect single faults but fail to detect multiple simultaneous faults [23].
The installation and tuning of a FDD tool may require expert knowledge and can be a time consuming task [24]. For example, a set up time of one week was reported by Smith [29]. Therefore, the cost of setting up a FDD tool can be significant.
A variety of intelligent algorithms and software-based technologies, such as artificial intelligence, pattern recognition, neural networks and fuzzy logic, have been developed in recent decades in order solve complex problems in technical systems [30]. Demonstrations and pilots in this field have shown good results but only few solutions have proceeded to commercial products. These techniques require considerable knowledge to be applied and maintained correctly, necessitating participation by skilled professionals and leading to high design and maintenance costs for the solution. In addition, these solutions are seldom transparent or well understood in field use, which leads to a lack of trust [31].
Often building operators and facility managers have several responsibilities beyond using the FDD tools. If operators and managers are too busy with other duties, such as taking care of occupant complaints, it can be difficult to find time for the use of the FDD tools. In addition to using and analyzing the diagnosis of the tool, resources are required to correct the faults that the tool identified. It is insufficient merely to identify problems and their impacts, but building staff must correct them [11]. The benefits of the FDD tool are not gained until the corrective actions have been taken to fix the faults [12].

3. Method

In this study, the users’ experiences of the use of a performance monitoring and management system (PEMMS) were explored using semi-structured interviews. The PEMMS is in use in three buildings in the Helsinki region in Finland. Two of them are office buildings and one is a commercial building.

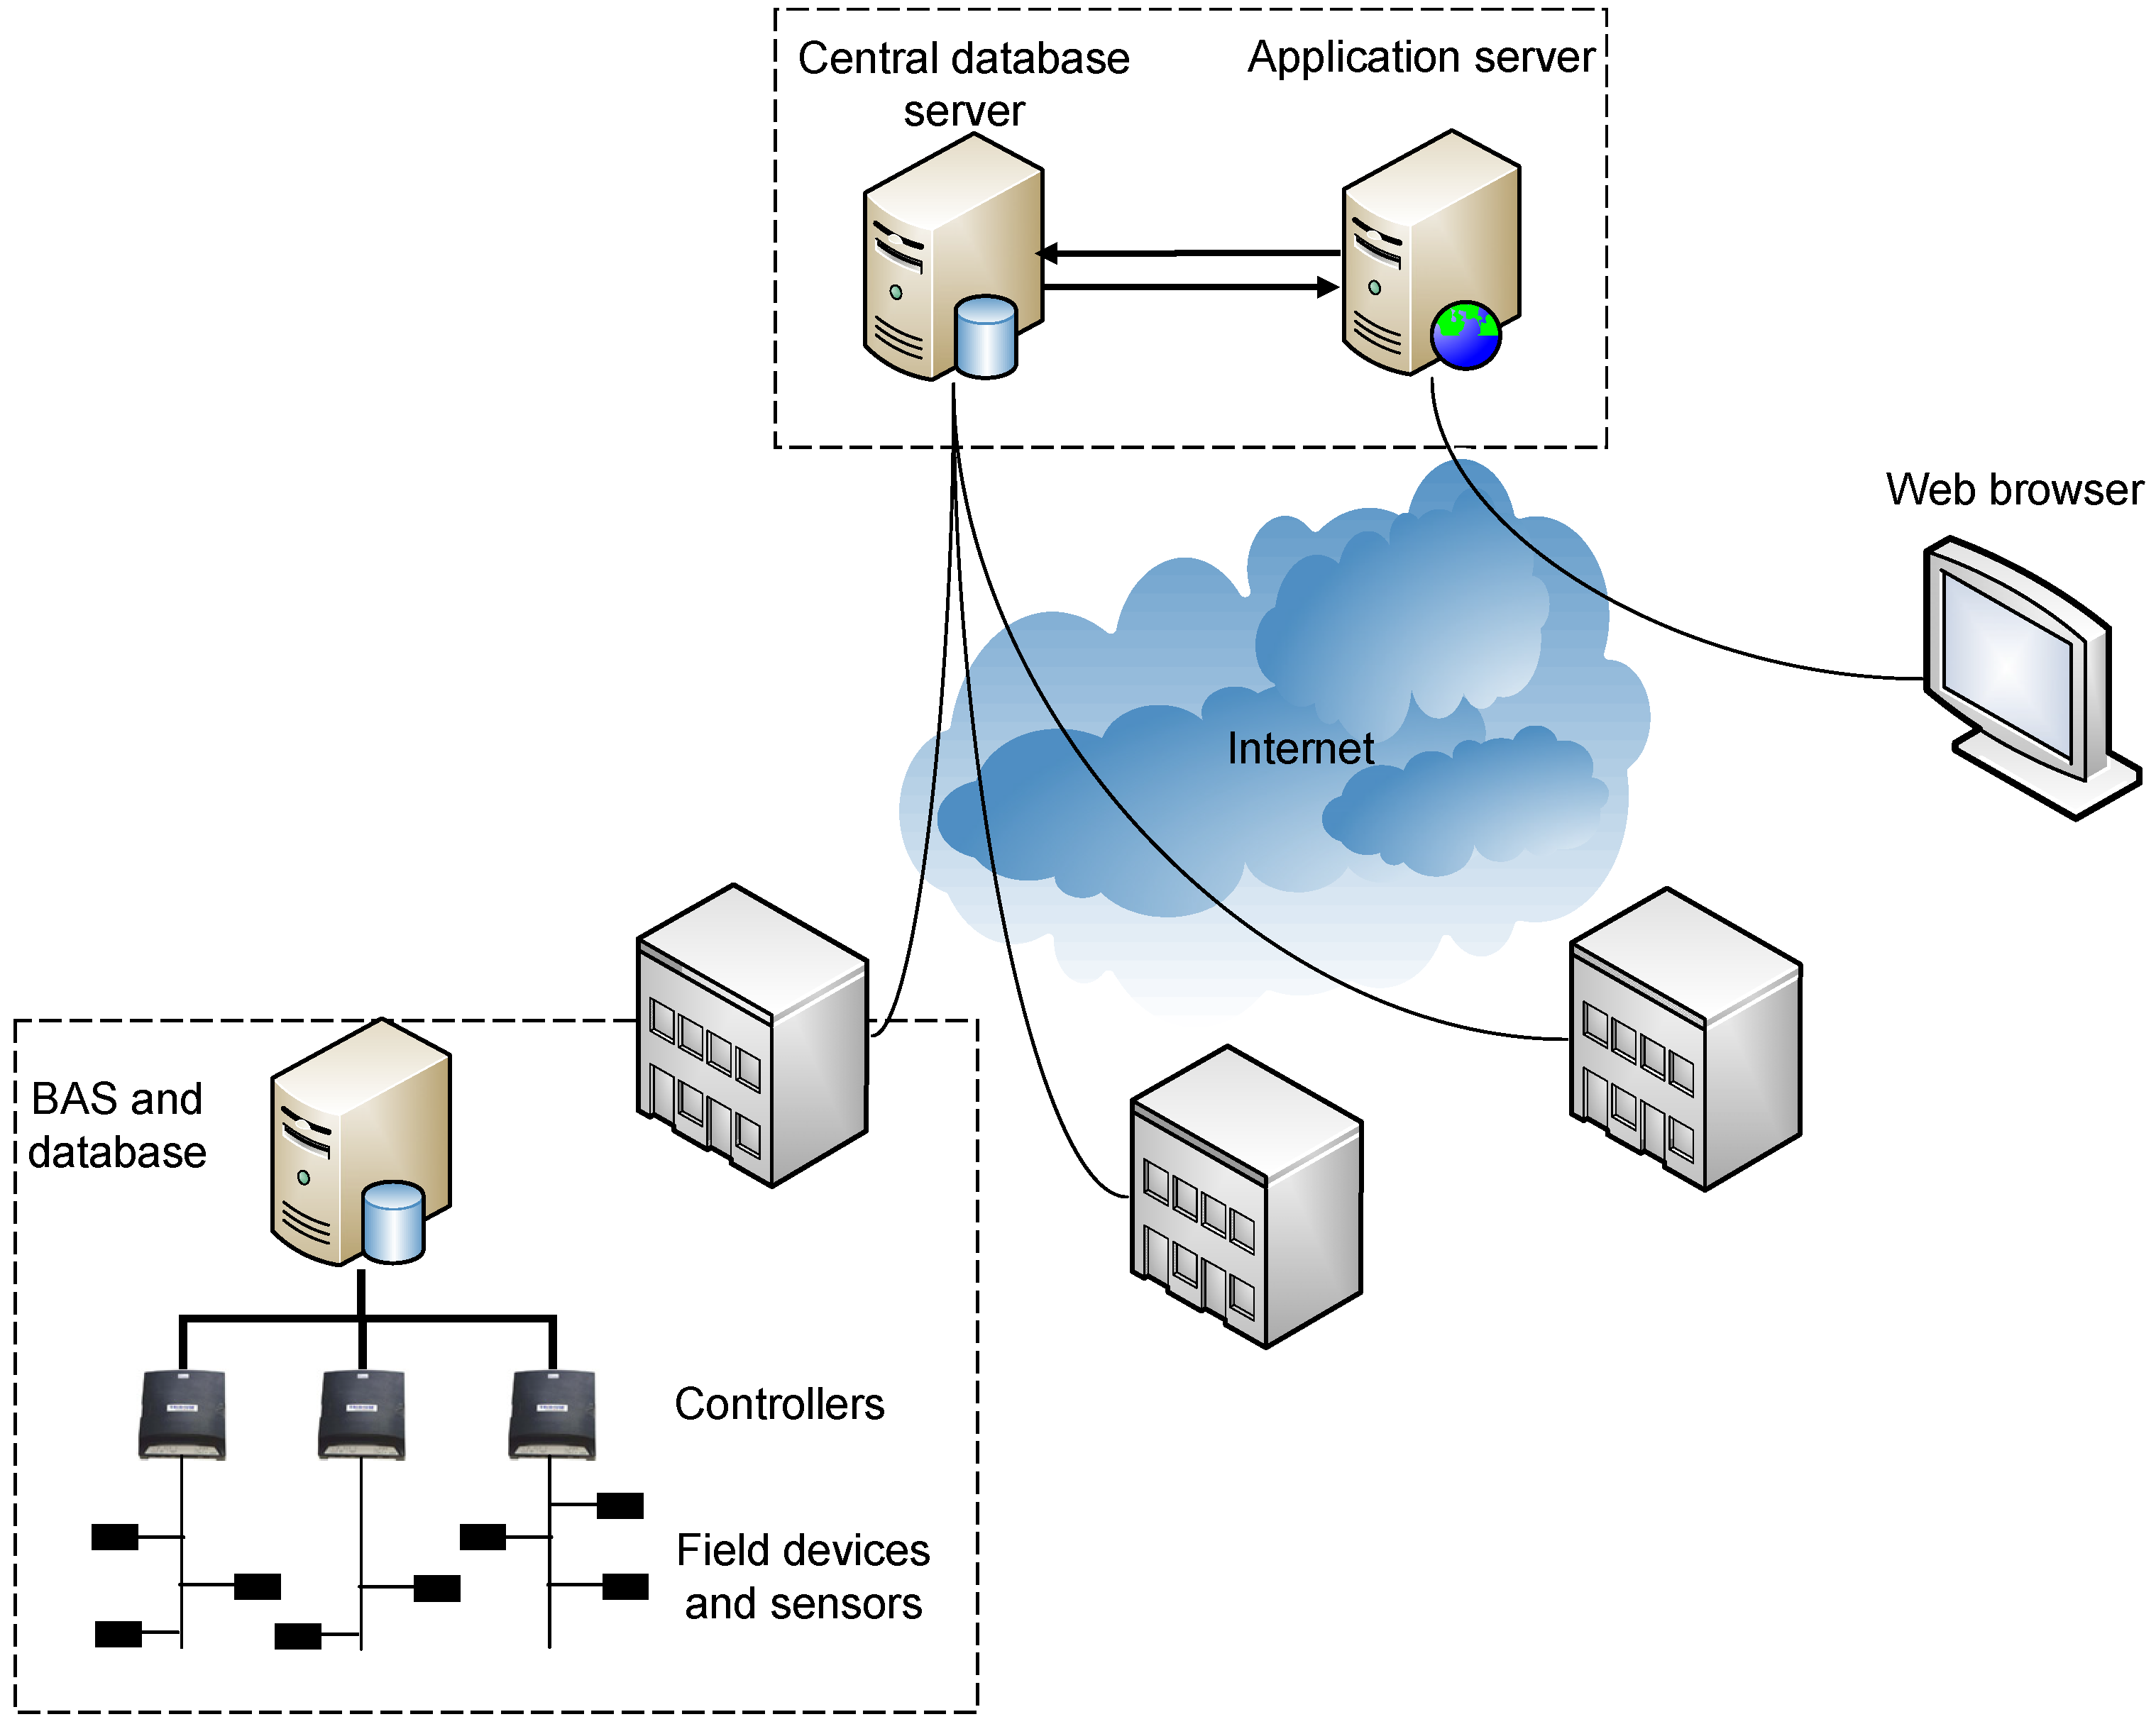
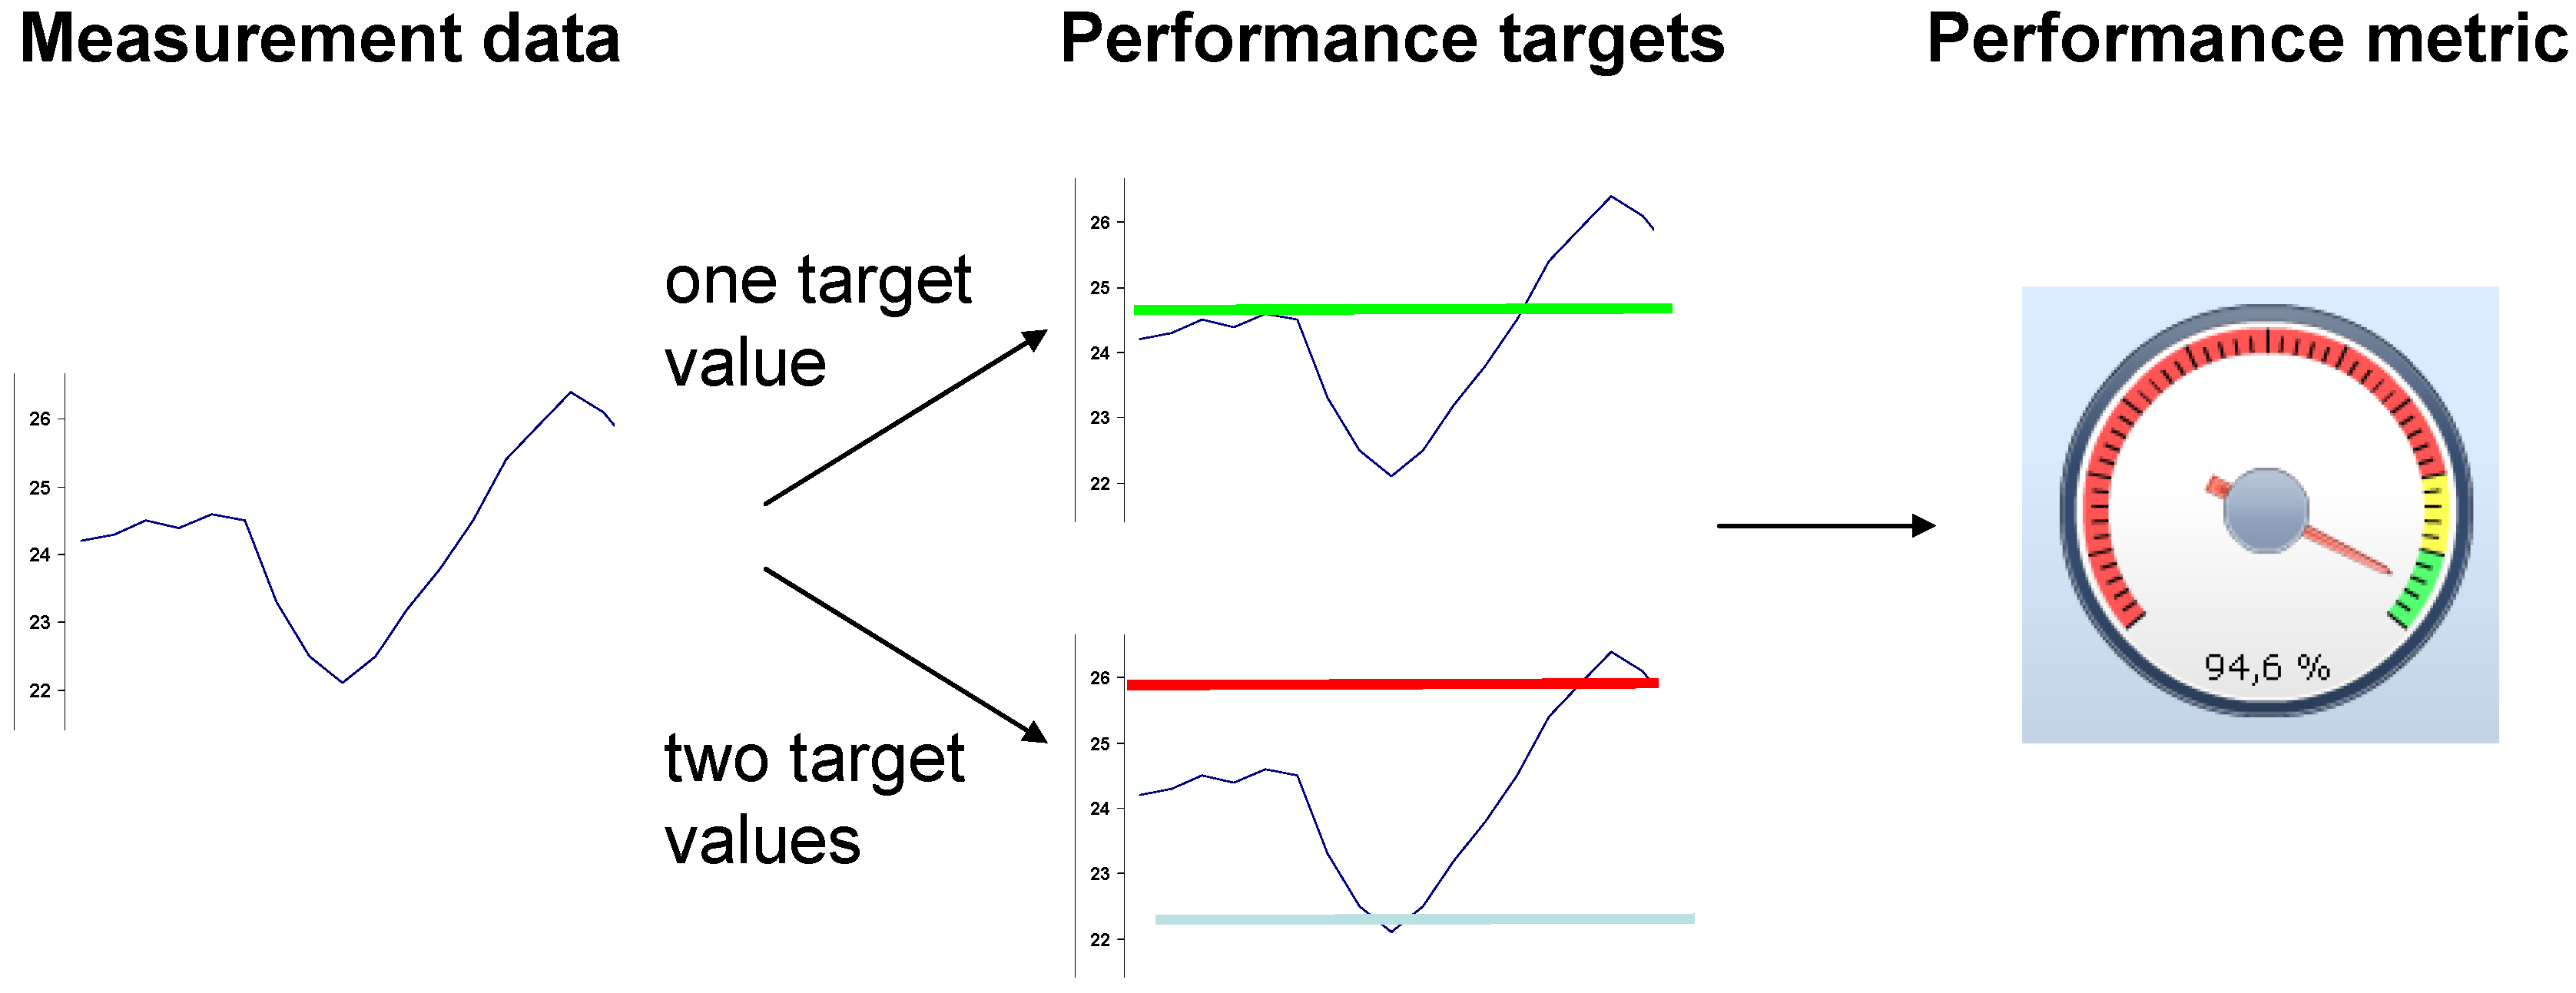
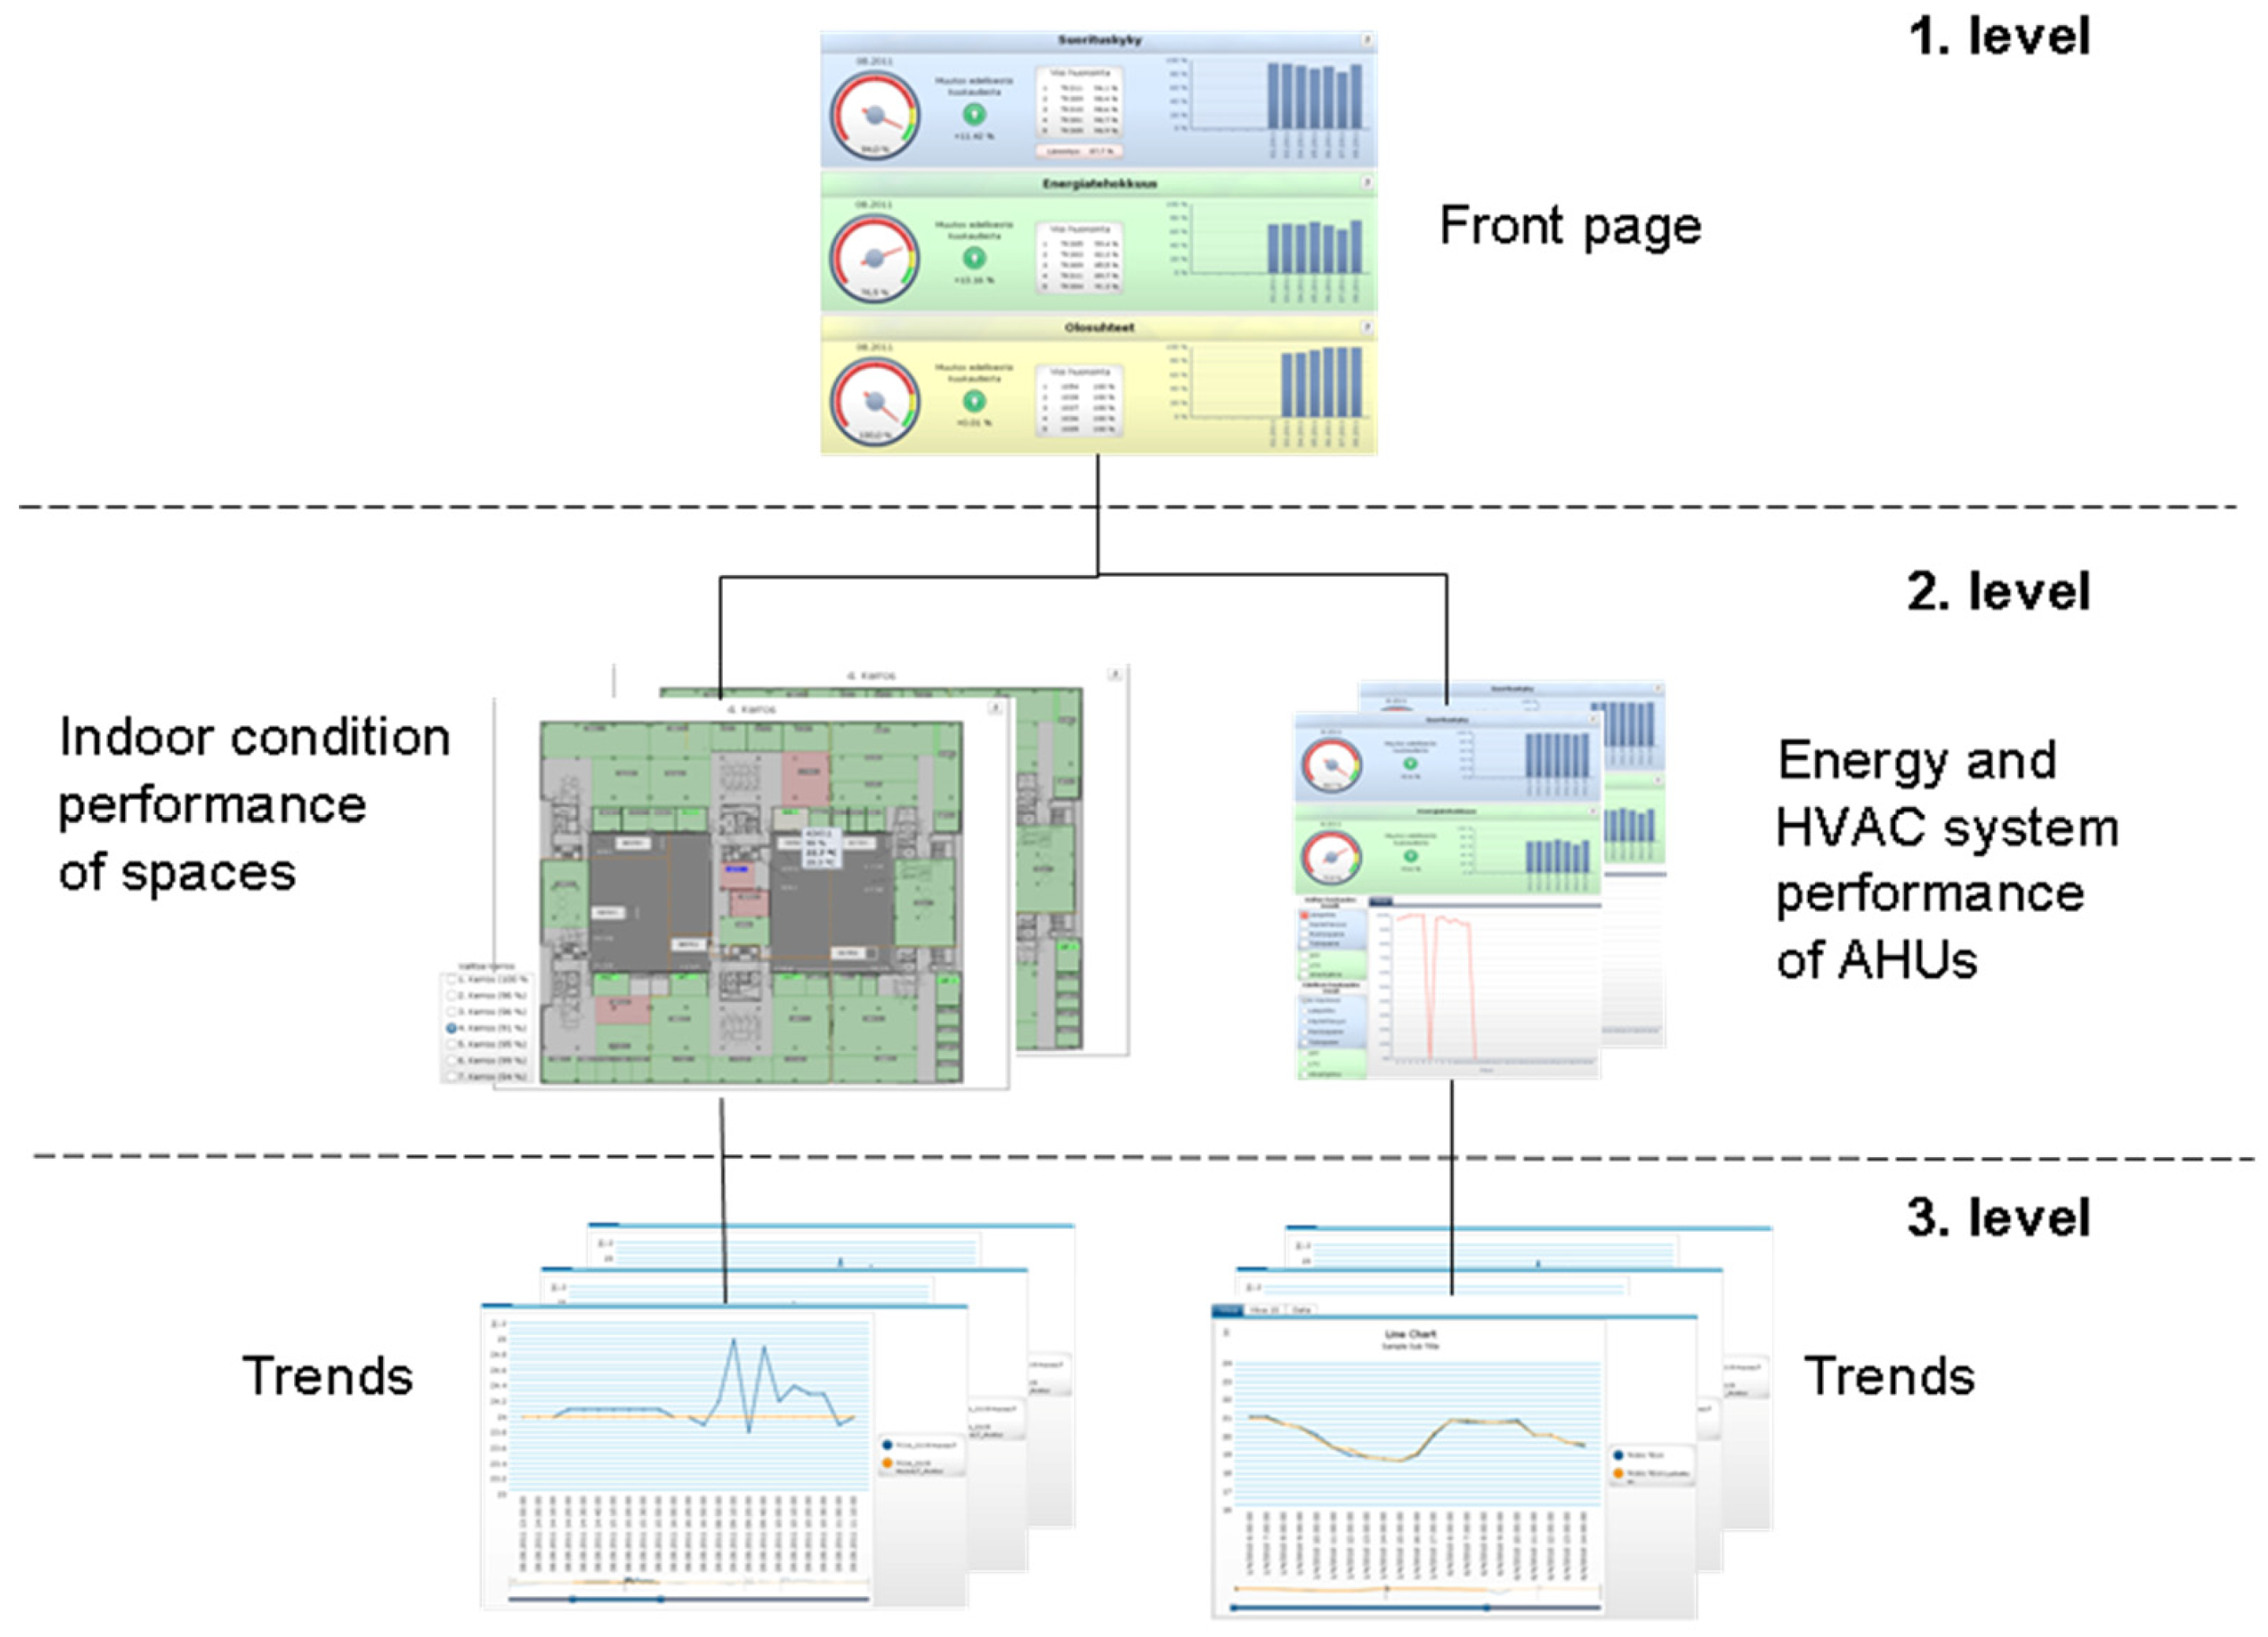
3.1. Performance Monitoring and Management System (PEMMS)

The PEMMS is a new tool developed as part of a larger research effort which was conducted in a Finnish building services company. The research effort aimed at utilizing building automation systems in the development of new services for building operation and maintenance. The first author was responsible of the research project and PEMMS development. The tool turns building automation data into a set of performance metrics which approach building performance from three perspectives: energy, indoor conditions and HVAC system performance. The system provides high-level performance reports which enable the overall building performance to be assessed at a glance. In addition, the system offers information that is detailed enough to help the user in finding the causes of degraded performance. As the name of the PEMMS suggests, it is intended to be utilized in both building performance management and performance monitoring.
The system architecture of PEMMS is shown in Figure 1. PEMMS uses a building automation system to collect and store data points at a 10-min interval. The data is first saved as trend logs in controllers and then collected to a database server located in the building for long-term storage. This server is connected through internet to a central server that polls and stores data from several buildings. Finally, the data is transferred to another server which includes an application to visualize the data in performance metrics on a web page. The calculations needed to transform building automation data into performance metrics are performed in the controllers, the database located in the building, as well as by the visualization application. The system is constructed by using hardware and software platforms already available on the market. The key components of the system are Tridium Niagara automation and integration products and SAP Crystal Dashboard Design business intelligence software.
Figure 1. PEMMS architecture.
Buildings 04 00222 g001
The front page of the PEMMS gives a holistic view of building’s performance as shown in Figure 2. The idea of the front page is to provide a fast and intuitive picture of the current and past performance. The performance metrics provided by the PEMMS can be accessed by a regular web browser. In addition to an internet connection, the user is required to have a username and a password to login to the system.
The percentage values presented in the front page describe the performance of the whole building. The energy and HVAC system metrics are calculated for all AHUs (air handling units) linked to the PEMMS and the percentage value shown in the front page is calculated as an average value of these AHU metrics. Similarly, the indoor conditions metric is calculated for all spaces linked to the PEMMS and the front page percentage presents the average value of these space-specific indoor conditions metrics. Gauges in the front page are used to present the current state (the performance of the ongoing month) of each performance category. On the right side of the gauges, the current state is compared to the performance of the previous month. The five currently worst performing AHUs and spaces are presented in the middle of the page and the performance history of twelve previous months is illustrated on the right side of the page.
Building automation data is transformed into performance metrics by comparing actual measurements with predetermined targets. Each performance target is based on either of the following principles:
  • Target values are generally seen as representing good performance, such as targets derived from building standards or guides;
  • Target values represent good performance for the building or the equipment in question, such as targets presenting optimal operation or targets that can be achieved according to the equipment manufacturer.
Figure 2. Front page of performance monitoring and management system (PEMMS).
Buildings 04 00222 g002
Performance targets can include one or two target values. If there is one target value for the performance metric, the metric is calculated by dividing the actual measurement with the target value. In the case of two target values, the metric is calculated by counting the time during which the actual measurements are inside the minimum and maximum target values and dividing this time with the total measurement time. The results of the divisions are multiplied with 100 to convert metrics into percentage format. The comparison of actual measurements with target values enables performance metrics to be presented in 0%‒100% scale where 100% signifies the best performance possible. The method used in transforming building automation data into performance metrics is summarized in Figure 3.
Figure 3. Methods of transforming automation data into performance metrics.
Buildings 04 00222 g003
The PEMMS offers also drill-down capabilities to view detailed information behind each metric. In addition to the front page, there are two levels of performance reports providing information on metrics and sub-measures of each air handling unit and space as well as on the actual measurement data as illustrated in Figure 4.
Figure 4. Reporting hierarchy.
Buildings 04 00222 g004
On the second level of reporting, the users can view indoor conditions metrics of each space linked to the system on a color coded floor plan where red means poor performance, yellow means satisfactory performance and green means good performance. The indoor conditions metrics are presented as monthly summaries on the floor plan and the users can freely select the month they want to view. On the second level, it is also possible to view energy and HVAC system metrics and sub-measures of each AHU. The actual measurement data, on which the sub-measures and metrics are based, is available on the third level of reporting to be used for in-depth analysis. The data is visualized using time series plots and the users can determine which data points are to be plotted. PEMMS only assists in fault detection and diagnostics by visualizing building data. The localization of faults is left for the system user.

3.2. Qualitative Interview Study

Semi-structured interviews were conducted to get an insight of the users’ experiences and opinions of the PEMMS and especially to gain an in-depth understanding of the challenges associated with use of the system. In the semi-structured interview method, the interviewer has a list of predetermined questions to be asked of the respondents. The predetermined questions only guide the discussion while at the same time giving the opportunity for the interviewer to explore particular themes or responses further [32]. On the other hand, the list of questions ensures that the same basic lines of inquiry are conducted with each interviewee [33]. The predetermined interview questions are shown in Table 1.
Table 1. Predetermined interview questions.
Please tell about your role and responsibilities in the building where the PEMMS is in use.
What information systems associated to building operation and maintenance do you use in your work? How often do you use these systems?
What deficiencies do you see in these systems? What kind of information would you need in your work?
Why did you acquire PEMMS? What kind of expectations did you have for the system? (only presented to persons who participate in the purchase decision making)
Have you participated to the development or the implementation of PEMMS?
In what ways has the implementation/use of PEMMS been supported or motivated?
What did you think about the training and the instructions?
Have you used the PEMMS? How often have you used it? Has the use been mandatory or voluntary?
For what purposes have you used the PEMMS?
What is your overall impression of the PEMMS and satisfaction with the system?
Has the system been useful in your work?
What do you think about the information quality or the user interface of the system?
How would you describe the difficultness or easiness of use of the system?
What kind of changes has there been in working procedures/organizations/management practices?
What kind of benefits has the system provided?
What challenges do you see in the use of the system?
What would you improve in the system?
Do you intend to use the system in the future?
Do you intend to purchase similar kind of systems in the future? (only presented to persons who participate in the purchase decision making)
Background information of all the ten persons participating to the interviews is presented in Table 2. The interviewees are classified into three categories according to their role in the studied buildings: owner, user and service provider. In addition to the role of the interviewee, Table 2 represents information on the respondents’ responsibilities, the time period he or she has had the access to the PEMMS and the building where the respondents worked on. The duration of access is calculated from the time the user has received a username and a password to the PEMMS to the time when the user is interviewed.
Table 2. Background information of the interviewees.
No.RoleOccupationDuration of accessBuilding
1OwnerHVAC specialist39 weeksOffice building 1
2Owner/userHead of corporate real estate management6 weeksOffice building 2
3Owner/userFacility manager6 weeksOffice building 2
4Service providerFacility manager30 weeksCommercial building
5Service providerCustomer service manager29 weeksCommercial building
6Service providerCustomer service manager29 weeksCommercial building
7Service providerEnergy consultant8 weeksOffice building 2
8Service providerEnergy consultant7 weeksOffice building 2
9Service providerService man6 weeksOffice building 2
10Service providerService man4 weeksOffice building 2
The interviews took place at each of the interviewees’ workplace and they were held in Finnish and lasted from 30 min to two hours. The intention was to organize the interviews so that the interviewees would have the possibility to use the PEMMS during the discussions. The aim with this was to remind the user of the capabilities and challenges of the system as well to provide the interviewer with the possibility to observe the use of the system. The PEMMS was available in nine of the ten interviews. At the beginning of the interviews, the interviewees were informed about the purpose of the study as well as the anonymity and the confidentiality practices. All the interviews were tape recorded and field notes were taken during the discussions to ease the data analysis. All the interviews were conducted by the first author of the paper between May and July 2011.
The interviews were analyzed using content analysis to identify emerging themes from the interview data. The research approach used in the analysis was abductive, meaning that the analysis was a continuous interplay between the theory and the empirical data. Thus, the findings were based on both prior theory and the empirical research. The data analysis started with reviewing the field notes several times to develop an initial coding scheme. The coding was used to identify themes arising from the interview data. The emerging themes that were not discussed in the state of the art review led to search for new theories supporting these findings. Finally, the identified themes were grouped under four categories: (1) implementation of the system; (2) frequency and purpose of use; (3) positive experiences; and (4) challenges and proposals for improvement. This categorization formed the basis for presenting the interview results. Direct quotations were used in reporting the results to provide sufficient descriptions of the phenomena.

4. Results

4.1. Implementation of the System

During the implementation of the PEMMS, approximately one hour training session to the use of the system was organized in each of the three buildings. All the interviewees, apart from one, had participated this session. The training included an introduction to the system and an outline of the system features and capabilities. After the session, usernames and passwords were sent to the users by email so that they could familiarize themselves with the system. Most of the interviewees thought that this kind of short introduction to the system use was sufficient and that the best way to learn is by doing.
“In my opinion the training was sufficient at this point … you cannot learn so much at one time … it is easier if you familiarize yourself with the system, then you can ask more and understand better what it is about.”
“I thought that it (the training) was good … it is good that the training is short so that too much information is not given … usually you learn by doing … I believe that everyone can figure out themselves how the system works in detail.”
“The system is extremely clear. The only thing that is needed is to go through what the terms mean.”
However, two interviewees would have also wanted written training materials, such as instructions, manuals or handouts. As the other of them stated:
“… some kind of manual, what the system enables and how you find it. You cannot remember everything after the training.”
In addition to the system training, no other organizational support was mentioned during the interviews. Neither had any of the interviewees participated in the development of the PEMMS.

4.2. Frequency and Purpose of Use

All the interviewees had used the PEMMS for one to three times, i.e., none of them had used it on a daily or weekly basis. The use of the system was voluntary. The following words were used in describing the system usage:
“I have only tested it (the PEMMS) for few times”
“I have just familiarized myself with it (the PEMMS).”
In one of the buildings where the PEMMS had been in use for only a short time (the interviewees had received the access to the system for four to eight weeks before the interview), the aim was to test the system for a short period and then make decisions on how the system will be utilized in the future. However, in the other two buildings where the PEMMS was introduced several months ago (the interviewees had received the access to the system for 29 to 39 weeks before the interview), the system had remained in test use and was not taken into operative use.
During the use of the system, few abnormal performance values had been noticed. However, no actions had been made to find out what were the causes for these anomalies. For example, one of the interviewees said:
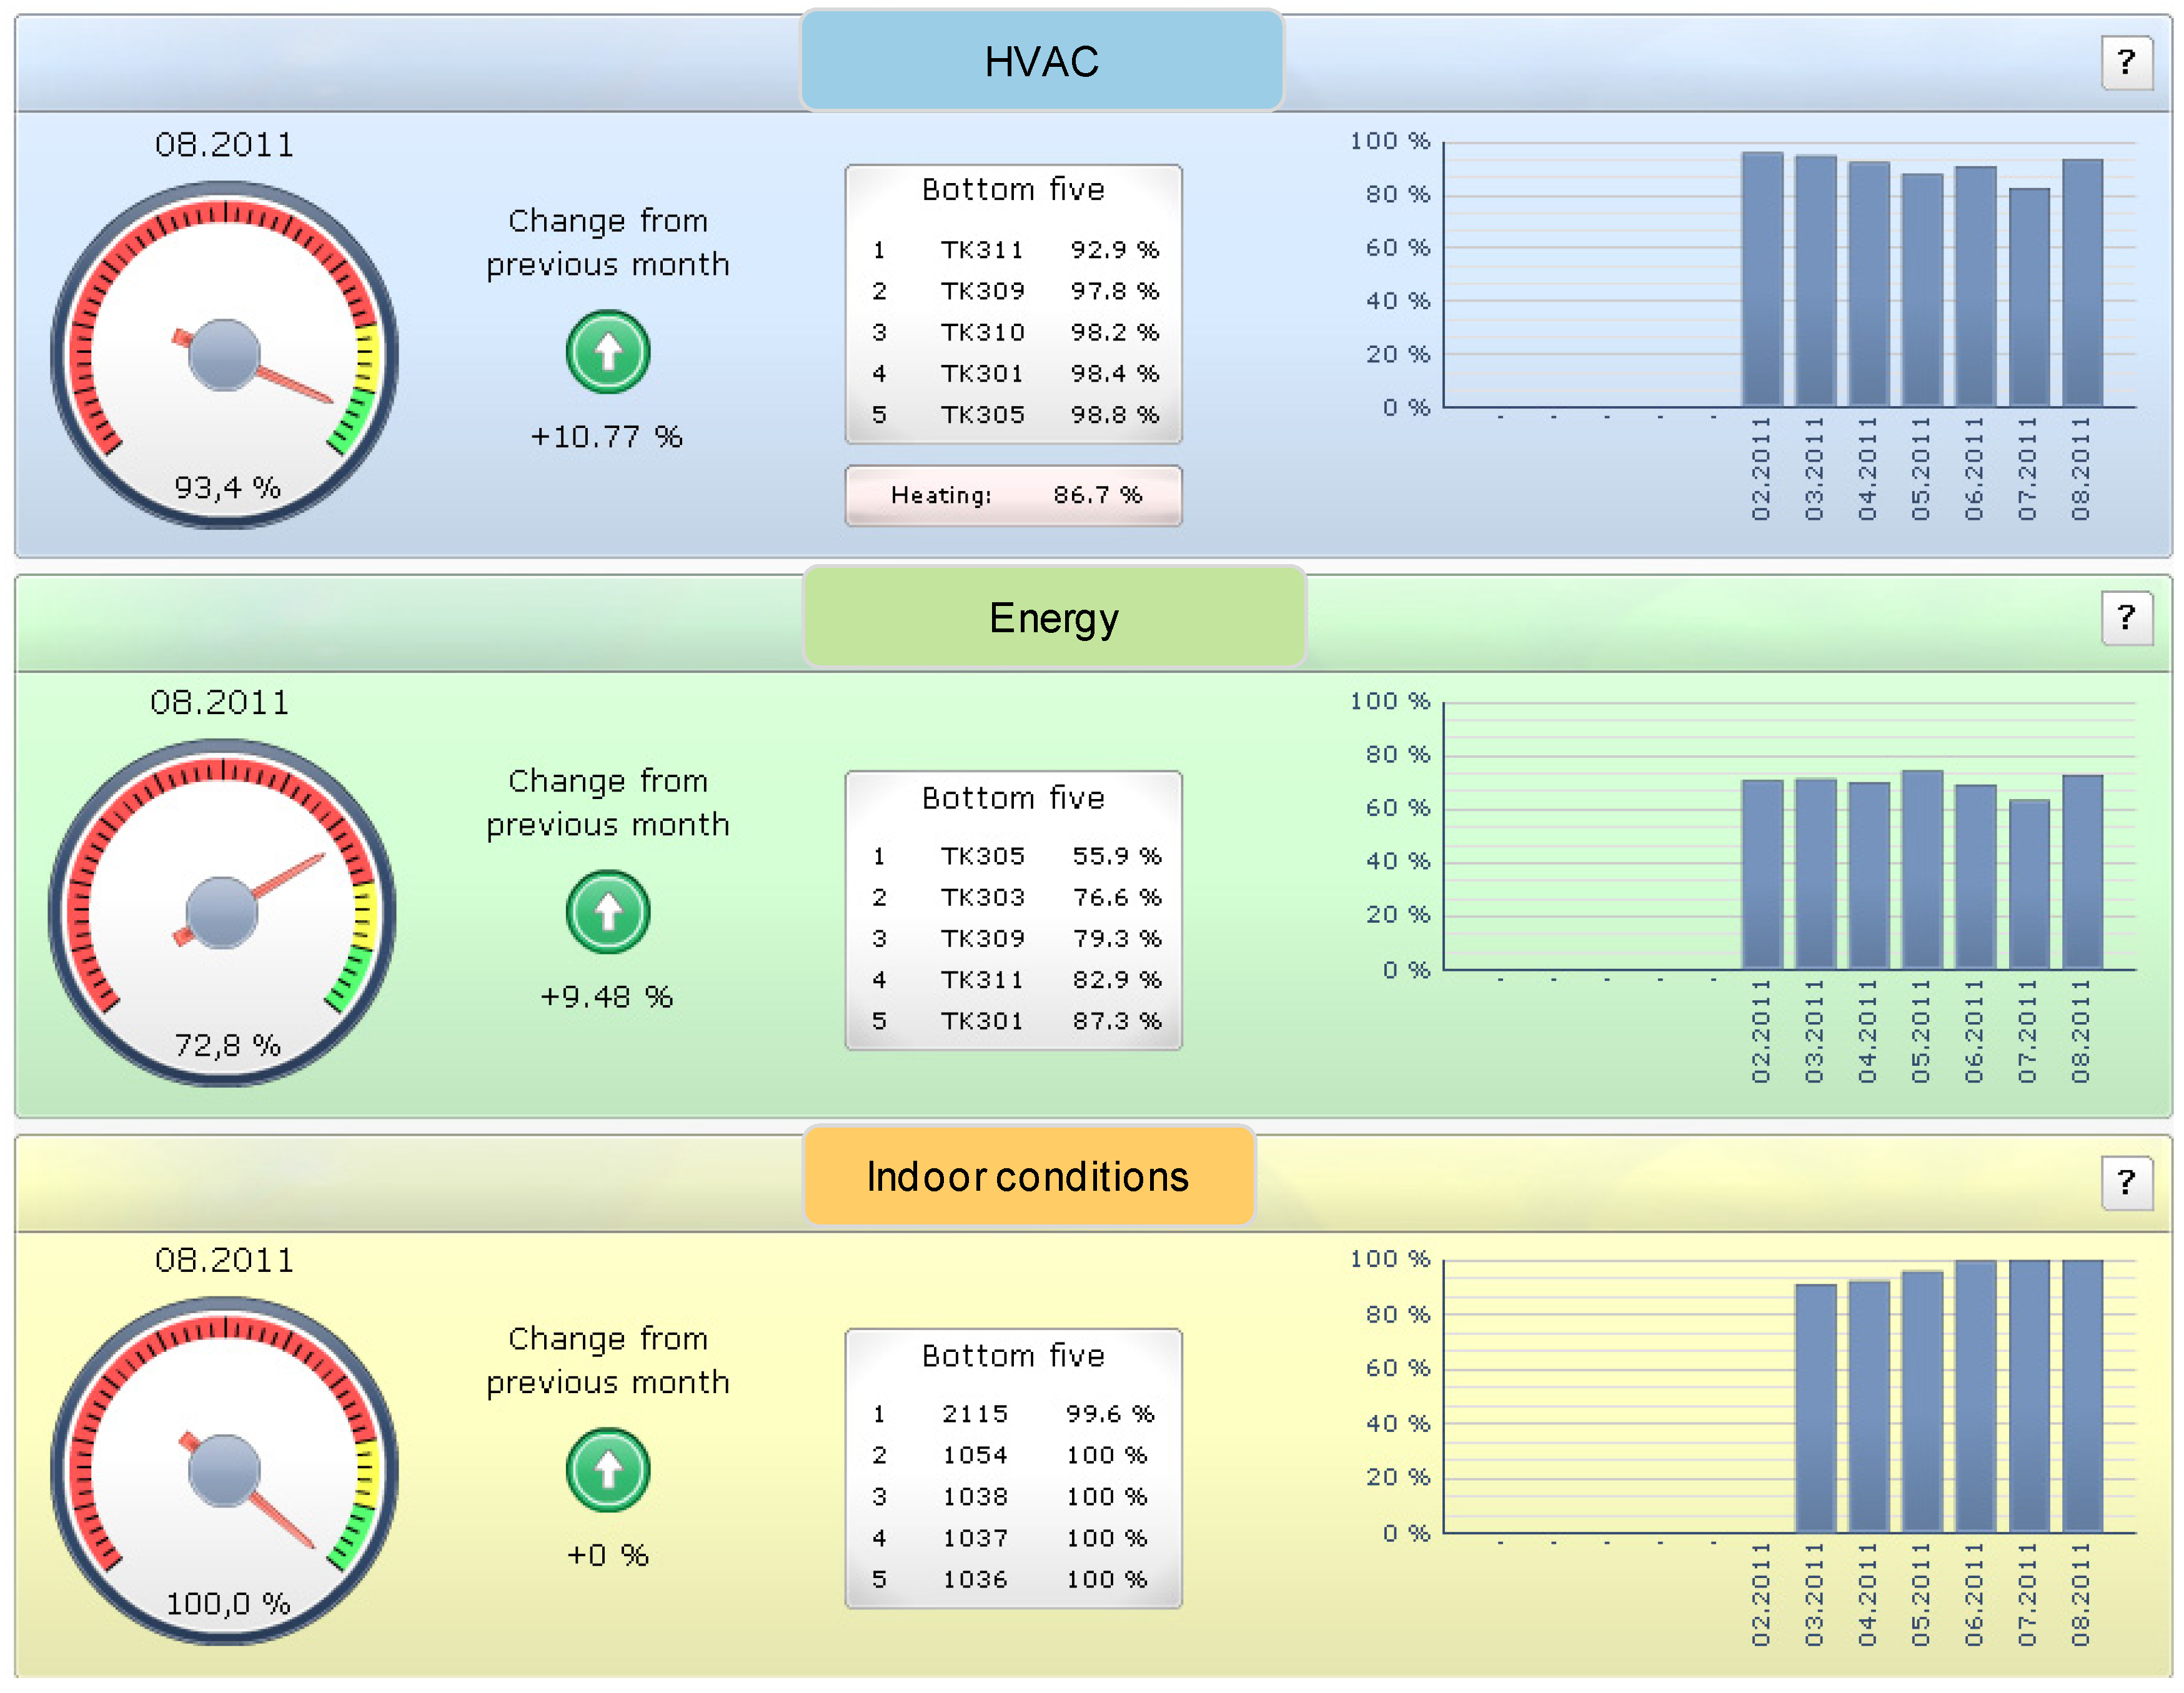
“I viewed the HVAC performance metrics, why is there good and poor air handling units. I took a glance at the spaces as well, how they are performing. It gave me good information. It was quite warm in there … the reason is not known … it has not yet been sorted out. It would require going to the site.”
As the use of the system was limited to testing, no actual benefits were gained with the help of the system. No faults were corrected or energy efficiency or indoor conditions improved.
Observations during the interviews supported that the PEMMS had been used only for few times by the interviewees. Most of the users did not fully remember where each report was located or what would happen when pressing on some of the icons. The two interviewed energy consultants made an exception to this. Although the consultants had used the PEMMS two or three times, they used the system in a routine manner. Both of them had even found performance metric calculation errors which had not been noticed by the system developers.
All the interviewees believed that they would use the PEMMS in the future. However, it was not clear how often they would use it. Two of the interviewees said that they will probably use the system one or twice a month whereas the others stated something more undefined and could not specify more clearly the future use. As one of the latter ones answered:
“I suppose I will use it … I have a link to it on my computer. From there I can find it.”
Four of the interviewees were in a position to make investment decisions and to them the last question “Do you intend to purchase similar kind of systems in the future?” was presented. One of the decision makers was so satisfied with the PEMMS that was ready to order the system to other buildings as well. Two other interviewees wanted to gather more experiences with these kinds of systems and one said that he presumably will not invest more in these systems in the future.

4.3. Positive Experiences

The end user feedback concerning the usability of the PEMMS was positive. However, no real usability study was performed. The interviewees told that were satisfied with the system interface and described it as follows:
“In my opinion this makes common sense. You can quickly see if everything is fine and if not then you can search what might be the problem behind it.”
“I think that this is clear this front page. There is no unnecessary information on the front page. You can see certain things at a glance”
“In my opinion this is very easy (to use). And then this is also very clear. This is not too complicated … even a stupid can understand this. You don’t need to be a technical expert to understand this.”
All the interviewees, regardless of their position in the operation and maintenance organization, thought that they could utilize the PEMMS as a part of their work. The interviewees identified that the system provides several capabilities. In their opinion the system could be used for monitoring building performance, optimizing operation, detecting faults before they affect indoor conditions and assessing the impacts of corrective measures on building performance.
“The more there are devices in the building the better this (the PEMMS) services it … when there are large number of devices, it is difficult to see the overall performance ... some things can go unnoticed, there may not be alarms but still the process does not work optimally … this (the PEMMS) definitely assists … you can drill down to see what is wrong.”
“This is a monitoring application.”
“The history information is good. If something is creating problems all the time and if actions are taken to fix it, you can easily see what kind of affect it has on performance … The system provides advantage if you can predict things and you don’t need to hurry only after someone comes to complain. This would be good customer service … This is a tool of the future for maintenance men. It is about predicting things …”

4.4. Challenges and Proposals for Improvement

Many of the PEMMS users stated that they lack time to use the system. In today’s hectic work environment with numerous information systems it can be hard to find time to a new system, such as PEMMS. It was also mentioned that even the existing system are not fully utilized or used at all. For example, one of the interviewees pointed out that:
“The Computerized Maintenance Management Systems are often not updated … all the documents are not included … this is very common.”
On the other hand, it was noted that the lack of time cannot be an obstacle to the use of PEMMS since the system provides a quick overview of the building performance. It takes only few seconds to view the front page of the system to check whether something is wrong with the building.
In order to be used in the hectic work environment, many interviewees suggested that an easier access should be provided to performance metric information. Although the PEMMS can be accessed by a web browser and the front page of the system provides a fast picture of the building performance, the users perceived that the information was not enough easy to obtain. Since the interviewees had only used the system for few times, they had difficulties in remembering the web site address, usernames as well as passwords. The interviewees stated that the performance reports should be accessible from those applications that they would otherwise use in their daily work, such as email or the Computerized Maintenance Management System (CMMS). At least the front page performance metrics should be in these applications so that they could be quickly viewed while performing other work tasks. Another proposal was to receive notifications of poor performance to email to avoid unnecessary logins to the system. Currently the user may login to the system to see that everything is well in the building but by receiving performance alarms the system would only be used in abnormal situations. The idea would be to devote time to the system only in situations when the performance differs from the expected.
“Alarm limits, you would get alarms to email stating that the performance has dropped under 50% or whatever the limit is.”
“The thing that would be needed and would be efficient is reporting once a month to email … is would be handy, you wouldn’t need to login to the system.”
“If the system had an alarm feature … stating that something is wrong now … without login in to the system”
In addition to system access difficulties, some of the interviewees did not fully trust the PEMMS. The performance metric idea was new to the users and they did not entirely understand what the metrics meant and what they could enable.
“I have just familiarized with the system and all these (calculation principles) have not entirely opened up to me.”
“It (the PEMMS) could be useful when you start to understand how the system functions and you begin to trust it.”
Another issue affecting the trust was the system’s limited capability to measure building performance. The PEMMS has several limitations and some of these were also noticed by the interviewees. The limitations that the users identified were associated with indoor condition measurements and inability to take into account exceptional process operating modes. Although the indoor air temperature shown by the automation system or the PEMMS seems to be on a good level, it does not guarantee that the building occupants are satisfied with it.
“The outdoor temperature determines how people perceive indoor conditions … there are those people that think 22 °C is cold … we cannot go and say that this temperature is good.”
“It is not able to interpret all, in all possible way … for example does the night cooling or heating work as suppose to.”
Few proposals were given to improve the interface and the usability of the PEMMS. Most of these were connected to trending. The interviewees commented that this part of the reporting should be made more usable.
“I would see that there is much to improve in the trending features … when I open this trend page, it does not tell me anything … some of the features were such that I did not even notice that something had happened.”
“Then the trending could be more user-friendly … the possibility to display more plots at a time … the x-axis could scale automatically.”
Some new features were suggested to the system during the interviews. They were for example:
“Question marks could include information of the air handling units, such as the size of the unit.”
“Floor plan pictures could show which areas each air handling unit serves.”
“The system was sometimes slow to use. Could it be faster?”
“When you click a trend, could it be opened in another window?”
“Could the indoor air temperature be viewed from energy efficiency perspective in the floor plan reports?”

5. Discussion

5.1. Present Use of the System

The PEMMS was in test use in each of the studied buildings. The idea of presenting building performance as performance metrics was new to the users and they wanted to gain experiences with the system. In one of the buildings where the system was just taken into use, the aim was to test the use of the system and then make decisions on how to utilize it in the future. Thus, it was understandable that the system was not utilized more thoroughly in this case. However, the PEMMS had stayed in test use in the other building as well, although the users had received access to the system for several months.
Despite there were no significant differences in the frequency of use (varied between one to three times), there had probably been differences in the thoroughness of use. For instance, the interviewed energy consultants were able to discover errors in the performance metric calculations, though they had only used the PEMMS for few times.
The users had not utilized the PEMMS more frequently although they were satisfied with the system in general. The users had identified the capabilities of the system and though that the user interface of the system was easy to and use suitable for non-technical users as well. The users had also recognized several useful features in the system, such as the ability see the overall performance of the building at a glance and the possibility drill-down into detailed information if necessary. All the interviewees also thought that they could utilize the PEMMS as a part of their work in either building performance monitoring or management.
Since the use of PEMMS was limited to testing and experimenting, no actual benefits were gained with the help of the system. The success of PEMMS was limited to good user satisfaction. Although the users were satisfied with the system, it did not lead to any individual or organizational impacts. It is not unexceptional that information systems are underutilized or left unused. As discussed in Section 2.2, despite of the benefits of fault detection and diagnostics systems they have not been adopted on the building sector. In addition, it is typical that building automation systems are not fully utilized.

5.2. Challenges and Proposals for Improvement

The low amount of use of the PEMMS has certainly had an effect on the identified challenges and proposals for improvement that the users mentioned during the interviews. An in-depth analysis of the system usage is difficult to make based on just one to three instances of use. On the other hand, the feedback from the interviewees presented their first impression of the system which can be valuable as well. The same kind of challenges came up in almost every discussion. The main challenges were associated with accessibility, trust and management practices. The first two challenges were directly mentioned by the interviewees themselves but the third was more based on author’s interpretations and prior studies. All the three challenges with proposals for improvement are discussed in detail in the following paragraphs.

5.2.1. Information Accessibility

Many of the interviewees wished that the performance metric information could be easier to access. In today’s hectic work environment, information should be accessible as convenient and fast as possible. The interviewees were struggling to manage with numerous information systems and therefore had problems in finding the PEMMS and authenticating to it.
Highlighting the importance accessibility was not surprising. Numerous information science studies have shown that accessibility is the factor that influences most when selecting information sources [34,35,36]. Information seekers tend to choose information sources that are obtained with the least effort. However, there are various interpretations of the concept of accessibility. Bronstein [37] found in her study five meanings for accessibility and of these three were also supported by earlier studies. The three elements were ease of use, time saving, and physical proximity. With physical proximity she meant the convenience of accessing information. To the PEMMS users the most challenging accessibility element was physical proximity as they had difficulties in remembering the PEMMS website address and usernames as well as passwords.
To overcome the accessibility difficulties the users proposed that the performance reports or at least the front page of the PEMMS should be accessible from those applications that they would otherwise use in their daily work, such as email or the Computerized Maintenance Management System (CMMS). Another suggestion was to receive performance alarms of poorly performing devices so that time would be devoted to building performance issues only when the performance deviates from the expected. These wishes are in line with the findings of prior studies as the users would like to obtain information as easily as possible.
Probably because the interview questions concentrated around PEMMS, the interviewees suggested that the PEMMS should resolve the difficulties with accessibility. However, the problem could be solved with organizational procedures as well. For instance, one person in the operation and maintenance organization could be responsible for the use of the PEMMS and he or she could print performance reports to weekly or monthly meetings as well as inform the necessary people in case of anomalies. All the parties would receive performance information in a convenient way and response to performance deviations would be secured.
Although the importance of information accessibility is known is the field of information science, it has been overlooked in the context of building performance visualization and fault detection and diagnostics tools. Many of these tools, such as tools described in the studies of Friedman and Piette [12], Motegi and Piette [38], and Granderson et al. [15], have aimed at providing building performance information on a web page. The challenge so far has been in creating a system that collects performance data, processes it to information and presents the information on the web. In this setting, challenges have been confronted, for instance, with data acquisition and quality [11,15,39,40]. However, the findings of this study suggest that the system users may not be satisfied with a web portal dedicated in displaying performance information. The users do not want a new system as they are struggling to manage with numerous existing ones. Instead, the users would like to receive information as easily as possible preferably to applications that they would otherwise use in their daily work.

5.2.2. Trust in the System

All the interviewees did not fully trust the PEMMS. To some of the users, the whole concept of performance measurement was new and others did not entirely understand what the metrics meant. In addition, some users commented that the system had only limited capabilities in assessing building performance. The system was not able to take account all operating modes or able to measure all aspects of building performance. Similar lack of trust has been one of the reasons why only few solutions based on intelligent algorithms, such as artificial intelligence and neural networks, have proceeded to commercial products [31]. These solutions are often neglected in practice since they are seldom transparent or well understood in field use.
The users did not themselves suggest any methods to solve the lack of trust challenge. However, the challenge could certainly be addressed by educating the PEMMS users and by improving the performance measurement features of PEMMS. Training and education could provide a deeper understanding of the possibilities and capabilities of performance measurement. On the other hand, the limitations of the PEMMS could be reduced by developing the system further to take into consideration other aspects of building performance.

5.2.3. Management Practices

Although the accessibility of the PEMMS could be improved to meet the user requirements, it still would not guarantee that the performance reports provided by the system would be utilized in improving building performance. Turning information into actions and improvements requires management practices that support the performance measurement philosophy. The PEMMS is only one part of a larger entity which aims at improving building performance.
Signs of above mentioned management practices could not be observed in the studied buildings. The PEMMS was currently used only for test purposes to see how the system works and therefore there were no changes in managerial practices or in ways of working. However, to achieve better building performance, the working procedures should change as well. The PEMMS itself does not improve building performance, it only enables the improvements. Similar lack of management practices supporting performance improvements has been reported in the field building performance visualization and fault detection and diagnostics tools. Although, most of the studies in this field have focused on technical aspects some have also described managerial and organizational challenges. For instance, Katipamula et al. [41] stated that the benefits of fault detection and diagnostics tools will not be realized if the building staff are not able use their control systems to correct problems, are too busy with other duties or lack resources to obtain help from control contractors. In addition, Neumann and Jacob [40] reported of organizational problems in implementing ongoing commissioning tools. According to them, ongoing commissioning approach requires a dedicated team, clarification of responsibilities and an action management plan to gain achievements. Venkatesh et al. [42] described the importance of organizational infrastructure to the acceptance of information systems and Mahmood et al. [43] explained how organizational attitude and support affect user satisfaction.
In order to achieve improvements in building performance, the same management practices that are utilized in other fields of performance management could be used. For instance, management methods used in energy performance measurement could provide a good starting point since there exists a long history in conducting energy performance measures. The management principles and the lessons learned in energy performance management could now be applied to other fields of building performance. There are several guides for implementing energy performance management practices and one of them is by the Office of Energy Efficiency of Natural Resources Canada [44]. According to the guide, a successful energy management program requires:
  • Management’s understanding and commitment;
  • Company policies, directives and organization;
  • Program responsibilities;
  • Procedures and systems;
  • Project selection and focus;
  • Approved budget;
  • Approved investment criteria;
  • Training;
  • Integrated information systems;
  • Reports on savings achieved;
  • Motivation;
  • Marketing.
As can be seen from the above list, only few of the elements of success are related to technology. However, the technology part is important since it enables the whole management program.

6. Conclusions

A new tool called PEMMS was developed for building performance monitoring and management. The PEMMS utilizes building automation data and transforms the data into a set of performance metrics, and is capable of visualizing building performance from energy, indoor conditions and HVAC system perspectives. The PEMMS can be accessed by a regular web browser.
The PEMMS is in use in three buildings in which the users’ experiences of the use of a performance monitoring and management system (PEMMS) were explored using semi-structured interviews. The following findings were made.
The users told they are satisfied with the solution in general. However, the PEMMS was not taken into operative use. The main challenges with the use of the solution were related to accessibility, trust and management practices.
The users were struggling to manage with numerous information systems and therefore had problems in finding the PEMMS and authenticating to it. Instead of logging to the PEMMS they would rather receive information to applications that they otherwise use in their daily work.
The second reason for not using the system was the lack of trust. All the interviewees did not fully understand what the performance metrics meant. In addition, some users commented that the system had only limited capabilities in assessing building performance, i.e., the system was not able to measure all aspects of building performance.
The third challenge was associated with management practices. The PEMMS and other similar systems are not taken in everyday use if management practices do not support the use. First, management practices should support the performance measurement philosophy. Second, management practices should support the use of the PEMMS (or other tool) for performance measurement. Third, management practices should support the way to turn the performance information into actions and improvements. The PEMMS was used only for test purposes to see how the system works and therefore there were no changes in managerial practices.

Author Contributions

The first author performed most of the work. The second author participated in planning the interview study and writing the article.

Conflicts of Interest

The authors declare no conflict of interest.

References

  1. European Commission. EU’s Energy Related Strategies. Available online: http://ec.europa.eu/energy/strategies/index_en.htm (accessed on 2 February 2011).
  2. International Energy Agency (IEA). Technology Roadmap: Energy-Efficient Buildings: Heating and Cooling Equipment; International Energy Agency: Paris, France, 2011. [Google Scholar]
  3. United States General Accounting Office (GAO). School Facilities, Condition of America’s Schools; United States General Accounting Office: Washington, DC, USA, 1995. [Google Scholar]
  4. Huizenga, C.; Zagreus, L.; Arens, E. Air quality and thermal comfort in office buildings: Results of a large indoor environmental quality survey. In Proceedings of the Healthy Buildings 2006, Lisbon, Portugal, 4–8 June 2006.
  5. Mills, E.; Mathew, E. Monitoring-Based Commissioning: Benchmarking Analysis of 24 UC/CSU/IOU Projects; Lawrence Berkeley National Laboratory: Berkeley, CA, USA, 2009. [Google Scholar]
  6. Bordass, B.; Leaman, A.; Ruyssevelt, P. Assessing building performance in use 5: Conclusions and implications. Build. Res. Inf. 2001, 29, 144–157. [Google Scholar] [CrossRef]
  7. Menezes, A.C.; Cripps, A.; Bouchlaghem, D.; Buswell, R. Predicted vs. actual energy performance of non-domestic buildings: Using post-occupancy evaluation data to reduce thè performance gap. Appl. Energy 2012, 97, 355–364. [Google Scholar] [CrossRef] [Green Version]
  8. Haves, P.; Hitchcock, R.J. Performance Monitoring in Large Commercial Buildings; Berkeley National Laboratory for the California Energy Commission: Berkeley, CA, USA, 2008. [Google Scholar]
  9. Piette, M.A.; Kinney, S.; Friedman, H. EMCS and Time-Series Energy Data Analysis in a Large Government Office Building; Lawrence Berkeley National Laboratory: Berkeley, CA, USA, 2001. [Google Scholar]
  10. Brown, K.; Anderson, M.; Harris, J. How monitoring-based commissioning contributes to energy efficiency for commercial buildings. In Proceedings of the 2006 ACEEE Summer Study on Energy Efficiency in Buildings, Pacific Grove, CA, USA, 13–18 August 2006.
  11. Brambley, M.; Haves, P.; McDonald, S.; Torcellini, P.; Hansen, D.; Holmberg, D.; Roth, K. Advanced Sensors and Controls for Building Applications: Market Assessment and Potential R&D Pathways; Pacific Northwest National Laboratory: Washington, DC, USA, 2005. [Google Scholar]
  12. Friedman, H.; Piette, M. Comparative Guide to Emerging Diagnostic Tools for Large Commercial HVAC Systems; Lawrence Berkeley National Laboratory: Berkeley, CA, USA, 2001. [Google Scholar]
  13. Visier, J.C. Annex 40 Commissioning Tools for Improved Energy Performance. Available online: http://www.ecbcs.org/docs/Annex_40_Commissioning_Tools_for_Improved_Energy_Performance.pdf (accessed on 23 May 2014).
  14. Motegi, N.; Piette, M.; Kinney, S.; Herter, K. Web-based Energy Information Systems for Energy Management and Demand Response in Commercial Buildings; Lawrence Berkeley National Laboratory: Berkeley, CA, USA, 2002. [Google Scholar]
  15. Granderson, J.; Piette, M.A.; Ghatikar, G.; Price, P. Building Energy Information Systems: State of Technology and User Case Studies; Lawrence Berkeley National Laboratory: Berkeley, CA, USA, 2009. [Google Scholar]
  16. Few, S. Information Dashboard Design: The Effective Visual Communication of Data; O’Reilly Media, Inc.: Sebastopol, CA, USA, 2006. [Google Scholar]
  17. Lehrer, D. Research Scoping Report: Visualizing Information in Commercial Buildings; California Energy Commission (CEC): Sacramento, CA, USA, 2009. [Google Scholar]
  18. Friedman, H.; Crowe, E.; Sibley, E.; Effinger, M. The Building Performance Tracking Handbook; California Commissioning Collaborative: Berkeley, CA, USA, 2011. [Google Scholar]
  19. International Performance Measurement and Verification Protocol (IPMVP). Concepts and Options for Determining Energy and Water Savings Volume 1; Efficiency Valuation Organization: Washington, DC, USA, 2012. [Google Scholar]
  20. Katipamula, S.; Brambley, M. Methods for fault detection, diagnostics, and prognostics for building systems—A review. Part I. Int. J. HVAC R Res. 2005, 11, 3–25. [Google Scholar] [CrossRef]
  21. Zhivov, A.; Pietiläinen, J.; Reinikainen, E.; Schmidt, F.; Woody, A. Energy Process Assessment Protocol; International Energy Agency: Washington, DC, USA, 2009. [Google Scholar]
  22. Ulickey, J.; Fackler, T.; Koeppel, E.; Soper, J. Building Performance Tracking in Large Commercial Buildings: Tools and Strategies; California Energy Commissioning: Berkeley, CA, USA, 2010. [Google Scholar]
  23. Katipamula, S.; Brambley, M. Methods for fault detection, diagnostics, and prognostics for building systems—A review. Part II. Int. J. HVAC R Res. 2005, 11, 169–187. [Google Scholar] [CrossRef]
  24. Dexter, A.; Pakanen, J. Demonstrating Automated Fault Detection and Diagnosis Methods in Real Buildings; Technical Research Centre of Finland, Laboratory of Heating and Ventilation: Espoo, Finland, 2001. [Google Scholar]
  25. Braun, J.; Li, H. Automated Fault Detection and Diagnostics of Rooftop Air Conditioners for California; California Energy Commission: Berkeley, CA, USA, 2003. [Google Scholar]
  26. Seem, J. A personal view of commercial exploitation. In Demonstrating Automated Fault Detection and Diagnosis Methods in Real Buildings, Technical Research Centre of Finland; Laboratory of Heating and Ventilation: Espoo, Finland, 2001; pp. 375–376. [Google Scholar]
  27. Norford, L.K.; Wright, J.A.; Buswell, R.A.; Luo, D.; Klaassen, C.J.; Suby, A. Demonstration of fault detection and diagnosis methods for air-handling units. Int. J. HVAC R Res. 2002, 8, 41–71. [Google Scholar] [CrossRef]
  28. Schein, J.; Bushby, S.T. Fault detection & diagnostics for AHUs and VAV boxes. ASHRAE J. 2005, 47, 8–63. [Google Scholar]
  29. Smith, W. Final Report: Energy Efficient and Affordable Commercial and Residential Buildings; California Energy Commission: Berkeley, CA, USA, 2003. [Google Scholar]
  30. Hirvonen, J.; Kaasinen, E.; Kotovirta, V.; Lahtinen, J.; Norros, L.; Salo, L.; Timonen, M.; Tommila, T.; Valkonen, J.; van Gils, M.; et al. Intelligence Engineering Framework; VTT Technical Research Centre of Finland: Espoo, Finland, 2010. [Google Scholar]
  31. Hirvonen, J.; Ventä, O. Design process for intelligent algorithm intensive systems. In International Multi-Conference on Engineering and Technological Innovation, 2nd ed.; International Institute of Informatics and Systemics: Winter Garden, FL, USA, 2009; pp. 236–241. [Google Scholar]
  32. Tuomi, J.; Sarajärvi, A. Laadullinen Tutkimus ja Sisällönanalyysi; Tammi: Helsinki, Finland, 2002. [Google Scholar]
  33. Patton, M.Q. Qualitative Research & Evaluation Methods, 3rd ed.; Sage Publications, Inc.: Thousand Oaks, CA, USA, 2002. [Google Scholar]
  34. Allen, T.J. Managing the Flow of Technology: Technology Transfer and the Dissemination of Technological Information within the Research and Development Organization; MIT Press: Cambridge, MA, USA, 1977. [Google Scholar]
  35. O’Reilly, A. Variations in decisions makers’ use of information sources: The impact of quality and accessibility of information. Acad. Manag. J. 1982, 25, 756–771. [Google Scholar] [CrossRef]
  36. Rice, R.E.; Shook, D.E. Access to, usage of, and outcomes from an electronic messaging system. ACM Trans. Office Inf. Syst. 1988, 6, 255–276. [Google Scholar] [CrossRef]
  37. Bronstein, J. Selecting and using information sources: Source preferences and information pathways of Israeli library and information science students. Inf. Res. 2010, 15. Available online: http://www.informationr.net/ir/15-4/paper447.html (accessed on 23 May 2014).
  38. Motegi, N.; Piette, M.A. Web-based energy information systems for large commercial buildings. In National Conference on Building Commissioning; Lawrence Berkeley National Laboratory: Berkeley, CA, USA, 2002. [Google Scholar]
  39. Lehrer, D.; Vasudev, J. Visualizing information to improve building performance: A study of expert users. In Proceedings of the ACEEE Summer Study on Energy Efficiency in Buildings, Pacific Grove, CA, USA, 15–20 August 2010.
  40. Neumann, C.; Jacob, D. Results of the Project Building EQ Tools and Methods for Linking EPBD and Continuous Commissioning; Fraunhofer Institute for Solar Energy Systems: Freiburg, Germany, 2010. [Google Scholar]
  41. Katipamula, S.; Brambley, M.R.; Bauman, N.N.; Pratt, R.G. Enhancing building operations through automated diagnostics: Field test results. In Proceedings of the 2003 International Conference for Enhanced Building Operations, Berkeley, CA, USA, 9–10 October 2013.
  42. Venkates, V.; Morris, M.G.; Davis, G.B.; Davis, F.D. User acceptance of information technology: Toward a unified view. MIS Q. 2003, 27, 425–478. [Google Scholar]
  43. Mahmood, M.A.; Burn, J.A.; Gemoets, L.A.; Jacquez, C. Variables affecting information technology end-user satisfaction: A meta-analysis of the empirical literature. Int. J. Hum. Comput. Stud. 2000, 52, 751–771. [Google Scholar] [CrossRef]
  44. Hooke, J.H.; Landry, B.J.; Hart, D. Energy Management Information Systems, Achieving Improved Energy Efficiency, A Handbook for Managers, Engineers and Operational Staff; Office of Energy Efficiency of Natural Resources Canada: Ottawa, Canada, 2003. [Google Scholar]

