Article

Access to Parks for Youth as an Environmental Justice Issue: Access Inequalities and Possible Solutions

by
Alessandro Rigolon
* and
Travis L. Flohr
College of Architecture and Planning, University of Colorado Denver, 1250 14th St, Denver, CO 80202, USA
*
Author to whom correspondence should be addressed.
Buildings 2014, 4(2), 69-94; https://doi.org/10.3390/buildings4020069
Submission received: 17 January 2014 / Revised: 2 April 2014 / Accepted: 2 April 2014 / Published: 14 April 2014
(This article belongs to the Special Issue Designing Spaces for City Living)

Abstract

:
Although repeated contact with nature helps foster mental and physical health among young people, their contact with nature has been diminishing over the last few decades. Also, low-income and ethnic minority children have even less contact with nature than white middle-income children. In this study, we compared accessibility to play in parks for young people from different income and racial backgrounds in Denver, Colorado. Park access for children and youth was measured using a geographic information system (GIS). Each neighborhood was classified according to income level, residential density, and distance from downtown; and then each park was classified based on formal and informal play, and level of intimacy. Comparisons between neighborhoods show that that low-income neighborhoods have the lowest access and high-income neighborhoods have the highest access to parks, and that differences are even higher for parks with play amenities and high levels of intimacy. To overcome this issue, the paper proposes a framework for action to improve access to parks for low-income children and youth and to help planners, decision makers and advocacy groups prioritize park investments.

1. Introduction

A growing body of research indicates that contact with nature is beneficial for mental and physical health among young people [1], particularly for low-income children [2]. Repeated contact with nature fosters physical development [3], cognitive development [4], and social development [5]. However, research in a variety of Western countries shows that the time children spend outdoors playing in nature is decreasing [6,7,8]. Most importantly, low-income and ethnic minority children have even less contact with nature than white middle-income children due to lack of available green spaces and recreational opportunities [9] and to safety concerns in their communities [10,11,12]. Furthermore, regardless of income level, young people’s use of parks and their benefits differ depending on park design, including the presence of different play amenities [13,14,15]. Yet, limited research about access to parks has looked at park design aspects or has studied the topic with an environmental justice lens.
In this paper, we focus on access to play opportunities in parks for young people, including children and teenagers. In our discussion, we distinguish between “access to parks”, describing the possibility to enjoy any type of park, and “access to play in parks”, depicting the possibility to experience parks with significant play spaces in them, which are described later. Thus, “access to play in parks” can be considered a sub-type of “access to play”. Also, we argue that play opportunities in playgrounds, sport fields, and other spaces found in parks can all provide contact with natural elements, such as trees, grass, and rocks. Indeed, Kaplan claimed that nature can be found in cities in the form of parks, trees, plants, and water [16]. Natural places and elements that can be experienced in cities on a daily basis were defined as “nature-at-the-doorstep” ([16], p. 189). The definition of nature adopted in this paper, including the fact that it can be found in cities, is widely accepted in the planning and environmental psychology literatures [17,18,19,20]. Thus, in this paper every reference to park is a reference to urban nature. This paper presents the results of an environmental justice study measuring young people’s access to play in parks in Denver, Colorado and a framework for design and planning interventions.

2. Access to Parks as an Environmental Justice Issue: A Literature Review

Increasingly, research has studied how access to different types of public facilities for recreation including natural elements differs by socio-economic status [9,21]. In particular, scholars have studied how various income and racial groups have different levels of access to parks and playgrounds [13,22,23,24,25,26,27,28,29,30,31,32,33,34,35], walkable and bikeable neighborhoods [36,37,38,39,40,41], green school grounds [42], greenways [43], and street trees [44].
This body of research shows that access to parks and other recreational facilities is an environmental justice issue because parks are not equitably distributed across urban environments. The concept of environmental justice developed from the acknowledgement that low-income and ethnic minority groups tend to be more exposed to environmental hazards [45,46]. However, environmental justice also addresses inequalities in terms of access to services, including housing, health, food [45], and recreational opportunities [46]. Until recently, most environmental justice literature focused on exposure to “bads”, while fewer studies have been dedicated to access to “goods”, including nature [46]. In this paper, we adopt an environmental goods approach to analyze the social disparities in young people’s access to play opportunities in parks. Also, when talking about unequal access to resources, it is important to identify who are the populations that are at risk. Talen identified four parameters to operationalize populations in need: people under 18; people above 65; median household income under a certain threshold, and percentage of occupied housing units with no vehicle available [41]. Young people are indeed a vulnerable part of the population in relation to health [47]. Thus, it is quite surprising that few environmental justice studies analyzed the unjust distribution of environmental hazards and access to nature for youth [48].

2.1. Measuring Accessibility to Play Opportunities

Ribot and Peluso, expanding the concept of property, defined access as “the ability to derive benefits from things” ([49], p. 153). In this paper, we conceptualized access from a spatial quantitative point of view, including the opportunity to enjoy settings that are open to the public and that are within walking distance from people’s homes. In the planning literature, accessibility and proximity to public facilities have been measured in several ways. Most of the studies we reviewed used a Geographic Information System (GIS) network analysis to measure distances between residences and public facilities [22,26,27,38,41]. Fewer studies used surveys of residents, asking them to report their distance from various public facilities [13,25,36]. GIS analyses may highlight more reliable results than surveys because they rely on objective measures of the physical environment rather than on self-reporting. However, some variability exists even in the studies using GIS. Indeed, Talen suggested that the size of the unit of analysis (parcel, census block, census block group or neighborhood) may create different results [41]. Also, among the approaches used to measure distance to facilities in GIS, the minimum distance approach [41], measuring the actual distance between origins and the nearest facility, is the most used in the literature we reviewed.
However, when considering children’s play, access to every type of park may not be the best measure to use. First, the quality of parks and playgrounds, their level of maintenance, and the presence of play amenities need to be included in the analysis [9,31]. In particular, “children demand both developed and undeveloped, structured and unstructured play opportunities” ([50], p. 338). Also, low-income areas have been found to have parks with poorer quality amenities than higher income areas [28,31]. Qualitative research has shown that, if parks are dangerous, children tend not to access them and play on sidewalks instead [10]. We addressed these methodological gaps through our research methods.

2.2. Access to Parks and Play Opportunities

Two recent reviews have summarized research addressing how the provision of parks and recreational facilities varies by ethnic and income group. The review carried on by the National Recreation and Park Association shows that most studies found that low-income groups and ethnic minorities tend to be underserved in terms of access to parks and recreational facilities [9]. Macintyre’s review challenges the assumption that low-income groups and ethnic minorities have always lower access to health promoting amenities, including parks [21]. This section critically analyzes empirical studies about access to public facilities to clarify the contradictions between the two cited reviews.

2.2.1. Access to Parks

The evidence is somehow mixed about how access to any type of park varies by income and racial group. However, a literature search shows that most studies found that low-income and ethnic minority groups tend to be underserved [25,28,35,39,51,52]. These studies cover a variety of countries (United States, England, Turkey, and Australia) and are based on GIS analyses measuring the distance that people have to walk to reach a park and on surveys. In particular, Wolch and colleagues found that park funding in Los Angeles tends to worsen the existing inequities among different parts of the city [35]. Also, people residing in low-income areas tend to considered park proximity a need [25].
Other studies found no statistical difference for access to parks among income and racial groups [26,29,32,34] or that low-income people and minorities have higher levels of access than other parts of the population [22,24,38,40]. Among these studies, Cutts and colleagues found that the areas with the highest percentages of children and teenagers tended to be underserved by parks [38]. Also, Timperio and colleagues in their GIS analysis used the whole neighborhood as the unit analysis [34], and the size of the unit of analysis might have influenced their findings [41]. Furthermore, two studies found that low-income and ethnic minority groups tend to live in areas with high crime concentrations, and this may limit people’s use of parks [38,40]. Finally, two of these studies focused on cities in England and Scotland [22,24], two countries that are known to invest more public money into social equity than the United States [53]. Overall, the majority of the studies we reviewed shows that access to parks, regardless of their quality, is lower for disadvantaged parts of the population.

2.2.2. Quality of Open Space and Access to Play in Parks

The literature consistently shows that high quality urban open spaces including natural elements and formal play opportunities are inequitably distributed in cities [24,27,28,29,31,33,37,44]. In particular, low income and ethnic minority groups tend to have less access to street trees than people living in other parts of the city [37,40,44]. Also, disadvantaged areas of cities seem to have less amenities in public open space, including tables, fountains, and cycling paths [37]. Access to play in parks and the quality of play amenities is also an issue. Indeed, underserved populations have less access to playgrounds and recreational opportunities [27,29,33]. Most importantly, such play amenities tend to have lower quality [24,28], to have lower levels of maintenance [31], to be perceived as overcrowded [28], to be less safe [23], and to include more physical environment hazards [54]. This research, conducted in the United States, Canada, and Australia, including cities like New York [54], Boston [23], and Los Angeles [28], shows that access to safe and quality play spaces in urban nature is an issue for low-income and ethnic minority groups. When studying access to outdoor play opportunities for young people, it is therefore important to focus on access to parks with quality and safe play opportunities rather than access to every park.

2.3. Literature Gaps

This literature review showed a series of gaps in relation to young people’s access to play in parks. Indeed, only few studies included the percentage of young people in the spatial and statistical analysis [28,33,38,40,41]. Not including such percentage means assuming that children and youth are equally distributed in the city, without taking into account the areas that have more demand for play spaces. Also, to our knowledge no published study focused on or fully described access to parks that included different types of play amenities and spaces with different levels of intimacy. Then, most studies did not try to explain the reasons behind their quantitative findings. Finally, almost no study proposed solutions to increase access to play in parks for children living in underserved areas. Only Talen proposed a suitability analysis combining areas with high needs (low SES status, high percentage of children and elderly people) and low provisions (higher distances to destinations) [41].

2.4. The Study Goals

This study has three interrelated goals that derive from the research problem and the literature review. First, this paper aims to explore correlations, for different neighborhoods, between levels of access to different types of parks and income levels and the percentage of ethnic minorities. By doing that, we want to test the hypothesis that young people living in low income and ethnically diverse areas have less access to parks and to parks with significant play opportunities. Secondarily, we aim to test whether access to different types of parks differs by neighborhoods with different residential density and distances from downtown. Indeed, it is common sense knowledge that suburbs include more natural spaces than inner city neighborhoods, yet suburban single-family developments generally include backyard play spaces and dense urban developments typically do not. Finally, we aim to develop an action framework to increase access to play opportunities in parks for low-income youth, including practical actions that communities can undertake to improve the built environment.

3. Research Design

In this study, we compared access to different types of parks in a series of neighborhoods in Denver that presented variations in terms of income level (low, medium, and high), and residential density and distance from downtown (inner city and suburbs). Expanding a methodology we piloted earlier, park accessibility for children and youth was measured through a weighted spatial network analysis using GIS. Walkability studies were used to predict route preferences. Comparisons of the levels of access to different types of parks were conducted among the selected neighborhoods to test differences among low-, medium-, and high-income neighborhoods, and between urban and suburban neighborhoods. We chose to study differences between neighborhoods because neighborhoods can be considered “children and youth’s domains”, i.e., spaces they identify with and where they spend a significant amount of their time [55,56,57], often because their home range is limited to their neighborhood [50]. In this study, we seek to address most of the gaps we identified in the literature review.

3.1. Sampling

We chose Denver, Colorado as a study site because various groups that advocate for improving low-income children’s health have expressed concern about a lack of parks in the city’s low-income neighborhoods [58,59]. A stratified random sample was used to generalize the findings to other neighborhoods in the Denver Metropolitan Area [60]. In this study, Denver’s 78 neighborhoods were stratified based on density, distance from downtown, and income level. First, each neighborhood was stratified into urban and suburban neighborhoods. Floor area ratio (FAR), population density, and distance from the downtown central business district were used to categorize each neighborhood as urban or suburban. All Denver neighborhoods meet the United States Census definition of urban area; however, morphologically many neighborhoods can be classified as suburban, as such FAR and distance to downtown were used to create thresholds for urban and suburban neighborhoods [61]. Neighborhoods with an average FAR less than 2.0 and >0.8 kilometers (0.5 miles) outside Denver’s downtown were classified as suburban [61].
Second, urban and suburban neighborhoods were stratified into low-income, medium-income, and high-income neighborhoods using 2010 census data; however, only one neighborhood met the United States Census Bureau’s definition of poverty [62]. The neighborhoods’ percent of population living in poverty was then classified using each neighborhoods standard deviation score: >2.0 standard deviations were classified as low-income; <2.0 and >−1.0 standard deviations were classified as medium-income; and <−1.0 standard deviations were classified as high-income. A random sample of two urban and two suburban neighborhoods was selected from each level of income for a total n of 12 neighborhoods. The sample includes six urban and six suburban neighborhoods (stratified by FAR, population density, and distance from downtown), and four neighborhoods for each of the income categories (low, medium, and high). The location of the 12 neighborhoods within the city of Denver, including their classification, is presented in Figure 1.
Figure 1. The 12 sampled neighborhoods in the city of Denver, classified by density and distance from downtown (suburban or urban), and income.
Buildings 04 00069 g001

3.2. Methods

Park accessibility for children and youth was measured through a weighted spatial network analysis using GIS. Each neighborhood was classified as described above; then each park was classified based on the presence of formal and informal play opportunities, and of spaces with different levels of intimacy, addressing one of the literature gaps. To measure equity of access, we used census blocks to record household income, percentage of non-white population, percentage of people under 18 (addressing one of the literature gaps), and geo-referenced crime records; we used FAR and population density to control for private yard play space, and assessed land value to control for data errors for household income within the census.

3.2.1. Measuring Access to Parks and to Play in Parks

Each park, school ground and community garden in the sampled neighborhoods and within a quarter-mile radius around each neighborhood were classified based on the presence of formal and informal play amenities, and on the presence of vegetation creating enclosed spaces (level of intimacy). Formal play amenities were defined as settings that afforded games or activities with predefined rules or routines [63]. Such spaces included playgrounds, sport fields, recreational courts, swimming pools, and skate parks. Informal play spaces were defined as settings that included natural elements such as trees, water, sand, and rocks, and that afforded exploration [14,63]. In this study, such settings included natural spaces like creeks and ponds, groves with low-hanging trees, rolling hills, gardens and play areas with sand and rocks. Finally, the level of intimacy can be defined as the level of enclosure of outdoor spaces, surrounded by vegetation, rocks, or built structures [64]. Intimacy is rooted in the concepts of prospect and refuge introduced by Appleton: Prospect is a characteristic of settings where people can overlook a space, while refuge is a feature of places where people can find shelter and privacy [65]. These characteristics are important for play because children prefer places that have some privacy from adults [50], while adults like play settings that can be supervised [66]. In this paper, we will specifically focus on parks with high levels of intimacy, which tend to be preferred by children.
For city parks, formal play amenities, and informal play amenities like creeks and ponds, GIS data from the city of Denver was available. For school grounds, community gardens, levels of intimacy, and informal play amenities like groves with low-hanging trees, hills and play areas with sand and rocks, we screened aerial photos and conducted site visits to digitize new green spaces and amenities. Given this framework, each park was classified based on three dichotomous variables: including formal play spaces or not, including informal play spaces or not, and having high levels of intimacy or not. For play opportunities, we used the amenities mentioned above. For the levels of intimacy, parks were classified as having high levels of intimacy if they included spaces enclosed by vegetation or other natural elements for at least 50% of their perimeter. Then, based on these dichotomous variables, we studied access to eight types of parks: all parks, regardless of play amenities and levels of intimacy, parks with formal play amenities, parks with informal play amenities, parks with high levels of intimacy, parks with a combination of two of the three above features (three combinations), and parks with formal and informal play amenities and high levels of intimacy.

3.2.2. Network Analysis

Accessibility to each park type was measured through a weighted spatial network analysis service area function in a GIS (ESRI’s ArcGIS, version 10) [67], using a modified version of the “minimum distance” approach introduced by Talen ([41], p. 183). Talen’s [41] method created a dichotomous variable of access or no access to facilities, while introducing potential errors because of the size and shape of certain census block groups. We improved this method by using a combination of census blocks and parcels to measure the percentage of parcels with access within each census block. Smaller parcel geometry, when available, creates a more refined picture of access. An access ratio for each census block is calculated as in Equation (1):
# of Parcels that Have Access in a Block/# of Parcels in a Block = Access Ratio
A youth-appropriate walkability index for the city streets has been calculated based on three street design aspects: the speed limit, as a proxy for traffic [68,69,70,71], the presence of tree canopy, as a proxy for street trees [68,72], and the presence of a sidewalk [68,70,71,73]. Speed limit, representing traffic, is an appropriate variable for a youth walkability scale because research consistently shows that traffic danger is one of the main reasons why parents limit their children’s mobility [69,70,74,75]. Also, street trees can foster young people’s walking behaviors because they are important elements for shading, particularly in Denver, which has an average of 300 days of sun per year [76], and for neighborhood aesthetics [72]. Finally, the presence of sidewalks can reduce parents and youth’s traffic concerns [77].
Scores were assigned to different street segments using a combination of scores related to speed limit, presence of tree canopy, and presence of sidewalks. Lower scores represent very walkable streets, while higher scores represent streets with low walkability. Traffic level scores were assigned to different street segments using coefficients related to speed limits, as shown in Table 1. Street segments are parts of streets between two intersections. Scores for tree canopy were calculated as follows: Each street segment was given a score of 1 if it had at least some tree cover along it, and a score of 1.1 if it had no trees along it. Finally, the presence of sidewalk was used as follows: Each street segment was assigned a score of 1 if it had a sidewalk, and a score of 1.1 if it had no sidewalk. The scores were assigned to each street segment. The scores for the three aspects were multiplied to create a single walkability score. A street segment walkability index was created by multiplying the walkability score of that street segment by the street segment length [67].
Table 1. Speed limit walkability scores.
Speed (MPH)152530354565
Score0.850.9211.051.151.35

3.2.3. Statistical Analysis

We calculated descriptive and inferential statistics to assess differences in access to parks based on income level and on housing density and distance from downtown. To assess differences between income levels, a series of tests were conducted. First, we conducted a Kruskal-Wallis H Test to assess whether there were statistically significant differences among groups [78]. Such a test is appropriate when testing differences among more than two groups and when the dependent variables are non-parametric [78]. Then, we conducted a Jonckheere-Terpstra Test to assess whether there were any ordered group trends in terms of access to parks among income groups [79]. In other words, we used such a test to calculate the direction or sign of the differences. Third, we ran a Mann Whitney U test between pairs of income levels to calculate the effect sizes of the differences [78]. Finally, to assess differences in terms of access to parks between urban and suburban neighborhoods, we conducted a Mann Whitney U test, which is appropriate when testing differences between two groups and when the dependent variables are non-parametric [78]. Assumptions for all these tests were tested and met.

4. Findings

4.1. Descriptive Statistics

Descriptive statistics were calculated for the variables used to measure equity, divided by neighborhood. Table 2 shows large variations among neighborhoods in terms of ethnicity, presence of young people, income, land value, and number of crimes. Harvey Park and Sun Valley are the neighborhoods with the highest percentage of people in poverty, while Country Club and Fort Logan have the lowest concentration of people in poverty (see Table 2). This reflects the way the neighborhoods were sampled in terms of income (see Figure 1). The highest percentage of non-white residents can be found in East Colfax and Five Points and the lowest in Country Club and Hampden (see Table 2). Also, the neighborhoods with the highest percentage of people under 18 are East Colfax and Five Points, while the neighborhoods with the highest number of crime are East Colfax and Harvey Park (see Table 2).
Table 2. Descriptive statistics of the equity variables for the 12 sampled neighborhoods.
Neighborhood% Non-white% Less than 18Median household income ($)% in povertyLand value ($/m2)Number of crimes
All neighborhoods (N, Mean, St. Dev.)(1481, 44%, 30%)(1481, 22%, 13%)(1481, 51059, 21325)(1481, 11%, 10%)(1481, 0.0016, 0.0016)(1481, 5.32, 8.92)
Gateway/Green Valley Ranch (N, Mean, St. Dev.)(52, 44%, 30%)(52, 20%, 13%)(52, 49389, 18286)(52, 11%, 8%)(52, 0.0008, 0.0010)(52, 6.79, 12.45)
Hampden (N, Mean, St. Dev.)(92, 13%, 13%)(92, 8%, 6%)(92, 81710, 14879)(92, 6%, 3%)(92, 0.0046, 0.0026)(92, 3.83, 2.4)
East Colfax (N, Mean, St. Dev.)(51, 78%, 16%)(51, 29%, 11%)(51, 33632, 5238)(51, 18%, 5%)(51, 0.0004, 0.0002)(51, 9.88, 9.46)
Speer (N, Mean, St. Dev.)(140, 15%, 11%)(140, 17%, 9%)(140, 58405, 21226)(140, 9%, 4%)(140, 0.0026, 0.0006)(140, 4.36, 4.89)
Country Club (N, Mean, St. Dev.)(63, 8%, 7%)(63, 23%, 10%)(63, 100318, 26599)(63, 2%, 2%)(63, 0.0041, 0.0009)(63, 3.16, 2.71)
Sun Valley (N, Mean, St. Dev.)(131, 55%, 24%)(131, 22%, 10%)(131, 28286, 5948)(131, 22%, 6%)(131, 0.0007, 0.0002)(131, 9.68, 12.79)
Harvey Park (N, Mean, St. Dev.)(156, 47%, 26%)(156, 13%, 12%)(156, 29324, 10488)(156, 29%, 8%)(156, 0.0023, 0.0025)(156, 10.03, 8.15)
Cherry Creek (N, Mean, St. Dev.)(96, 35%, 19%)(96, 21%, 13%)(96, 55372, 13197)(96, 8%, 5%)(96, 0.0008, 0.0005)(96, 1.66, 2.89)
Five Points (N, Mean, St. Dev.)(360, 75%, 14%)(360, 35%, 8%)(360, 56051, 5007)(360, 5%, 2%)(360, 0.0007, 0.0002)(360, 3.44, 7.26)
Fort Logan (N, Mean, St. Dev.)(131, 22%, 17%)(131, 16%, 9%)(131, 53445, 14435)(131, 5%, 3%)(131, 0.0009, 0.0004)(131, 4.95, 16.65)
College View/South Platte (N, Mean, St. Dev.)(136, 58%, 18%)(136, 25%, 8%)(136, 47059, 8776)(136, 8%, 5%)(136, 0.0007, 0.0001)(136, 3.27, 3.99)
Congress Park (N, Mean, St. Dev.)(116, 18%, 12%)(116, 8%, 6%)(116, 40327, 13976)(116, 12%, 5%)(116, 0.0025, 0.0013)(116, 5.83, 4.02)

4.2. Neighborhoods Comparison

The Kruskal-Wallis H Test for all neighborhoods, regrouped by income level, revealed statistically significant differences in mean ranks for all access variables (p < 0.01). For example, for percent of access to all parks, χ² (2, N = 1481) = 21.144, p = 0.000, and for percent of access to parks with formal and informal play amenities and high levels of intimacy, χ² (2, N = 1481) = 81.306, p = 0.000. This means that the three groups of neighborhoods, classified based on income level, differed significantly on access to different types of parks. Table 3 shows the differences in mean ranks among income levels for access to different types of parks. For most park types, the mean ranks increase with the income level. The same Kruskal-Wallis H Test also showed statistically significant differences in mean ranks for the percentage of non-white people, χ² (2, N = 1481) = 227.058, p = 0.000, for the percentage of people under 18, χ² (2, N = 1481) = 202.289, p = 0.000, and for the number of crimes, χ² (2, N = 1481) = 303.648, p = 0.000. This shows that areas with various income levels also differ in terms of these three variables.
Then, the Jonckheere-Terpstra test was statistically significant for all access variables except for the percent of access to parks with formal and informal play spaces, showing the presence of a trend among the three income groups (see Table 4). Also, the signs of the J-T statistics were positive for all access variables (see Table 4), showing that low-income neighborhoods have the lowest access and high-income neighborhoods have the highest access [79].
Table 3. Mean ranks of access to different types of parks by income groups from the Kruskall-Wallis H Test.
Access by park typeLevel of incomeNMean rank
Percent Access to All ParksLow Income611738.43
Medium Income523692.82
High Income347818.14
Total1481
Percent Access to Parks with Formal PlayLow Income611712.08
Medium Income523709.16
High Income347839.92
Total1481
Percent Access to Parks with Informal PlayLow Income611698.40
Medium Income523780.18
High Income347756.95
Total1481
Percent Access to Parks with High Levels of IntimacyLow Income611663.66
Medium Income523793.19
High Income347798.51
Total1481
Percent Access to Parks with Formal and Informal PlayLow Income611707.78
Medium Income523790.20
High Income347725.34
Total1481
Percent Access to Parks with Formal Play and High Levels of IntimacyLow Income611668.10
Medium Income523711.33
High Income347914.09
Total1481
Percent Access to Parks with Informal Play and High Levels of IntimacyLow Income611674.14
Medium Income523856.04
High Income347685.33
Total1481
Percent Access to Parks with Formal and Informal Play and High Levels of IntimacyLow Income611676.30
Medium Income523853.01
High Income347686.10
Total1481
Ratio between FAR and permeable surface per lotLow Income611761.00
Medium Income523704.08
High Income347761.42
Total1481
Table 4. Jonckheere-Terpstra (J-T) results and effect size for all access variables.
Access by park typeJ-T p-valueStd. J-T statistic
Percent Access to All Parks0.0382.071
Percent Access to Parks with Formal Play0.0003.876
Percent Access to Parks with Informal Play0.0062.749
Percent Access to Parks with High Levels of Intimacy0.0006.094
Percent Access to Parks with Formal and Informal Play0.1401.475
Percent Access to Parks with Formal Play and High Levels of Intimacy0.00010.103
Percent Access to Parks with Informal Play and High Levels of Intimacy0.0072.714
Percent Access to Parks with Formal and Informal Play and High Levels of Intimacy0.0092.629
Ratio between FAR and permeable surface per lot0.428−0.792
Then, we performed three Mann Whitney U tests to calculate the effect sizes of the differences in access to parks by income. The effect size was calculated as the ratio between the Mann Whitney Z coefficient and the square root of N [78]. Table 5 shows the effect sizes of the differences between low- and mid-income areas, between mid- and high-income areas, and between low- and high-income areas. Our results show that the effect sizes tend to be higher for parks with a variety of play spaces and with high levels of intimacy, reaching in some occasions a medium effect size (see Table 5). These findings also show differences for both access to parks and access to play in parks, but with bigger effects for access to parks with a variety of play spaces and high levels of intimacy, including natural elements like water, vegetation, rocks and sand (see Table 5). This means that low-income neighborhoods are particularly lacking parks where young people can get in contact with nature.
Table 5. Effect sizes (Mann Whitney U Test) between income groups access per park type.
Access by park typeLevel of IncomeNr
Percent Access to All ParksBetween Low- and Mid-income11340.048
Between Mid- and High-income8700.156 ***
Between Low- and High-income9580.098 **
Percent Access to Parks with Formal PlayBetween Low- and Mid-income11340.002
Between Mid- and High-income8700.153 ***
Between Low- and High-income9580.143 ***
Percent Access to Parks with Informal PlayBetween Low- and Mid-income11340.1 **
Between Mid- and High-income8700.026
Between Low- and High-income9580.068 *
Percent Access to Parks with High Levels of IntimacyBetween Low- and Mid-income11340.173 ***
Between Mid- and High-income8700.009
Between Low- and High-income9580.172 ***
Percent Access to Parks with Formal and Informal PlayBetween Low- and Mid-income11340.101 **
Between Mid- and High-income8700.077 *
Between Low- and High-income9580.02
Percent Access to Parks with Formal Play and High Levels of IntimacyBetween Low- and Mid-income11340.072 *
Between Mid- and High-income8700.278 ***
Between Low- and High-income9580.349 ***
Percent Access to Parks with Informal Play and High Levels of IntimacyBetween Low- and Mid-income11340.249 ***
Between Mid- and High-income8700.221 ***
Between Low- and High-income9580.015
Percent Access to Parks with Formal and Informal Play and High Levels of IntimacyBetween Low- and Mid-income11340.244 ***
Between Mid- and High-income8700.217 ***
Between Low- and High-income9580.012
Ratio between FAR and permeable surface per lotBetween Low- and Mid-income11340.076 *
Between Mid- and High-income8700.048
Between Low- and High-income9580.014
* p < 0.05, ** p < 0.01, *** p < 0.001.
Then, the Mann Whitney Test to assess differences in access to parks and presence of green spaces within lots between urban and suburban neighborhoods showed statistically significant differences for five park types out of eight and for the presence of green spaces within lots (see Table 6). Regarding the sign of these differences, the results are contrasting, as the mean ranks in Table 6 show. The effect sizes were calculated as described above and were generally slightly lower than the ones found for income groups, except for the presence of green spaces in lots, expressed as a ratio between FAR and permeable surfaces (see Table 6). Indeed, our findings show that suburban lots have a significantly higher ratio between FAR and permeable surfaces than urban lots, suggesting the presence of more green spaces within lots, probably providing play opportunities.
Table 6. Effect sizes between urban and suburban neighborhoods for access to different types of parks and for the ratio between Floor area ratio (FAR) and permeable surfaces per lot from the Mann Whitney U Test.
VariablesUrban vs. suburbanNMean rankr
Percent Access to All ParksSuburban905740.550.001
Urban576741.71
Total1481
Percent Access to Parks with Formal PlaySuburban905761.800.061 *
Urban576708.31
Total1481
Percent Access to Parks with Informal PlaySuburban905710.210.094 ***
Urban576789.38
Total1481
Percent Access to Parks with High Levels of IntimacySuburban905684.480.186 ***
Urban576829.80
Total1481
Percent Access to Parks with Formal and Informal PlaySuburban905739.990.003
Urban576742.58
Total1481
Percent Access to Parks with Formal Play and High Levels of IntimacySuburban905742.640.006
Urban576738.43
Total1481
Percent Access to Parks with Informal Play and High Levels of IntimacySuburban905681.490.209 ***
Urban576834.50
Total1481
Percent Access to Parks with Formal and Informal Play and High Levels of IntimacySuburban905686.320.193 ***
Urban576826.91
Total1481
Ratio between FAR and permeable surface per lotSuburban905990.320.73 ***
Urban576349.27
Total1481
* p < 0.05, ** p < 0.01, *** p < 0.001.
In summary, the GIS spatial analysis showed that, in Denver, young people living in low-income and racially diverse neighborhoods have significantly less access to play in urban parks than young people living in mid- and high-income white neighborhoods (see Table 4 and Table 5). This confirms the findings of previous research [25,28,35,39,51,52]. Also, the findings of this study advance the park accessibility literature because they show even greater disparities in terms of access to parks with formal and informal play opportunities and with high levels of intimacy, including natural elements. This means that these amenities are located further away from the homes of low income and non-white young people, thus limiting their opportunities of contact with nature and physical activity. These findings are particularly disturbing, as low-income and non-white children and youth have few opportunities to access outdoor recreation in natural spaces located far from home, given their limited mobility [46].
Limited opportunities for contact with nature and physical activity have negative health implications for low-income and non-white young people’s health in Denver [1,3,4,5]. In particular, parks that lack significant play amenities are less beneficial for young people’s physical activity levels than parks with play spaces [13]. Also, parks located in low-income areas tended to have lower levels of intimacy (see Table 5), showing a partial lack of vegetation. This can possibly limit young people’s use of these parks during summer months. The implications of our findings for the health of children and youth living in Denver’s low-income and ethnically diverse areas call for an action framework to improve access to parks with significant play amenities and high levels of intimacy.

5. Discussion: Process, Policy and Built Environment Implications

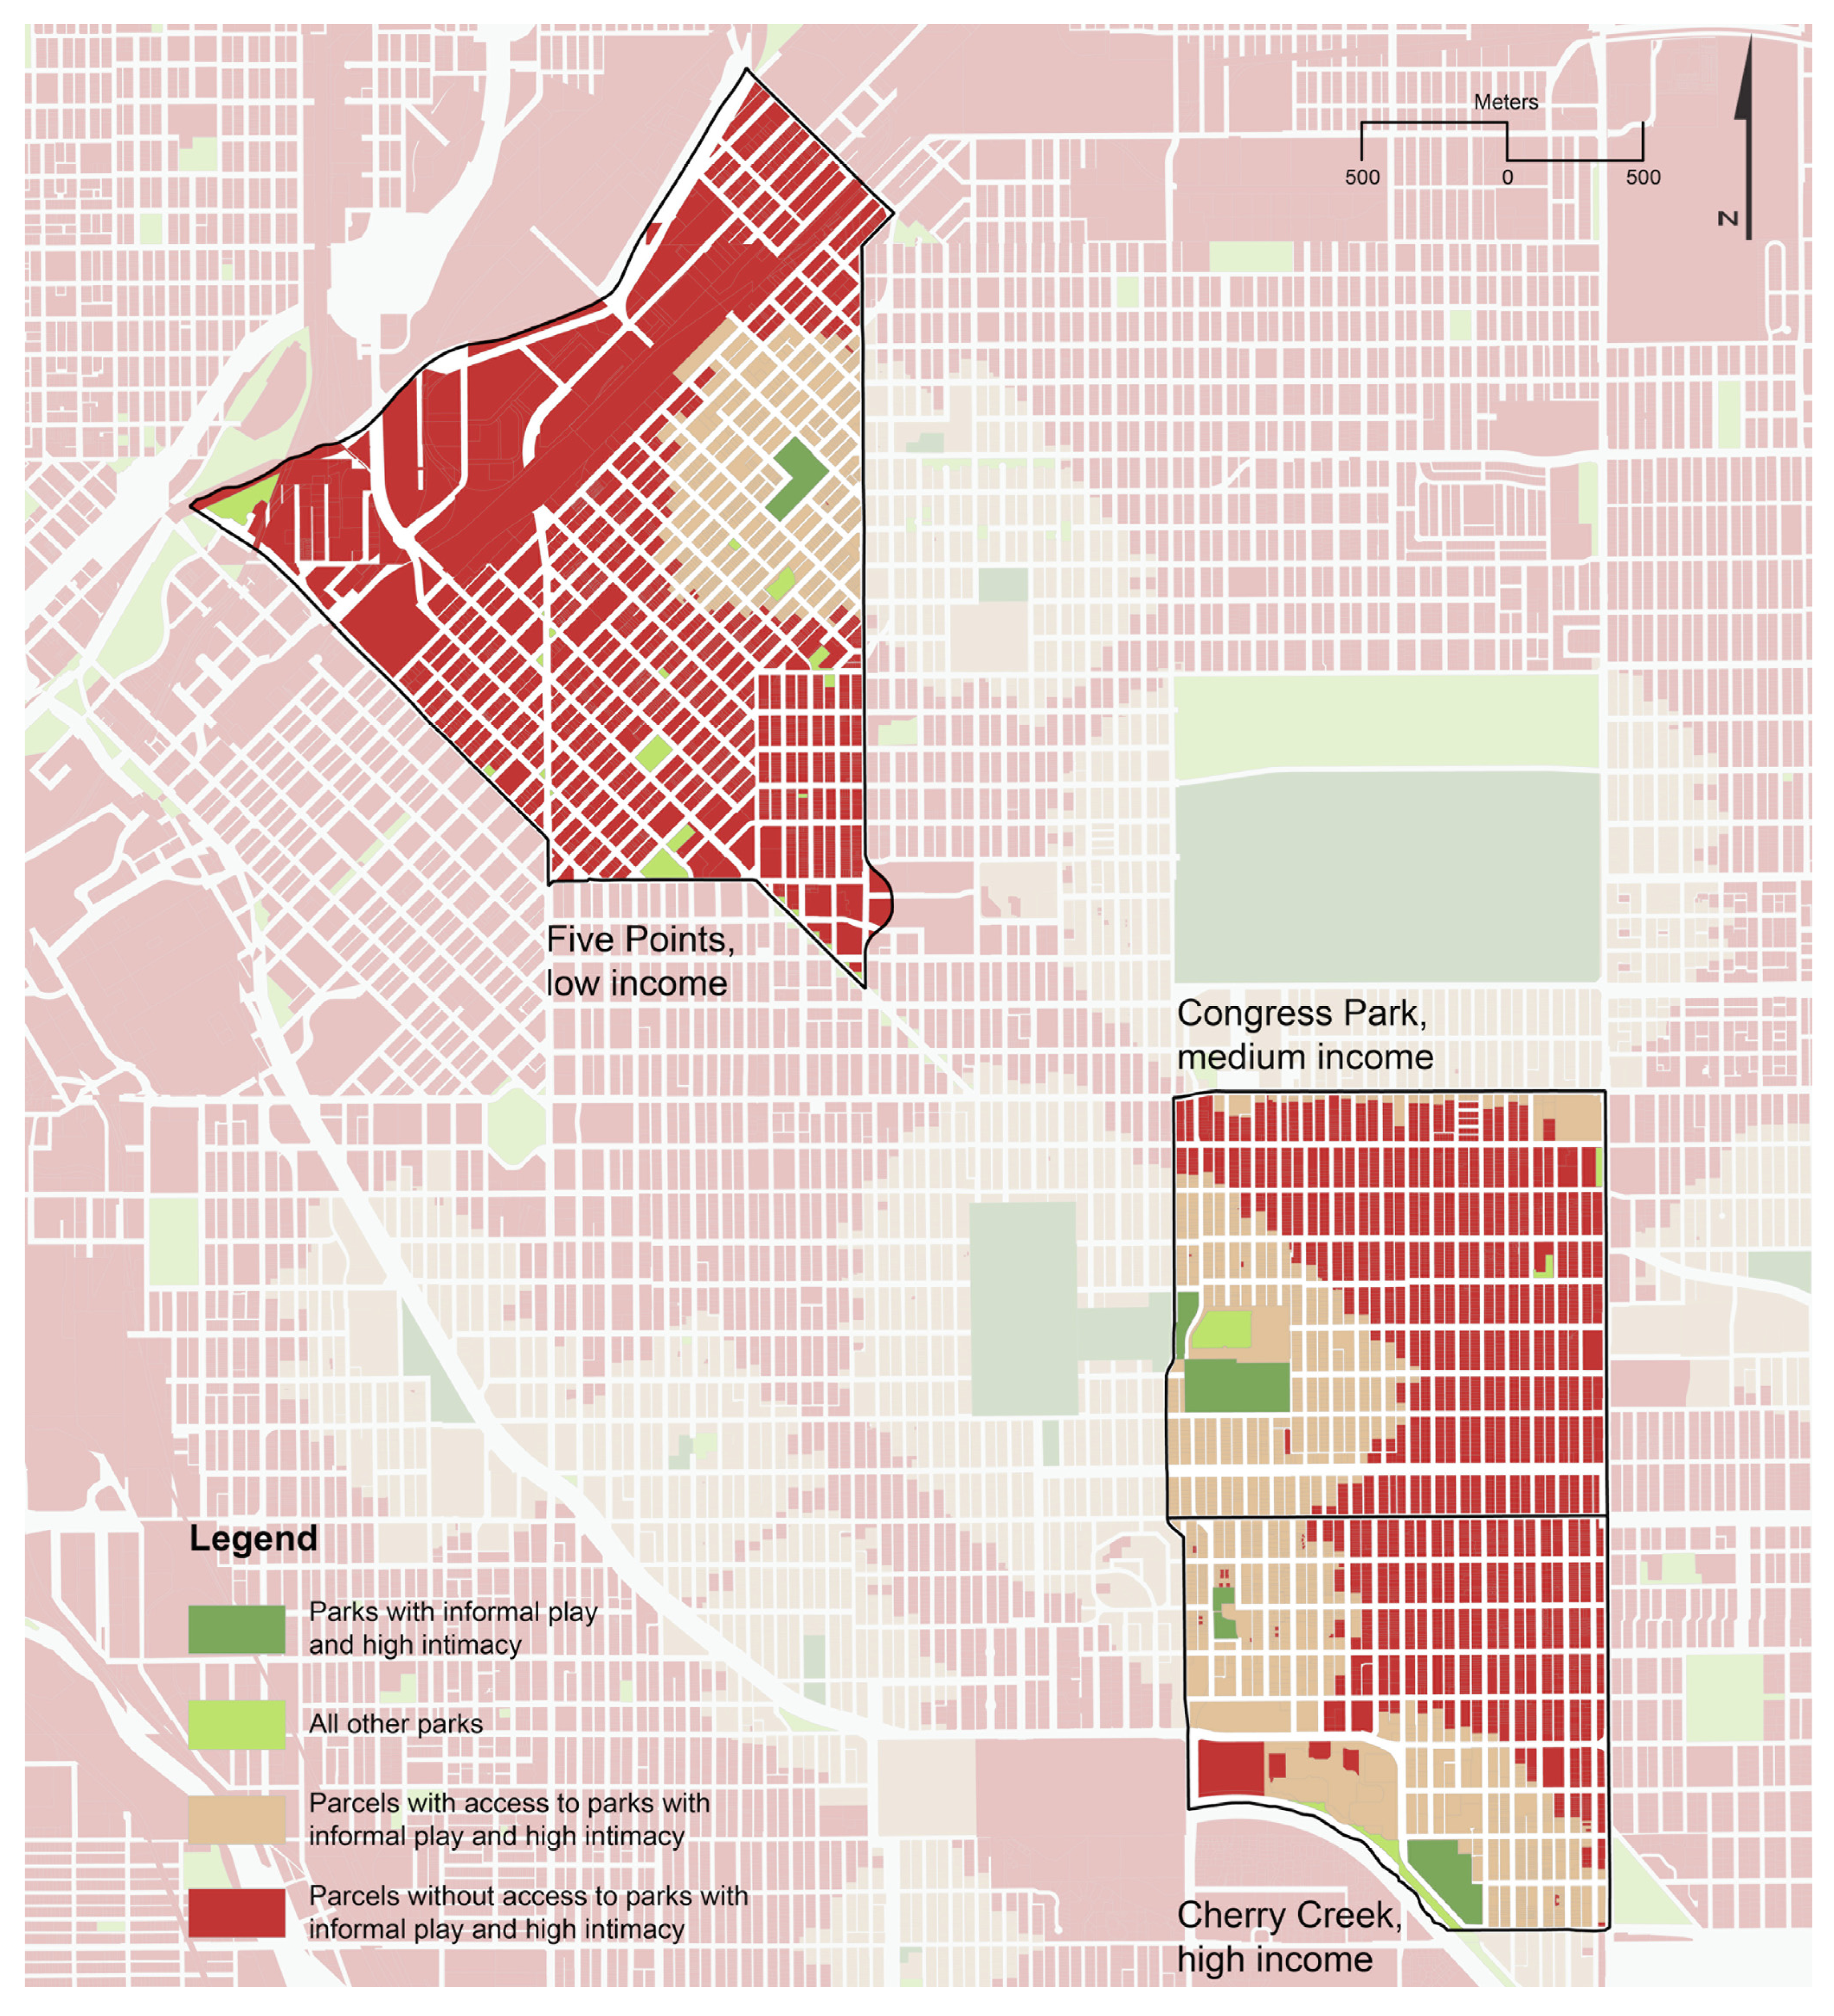
This research project started with the goal to describe, quantify, and evaluate the relationships between social justice variables and access to various types of parks. The initial results were presented to various community groups and they were well received despite the results showing non-equitable distributions of access to play in parks. Also, the community groups were interested in the practical application of our findings. The implications of this research are twofold: creating a flexible, participatory, prioritization framework for community organizations, leaders, and local policy makers and providing examples of affordable and achievable park policy and designs within this framework. Therefore, in this second part of the paper we propose some possible solutions to the environmental justice issues we identified.
As an example, our findings showed a deficiency of parks with informal play spaces, including a variety of natural elements, and with high levels of intimacy, particularly in areas of high-density development and urban poverty. Figure 2 shows the areas of deficiencies in three urban neighborhoods. In particular, Five Points, a neighborhood with a high concentration of poverty, includes larger areas of deficiency than the other two neighborhoods (Figure 2). Once the areas of deficiencies are known, we can build on the suitability analysis work of Ian McHarg [80], Frederick Steiner [81] and others; in their framework, planners, organizations, and professionals can facilitate community-developed suitability criteria to prioritize and select locations for built environment interventions that would optimally fill service gaps in park infrastructure. Numerous researchers have studied effective design and planning processes for children’s spaces and have concluded that, to create effective play spaces, it is best to build partnerships between public and private agencies, businesses, schools, and citizens of all ages [66,82,83,84].
Figure 2. Cherry Creek, Congress Park, and Five Points neighborhoods access to informal, highly intimate play spaces.
Buildings 04 00069 g002
The composition of key stakeholders is important and context specific. The exact composition varies depending on the stage of the process and needs of the community. For example, to define city or neighborhood level policy and design guidelines, all key stakeholders should be present to ensure that the generated policy and design guidelines will be accepted [85]. However, when addressing a single design implementation, the key stakeholders may be limited to a private developer and city officials, assuming they are working within the community accepted city policy and design guidelines. Due to the fluid nature of various contexts this paper simply presents a flexible framework to act as a guide when considering where interventions can be placed and when identifying who the key stakeholders are likely to be. In particular, an action framework involving stakeholders is presented in the next section. The combination of the processes discussed by Lopez and colleagues [82] with the suitability analysis and ecological framework presented by Steiner [81] provides a unique blueprint for design and policy guidelines to locate park interventions and for a prioritization framework when multiple options are encountered. 
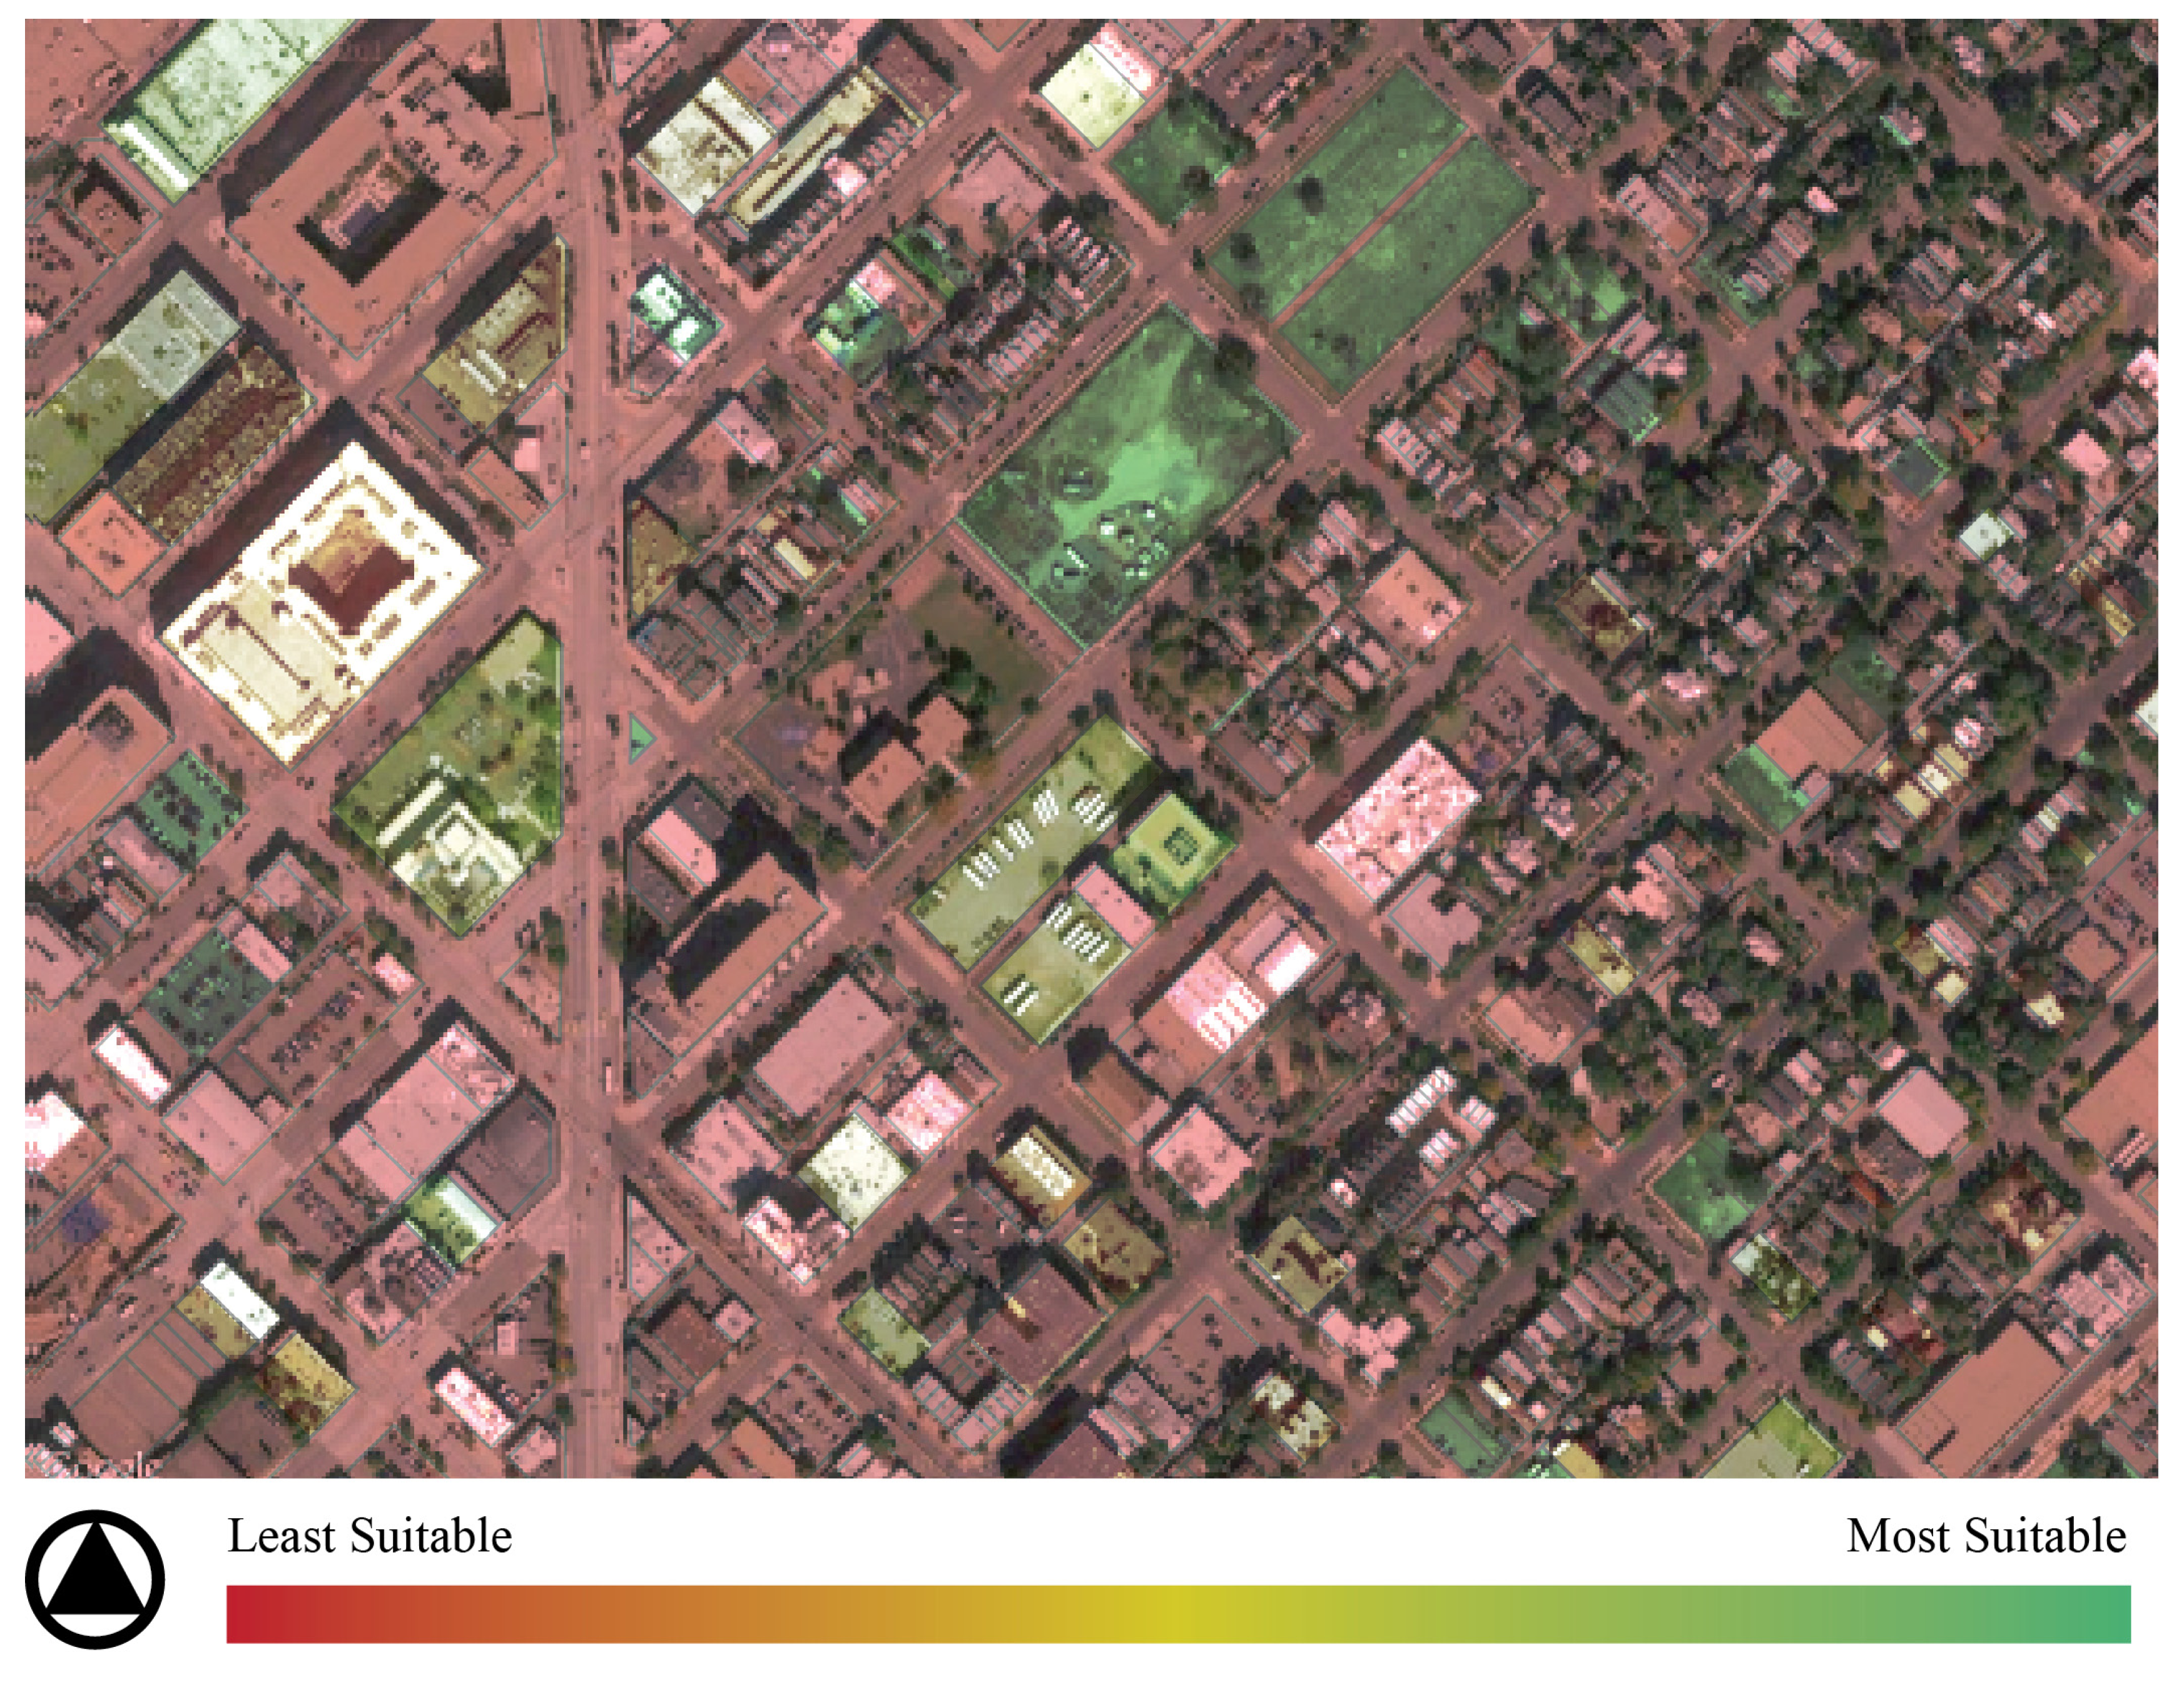
Figure 3 shows a completed suitability analysis for retrofitting existing alleys into park spaces, based on examples of suitability criteria (Table 7).
Table 7. Example of intervention types and possible suitability analysis criteria.
Intervention type Retrofit or new constructionPublic or private land ownershipExamples of suitability criteria framework
School Yard RenovationsRetrofitPublic or PrivateMinimum of “x” square meters of playground space that key stakeholders have identified as underused + open access to play areas when school is not in session + “x” meters from “x” density of population = possible retrofit locations
Park RenovationsRetrofitPublicMinimum of “x” square meters that key stakeholders have identified as underused, fields, or park spaces + minimum of “x” square meter size park + a park slated for renovations near “x” density of population = possible retrofit locations
New Green Spaces in Multifamily Residential Building ComplexesNew ConstructionPrivateMinimum of “x” density of proposed development + willingness of a density bonus for new amenities + lack of proximity to existing park infrastructure = possible locations for new green space infrastructure locations
Replacing Street Alley/Street SegmentsNew ConstructionPublic or Private Need for safe streets + under used streets that key stakeholders have identified as underused + need for street repair + near “x” density of population = possible street closure locations
Retrofitted or New Community GardensNew Construction or RetrofitPublic or PrivateMinimum of “x” square meters that key stakeholders have identified as underused + proximity to “x” high density of population
Identifying locations, using a suitability analysis, is a long-standing practice within ecological planning and landscape architecture [86]. Suitability analyses have three key criteria: defining a problem statement, defining what is suitable, and choosing the appropriate tools [87]. While the National Recreation and Park Association Standards were discontinued from time to time, within the United States, many states, municipalities, and consultants still use these standards for comparisons. However, to our knowledge none of these park typologies address informal, highly intimate play space requirements [88] or described spatial access requirements particular to children. Finding a suitable place for new parks can be problematic in dense urban neighborhoods, due to a lack of available undeveloped land. Then, suitability questions involve where it is suitable to locate: park renovations, school yard renovations, new green spaces within existing and new multi-family residential complexes, repurposing alleyways and/or street segments, and retrofitting community garden spaces.
Table 7 shows a brief list of intervention types and examples of potential suitability criteria for choosing intervention locations and strategies. Table 7 also shows the complexity of land ownership. It is worth mentioning that for each intervention type the key stakeholders are likely to be different and should be engaged to address land ownership issues, suitability criteria, and park design features. Many of these interventions require both policy and regulatory changes; however, many can be accomplished effectively with limited budgets and land resources within the existing urban fabric. Precedents exist for these policy changes and can be found in current initiatives that facilitate additional public housing, safe streets and safe routes to schools, traffic control, density and community character preservation, and urban quasi-public spaces. Such initiatives include zoning density bonuses [89,90], form based code [91,92], street and alleyway closures [93,94], school renovations [15,95,96], and community gardens [97].
Figure 3 highlights the use of a complete suitability analysis for a subarea of the Five Points neighborhood in Denver, Colorado. The problem was defined as the need to find suitable locations for a new pocket park. The suitability criteria should be developed using key stakeholders; however for this example they were: alleyways that do not provide direct lot access, that have less than 100 car counts per year, and that are within or adjacent to census blocks where over 25% of the population are children; or existing parks that are greater than 500 square meters, that have less than 100 yearly park visitors, and that are within or adjacent to census blocks where over 25% of the population are children; or industrial parcels that have sat vacant for more than 20 years, that are less than 2500 square meters and determined to no longer command a fair market value, and that are within or adjacent to census blocks where over 25% of the population are children. This example of suitability criteria shows how multiple factors need to be taken into account, including physical environment, economic, and social factors.

6. An Action Framework

This paper concludes with an action framework to increase underserved young people’s access to parks and outdoor play opportunities in cities, addressing one of the literature gaps we identified. Our framework presents a set of strategies, including several steps involving different actors, to achieve implementable design and policy goals outlined in the previous section. The proposed framework is rooted in a series of models of environmental interventions to increase physical activity and health [98,99,100,101,102]. 
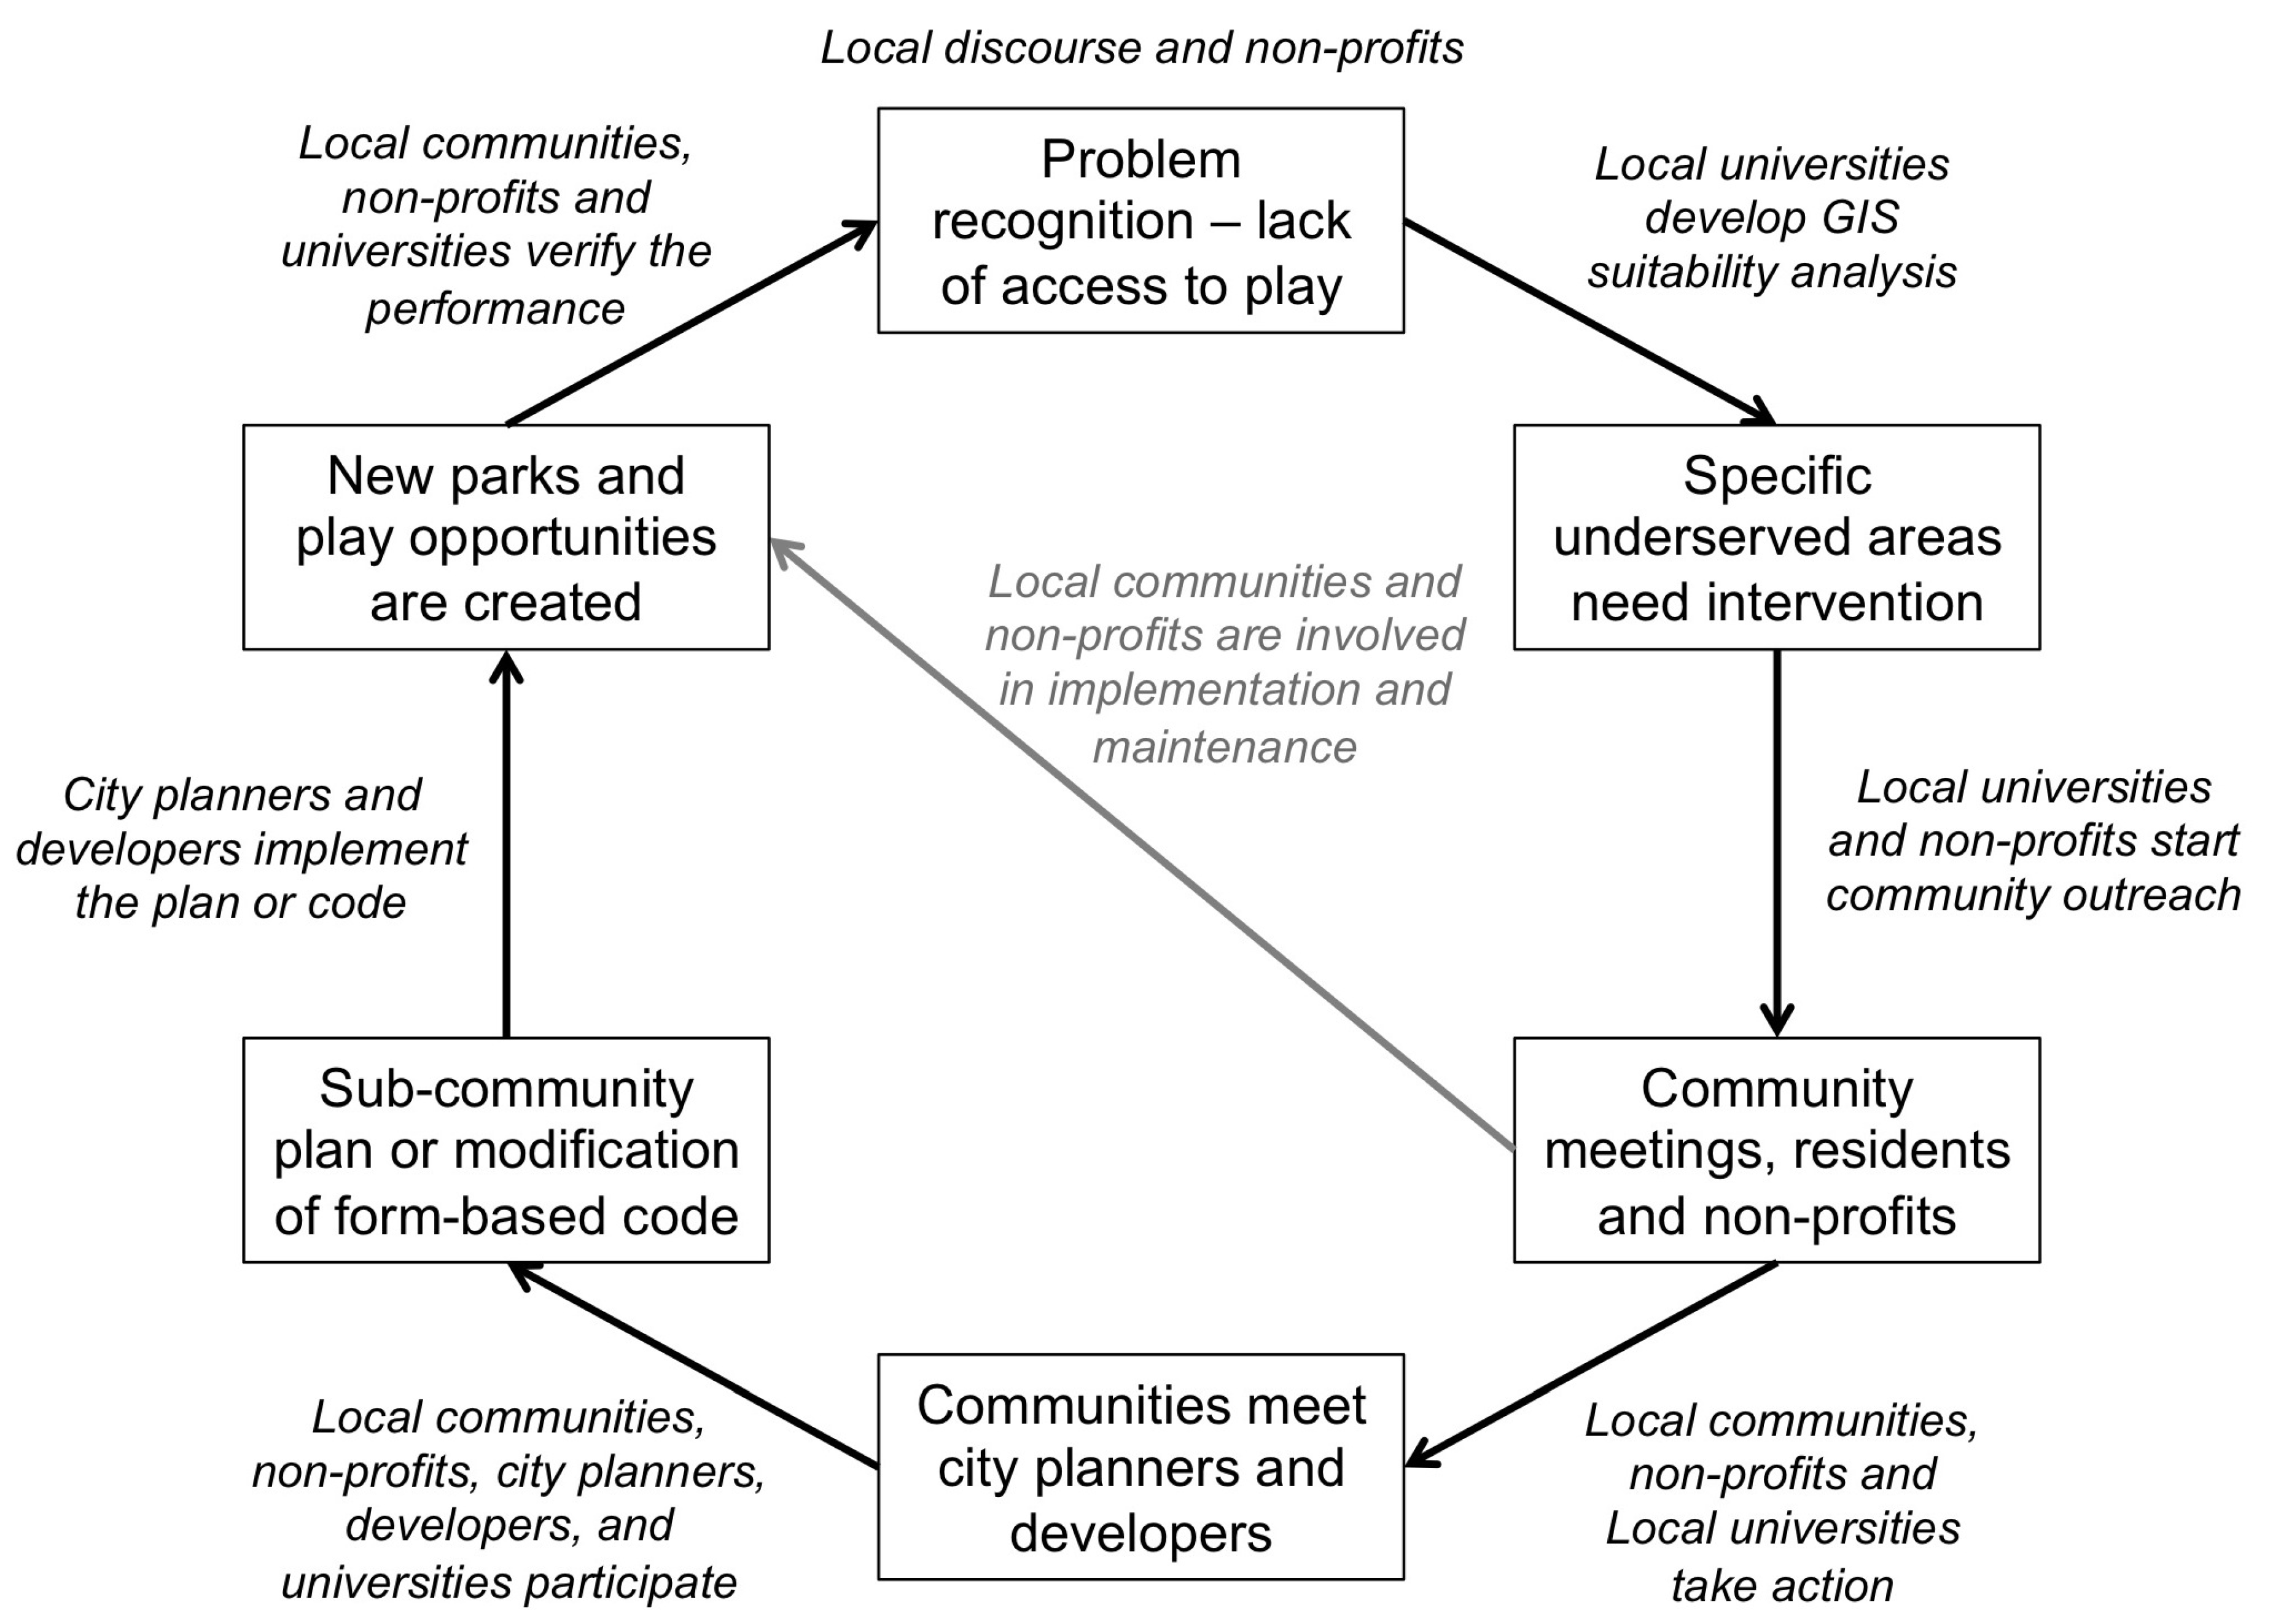
Figure 4 depicts our proposed model of action, including the various key stakeholders needed for each step of the framework. As mentioned in the previous section, the set of strategies we propose highlights the role of public-private partnerships in solving access to nature issues and the need for a bottom-up approach, involving local communities in decision making.
Figure 3. Example of suitability analysis for a highly intimate park with informal play spaces.
Buildings 04 00069 g003
Figure 4. An action framework to increase young people’s outdoor play opportunities.
Buildings 04 00069 g004
In particular, our bottom-up approach includes local non-profit organizations, universities, and community members collaborating to highlight issues and strategically solve them. A bottom-up approach is needed when greening low-income and ethnic areas, as research repeatedly shows that neighborhoods that were greened with a top-down approach tended to gentrify in several years following the interventions, a phenomenon known as ecological gentrification [103,104]. On the other hand, the participation of non-profit organizations and community members can be considered an example of community-based participatory research, as it was defined by Leung and colleagues [100]. Also, the same authors explain that such participatory research can be applied to local intervention plans [100]. In our framework, local universities can support local communities and non-profit organizations by developing suitability analysis tools to define locations that are underserved in terms of access to green spaces and play, thus needing interventions. The positive role of universities as supporters of community placemaking activities has been highlighted by previous research [105].
Each step of the process described in Figure 4 can be seen in the framework proposed by Sallis and colleagues [98], which includes the roles of advocacy, agencies, policies, and environments in increasing physical activity. First, the problem recognition, the analysis that shows specific underserved areas, and the community meetings can be seen as a form of advocacy. Then, the action undertaken to promote meetings between communities, city planners and developers can be considered a form of agency. Next, the creation of sub-community plans or the modifications of form-based codes focusing on creating or ameliorating new green spaces are policies deriving from advocacy and agency. Finally, new parks or refurbished parks with new play opportunities are the physical environment results of these coordinated efforts.
However, not all steps presented in Figure 4 are always necessary to create new green spaces and play opportunities. Indeed, local communities could take action to create new open spaces designed, built, and managed by the community itself, such as community gardens [101,102,106]. These spaces, often constructed on private land like vacant lots, can constitute a viable alternative to traditional parks [102]. In this scenario, non-profit organizations could help communities raise funds to build new open spaces, and local residents could actively participate in maintaining the new open spaces, including initiatives to increase children and youth’s sense of safety.

7. Limitations

The research design and methods we employed in this study have some limitations that can be addressed in future research. First, in this paper we defined “access” from a quantitative point of view only. Indeed, the threshold of a quarter mile as the maximum distance individuals are likely to walk to reach a destination should be re-assessed when focusing on young people’s independent or social mobility. Other aspects, like safety and social capital, could be explored with qualitative methods to generate an expanded definition of accessibility. Second, in this paper we did not investigate the reasons why certain parts of the city are underserved by parks and play opportunities. Policy document analysis or investment analysis could be used to uncover these reasons. Third, the suitability analysis and action frameworks we proposed are flexible models, but they need to be customized to fit specific situations because, as we argued, successful actions to address environmental justice issues need to start from local communities.

8. Conclusions

In this study, we compared access to parks and play opportunities in parks for young people living in neighborhoods with different levels of income and different population densities and distances from downtown. Our findings support the results of previous published research about park access and show that low-income ethnic areas have significantly less access to parks than high-income white areas. Furthermore, this study methodologically advances spatial access research by creating a ratio access variable using a smaller geographical unit, i.e., parcels, than previous studies. Our findings also show a large disparity in access to parks that promote structured and unstructured play in intimate and natural settings, further marginalizing low-income neighborhoods. Finally, this study provides a practical action framework for creating affordable play spaces within low-income communities, to improve low-income children and youth’s access to nature and play, consequently improving their health.

Acknowledgments

The authors received no financial support in preparation of the publication of this article and would like to thank Sharon E. Sutton, the Guest Editor of this Special Issue, for her feedback and encouragement throughout the research process.

Author Contributions

The co-authors contributed actively to this research project and to writing this article.

Conflicts of Interest

The authors declare no conflict of interest.

References

  1. McCurdy, L.E.; Winterbottom, K.E.; Mehta, S.S.; Roberts, J.R. Using nature and outdoor activity to improve children’s health. Curr. Probl. Pediatr. Adolesc. Health Care 2010, 40, 102–117. [Google Scholar] [CrossRef]
  2. Wells, N.M.; Evans, G.W. Nearby nature: A buffer of life stress among rural children. Environ. Behav. 2003, 35, 311–330. [Google Scholar] [CrossRef]
  3. Burdette, H.L.; Whitaker, R.C. Resurrecting free play in young children: Looking beyond fitness and fatness to attention, affiliation, and affect. Arch. Pediatr. Adolesc. Med. 2005, 159, 46–50. [Google Scholar] [CrossRef]
  4. Wells, N.M. At home with nature: Effects of “greenness” on children’s cognitive functioning. Environ. Behav. 2000, 32, 775–795. [Google Scholar] [CrossRef]
  5. Moore, R.C. Childhood’s Domain: Play and Place in Child Development; Croom Helm: London, UK, 1986. [Google Scholar]
  6. Clemens, R. An investigation of the status of outdoor play. Contemp. Issues Early Child. 2004, 5, 68–80. [Google Scholar] [CrossRef]
  7. Karsten, L. It all used to be better? Different generations on continuity and change in urban children’s daily use of space. Child. Geogr. 2005, 3, 275–290. [Google Scholar] [CrossRef]
  8. Wridt, P.J. An historical analysis of young people’s use of public space, parks and playgrounds in New York City. Child. Youth Environ. 2004, 14, 86–106. [Google Scholar]
  9. National Recreation and Park Association. Parks & Recreation in Underserved Areas: A Public Health Perspective; National Recreation and Park Association: Ashburn, VA, USA, 2011. [Google Scholar]
  10. Platt, L. “Parks are dangerous and the sidewalk is closer”: Children’s use of neighborhood space in Milwaukee, Wisconsin. Child. Youth Environ. 2012, 22, 194–213. [Google Scholar]
  11. Gómez, J.E.; Johnson, B.A.; Selva, M.; Sallis, J.F. Violent crime and outdoor physical activity among inner-city youth. Prev. Med. (Baltim) 2004, 39, 876–881. [Google Scholar] [CrossRef]
  12. Evans, G.W. The environment of childhood poverty. Am. Psychol. 2004, 59, 77–92. [Google Scholar] [CrossRef]
  13. Potwarka, L.R.; Kaczynski, A.T.; Flack, A.L. Places to play: Association of park space and facilities with healthy weight status among children. J. Community Health 2008, 33, 344–350. [Google Scholar] [CrossRef]
  14. Staempfli, M.B. Reintroducing adventure into children’s outdoor play environments. Environ. Behav. 2009, 41, 268–280. [Google Scholar] [CrossRef]
  15. Dyment, J.E.; Bell, A.C.; Lucas, A.J. The relationship between school ground design and intensity of physical activity. Child. Geogr. 2009, 7, 261–276. [Google Scholar] [CrossRef]
  16. Kaplan, R. Impact of urban nature: A theoretical analysis. Urban. Ecol. 1984, 8, 189–197. [Google Scholar] [CrossRef]
  17. Baur, J.W.R.; Tynon, J.F.; Gómez, E. Attitudes about urban nature parks: A case study of users and nonusers in Portland, Oregon. Landsc. Urban. Plan. 2013, 117, 100–111. [Google Scholar] [CrossRef]
  18. Beatley, T. Biophlic Cities: Integrating Nature into Urban Design and Planning; Island Press: Washington, DC, USA, 2011. [Google Scholar]
  19. Herzog, T.R. A cognitive analysis of preference for urban nature. J. Environ. Psychol. 1989, 9, 27–43. [Google Scholar] [CrossRef]
  20. Sullivan, W.C.; Kuo, F.E.; Depooter, S.F. The fruit of urban nature: Vital neighborhood spaces. Environ. Behav. 2004, 36, 678–700. [Google Scholar] [CrossRef]
  21. Macintyre, S. Deprivation amplification revisited; or, is it always true that poorer places have poorer access to resources for healthy diets and physical activity? Int. J. Behav. Nutr. Phys. Act. 2007, 4, 1–7. [Google Scholar] [CrossRef]
  22. Comber, A.; Brundson, C.; Green, E. Using a GIS-based network analysis to determine urban greenspace accessibility for different ethnic and religious groups. Landsc. Urban. Plan. 2008, 86, 103–114. [Google Scholar] [CrossRef]
  23. Cradock, A.L.; Kawachi, I.; Colditz, G.A.; Hannon, C.; Melly, S.J.; Wiecha, J.L.; Gortmaker, S.L. Playground safety and access in Boston neighborhoods. Am. J. Prev. Med. 2005, 28, 357–363. [Google Scholar] [CrossRef]
  24. Ellaway, A.; Kirk, A.; Macintyre, S.; Mutrie, N. Nowhere to play? The relationship between the location of outdoor play areas and deprivation in Glasgow. Health Place 2007, 13, 557–561. [Google Scholar] [CrossRef]
  25. Erkip, F. The distribution of urban public services: The case of parks and recreational services in Ankara. Cities 1997, 14, 353–361. [Google Scholar] [CrossRef]
  26. Gilliland, J.; Holmes, M.; Irwin, J.D.; Tucker, P. Environmental equity is child’s play: Mapping public provision of recreation opportunities in urban neighbourhoods. Vulnerable Child. Youth Stud. 2006, 1, 256–268. [Google Scholar] [CrossRef]
  27. Jones, A.P.; Brainard, J.; Bateman, I.J.; Lovett, A.A. Equity of access to public parks in Birmingham, England. Environ. Res. J. 2009, 3, 237–256. [Google Scholar]
  28. Loukaitou-Sideris, A.; Stieglitz, O. Children in Los Angeles parks: A study of equity, quality and children’s satisfaction with neighbourhood parks. Town Plan. Rev. 2002, 73, 467–488. [Google Scholar] [CrossRef]
  29. Moore, L.V.; Diez Roux, A.V.; Evenson, K.R.; McGinn, A.P.; Brines, S.J. Availability of recreational resources in minority and low socioeconomic status areas. Am. J. Prev. Med. 2008, 34, 16–22. [Google Scholar] [CrossRef]
  30. Nicholls, S. Measuring the accessibility and equity of public parks: A case study using GIS. Manag. Leis. 2001, 6, 201–219. [Google Scholar] [CrossRef]
  31. Smoyer-Tomic, K.E.; Hewko, J.N.; Hodgson, M.J. Spatial accessibility and equity of playgrounds in Edmonton, Canada. Can. Geogr. 2004, 48, 287–302. [Google Scholar] [CrossRef]
  32. Talen, E. The social equity of urban service distribution: An exploration of park access in Pueblo, Colorado, and Macon, Georgia. Urban. Geogr. 1997, 18, 521–541. [Google Scholar] [CrossRef]
  33. Talen, E.; Anselin, L. Assessing spatial equity: An evaluation of measures of accessibility to public playgrounds. Environ. Plan. A 1998, 30, 595–613. [Google Scholar]
  34. Timperio, A.F.; Ball, K.; Salmon, J.; Roberts, R.; Crawford, D. Is availability of public open space equitable across areas? Health Place 2007, 13, 335–340. [Google Scholar] [CrossRef]
  35. Wolch, J.; Wilson, P.; Fehrenbach, J. Parks and park funding in Los Angeles: An equity-mapping analysis. Urban. Geogr. 2005, 26, 4–35. [Google Scholar] [CrossRef]
  36. Christie, N.; Kimberlee, R.; Towner, E.; Rodgers, S.; Ward, H.; Sleney, J.; Lyons, R. Children aged 9–14 living in disadvantaged areas in England: Opportunities and barriers for cycling. J. Transp. Geogr. 2011, 19, 943–949. [Google Scholar] [CrossRef]
  37. Crawford, D.; Timperio, A.; Giles-Corti, B.; Ball, K.; Hume, C.; Roberts, R.; Andrianopoulos, N.; Salmon, J. Do features of public open spaces vary according to neighbourhood socio-economic status? Health Place 2008, 14, 889–893. [Google Scholar] [CrossRef]
  38. Cutts, B.B.; Darby, K.J.; Boone, C.G.; Brewis, A. City structure, obesity, and environmental justice: An integrated analysis of physical and social barriers to walkable streets and park access. Soc. Sci. Med. 2009, 69, 1314–1322. [Google Scholar] [CrossRef]
  39. Duncan, D.T.; Aldstadt, J.; Whalen, J.; White, K.; Castro, M.C.; Williams, D.R. Space, race, and poverty: Spatial inequalities in walkable neighborhood amenities? Demogr. Res. 2012, 26, 409–448. [Google Scholar] [CrossRef]
  40. Franzini, L.; Taylor, W.; Elliott, M.N.; Cuccaro, P.; Tortolero, S.R.; Janice Gilliland, M.; Grunbaum, J.; Schuster, M.A. Neighborhood characteristics favorable to outdoor physical activity: Disparities by socioeconomic and racial/ethnic composition. Health Place 2010, 16, 267–274. [Google Scholar] [CrossRef]
  41. Talen, E. Neighborhoods as service providers: A methodology for evaluating pedestrian access. Environ. Plan. B 2003, 30, 181–200. [Google Scholar] [CrossRef]
  42. Dyment, J.E. “There’s only so much money hot dog sales can bring in”: The intersection of green school grounds and socio-economic status. Child. Geogr. 2005, 3, 307–323. [Google Scholar] [CrossRef]
  43. Lindsey, G.; Maraj, M.; Kuan, S. Access, equity and urban greenways: An exploratory investigation. Prof. Geogr. 2001, 53, 332–346. [Google Scholar] [CrossRef]
  44. Landry, S.M.; Chakraborty, J. Street trees and equity: Evaluating the spatial distribution of an urban amenity. Environ. Plan. A 2009, 41, 2651–2670. [Google Scholar] [CrossRef]
  45. Heiman, M.K. Race, waste, and class: New perspectives on environmental justice. Antipode 1996, 28, 111–121. [Google Scholar] [CrossRef]
  46. Floyd, M.F.; Johnson, C.Y. Coming to terms with environmental justice in outdoor recreation: A conceptual discussion with research implications. Leis. Sci. 2002, 24, 59–77. [Google Scholar] [CrossRef]
  47. Flaskerud, J.H.; Winslow, B.J. Conceptualizing vulnerable populations health-related research. Nurs. Res. 1998, 47, 69–78. [Google Scholar] [CrossRef]
  48. Strife, S.; Downey, L. Childhood development and access to nature: A new direction for environmental inequality research. Organ. Environ. 2009, 22, 99–122. [Google Scholar] [CrossRef]
  49. Ribot, J.C.; Peluso, N.L. A theory of access. Rural Sociol. 2009, 68, 153–181. [Google Scholar] [CrossRef]
  50. Berg, M.; Medrich, E.A. Children in four neighborhoods: The physical environment and its effect on play and play patterns. Environ. Behav. 1980, 12, 320–348. [Google Scholar] [CrossRef]
  51. Veitch, J.; Salmon, J.; Ball, K. Children’s active free play in local neighborhoods: A behavioral mapping study. Health Educ. Res. 2007, 23, 870–879. [Google Scholar] [CrossRef]
  52. Jones, A.P.; Hillsdon, M.; Coombes, E. Greenspace access, use, and physical activity: Understanding the effects of area deprivation. Prev. Med. (Baltim) 2009, 49, 500–505. [Google Scholar] [CrossRef]
  53. Organisation for Economic Co-operation and Development. Society at a glance 2011: OECD Social Indicators. In Society at a Glance; OECD Publishing: Paris, France, 2011. [Google Scholar]
  54. Suecoff, S.A.; Avner, J.R.; Chou, K.J.; Crain, E.F. A comparison of New York City playground hazards in high-and low-income areas. Arch. Pediatr. Adolesc. Med. 1999, 153, 363–366. [Google Scholar]
  55. Fagerholm, N.; Broberg, A. Mapping and characterising children’s daily mobility in urban residential areas in Turku, Finland. Fenn. J. Geogr. 2011, 189, 31–46. [Google Scholar]
  56. O’Neil, R.; Parke, R.D.; McDowell, D.J. Objective and subjective features of children’s neighborhoods: Relations to parental regulatory strategies and children’s social competence. Appl. Dev. Psychol. 2001, 135–155. [Google Scholar]
  57. Tranter, P.; Pawson, E. Children’s access to local environments: A case-study of Christchurch, New Zealand. Local Environ. 2001, 6, 27–48. [Google Scholar] [CrossRef]
  58. Piton Foundation the Children’s Corridor. Available online: http://www.denverchildrenscorridor.org/ (accessed on 2 February 2014).
  59. LiveWell Colorado Healthy Communities. Available online: http://livewellcolorado.org/healthy-communities (accessed on 2 February 2014).
  60. Onwuegbuzie, A.J.; Collins, K. A typology of mixed methods sampling designs in social science research. Qual. Rep. 2007, 12, 36. [Google Scholar]
  61. United States Census Bureau Urban and Rural Classification—Geography. Available online: http://www.census.gov/geo/reference/urban-rural.html (accessed on 1 October 2014).
  62. United States Census Bureau Poverty Data—Poverty Thresholds. Available online: http://www.census.gov/hhes/www/poverty/data/threshld/index.html (accessed on 1 October 2014).
  63. Gray, P. The decline of play and the rise of psychopathology in children and adolescents. Am. J. Play 2011, 3, 443–463. [Google Scholar]
  64. Cosco, N.G. Motivation to Move: Physical Activity Affordances in Preschool Play Areas; Heriot Watt University: Edinburgh, UK, 2006. [Google Scholar]
  65. Appleton, J. The Experience of Landscape; John Wiley & Sons: New York, NY, USA, 1975. [Google Scholar]
  66. Francis, M. Negotiating between children and adult design values in open space projects. Des. Stud. 1988, 9, 67–75. [Google Scholar] [CrossRef]
  67. Wade, T.; Sommer, S. A to Z GIS: An Illustrated Dictionary of Geographic Information Systems, 2nd ed.; ESRI Press: Redlands, CA, USA, 2006. [Google Scholar]
  68. Krizek, K. Operationalizing neighborhood accessibility for land use-travel behavior research and regional modeling. J. Plan. Educ. Res. 2003, 22, 270–287. [Google Scholar] [CrossRef]
  69. Napier, M.A.; Brown, B.B.; Werner, C.M.; Gallimore, J. Walking to school: Community design and child and parent barriers. J. Environ. Psychol. 2011, 31, 45–51. [Google Scholar] [CrossRef]
  70. Pont, K.; Wadley, D.; Ziviani, J.; Khan, A. The influence of urban form and family decision making on children’s travel to school. J. Urban. Des. 2013, 18, 363–382. [Google Scholar] [CrossRef]
  71. Rosenberg, D.; Ding, D.; Sallis, J.F.; Kerr, J.; Norman, G.J.; Durant, N.; Harris, S.K.; Saelens, B.E. Neighborhood Environment Walkability Scale for Youth (NEWS-Y): Reliability and relationship with physical activity. Prev. Med. (Baltim) 2009, 49, 213–218. [Google Scholar] [CrossRef]
  72. Larsen, K.; Gilliland, J.; Hess, P.; Tucker, P.; Irwin, J.; He, M. The influence of the physical environment and sociodemographic characteristics on children’s mode of travel to and from school. Res. Pract. 2009, 99, 520–526. [Google Scholar]
  73. Kerr, J.; Rosenberg, D.; Sallis, J.F.; Saelens, B.E.; Frank, L.D.; Conway, T.L. Active commuting to school: Associations with environment and parental concerns. Med. Sci. Sports Exerc. 2006, 38, 787–794. [Google Scholar]
  74. Trapp, G.S.; Giles-Corti, B.; Christian, H.E.; Bulsara, M.; Timperio, A.F.; McCormack, G.R.; Villaneuva, K.P. On your bike! A cross-sectional study of the individual, social and environmental correlates of cycling to school. Int. J. Behav. Nutr. Phys. Act. 2011, 8, 123–132. [Google Scholar] [CrossRef]
  75. Veitch, J.; Bagley, S.; Ball, K.; Salmon, J. Where do children usually play? A qualitative study of parents’ perceptions of influences on children’s active free-play. Health Place 2006, 12, 383–393. [Google Scholar] [CrossRef]
  76. City of Denver Mild and mile high. Available online: http://www.denver.org/metro/weather (accessed on 1 October 2014).
  77. Pont, K.; Ziviani, J.; Wadley, D.; Abbott, R. The Model of Children’s Active Travel (M-CAT): A conceptual framework for examining factors influencing children’s active travel. Aust. Occup. Ther. J. 2011, 58, 138–144. [Google Scholar] [CrossRef]
  78. Leech, N.L.; Barrett, K.C.; Morgan, G.A. IBM SPSS for Intermediate Statistics: Use and Interpretation, 4th ed.; Routledge: New York, NY, USA, 2011. [Google Scholar]
  79. Sheskin, D.J. Handbook of Parametric and Nonparametric Statistical Procedures, 4th ed.; Chapman & Hall/CRC: Boca Raton, FL, USA, 2007. [Google Scholar]
  80. McHarg, I.L. Design with Nature; John Wiley & Sons: New York, NY, USA, 1992. [Google Scholar]
  81. Steiner, F.R. The Living Landscape: An Ecological Approach to Landscape Planning, 2nd ed.; Island Press: Washington, DC, USA, 2008. [Google Scholar]
  82. Lopez, R.; Campbell, R.; Jennings, J. The Boston schoolyard initiative: A public-private partnership for rebuilding urban play spaces. J. Health Polit. Policy Law 2013, 38, 617–638. [Google Scholar]
  83. Brink, L.; Yost, B. Transforming inner-city school grounds: Lessons from learning landscapes. Child. Youth Environ. 2004, 14, 209–233. [Google Scholar]
  84. Frank, K.I. The potential of youth participation in planning. J. Plan. Lit. 2006, 20, 351–371. [Google Scholar] [CrossRef]
  85. Innes, J.; Booher, D. Planning with Complexity: An. Introduction to Collaborative Rationality for Public Policy; Routledge: New York, NY, USA, 2010. [Google Scholar]
  86. Collins, M.G.; Steiner, F.R.; Rushman, M.J. Land-use suitability analysis in the United States: Historical development and promising technological achievements. Environ. Manag. 2001, 28, 611–621. [Google Scholar] [CrossRef]
  87. Mitchell, A. The ESRI Guide to GIS Analysis, Volume 3: Modeling Suitability, Movement, and Interaction; ESRI Press: Redlands, CA, USA, 2012; Volume 3. [Google Scholar]
  88. National Recreation and Park Association. Parks and Recreation: National Database Report; National Recreation and Park Association: Ashburn, VA, USA, 2014. [Google Scholar]
  89. Keating, W.D. Linking downtown development to broader community goals: An analysis of linkage policy in three cities. J. Am. Plan. Assoc. 1986, 52, 133–141. [Google Scholar] [CrossRef]
  90. Cervero, R. Journal report: Light tail transit and urban development. J. Am. Plan. Assoc. 1984, 50, 133–147. [Google Scholar] [CrossRef]
  91. Ewing, R.; Handy, S. Measuring the unmeasurable: Urban design qualities related to walkability. J. Urban. Des. 2009, 14, 65–84. [Google Scholar] [CrossRef]
  92. Wheeler, S.M. The evolution of urban form in Portland and Toronto: Implications for sustainability planning. Local Environ. 2003, 8, 317–336. [Google Scholar] [CrossRef]
  93. Pucher, J.; Dijkstra, L. Promoting safe walking and cycling to improve public health: Lessons from the Netherlands and Germany. Am. J. Public Health 2003, 93, 1509–1516. [Google Scholar] [CrossRef]
  94. Wolch, J.; Newell, J.; Seymour, M.; Huang, H.B.; Reynolds, K.; Mapes, J. The forgotten and the future: Reclaiming back alleys for a sustainable city. Environ. Plan. A 2010, 42, 2874–2896. [Google Scholar] [CrossRef]
  95. Dyment, J.E.; Bell, A.C. Grounds for movement: Green school grounds as sites for promoting physical activity. Health Educ. Res. 2008, 23, 952–962. [Google Scholar] [CrossRef]
  96. Herrington, S.; Studtmann, K. Landscape interventions: New directions for the design of children’s outdoor play environments. Landsc. Urban. Plan. 1998, 42, 191–205. [Google Scholar] [CrossRef]
  97. Nedovic, S.; Morrissey, A.-M. Calm active and focused: Children’s responses to an organic outdoor learning environment. Learn. Environ. Res. 2013, 16, 281–295. [Google Scholar] [CrossRef]
  98. Sallis, J.F.; Bauman, A.E.; Pratt, M. Environmental and policy interventions to promote physical activity. Am. J. Prev. Med. 1998, 15, 379–397. [Google Scholar] [CrossRef]
  99. French, S.A.; Story, M.; Jeffery, R.W. Environmental influences on eating and physical activity. Annu. Rev. Public Health 2001, 22, 309–335. [Google Scholar] [CrossRef]
  100. Leung, M.W.; Yen, I.H.; Minkler, M. Community based participatory research: A promising approach for increasing epidemiology’s relevance in the 21st century. Int. J. Epidemiol. 2004, 33, 499–506. [Google Scholar] [CrossRef]
  101. Twiss, J.; Dickinson, J.; Duma, S.; Kleinman, T.; Paulsen, H.; Rilveria, L. Community gardens: Lessons learned from California healthy cities and communities. Am. J. Public Health 2003, 93, 1435–1438. [Google Scholar] [CrossRef]
  102. Francis, M.; Cashdan, L.; Paxson, L. Community Open Spaces: Green Neighborhoods Through Community Action and Land Conservation; Island Press: Washington, DC, USA, 1994. [Google Scholar]
  103. Dooling, S. Ecological gentrification: A research agenda exploring justice in the city. Int. J. Urban. Reg. Res. 2009, 33, 621–639. [Google Scholar] [CrossRef]
  104. Gould, K.A.; Lewis, T.L. The Environmental Injustice of Green Gentrification: The Case of Brooklyn’s Prospect Park. In The World in Brooklyn: Gentrification, Immigration, and Ethnic Politics in a Global City; DeSena, J., Shortell, T., Eds.; Lexington Books: Plymouth, UK, 2012; pp. 113–146. [Google Scholar]
  105. Sutton, S.E.; Kemp, S.P. Children as partners in neighborhood placemaking: Lessons from intergenerational design charrettes. J. Environ. Psychol. 2002, 22, 171–189. [Google Scholar] [CrossRef]
  106. Tidball, K.G.; Krasny, M.E. From Risk to Resilience: What Role for Community Greening and Civic Ecology in Cities? In Social Learning towards a Sustainable World; Wals, A.E.J., Ed.; Wageningen, The Netherlands, 2007; pp. 149–164. [Google Scholar]

