
Performance Evaluation of Well-Insulated Versions of Contemporary Wall Systems—A Case Study of London for a Warmer Climate

Abstract
:1. Introduction
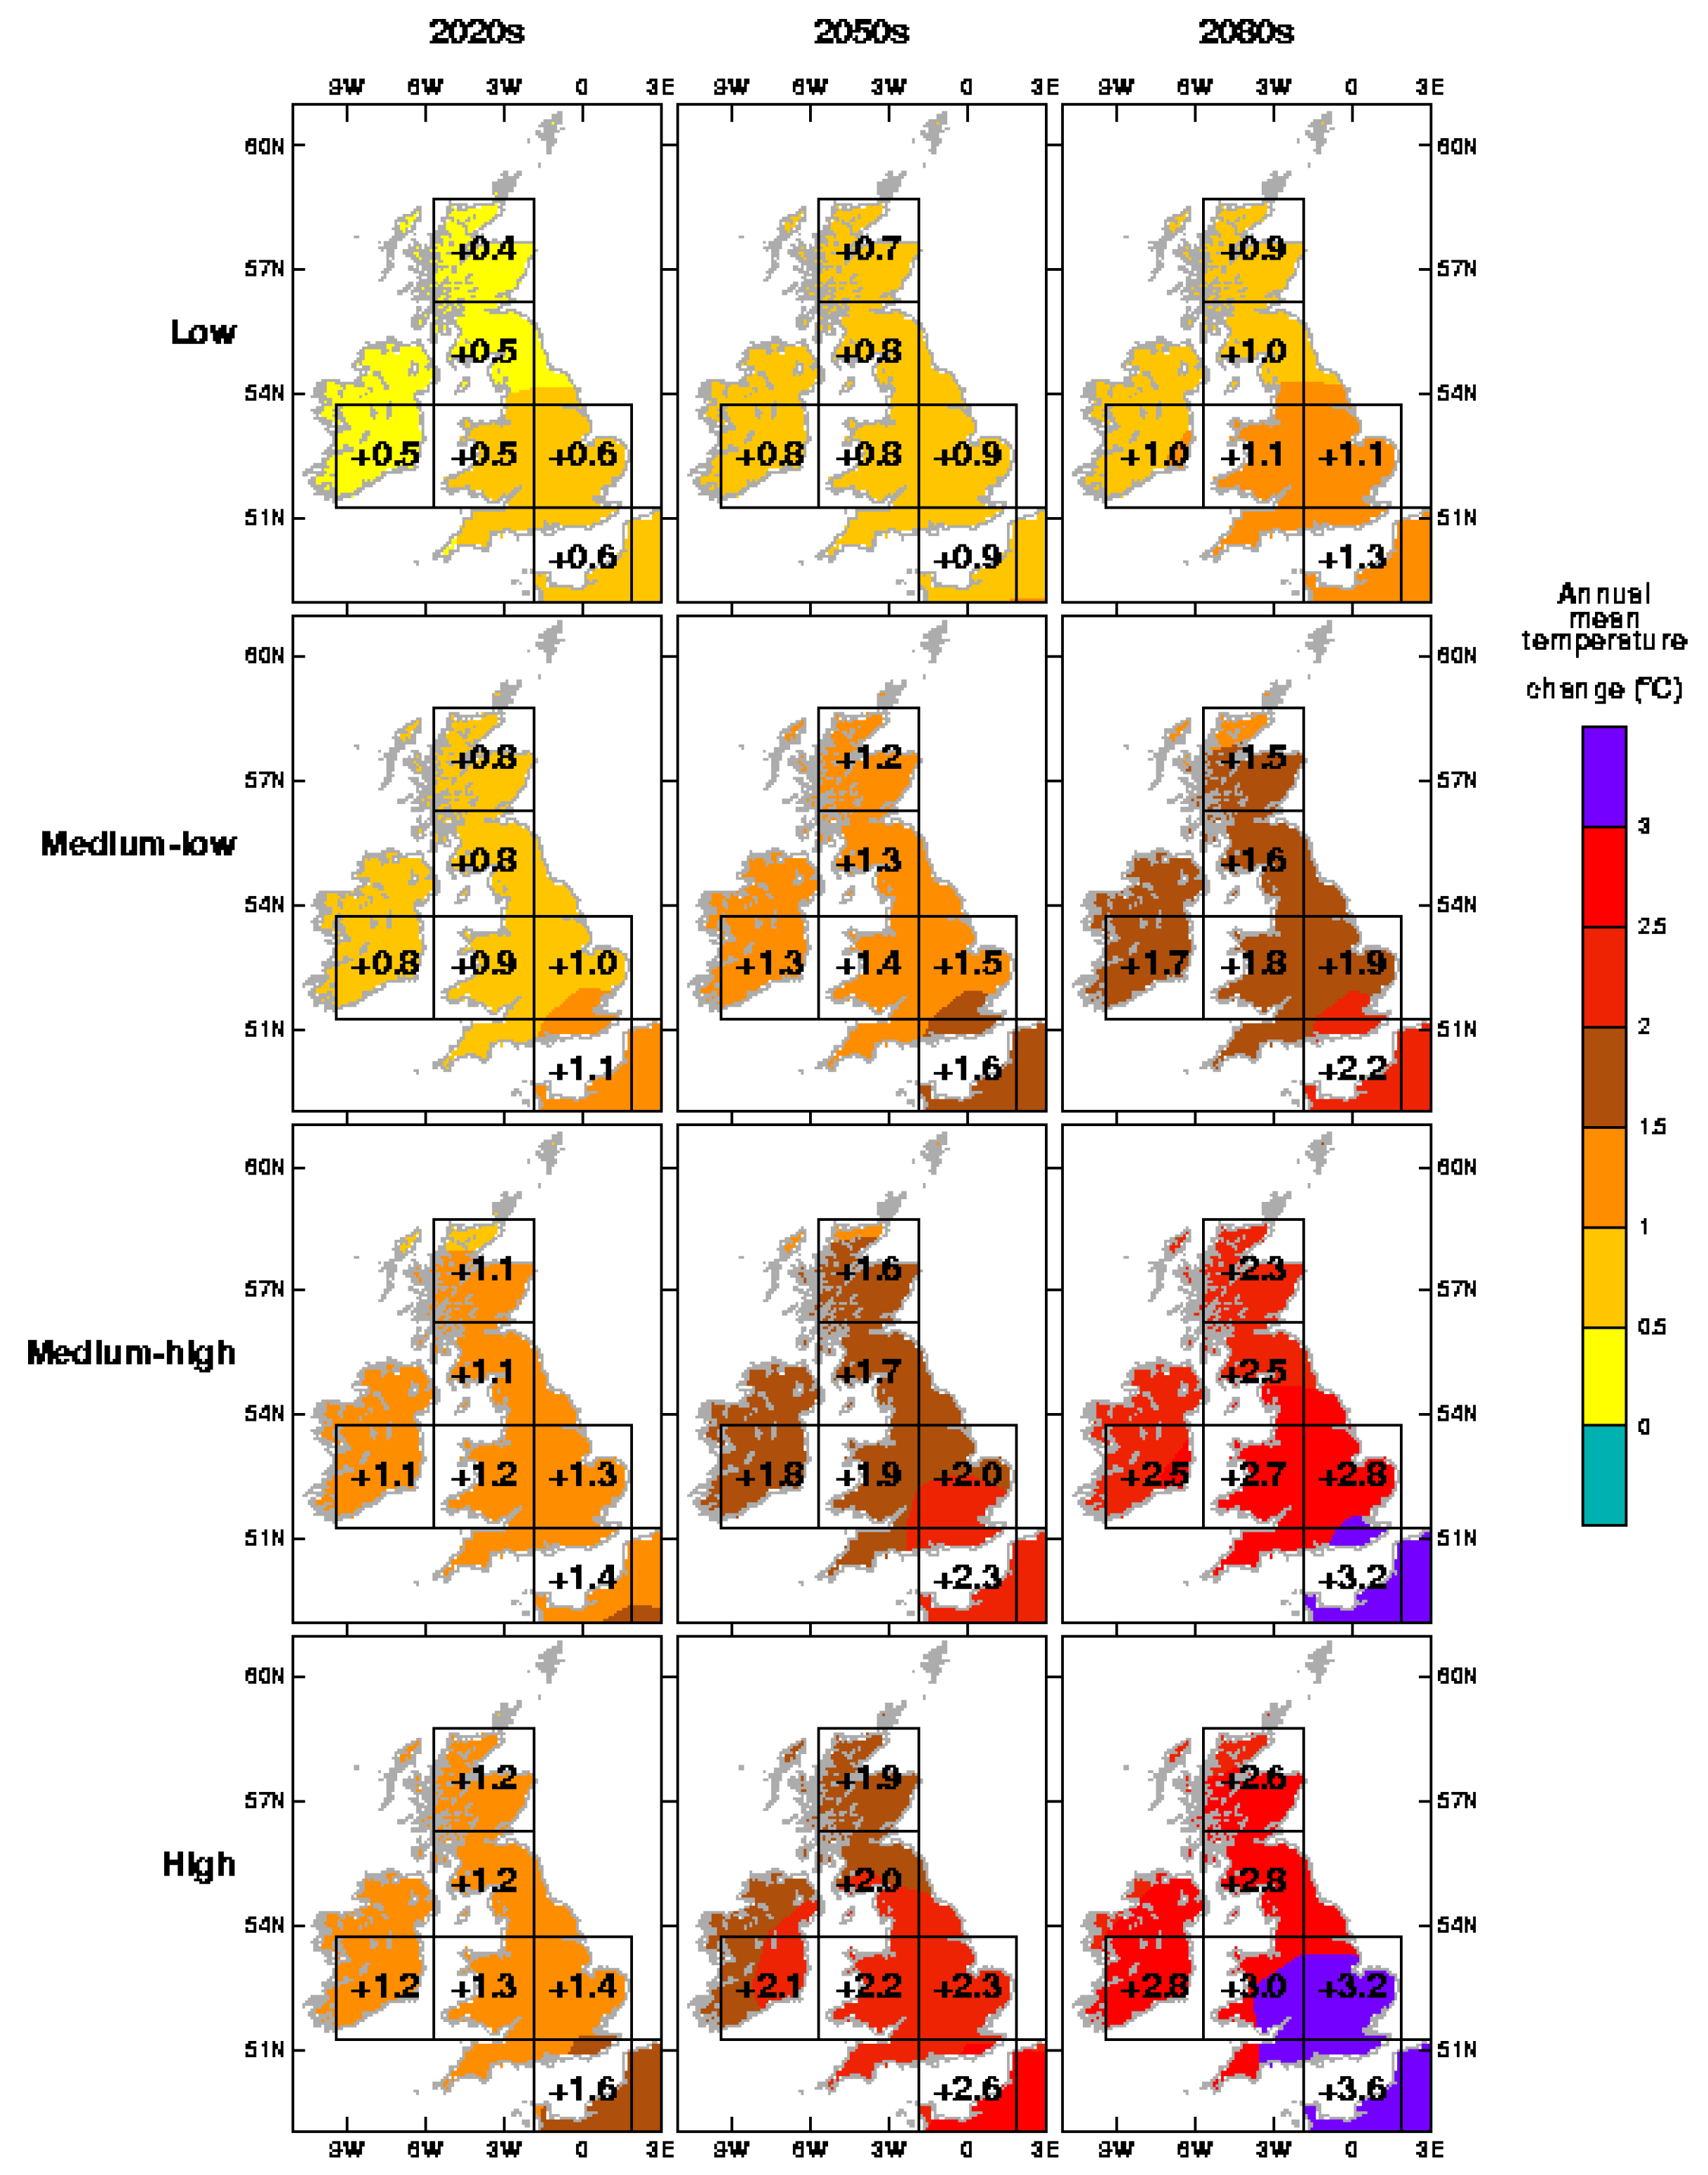
2. Climate Change in the UK
3. Thermal Mass
Quantification Framework and Dynamic Thermal Modeling
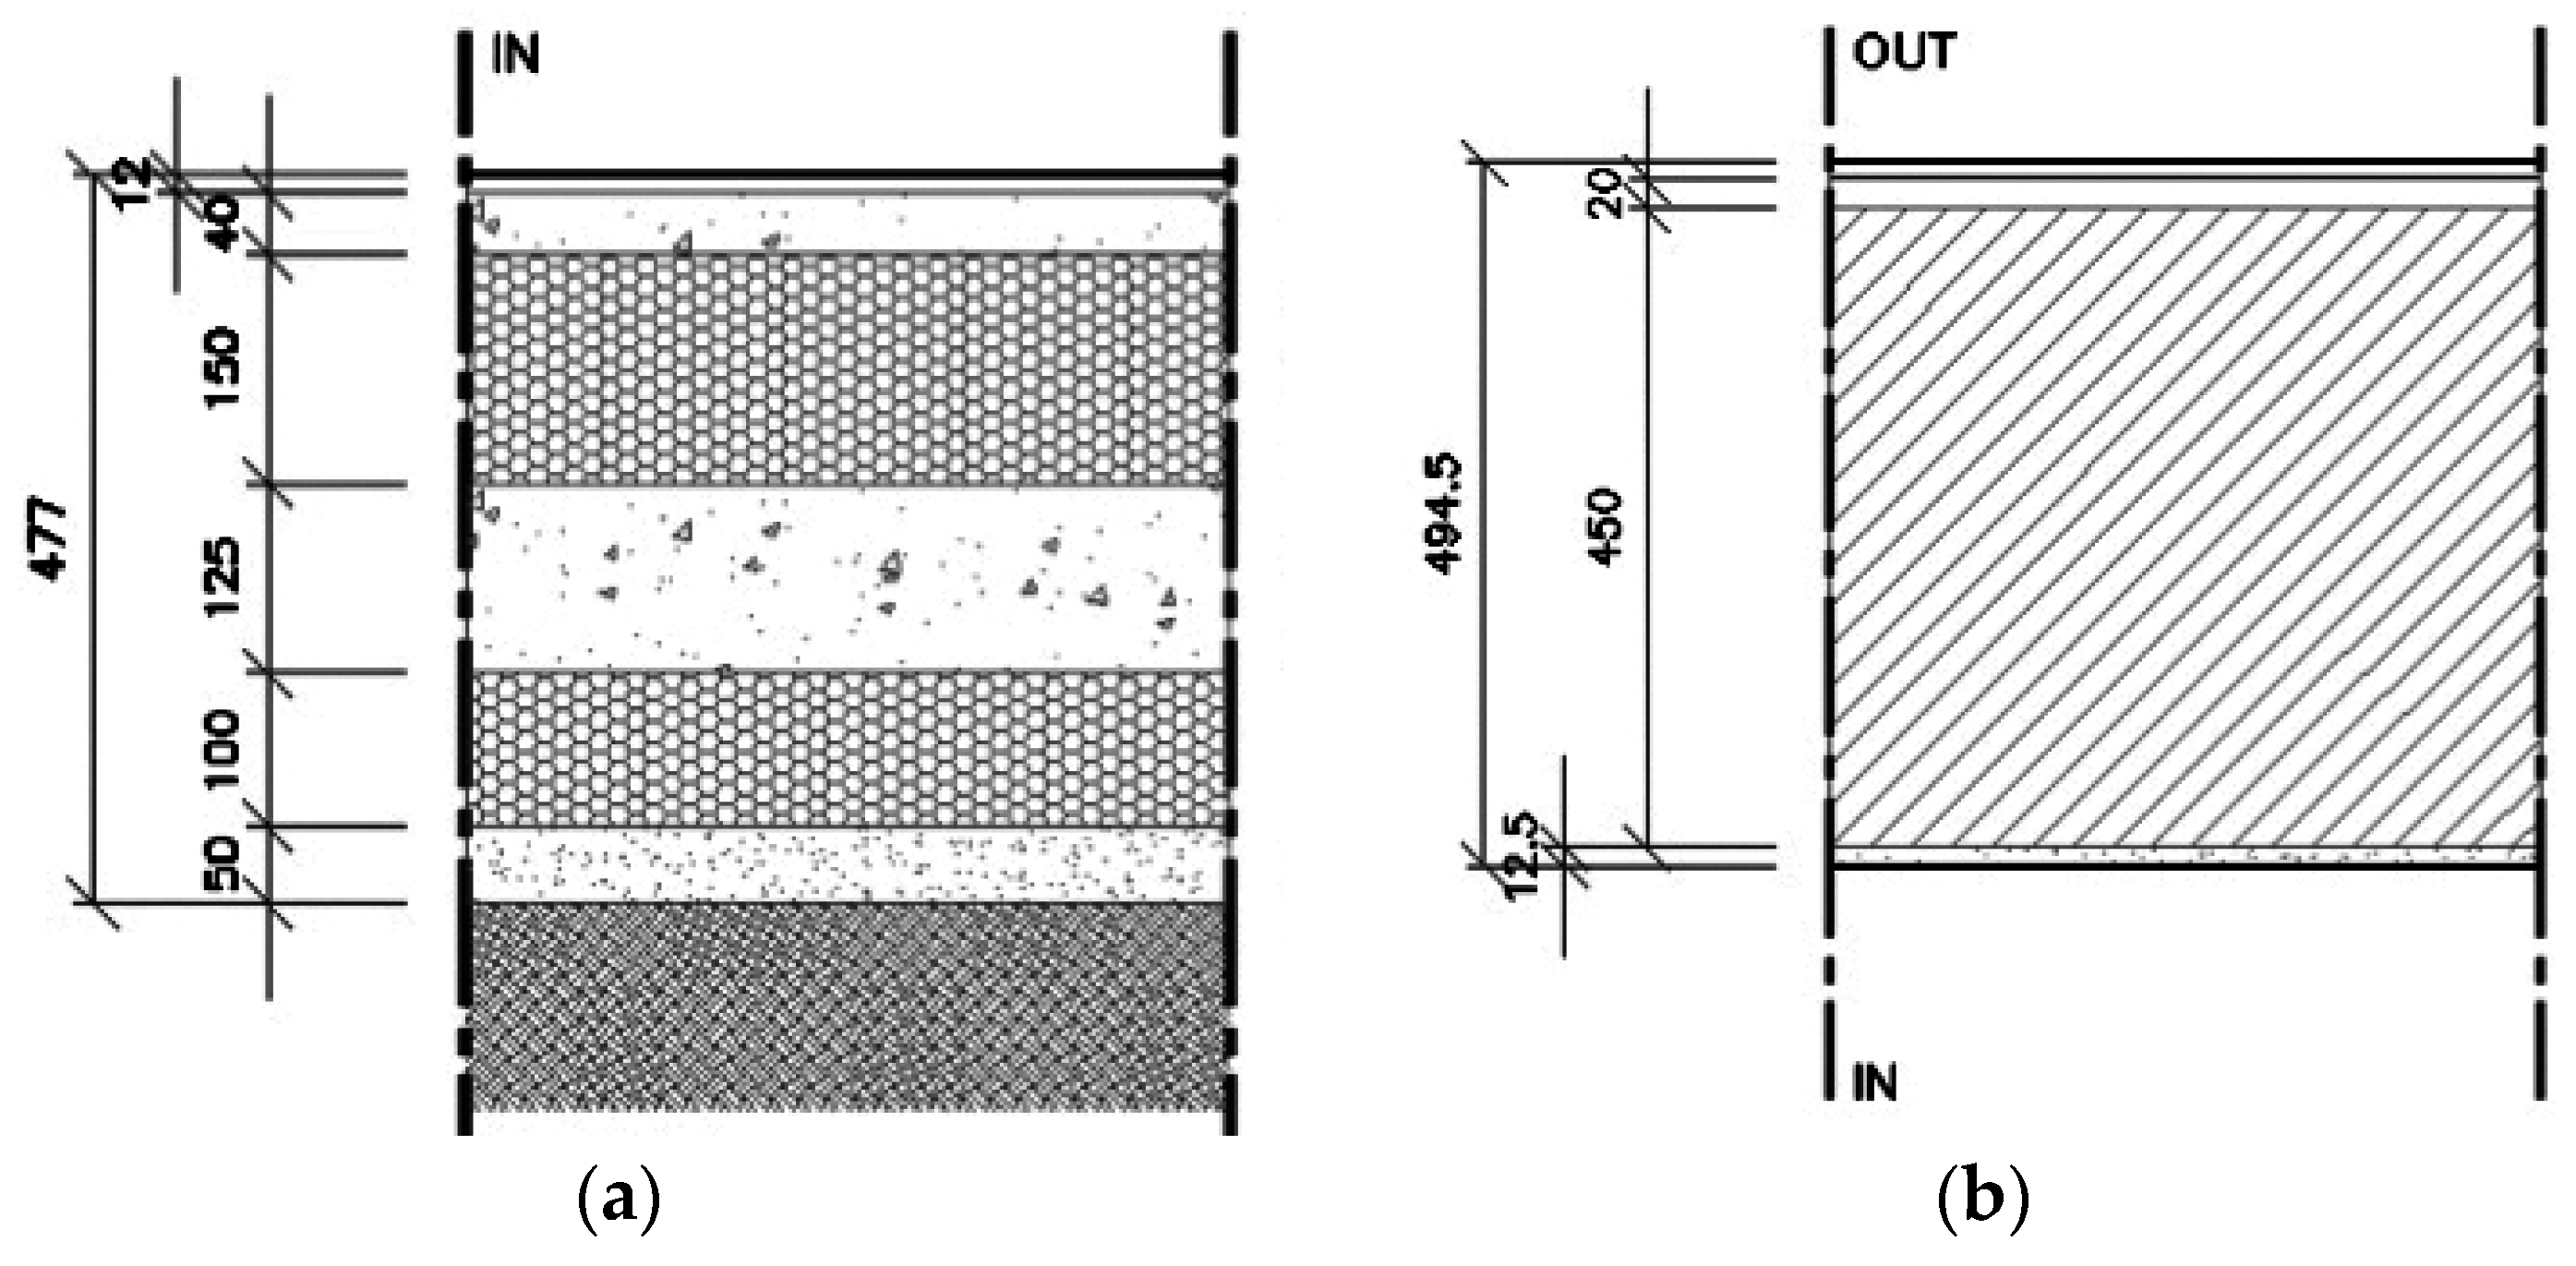
4. Construction Systems
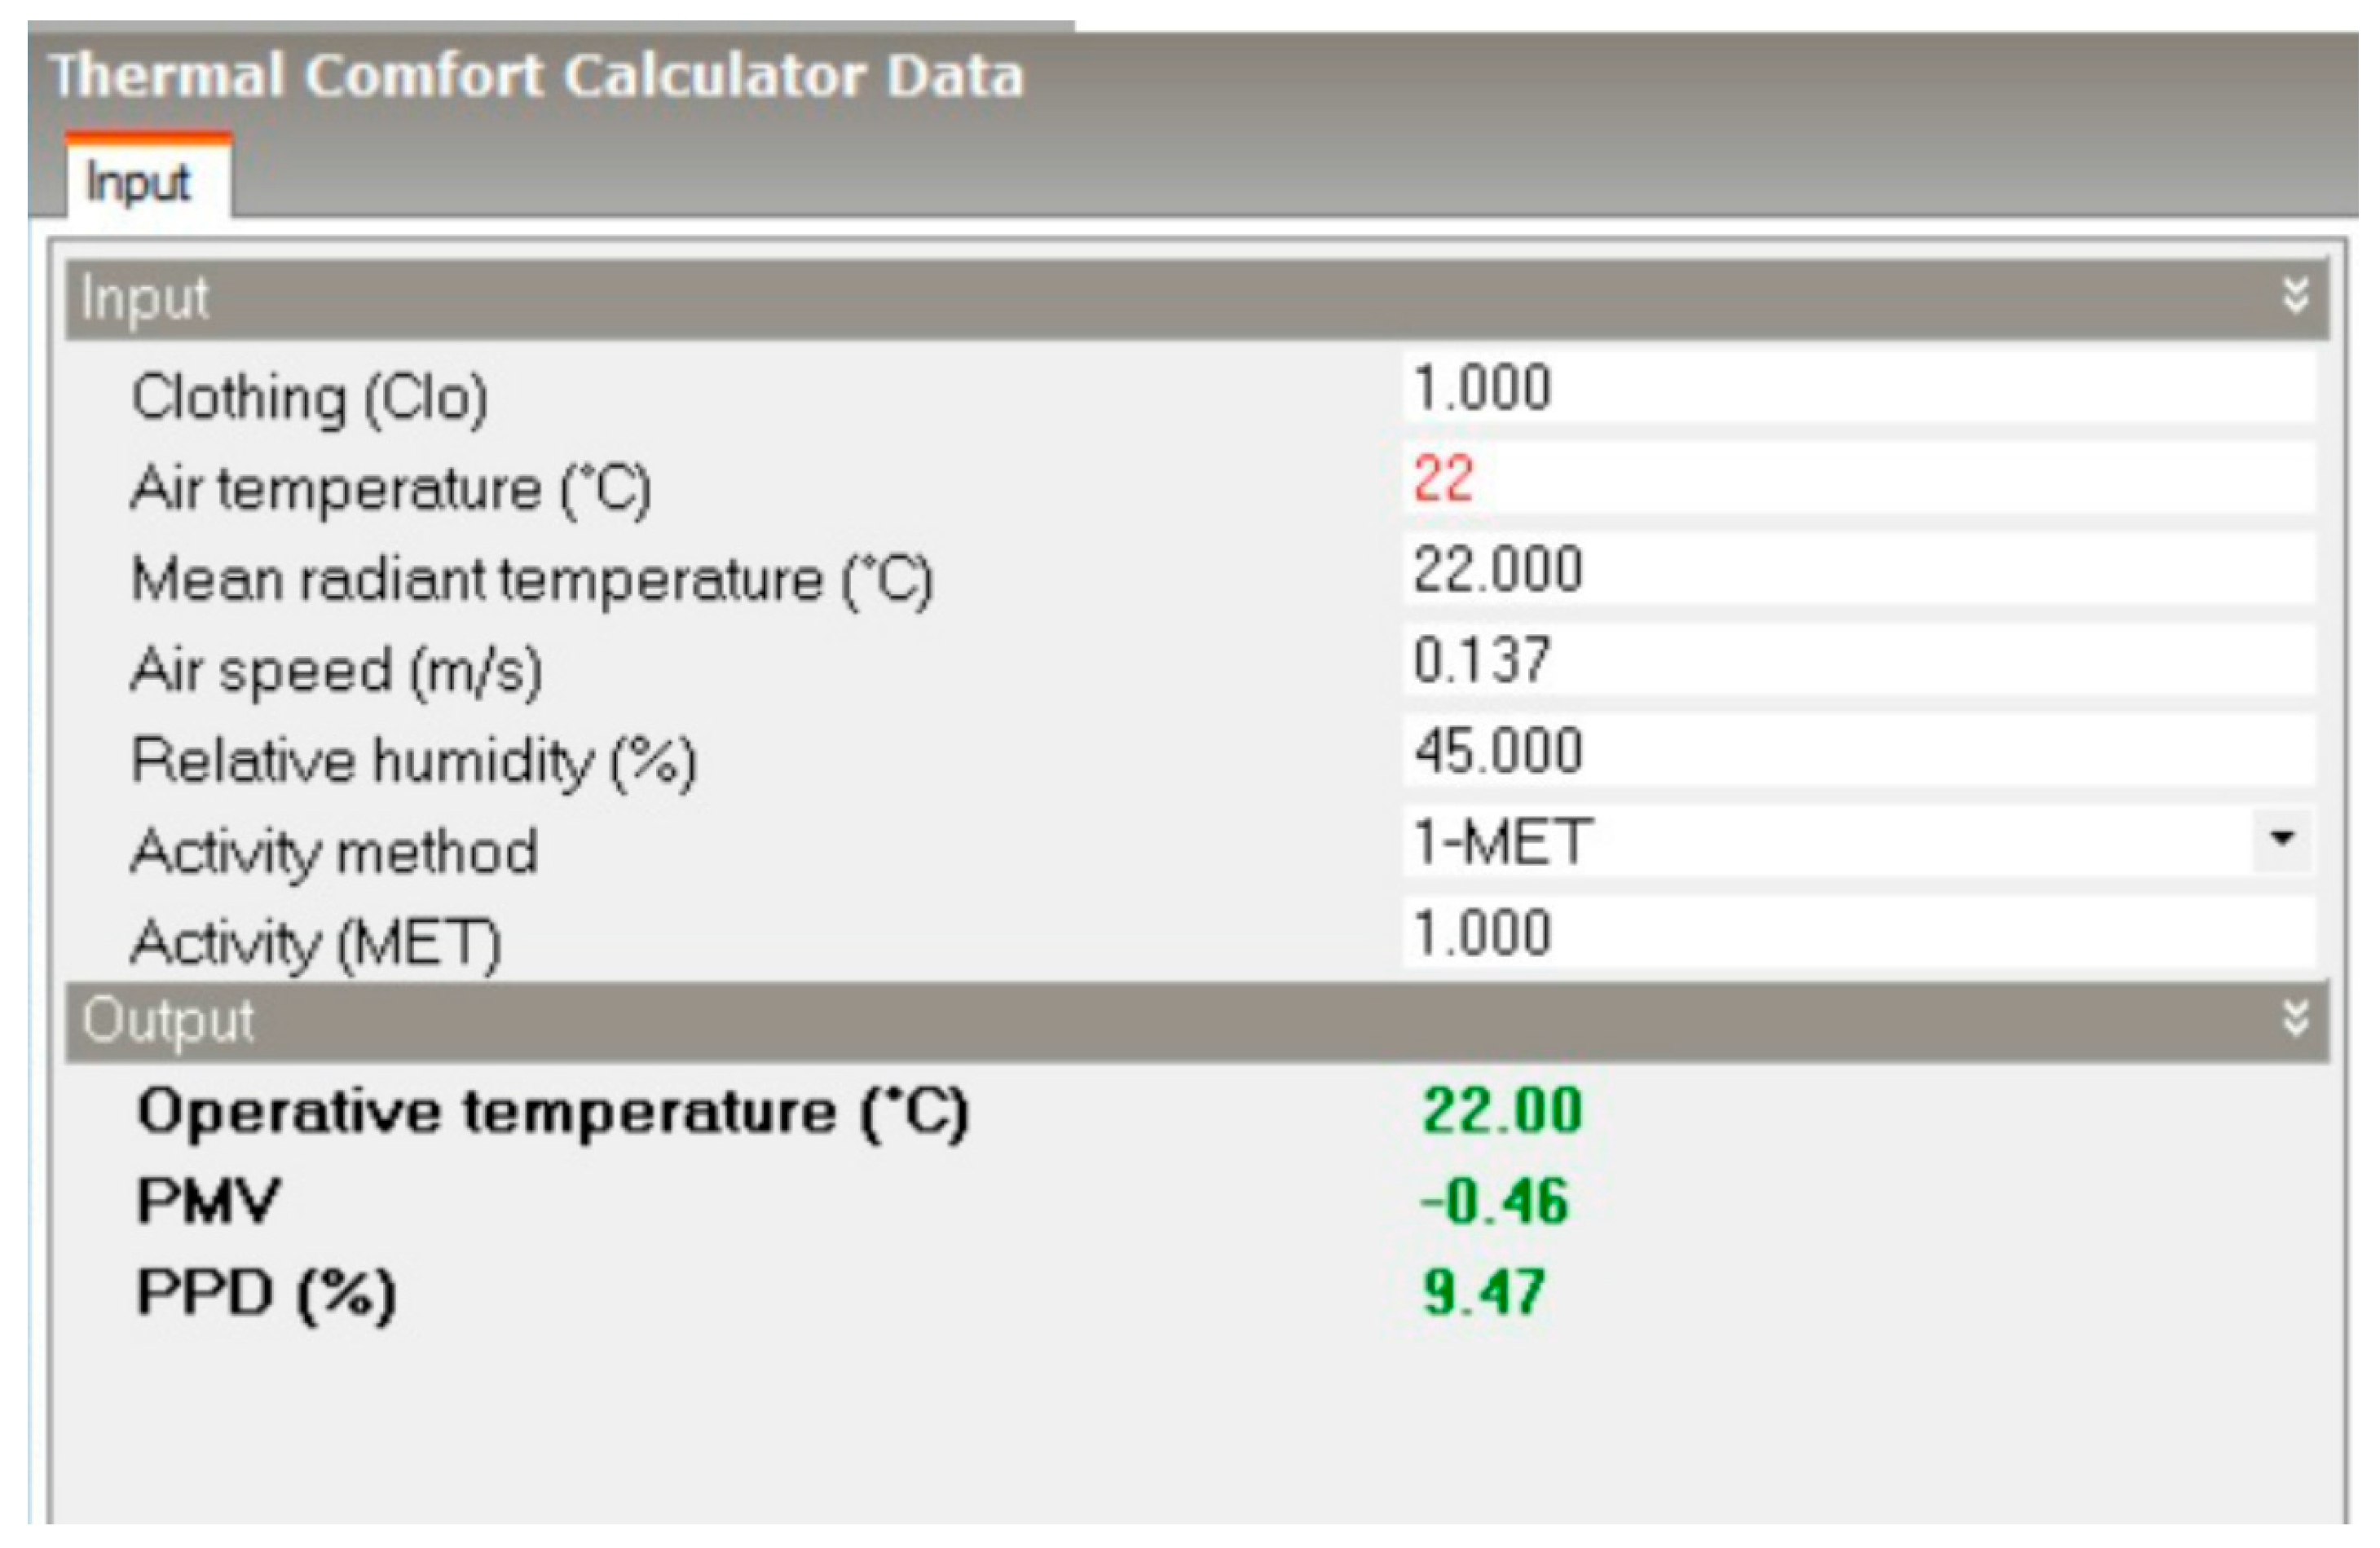
5. Thermal Comfort
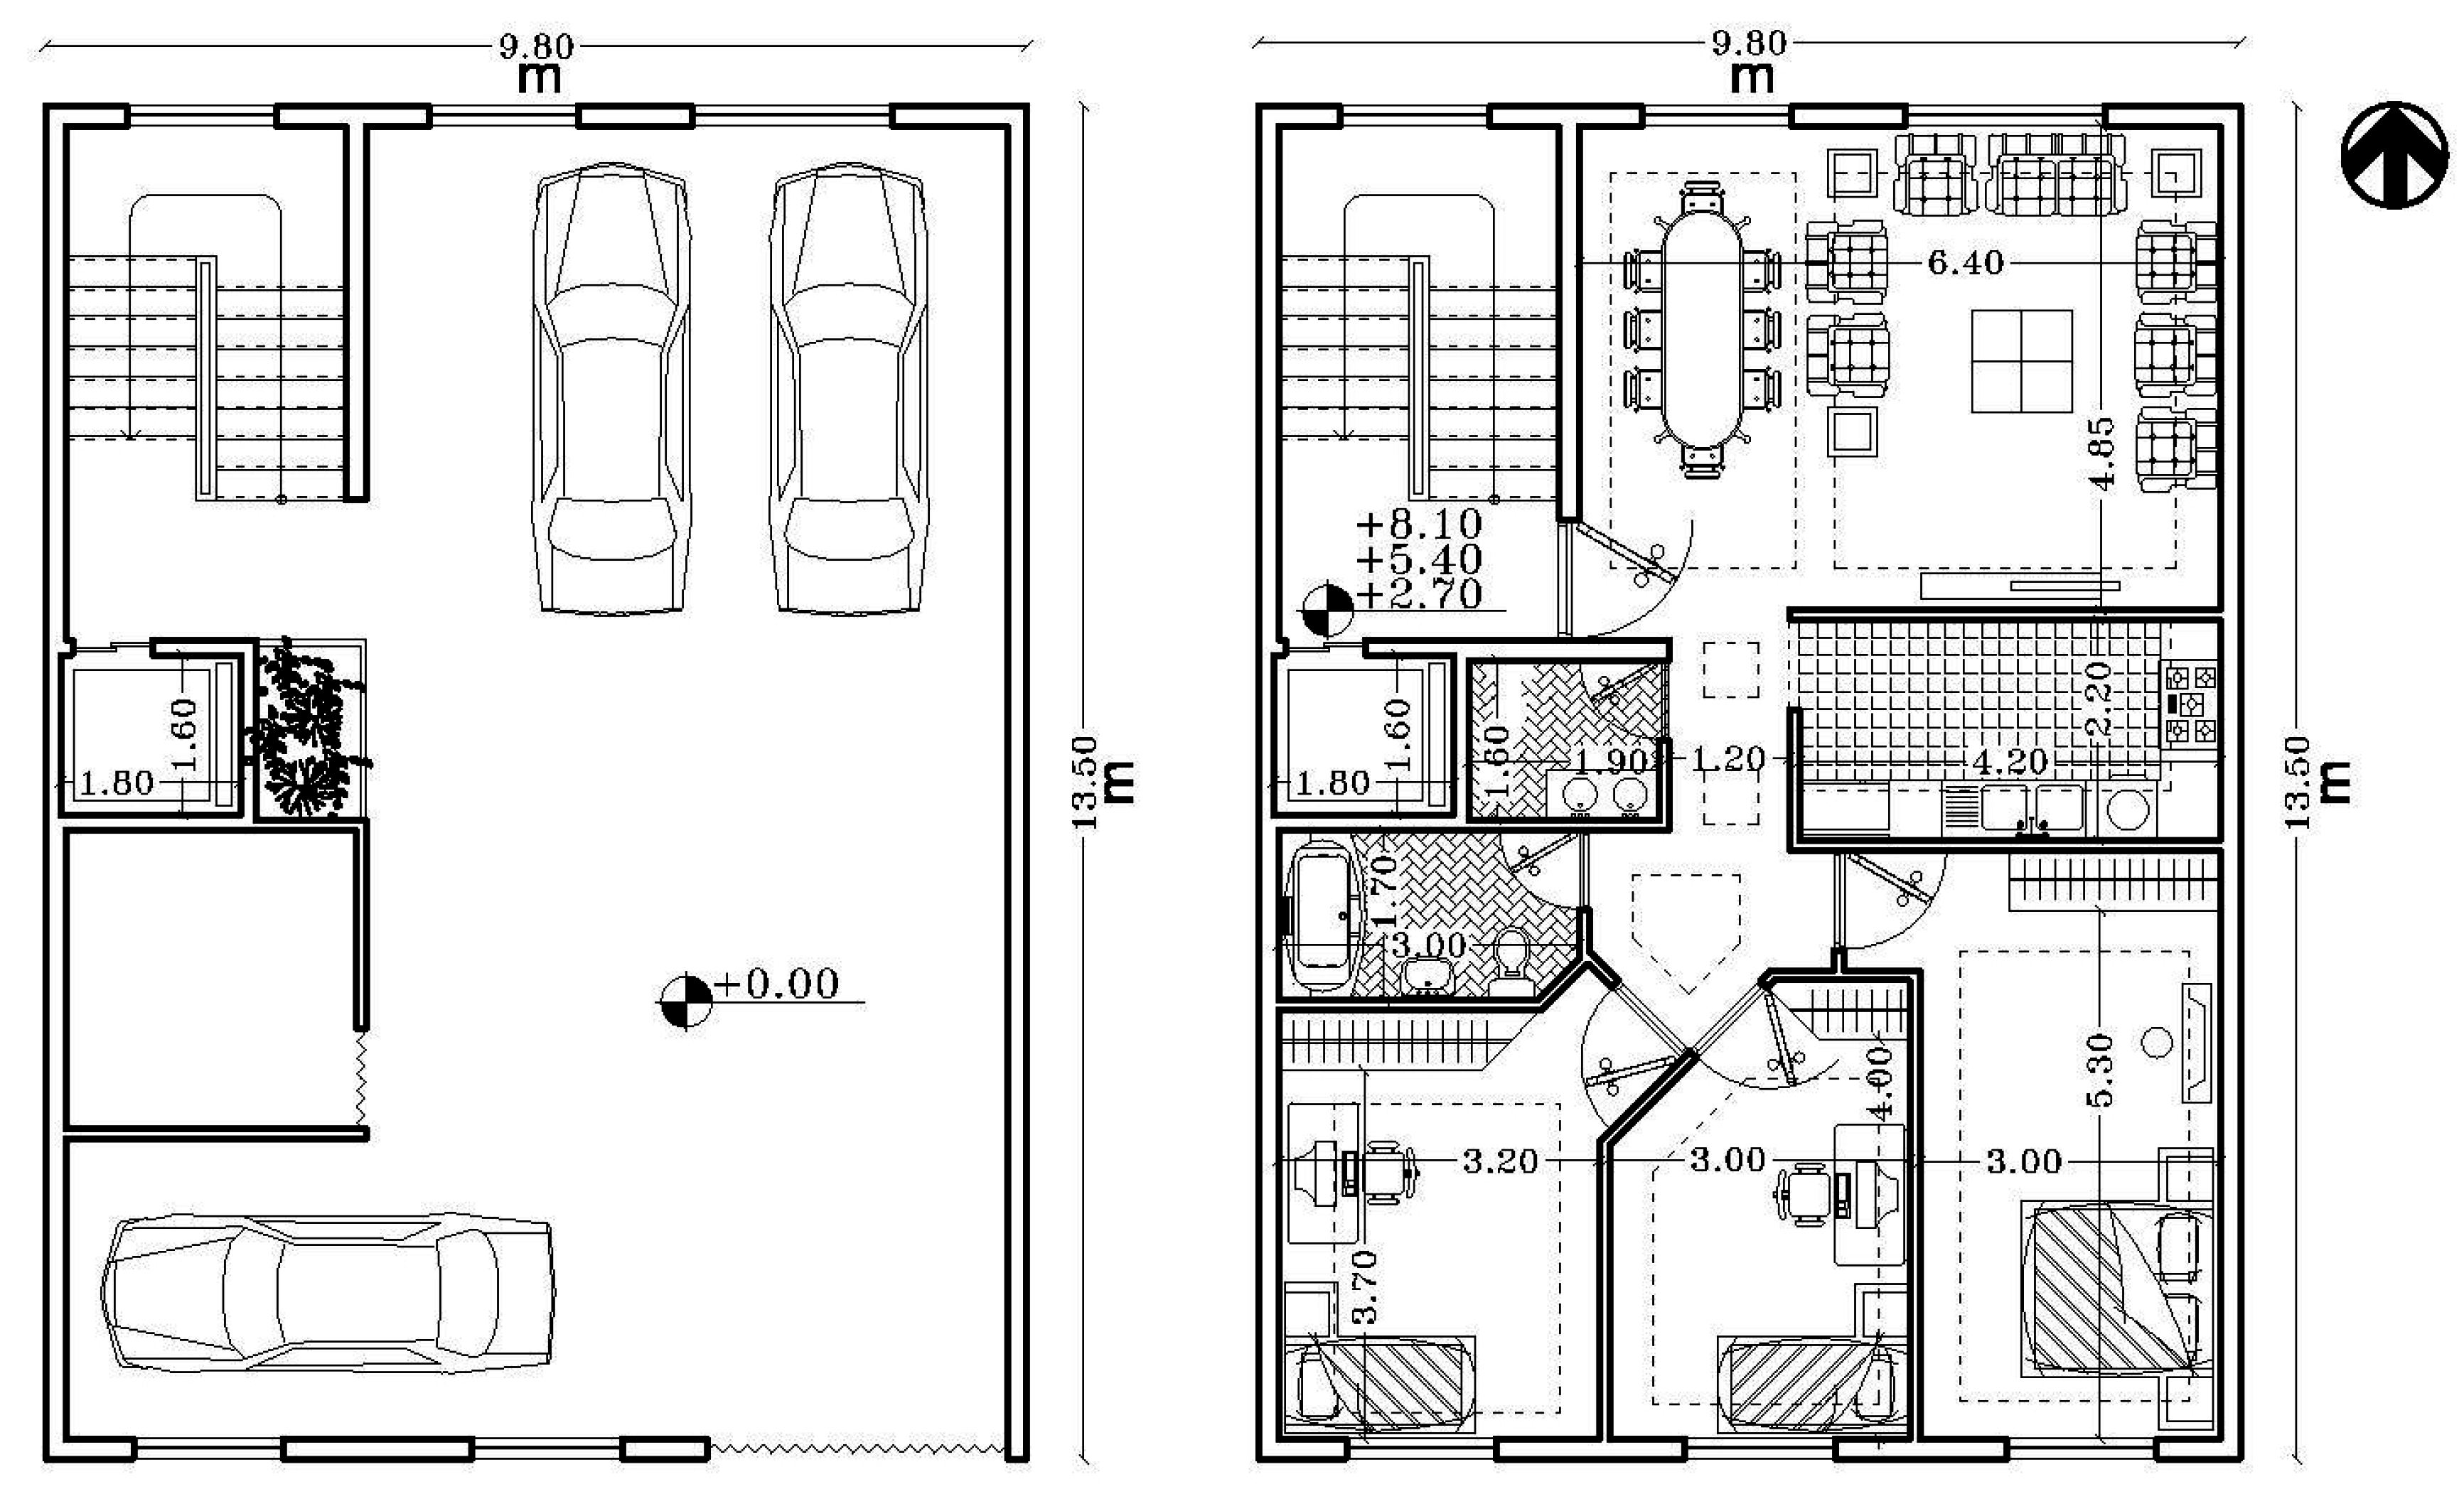
6. Case Study
7. Results and Discussion
8. Conclusions
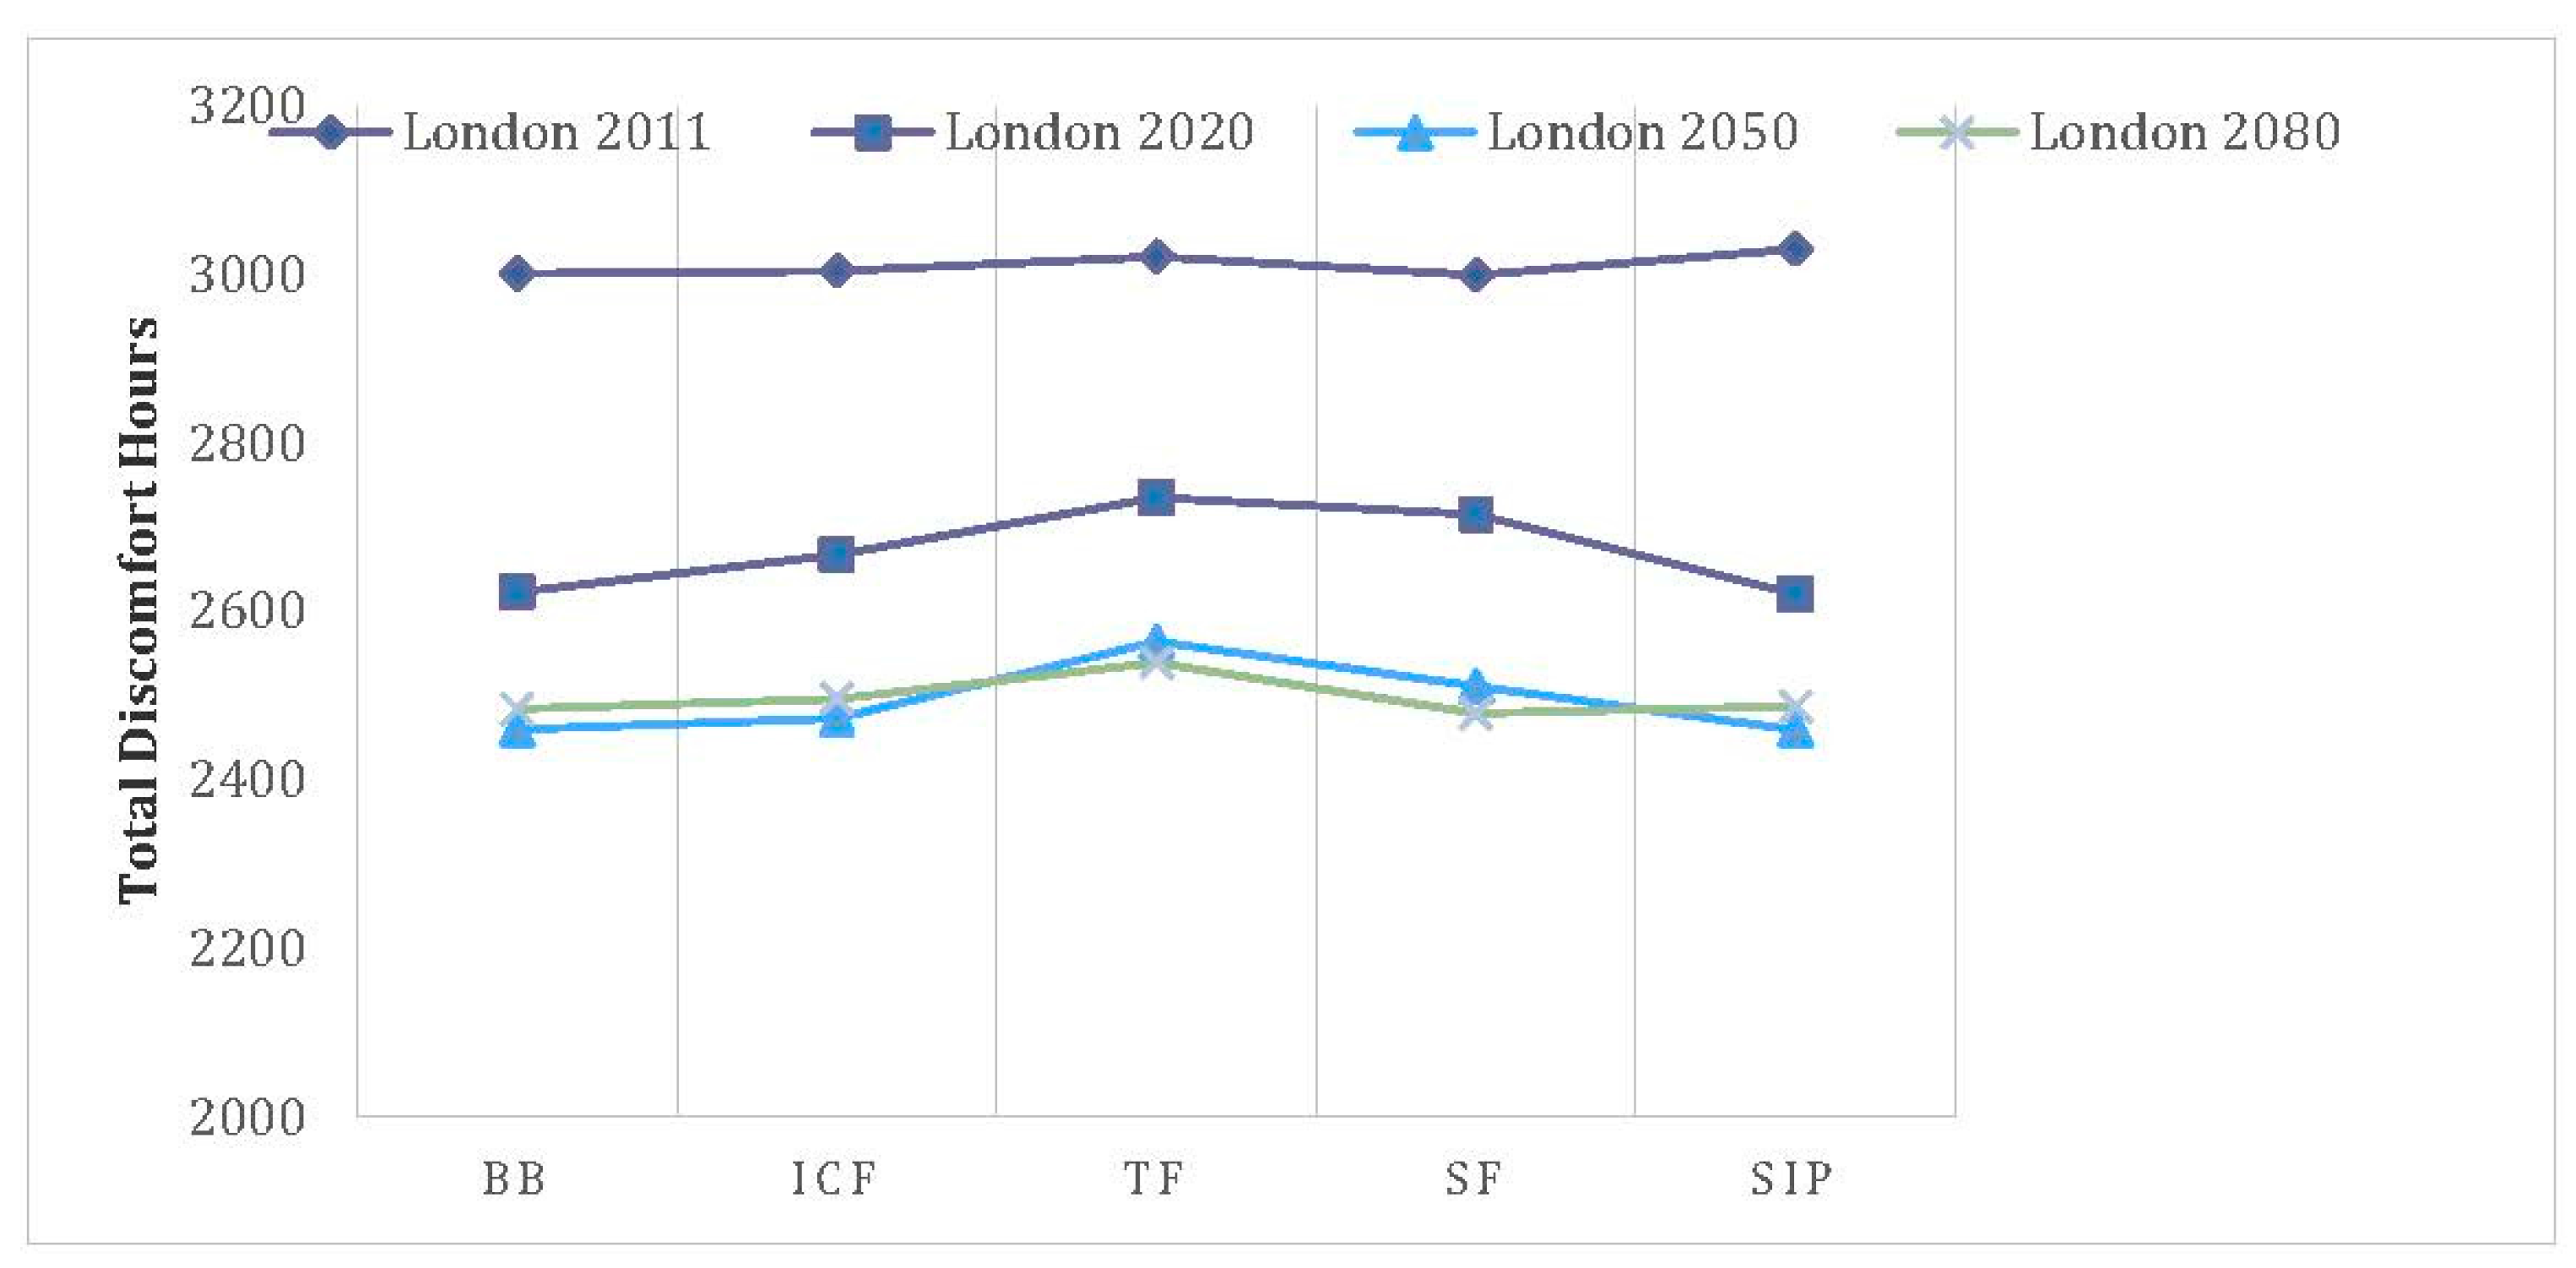
- A high level of thermal mass shows minor advantages in most cases for a typical flat model. This result is comparable to the Three Regions Climate Change Group (TRCCG) studies, which undertook similar research for 1960s houses and flats in London, and the east and southeast of England. They found that ventilation use, solar control, cooler floors, etc., were the most effective strategies to improve comfort in the UK housing [29].
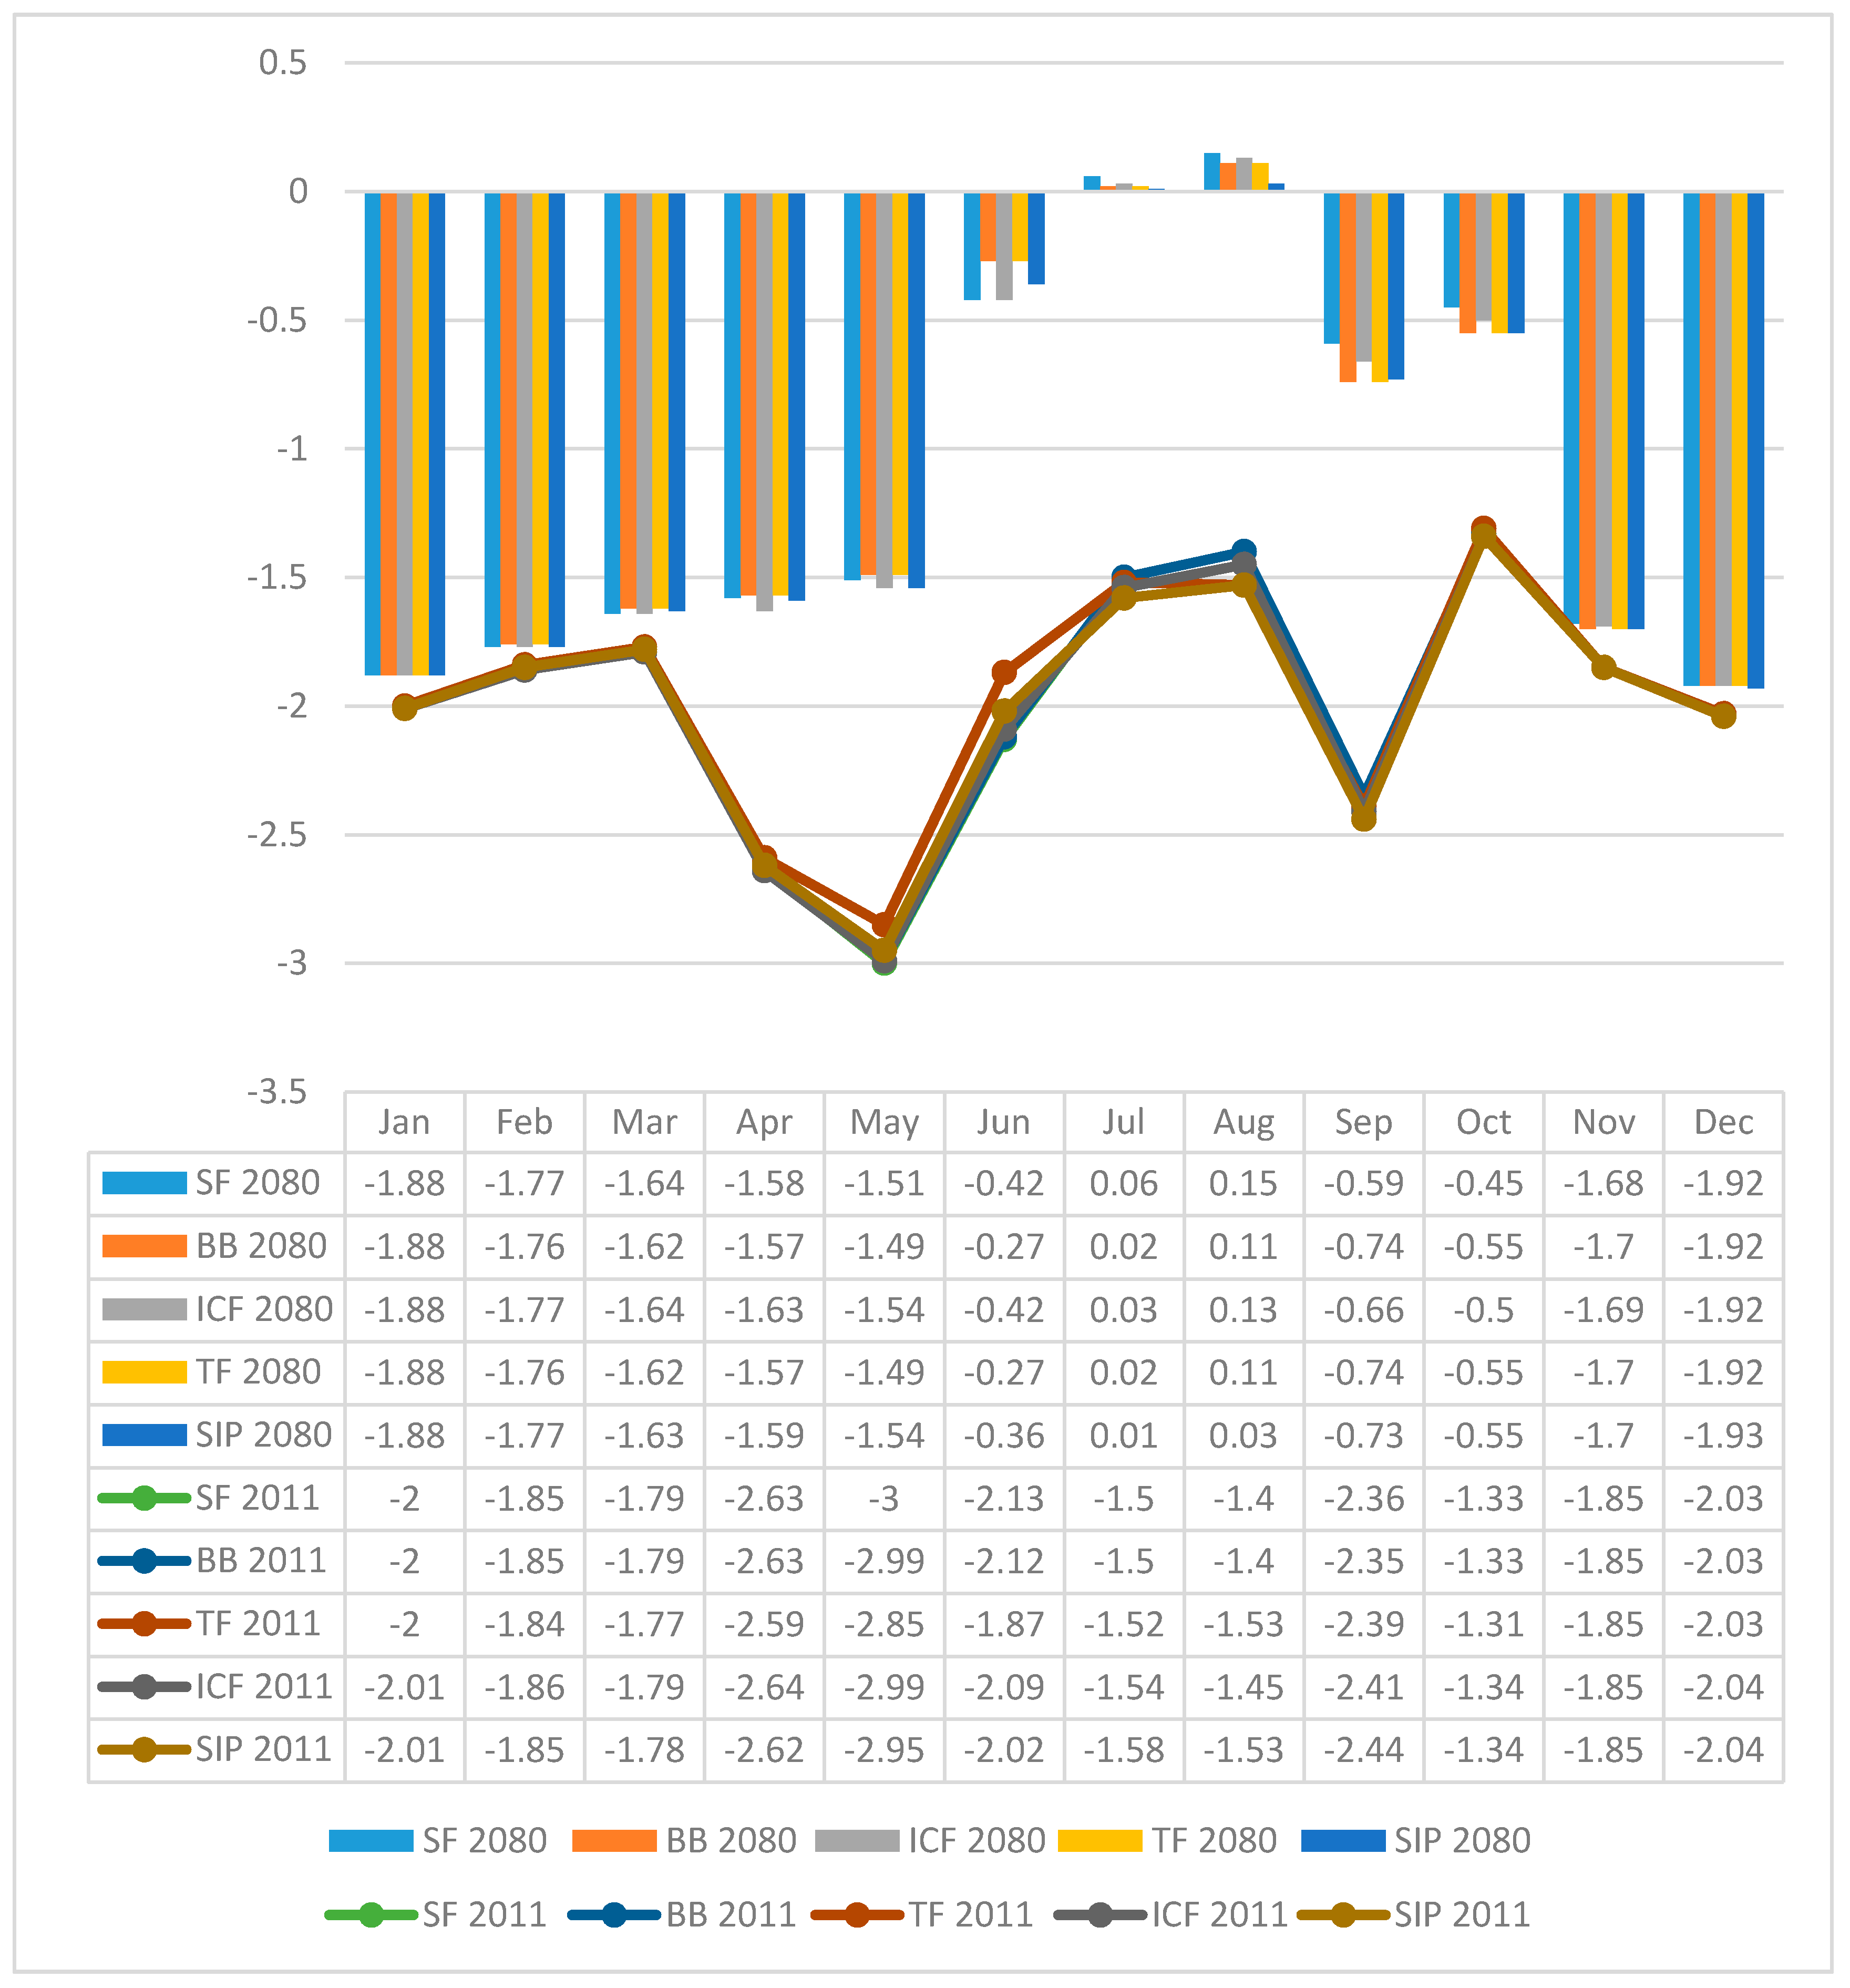
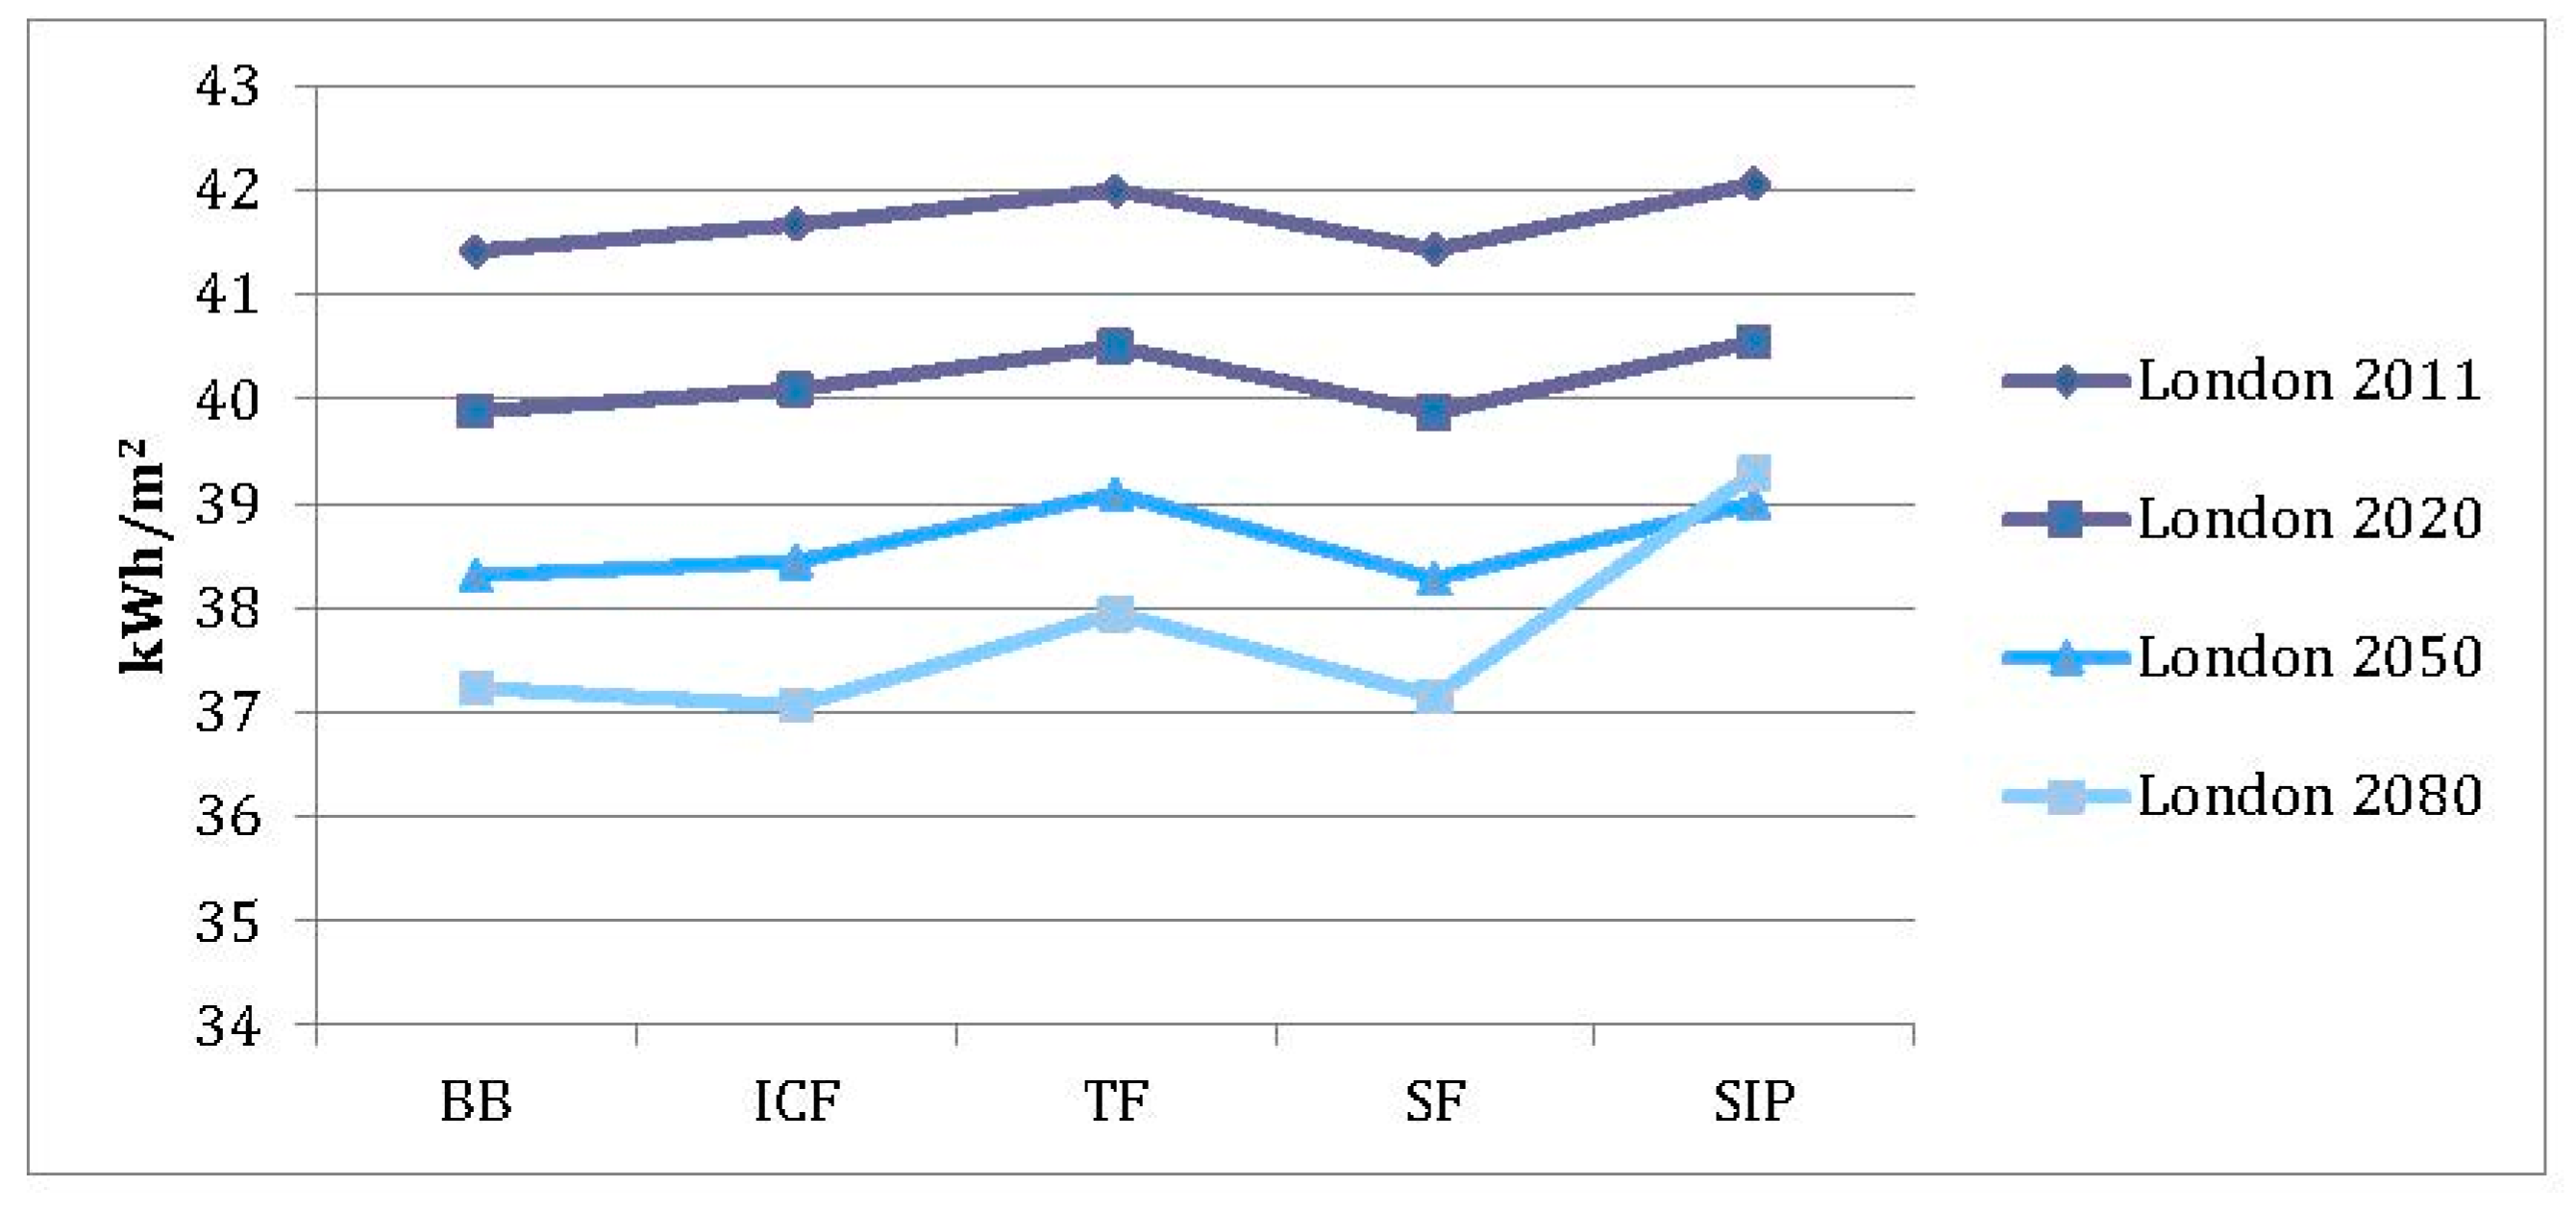
- Although climate change will cause more demand for cooling loads and increase overheating hours in the UK, the impact on heating loads should not be neglected and overall energy consumption is subject to decrease when high performance systems are used in an airtight model. Heating load reduction is considerably higher than cooling load increase and therefore climate change would cause less overall energy consumption. This is also comparable to the results found from Collins et al. in a study on the entire UK housing stock in London, Manchester, Cardiff and Edinburgh [10].
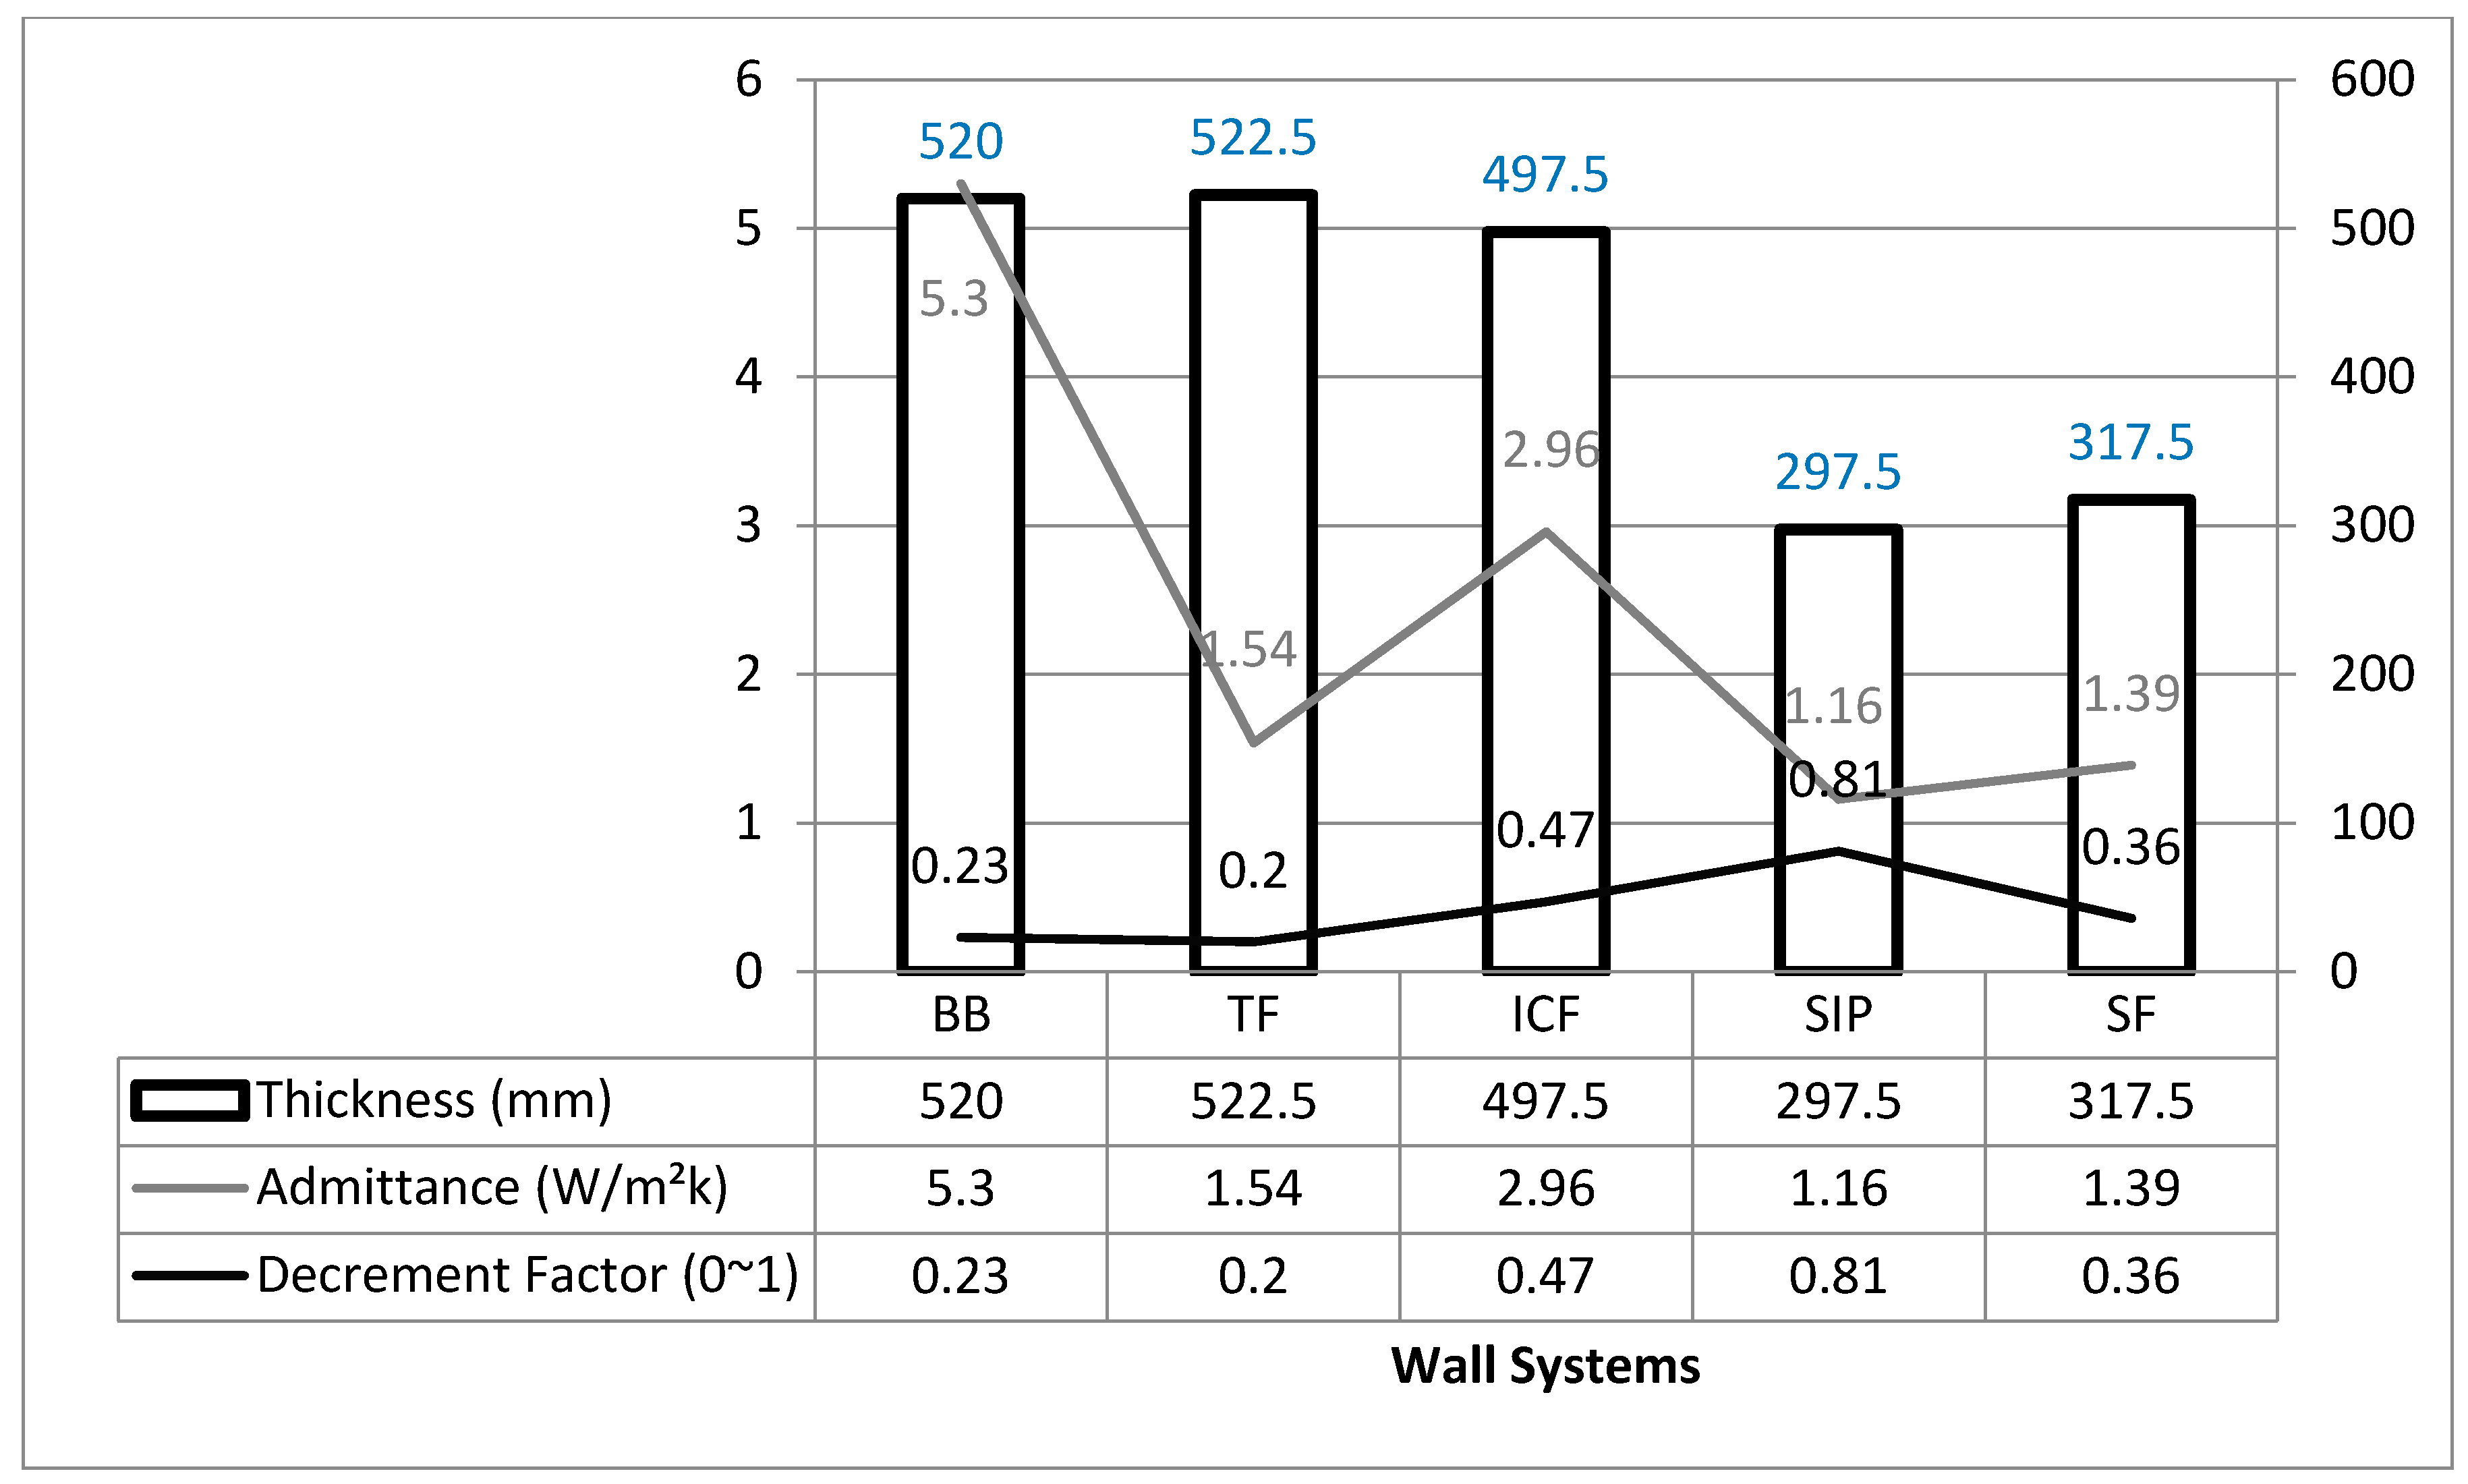
- Although decrement factor and admittance factor do not necessarily characterize the behavior of the construction systems, it seems that a low level of decrement factor (TF) demonstrates maximum discomfort hours most of the time.
Conflicts of Interest
Appendix A

References
- Department for Communities and Local Government. Homes for Future: More Affordable, More Sustaianble; DCLG: London, UK, 2007.
- Athienitis, A.K.; Santamouris, K. Thermal Analysis and Design of Passive Solar Buildings; James & James Ltd.: London, UK, 2005. [Google Scholar]
- Li, X.W.; Malkawi, A. Multi-objective optimization for thermal mass model predictive control in small and medium size commercial buildings under summer weather conditions. Energy 2016, 112, 1194–1206. [Google Scholar] [CrossRef]
- Li, W.; Xu, P.; Wang, H.; Lu, X. A new method for calculating the thermal effects of irregular internal mass in buildings under demand response. Energy Build. 2016, 112, 761–772. [Google Scholar] [CrossRef]
- Dunster, B. UK Housing and Climate Change: Heavyweight vs. Lightweight construction. In RIBA; Ove Arup & Partners Ltd.: London, UK, 2005; Available online: http://www.architecture.com/Files/RIBAProfessionalServices/Practice/UKHousingandclimatechange.pdf (accessed on 8 August 2016).
- Orme, M.; Palmer, J.; Irving, S. Control of overheating in well-insulated housing. In Building Sustainability: Value and Profit; Building Services Research and Information Association: Bracknell, UK, 2003; Available online: http://www.cibse.org/pdfs/7borme.pdf (accessed on 8 July 2016).
- Building Research ESTABLISHMENT (BRE). The Passivhaus Standard. Available online: http://www.passivhaus.org.uk/standard (accessed on 8 July 2016).
- De Wilde, P. The implications of a changing climate for buildings. Build. Environ. 2012, 55, 1–7. [Google Scholar] [CrossRef] [Green Version]
- Hulme, M.; Jenkins, G.; Lu, X.F.; Turnpenny, J.; Mitchell, T.; Jones, R.; Lowe, J.; Murphy, J.; Hassel, D.; Boorman, P.; et al. Climate Change Scenarios for the United Kingdom, The UKCIP Scientific Report; Tyndall Centre for Climatic Change Research, School of Environmental Engineering, University of East Anglia: Norwich, UK, 2002; Available online: http://www.ukcip.org.uk/resources/publications (accessed on 8 January 2017).
- Collins, L.; Natarajan, S.; Levermore, G. Climate change and future energy consumption in UK housing stock. Build. Serv. Eng.Res. Technol. 2010, 31, 80–86. [Google Scholar] [CrossRef]
- DCLG. English Housing Survey: Housing Stock Report; Department for Communities and Local Government: London, UK, 2008.
- Childs, K.W.; Courville, G.E.; Bales, E.A. Thermal Mass Assessment: An Explanation of the Mechanisms by Which Building Mass Influences Heating and Cooling Energy Requirements; Department of Energy: Oak Ridge, TN, USA, 1983.
- Orme, M.; Palmer, J. Control of Overheating in Future Housing—Design Guidance for Low Energy Strategies; Faber Maunsell: Lodon, UK, 2003. [Google Scholar]
- Kosny, J.; Desjarlais, A.; Christian, J. Dynamic thermal performanc of concrete and masonry walls. In Proceeidngs of the Thermal Performance of the Exterior Envelopes of Buildings, Clearwater, FL, USA, 6–10 December 1998.
- Chartered Institution of Building Services Engineers. Gudie A: Environmental Design; CIBSE: Lodon, UK, 2006. [Google Scholar]
- British Standards Institute. Thermal Performance of Buildings—Calculation of Energy Needs for Space Heating and Cooling Using Dynamic Methods—General Criteria and Validation Procedures; BSI: London, UK, 2007. [Google Scholar]
- The Concrete Centre. Thermal Mass for Housing; The concrete Centre: Surrey, UK, 2006. [Google Scholar]
- British Standards Institute. Building Components and Building Elements—Thermal Resistance and Thermal Transmittance—Calculation Method; BSI: London, UK, 2003. [Google Scholar]
- Clarke, J. Energy Simulation in Building Design; Butterwork-Heinemann: Oxford, UK, 2001. [Google Scholar]
- ASHRAE 55 INT 2-2015 Thermal Environment Conditions for Human Occupancy; American Society of Heating, Refrigerating and Air-conditioning Engineers organization: Atlanta, GA, USA, 2013.
- Kalogirou, S.; Florides, G.; Tassou, S. Energy analysis of buildings employing thermal mass in Cyprus. Renew. Energy 2002, 27, 353–368. [Google Scholar] [CrossRef]
- Brisken, W.R.; Reque, S.G. Heat load calculations by thermal response. ASHVE Trans. 1956, 62, 391–424. [Google Scholar]
- Davies, M. Building Heat Transfer; John Wiley and Sons: Sussex, UK, 2004. [Google Scholar]
- Chudley, R.; Greeno, R. Building Construction Handbook; Elsevier: Oxford, UK, 2008. [Google Scholar]
- MacLaren, F.H.; Dennis, L.; Mourshed, M. Public opinions on alternative lower carbon wall construction techniques for UK housing. Habitat Int. 2012, 37, 163–169. [Google Scholar] [CrossRef] [Green Version]
- Bregulla, J.; Enjily, V. An Introduction to Building with Structural Insulated Panels (SIP); BRE Construction Division: London, UK, 2004. [Google Scholar]
- Muphy, J.; Sexton, D.; Jenkins, G.; Boorman, P.; Booth, B.; Brown, K.; Clark, R.; Collins, M.; Harris, G.; Kendon, L.; et al. UK Climate Projections Science Report: Climate Change Projection, version 3; Marine Climate Change Impacts Partnership: Durham, UK, 2010; Available online: http://ukclimateprojections.defra.gov.uk/images/stories/projections_pdfs/UKCP09_Projections_V2.pdf (accessed on 8 September 2016).
- Chandel, S.S.; Sharma, V.; Marwah, B.M. Review of energy efficient features in vernacular architecture for improving indoor thermal comfort conditions. Renew. Sustain. Energy Rev. 2016, 65, 459–477. [Google Scholar] [CrossRef]
- Three Regions Climate Change Group. Your Home in a Changing Climate: Retrofitting Exisiting Homes for Climate Change Impacts; Greater London Authority: London, UK, 2008.

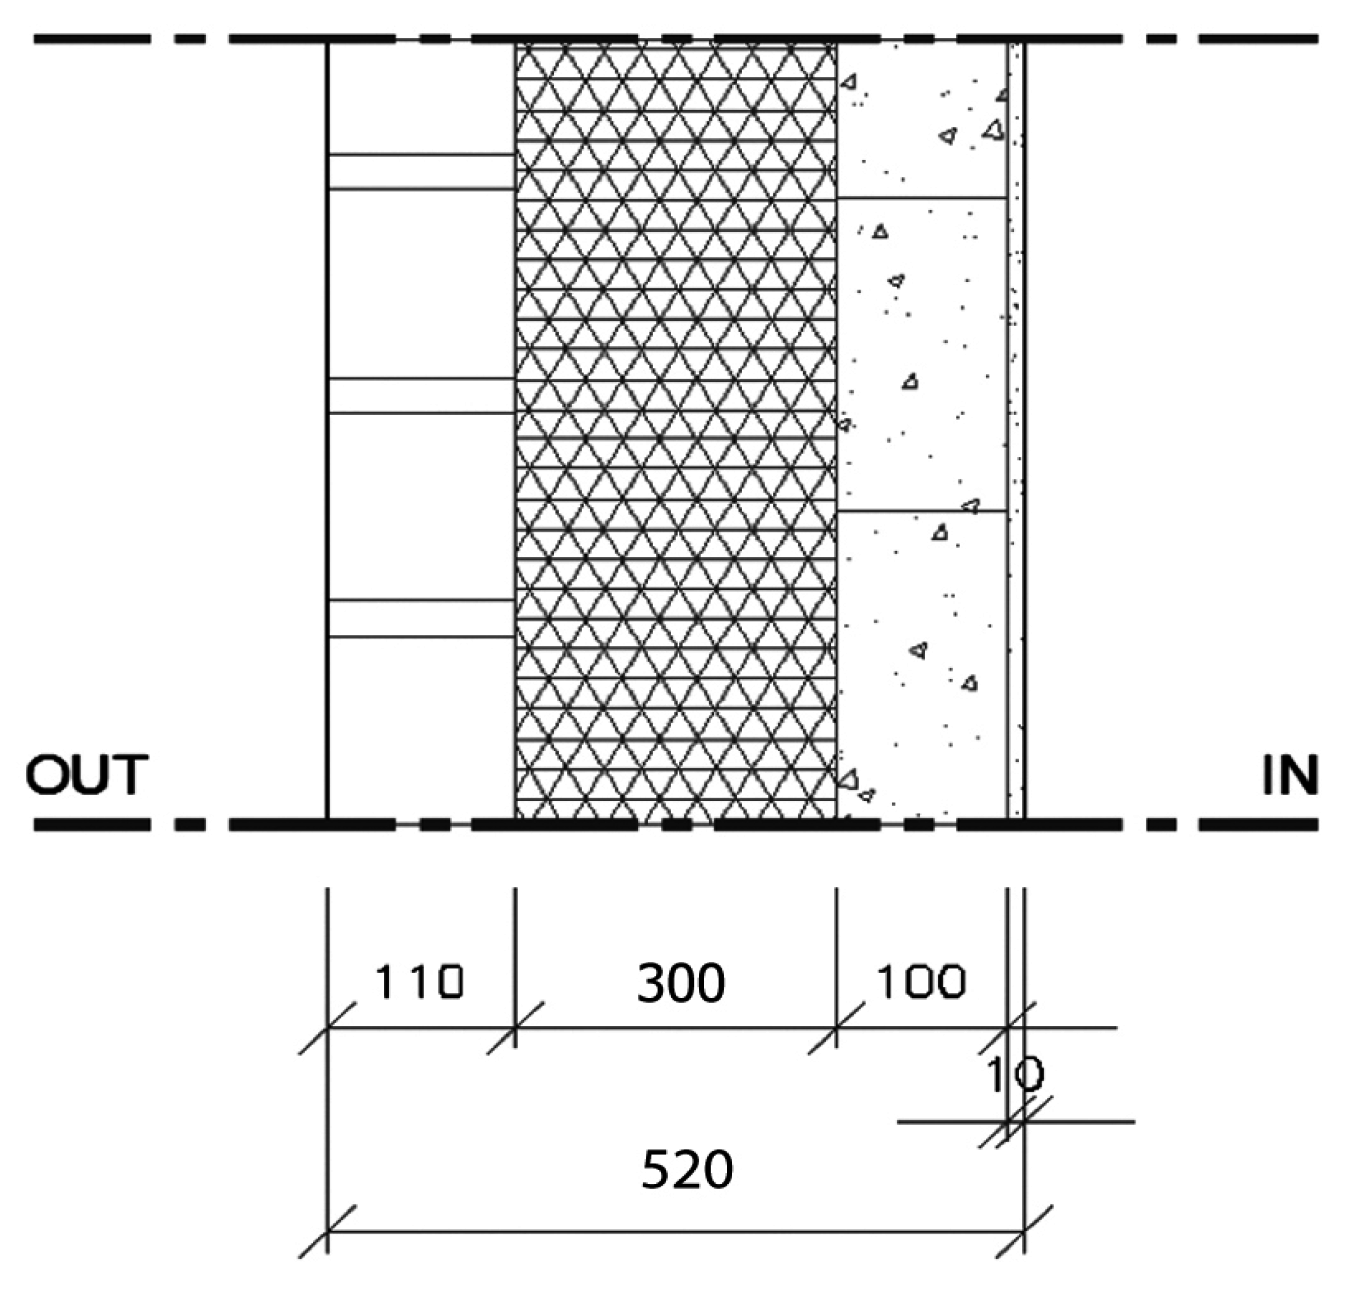
| Decrement factor (0–1) | 0.23 |
| Time Constant (h) | 7.7 |
| Admittance (W/m2·K) | 5.3 |
| U-Value (W/m2·K) | 0.1 |
| Thickness (mm) | 520 |
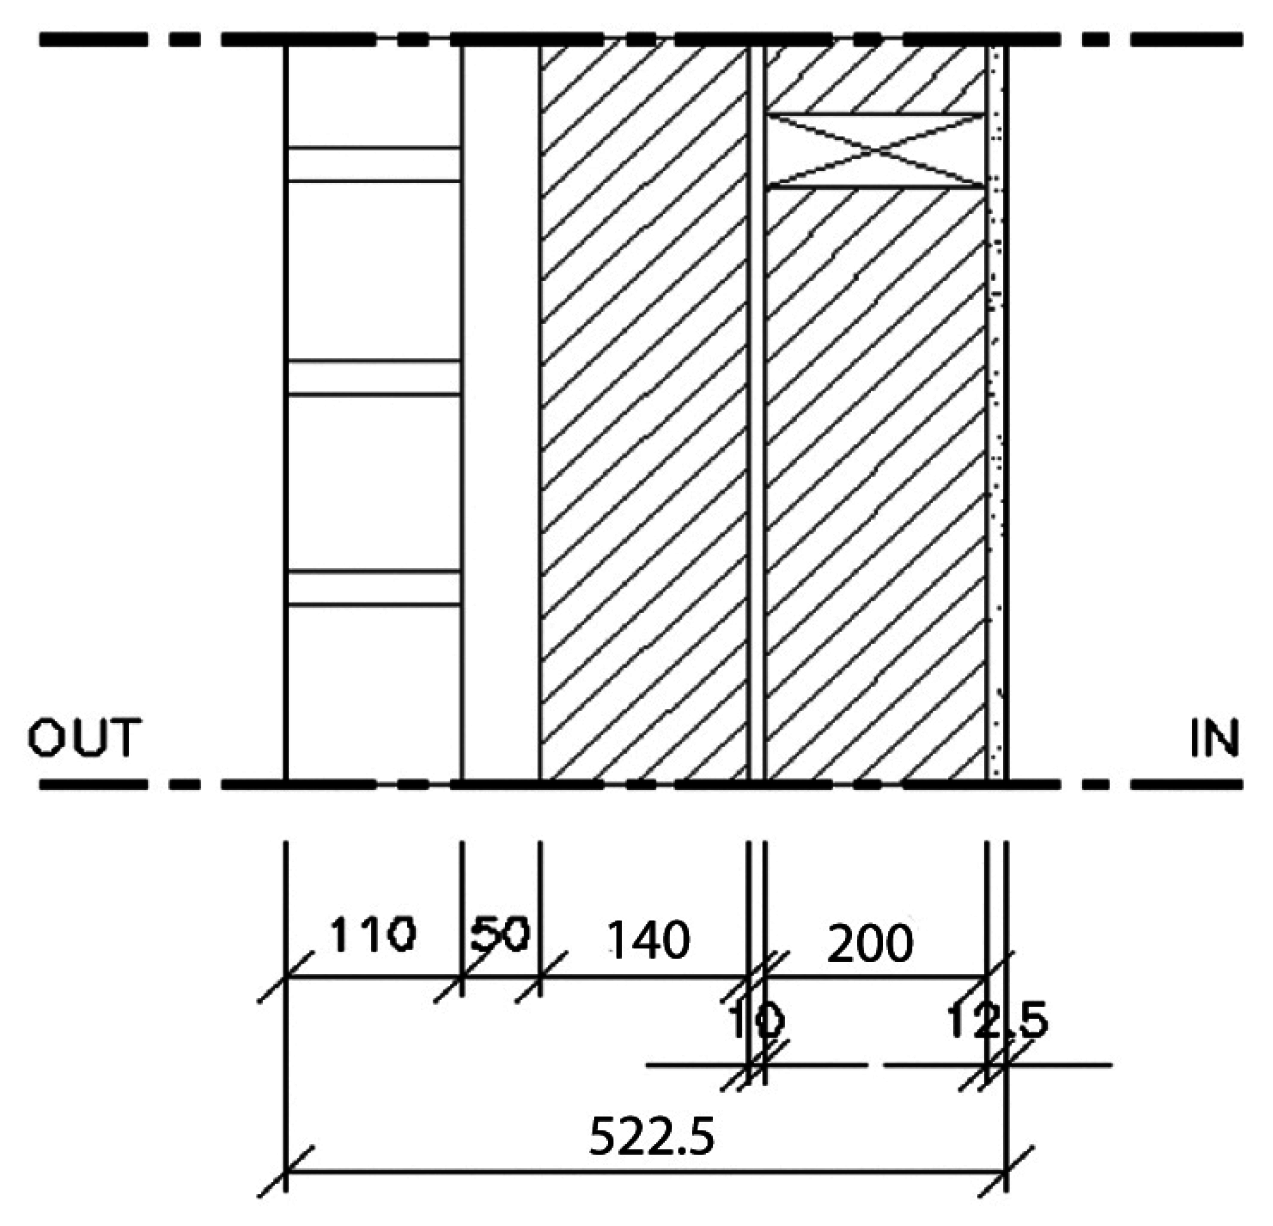
| Decrement factor (0–1) | 0.2 |
| Time Constant (h) | 3 |
| Admittance (W/m2·K) | 1.54 |
| U-Value (W/m2·K) | 0.1 |
| Thickness (mm) | 522.5 |
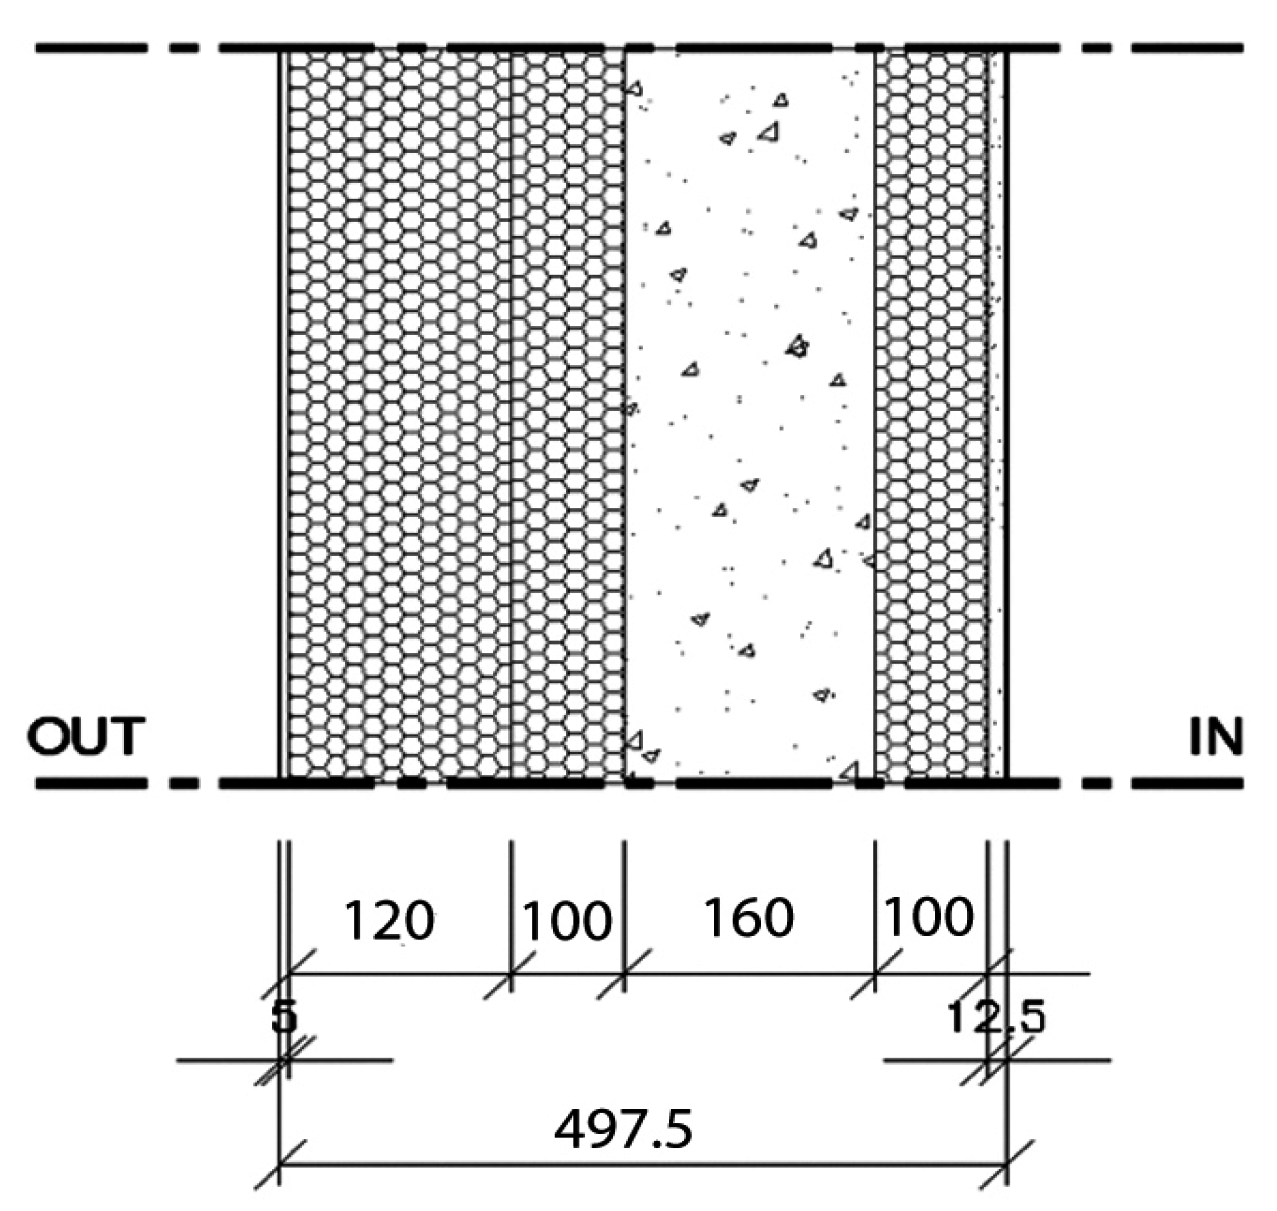
| Decrement factor (0–1) | 0.47 |
| Time Constant (h) | 5 |
| Admittance (W/m2·K) | 2.96 |
| U-Value (W/m2·K) | 0.1 |
| Thickness (mm) | 497.5 |
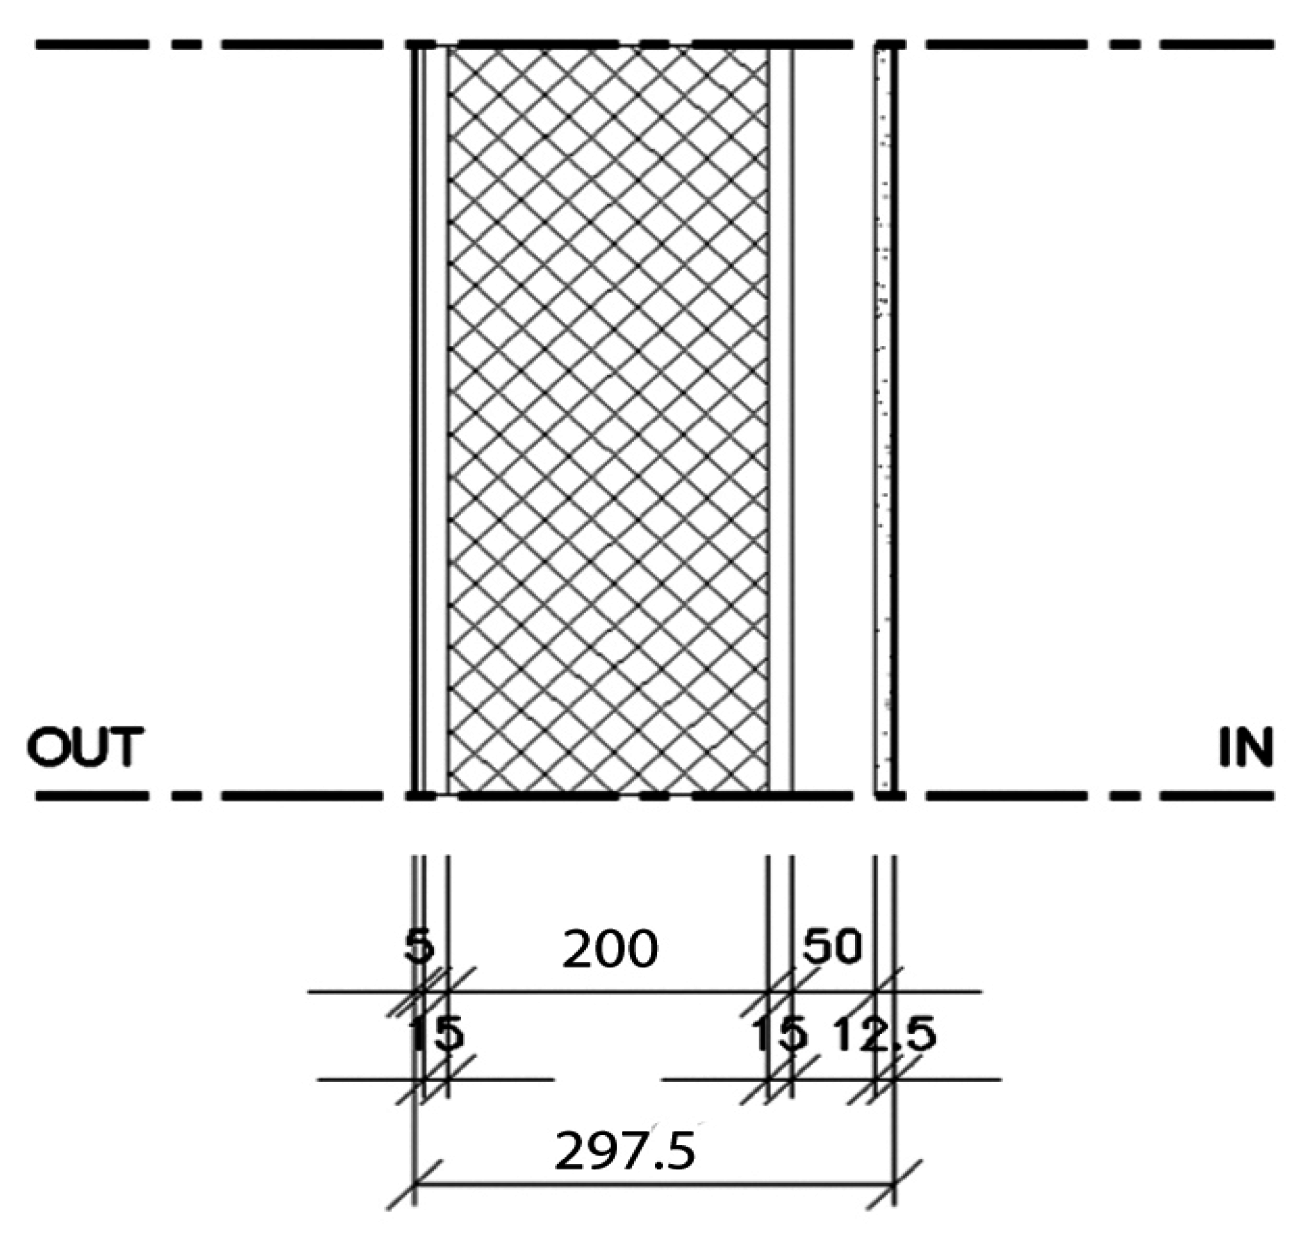
| Decrement factor (0–1) | 0.81 |
| Time Constant (h) | 2.4 |
| Admittance (W/m2·K) | 1.16 |
| U-Value (W/m2·K) | 0.1 |
| Thickness (mm) | 297.5 |
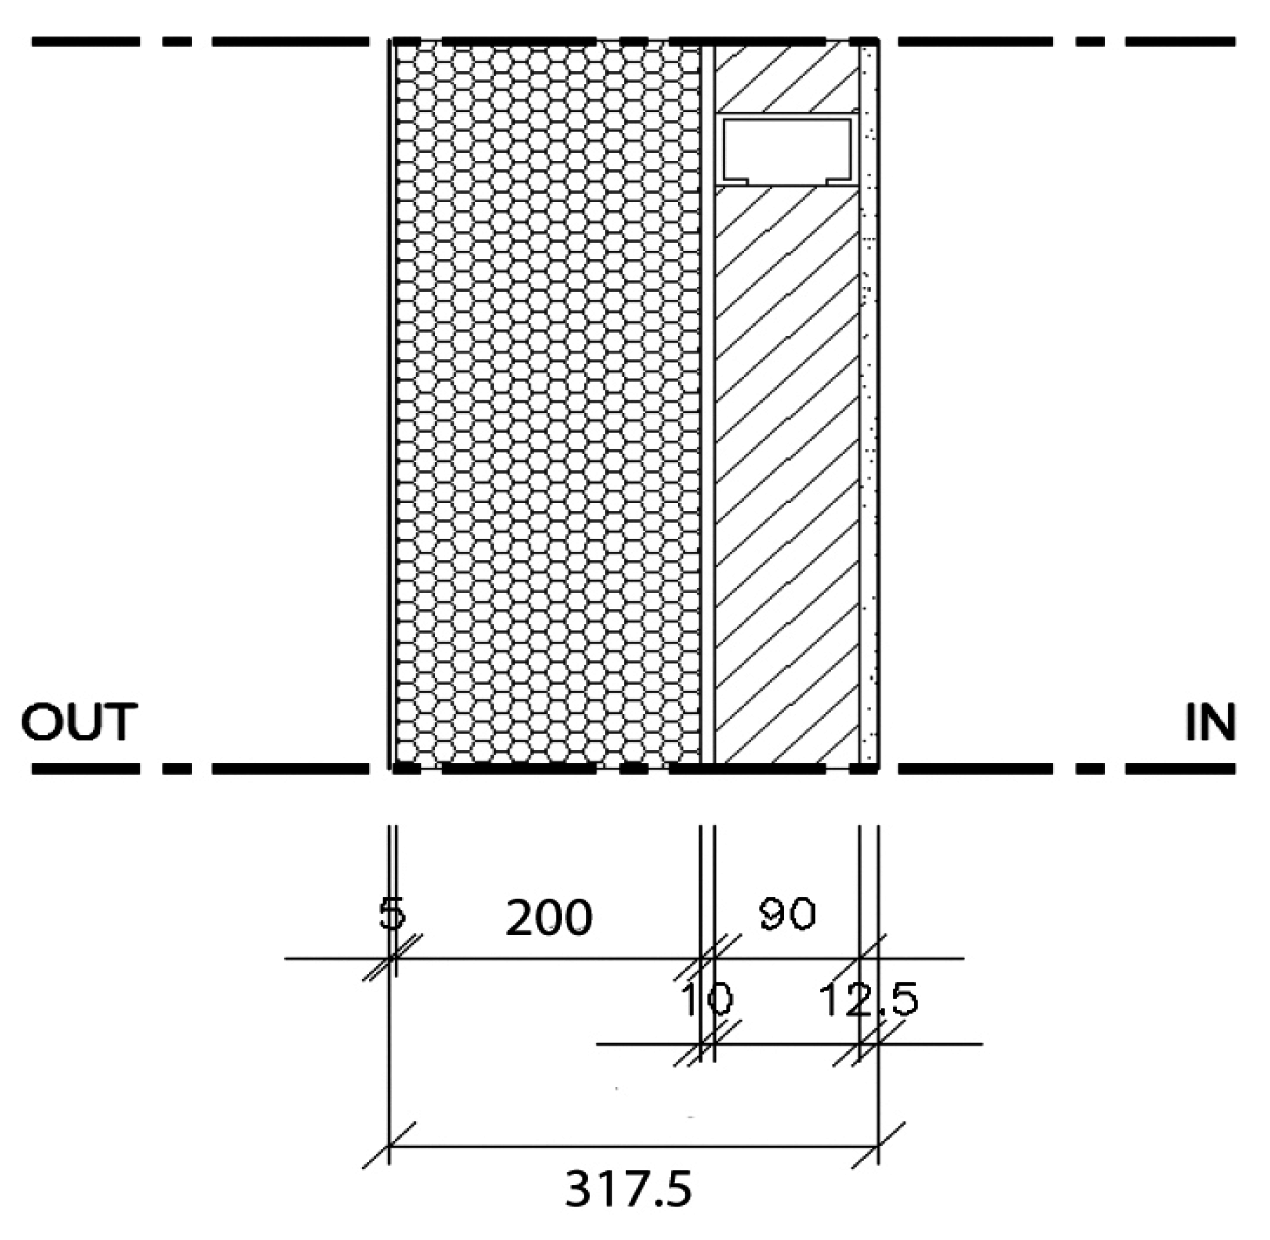
| Decrement factor (0–1) | 0.36 |
| Time Constant (h) | 4.9 |
| Admittance (W/m2·K) | 1.39 |
| U-Value (W/m2·K) | 0.1 |
| Thickness (mm) | 317.5 |


© 2017 by the author. Licensee MDPI, Basel, Switzerland. This article is an open access article distributed under the terms and conditions of the Creative Commons Attribution (CC BY) license ( http://creativecommons.org/licenses/by/4.0/).
Share and Cite
Sajjadian, S.M. Performance Evaluation of Well-Insulated Versions of Contemporary Wall Systems—A Case Study of London for a Warmer Climate. Buildings 2017, 7, 6. https://doi.org/10.3390/buildings7010006
Sajjadian SM. Performance Evaluation of Well-Insulated Versions of Contemporary Wall Systems—A Case Study of London for a Warmer Climate. Buildings. 2017; 7(1):6. https://doi.org/10.3390/buildings7010006
Chicago/Turabian StyleSajjadian, Seyed Masoud. 2017. "Performance Evaluation of Well-Insulated Versions of Contemporary Wall Systems—A Case Study of London for a Warmer Climate" Buildings 7, no. 1: 6. https://doi.org/10.3390/buildings7010006