Article

The Implications of Climate Zones on the Cost-Optimal Level and Cost-Effectiveness of Building Envelope Energy Renovation and Space Heat Demand Reduction

by
Farshid Bonakdar
1,*,
Angela Sasic Kalagasidis
2 and
Krushna Mahapatra
1
1
Department of Built Environment and Energy Technology, Linnaeus University, 351 95 Växjö, Sweden
2
Department of Architecture and Civil Engineering, Chalmers University of Technology, 412 96 Gothenburg, Sweden
*
Author to whom correspondence should be addressed.
Buildings 2017, 7(2), 39; https://doi.org/10.3390/buildings7020039
Submission received: 14 February 2017 / Revised: 26 April 2017 / Accepted: 3 May 2017 / Published: 10 May 2017
(This article belongs to the Special Issue Building Refurbishment and Energy Performance)

Abstract

:
The cost-optimal level of energy performance for buildings shall be identified according to the European directive of 2010. The Swedish building stock needs comprehensive knowledge and an overall strategy for the cost-optimal level of renovation. This paper studies the contribution of Swedish climate zones to the cost-optimal level of renovation on a multi-story residential building in Sweden from the building owner perspective. The building space heat demand is simulated for four Swedish climate zones. The net present profit (NPP) method is defined and used in this study in order to analyze the cost-optimal level and the cost-effective renovation of building envelope components (e.g., attic floor, basement walls, exterior walls and windows). The implication of different discount rates is studied, as well. The results show that the optimum renovation of the building envelope offers 51% more energy savings for space heating when the building is in a northern climate zone compared to a southern zone. The study suggests that different renovation strategies for the building stock renovation need to be identified, separately, for each climate zone. The NPP analysis identifies the minimum required investment and maximum achievable energy savings that are needed to have a cost-effective renovation. The broad range of studied climate zones provides the opportunity to apply the obtained results to other climate zones by either interpolation or extrapolation of NPPs for the buildings with similar characteristics.

1. Introduction

Approximately 40% of the existing apartment blocks in Sweden were built in the period between 1961 and 1975 when the requirements for energy use for heating of buildings were less strict than present national standards. That includes 40,000 multi-story buildings with about 920,000 apartments [1]. Therefore, these buildings have overly large energy demands for space heating and operation compared to new buildings. Given the good serviceability condition of these buildings [2], well-developed maintenance routines, e.g., compulsory ventilation control [3], as well as a low turnover in the entire building stock (0.5% for single-family [4]), it is estimated that the majority of multi-family buildings from this period will undergo deep energy renovation during the next 20 years [5].
Energy targets for the Swedish residential sector have been systematically tightened and implemented over the past 40 years [6]. Besides requirements on low overall thermal transmittance and specific fan power, as well as mandatory energy-related provisions (e.g., minimum air velocity in occupied zones of 0.15 m/s during heating seasons and 0.25 m/s at other times of the year and a minimum surface temperature of 16 °C for the floor of occupied zone), the Swedish building regulations encompass performance requirements for buildings undergoing renovation [6]. As a result of these measures, total energy use in residential buildings has been reduced by 11% between 1995 and 2011 [6], which is considered good, but may not be sufficient to achieve a 50% reduction by 2050. Therefore, the latest national plan for energy efficiency in the building sector asks for more comprehensive renovation and other complementary financial instruments [7].
Deep renovation (i.e., a renovation with a total cost higher than 25% of the building’s value, excluding its land value, or a renovation when more than 25% of the building envelope surface undergoes renovation [8]) includes a large variety of measures, e.g., the improvement of the airtightness and the increment of the overall thermal resistance of the building envelope, installation of a ventilation heat recovery system, the use of more efficient heating systems and using energy efficient appliances. A costly initial investment in these measures is of great concern for property owners. Hence, there is a large need for objective methods and tools with which it would be possible to produce detailed renovation plans for existing buildings from the building owner perspective. That is also in accordance with renovation and investment strategies presented at the level of the building stock [7].
The European Union (EU) directive on the energy performance of buildings [9] requires EU member countries to set minimum criteria for the energy performance of buildings and building components. That includes existing buildings that are subject to major renovation. According to the later directive of 2010 [8], EU countries shall produce a comparative methodology framework to identify the cost-optimal level of energy performance for buildings and building components during their lifespan. Numerous researchers studied the cost-optimal level of buildings’ renovation. The main objectives and methodology of those studies are explained and compared in the following section of the literature review. There are limitations in those studies, regarding the contribution magnitude of different parameters, e.g., building characteristics, climate condition and economic parameters, to the cost-optimal level of building energy renovation. The existing studies commonly consider and analyze case studies with certain characteristics. Therefore, the obtained results may not be readily applicable for the entire building stock in another climatic condition or under another investment condition.
In this study, we focus on the renovation of the building envelope components (e.g., basement walls, attic floor, exterior walls and windows) from the perspective of the building owner. The significant contribution of the building envelope to space heat demand reduction has been indicated in several research works [10,11,12]. Building envelope renovation is often suggested as the most expensive retrofit strategy for the property owner [13,14]. In the European countries, space heat demand uses a large amount of total final energy during the operation phase of existing buildings [15,16]. A recent study [17] indicates that final energy use for space heating should be reduced by approximately 80% to fulfil the EU objective, i.e., reducing 80–95% of GHG emissions by 2050, compared to 1990.
In order to provide better knowledge and understanding for the development of an objective methodology, this work considers the implications of different climate zones; i.e., four zones from north to south of Sweden; on the optimum measures of building envelope renovation. This is required for the identification of the reference building in this building stock. The cost-optimization is analyzed by means of a reformed net present value (NPV) method, which is denoted net present profit (NPP). It indicates the difference between renovation investment and the present value of saved energy cost during the building lifespan after renovation. In this method, the cost-optimal level of energy renovation and the cost-effectiveness of renovation measures can be studied simultaneously. Therefore, this analysis can suggest whether or not the cost-optimal level of renovation is cost effective. Another feature of the employed method is that the span of cost-effective measures of renovation can be identified, as well. From the perspective of the building owner, the employed method is more comprehensive and provides more understandable results than the method in which the NPV of global cost is calculated (illustrated in Figure 5). This is because the maximum value of NPP directly indicates the optimum measure, and the positive values indicate the span of cost-effective measures. It also provides, on one side, a range of measures that suggest the most superficial renovation, while still cost-effective; and on the other side, the deepest renovation within the cost-effective span of the renovation measures. This span of measures cannot be identified from the NPV of the global cost calculation method.
The ultimate target of this study is to investigate how and to what extent the different climate zones may influence the cost-optimal level and the cost-effectiveness of energy renovation for building envelope components. In addition, the study aims to analyze the contribution of different economic scenarios to the cost-optimal level, as well as the most cost-effective renovation of the building envelope when the climate zone varies.
What makes this study different from other works with a similar subject is the integrated approach to finding the trend of changes in the cost-optimal level and the cost-effectiveness of building envelope renovation, when the climate zones and economic parameters vary. This is especially of interest for building owners with the same type of building in different parts of the country, as is the case in Sweden. During the 1960s, about a million apartments were built all over Sweden in a huge construction campaign. To facilitate the costs and time of construction, the campaign had been based on a few multi-family building types, which have been replicated at different locations. A multi-story residential building from the 1960s has been used as a case study in order to do the energy-balance simulation and perform the cost optimization analysis.

2. Overview of the Research Area

There are various studies about the cost-effectiveness and cost-optimization of energy renovation of the building envelope for either a single case study building or collected set of buildings (e.g., [18,19,20,21,22,23,24,25,26,27,28,29,30,31,32]).
For example, Goto, Y. et al. [30] performed an economic, ecological and thermo-hygric optimization analysis of insulation thickness for a vapor-open envelope, considering several subtropical climates in Japan. Their study is limited to the insulation thickness for the walls in new buildings. Arumegi and Kalamees [27] analyzed primary energy savings due to the renovation of a wooden apartment building from the economic point of view, based on computer simulation, field measurement and economic calculation, as well as the cost-optimum primary energy level of renovation. In another study, the economic viability of building envelope renovation for five representative dwellings in the Belgium building stock has been studied by Verbeeck et al. [31]. They considered extra insulation, better glazing and renewable energy systems in order to find the priority of energy saving measures from the economic point of view. The economic impact was assessed through total NPV, assuming a discount rate of 5%. The results of their study suggest that roof insulation is the most effective measure from the economic perspective, and floor insulation appeared to be profitable (i.e., cost-effective). Bonakdar, F. et al. [21] analyzed the cost-optimum energy renovation of the building envelope in a Swedish multi-story residential building, using the marginal cost-difference method, and studied the contribution of different economic scenarios to the cost-optimal level of renovation. The contributions of building lifespan after renovation, energy price development and discount rate to the optimum measures of building envelope components were considered in that study. They found that the scenario with a 1% discount rate and a 3% annual energy price development may offer a 100% increase in the optimum thickness of additional insulation, compared to the scenario with a 5% discount rate and a 1% annual energy price development. The results of their study suggested that building lifespan does not contribute to the optimum measures variation as much as the economic parameters. A brief review of several studies [16,20,21,23,25,27,28,31,33,34,35,36,37,38,39,40,41,42,43,44,45,46,47] is compiled and presented in Table 1, where the methodology, approach, some assumptions and the applicability of the studies can be compared.

3. Methods

Sweden is located between the latitudes of 70°N and 55°N, equivalent to heating degree days (HDD) between 7400 HDD and 3900 HDD (for the year 2014), from north to south respectively (i.e., about 1500 km). This indicates a large span in climate condition within the length of the country, which may cause significant differences in the required space heat demand of buildings. Therefore, studying the implications of different climate zones on building performance to meet the required heat demand of living space is very important. This is especially of so much interest, from the economic point of view, for the renovation of the residential building stock in Sweden, which is old and in urgent need of energy performance improvement.

3.1. General Approach

An existing residential apartment building is used as a case study. This building is located in Zone 3 of the Swedish climate zones. The design of multi-family residential buildings from this period has been very uniform throughout the country, although their number is different between different locations [48]. Common features include a load bearing system of concrete, sandwich wall elements and exhaust-air ventilation systems.
The general approach of this study can be described as the steps outlined below.
(i)
energy balance simulation of the case study building;
(ii)
assuming identical buildings in different climate zones and performing energy balance simulation;
(iii)
considering the energy efficiency measures for the energy renovation of the building envelope in different climate zones and estimating the implementation cost;
(iv)
performing the cost-optimization of energy renovation for each individual component of the building envelope, i.e., windows, basement walls, exterior walls and attic floor;
(v)
analyzing the implications of different discount rates on the optimum measures in different climate zones;
(vi)
cost-effectiveness evaluation of building envelope energy renovation.

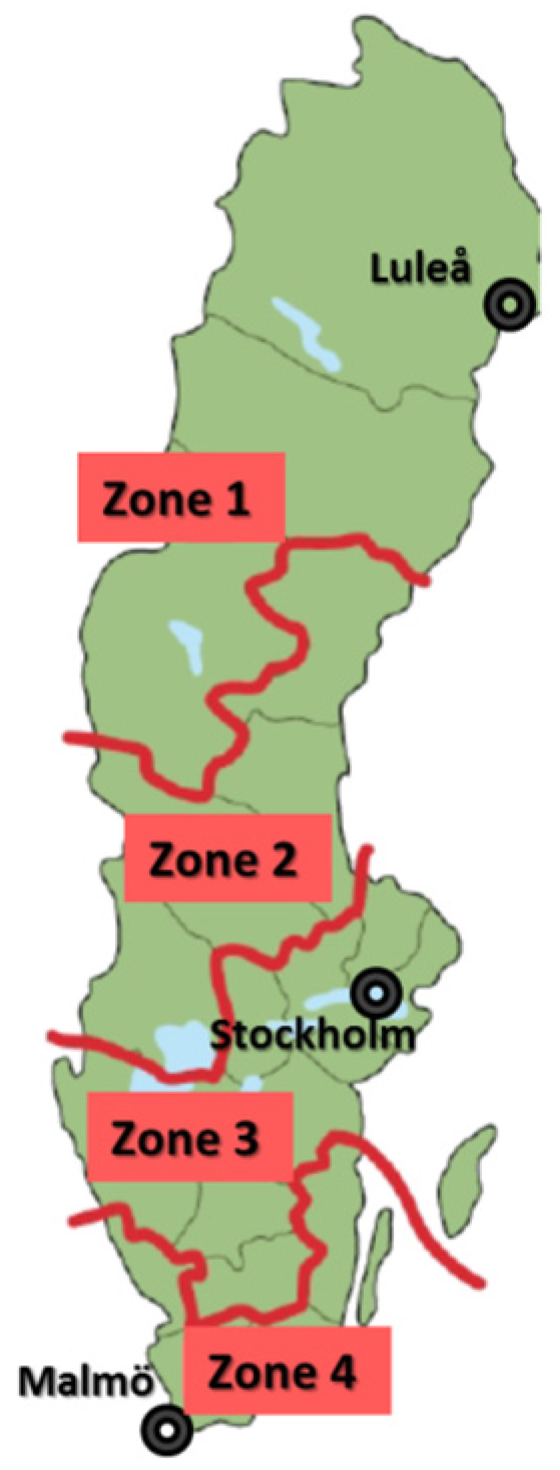
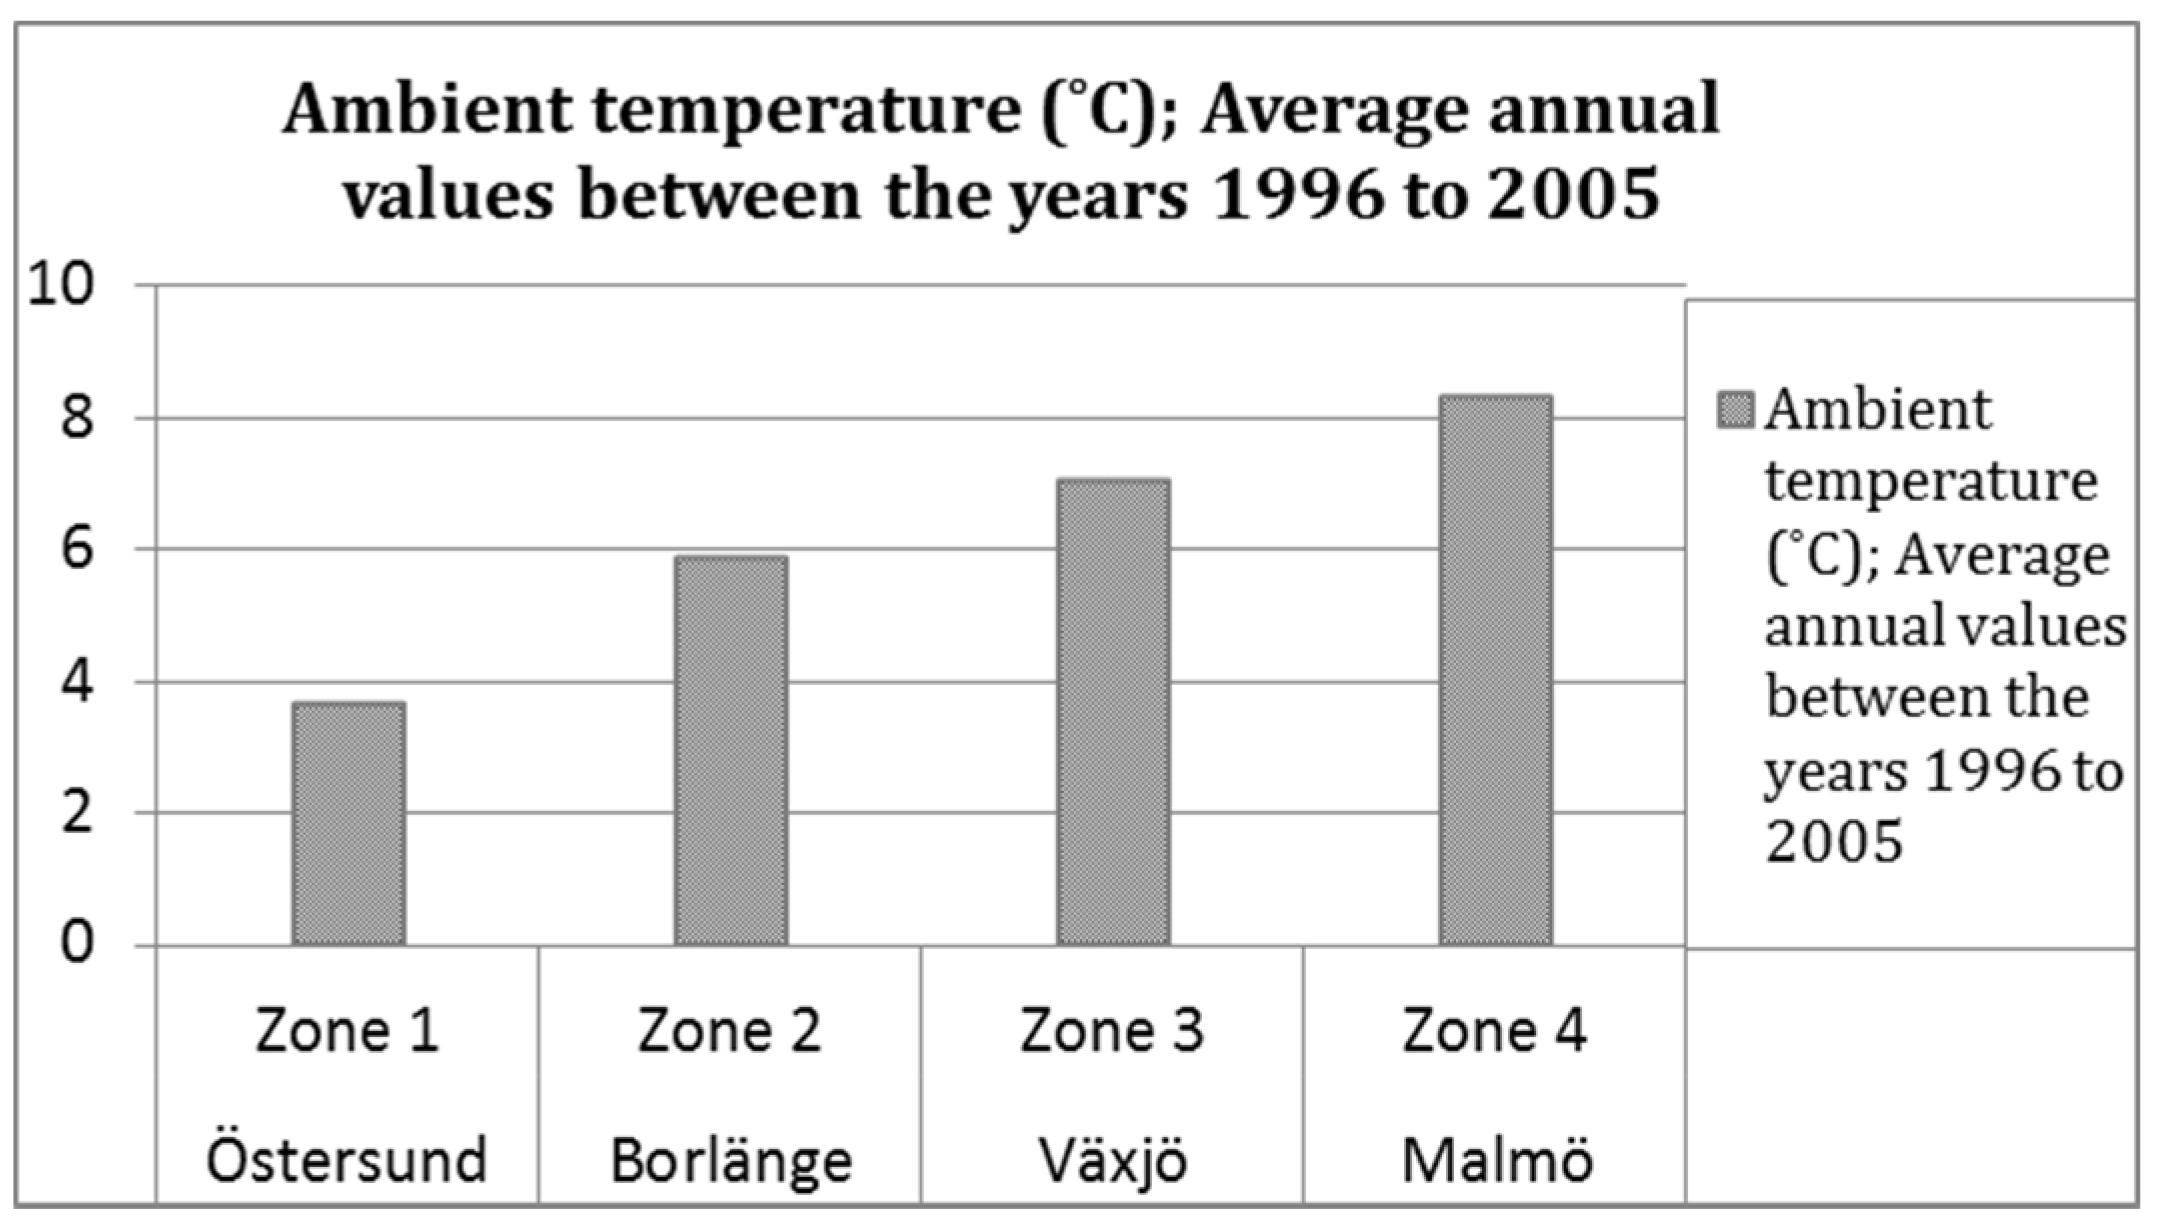
3.2. Climate Zones in Sweden

Sweden is divided into four climate zones of 1, 2, 3 and 4, respectively from north to south (Figure 1), according to the Swedish building code [3]. We consider the following cities, representing four different climate zones, i.e.: Malmö, in Zone 4 with the latitude of 55°36′ N and heating degree days of about 3900 HDD, for the year 2014; Växjö in Zone 3 with the latitude of 56°50′ N and heating degree days of about 4600 HDD, for the year 2014; Borlänge in Zone 2 with the latitude of 60°29′ N and heating degree days of about 5300 HDD, for the year 2014; and Östersund in Zone 1 with the latitude of 63°10′ N and heating degree days of about 5900 HDD, for the year 2014.
Figure 2 illustrates the average of ambient temperature (°C) for the considered locations of the case study building, between the years 1996 and 2005. This period is used in the energy balance simulation of the building.
Other climate parameters, e.g., wind velocity, solar radiation and relative humidity, are considered, as well, in the energy balance simulation of the building.

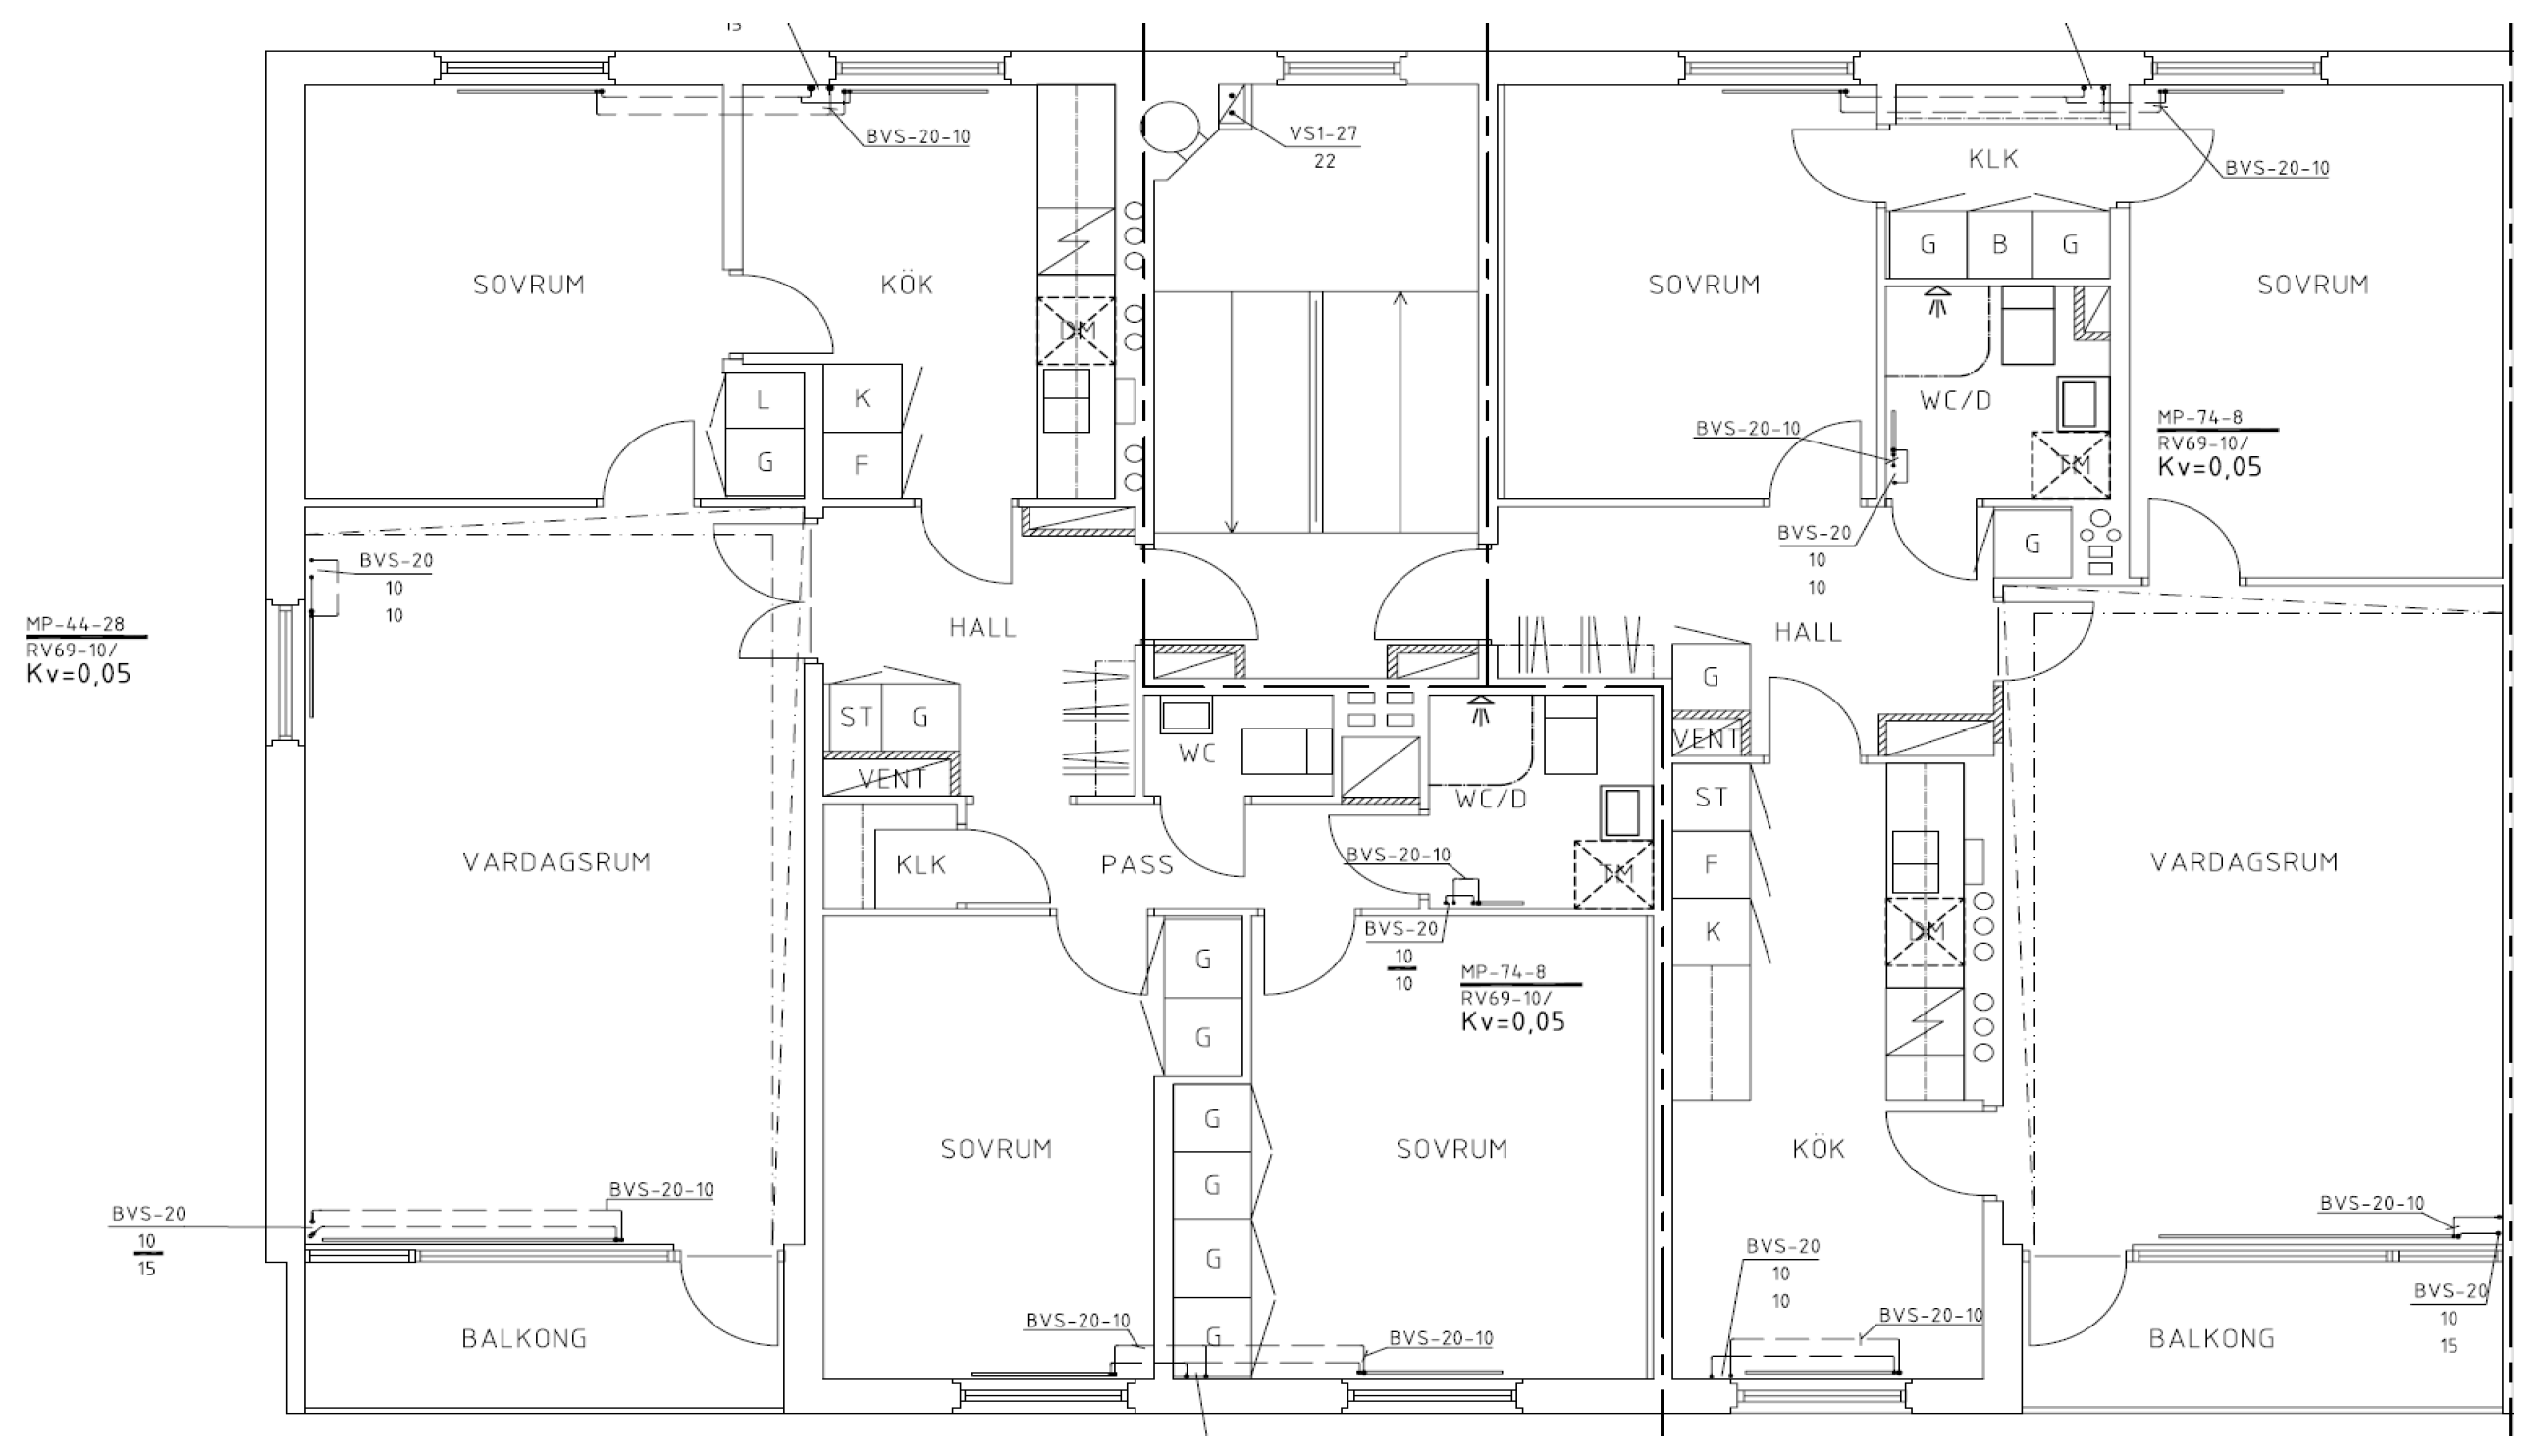
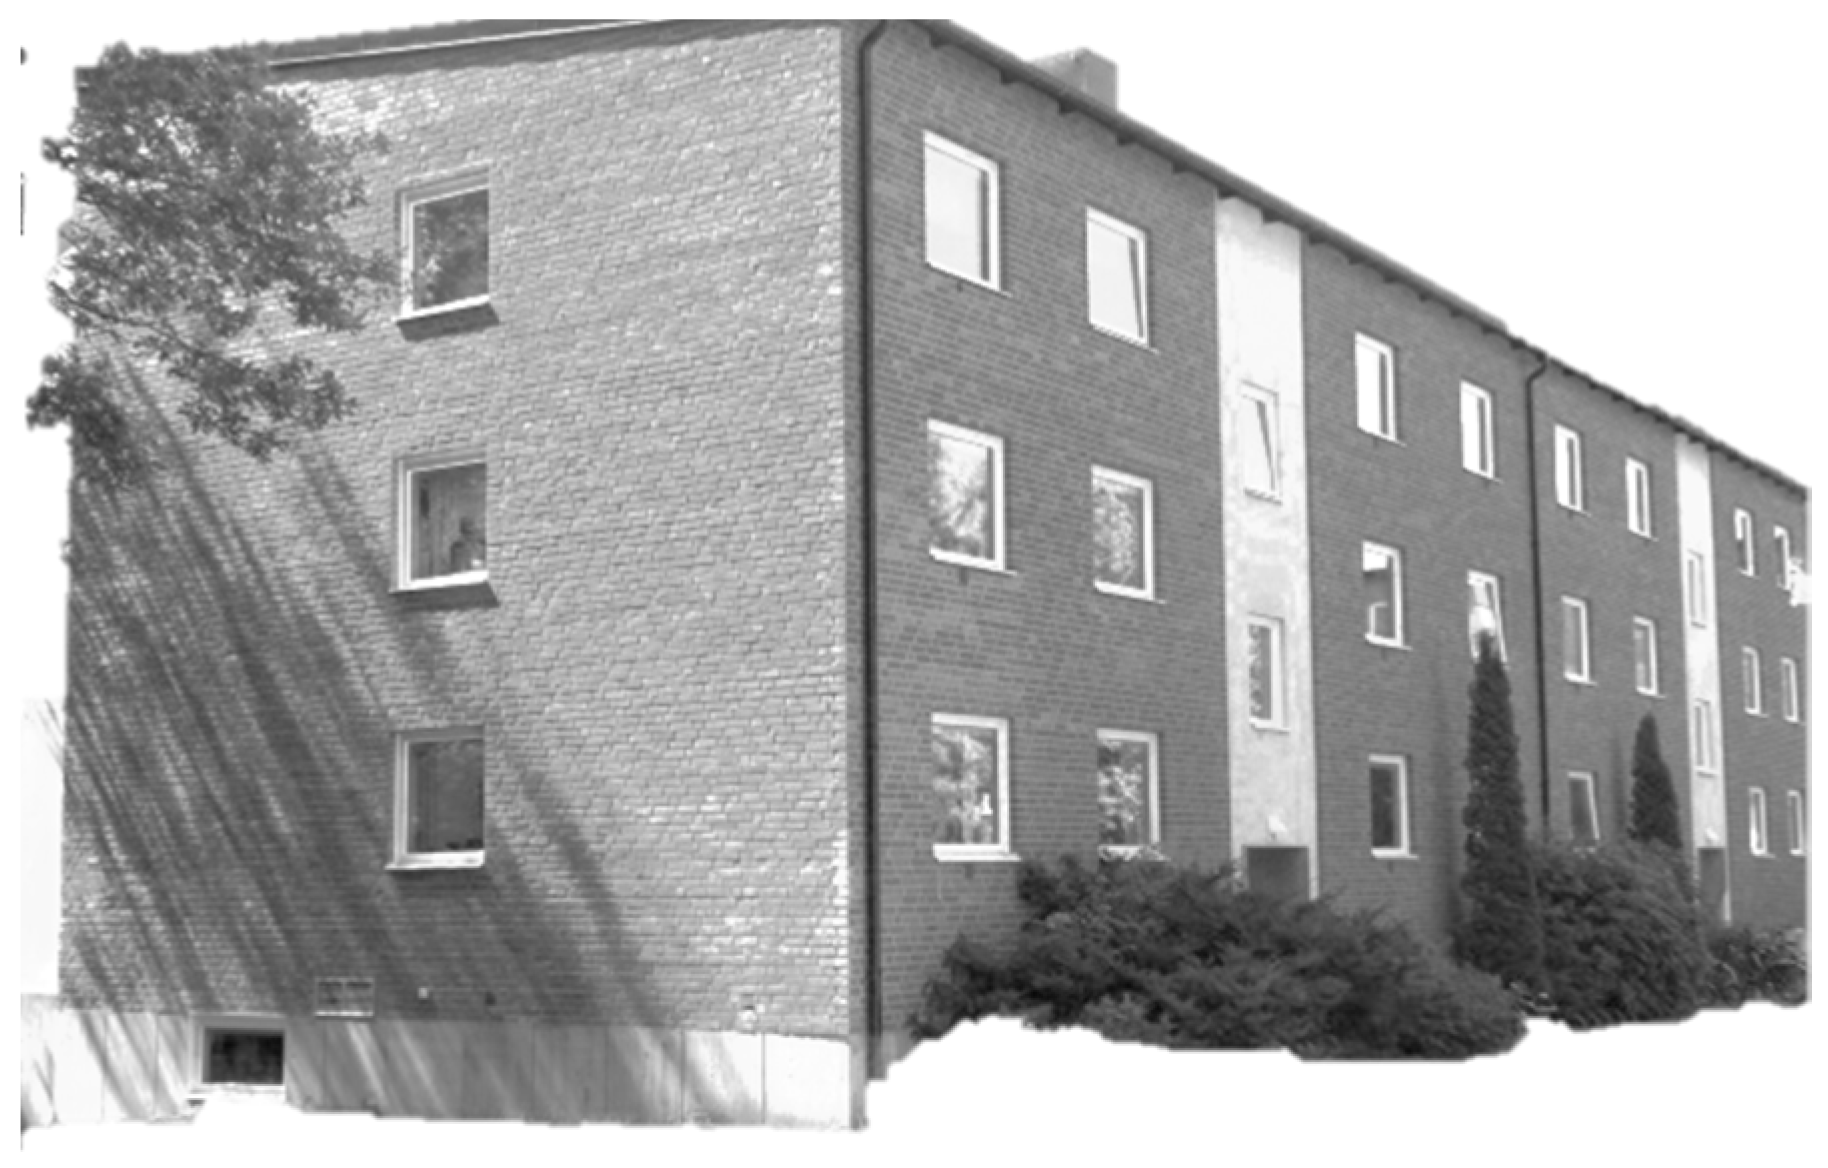
3.3. Case Study Building

The case study building is located in city of Växjö in the third climate zone of Sweden, which is used as the reference zone. The building consists of six flats on the ground floor and four flats on each floor from the first floor to the third floor. Therefore, this building has 18 residential flats. The building structure is concrete frame with brick facade, and it was constructed in 1964. Figure 3 and Figure 4 show the north-east view and a floor plan of the building, respectively. Table 2, Table 3, Table 4 and Table 5 present the building envelope characteristics [49,50] in initial status.
The total volume of indoor space is 3710 m3 with the heated floor area of 1430 m2. The ventilation system of the building is an exhaust air fan with the flowrate of 0.35 lit/m2/s. The airtightness of the building has not been considered in the simulation since the ventilation system in the building is assumed to remain unchanged. The heating system is district heating (DH), which currently dominates apartment heating in Sweden [51]. The DH system contributed to about 56% of the total heat supply in the Swedish residential and service sector, in 2011 [51]. Buildings connected to DH in Sweden are heated continuously during 24 hours or whenever the need appears in order to keep the heating power demands within certain limits. Consequently, the indoor temperature in multi-family buildings is rather uniform and stable, which allows treating the building as one thermal zone in building energy simulations. However, the model takes into account temporal variations of indoor air temperature and energy demand that result from the operation of ventilation systems, occupancy patterns, use of domestic appliances and the effects of solar heat gains. Mata, Kalagasidis and Johnsson [52] have shown that this approach combines favorable features of detailed and more general building energy simulations models. A better spatial resolution of a building would require a much larger set of input data, which may not be readily available. Instead, the required information of the building characteristics for the analysis was extracted from existing drawings provided by the building owner.
There are about 30,000 apartment buildings in Sweden with a total heated floor area of approximately 75 million m2, constructed between 1961 and 1975 [53]. They have rather similar characteristics to the case study building since they are almost from the same period of time [53].

3.4. Energy Balance Simulation

The energy balance of the building, before and after implementing the energy efficiency measures, was modelled, using the simulation program of VIP-Energy ® [54]. VIP-Energy is a dynamic energy balance program that models buildings’ final energy use. The climate data in VIP-Energy include ambient temperature, relative humidity, wind velocity and the sun radiation [54]. These data are obtained from Meteonorm [55] and from the Swedish Meteorological and Hydrological Institute (SMHI). The simulation program has been validated by IEA-BESTEST and CEN-15265 [56]. A required room temperature of 22 °C and a constant operation schedule pattern, as well as intensity of heat gain (e.g., from solar radiation and internal heat gain) during the entire year are assumed for the energy balance simulation, which uses hourly steps. The exhaust air ventilation has a constant flow rate of 1 ACH during the entire year. The program takes air leakage from the envelope into account.

3.5. Building Envelope Renovation and Energy Efficiency Measures

In this study, the main components of the case study building envelope (i.e., exterior walls, windows, basement walls and attic floor) are considered to undergo major renovation for energy conservation purposes. Additional insulations on opaque components and energy-efficient windows were considered as energy efficiency measures for envelope renovation.
We assumed a wide range of additional insulation thicknesses for the considered opaque components and different thermal transmittance for new windows in order to evaluate the contribution of the considered energy efficiency measures to the energy saving of space heat demand. This exercise was performed for the cases where the case study building is assumed to be located in each climate zone of Sweden.
The initial thermal transmittance of the considered components in the building envelope meet the required criteria of the Swedish building code at the time of building construction, i.e., SBN 67 [57]. The U-values of the components are well below the required criteria of SBN 67 for the building located in climate Zone 3. They also meet the requirements of that building code for all other climate zones. Therefore, an identical building is assumed for other climate zones. This is suggested in the typology approach for building stock energy assessment (Tabula project), as well [58].
Table 6 shows the additional insulation materials and the span of considered thicknesses, as well as the different U-values for the new windows. The thermal conductivity (λ-value) of the considered insulation materials (e.g., mineral wool or EPS panel) are collected from the reference database for the building materials and their prices on the Swedish market [59]. This database suggests different insulation materials with a wide range of thermal conductivity (e.g., mineral wool of 0.033–0.039 W/mK). As is shown in Table 6, a wide range of thicknesses for additional insulation on opaque components of the building envelope is chosen. This thickness reaches to as large as 500 mm in exterior walls, which requires special consideration in terms of installation facility and practicality. The existing overhang of the roof provides sufficient room for 500 mm-thick insulation on exterior walls. The cost of the required installation materials is taken into account for renovation cost estimation. The considered wide span of insulation thicknesses provides a more reliable trend of NPP with respect to variations in insulation thickness. Moreover, applying 480 mm of additional insulation on exterior walls of residential buildings has been successfully practiced in renovation projects, as suggested in [59].

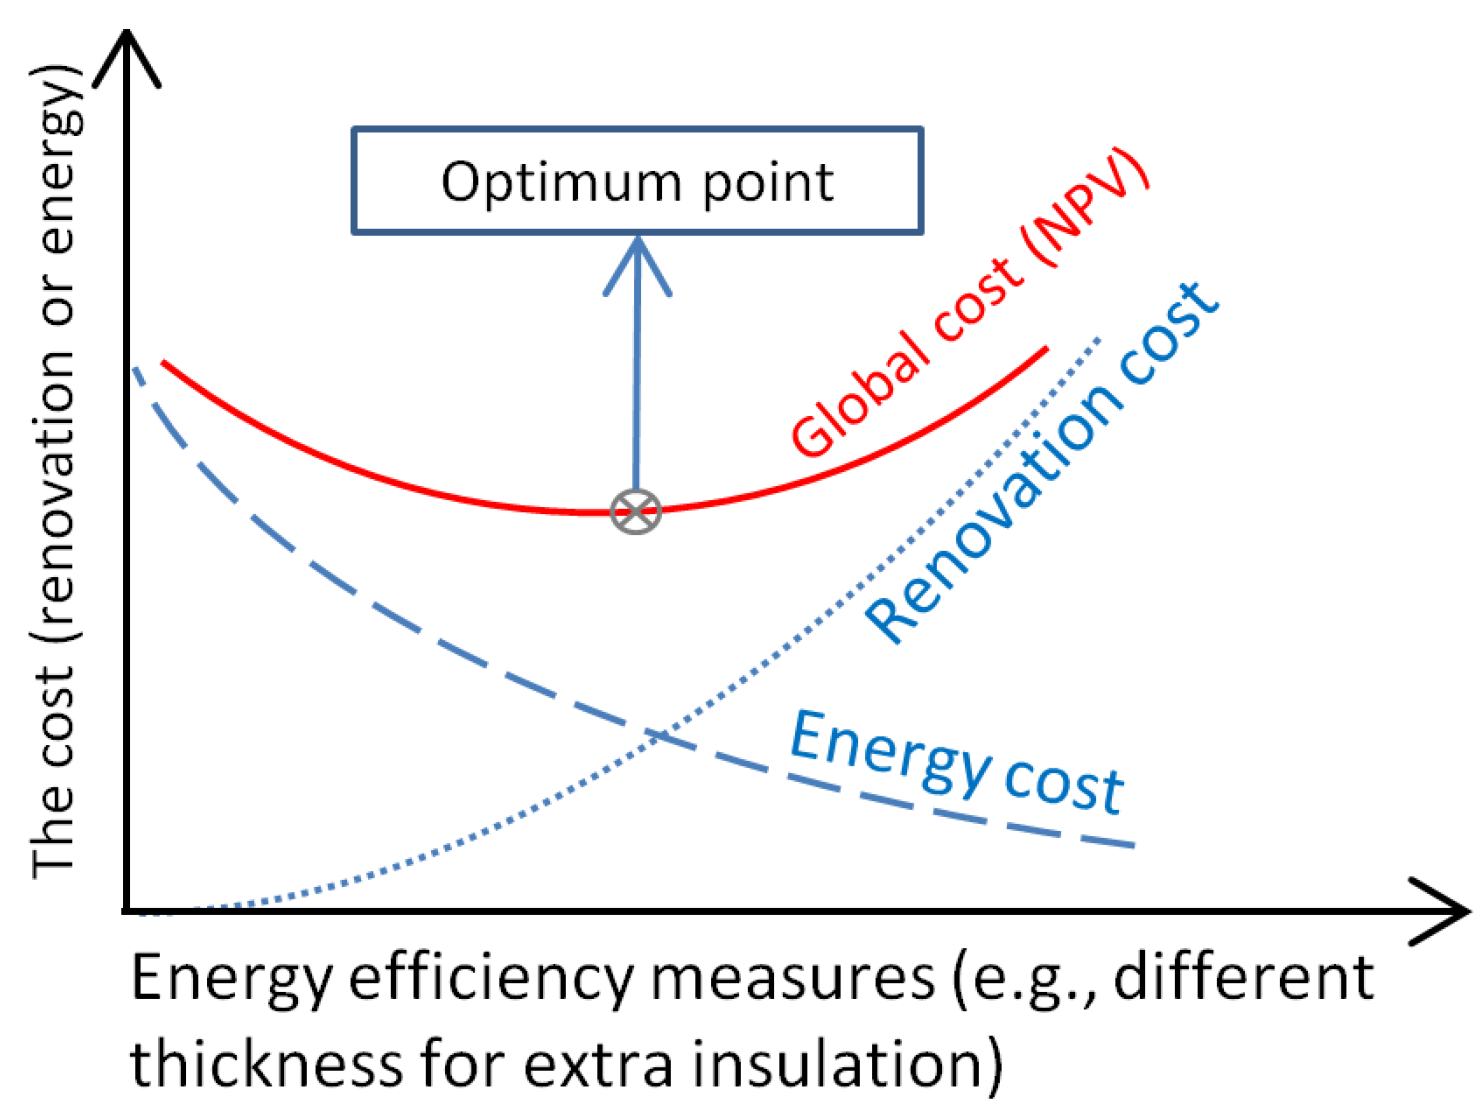
3.6. Cost-Optimization and Cost-Effectiveness Analysis

In the Swedish residential building stock, the energy renovations of existing buildings are carried out mainly for reducing the energy use and greenhouse gas emission. This is expected to be done in a cost-effective manner in order to motivate the buildings’ owners to consider renovation for the energy conservation purposes at the microeconomic level. An energy-efficient measure is cost-effective as long as the investment cost for implementation of the measure could be paid back due to saved energy cost during the considered lifespan of the measure. However, the cost-effectiveness may be dependent on various parameters, e.g., discount rate, life span of the measures, energy price, etc. There might be cases where some measures may not be cost-effective, i.e., the investment does not pay back during the lifespan. Above all, the cost-effectiveness of a measure may vary in a range (e.g., additional insulation of wall may be cost-effective at several thickness levels of insulation), of which one point is the cost-optimum. The energy performance of the building directive [8] recommends the implementation of such cost-optimal level of energy efficiency measures.
In this study, the concept of net present value (NPV) is employed as a base to practice a calculation method in order to simultaneously perform the cost-optimization analysis for the energy renovation of the building envelope and evaluate the cost-effectiveness of measures. The cost-optimal level for energy renovation is the point where the NPV of global cost, i.e., the sum of the NPV of annual final energy costs during the building lifespan and the investment cost of renovation, would be the minimum. Figure 5 illustrates this concept of cost optimization.
In this study, the term “net present profit (NPP)” is suggested for the cost-optimization method. It represents the difference between the net present value of the reduced energy cost of space heat demand for a certain period of time (i.e., considered lifespan for efficiency measure) and the initial investment of the energy renovation. The following equation shows the details of the NPP concept and calculation.
NPP   = [ i = 1 k S i / ( 1 + R ) ^   i ] I
where S is the net cash flow (final energy cost saving for space heating) during the building lifespan after renovation (k); R is real discount rate; and I is the investment cost for energy renovation (renovation cost). Figure 6 illustrates a sample diagram for NPP calculation results. It shows how the diagram can be interpreted and what information can be extracted.
In Figure 6, the efficiency measure that is indicated at Point 2 represents the cost-optimum thickness of extra insulation in the NPP diagram; Point 1 indicates the minimum thickness of extra insulation, which suggests the lowest investment for energy renovation without financial loss; and Point 3 indicates the measure that offers the maximum energy savings due to the maximum thickness of extra insulation without financial loss. The range of measures between Points 1 and 3 is the range where the measures are cost-effective. The NPP concept can provide a clear and comprehensible picture to express and visualize the cost-optimality, as well as the cost-effectiveness of energy renovation, especially in a comparative analysis, e.g., this study.
In this study, NPP is calculated for all considered efficiency measures of the building envelope components. An example of such a calculation is provided in Table 7 for the NPP of exterior walls’ renovation. The maximum value of NPP corresponds to the cost-optimum measure, i.e., optimum thickness for additional insulation on opaque components and optimum U-value for new windows. Negative values of NPP indicate that the investment for energy efficiency is not cost-effective for the considered lifetime and the assumed economic parameters. The preference of the NPP concept is that the cost-optimal level of energy renovation can be analyzed, while the range of cost-effective measures can, simultaneously, be evaluated. The results, obtained from NPP analysis, can provide information for making the decision to renovate a building, based on the priority given to either energy savings or the investment for energy performance improvement.
Another feature of the NPP method is the possibility to evaluate the most cost-effective measures that correspond to the optimum-level of building envelope energy renovation for each component. This is especially important in the cases where renovation profitability is of the most interest. The preferability of this method, which has not been used in existing works with a similar subject (e.g., payback time and internal rate of return), is that it provides a comprehensible picture for the cost-effectiveness of energy renovation while optimizing that.
In order to calculate NPP for the energy renovation, the parameters listed below need to be considered. The possible variations of some of these parameters are assessed in sensitivity analysis for the evaluation of their contribution to the optimum measures and the renovation cost-effectiveness.

3.6.1. Discount Rate

The discount rate reflects the capital cost and expected rate of return of an investment. That is, the utmost assessment principle of the costs and long-term profits in different policy scenarios. A discussion paper of BPIE [60] suggests a discount rate in the range of 1–7% to be used by EU member states in energy system analysis. It indicates that the discount rate may significantly vary depending on the country and the investment timespan. In the United Kingdom, for instance, the real discount rates of 3.5% and 3.0% can be assumed for the investment time-span of 0–30 years and 31–75 years, respectively.
Notices from European Union institutions, bodies, offices and agencies on the European Regulation No. 244/2012 [61] urge EU member states to do the sensitivity analysis on two different discount rates for the calculation of buildings’ energy performance in which one shall be 4% in the real rate. The U.S. Department of Energy [62] suggests a discount rate of 3% for the projects related to energy conservation and life cycle cost (LCC) analysis of existing and new buildings. The potential risk in capital investment may be reduced by considering the energy efficiency measures. Therefore, the discount rate for sustainable buildings is usually on a risk-free basis [63]. Zalejska-Jonsson, A. [64] calculated a 2% discount rate, considering a risk-neutral investment. Mata et al. [16] noted that the range of discount rates proposed by European countries for the life cycle cost assessment of public projects varied between 1.5% and 5.0%. As is suggested by the BRE Global Client Report [65] of the LCC analysis of an insulation material, a real discount rate of 3.5% is used by the U.K. Treasury. A discount rate of 3.0% was considered as a base case scenario in this study. This rate is indicated in the guideline of the EU directive on the energy performance of buildings [66]. In order to evaluate the contribution of the discount rate to the optimum measures in different climate zones, we consider discount rates of 1.0% and 5.0% to perform the sensitivity analysis.

3.6.2. District Heating (DH) Price

DH price significantly varies due to several parameters, e.g., the ownership structure of district heating companies, input fuels and the geographical conditions for the installation of DH [67]. In order to have a comparative methodology with the focus of the climate zones’ effect on the optimum measures, we assume an average price of 0.067 Euro per kWh for all four zones of Sweden. This rate is equal to the DH energy price based on the energy supplier tariff in the city of Växjö [68]. Energy price for space heating has a significant impact on the optimal level of renovation and on the cost-effectiveness of renovation. However, this parameter remains constant, as there are various reasons for the large variety in energy price throughout the country. Studying the details of the implications of the various relevant parameters on energy price variations requires a comprehensive analysis, including the energy supply system analysis, which is not in line with the purpose of this study and, therefore, is not included in the sensitivity analysis.

3.6.3. Annual Increase in DH Price

The official statistics of Sweden suggests an annual increment of about 2% in DH price between 1996 and 2012 [69]. In this study, the same trend is assumed to continue during the lifespan of the building after renovation.

3.6.4. Remaining Lifespan of the Building after Renovation

The lifespan of the building envelope may change depending on various parameters, e.g., construction technology at the time when the building was constructed, building materials’ quality and the maintenance regime. A survey on actual buildings’ lifespan [70] revealed that the reason commonly cited for the demolition of buildings is area redevelopment, which is not essentially connected to the condition of structural system or the general condition of buildings from the physical point of view.
The exiting building windows and insulation materials of the case study building are about 50 years old. In order to have a realistic comparison with the focus on the climate zones’ implications, it is assumed that the implemented energy efficiency measures lifespans would be 50 years after renovation. The thermal conductivity of the building envelope is assumed to remain constant during the lifespan of improved components after renovation.

3.6.5. The Cost Estimation for Renovation Work

Investment cost for implementing the considered energy efficiency measures is calculated according to the renovation work tariff of Sweden [59] assuming that the building does not need renovation for repair and maintenance purposes. The costs of required materials and time for installation and construction work and changing windows, as well as the required man-hours for each work, the cost of excavation for basement walls’ insulation and required scaffolding for the work on the external side of the facades were taken into account. The costs of required equipment for the insulation materials installation are considered, as well.
The price of insulation materials and the new windows may vary depending on the market where the materials are supplied. The local market of the Swedish construction industry is used for the prices of insulation materials and new windows that are considered in this study. The price of mineral wool with thermal conductivity of 0.037 W/mK varies from 4–28 Euros/m2 for the thicknesses of 50–400 mm, respectively. The price of mineral wool panels with thermal conductivity of 0.034 W/mK, which are considered as extra insulation on exterior walls, varies from 4–21 Euros/m2 for the thicknesses of 45–290 mm, respectively. The price of expanded polystyrene panels (EPS) that are considered for basement walls changes from 7–30 Euros/m2 for the thicknesses of 70–300 mm, respectively. The price of new windows appears to have large uncertainty in the market, and it is significantly different between different manufacturers. We use the average price of the common Swedish manufacturers. The considered new windows, for the case study building, with a U-value of 1.2–0.6 W/m2K, vary from, approximately, 300–900 Euros, respectively. Table 7 shows the estimated cost for implementing the additional insulation with different thicknesses on exterior walls as an example. The details of further calculation of NPP values are presented, as well.

4. Results and Discussion

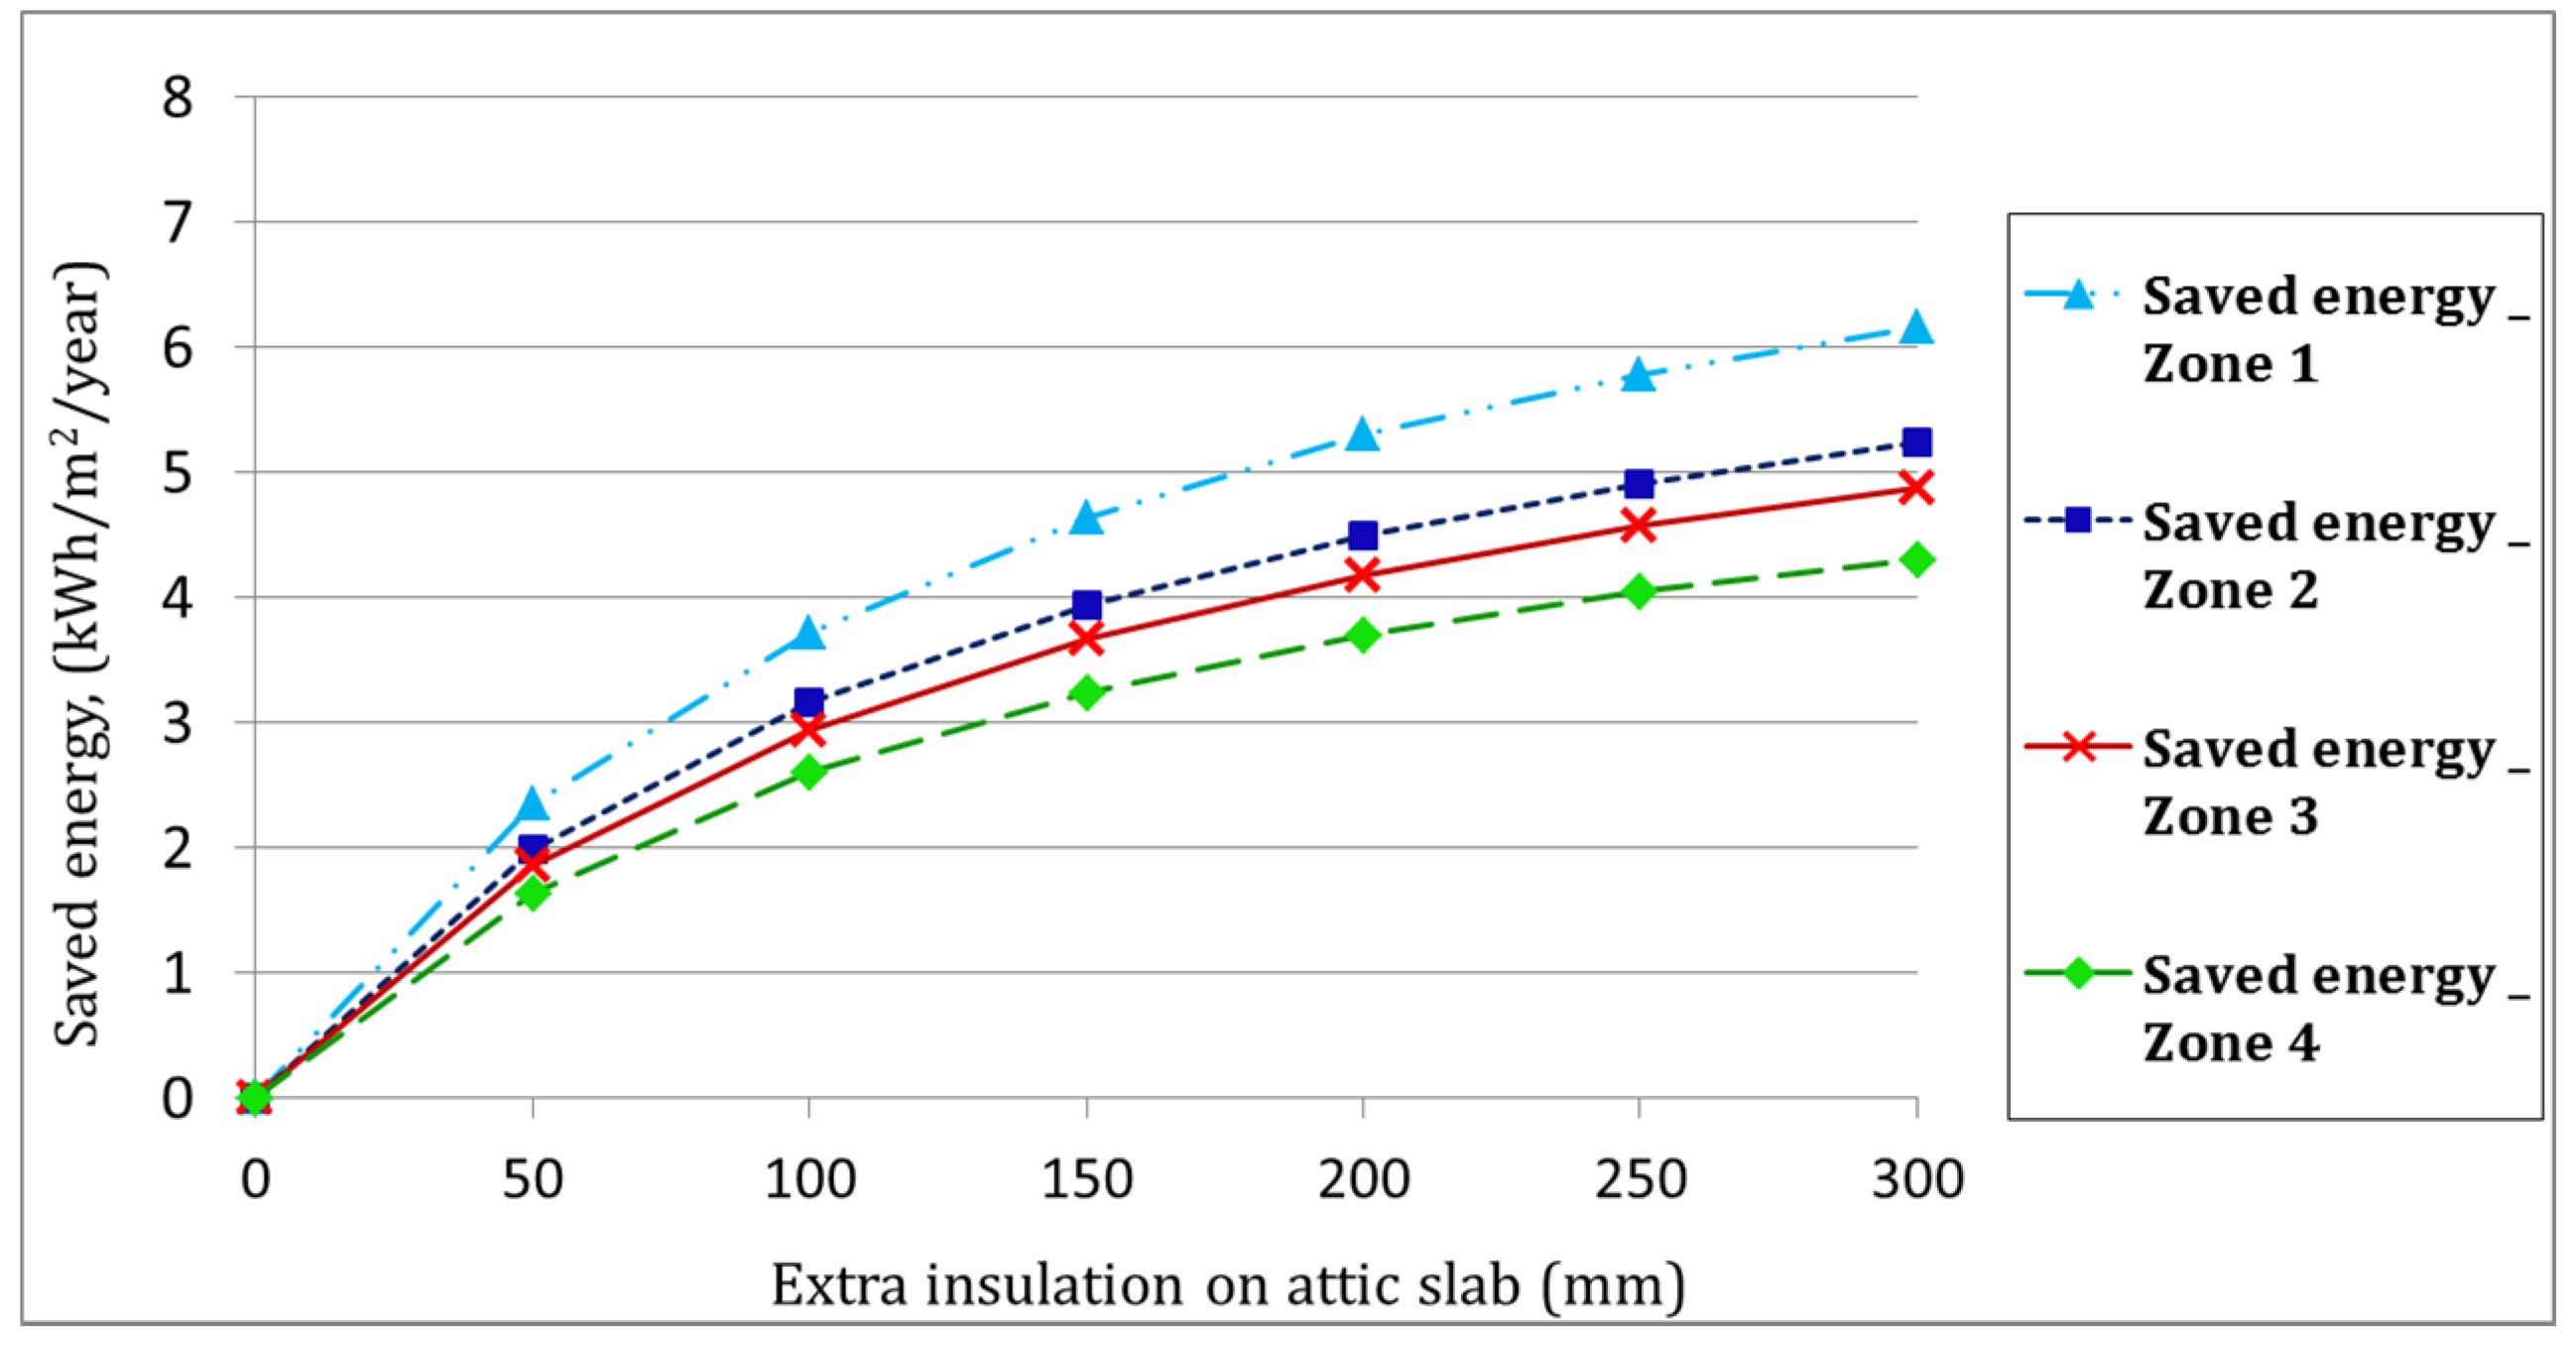
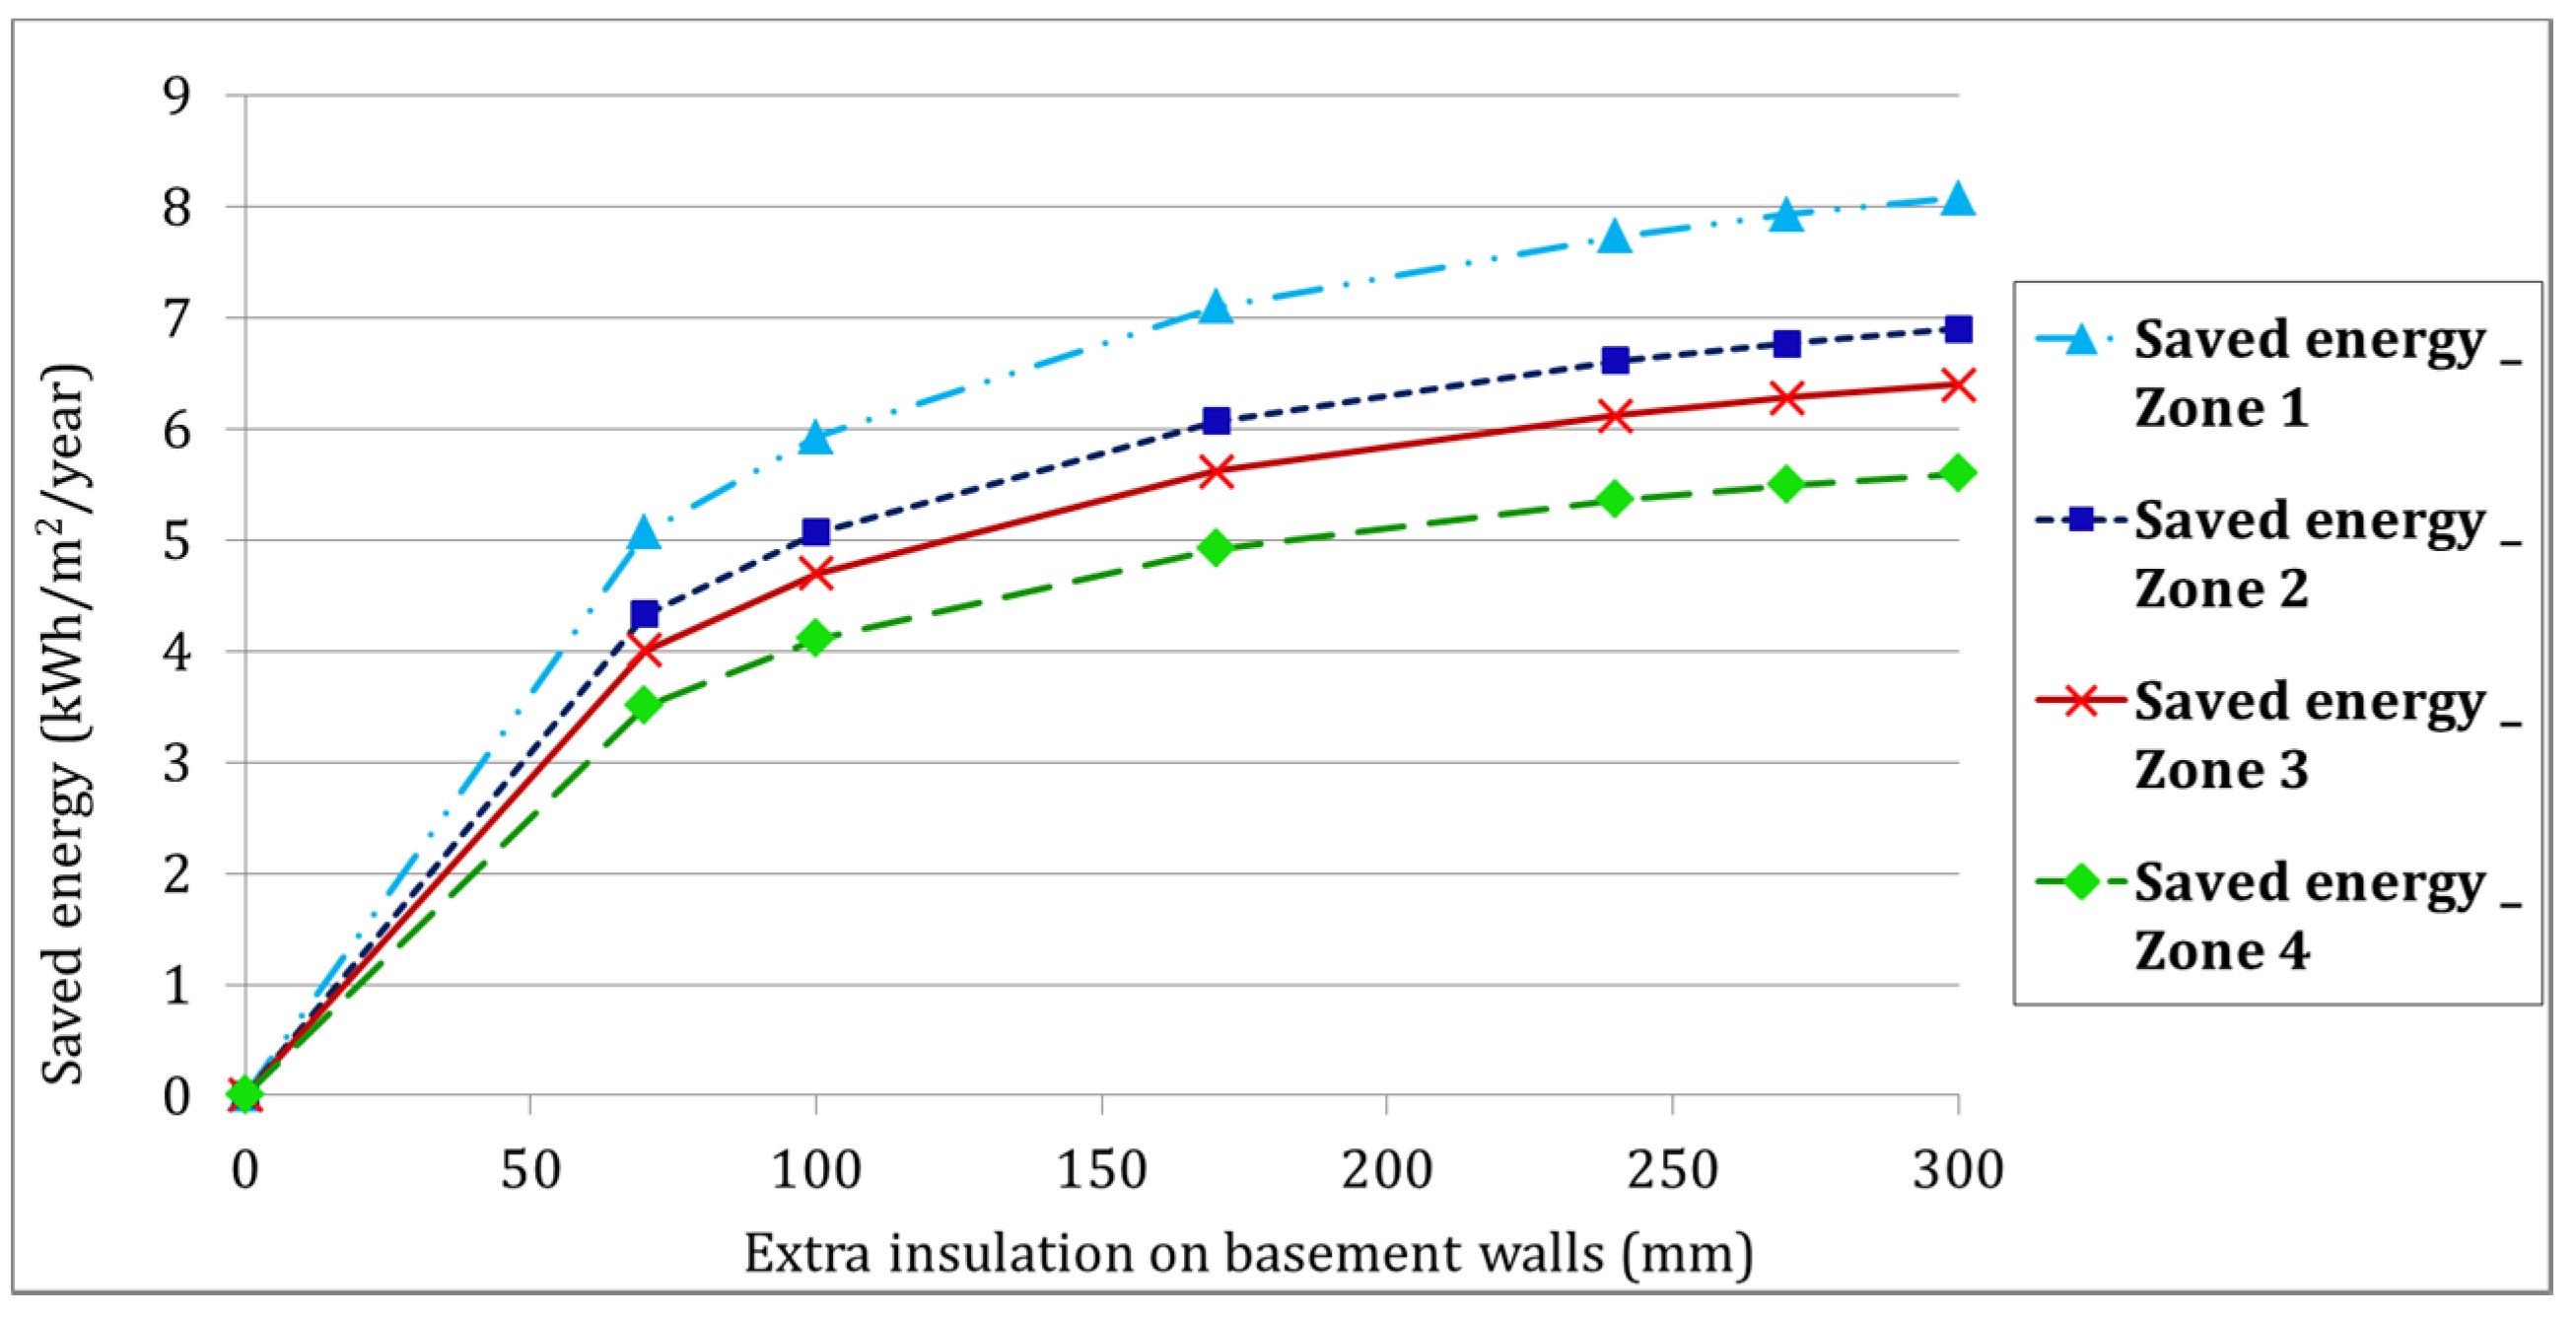
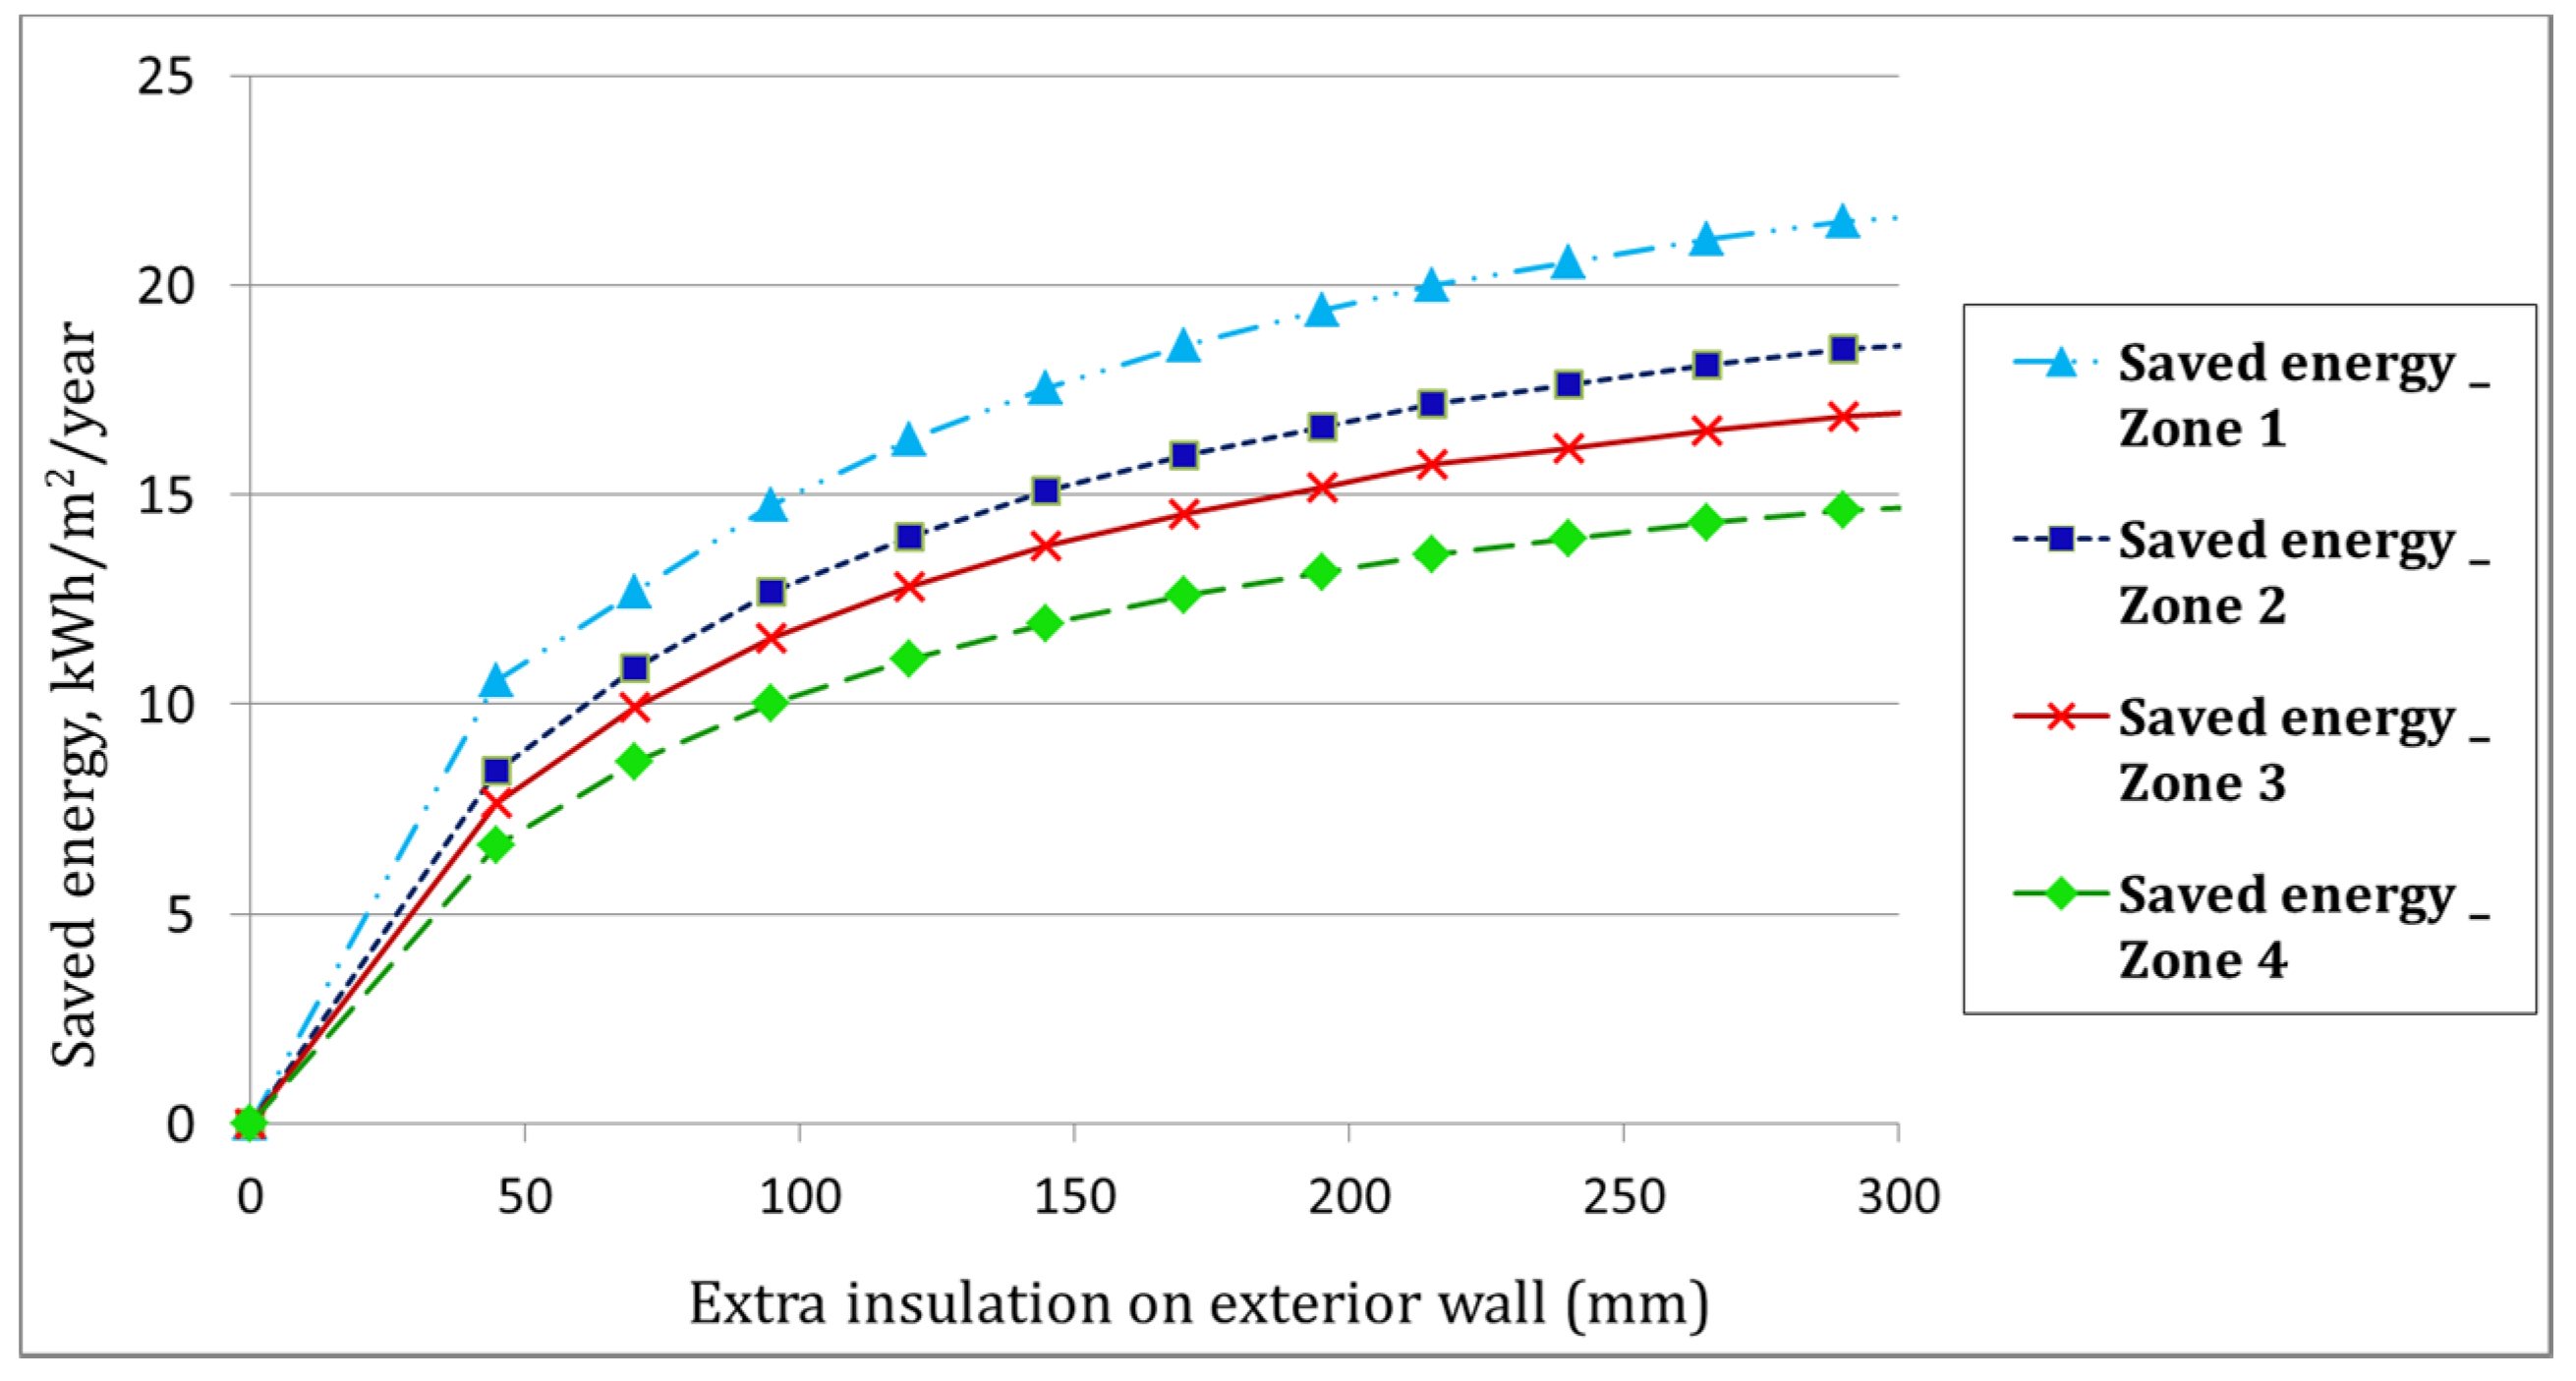
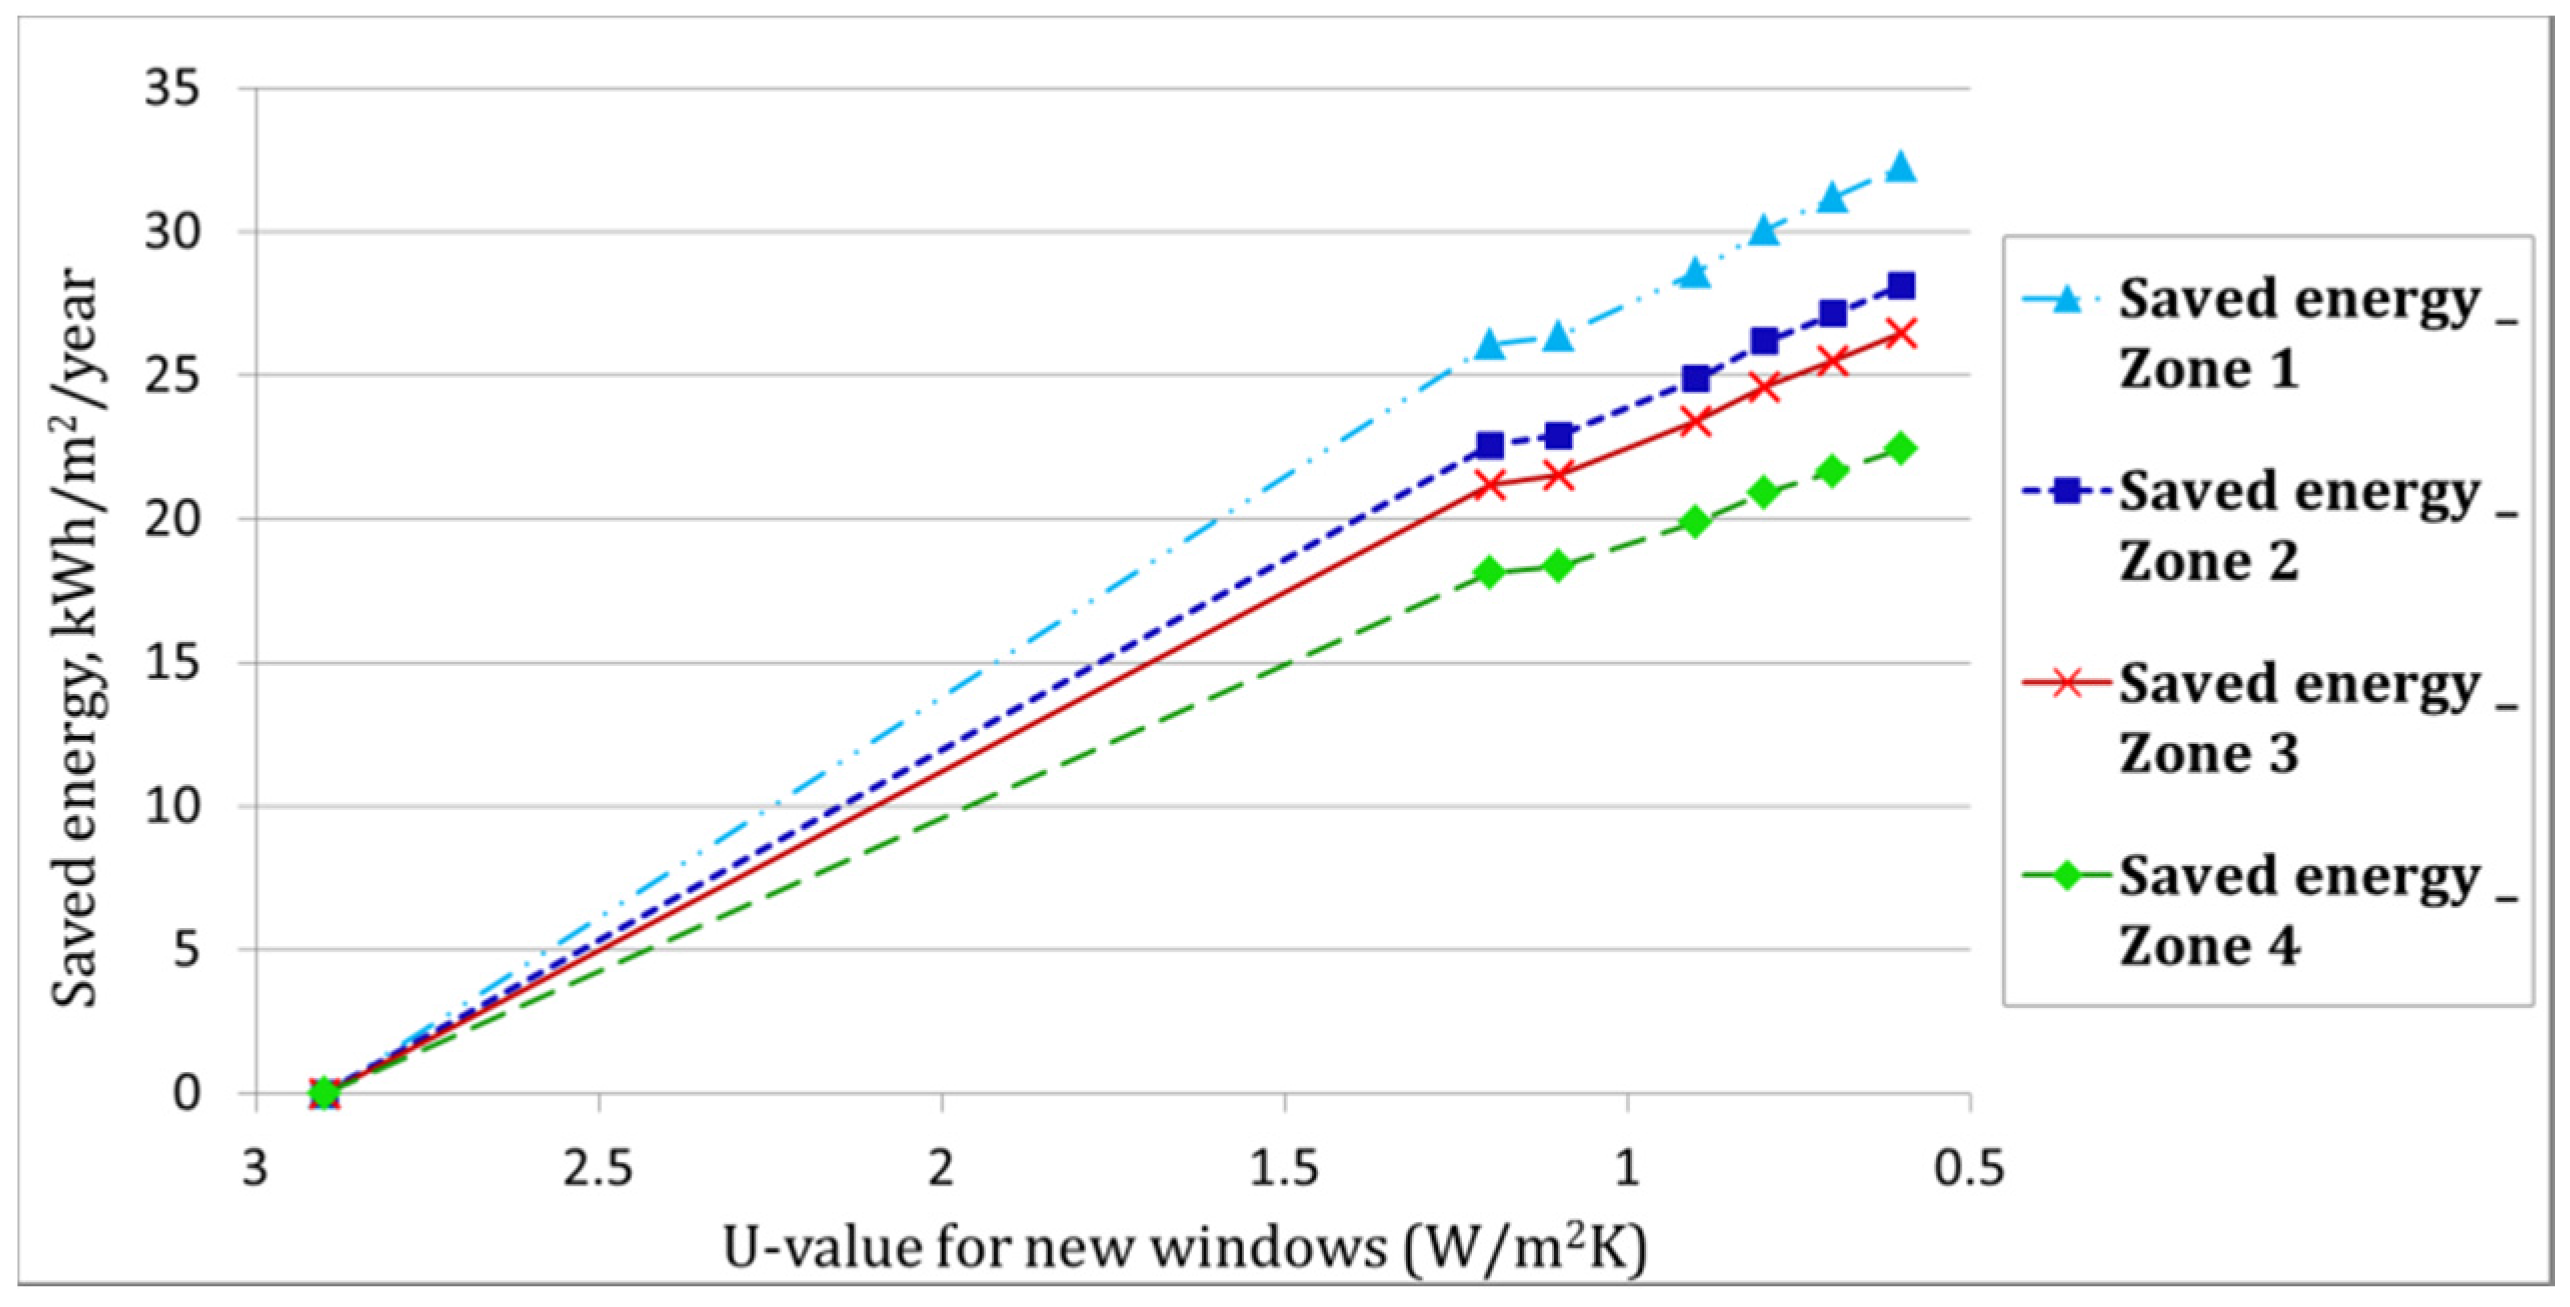
4.1. Reduced Heat Demand Due to Improving the Thermal Transmittance of Building Envelope

The trends of increasing the saved energy due to reducing the thermal transmittance of considered components are illustrated in Figure 7, Figure 8, Figure 9 and Figure 10, for the base case scenario (i.e., discount rate of 3%, energy price development of 2% and 50-year lifespan of the case study building).
In all four components (Figure 7, Figure 8, Figure 9 and Figure 10), the marginal saved energy for heat demand reduces as the thickness of additional insulation increases or the U-value of new windows reduces. If the results were to be interpreted from the mathematical perspective, it can be suggested that as the derivative of the curves (in Figure 7, Figure 8 and Figure 9) approaches zero, the probability of having the optimum thickness of additional insulation increases.

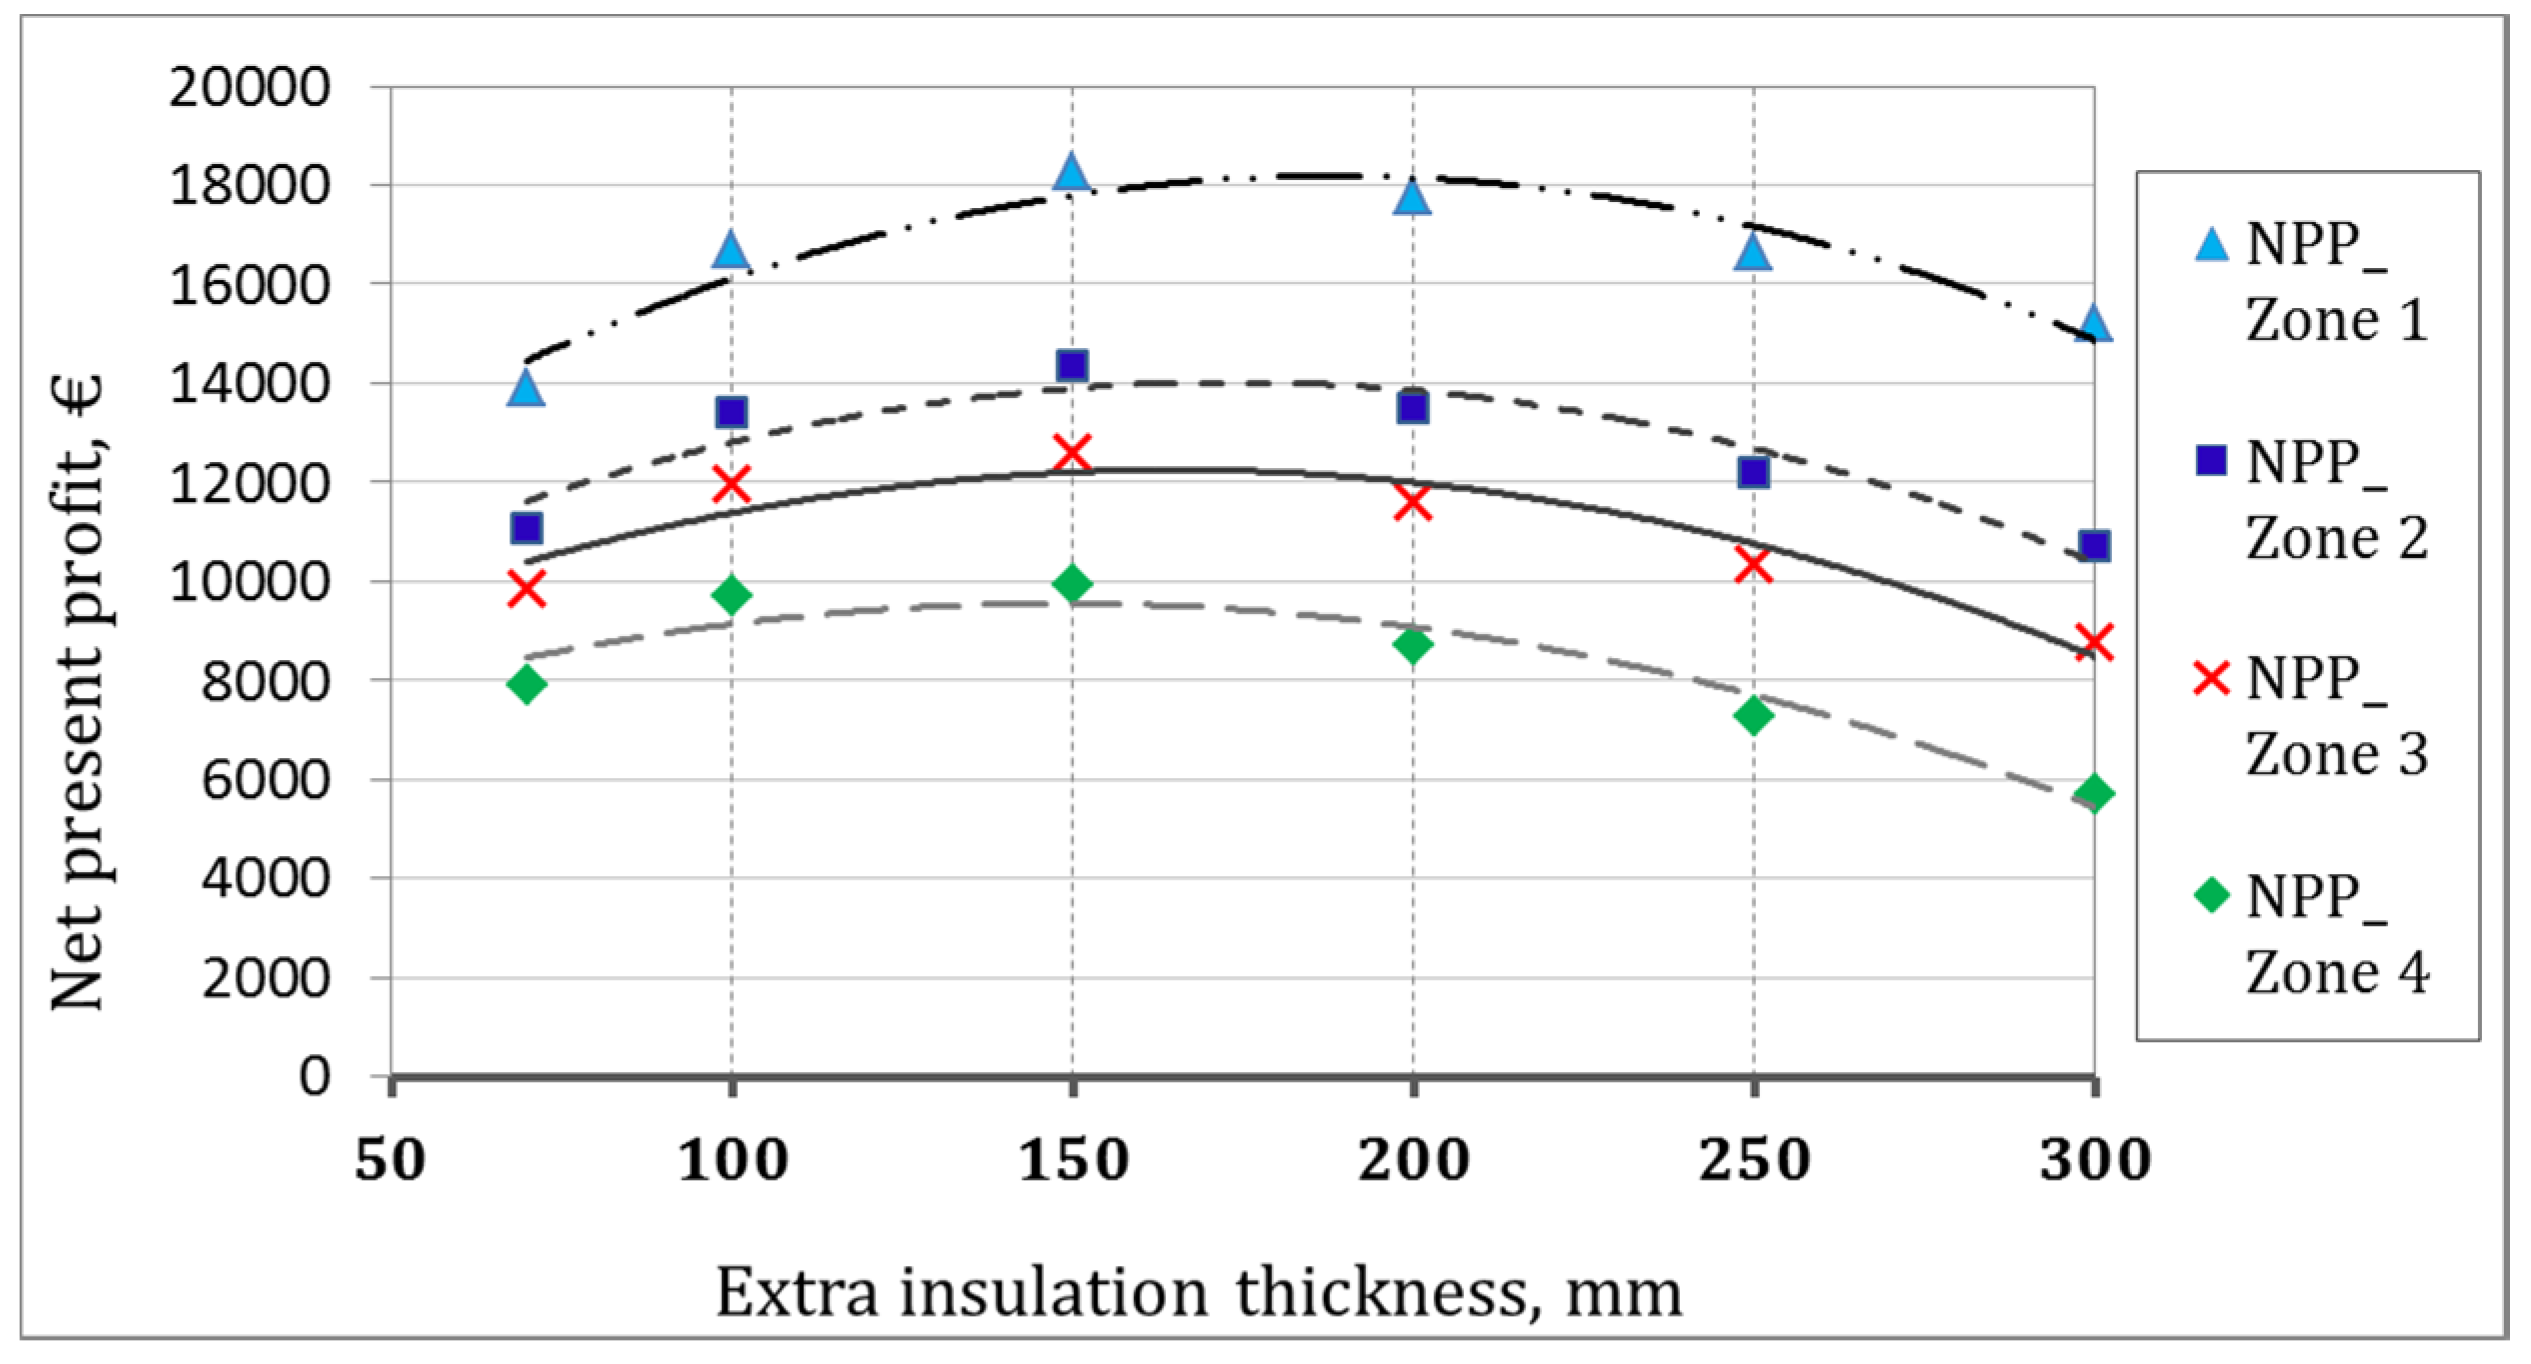
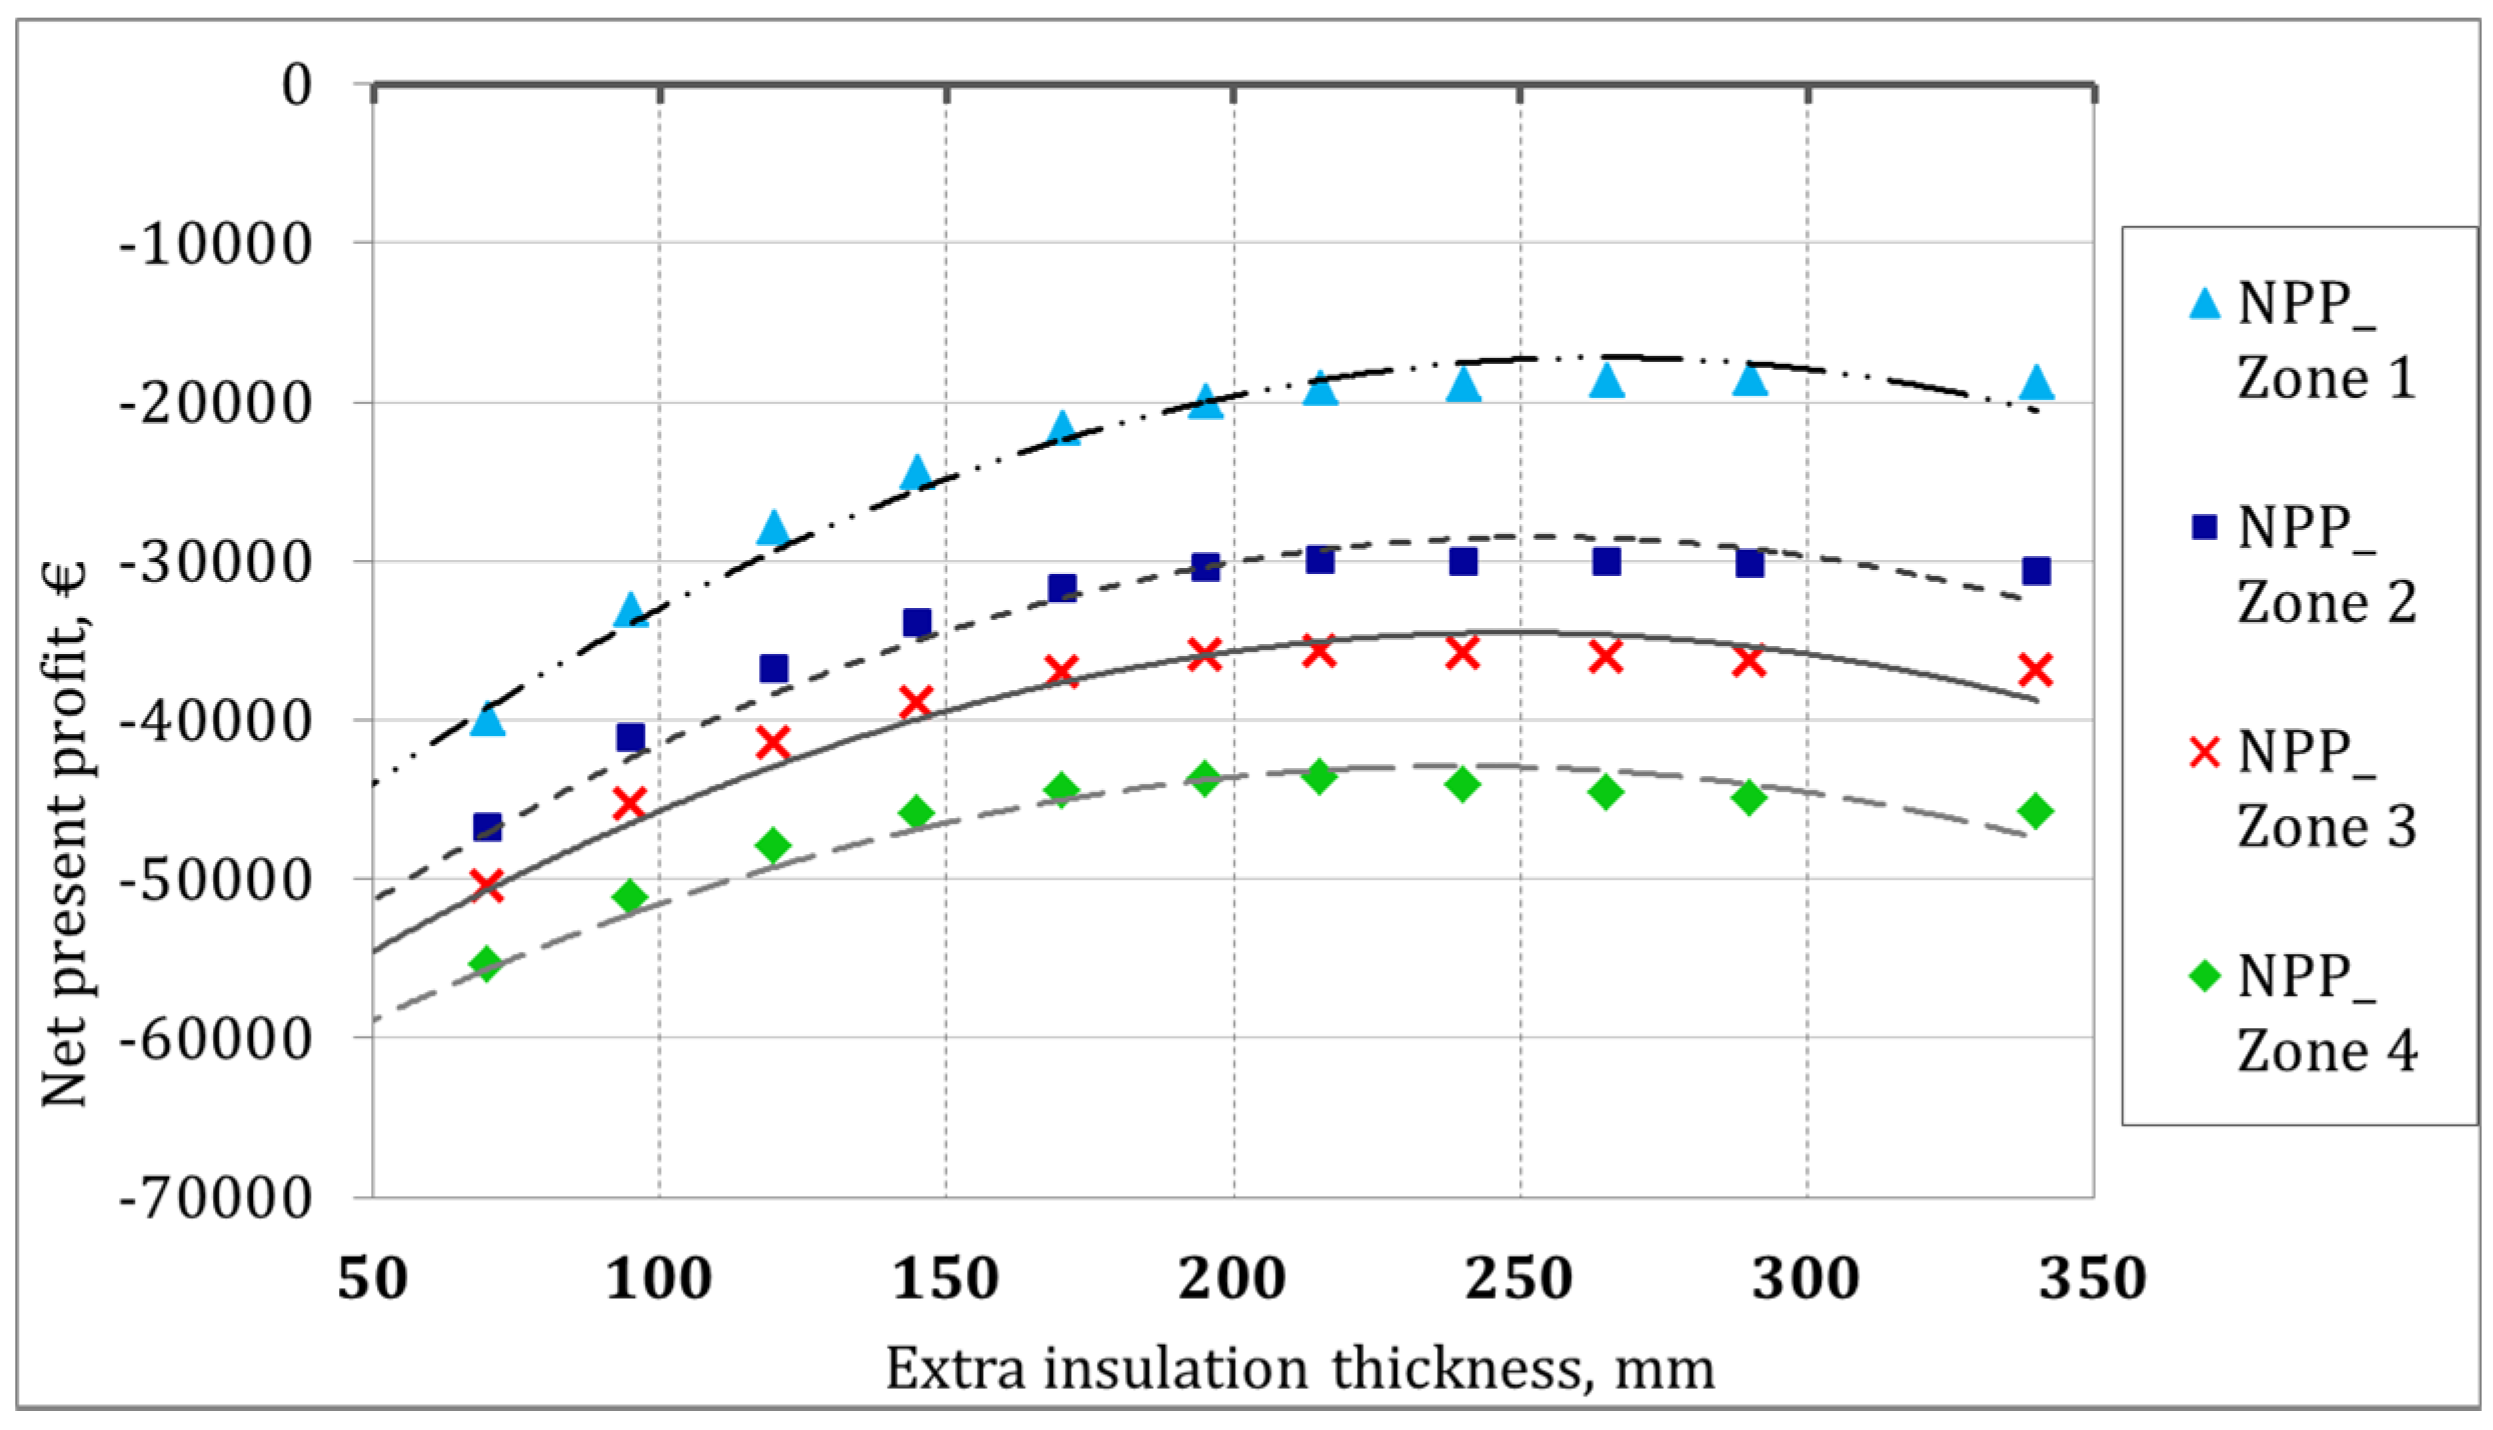
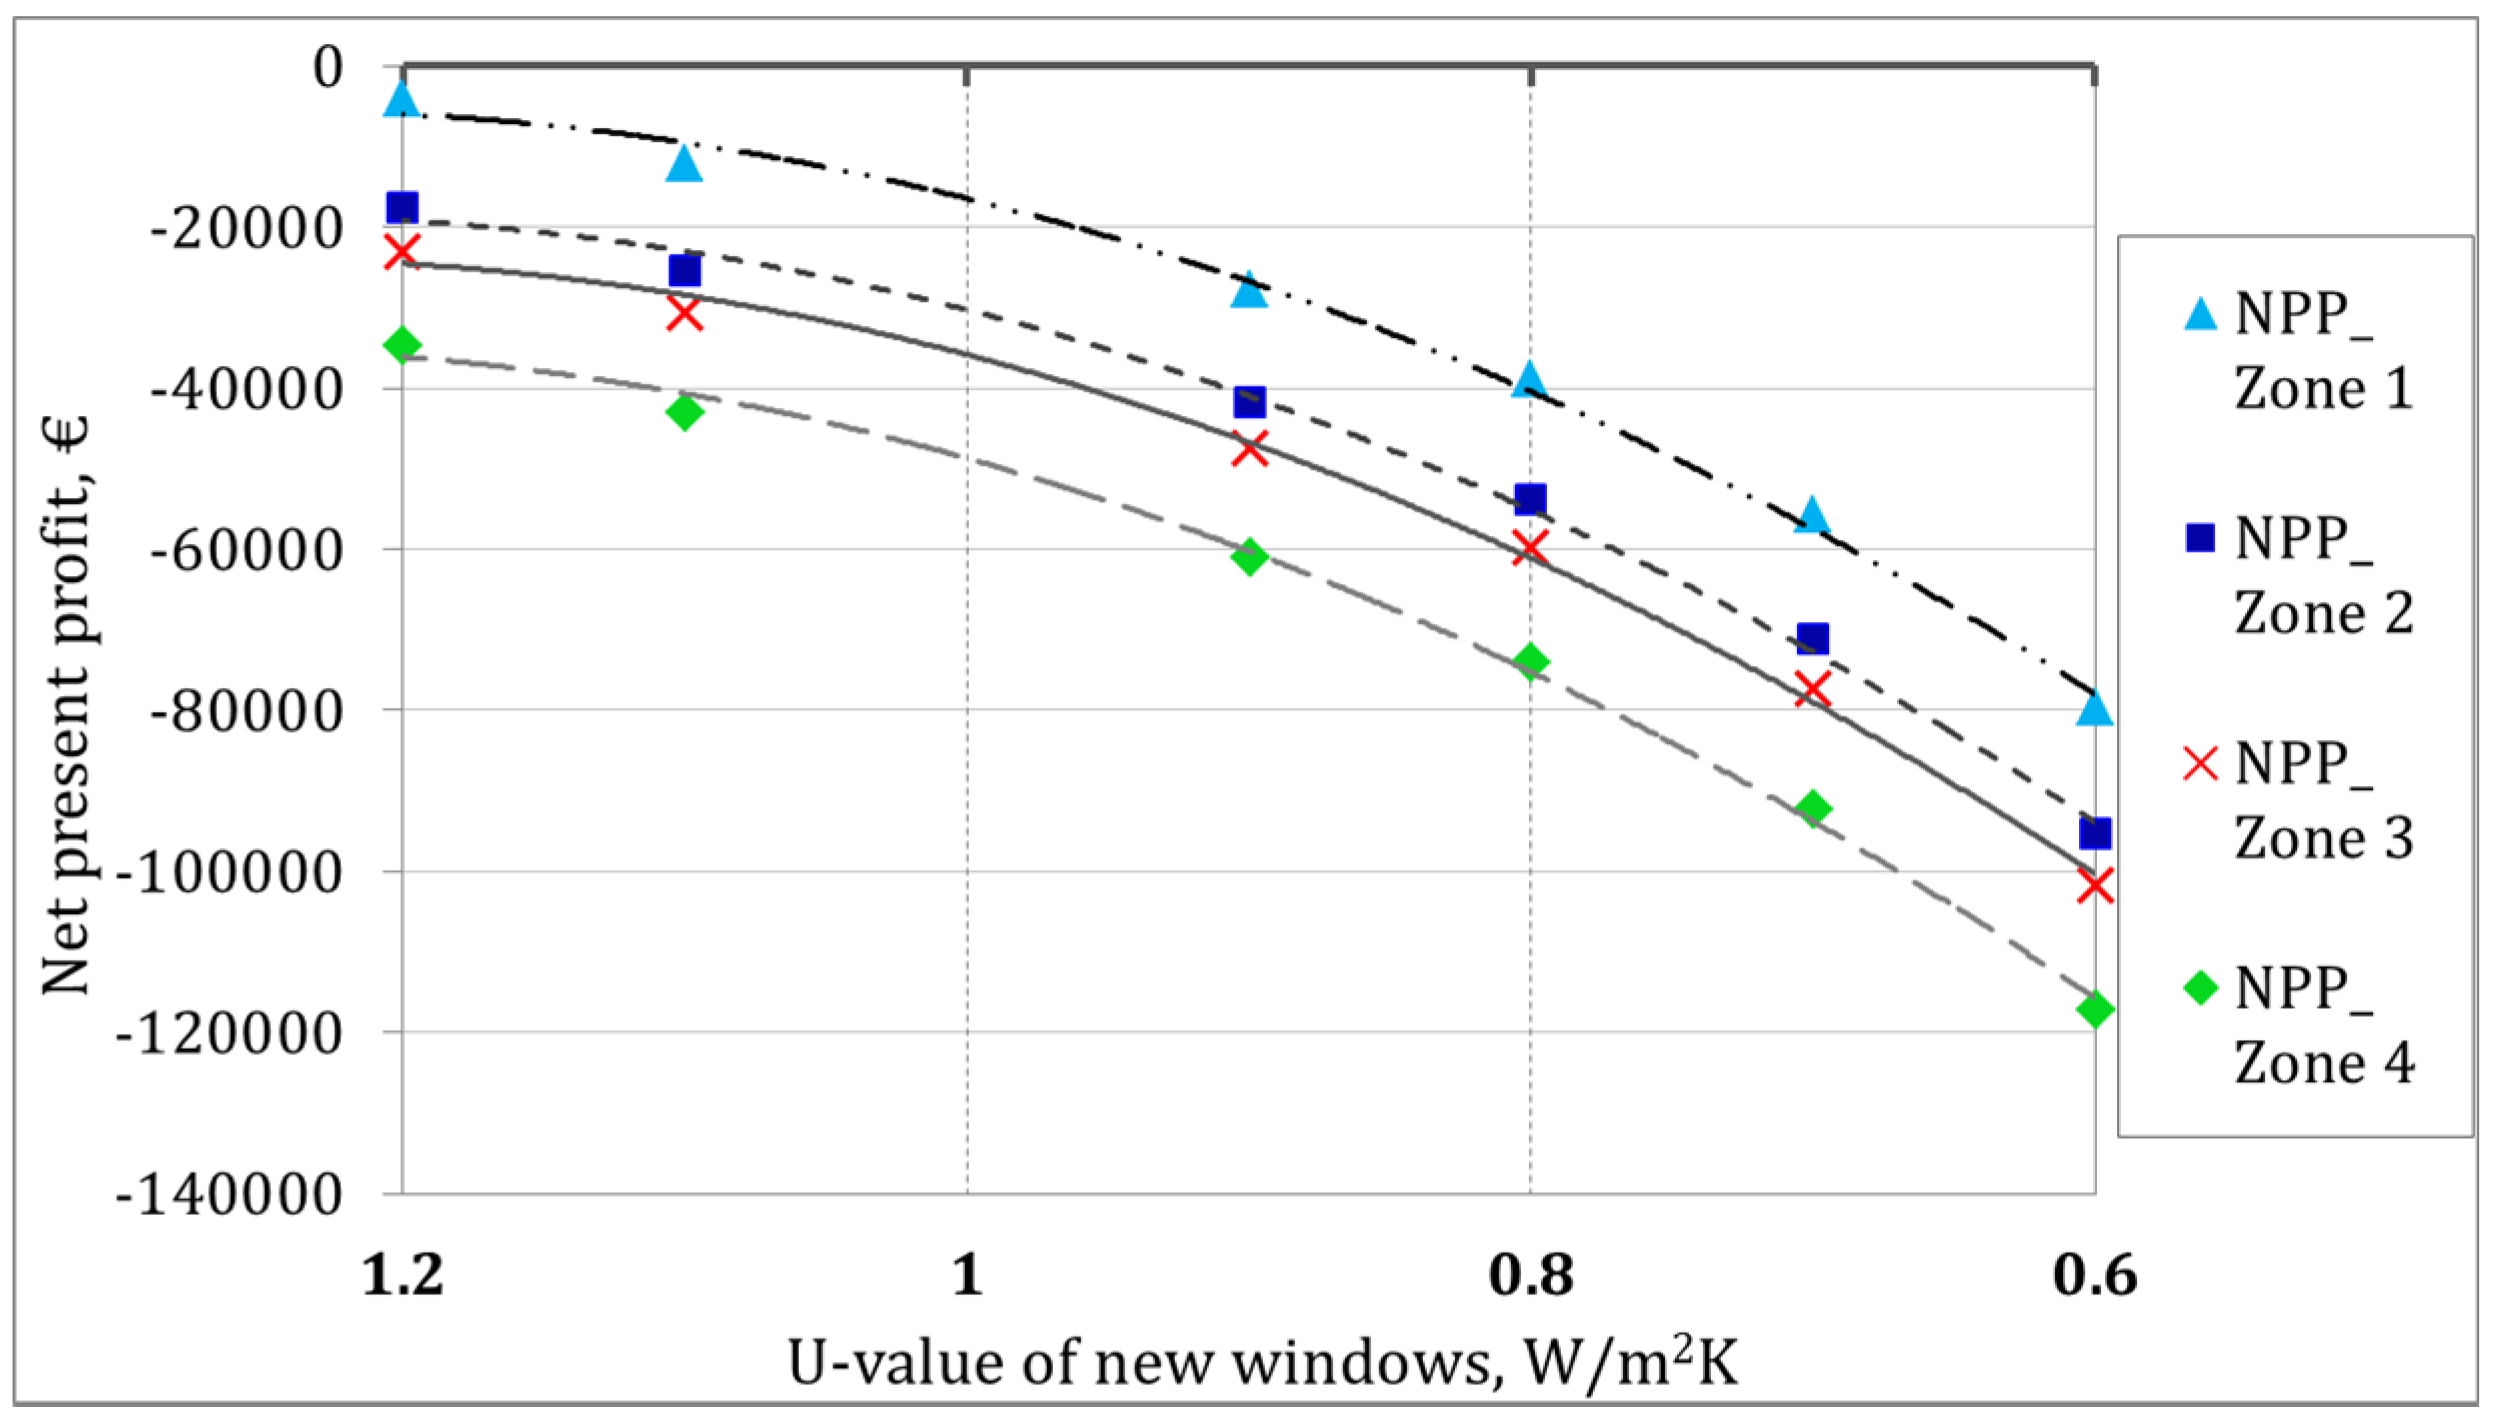
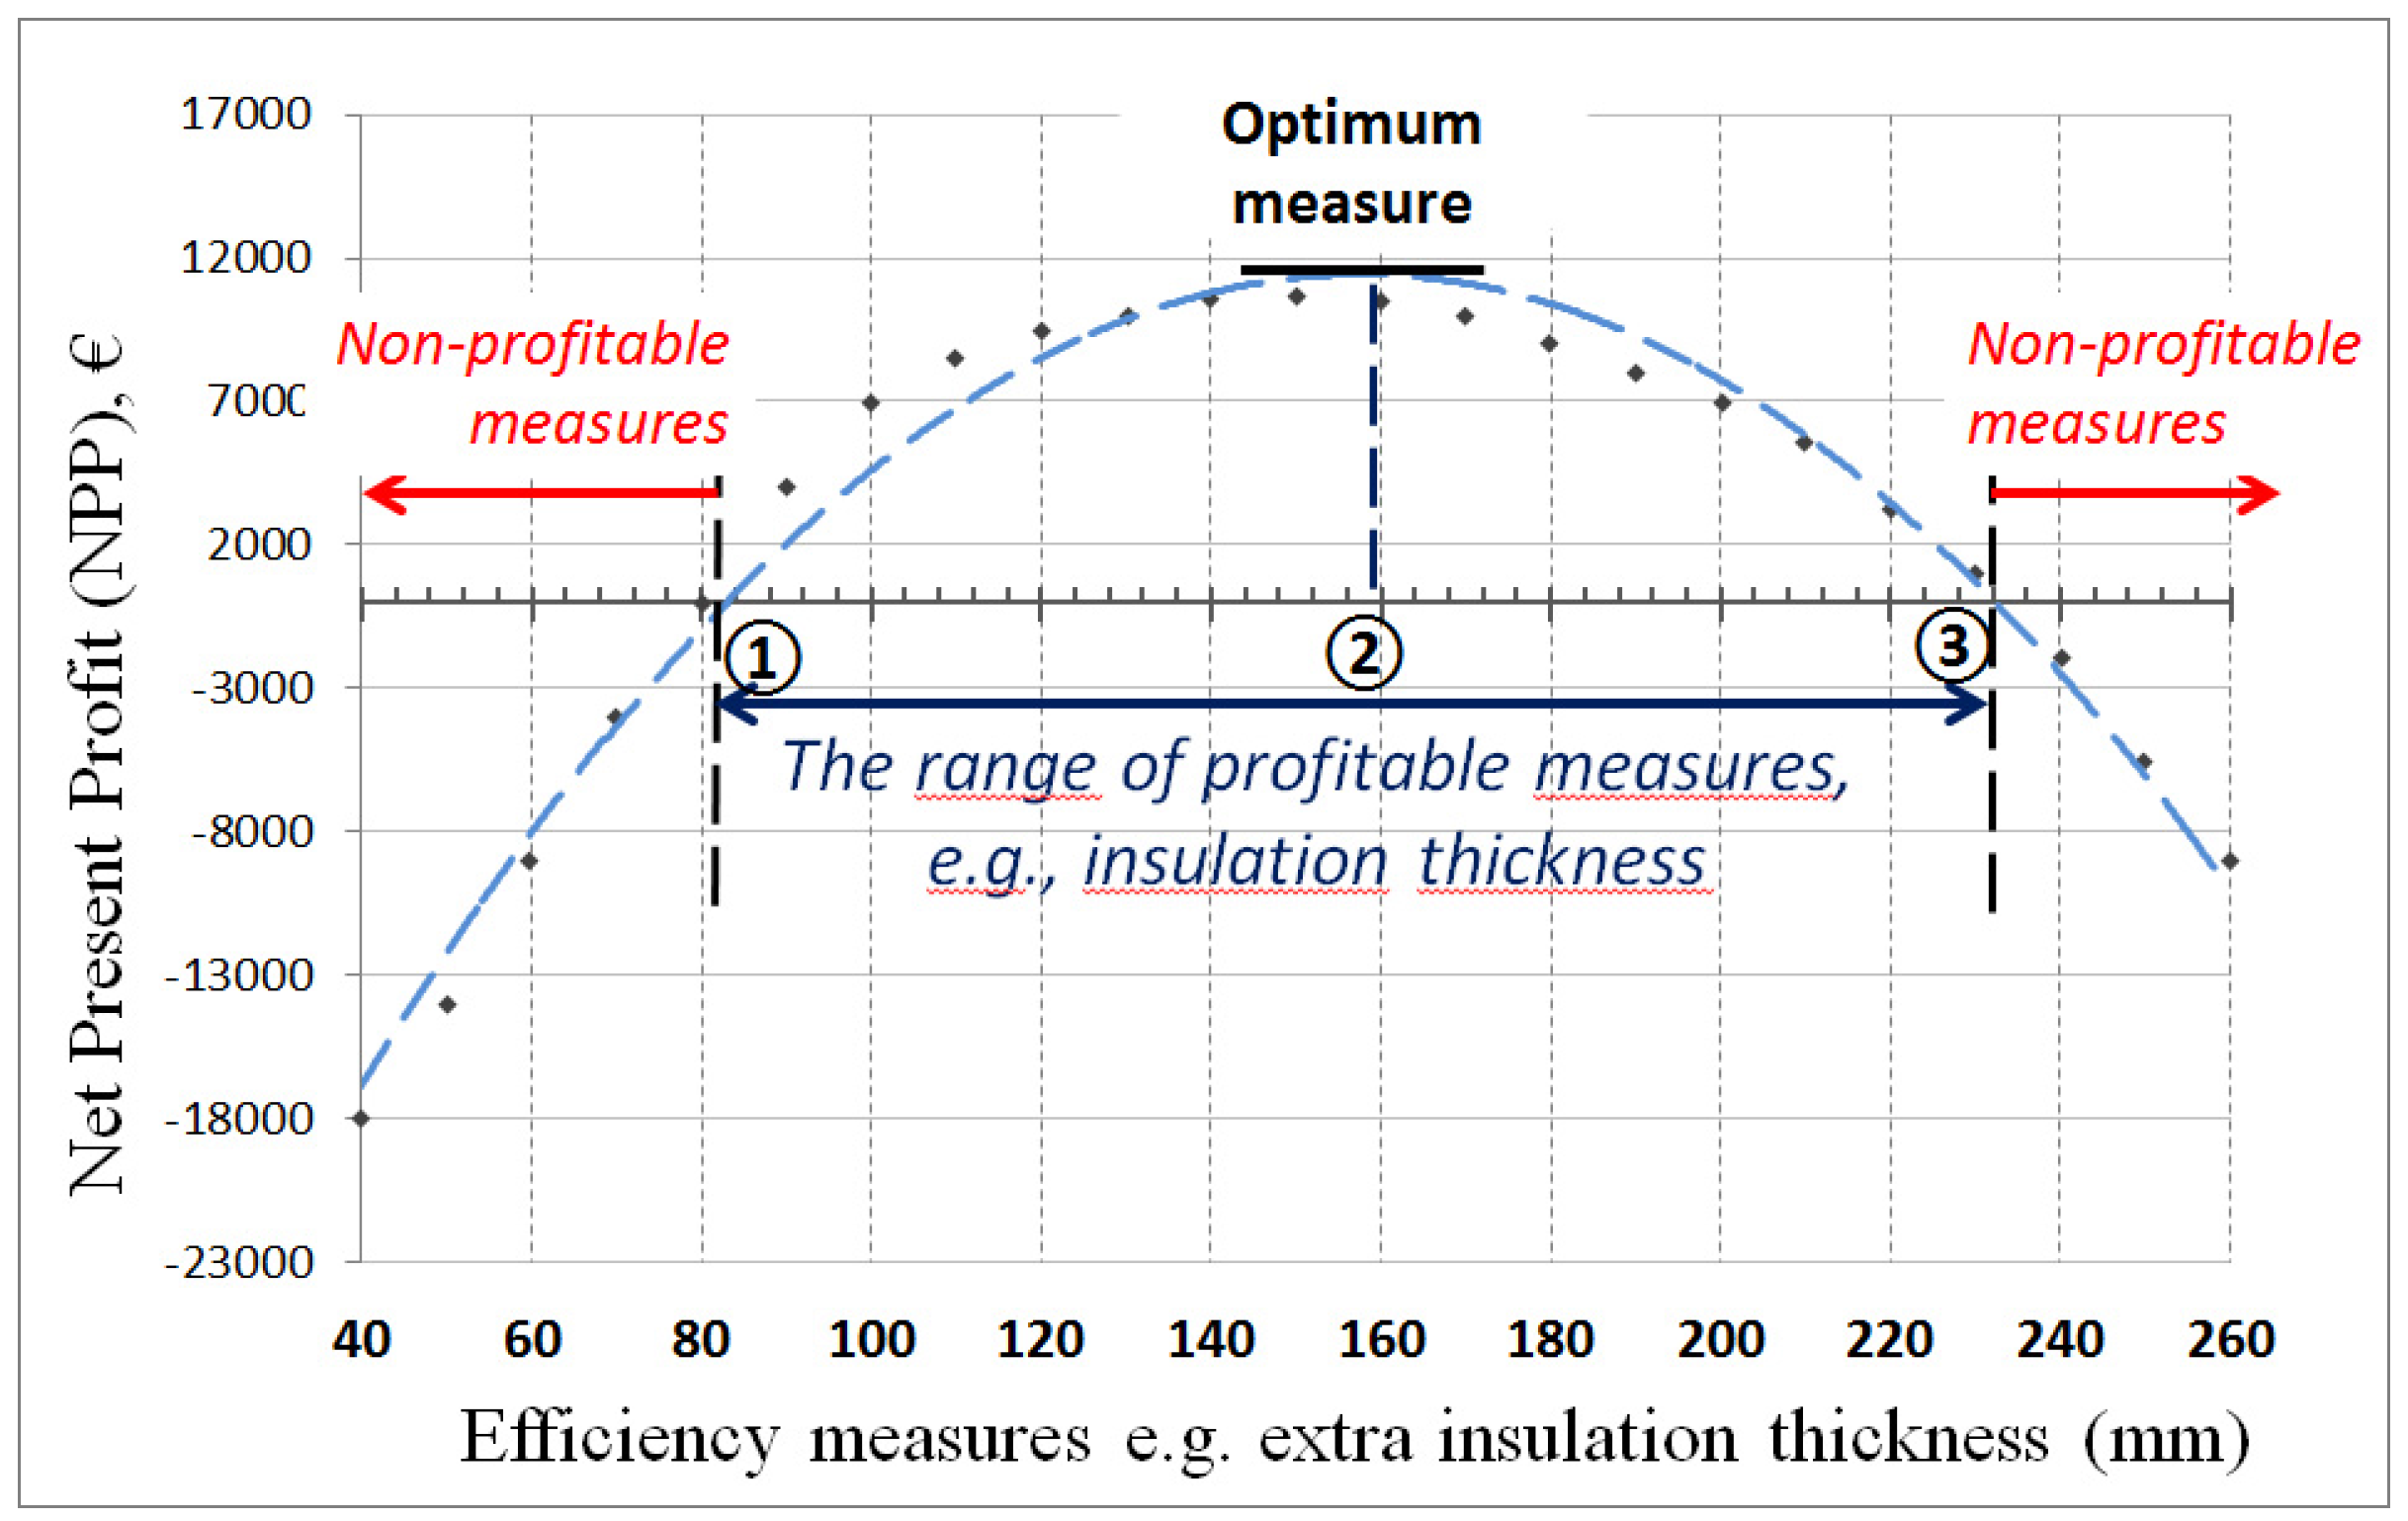
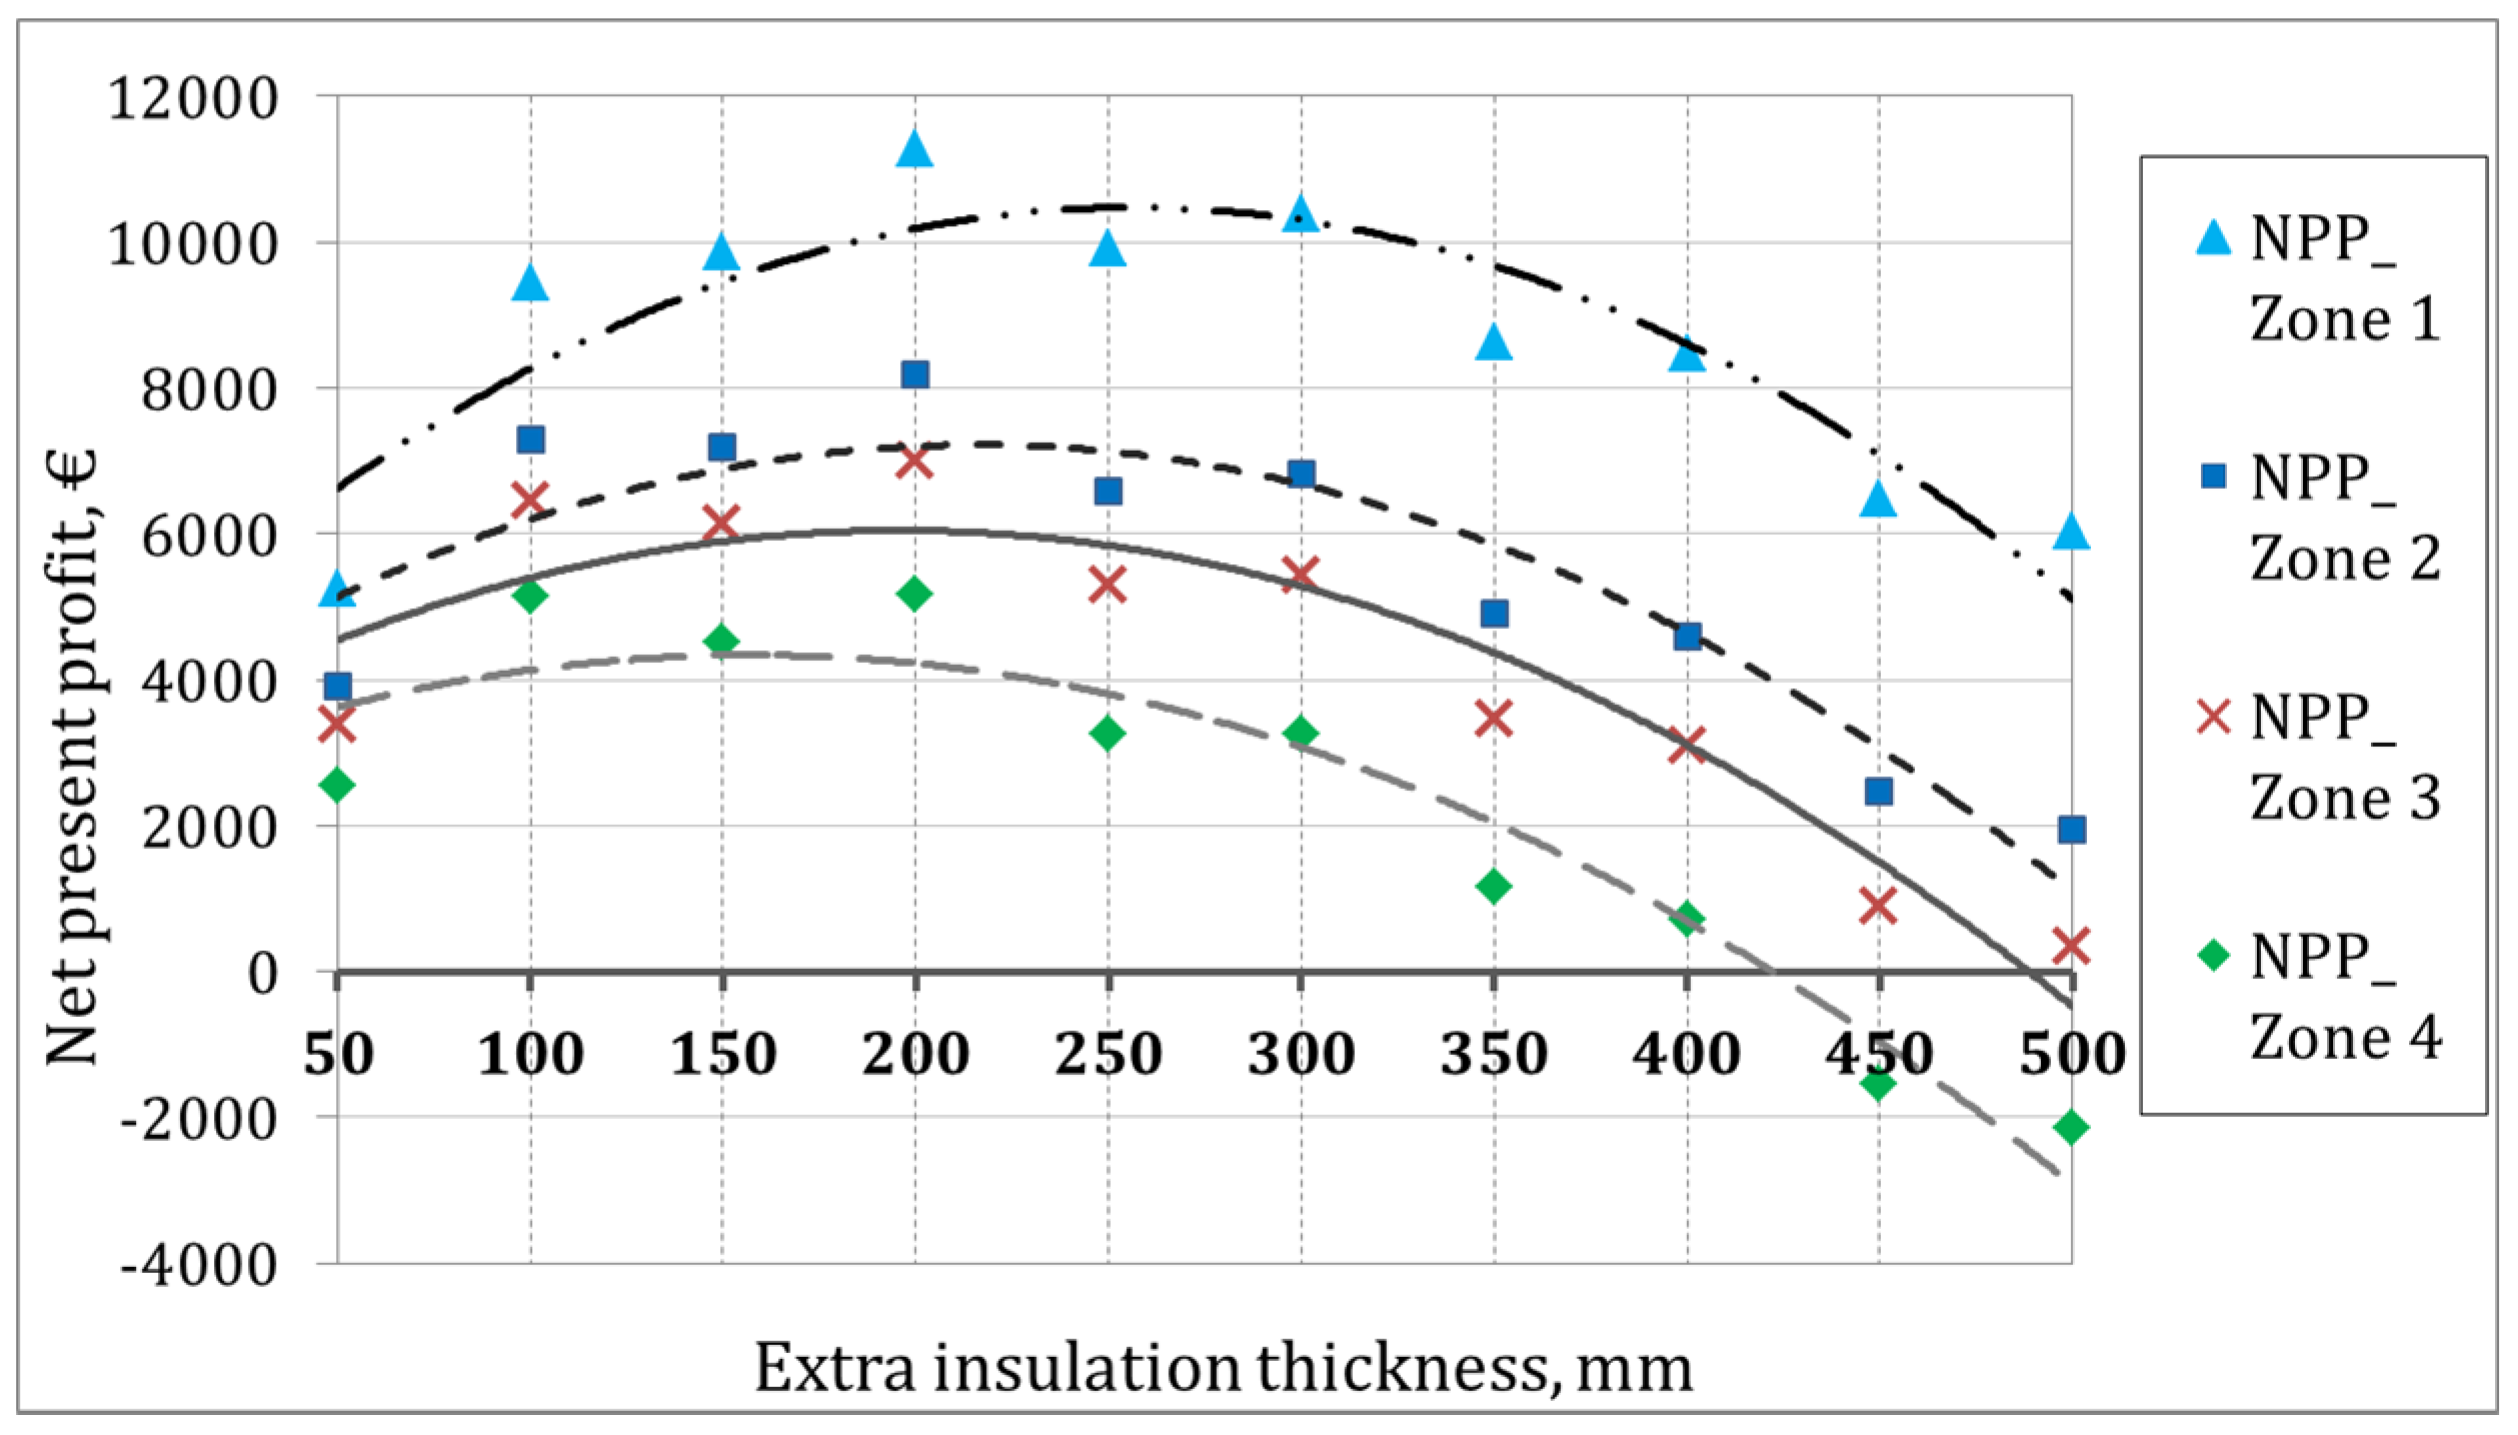
4.2. Optimum Measures

Figure 11, Figure 12, Figure 13 and Figure 14 illustrate the NPP trend lines for different thicknesses of extra insulation on opaque components and different U-values of new windows; in different climate zones; for the base case scenario (i.e., discount rate of 3%, energy price development of 2% and 50-year lifespan of the case study building).
The optimum level of renovation for the considered components of the building envelope in different climate zones can be suggested in Figure 11, Figure 12, Figure 13 and Figure 14. The highest point of these curves indicates the optimum thickness of additional insulation on opaque components or the optimum U-value of new windows. The optimum measures are extracted graphically from the curves. The price of different thicknesses for insulation materials, which is a significant parameter in NPP values, does neither follow a linear trend nor any other rational trend in the existing market of building materials. That is the reason for considering fitted curves for NPP values for different thicknesses of insulation materials and different U-values of new windows.
Considering the existing uncertainty due to a large variety of the materials’ price in the market, we chose one value rather than a band of the thicknesses in order to avoid disorienting from the main target of the study, i.e., analyzing the implication of different climate zones on the cost-optimal level and the cost-effectiveness of envelope renovation.
The results suggest that the optimum thickness of additional insulation on the attic floor, basement walls and exterior walls increases by about 25%, 19% and 18%, respectively, when the building is located in Zone 1, compared to Zone 4. All of the optimum thicknesses of additional insulation on the attic floor and basement wall appear to be cost-effective, for the base case scenario, whilst the optimum thickness of insulation on exterior walls and optimum U-values for new windows are not cost-effective for the same scenario.

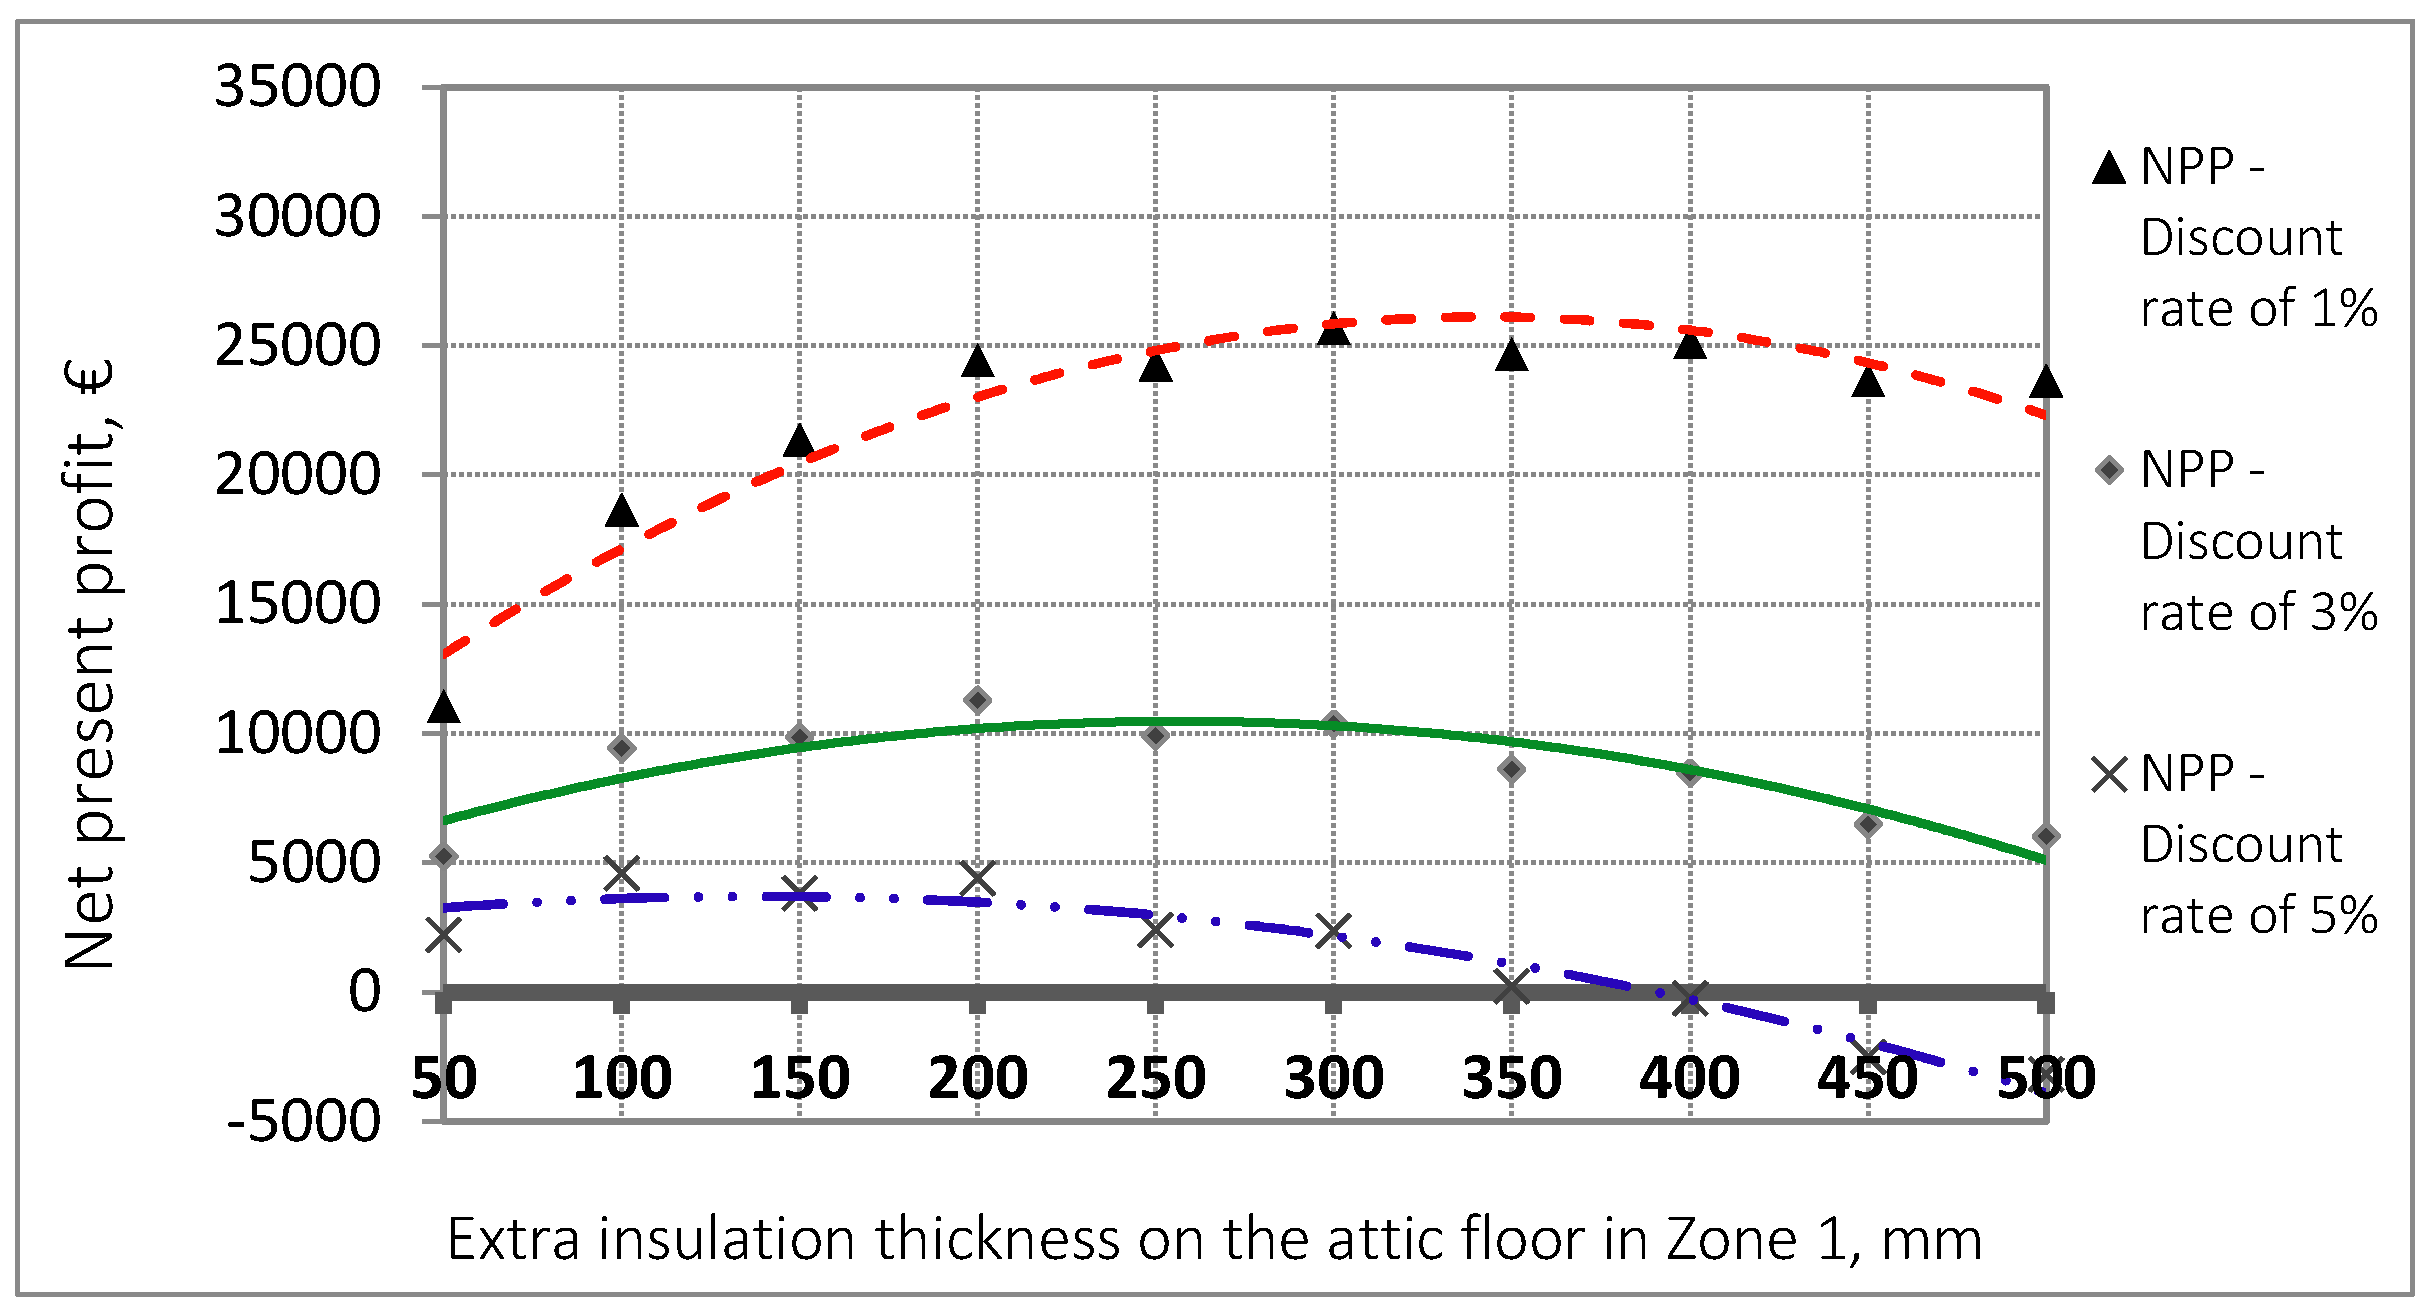
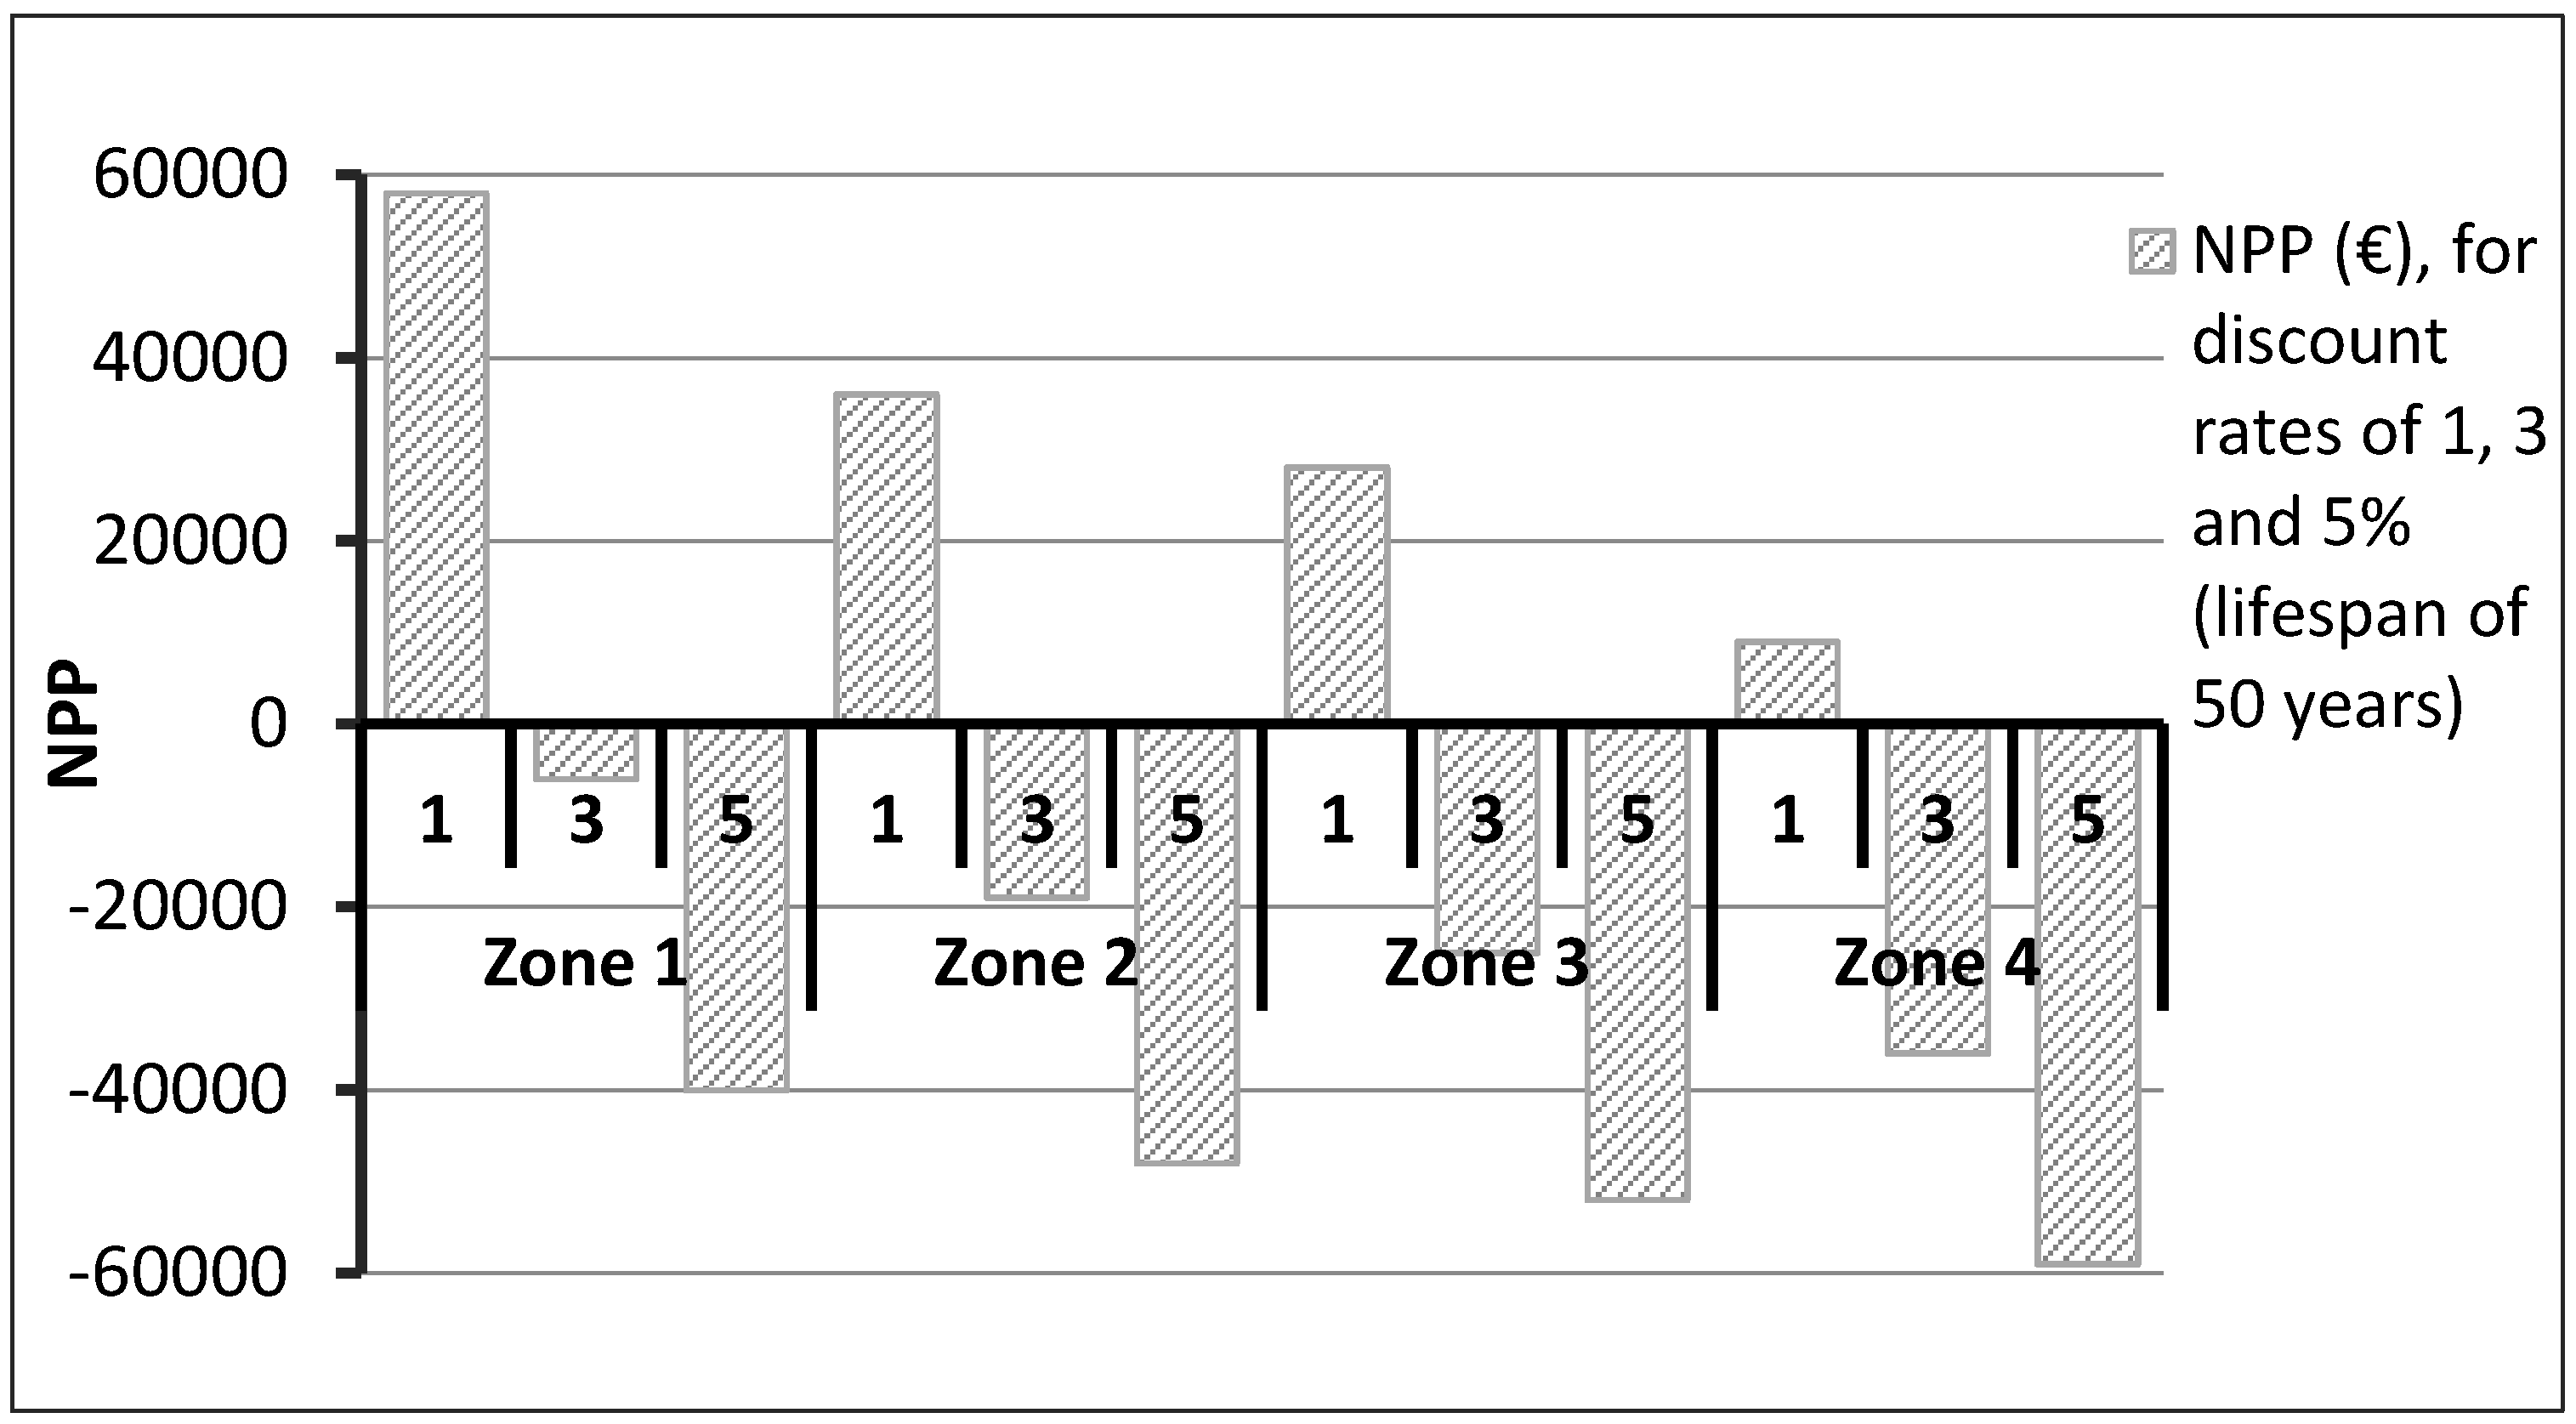
4.3. Discount Rate Contribution to Optimum Measures

The discount rate is a principal factor to assess the costs and long-term profits in different policy scenarios. The EU member states are urged to do the sensitivity analysis, when calculating the buildings energy performance, considering at least two different discount rates [61]. The discount rate may significantly vary due to several reasons, e.g., investment lifespan, which is an uncertain parameter and very sensitive to the building sector characteristics.
Therefore, we performed a sensitivity analysis in order to study the implication of the discount rate on the optimum measures of building envelope renovation in different climate zones. Figure 15 illustrates the results of this analysis for different thicknesses of additional insulation on attic floor in climate Zone 1, considering a 50-year lifespan and 2% annual energy price development.
The results of Figure 15 indicate a considerable increase in the optimum thickness of additional insulation on attic floor as the discount rate reduces. It shows a 67% and 40% increase in optimum thickness, when the discount rate reduces from 5 down to 3% and from 3 down to 1%, respectively. The net present profit is, significantly, increased (i.e., about 400%), when the discount rate reduces from 5% down to 1%. We performed the same exercise for other components in all four zones. Table 8 presents the results of these exercises.

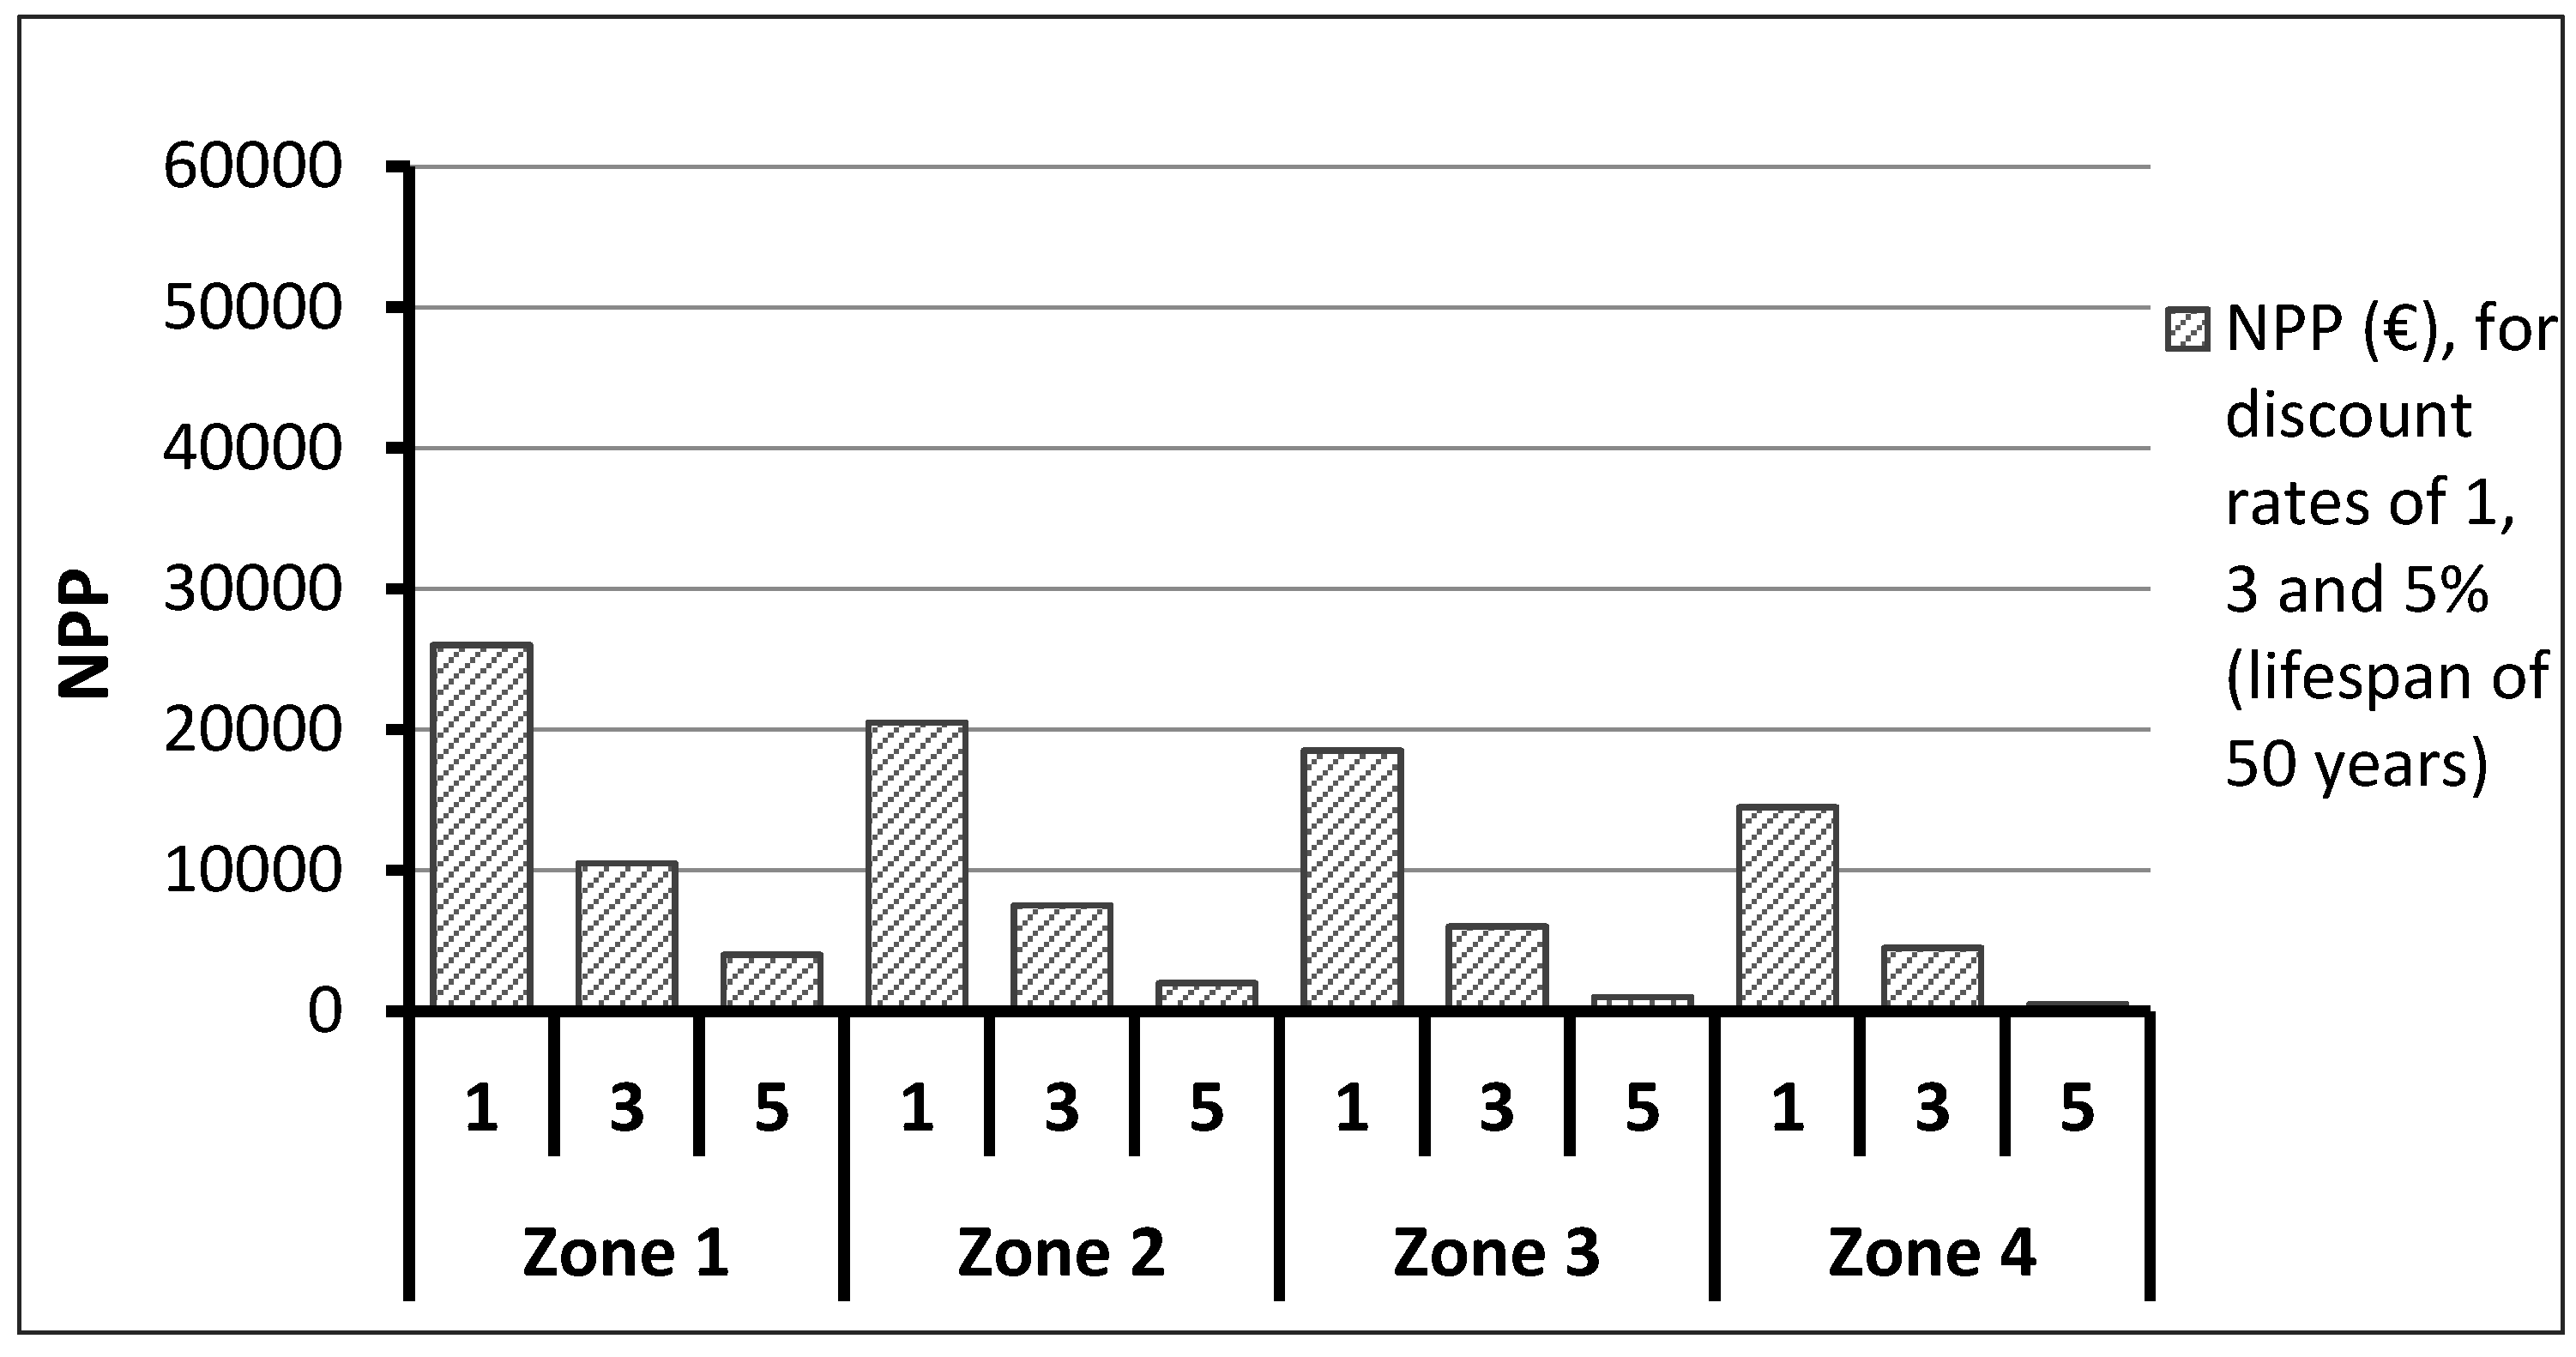
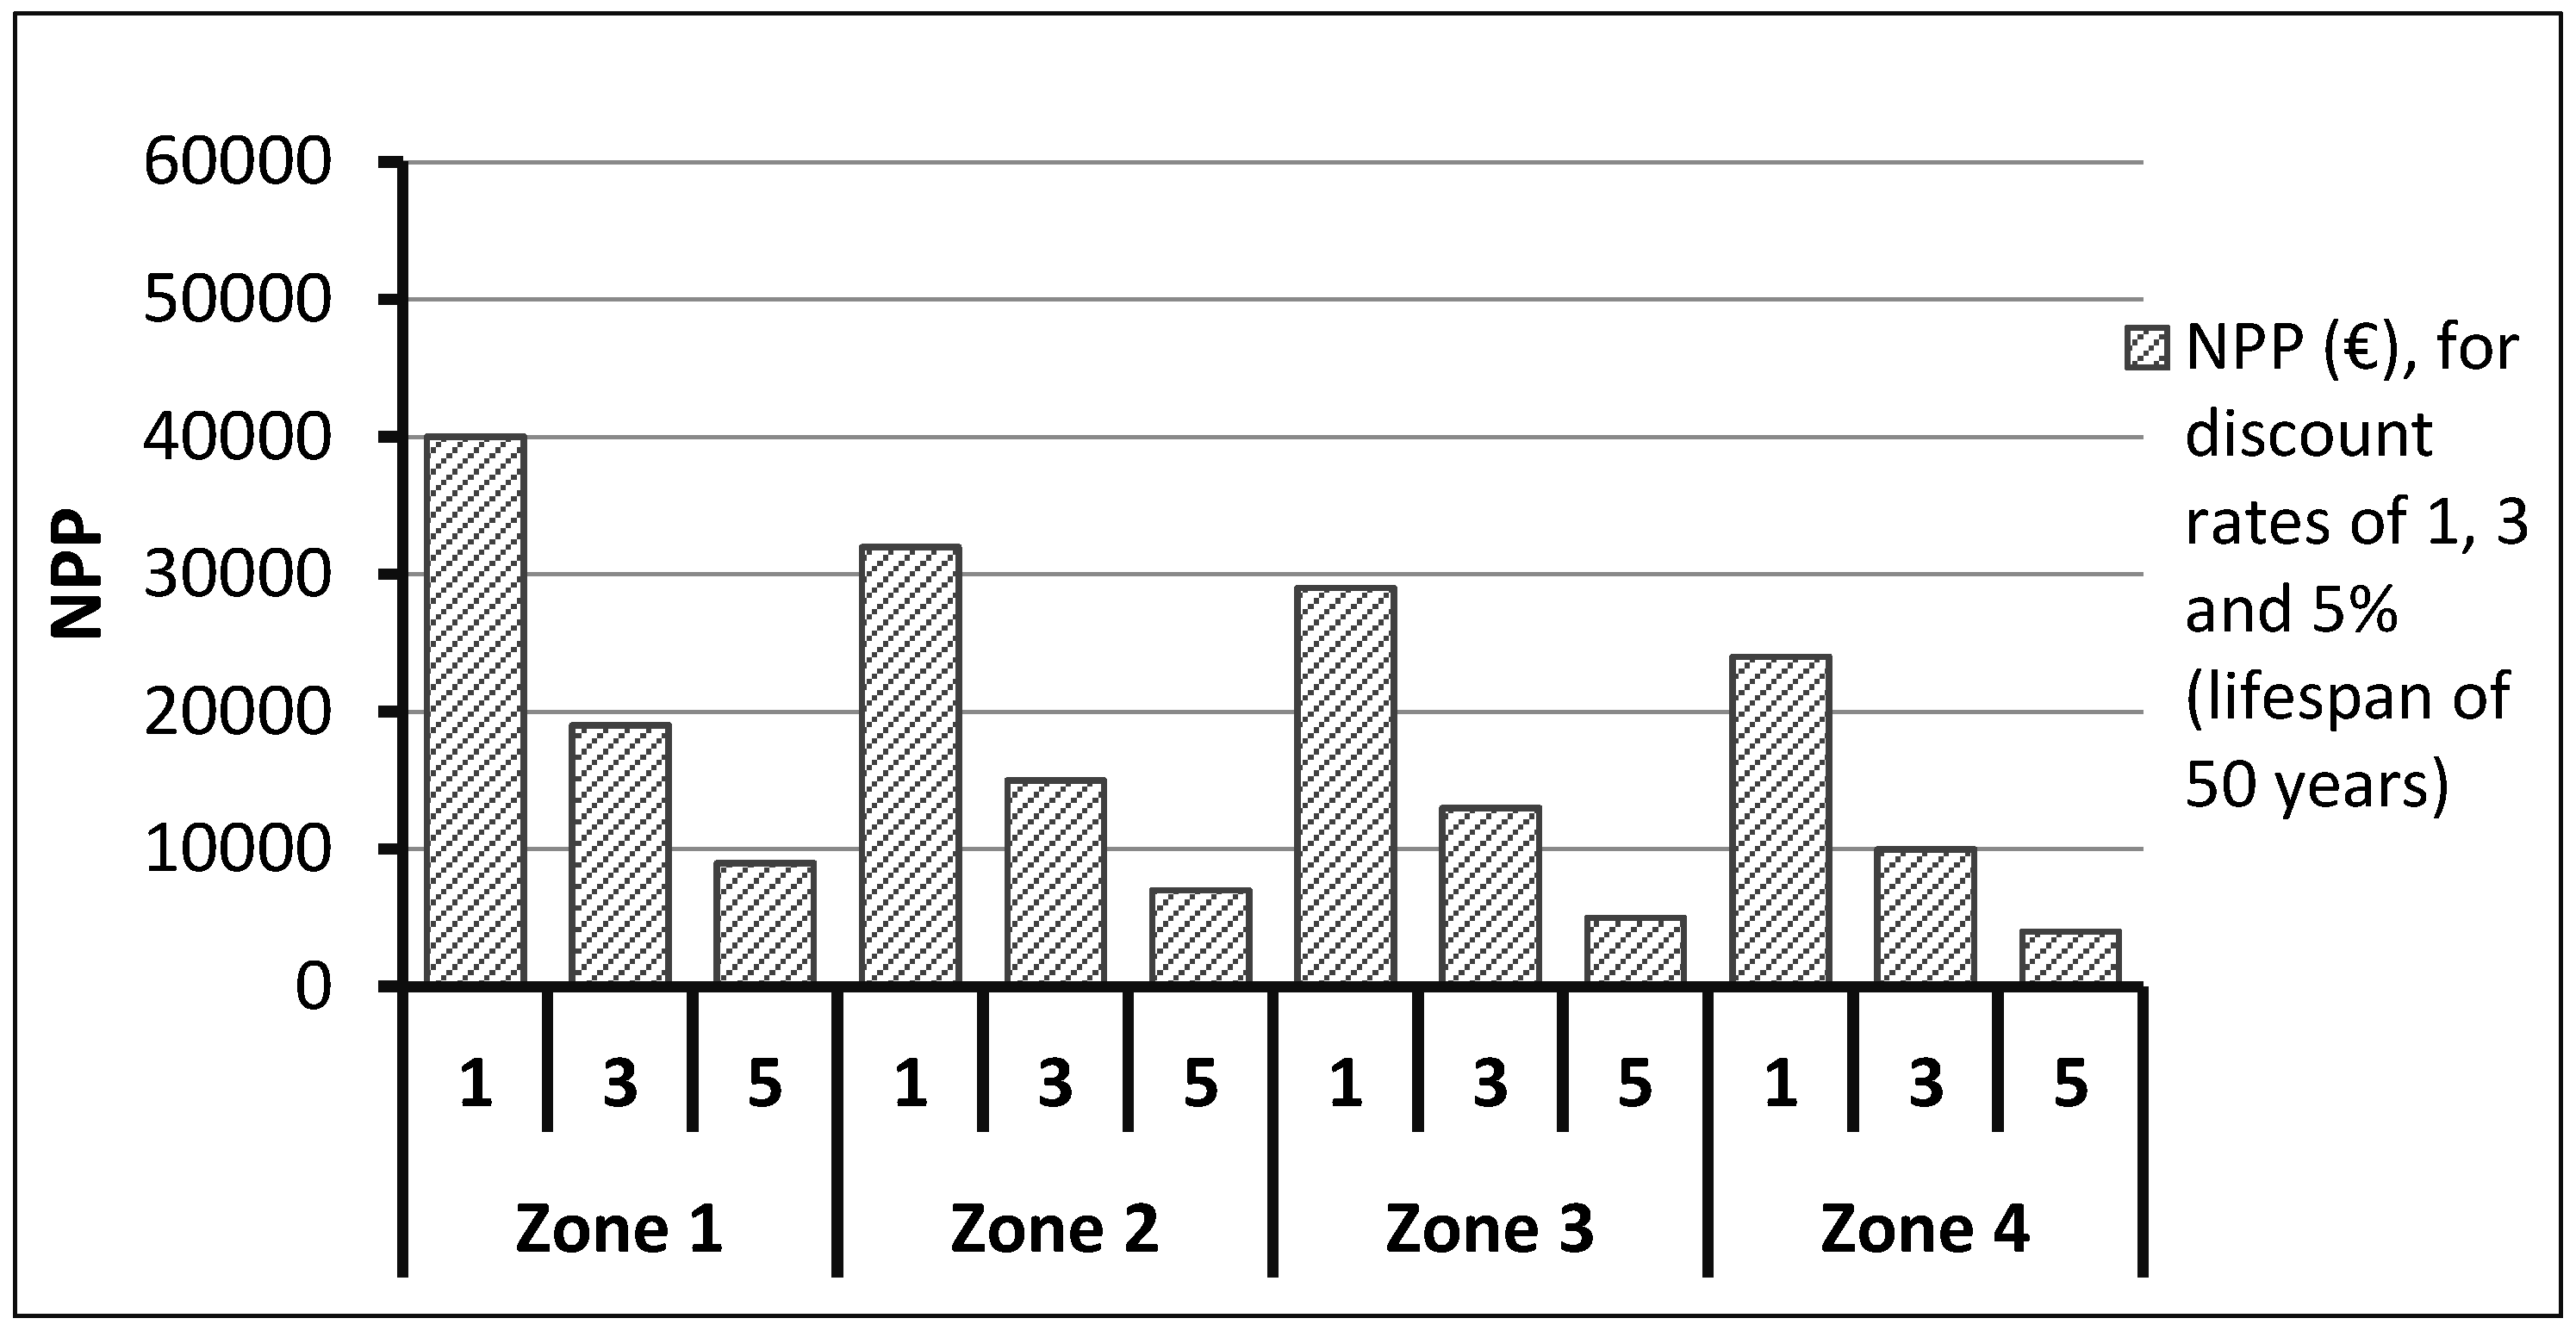
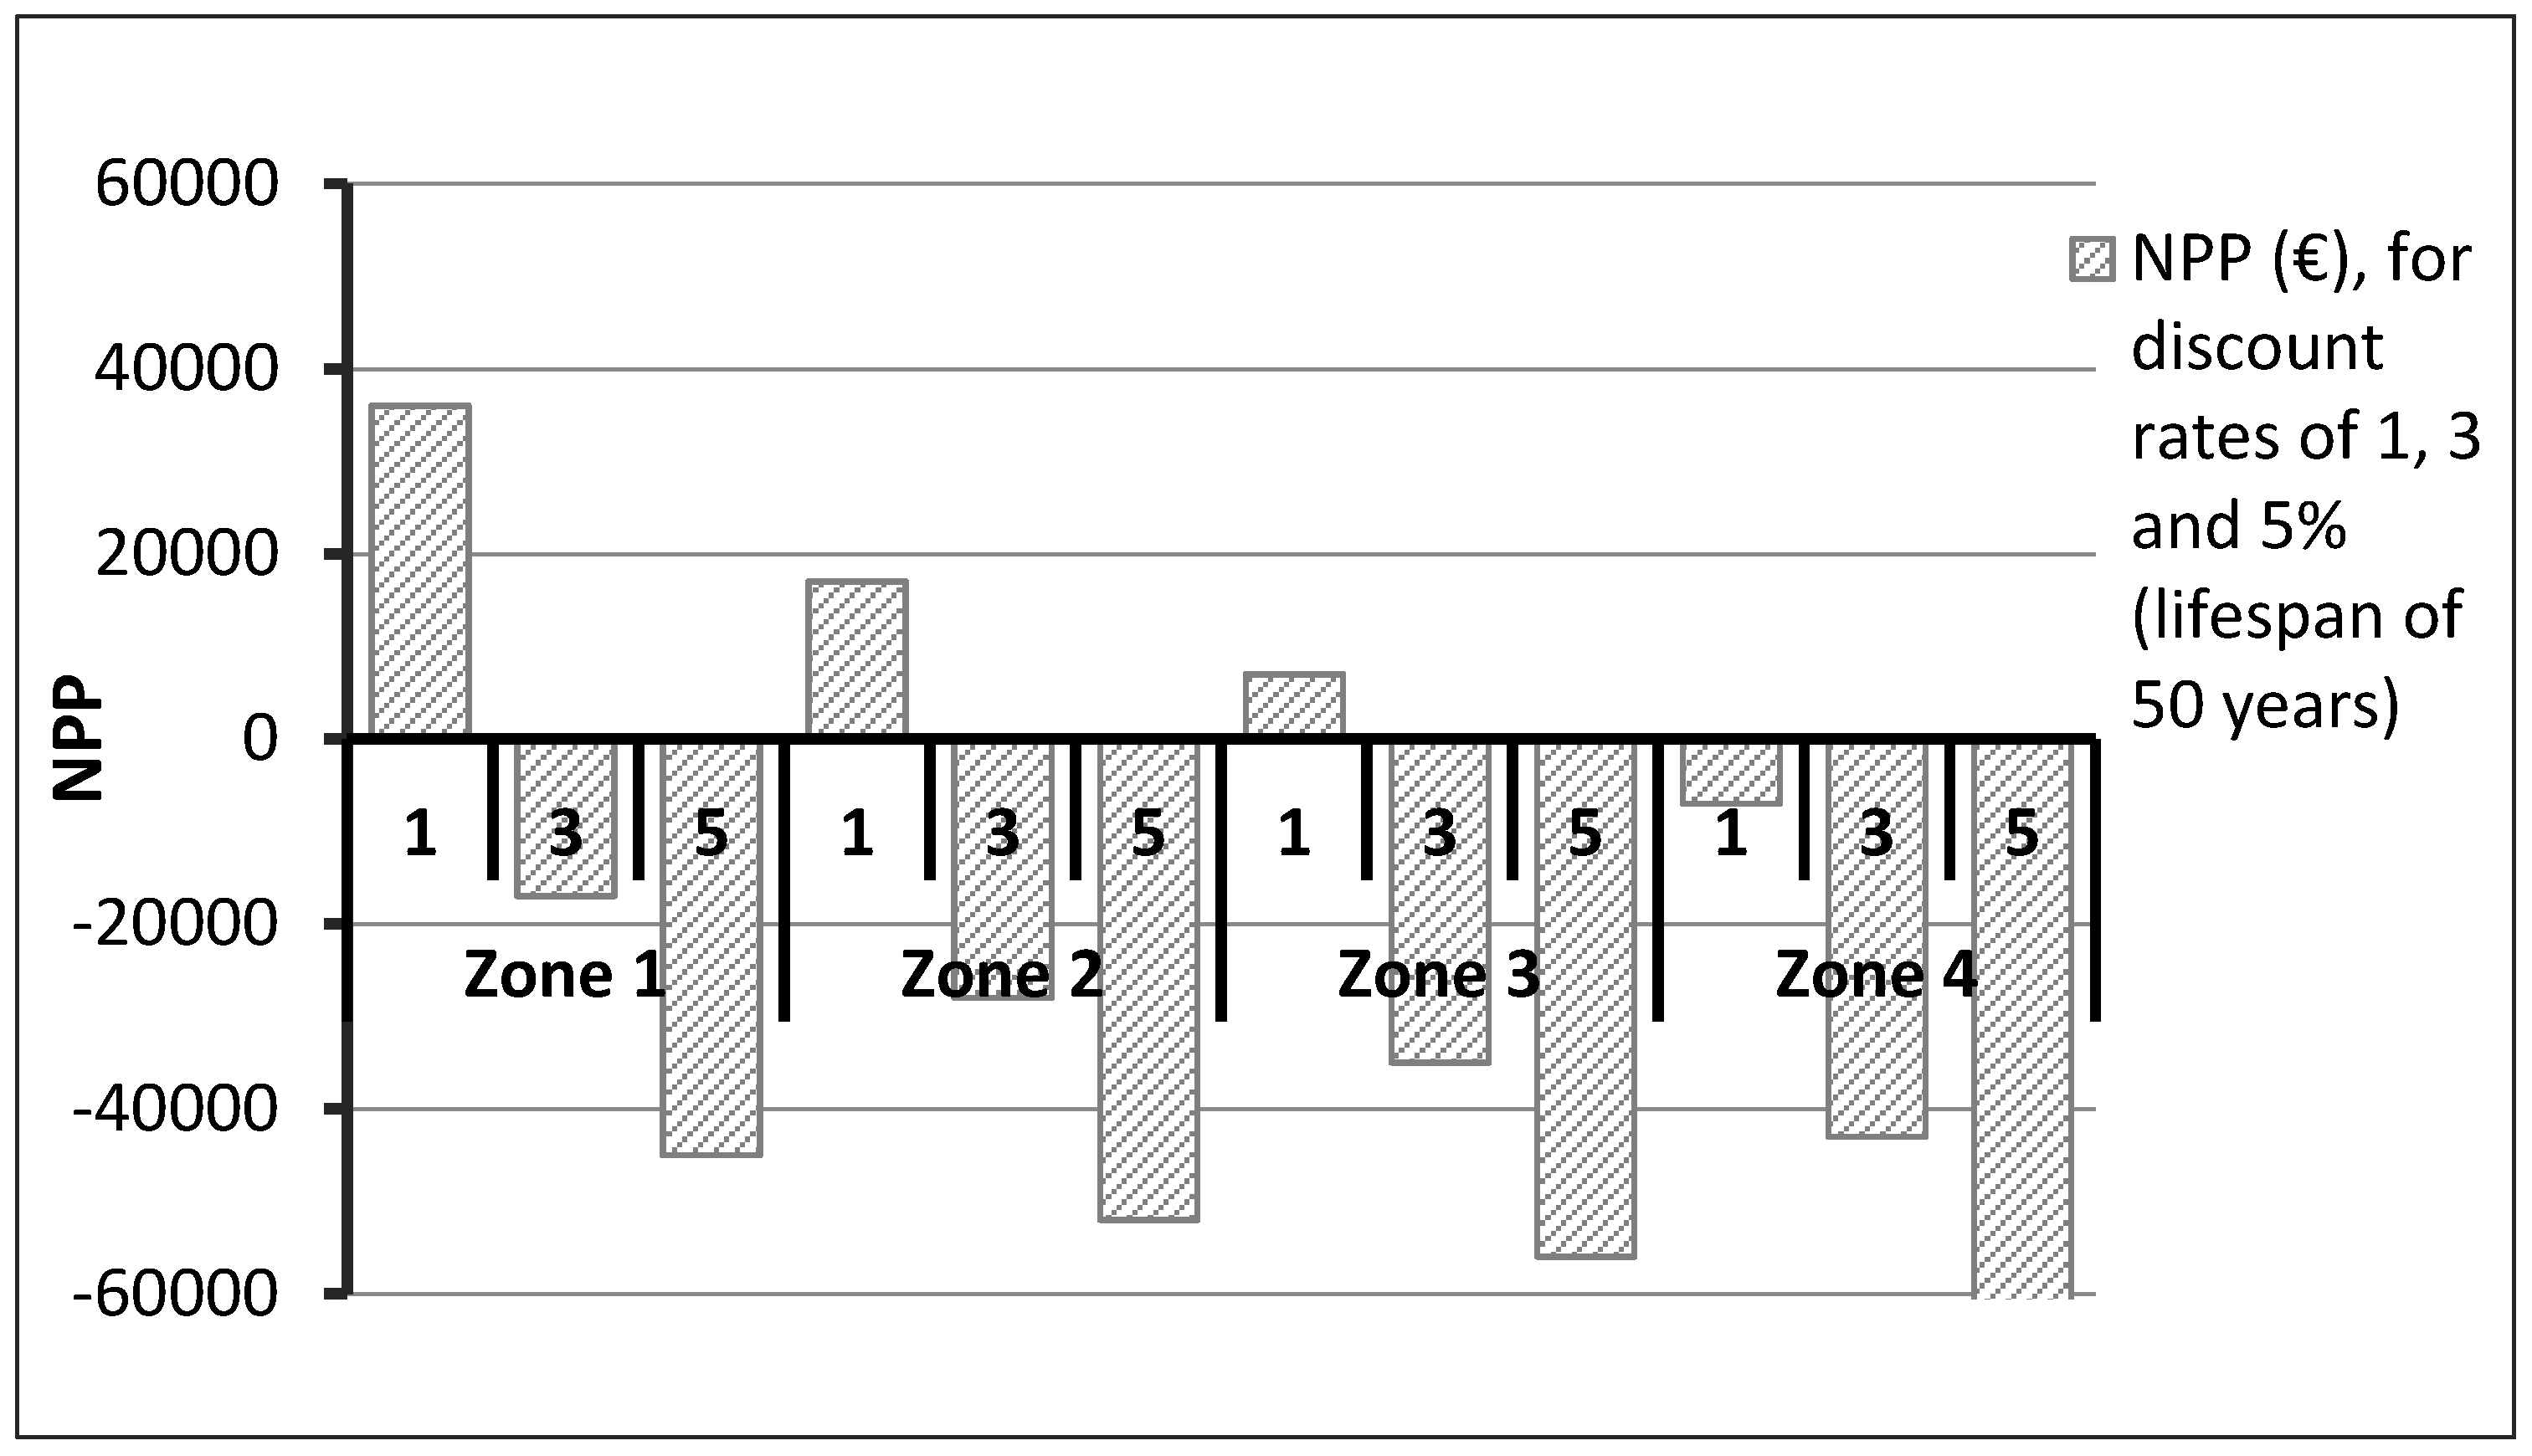
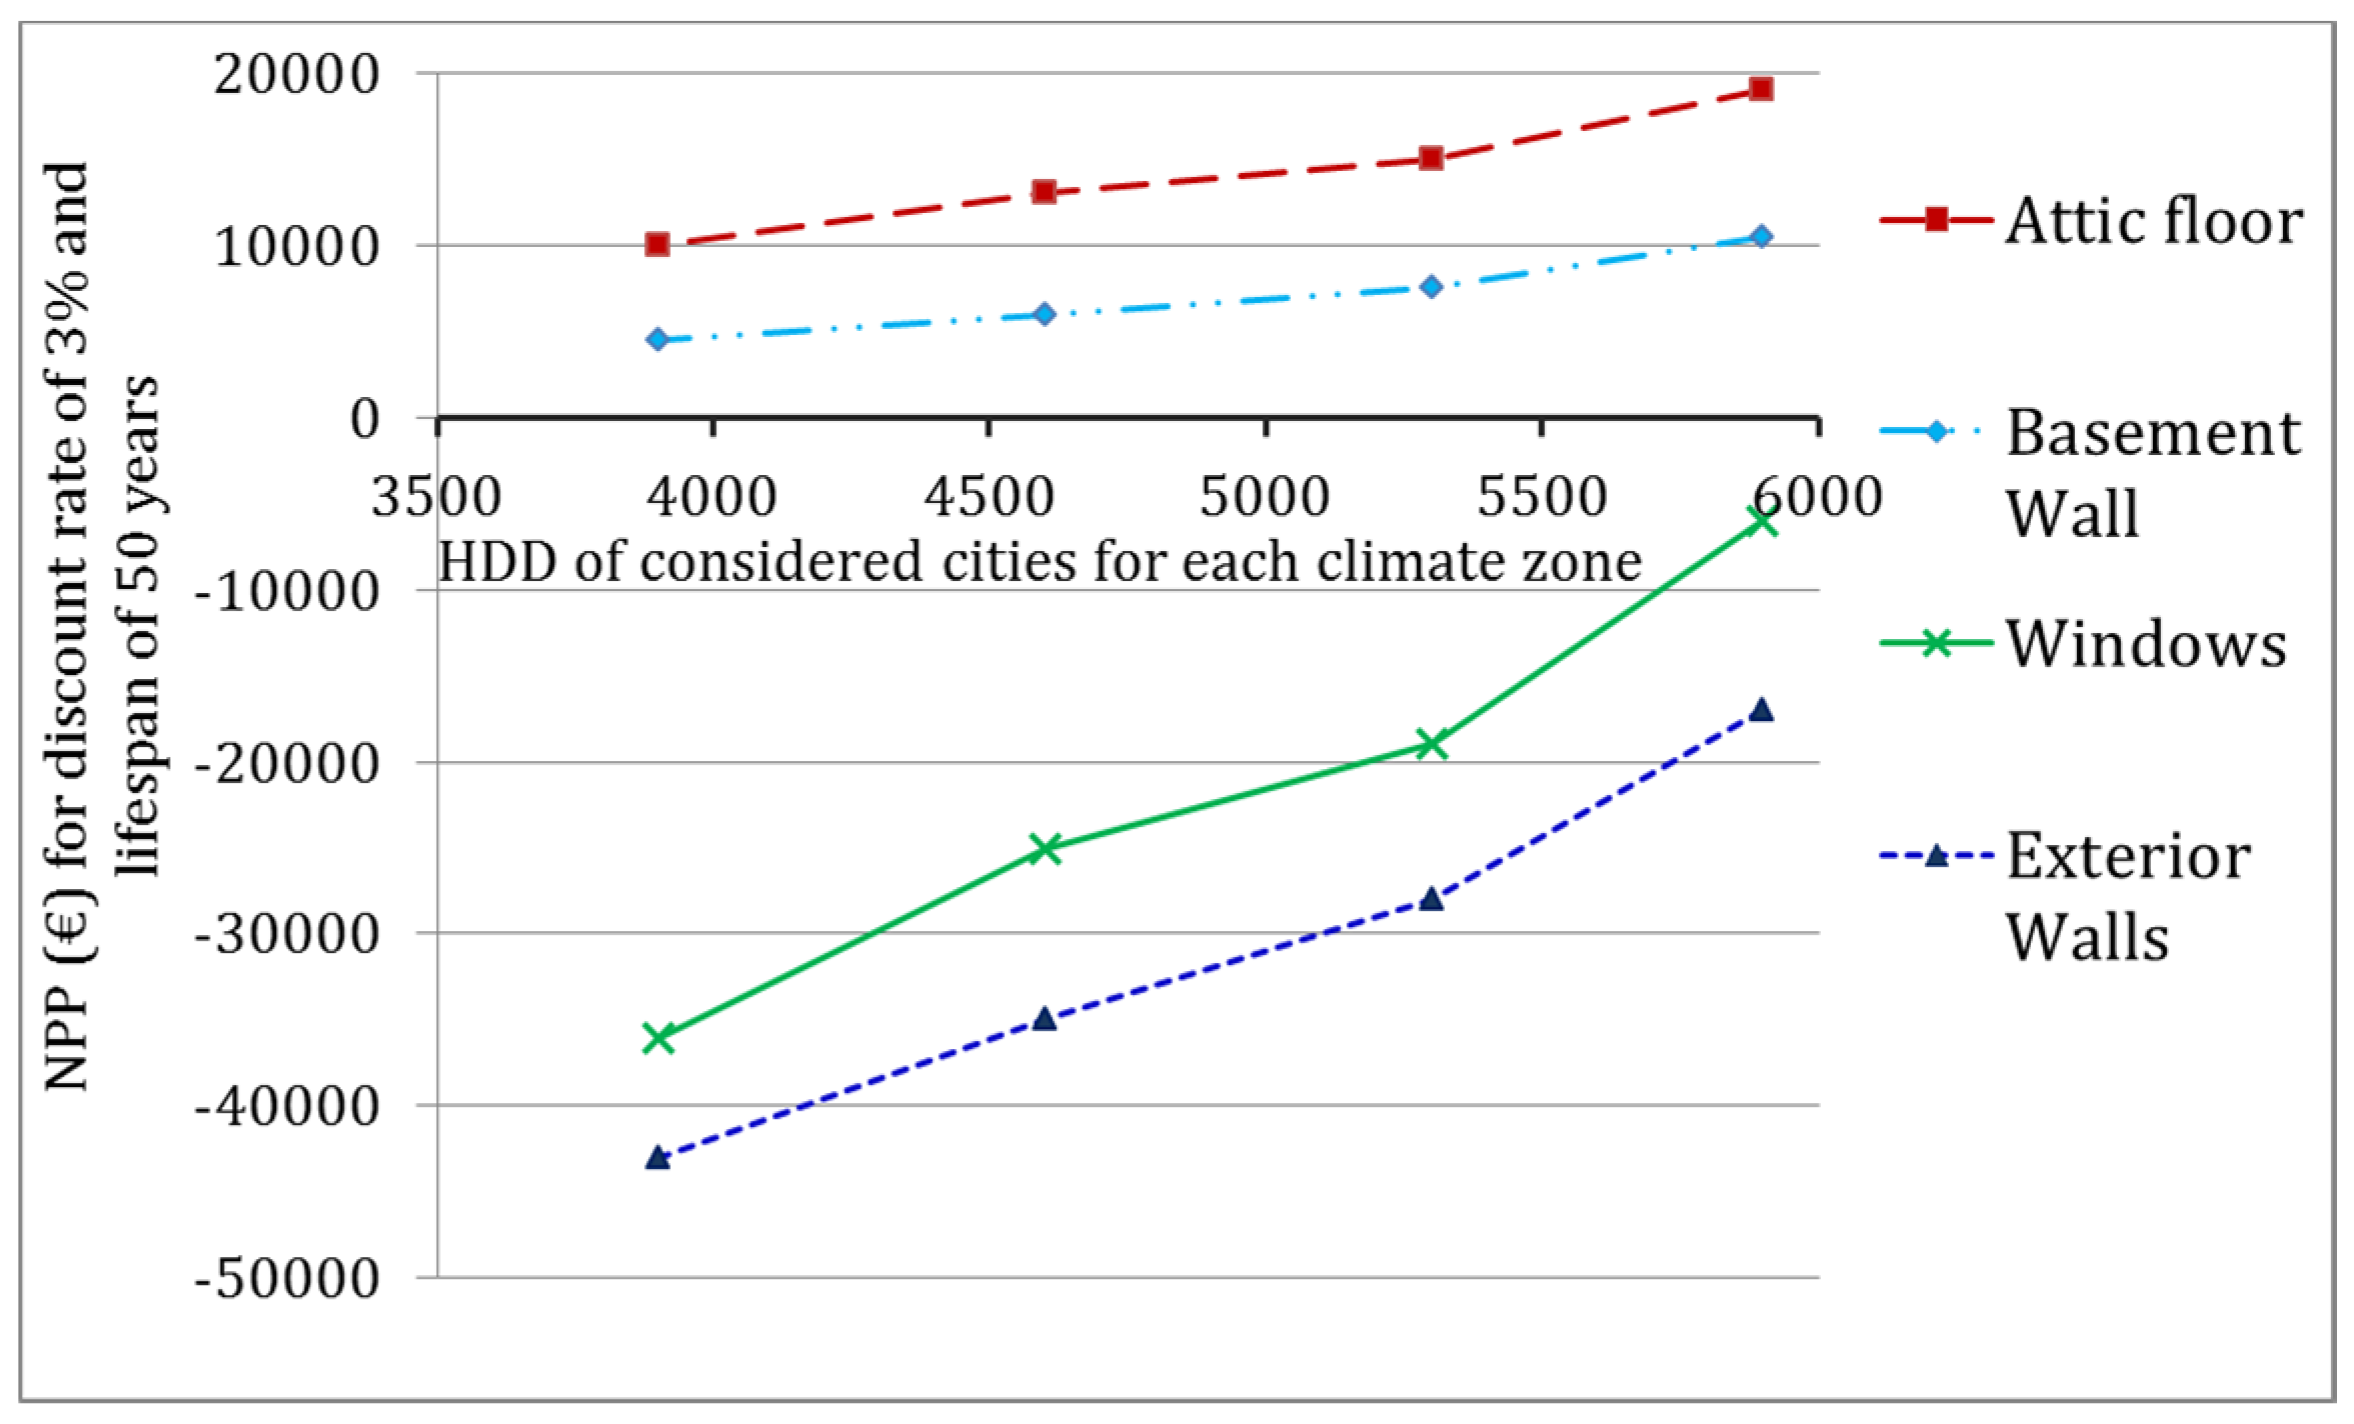
4.4. The Cost-Effectiveness of Optimum Energy Renovation

The cost-effective energy efficiency measures for the renovation of the building envelope are illustrated in Figure 16, Figure 17, Figure 18 and Figure 19, where the optimum measures for different discount rates, with the lifespan of 50 years, are considered. These figures indicate the maximum NPP of building envelope renovation, which corresponds to cost-optimum measures.
As far as the implication of climate zones on renovation cost-effectiveness is concerned, the results illustrated in Figure 16 indicate that NPP for implementing the additional insulation with optimum thickness on attic floor is about 60% less when the building is located in Zone 4 compared to Zone 1. This reduction is about 50% for implementing the optimum thickness of additional insulation on basement walls (Figure 17). Figure 16 and Figure 17 suggest that the cost-optimal level of renovation for attic floors and basement walls is cost-effective regardless of the climate zones and the considered discount rate within the range of 1–5%.
The implications of climate zones on the cost-effectiveness of exterior walls’ renovation, considering the optimum thickness of additional insulation, are illustrated in Figure 18. The results suggest that implementing the additional insulation on exterior walls cannot be cost-effective unless we consider a low discount rate of 1% in climate Zones 1, 2 and 3. A similar condition is, to some extent, valid for windows’ replacement. As is illustrated in Figure 19, it can be suggested that the optimum measures for new windows would be cost-effective in all four climate zones if the discount rate of 1% is considered.
The NPP of exterior walls’ optimum renovation reduces by about 150% for the base case scenario, when the building is located in climate Zone 4 compared to Zone 1 (Figure 18). This reduction is about 500% for windows’ replacement when we consider the building in climate Zone 4 compared to Zone 1 (Figure 18).
A general evaluation of the results in Figure 16, Figure 17, Figure 18 and Figure 19 indicates that the implication of different Swedish climate zones on the cost-effectiveness of building envelope renovation is significantly larger for windows and exterior walls than for attic and basement walls when renovated at a cost-optimal level. The trends of optimum cost-effectiveness changes due to the heating degree day (HDD) variation, within four climate zones of Sweden, are illustrated in Figure 20, for the considered components in this study.
This figure suggests the trends of cost-effectiveness improvement while HDD increases for each of the considered components. These results provide an opportunity to estimate the cost-effectiveness of the envelope optimum renovation for buildings with similar characteristics located in regions with similar climate conditions, e.g., northern Europe and North America. The fact that the components of windows and exterior walls are directly exposed to the outdoor environment can explain the steeper trends of cost-effectiveness for the measures in these components compared to basement walls and the attic floor.

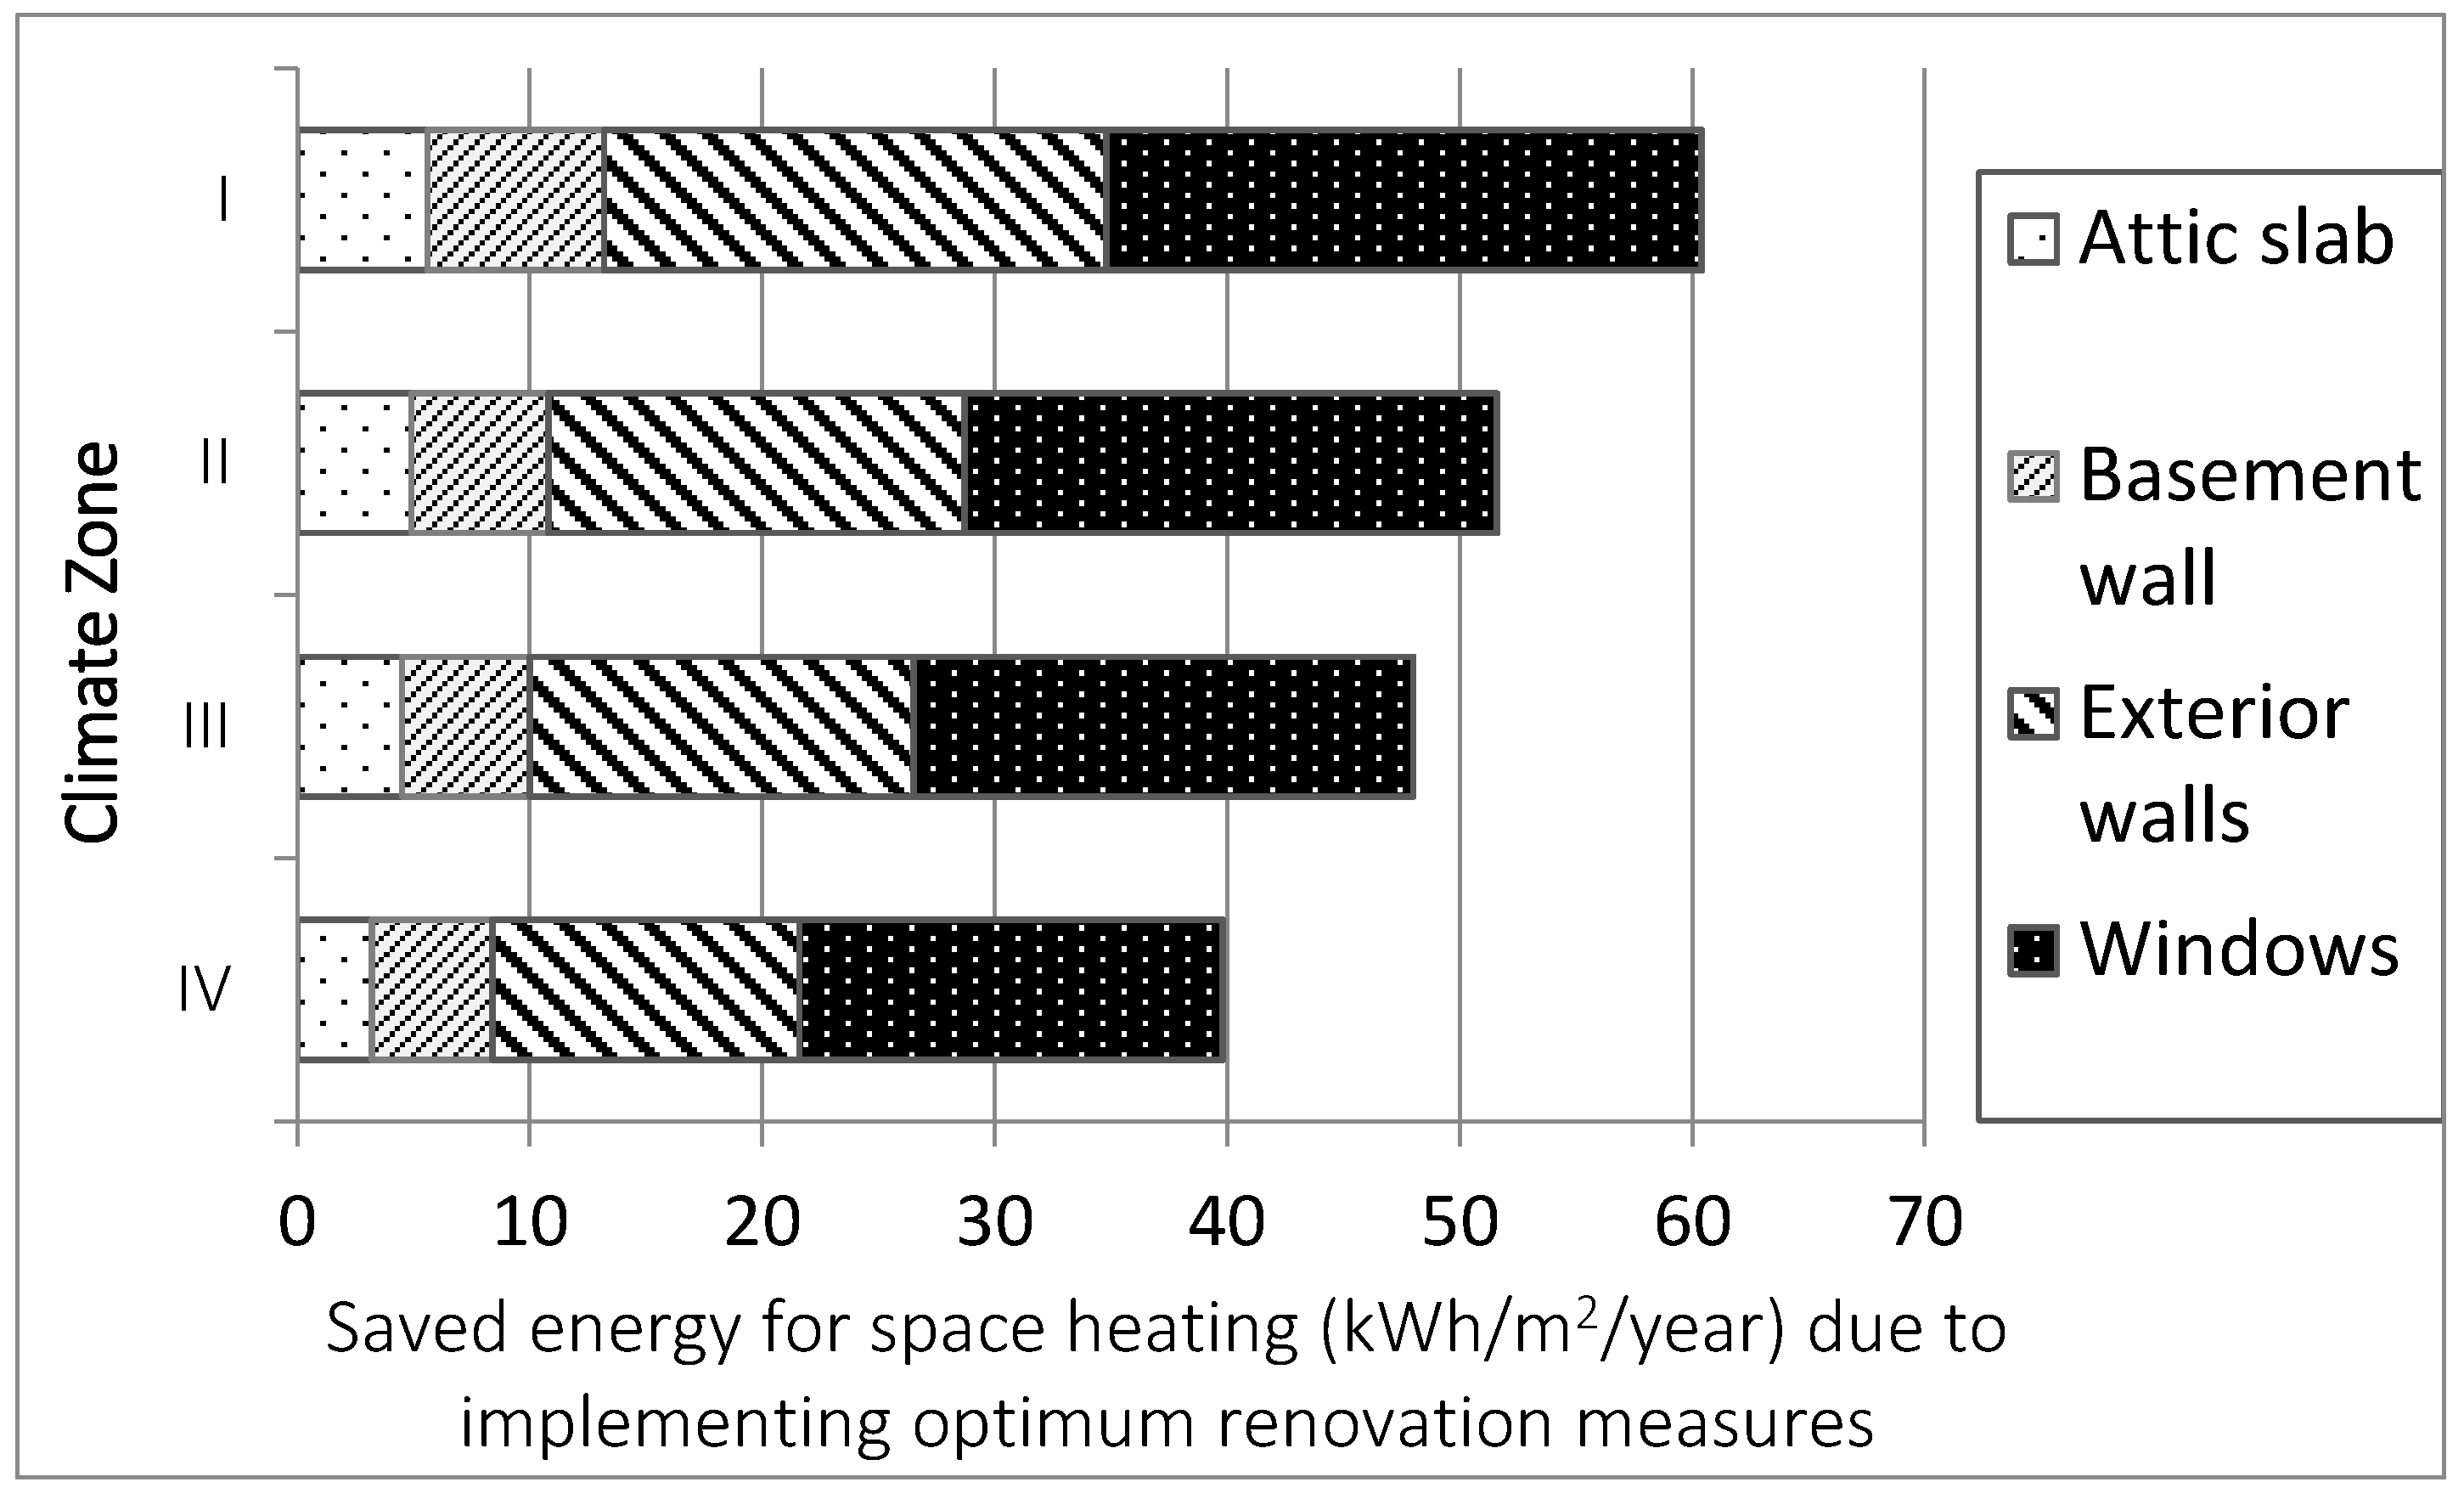
4.5. The Final Energy Saving of Space Heat Demand

Figure 21 illustrates the saved energy for space heating that can be achieved if the cost-optimum measures are implemented for the energy renovation of considered components on the building envelope in different climate zones. Since there is an interaction between the contributions of different single components to reduced heat demand, the saved energy for space heat demand, due to the measures for single components, should not be linearly summed up, in order to obtain total energy savings due to a combination of those measures, which can be offered as a renovation package. This is suggested by Mata E. et al. [52], as well.
The linear summation of the reduced heat demand of single components’ renovation (as is shown in Figure 21) does not provide an accurate result for total saved energy after the renovation of combined components (i.e., renovation packages). However, the accumulation of their saved energy can provide an overall picture and estimation for the implication of climate zones on total saved energy when the building envelope is renovated to a cost-optimal level.

5. Conclusions

The implications of four different Swedish climate zones on the cost-optimal level and the renovation cost-effectiveness of the building envelope have been analyzed in this study. The contribution of the discount rate has been evaluated, as well. The common cost-benefit analysis method of present value is reformed in order to optimize the renovation measures and, simultaneously, analyze their corresponding cost-effectiveness. The method is denoted as net present profit (NPP). The values of NPP indicate the cost-effectiveness of measures. Attic floor, exterior walls of the facade, basement walls and the windows of the building envelope are the components that have been studied. There are various other efficiency measures in a building that could be investigated for the cost-optimality and cost-effectiveness of energy renovation, e.g., heating and ventilation systems. However, the energy efficiency measures that are considered in this study are limited to building envelope thermal improvement, as this property of the building is more sensitive to climate zone variation.
The initial results of building energy simulation indicate that applying the considered energy efficiency measure (e.g., additional insulation with an optimum thickness on exterior walls) in different climate zones causes a significant difference in energy savings for space heat demand. This difference may reach as much as 52% from climate Zone 4 compared to climate Zone 1, when the optimum thickness is taken into account. As far as the thermal transmittance improvement is concerned, the final energy for space heat demand for the optimum renovation of exterior walls appears to be more sensitive than other considered components to the climate zones. This sensitivity is followed by energy savings due to windows’ U-value improvement. One reason is the direct exposure of these components to the outdoor climate. The thermal transmittance status of these components before renovation can be another reason.
The cost-optimal level of building envelope renovation is obtained from the highest point of the NPP trend curve. This curve is a result of NPP calculation for a wide range of energy efficiency measures in every considered component. The optimization of U-values for new windows has a limitation due to practical reasons. The range of available U-values of new windows is limited in the market. The common U-value of windows, which is used in practice for new or renovated buildings, is about 1.2 W/m2K or below. This limitation does not allow taking other U-values beyond 1.2 W/m2K into account. As far as the net present profit is concerned, the new windows’ U-value has the most sensitivity of NPP to climate zone, at the cost-optimal level. The NPP for additional insulation thicknesses on basement walls has the smallest sensitivity to climate zone when it is the cost-optimal level of renovation.
Comparing the implication of different discount rates with the implication of different climate zones on NPP indicates that the discount rate has significantly more contribution to NPP than climate zones. For instance, in attic floor renovation, changing the discount rate from 1–5% may cause about a 550% reduction in NPP; whilst this reduction is about 120% when the building is located in climate Zone 4 compared to Zone 1. The implication of the discount rate on NPP is dramatically significant for exterior walls’ and windows’ renovation. This can be a deriving factor of decision making for the renovation of the building envelope, especially in climate Zone 1, where the contribution of the discount rate appears to be larger to the cost-effectiveness, compared to climate Zone 4.
In terms of climate zone influence on space heat demand, the results indicate that the optimum renovation of the entire building envelope (i.e., all considered components as a package) provides about 53% more saved energy if the building is located in Zone 1 compared to Zone 4. This figure is suggested from a linear sum of the contribution of single components to saved energy for space heat demand and does not consider the interaction between energy efficiency measures of different components when they are renovated together as a package. The interaction between the efficiency measures of different components may cause different results for the cost-effectiveness of renovation packages when the considered measures are combined. For instance, although the renovation of exterior walls appeared not to be cost-effective for certain economic scenario (Figure 18), it may be cost-effective if we consider a renovation package of several components, including exterior walls for the same scenario. This needs to be further investigated in order to evaluate the cost-optimality and the cost-effectiveness of energy renovation measures for the combination of components compared to single components. However, it has not been considered in this paper with the purpose of keeping the paper comprehensible and focuses on the first objective, which is to analyze how the climate zone variation can contribute to the cost-optimal level and cost-effectiveness of energy renovation, considering different discount rates.
The findings of this study are based on the characteristics of a case-study building (i.e., a multi-story residential building) located in Swedish climate Zone 3. The same method can be used to perform a similar exercise for other buildings with different characteristics throughout the country in order to provide an overall picture and understanding of the entire building stock in Sweden. The results of the cost-effectiveness analysis are applicable for buildings with similar characteristics located in different climate conditions, as well. This is due to the broad climate zones that are analyzed in this study and the trend of cost-effectiveness variation, obtained for different components of the building envelope in different climate zones.

Author Contributions

The contribution of the article’s authors is as follow: Farshid Bonakdar conceived and implemented the study design, collected data and performed the analysis and wrote the first draft. Angela Sasic Kalagasidis contributed to the writing and discussions on article structure, energy calculations and literature review and Krushna Mahapatra contributed on editing and discussions on article structure and economic calculations.

Conflicts of Interest

The authors declare no conflict of interest.

Nomenclature

ACHAir change rate per hour (h−1)
DHDistrict heating
EEMEnergy efficiency measure
EPSExpanded polystyrene
GWPGlobal warming potential
HDDHeating degree day (°C)
HVACHeating, ventilating and air conditioning
LCALife cycle analysis
LCCLife cycle cost
LCCFLife cycle carbon footprint
LCIALife cycle impact assessment
MFDMulti-family dwelling
NPVNet present value (€)
NPPNet present profit (€)
N/ANot available
N/SNot specified
OPERAOptimal energy retrofit advisory
PVphotovoltaic
RBRepresentative building
SBOSimulation-based optimization
SFDSingle-family dwelling
U-valueThermal transmittance (W/m2K)
λ-valueThermal conductivity (W/mK)

References

  1. Hall, T.; Viden, S. The Million Homes Programme: A review of the great Swedish planning project. Plan. Perspect. 2005, 20, 301–328. [Google Scholar] [CrossRef]
  2. Dol, K.; Haffner, M. Housing Statistics in the European Union; OTB Research Institute for the Built Environment, Delft University of Technology: Delft, The Netherlands, 2010. [Google Scholar]
  3. Konsekvensutredning BBR, Ändring av Boverkets Byggregler (BBR)—Avsnitt 9 Energihushållning; Boverket: Karlskrona, Sweden, 2015.
  4. Berry, J.N.; McGreal, W.S. European Cities, Planning Systems and Property Markets; Taylor & Francis: Oxfordshire, UK, 2004. [Google Scholar]
  5. Itard, L.; Meijer, F.; Vrins, E.; Hoiting, H. Building Renovation and Modernisation in Europe: State of the Art Review; T.U.Delft: Delft, The Netherlands, 2008. [Google Scholar]
  6. Förslag Till Utvecklad Nationell Strategi för Energieffektiviserande Renovering; Energimyndigheten and Boverket: Karlskrona, Sweden, 2015.
  7. Swedish Parliament. Sweden’s Third National Action Plan Energy Efficiency (Sveriges Tredje Nationella Handlingsplan för Energieffektivisering); Swedish Parliament: Stockholm, Sweden, 2014. [Google Scholar]
  8. European Parliament. Directive 2010/31/EU of the European Parliament and of the Council on the Energy Performance of Buildings (Recast); Official Journal of the European Union; European Parliament: Brussels, Belgium, 2010. [Google Scholar]
  9. European Parliament. Directive 2002/91/EC of the European Parliament and the Council on the Energy Performance of Buildings; Official Journal of the European Union; European Parliament: Brussels, Belgium, 2002. [Google Scholar]
  10. Kauko, H.; Alonso, M.J.; Stavset, O.; Claussen, I.C. Case study on residential building renovation and its impact on the energy use and thermal comfort. Energy Procedia 2014, 58, 160–165. [Google Scholar] [CrossRef]
  11. Mata, E.; Sasic Kalagasidis, A.; Johnsson, F. Retrofitting measures for energy savings in the Swedish residential building stock—Assessing methodology. In Proceedings of the 11th International Conference on Thermal Performance of the Exterior Envelopes of Whole Buildings, Buildings XI, Clearwater, FL, USA, 5–9 December 2010. [Google Scholar]
  12. Dodoo, A.; Gustavsson, L.; Sathre, R. Life cycle primary energy implication of retrofitting a wood-framed apartment building to passive house standard. Resour. Conserv. Recycl. 2010, 54, 1152–1160. [Google Scholar] [CrossRef]
  13. Dall’O’, G. Green Energy Audit of Buildings: A Guide for Sustainable Energy Audit of Buildings; Springer: London, UK, 2013. [Google Scholar]
  14. Mata, E.; Sasic Kalagasidis, A.; Johnsson, F. Costs of retrofit measures in the Swedish residential building stock—An evaluation for three scenarios on future energy prices. In Proceedings of the 9th Nordic Symposium on Building Physics, Tampere, Finland, 29 May–2 June 2011; Chalmers University of Technology: Gothenburg, Sweden, 2011. [Google Scholar]
  15. EEA. Consumption and the Environment, 2012 Update; The European Environment Agency: Copenhagen, Denmark, 2012. [Google Scholar]
  16. Mata, E.; Sasic Kalagasidis, A.; Johnsson, F. Cost-effective retrofitting of Swedish residential buildings: Effects of energy price developments and discount rates. Energy Effic. 2015, 8, 223–237. [Google Scholar] [CrossRef]
  17. Boermans, T.; Bettgenhäuser, K.; Offermann, M.; Schimschar, S. Renovation Tracks for Europe up to 2050; Ecofys Germany: Köln, Germany, 2012. [Google Scholar]
  18. Hermelink, A.H. How Deep to Go: Remarks on How to Find the Costoptimal Level for Building Renovation; European Council for an Energy Efficient Economy: Köln, Germany, 2009. [Google Scholar]
  19. Hermelink, A.H.; Mueler, A. Economics of Deep Renovation: Implication of a Set of Case Studies; Ecofys Germany: Berlin, Germany, 2011. [Google Scholar]
  20. Gustafsson, S.-I. Optimisation of insulation measures on existing buildings. Energy Build. 2000, 33, 49–55. [Google Scholar] [CrossRef]
  21. Bonakdar, F.; Dodoo, A.; Gustavsson, L. Cost-optimum analysis of building fabric renovation in a Swedish multi-story residential building. Energy Build. 2014, 84, 662–673. [Google Scholar] [CrossRef]
  22. Wahlström, Å.; Filipsson, P.; Heincke, C. Cost optimal energy efficiency in multifamily houses. In Proceedings of the 6th Passive House Conference in the Nordic Countries, Göteborg, Sweden, 15–17 October 2013. [Google Scholar]
  23. Stocker, E.; Tschurtschenthaler, M.; Schrott, L. Cost-optimal renovation and energy performance: Evidence from existing school buildings in the Alps. Energy Build. 2015, 100, 20–26. [Google Scholar] [CrossRef]
  24. Perino, M.; Corrado, V.; Almeida, M.; Bencresciuto, A.; Ferreira, M.; Rodrigues, A. Cost-effective Energy and Carbon Emission Optimization in Building Renovation—A Case-Study in a Low Income Neighbourhood. Energy Procedia 2015, 78, 2403–2408. [Google Scholar]
  25. Gustafsson, S.-I.; Karlsson, B.G. Life-cycle cost minimization considering retrofits in multi-family residences. Energy Build. 1989, 14, 9–17. [Google Scholar] [CrossRef]
  26. Özkan, D.B.; Onan, C. Optimization of insulation thickness for different glazing areas in buildings for various climatic regions in Turkey. Appl. Energy 2011, 88, 1331–1342. [Google Scholar] [CrossRef]
  27. Arumägi, E.; Kalamees, T. Analysis of energy economic renovation for historic wooden apartment buildings in cold climates. Appl. Energy 2014, 115, 540–548. [Google Scholar] [CrossRef]
  28. Perino, M.; Corrado, V.; Domingo-Irigoyen, S.; Sánchez-Ostiz, A.; Miguel-Bellod, J.S. Cost-Effective Renovation of a Multi-residential Building in Spain through the Application of the IEA Annex 56 Methodology. Energy Procedia 2015, 78, 2385–2390. [Google Scholar]
  29. Chantrelle, F.P.; Lahmidi, H.; Keilholz, W.; Mankibi, M.E.; Michel, P. Development of a multicriteria tool for optimizing the renovation of buildings. Appl. Energy 2011, 88, 1386–1394. [Google Scholar] [CrossRef]
  30. Goto, Y.; Ostermeyer, Y.; Wakili, K.G.; Wallbaum, H. Economic, ecological and thermo-hygric optimization of a vapor-open envelope for subtropical climates. Energy Build. 2012, 55, 799–809. [Google Scholar] [CrossRef]
  31. Verbeeck, G.; Hens, H. Energy savings in retrofitted dwellings: Economically viable? Energy Build. 2005, 37, 747–754. [Google Scholar] [CrossRef]
  32. Bonakdar, F.; Gustavsson, L.; Dodoo, A. Implications of energy efficiency renovation measures for a Swedish residential building on cost, primary energy use and carbon dioxide emission. Proccedings of the ECEEE Summer Study 2013, Presq'ile de Giens, France, 3–8 June 2013. [Google Scholar]
  33. Terés-Zubiaga, J.; Campos-Celador, A.; González-Pino, I.; Escudero-Revilla, C. Energy and economic assessment of the envelope retrofitting in residential buildings in Northern Spain. Energy Build. 2015, 86, 194–202. [Google Scholar] [CrossRef]
  34. Ferrari, S.; Zagarella, F. Costs Assessment for Building Renovation Cost-optimal Analysis. Energy Procedia 2015, 78, 2378–2384. [Google Scholar] [CrossRef]
  35. Nikolaidis, Y.; Pilavachi, P.A.; Chletsis, A. Economic evaluation of energy saving measures in a common type of Greek building. Appl. Energy 2009, 86, 2550–2559. [Google Scholar] [CrossRef]
  36. Ouyang, J.; Ge, J.; Hokao, K. Economic analysis of energy-saving renovation measures for urban existing residential buildings in China based on thermal simulation and site investigation. Energy Policy 2009, 37, 140–149. [Google Scholar] [CrossRef]
  37. Brown, N.W.O.; Malmqvist, T.; Bai, W.; Molinari, M. Sustainability assessment of renovation packages for increased energy efficiency for multi-family buildings in Sweden. Building Environ. 2013, 61, 140–148. [Google Scholar] [CrossRef]
  38. Papadopoulos, A.M.; Theodosiou, T.G.; Karatzas, K.D. Feasibility of energy saving renovation measures in urban buildings: The impact of energy prices and the acceptable pay back time criterion. Energy Build. 2002, 34, 455–466. [Google Scholar] [CrossRef]
  39. Tronchin, L.; Tommasino, M.C.; Fabberi, K. On the cost-optimal levels of energy-performance requirements for buildings: A case study with economic evaluation in Italy. Int. J. Sustain. Energy Plan. Manag. 2014, 3, 49–62. [Google Scholar]
  40. Tahsildoost, M.; Zomorodian, Z.S. Energy retrofit techniques: An experimental study of two typical school buildings in Tehran. Energy Build. 2015, 104, 65–72. [Google Scholar] [CrossRef]
  41. Niemelä, T.; Kosonen, R.; Jokisalo, J. Cost-effectiveness of energy performance renovation measures in Finnish brick apartment buildings. Energy Build. 2017, 137, 60–75. [Google Scholar] [CrossRef]
  42. Niemelä, T.; Kosonen, R.; Jokisalo, J. Cost-optimal energy performance renovation measures of educational buildings in cold climate. Appl. Energy 2016, 183, 1005–1020. [Google Scholar] [CrossRef]
  43. Cetiner, I.; Edis, E. An environmental and economic sustainability assessment method for the retrofitting of residential buildings. Energy Build. 2014, 74, 132–140. [Google Scholar] [CrossRef]
  44. Mauro, G.M.; Hamdy, M.; Vanoli, G.P.; Bianco, N.; Hensen, J.L.M. A new methodology for investigating the cost-optimality of energy retrofitting a building category. Energy Build. 2015, 107, 456–478. [Google Scholar] [CrossRef]
  45. Fan, Y.; Xia, X. A multi-objective optimization model for energy-efficiency building envelope retrofitting plan with rooftop PV system installation and maintenance. Appl. Energy 2017, 189, 327–335. [Google Scholar] [CrossRef]
  46. Penna, P.; Prada, A.; Cappelletti, F.; Gasparella, A. Multi-objectives optimization of Energy Efficiency Measures in existing buildings. Energy Build. 2015, 95, 57–69. [Google Scholar] [CrossRef]
  47. Schwartz, Y.; Raslan, R.; Mumovic, D. Implementing multi objective genetic algorithm for life cycle carbon footprint and life cycle cost minimisation: A building refurbishment case study. Energy 2016, 97, 58–68. [Google Scholar] [CrossRef]
  48. Reppen, L.; Birch, C.; Kallstenius, P. Så Byggdes Husen 1880-2000: Arkitektur, Konstruktion Och Material i Våra Flerbostadshus Under 120 år; Svensk Byggtjänst: Stockholm, Sweden, 2013. [Google Scholar]
  49. Jansson, J.; Nilsson, T. Energieffektivisering av rekordårens flerbostadshus. In Byggteknik, LNU 2011; Linnéuniversitetet, Institutionen för teknik: Växjö, Sweden; p. 117.
  50. Reppen, L. Renoveringshandboken för Hus Byggda 1950-75; VVS-Företagen: Stockholm, Sweden, 2009. [Google Scholar]
  51. Truong, N.L. District Heat Production Under Different Environmental and Social Cost. Ph.D. Thesis, Linnaeus University, Växjö, Sweden, 2014. [Google Scholar]
  52. Mata, É.; Sasic Kalagasidis, A.; Johnsson, F. Energy usage and technical potential for energy saving measures in the Swedish residential building stock. Energy Policy 2013, 55, 404–414. [Google Scholar] [CrossRef]
  53. Teknisk Status i den Svenska Bebyggelsen—Resultat Från Projektet BETSI; Boverket—National Board of Housing, Building and Planning of Sweden: Karlskrona, Sweden, 2010.
  54. VIP-Energy; StruSoft AB: Malmö, Sweden, 2016.
  55. METEONORM. A Global Meteorological Climate Database Combined with a Weather Generator. Available online: http://www.antherm.eu/meteonorm/EN/ (accessed on 8 May 2017).
  56. Strusoft-AB. VIP-Energy. Available online: http://www.strusoft.com/products/vip-energy (accessed on 8 May 2017).
  57. Statens planverk. Föreskrifter, Råd Och Anvisningar för Byggnadsväsendet (Building Regulations); Statens Planverk: Stockholm, Sweden, 1967. [Google Scholar]
  58. Institute for Housing and Environment (IWU) and Mälardalens University Sweden (MDH). Typology Approach for Building Stock Energy Assessment—Tabula Project; Institut Wohnen und Umwelt GmbH: Darmstadt, Germany, 2012. [Google Scholar]
  59. Wikells-Byggberäkningar-AB. Sektionsfakta—ROT 4.14; Wikells Byggberäkningar AB: Växjö, Sweden, 2013–2014. [Google Scholar]
  60. Steinbach, J.; Staniaszek, D. Discount Rates in Energy System Analysis; Fraunhofer ISI, Building Performance Institute Europe (BPIE): Karlsruhe, Germany, 2015. [Google Scholar]
  61. European Commission. Notices from European Union Institutions, Bodies, Offices and Agencies on the Energy Performance of the Buildings (2012/C 115/01); Official journal of the European Union, European Commission: Brussels, Belgium, 2012. [Google Scholar]
  62. Rushing, A.S.; Kneifel, J.D.; Lippiatt, B.C. Energy Price Indices and Discount Factors for Life-Cycle Cost Analysis; National Institute of Standards and Technology: Gaithersburg, MD, USA, 2010; p. 77.
  63. Lorenz, D.; Luetzkendorf, T. Sustainability in property valuation: Theory and practice. J. Prop. Invest. Finance 2008, 26, 482–521. [Google Scholar] [CrossRef]
  64. Zalejska-Jonsson, A. In the business of building green: The value of low-energy residential buildings from customer and developer perspectives. In Department of Real Estate and Construction Management; Royal Institute of Technology: Stockholm, Sweden, 2013. [Google Scholar]
  65. Swabey, A. Life Cycle Environmental and Economic Analysis of Polyurethane Insulation in Low Energy Buildings; BRE Global: Watford, UK, 2010. [Google Scholar]
  66. European Parliament. Directive 2012/27/EU of the European Parliament and of the Council of 25 October 2012 on Energy Efficiency; European Parliament: Stockholm, Sweden, 2012. [Google Scholar]
  67. Swedish Energy Agancy. Energy in Sweden 2013; Swedish Energy Agancy: Stockholm, Sweden, 2014. [Google Scholar]
  68. VEAB Växjö Energy AB. Fjärrvärme priser; VEAB Växjö Energy AB: Växjö, Sweden, 2013. [Google Scholar]
  69. Swedish Energy Agency. Energy in Sweden—Facts and Figures 2011; Swedish Energy Agency: Stockholm, Sweden, 2011. [Google Scholar]
  70. O’Connor, J. Survey on actual service lives for North American buildings. In Proceedings of the Woodframe Housing Durability and Disaster Issues Conference, Las Vegas, NV, USA, 4–6 October 2004. [Google Scholar]
Figure 1. Swedish climate zones based on the building code of 1967.
Buildings 07 00039 g001
Figure 2. Ambient temperature (°C); average values from 1996–2005.
Buildings 07 00039 g002
Figure 3. North-east view of the case-study building.
Buildings 07 00039 g003
Figure 4. Floor plan of the case-study building.
Buildings 07 00039 g004
Figure 5. NPV of global cost concept for energy efficiency measures.
Buildings 07 00039 g005
Figure 6. Net present profit concept for the cost-optimal level and cost-effectiveness analysis of energy renovation measures.
Buildings 07 00039 g006
Figure 7. Saved energy for space heat demand due to additional insulation on the attic floor.
Buildings 07 00039 g007
Figure 8. Saved energy for space heat demand due to additional insulation on the basement walls.
Buildings 07 00039 g008
Figure 9. Saved energy for space heat demand due to additional insulation on the exterior walls.
Buildings 07 00039 g009
Figure 10. Saved energy for space heat demand due to more efficient windows.
Buildings 07 00039 g010
Figure 11. Net present profit of additional insulation on the attic floor for the base case scenario.
Buildings 07 00039 g011
Figure 12. Net present profit of additional insulation on the basement wall for the base case scenario.
Buildings 07 00039 g012
Figure 13. Net present profit of additional insulation on the exterior walls for the base case scenario.
Buildings 07 00039 g013
Figure 14. Net present profit of new windows with more efficient windows for the base case scenario.
Buildings 07 00039 g014
Figure 15. Net present profit of additional insulation on the attic floor for different discount rates in climate Zone 1.
Buildings 07 00039 g015
Figure 16. The cost-effectiveness of attic floor energy renovation, corresponding to the optimum measures.
Buildings 07 00039 g016
Figure 17. The cost-effectiveness of basement wall energy renovation, corresponding to the optimum measures.
Buildings 07 00039 g017
Figure 18. The cost-effectiveness of exterior walls energy renovation, corresponding to the optimum measures.
Buildings 07 00039 g018
Figure 19. The cost-effectiveness of windows’ energy renovation (changing windows), corresponding to the optimum U-values for new windows.
Buildings 07 00039 g019
Figure 20. The trend of changes in the cost-effectiveness due to HDD variation.
Buildings 07 00039 g020
Figure 21. The saved energy for space heat demand due to implementing the optimum level of energy renovation.
Buildings 07 00039 g021
Table 1. A summary of existing literature works with the subject of cost-optimization and cost-effectiveness of building renovation.
Ref. #Building TypeVintage and Location of BuildingBuilding Energy Modelling or Calculation MethodEnergy Retrofit Measures (e.g., Additional Insulation)Retrofit Profitability Assessment MethodOptimisation MethodLifespan After Renovation (Years)Sensitivity Analysis of Economic ParametersApplicability of the Study (e.g., Geographically and Building Type)
[21]MFD1967, SwedenVIP-Energy (transient, whole building energy model)Exterior walls, attic floor, basement walls, new windowsN/AMarginal cost difference40, 50 and 60 (sensitivity analysis)Different discount rates and energy price increaseSouthern Sweden; MFDs with similar characteristics
[31]Three detached houses and two terraced dwellingDetached house after 1973. Other houses before 1973, BelgiumCalculation: space heat demand based on energy performance regulations and EN832Roof slab, exterior walls, floor, new windows, PV panels, heating systemsNPV of energy cost for space heating and investmentNPV of costs and benefits due to implementing energy retrofit measures.30N/ABelgium; building stock of Belgium (RB)
[16]SFD, MFD1960–2005, Entire SwedenECCABS (whole building energy model, transient)Exterior walls, attic floor, basement, new windows, lights, ventilation (heat recovery), lowering indoor air temperatureNet annual costN/ADifferent lifespans for different measures (e.g., 30–40 years for different components)Energy price development and discount rateSweden; Swedish residential building stock (RB)
[23]Multi-story school buildings1945–1990 Alpine regionCalculated based on ÖNORM 8110-5 (Austrian standard)Building envelope insulation and four different heating systemsNPV of saved heat demandNPV of saved heat demand30Energy price, its increase, renovation costAlpine region; school buildings with similar characteristics
[25]MFD1960–1980 Malmö, SwedenOPERA (Optimal energy retrofit advisory)Attic floor and external wall, new windows and heating systemsNPVNPV50Energy price annual incrementsSouthern Sweden; MFDs with similar characteristics
[27]MFD1900–1950, EstoniaIDA (transient, whole building energy model)Attic floor, facade and basement floor, new doors and windowNPVNPV20N/AEstonia; wooden buildings, from same vintage (RB)
[28]MFD1970, Northern SpainN/SInsulation of envelope, heating system and ventilationNPV of LCCNPV of LCC60N/ASpain; MFD constructed during 1940–1980
[33]MFD1960, Northern SpainTRNSYS (transient, whole building energy model)Façade and roof and new windowsNPVN/A30N/ASpain; MFD of similar characteristics
[20]MFDVintage N/S, Norrköping, SwedenCalculation, using heating degree dayAttic floor insulation and heat pump of different sizesPVPV50Energy priceSweden, Norrköping, MFD with similar characteristics
[34]SFD, MFD1950–1970, ItalyNational values of final energy useTwo levels of standard and advanced renovation of walls, roof and windows; HVAC and energy systemsN/AN/SN/SN/AItaly; building from same vintage (RB)
[24]MFD1976 to 1982 PortugalN/SDifferent heating systems, renewable energy source, insulation of wall, roof and floor and new windowsGlobal cost (i.e., NPV of energy cost + renovation cost)Global cost (i.e., NPV of energy cost + renovation cost)N/ADifferent discount ratesPortugal; buildings with similar characteristic
[35]Detached houseVintage N/A; Central GreeceN/SRoof, external wall, basement, new doors and windows, heating system, lighting, electric appliances and cooling system.NPV; internal rate of return; savings to investment ratio; depreciated payback periodN/ABetween 10–30 years, depending upon the measuresDiscount rates between 4% and 8%Central Greece; detached houses with similar characteristics
[36]MFD1995, East coast of ChinaDoe-2 (transient, whole building energy model)New windows, adding insulation on roof and exterior walls, paining facade with light colour, closing the external staircaseLCC calculationN/A40N/AEast coast of China; buildings with similar characteristics
[37]MFDRow houses from 1973, Apartment buildings from 1963–1973, SwedenIDA (transient, whole building energy model)Attic floor, exterior walls, 3-glazed windows, balanced ventilation with heat exchangerN/SN/A50N/ASweden, Stockholm; buildings with similar characteristics
[38]Residential, hospital and educational buildingsFrom 1880–1980, Northern GreeceN/SAdding insulation on exterior walls and roof and new windows and heating systemDepreciated payback period and saving to investment ratioN/A70Yes;energy price variationNorthern Greece; Buildings with similar characteristics
[39]Single-family houseVintage N/S, ItalyN/SRoof and walls insulation, heating systems, solar collector, and windowsGlobal cost based on NPVGlobal cost based on NPV30N/AEast coast of Italy; Buildings with similar characteristics
[40]Two typical School buildingsBefore and after 2000, Tehran, IranDesignbuilder (transient, whole building energy model)Better insulation, new windows, shading, BMS and solar energyPayback timeN/ANot applicableN/AIran, Tehran; School buildings from the same vintages (RB)
[41]Brick apartment building1960, FinlandIDA (transient, whole building energy model)Exterior walls and roof, new windows, different energy system and HVAC systemsNPV of LCC during lifespan vs initial investment costSBO, using multi-objective building performance optimization25Interest rates of 3% and 7%Finland; brick apartment buildings with similar characteristics
[42]Educational buildings1960s and 1970s, FinlandIDA (transient, whole building energy model)Exterior walls and roof, New windows, Energy systemsNPV of LCC during lifespan vs initial investment costMinimization of NPV of LCC, using SBO20Energy price increase of 2%, 5%, 8% and 9%Finland; Educational buildings, during 1960 to 1979 (RB)
[43]MFDBefore 2000 (1990s), TurkeyEnergy plus (transient, whole building energy model)Insulation on building envelope and replacing windowsLCC analysisN/A50 years as total lifespan of buildingsN/ATurkey; MFD with similar characteristics
[44]Office buildingsBetween 1920 and 1970, South of ItalyEnergy plus (transient, whole building energy model)EEMs of building envelope, HVAC and renewable energy sourcesGlobal cost saving (primary energy saving and investment cost)Global cost saving (primary energy saving and investment cost)20Incentives for PV panel installationSouthern Italy, office buildings, between 1920 and 1970 (RB)
[45]MFD50-year old building, South AfricaN/SEEMs for envelope components (windows, roof walls) and solar panels on roofNPV of energy saving and retrofit costPayback period24Discount rates of 9% and 8.1%South Africa, MFDs with similar characteristics
[46]MFDItalyTRNSYS (transient, whole building energy model)EEMs for building envelope components and heating and ventilation systemN/AMulti-objective optimization: Genetic algorithm30Windows orientation, building compactness and locationMilan and Messina of Italy; MFDs with similar characteristics
[47]MFDSheffield, England, late 1950sEnergy plus (transient, whole building energy model)Building envelope insulation and windows replacementN/AMulti-objective Genetic algorithm to minimize LCCF and LCC60Two heating systemsEngland, Sheffield; MFDs with similar characteristics
This studyMFD1967, SwedenVIP-Energy (transient, whole building energy model)Exterior walls, attic floor and basement walls and new windowsNPP (net present profit)NPP (net present profit)50Discount rates of 1%, 3%, 5%, Climate zones of SwedenSweden; all Swedish climate zones; MFDs from same vintage
MFD: multi-family dwelling; SFD: single-family dwelling; N/A: not available; N/S: not specified (shall be available but not specified in the literature); LCA: life cycle analysis; LCC: life cycle cost; NPV: net present value; LCIA: life cycle impact assessment; GWP: global warming potential; SBO: simulation based optimization; MBS: building management system; RB: representative buildings analyzed; LCCF: life cycle carbon footprint; EEM: Energy Efficiency Measures.
Table 2. Building envelope characteristics: exterior walls.
Façade OrientationThe Area (m2)ComponentsU-Value (W/m2K)
South facade16070 mm of lightweight concrete + 100 mm of mineral wool + 120 mm of brick cladding0.29
North facade220
West facade107140 mm of ordinary concrete + 100 mm of mineral wool + 120 mm of brick cladding0.34
East facade107
Table 3. Building envelope characteristics: basement walls.
Façade OrientationThe Area (m2); above the Ground LevelThe Area (m2); below the Ground LevelComponentsU-Value (W/m2K)
South facade38110300 mm of ordinary concrete + 50 mm of mineral wool0.63
North facade22
West facade12
East facade18
Table 4. Building envelope characteristics: windows.
Façade OrientationThe Area (m2)U-value (W/m2K)
South facade1272.9
North facade55
West facade7.5
East facade6.5
Table 5. Building envelope characteristics: attic floor.
The ComponentsThe Area (m2)ComponentsU-value (W/m2K)
Attic floor (the slab)400200 mm of ordinary concrete and 150 mm of mineral wool0.25
Table 6. Energy efficiency measures for building energy renovation.
Building Envelope ComponentsEnergy Efficiency MeasuresThe Range of Considered Thicknesses (mm) for Additional Insulation and U-values (W/m2K) for New Windows
Exterior walls of the facadeAdditional mineral wool
(λ-value = 0.034 W/mK)
45–340
Basement wallsAdditional insulation panel of EPS
(λ-value = 0.039 W/mK)
70–300
Attic floorAdditional mineral wool
(λ-value = 0.037 W/mK)
50–500
WindowsChanging existing windows and replacing with more efficient windows1.2–0.6
Table 7. Additional insulation materials on exterior walls, assuming a 3% discount rate and a 50-year lifespan (an example for the calculation steps).
Energy Efficiency Measure for Exterior WallsFinal Energy Demand for Space Heating, kWh/yearNPV of Final Energy Price for Space Heating (50 years), €Investment Cost (cost of the measures’ implementation), €NPV of Saved Energy (50 years), €NPP, €
Initial state (Climate Zone 4)120,117310,670000
45 mm mineral wool110,275285,21587,00025,455−61,545
70 mm mineral wool107,374277,71288,40032,958−55,442
95 mm mineral wool105,287272,31589,50038,355−51,145
120 mm mineral wool103,704268,21990,40042,451−47,949
145 mm mineral wool102,460265,00391,60045,666−45,934
170 mm mineral wool101,469262,43992,70048,231−44,469
195 mm mineral wool100,640260,29594,10050,375−43,725
215 mm mineral wool100,018258,68795,60051,982−43,618
240 mm mineral wool994,56257,23397,50053,437−44,063
265 mm mineral wool98,938255,89399,30054,777−44,523
290 mm mineral wool98,479254,707100,90055,963−44,937
340 mm mineral wool98,006253,482102,90057,188−45,712
Table 8. Optimum insulation thickness (mm) and windows U-value W/m2K for the energy renovation of building envelope components, in different zones and for different discount rates.
Climate Zone1234
Discount Rate135135135135
Attic floor350250150320250120300220100290200100
Basement walls210190160200180150200170140190160120
Exterior walls290260240280250230270240220260220200
Windows1.21.21.21.21.21.21.21.21.21.21.21.2

