Creating a Resource Cadaster—A Case Study of a District in the Rhine-Ruhr Metropolitan Area


Resource Efficient Building, Ruhr-University Bochum, Universitätsstraße 150, 44801 Bochum, Germany
*
Author to whom correspondence should be addressed.
Buildings 2017, 7(2), 45; https://doi.org/10.3390/buildings7020045
Submission received: 14 February 2017
/
Revised: 30 May 2017
/
Accepted: 31 May 2017
/
Published: 2 June 2017
Abstract
:Today, both resource efficiency in general and the efficient use of natural resources specifically in the building sector are major political issues. Recent studies on resource efficiency have found the “anthropogenic stock” of the building sector to outweigh natural resource stocks. To make the anthropogenic stock accessible, material quantities with their individual composition need to be estimated and extrapolated to regional level. A geographical information system (GIS) is used as tool to handle the building specific data and combine them on regional level to calculate the anthropogenic stock. The resulting resource cadaster reflects the material quantities, divided into sixteen material fractions, of a specific residential district in the Rhine-Ruhr metropolitan area—a typical urban area in Germany. The case study area was weighted in total between 103.5 kt and 93 kt, depending on the dataset. This paper offers a step-by-step description of this approach, whereby a consistent dataset was created throughout the process of data collection and validation. In order to demonstrate the broader application of the resource cadaster, the results were extrapolated to the residential building sector of the entire federal state of North Rhine-Westphalia. In highly concentrated areas, like the Rhine-Ruhr Metropolitan area, both area-wide classification of material quantities and their regional localization are necessary to make the anthropogenic stock accessible. Information about toxic substances, however, also needs to be included in the process of data collection. This method of mapping could thus provide the foundation for future (re)uses of this stock. This study offers some concrete steps in the direction of achieving a circular economy.
1. Introduction
Worldwide depletion natural resources and increasing global demand have pushed the efficient use of natural resources into the political forefront [1]. “The Roadmap to a Resource Efficient Europe”, proposes pathways for increasing resource productivity, for example by decoupling economic growth from primary resource use [2]. A flagship initiative with the aim of creating a “circular economy,” resource efficiency is to be achieved by creating a recycling society [2,3]. The traditional linear economy, based on the principle of “take, make, consume, and dispose” [4], created a so-called “anthropogenic stock” estimated to outweigh the natural resource stock [5]. This new understanding caused a shift in interest away from taking only natural resources into account to focusing on the anthropogenic stock and its uses and reuses. In urban areas, the anthropogenic stock consists of buildings, transport infrastructure, manufacturing capacity, and durable goods [6,7]. According to Krausmann et al. [8], construction minerals account for the highest extraction rate of raw materials worldwide; thus, the building stock has been identified as the largest material stock [9]. Due to lifestyle changes during the timeframe from 1900–2005, the extraction rate rose from 667 to 22.931 mio. t per annum [7,8]. The second significant aspect in terms of the construction industry is the waste industry, as construction and demolition waste (CDW) generates about 25–30% of all waste in the EU [1]. In order to promote the idea of a circular economy, the EU considers CDW a priority waste stream with a high potential for re-use and recycle [10]. By preparing non-hazardous CDW for reuse and recycling, the minimum reuse target of 70% (by weight) by 2020, as defined in the Waste Framework Directive 2008/98/EC, should thus be met [11]. While the EU target has already been reached in Germany, further action is still needed to achieve a circular economy. The identification of CDW as a potential secondary resource prompted a number of studies in which the potential stream of CDW was modeled or calculated on the base of statistical data [12,13,14,15].
Closely coupled to resource protection and a circular economy, resource efficiency requires a reliable management system. The term “urban mining” includes not only urban areas as deposits for anthropogenic stocks. Flamme [16], instead, defines the concept of urban mining as a four-pillar model, consisting of the identification, the quantification, the mapping, and the recycling potential in the context of technical and economic feasibility.
The urban mining strategy provides a systematic management system in alignment with the concept of a circular economy [17]. This strategy requires information about both material and substance. Therefore, the stock has to be analyzed and a “cadaster of secondary resources” needs to be created, compromised of the following information: location, flows and stocks, density, speciation, partner elements, and dissipative losses [18]. Material flow analysis (MFA) and substance flow analysis (SFA) offer suitable methods for characterizing material stocks and flows in buildings within geographic segments and time boundaries. While MFA is utilized to identify composite flow of different materials, SFA is applied to investigate specific substances [19]. Furthermore, within these analytic methods, there are two different approaches: the “top-down” approach, and the “bottom-up” approach. In the top-down approach, for the most part, statistical data is used in combination with end of operation time for specific products to characterize input-flows against output-flows and to determine the in-use stock, which, is considered as “black box” model. The bottom-up approach determines the units for specific products and their composition. Compared to the top-down approach, the bottom-up approach is both more time-consuming and more detailed, as it requires field inspections and construction plan analysis [19,20,21]. Although the chosen approach should produce similar results when accurately conducted [20], not all results of the conducted studies are comparable as the reference parameters vary greatly.
Several studies have been carried out to assess the material stock for different categories, including building stock. The top-down approach is often taken when characterizing the material stock for global and nationwide extrapolation. For example, Spartari et al. [19] investigated the copper stock in North America over the data period from 1900–1999, including the building and construction categories, as well as the transport category. Gordon et al. [22] tallied the copper stock of the USA by using historical data from 1900 until 2000 that accounted for the following categories: building and construction, infrastructure, domestic and industrial equipment, and transport. In order to determine the steel stock of Japan, Daigo et al. [23] employed three different related terms: in-use stock, obsolete stocks, and overall stock. Using the top-down approach, Krausmann et al. [8] calculated the global growth of material use in relation to the gross domestic product and population for the twentieth century, thereby quantifying the following materials: biomass, fossil energy carriers, ores, industrial minerals, and bulk minerals used in construction. The study by Fishman et al. [24] assessed the national material stocks for timber, minerals, iron, and other metals of the United States and Japan. The same study concluded that the total material stock in the United Stated is larger than in Japan, which they interpreted as a consequence of the different histories of industrial development in those countries. Marcellus-Zamora et al. [25] estimated the materials stock by land-use type in historic urban buildings for an area of 2.6 km2 in Philadelphia, Pennsylvania. Further studies that include the building category were conducted on the basis of the top-down approach and can be referred to for the materials copper [26], steel, concrete, and minerals [27].
Bottom-up studies were conducted to investigate divergent materials within the building stock of various localities. Gruhler et al. [28] applied a bottom-up approach to investigate the residential building stock in Germany. Within the study, constructions plans for around sixty buildings were analyzed, focusing on the materials found in detail level of cost type 300 of DIN 267-1 [29]. These were further classified into ten different material categories, whereby the material intensity was calculated on the basis of the areas defined in DIN 277-1 [30]. Within this study, building typologies were created and applied to ten multi-family houses (MFH) for the construction period from 1880 to 1990, and to eight single-family houses (SFH) for the construction period from 1960 to 1990. On the basis of statistical data, Hashimoto et al. [31] quantified the building stock in Japan through relating the building stock in physical term per unit floor space to the material intensity rates for multiple types of buildings. Furthermore, their study provides a projection of the material stock growth in Japan until 2030 and investigates the following construction minerals: asphalt, sand, gravel, and crushed stone. Additionally, Hashimoto et al. [12] estimated the future potential waste and secondary resources for construction minerals in Japan.
By combining statistical data and analyzing construction plans, Lichtensteiger and Baccini [32] carried out a bottom-up study to characterize the building stock of Switzerland during the twentieth century. Their analysis classified the buildings according to four structural engineering classes of different construction periods: one-family buildings (here SFH), multi-family buildings, service buildings, and production buildings, and accounted for four time spans of twenty-five years (1900–1925, 1926–1950, 1951–1975, and 1976–2000). Based on this data, a 4-by-4 matrix was created and a model building was assigned to each combination of building class and period. The model building contains typical material values, although these are limited to gravel/sand, marl/clay, cement, timber, and copper. Schebek et al. [33] and Ortlepp et al. [34] limited their research to the non-residential stock and performed case studies in different areas of Germany to estimate the material stock. Schiller et al. [35] estimated the total material stock in Germany for the following material groups: mineral materials, metals, plastics, wood, and other. Their top-down and bottom-up study covers four different sectors: buildings, service, infrastructure, and goods. In the residential building sector, the mineral materials formed the largest part of the material stock. There are also bottom-up studies that focus on the metal stock of a nation [36]. Furthermore, in 2007, Wang et al. [37] formulated the anthropogenic iron cycle, concluding that the largest amount of iron in Europe can be found in landfills. Kral et al. [38] compared the copper metabolism of Taipei and Vienna, whereby the main difference was in the amount of stock.
As the quantity of studies shows, MFA has proven to be a suitable method for characterizing the urban material stock in the building sector. The exact material composition of the building stock, however, is still not well known [39]. To visualize the spatial distribution of the material stock and to fulfill the conditions for urban mining, a cadaster needs to be created. Zhu [21] illustrates the benefits for urban mining of employing geographical information systems (GIS) on three levels: spatial visualization, spatial data management, spatial analysis and modeling. Wallsten et al. [40] deliver an example of how GIS can be used to prospect the dormant copper stock in Linköping, Sweden. Kleemann et al. [41] used GIS to analyze the material stock in buildings of Vienna. In a further study by Kleemann et al. [42], GIS is presented as alternative tool for detecting and identifying the amount of the CDW stream created through demolition of buildings that were not reported to the municipal department and thus do not appear in official statistical data. Tanikawa [43], created a 4d-GIS model by not limiting the study only to constructions on and above ground level, but by also including underground constructions.
The residential building stock can be characterized by differences in age, type, and location. In this context, it is useful for our purposes that previous studies have defined buildings according to their typical construction characteristics and material compositions. (e.g., [28,32,44,45,46]). Kleemann et al. [45], for example, combine this data with GIS to analyze the material stock of Vienna. A resource map for different materials was created on the basis of the combined data, showing the exact position and amount of the resource material that will become available at the end of the building’s life cycle. Mastrucci et al. [47] chose a different method for calculating the material stock in combination with GIS. In this study, the building’s floor area is determined on the one hand by two coefficients as a function of the building’s volume. On the other hand, 3D-modeling determined the building’s volume, whereby the height of a building was determined through calculating the difference between the highest roof point and the ground surface. While a review of the literature shows that most studies examine either only specific resources or input and output material flows on a national level. (e.g., [12,14,23,26,28,31,35,36,48,49]), Kleemann et al. [41] and Schneider et al. [13], examine the material flow in the building sector on the city level (Vienna and Zurich, respectively). The present study examines material quantities for a typical urban area in Germany. To make the stock accessible material quantities with their individual composition need to be estimated and extrapolated to regional level. The reusable and recyclable material stock available in residential buildings depends both on their specific structure and on date of erection. In this case study, we first identified the relevant characteristics, then combined this information with appropriate data culled from previous studies, and finally entered this information in a GIS database to create a regional resource cadaster. The objective of this paper is to show a detailed and site specific approach for identifying quantities of material stock available in specific residential buildings, and thus to provide a foundation for developing further concepts for using anthropogenic stock as secondary material in the building sector. Only after a regional cadaster exists that provides a relatively exact quantification of the composition of available material can concepts be created to reuse the material, for example, when dismantling and transferring recycled material to another regional building site.
2. Method
The presented method shows the generic framework for assessing the material stock available in residential buildings in combination with GIS. Implementation is based on the following methodological approach:
- Determining the buildings structure by GIS
- Validating data
- Determining the construction years
- Reviewing data on material values from previous studies
- Analyzing the material intensities
2.1. Deteriming Building Structure by GIS
To determine the building structure in the study area, the following data are essential:
- Georeferenced vector polygon data, fitting to the built environment
- Attributes: floor count, roof type, function, and year of construction
Whereas the georeferenced vector polygons reflect the building’s footprint, the attributes allow for identifying the building’s characteristics. In Germany, the ALKIS–Dataset is available, which combines information from cadastral maps and registers. This dataset includes the attributes of floor count, roof type, and function. In addition, there is a 3D ALKIS model available in different detail levels, which allows for determining building heights. More information can be found in “Documentation on the Modelling of Geoinformation of Official Surveying and Mapping” of the AdV [50].
The vector (polygon) areas represent the building footprint (AShape, measure in m2). The calculation of the gross floor area (AGFA) of a building is to be carried out as follows:
2.2. Validating the Data
To achieve a minimum deviation and to avoid default values in the study, it is necessary to have a consistent dataset. In the first step, the attributes must be checked for completeness. In the second step, the attributes must be scrutinized for accuracy. This can be achieved through carrying out an on-site inspection. Therefore, preparations, such as datasheets with the existing attributes and a list of questions, are essential. Additionally, a camera can be helpful for documentation and for answering questions that arise later.
2.3. Determining the Construction Year
As the literature on material values shows, a building’s material stock is highly dependent on its year of construction. It is therefore, necessary to determine the year of construction.
In Germany, the first residential building catalogue was presented in 1990 by the Institute Wohnen und Umwelt (IWU). Under both the TABULA [51] and the EPISCOPE [52] projects, the typologies were revised and published in 2015. Even though the typologies were developed to determine the energy consumption due to the energetic status of a building, the publication also contains detailed information about period-specific building stock characteristics. These characteristics are defined depending on a certain construction period for single-family houses (SFH), terraced houses (TH), multi-family houses (MFH), and apartment blocks (AB). The catalogue defines twelve age classes over the time span beginning from before 1859 until today. Additionally, there are six special cases in the time span from 1946 to 1990 [44,52].
2.4. Material Stock
An analysis of a building’s material stock can be carried out empirically through analyzing the construction plans. A number of prior studies have generated characteristic values that provide orientation. Within the framework of the Leibniz Institute of Ecological Urban and Regional Development (IOER), Gruhler et al. [28] published representative building typologies with characteristic material intensity values mx (kg/AGFA). The study was limited to the materials listed in Table 1 and is abbreviated as IOER.
This study uses the IOER-method, which requires knowledge of the gross floor area AGFA in m2, which is then entered in the GIS dataset. The total appearance of each material x in kg/AGFA in relation to the total gross floor area of a building is to be calculated as follows:
The total weight of a building should be calculated as:
The second study, conducted by Lichtensteiger and Baccini [32] and abbreviated as ARK-method, delivers characteristic total values by house in relation to the construction period and to the structural engineering class. The study is limited to the materials listed in Table 1.
The ARK-method requires knowledge of the construction period and structural engineering classes, which is then entered in the GIS dataset. Information gaps must be filled in. Calculating the total material value in a building should be based on Equation (2).
3. Case Study
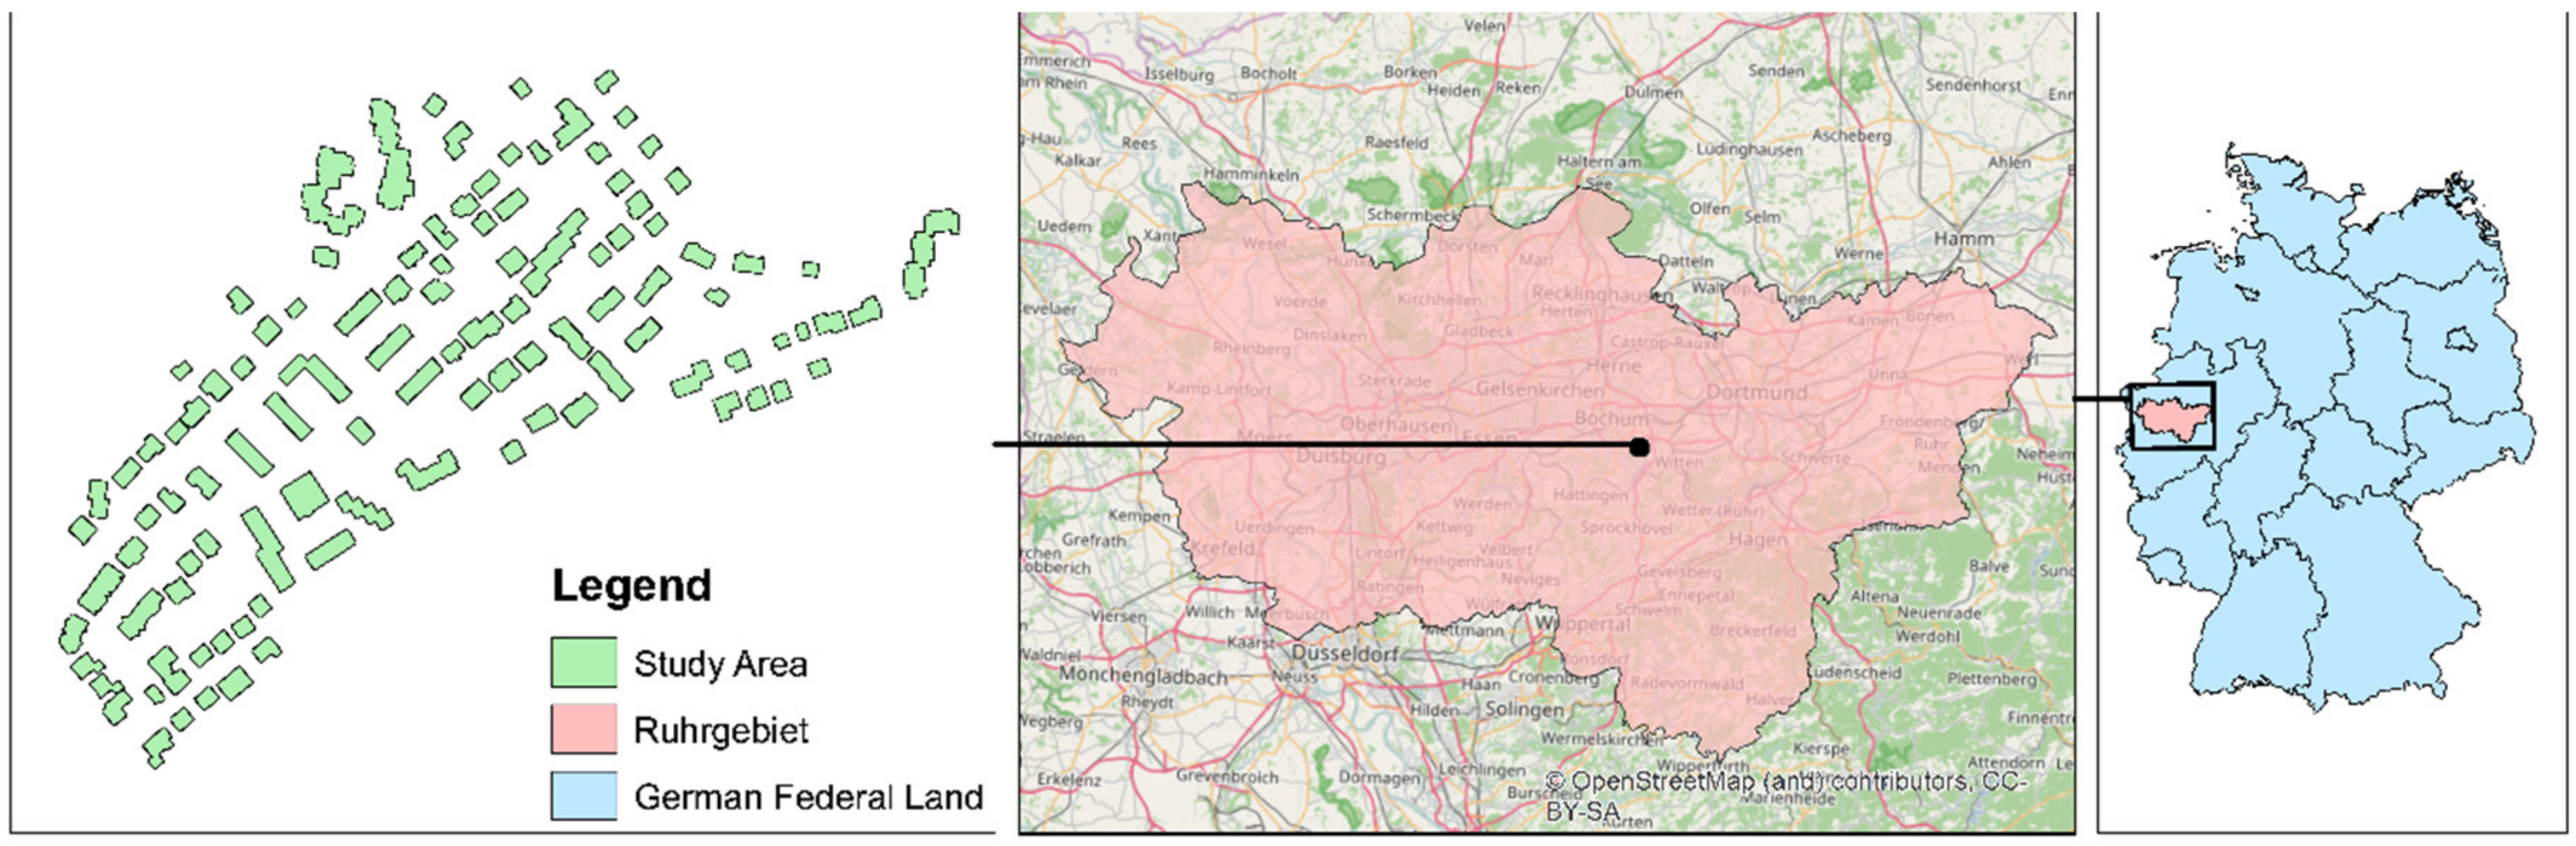
The Rhine-Ruhr metropolitan area, with its 5.05 million inhabitants, is the fifth largest conurbation in Europe and is located on the western edge of Germany. The metropolitan region covers an area of 4436 km2 and has a polycentric structure [53]. Bochum, a city located in the center of the Rhine-Ruhr metropolitan area, contains approximately 7% of the region’s inhabitants and covers approximately 3% of its area. Bochum’s population density is 2552 person/km2 [53,54,55]. We chose a typical residential area in Bochum for our case study. In an area of 0.175 km2, there are a total of 380 structures with a built gross area of 33,675 m2. Figure 1 shows the location of the study area.
3.1. Approach
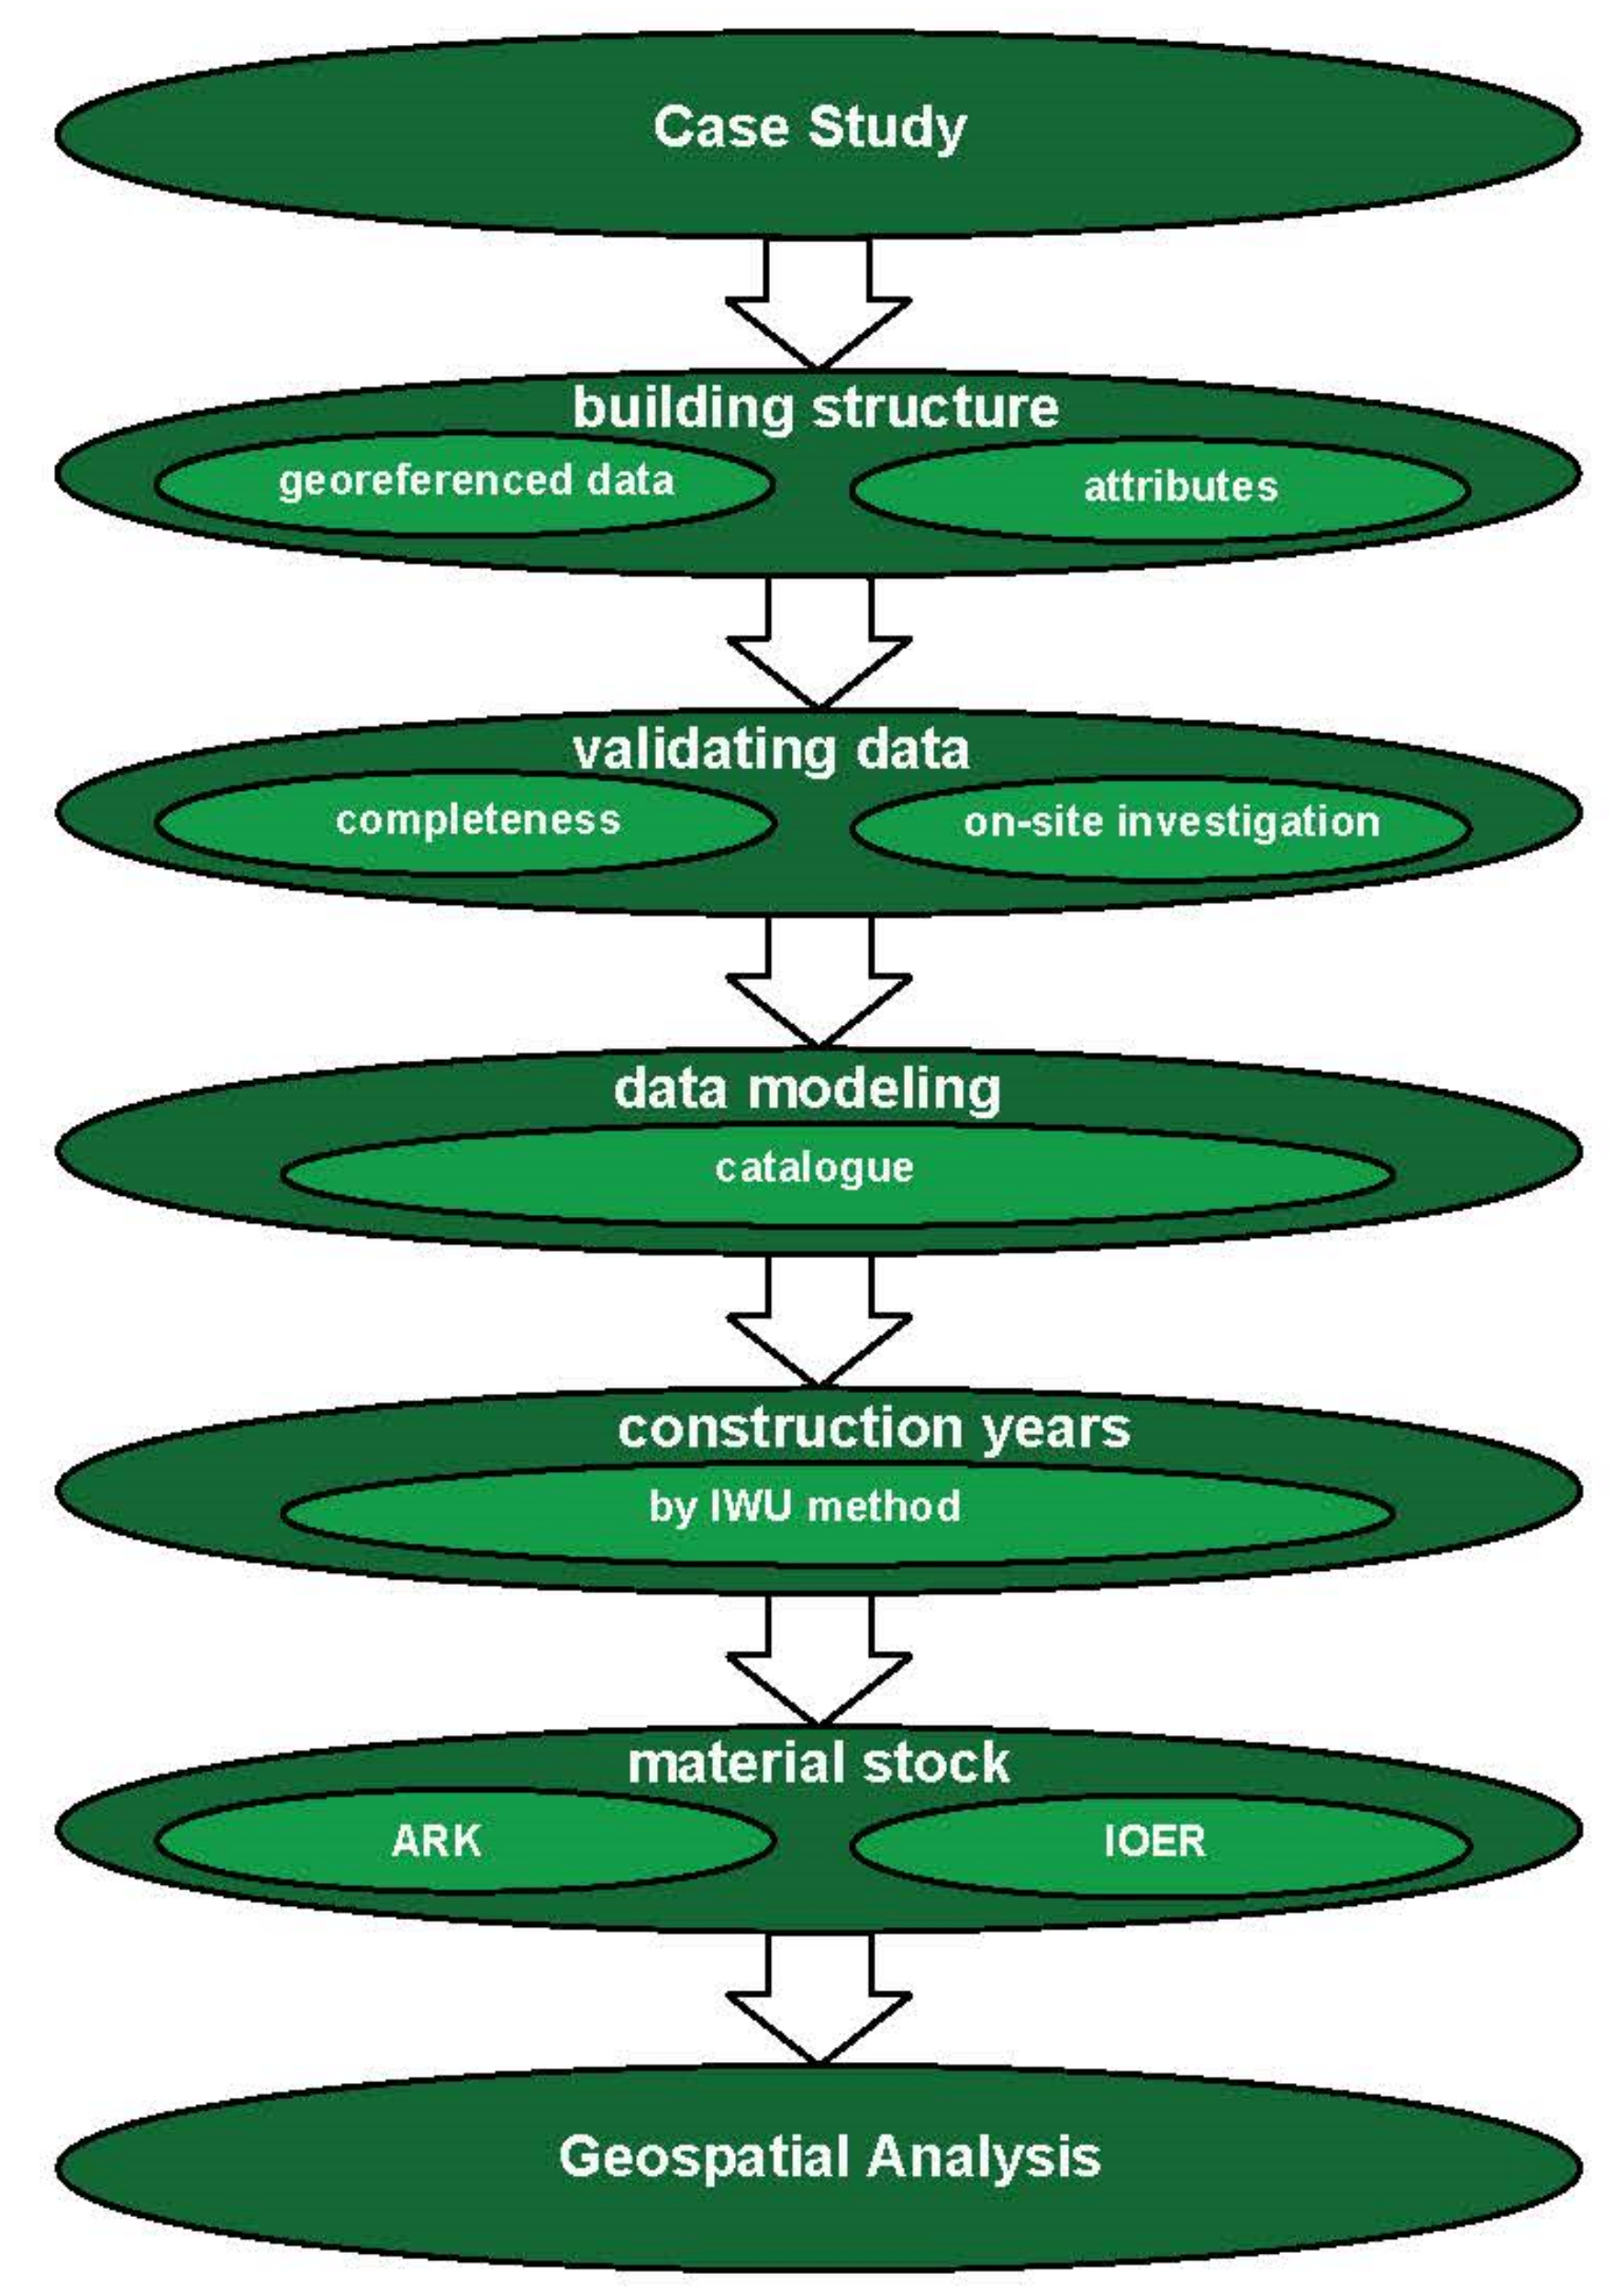
The aim of this study is to calculate the material quantities of residential buildings and to extrapolate the results to a wider region. Therefore, a homogeneous database needed to be created. In the first step, the spatial data, provided by the city of Bochum, were reviewed. As some data were missing or undefined, an on-site investigation was deemed necessary and was carried out. The on-site investigation allowed us to determine the characteristic information for each house. The collected information was entered in the database, which could then be entered in the GIS. The collected data could later be combined with the spatial data. The general procedure in this study is shown step by step in the Figure 2.
3.1.1. Determining the Building Structure
The building structure is first determined on the base of the ALKIS model, which was provided by the city of Bochum. The project’s GIS basic coordinate system is ETRS_1989_UTM_Zone_32N. In the second step, the georeferenced vector polygons were attached to the attributes: floor count, roof type, function and year of construction. The gross floor area for each building was calculated using an analysis tool to calculate geometry. The total gross floor area was calculated by multiplying the gross floor area by the total number of floors.
3.1.2. Validating the Data
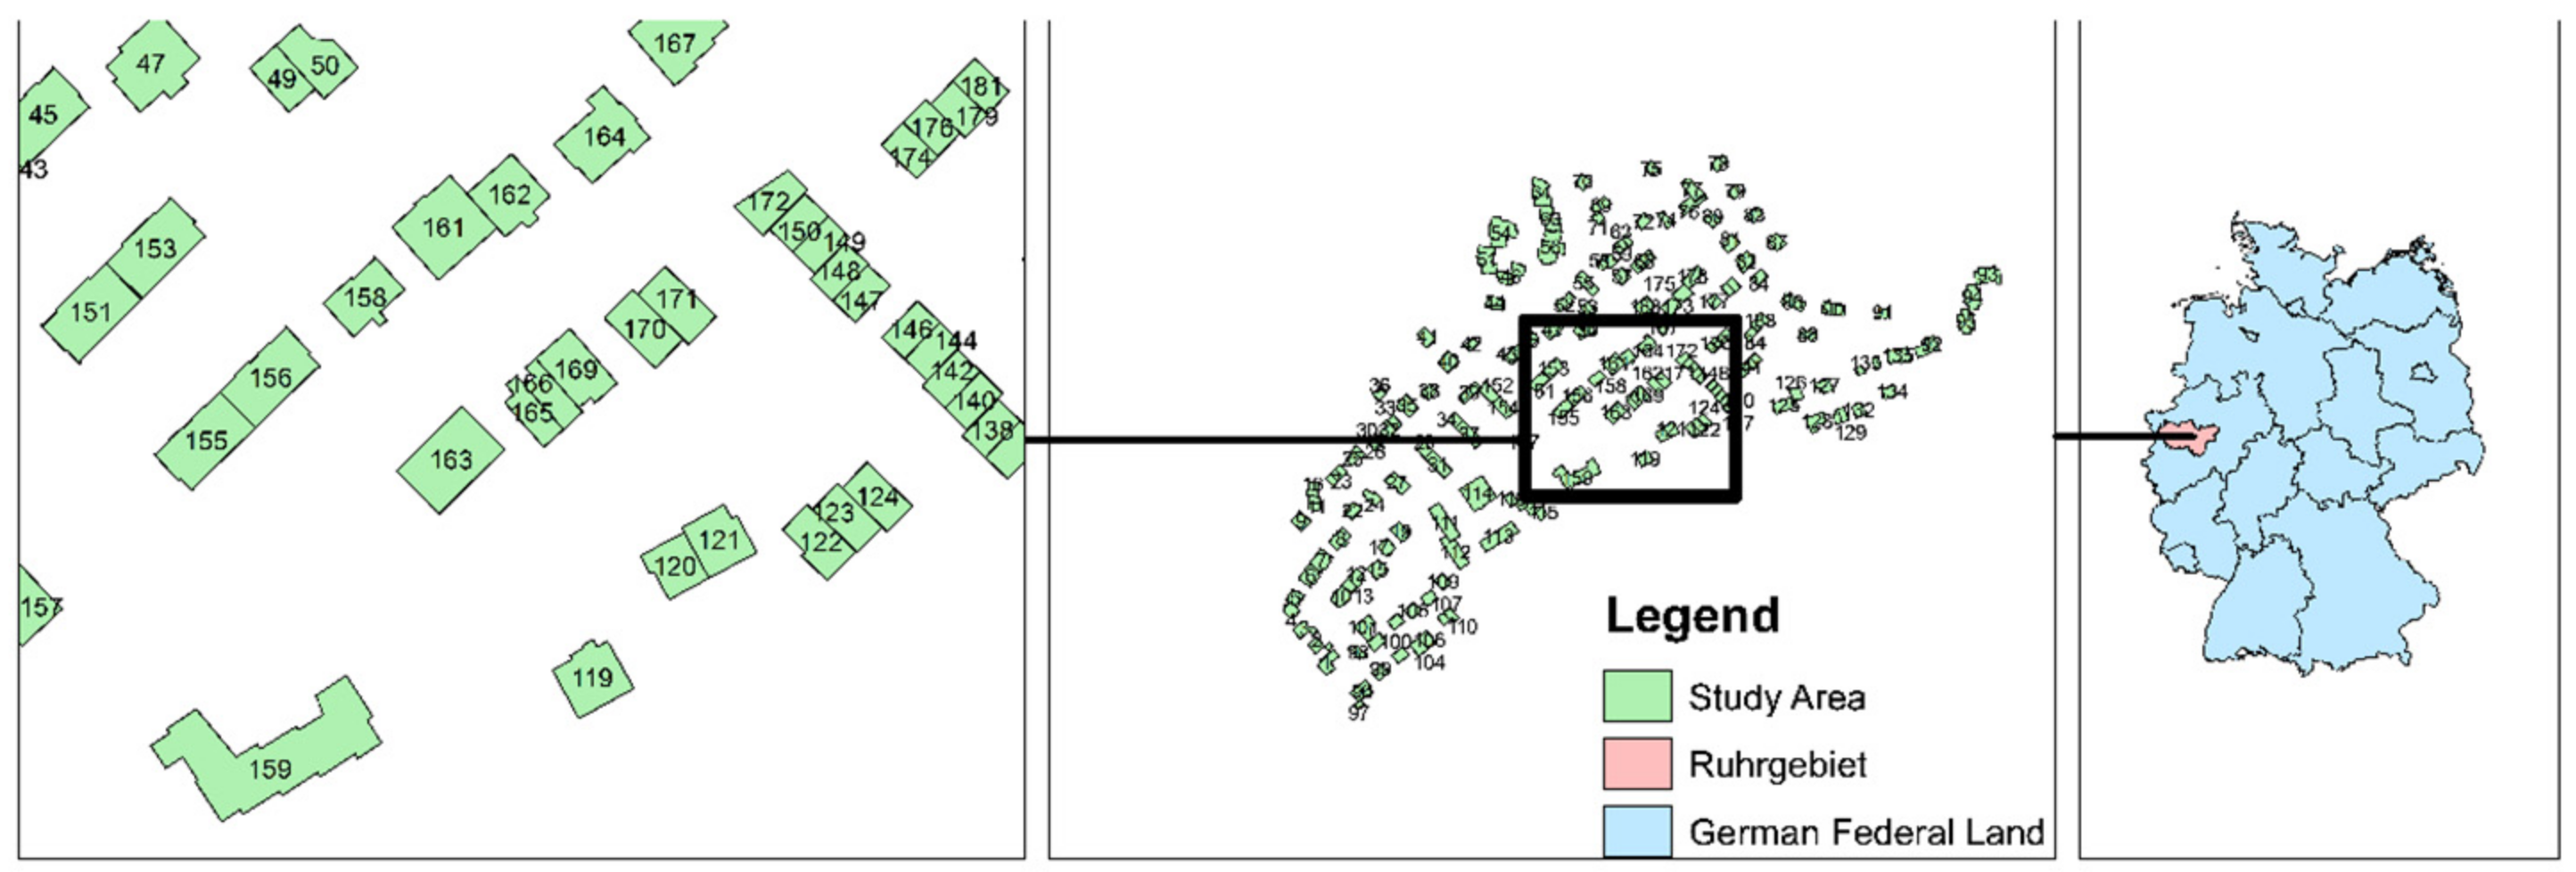
When setting up the GIS project, the dataset was checked for completeness. In the first review, we found no information on the attribute of construction year. Other attributes were also partly incomplete. Thus, an on-site investigation was conducted. A datasheet for each building and all already provided information (on the attributes) was generated. To be able to identify each building, each individual building was assigned by an identification number (ID). A plan view showing how this was conducted is depicted in Figure 3.
During the on-site investigation, each house was photographed. The ascertained information was prepared for use in the further process. To provide structured data digitalization and collection, a data model in the form of a catalogue was created.
3.1.3. Data Model
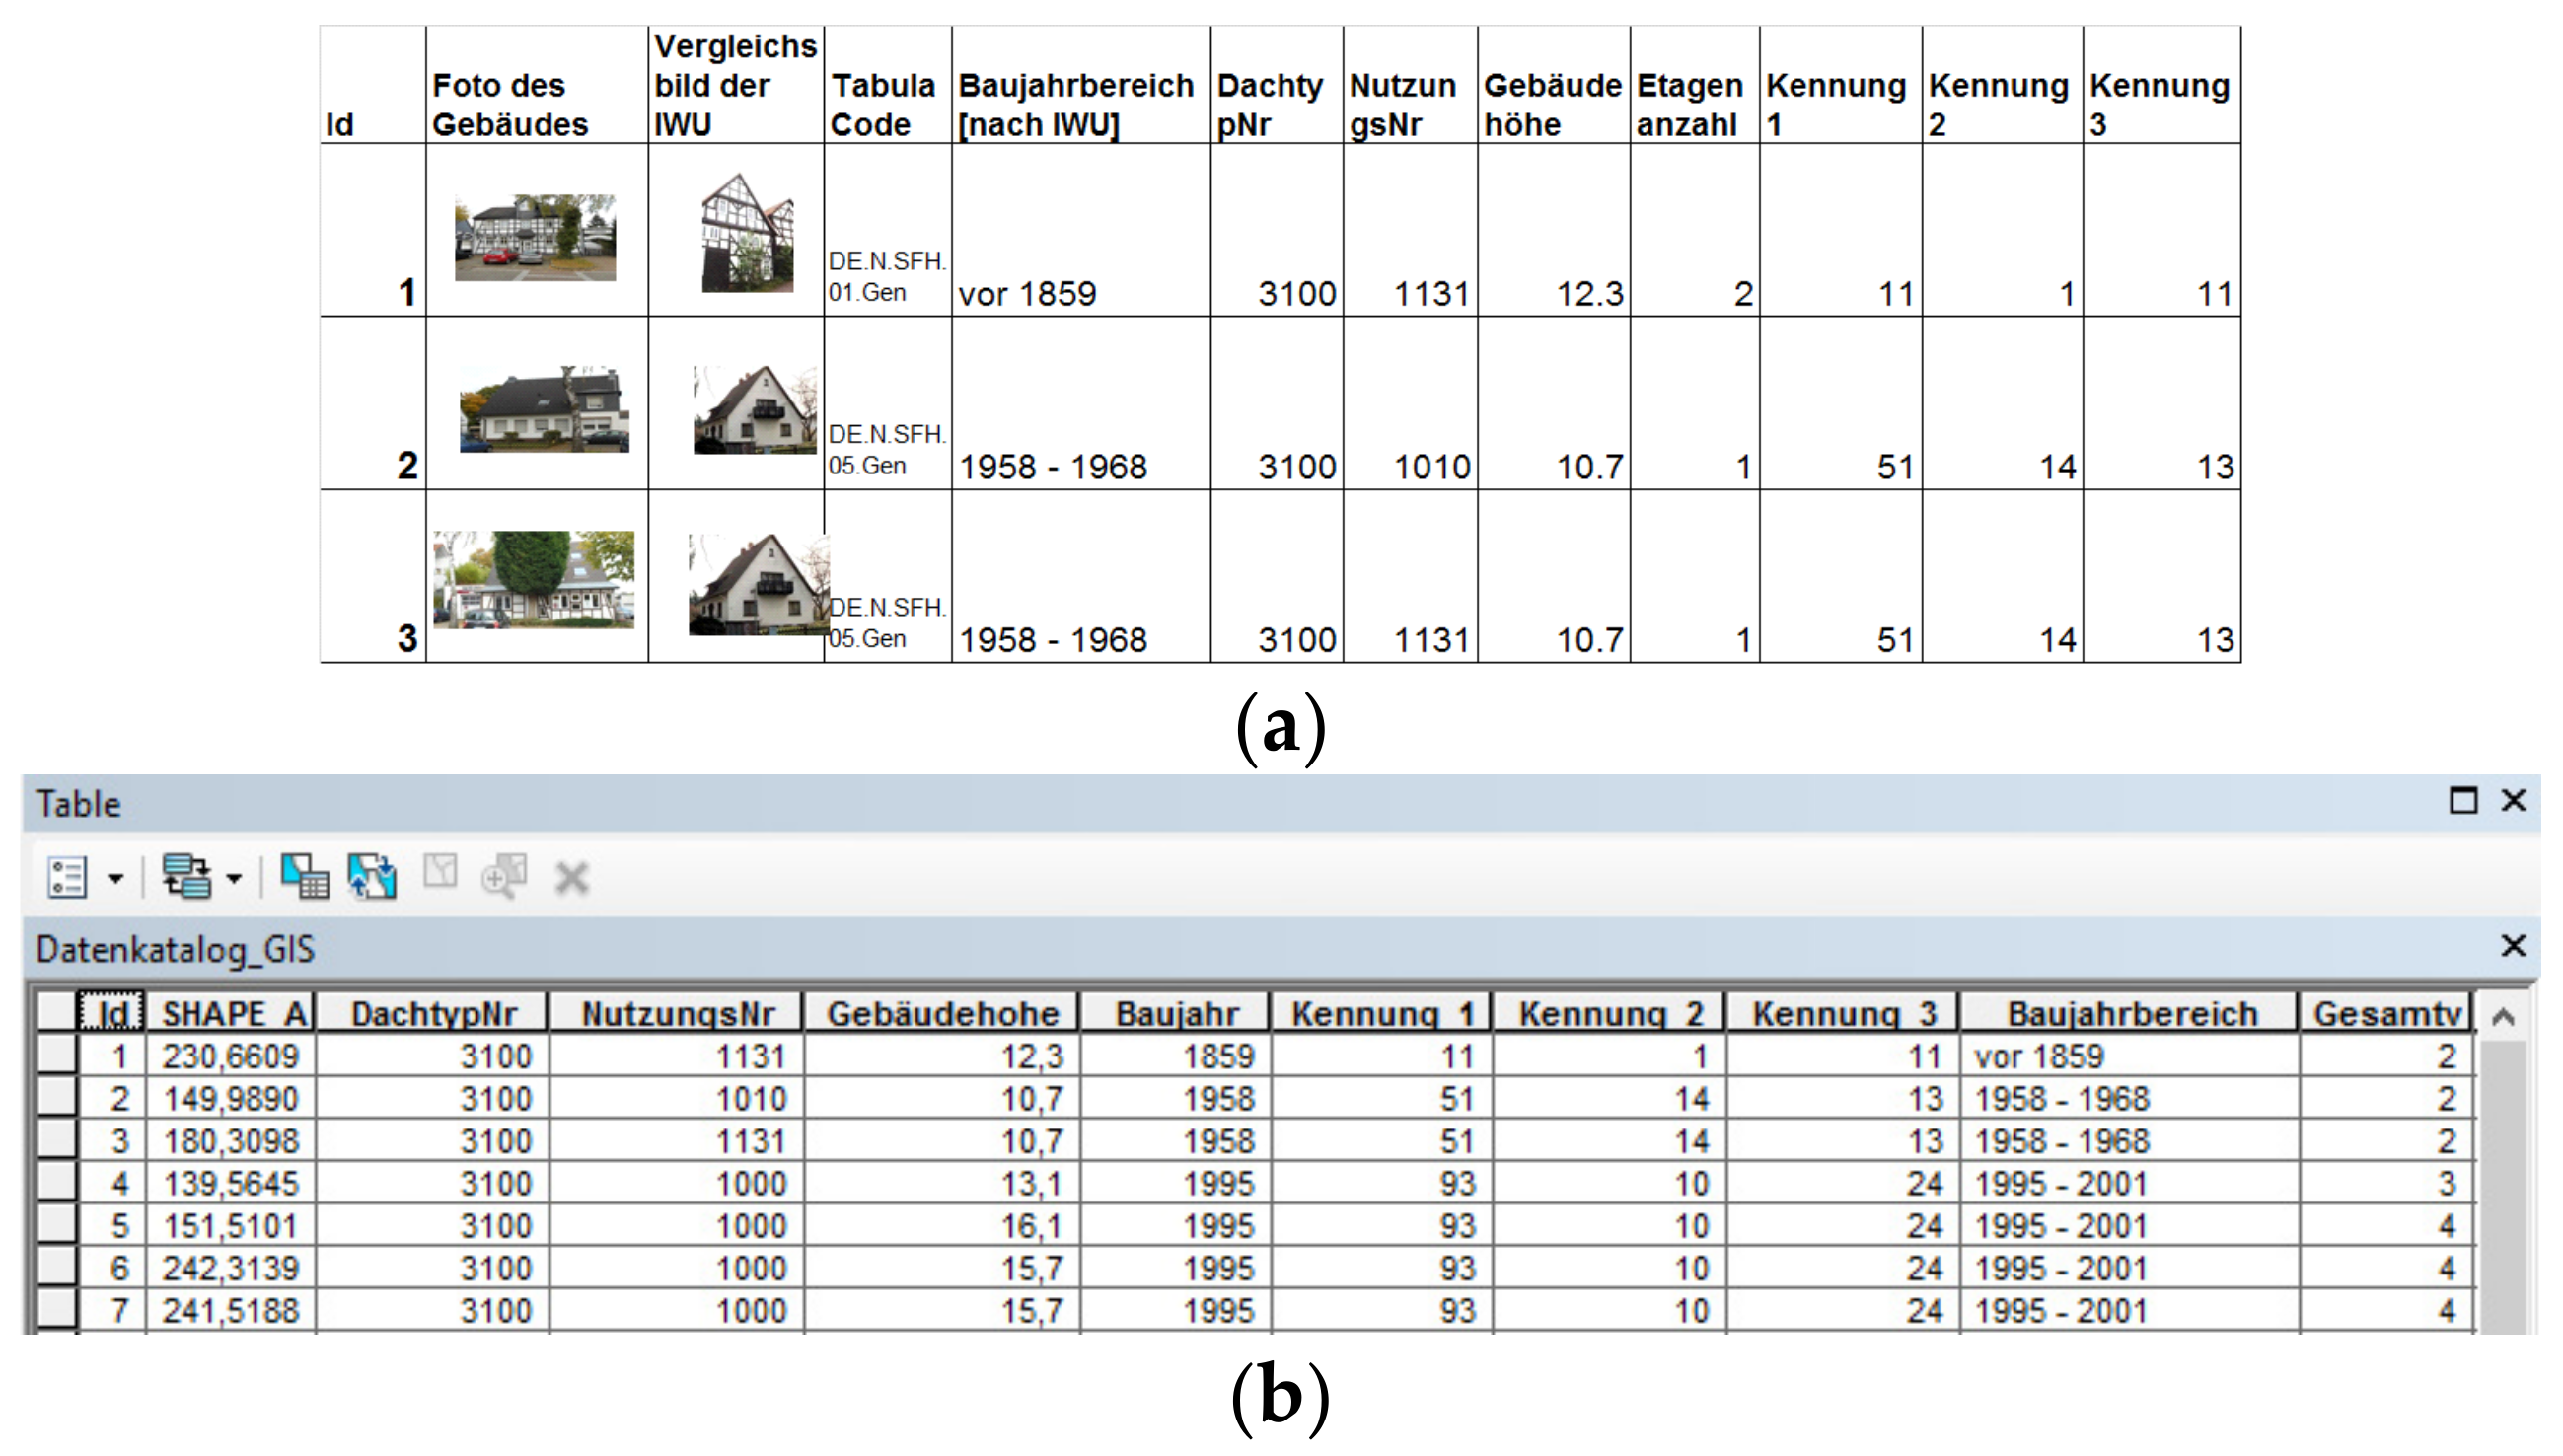
Keeping in mind that the digitalized information would be entered in the GIS, the data catalogue was created. The information documented during the on-site inspection was transferred into the catalogue, which included all additional information and a possibility for expansion. Figure 4 shows a sample structure in the data catalogue and in Figure 4b the data as entered in the GIS.
After completion, using the ID numbers, the georeferenced data can be combined with the GIS dataset. A homogeneous database is thus created, and the core procedure can be continued.
3.1.4. Construction Years
Determining the construction years of the building is essential for the further process. As the construction period range in both the IOER [28] and the ARK methods [32] are wide, it is possible to accurately determine the year of construction and thus to take IWU typologies into account. Determining the construction year of a building is conducted by analyzing the photo taken during the on-site inspection. In the first step, we estimated the building’s age by its visual appearance in comparison with the structural characteristics of a typical construction. We used identification codes to enter the determined construction period for every individual building into the data catalogue. The code thereby consists of two different encoding positions. Each construction period and each building type was given its own individual code. After entering the two encodes in the predetermined equation, the endcode was determined. The coding is thus built as follows:
3.1.5. Material Stock
Based on data from the relevant literature, we analyzed the material stock using the two methods discussed in Section 2.4. After determining the building type and construction period of each building according to the IWU-typology [44], the information was processed for further analyses. Additionally, to simplify further analyses, the building typologies/model buildings were provided with identification numbers. For the IOER-method, the encoding was processed using the typologies described in Gruhler et al. [28]. Generating the ID-numbers of the ARK-method was performed in accordance with the construction period and the building type. The ARK ID-number consists of two encode positions, whereby the first position provides information about the building type and the second position gives information about the construction period.
We assigned each building with a building typology/model building according to the descriptions used in the IWU-method. Thereby, the existing information provided the basic condition, meaning that only building typologies/model buildings that fulfilled these conditions were taken into account. The ID-numbers for each house were recorded in the data catalogue.
3.2. Results
By combining geospatial analyses with an on-site investigation, it was possible to estimate the building structure for 380 buildings in the study area.
The result of digitalizing the collected information during the on-site investigation led to 201 buildings with a built gross area of 7690 m2 being deleted from the dataset. The purged buildings either did not exist in reality or they were not classified as residential buildings, for example, structures such as garages or sheds. The final database consists of 179 residential buildings with a building gross area of 25,985 m2.
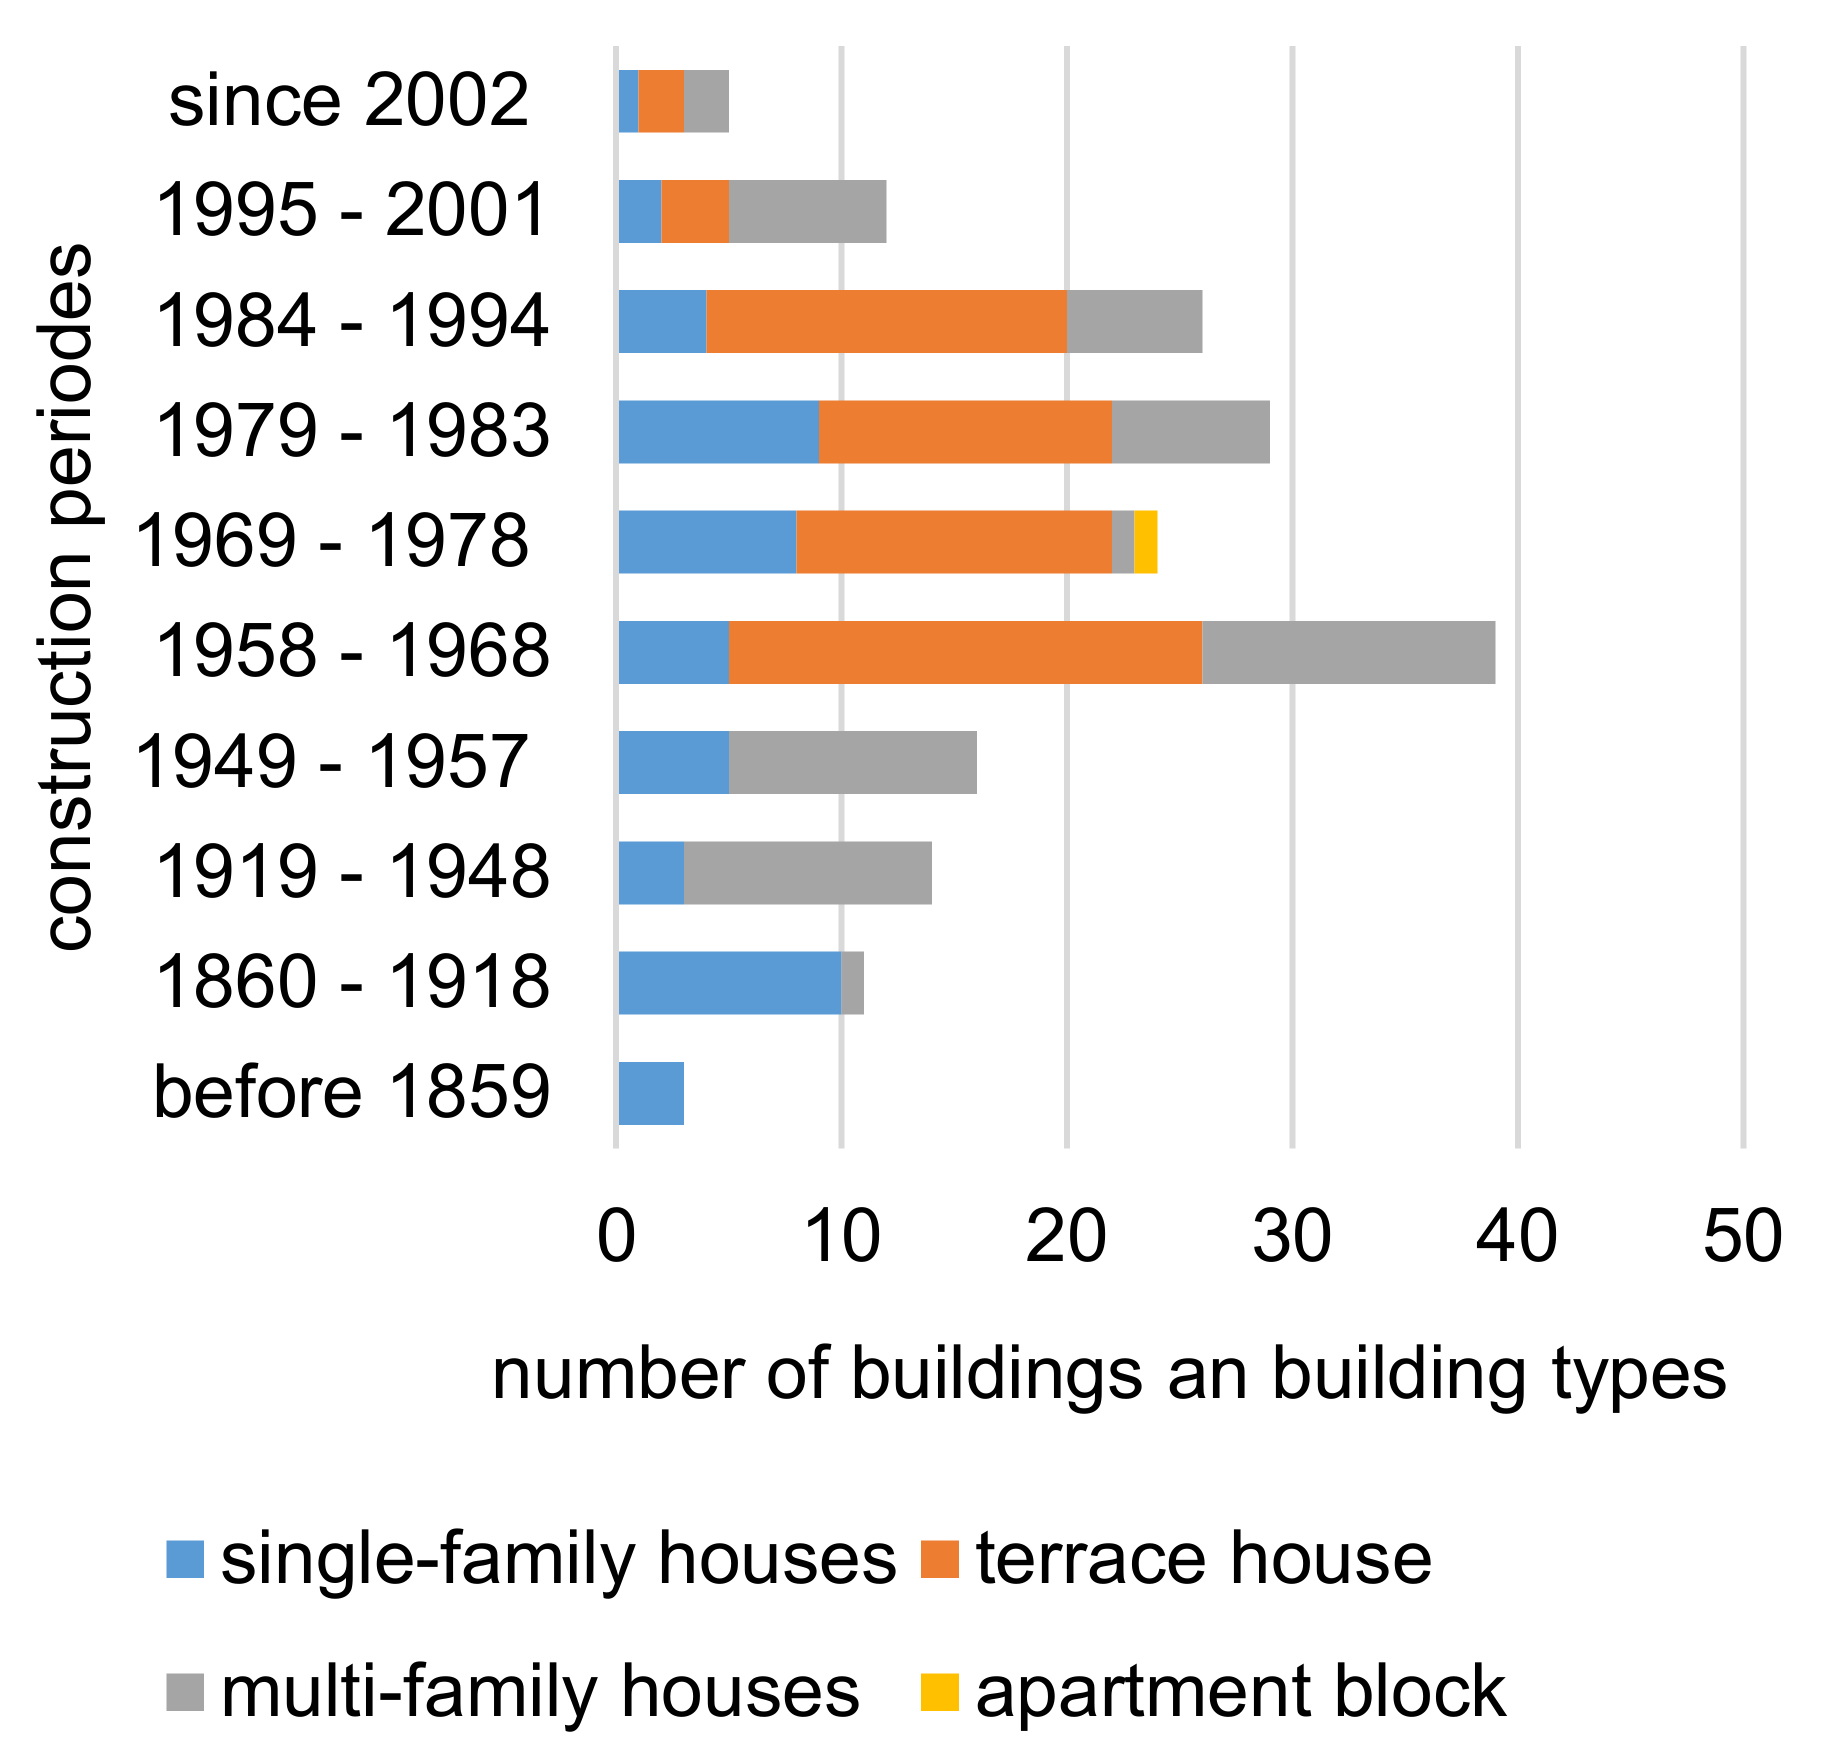
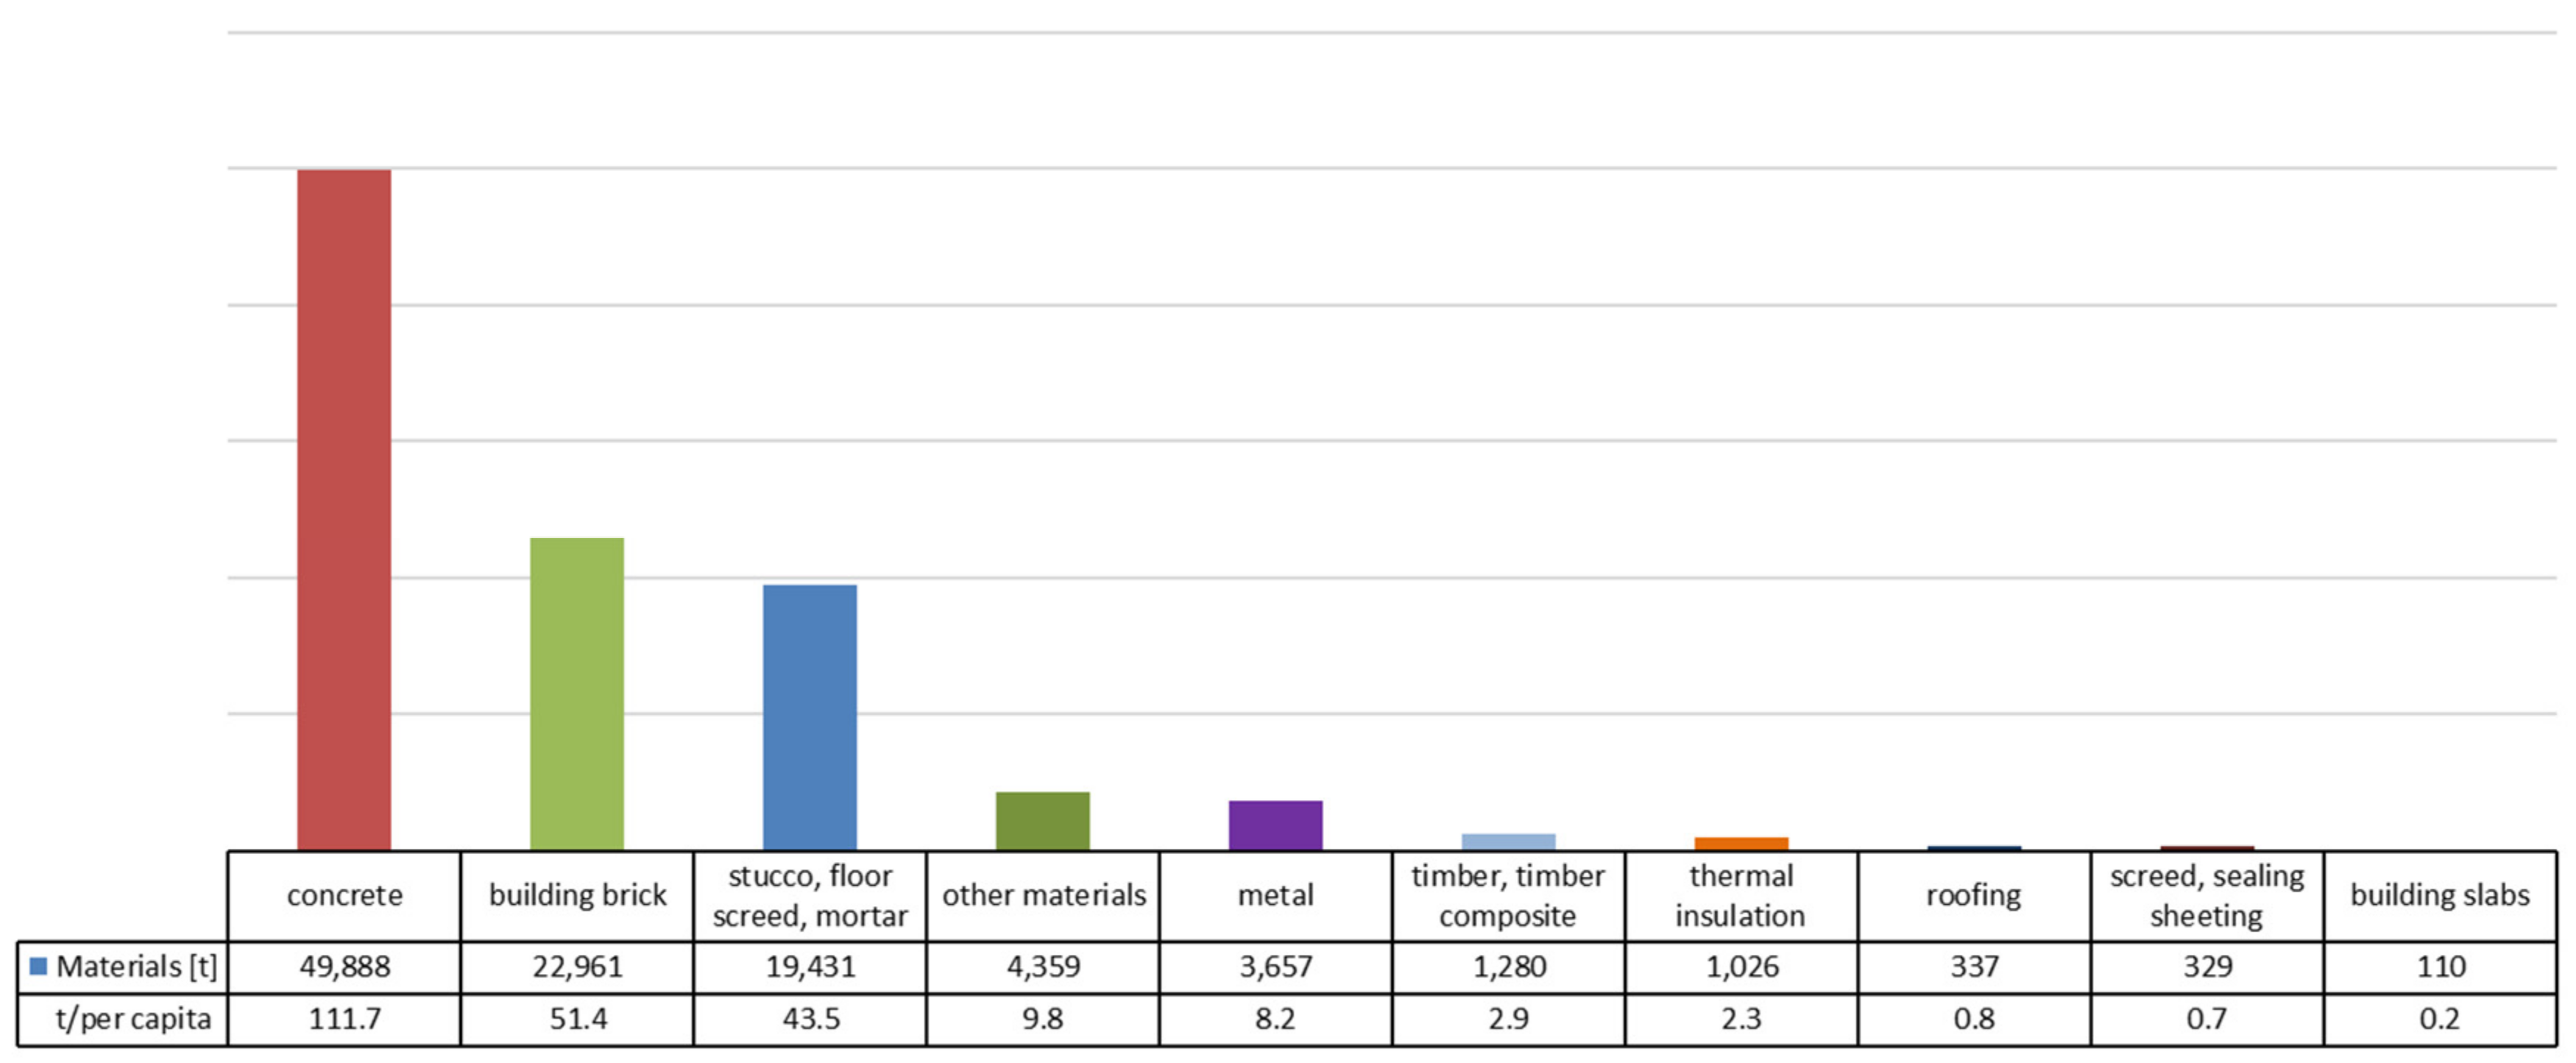
Chart 1 shows the construction periods of the buildings in the study. In total, there were twenty-six different IWU building typologies used to determine the building stock in the study area. Significant construction activity occurred in the period between 1958–1968. This spike in building is likely linked to the establishment of the Ruhr-University Bochum in 1965 [56], which is located close to the neighborhood. It is also notable that terrace houses were also starting to be built during this period, also due to the booming demand for residential buildings during these years. Likewise, a renewal of the built environment was initiated during this period. Thus, in the study area, old buildings were being demolished while new buildings were being built. Chart 2 presents the total weight of each material group for the entire residential buildings in the study area calculated using the IOER-method. A significant part of the total mass (approximately 103.5 kt) consists of concrete with 49,888 t, corresponding to approximately 48.3%. The material category of brick makes up approximately 22.2%; stucco, floor screed, mortar around 18.8%. The category of other materials is approximately 4.2% (metal approximately 3.5%; timber and timber composite approximately 1.24%, and thermal insulation approximately 1%). The remaining mass is made up of roofing/screed, sealing sheets, and building slabs. The calculation delivered a result of approximately 231.5 tons per capita of material stock.
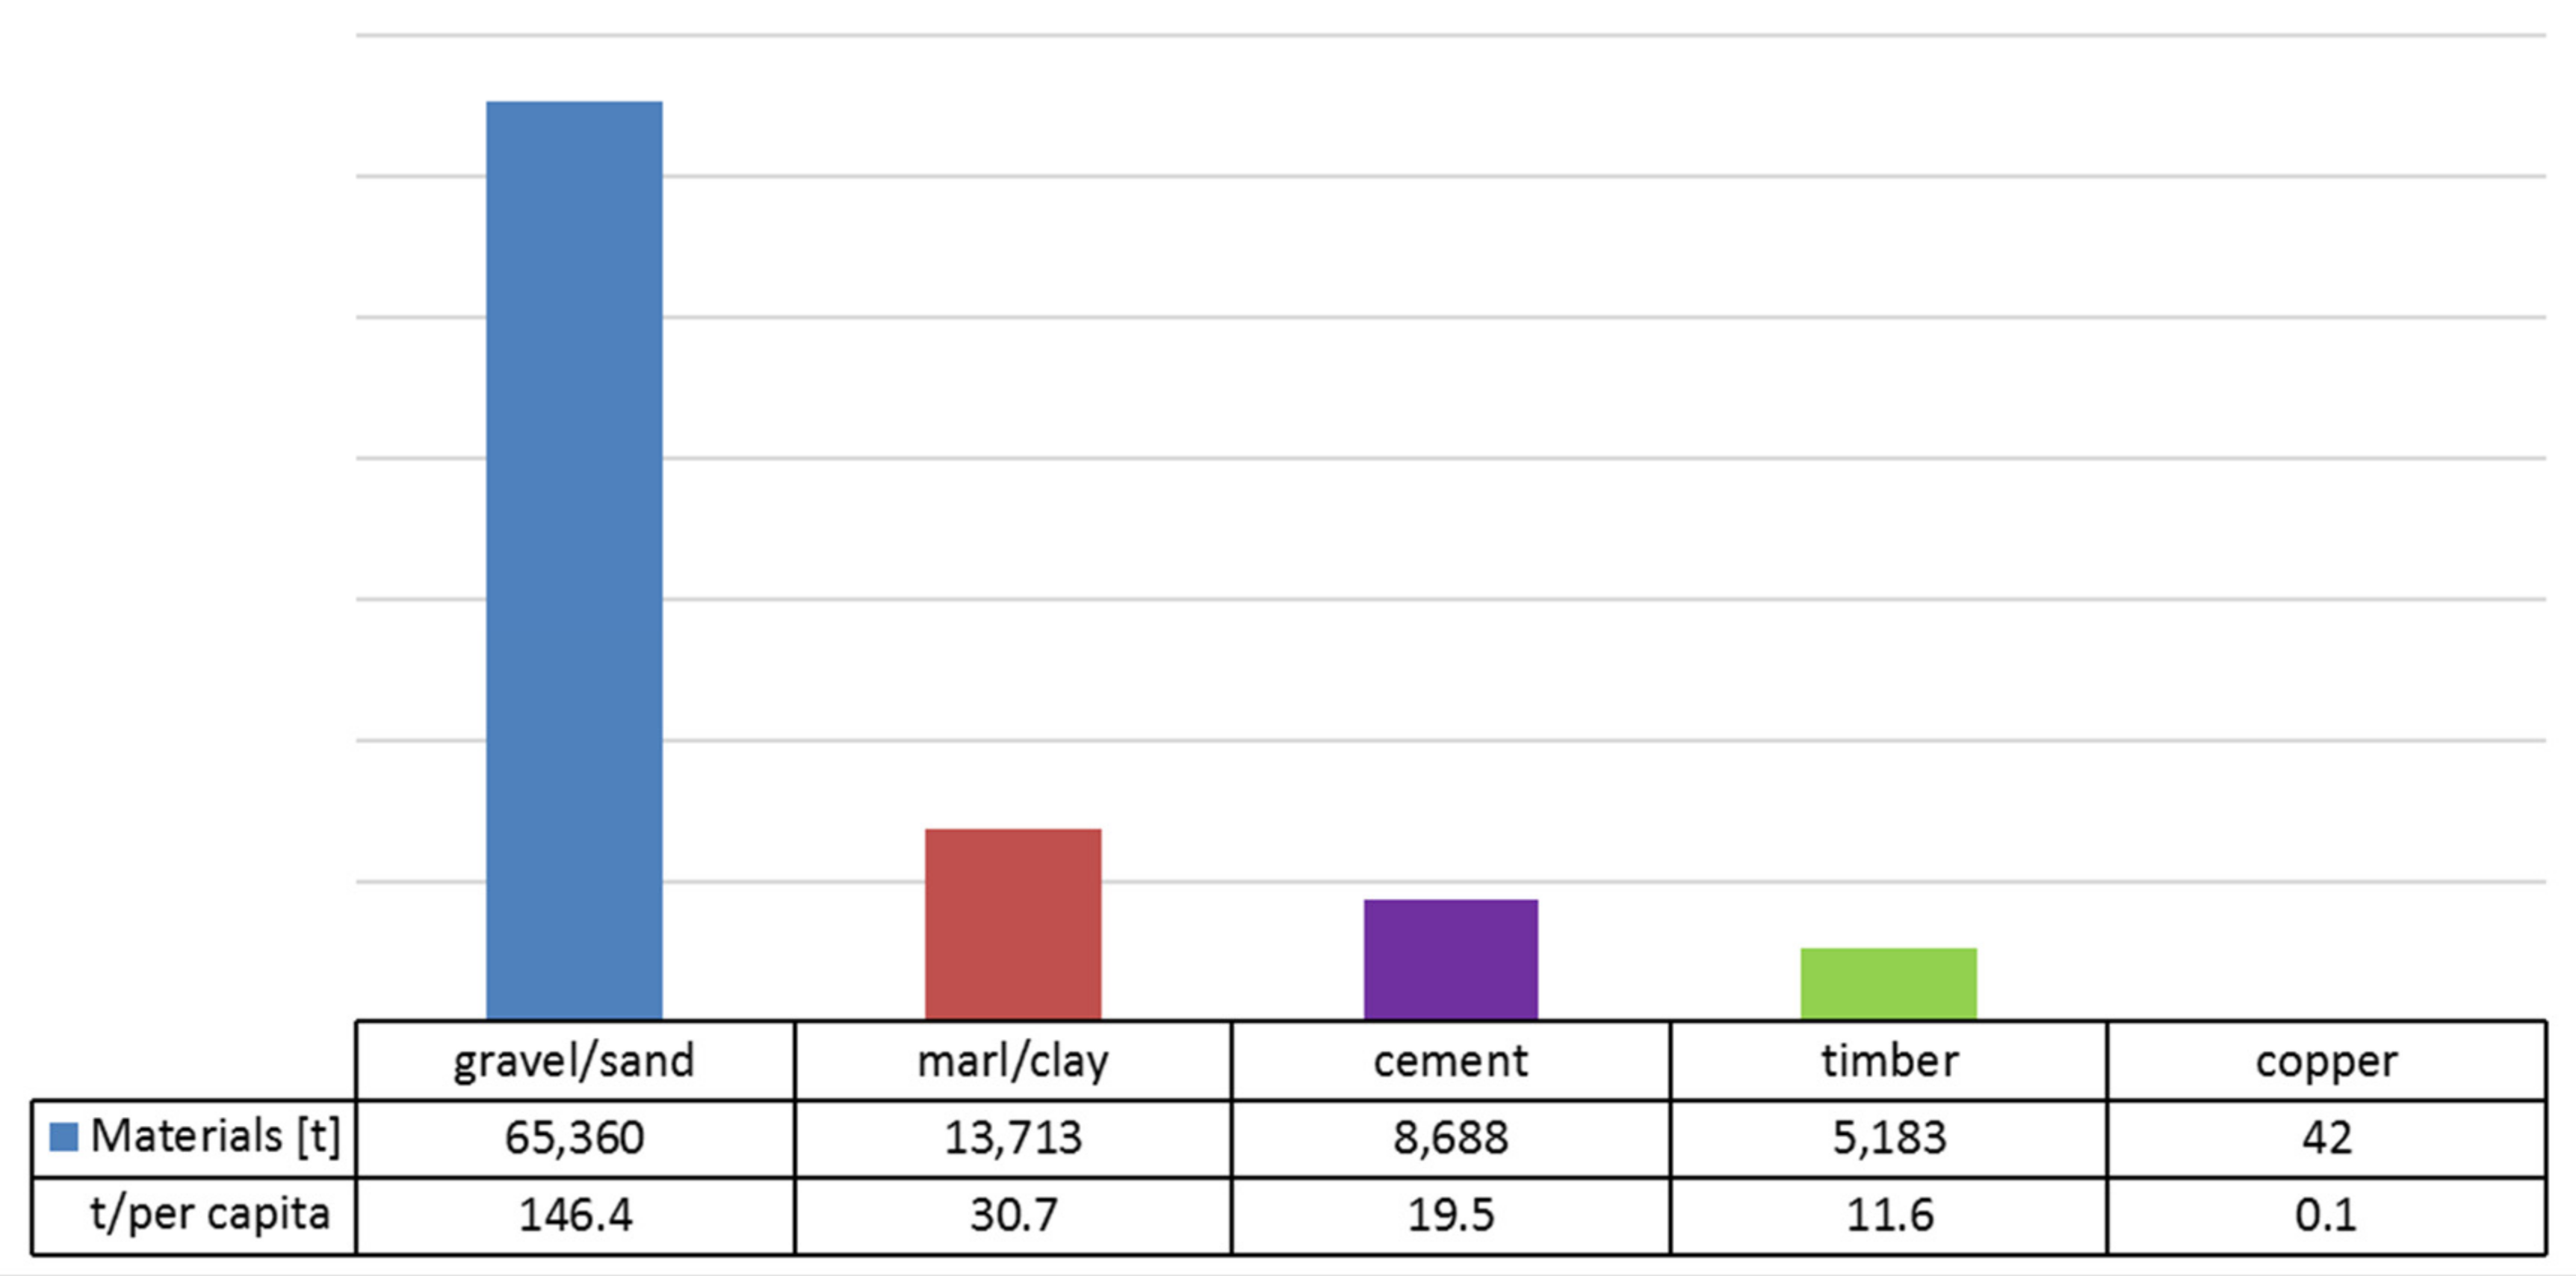
The results of the material tabulation using the ARK-method are shown in Chart 3. The total mass in the study area is calculated at 93 kt. The largest part of the material consists of gravel and sand, which, with 65,360 t, makes up approximately 70.3% of the mass. Marl and clay make up approximately 14.75%, and cement approximately 9.3% of the mass. The remaining mass is split between approximately 5.5% timber and 0.1% cooper. The calculation delivered a result of approximately 208.2 tons per capita of material stock.
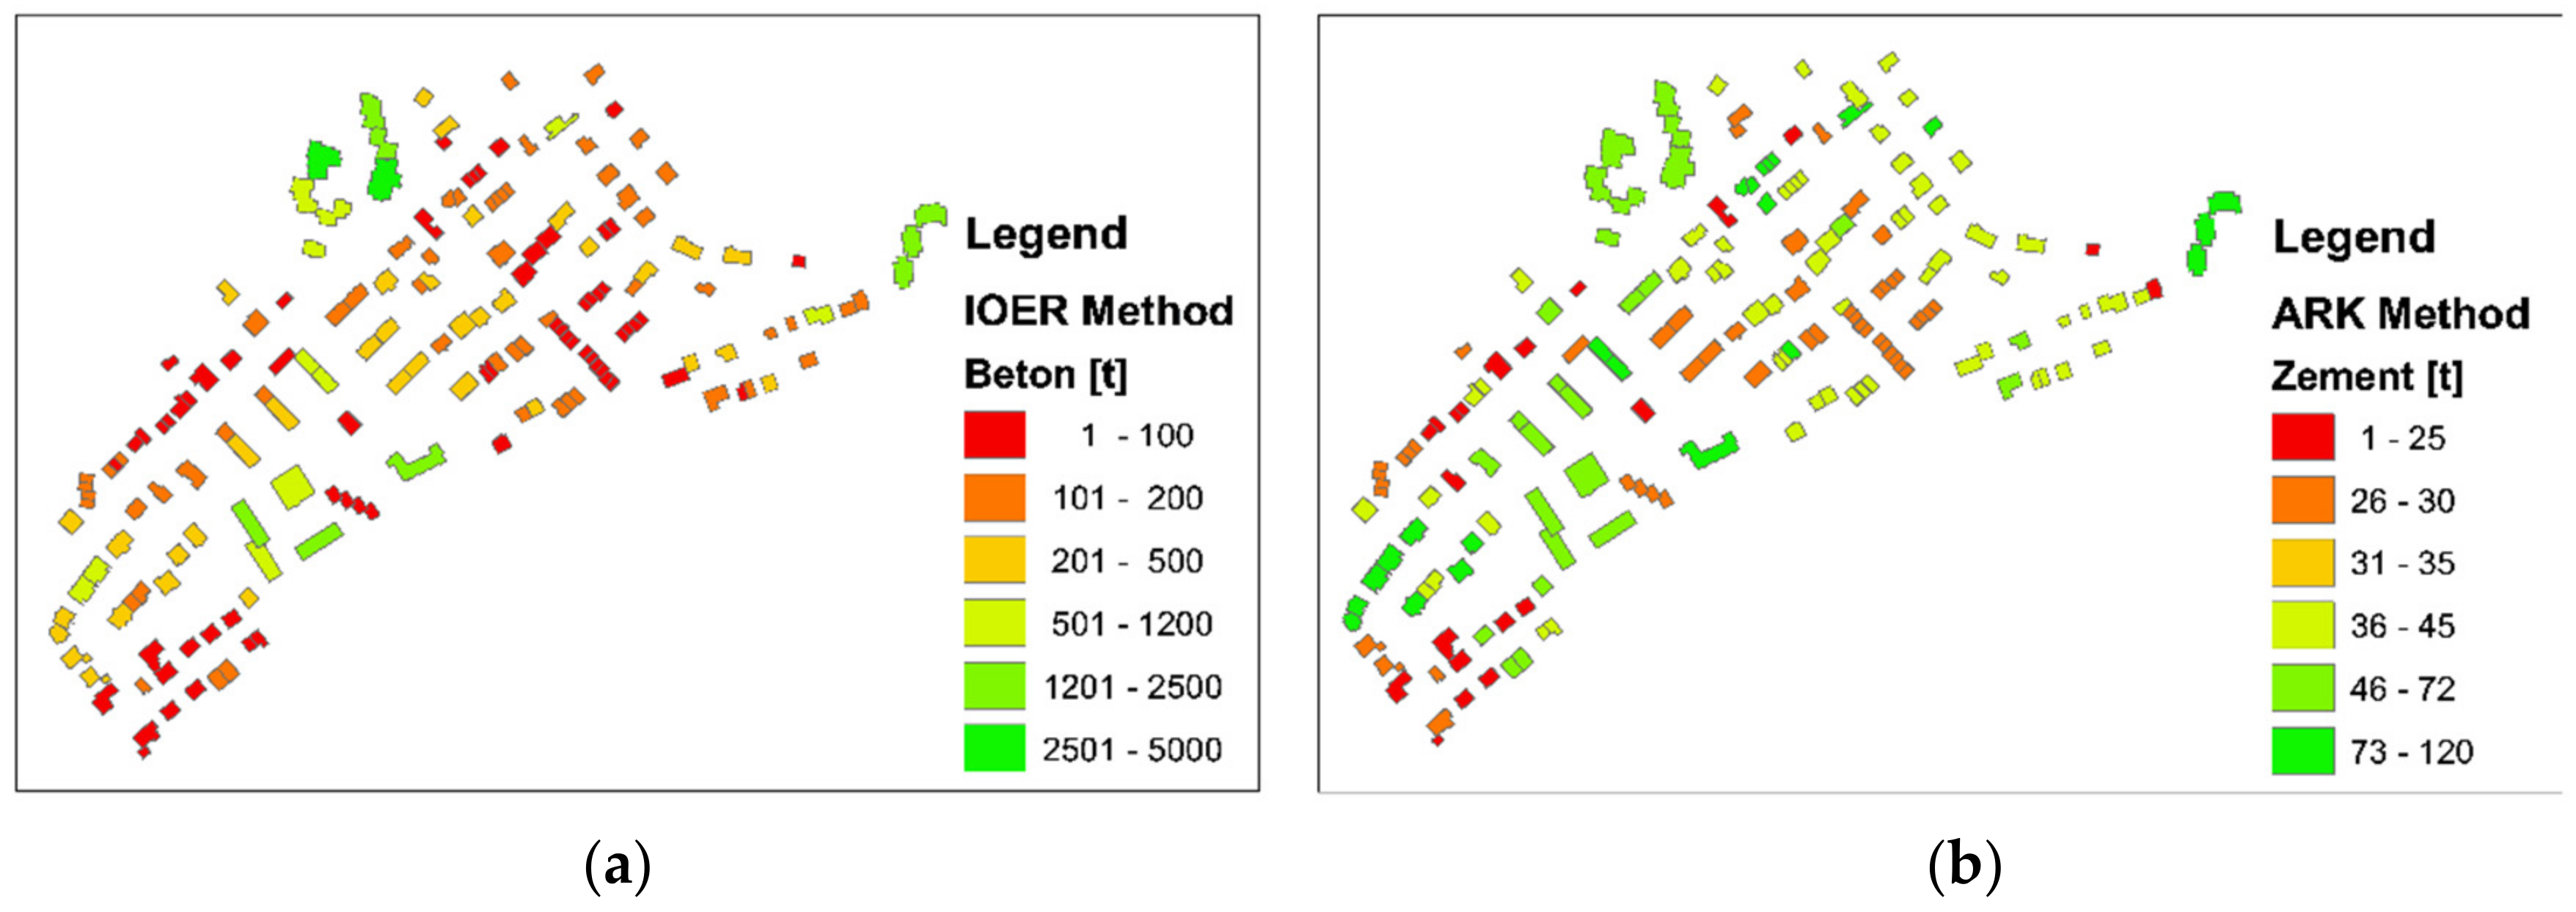
Figure 5 shows examples of the GIS resource cadaster for the different materials and the values from expert literature for the study area.
4. Discussion
This case study illustrates how to create a “cadaster of secondary resources” for residential building stock in order to quantify the available anthropogenic stock. To make the stock accessible, we first estimated the material quantities with their individual composition and then extrapolated the results to regional level. As noted above, the material stock in residential buildings depends both on their specific structure and on their specific year of construction.
By identifying these characteristics, a resource cadaster was created by combining appropriate data from prior studies with GIS for an exemplary area. The resource cadaster provides a spatial visualization of the quantities of available material stock, divided into sixteen building material fractions, for a specific residential building quarter in the Rhine-Ruhr metropolitan area—a typical urban area in Germany. The information was structured by using GIS. The created dataset can be expanded to a wider area according to the set parameters. Employing IWU typologies [44] simplified the process of determining the construction periods in the study area, as the dataset underlying the typologies are detailed, in-depth, and accurate. Although only 75% of the IWU typologies were assigned to the residential building stock, it can be reasonably argued that the study area characterizes a typical residential area in the metropolitan Rhine-Ruhr area, even though the area covers only approximately 0.003% of the entire area. The calculated material stock in tons per capita (231.5 tons per capita according to IOER-method; 208.2 tons per capita according to ARK-method) are comparable with the results of Kleemann et al. [41] (210 tons per capita) and Schneider et al. [13] (195 tons per capita). This study’s focus, however, differs in that it aimed to create a regional resource cadaster. In addition to assessing the material value of a city, it is useful for documenting and locating the material fractions in detail. Mapping and cadastering potential regional storage provides orientation for meeting future emerging material demands in an energy efficient manner. Furthermore, it allows for meeting and coordinating specific demands for secondary material, for example for road construction, by reusing regionally sourced materials. Additionally, the appearance of or the expectation of a secondary material stream can be estimated by using this method.
4.1. Existing Data
Gruhler et al. [28] relate their values to the size of building, as briefly described in the typologies. The material values of Lichtensteiger and Baccini [32] refer to model buildings created based on statistical data. The difference between the values of these two studies is not only limited to the calculation of the specific material values, but also in terms of the investigated materials. For example, whereas Gruhler et al. [28] relate their calculations to categories of building materials such as concrete brick, and others, Lichtensteiger and Baccini [32] relate their calculations to non-identical categories of material such as gravel/sand, cement, and other materials used to produce mineral construction materials. The total result of the material in the study area indicates a significant difference of 10% of the total mass. Keeping in mind that the latest values Gruhler et al. [28] provide are from 1990, and Lichtensteiger and Baccini’s study [32] refers only to Switzerland, and that within that studies, different materials were analyzed, our results are within an acceptable range. Still, the previous studies’ data limitations presented affect our study in different ways. It is thus not possible to state with absolute certainty which data values based on prior studies are best suited to our study area. In an attempt to explain the differences in the results, the study by Gruhler et al. (2002) [28] has the advantage of relating the material values to the building’s size, whereas Lichtensteiger and Baccini’s [32] method calculates the total mass of a building based on statistical data. Our study calculates AGFA by multiplying AShape by total floor count. Thus, it can be assumed that the AGFA calculation is not exact. Nevertheless, the developed method still allows for an expandable and improvable process, as the steps to be followed are not rigid. Our approach could thus contribute to improving the methodological procedures for assessing a region’s anthropogenic stock.
A further limitation of the values provided by previous studies is the lack of data on constructions built after 2000.
4.2. Expanded Dataset
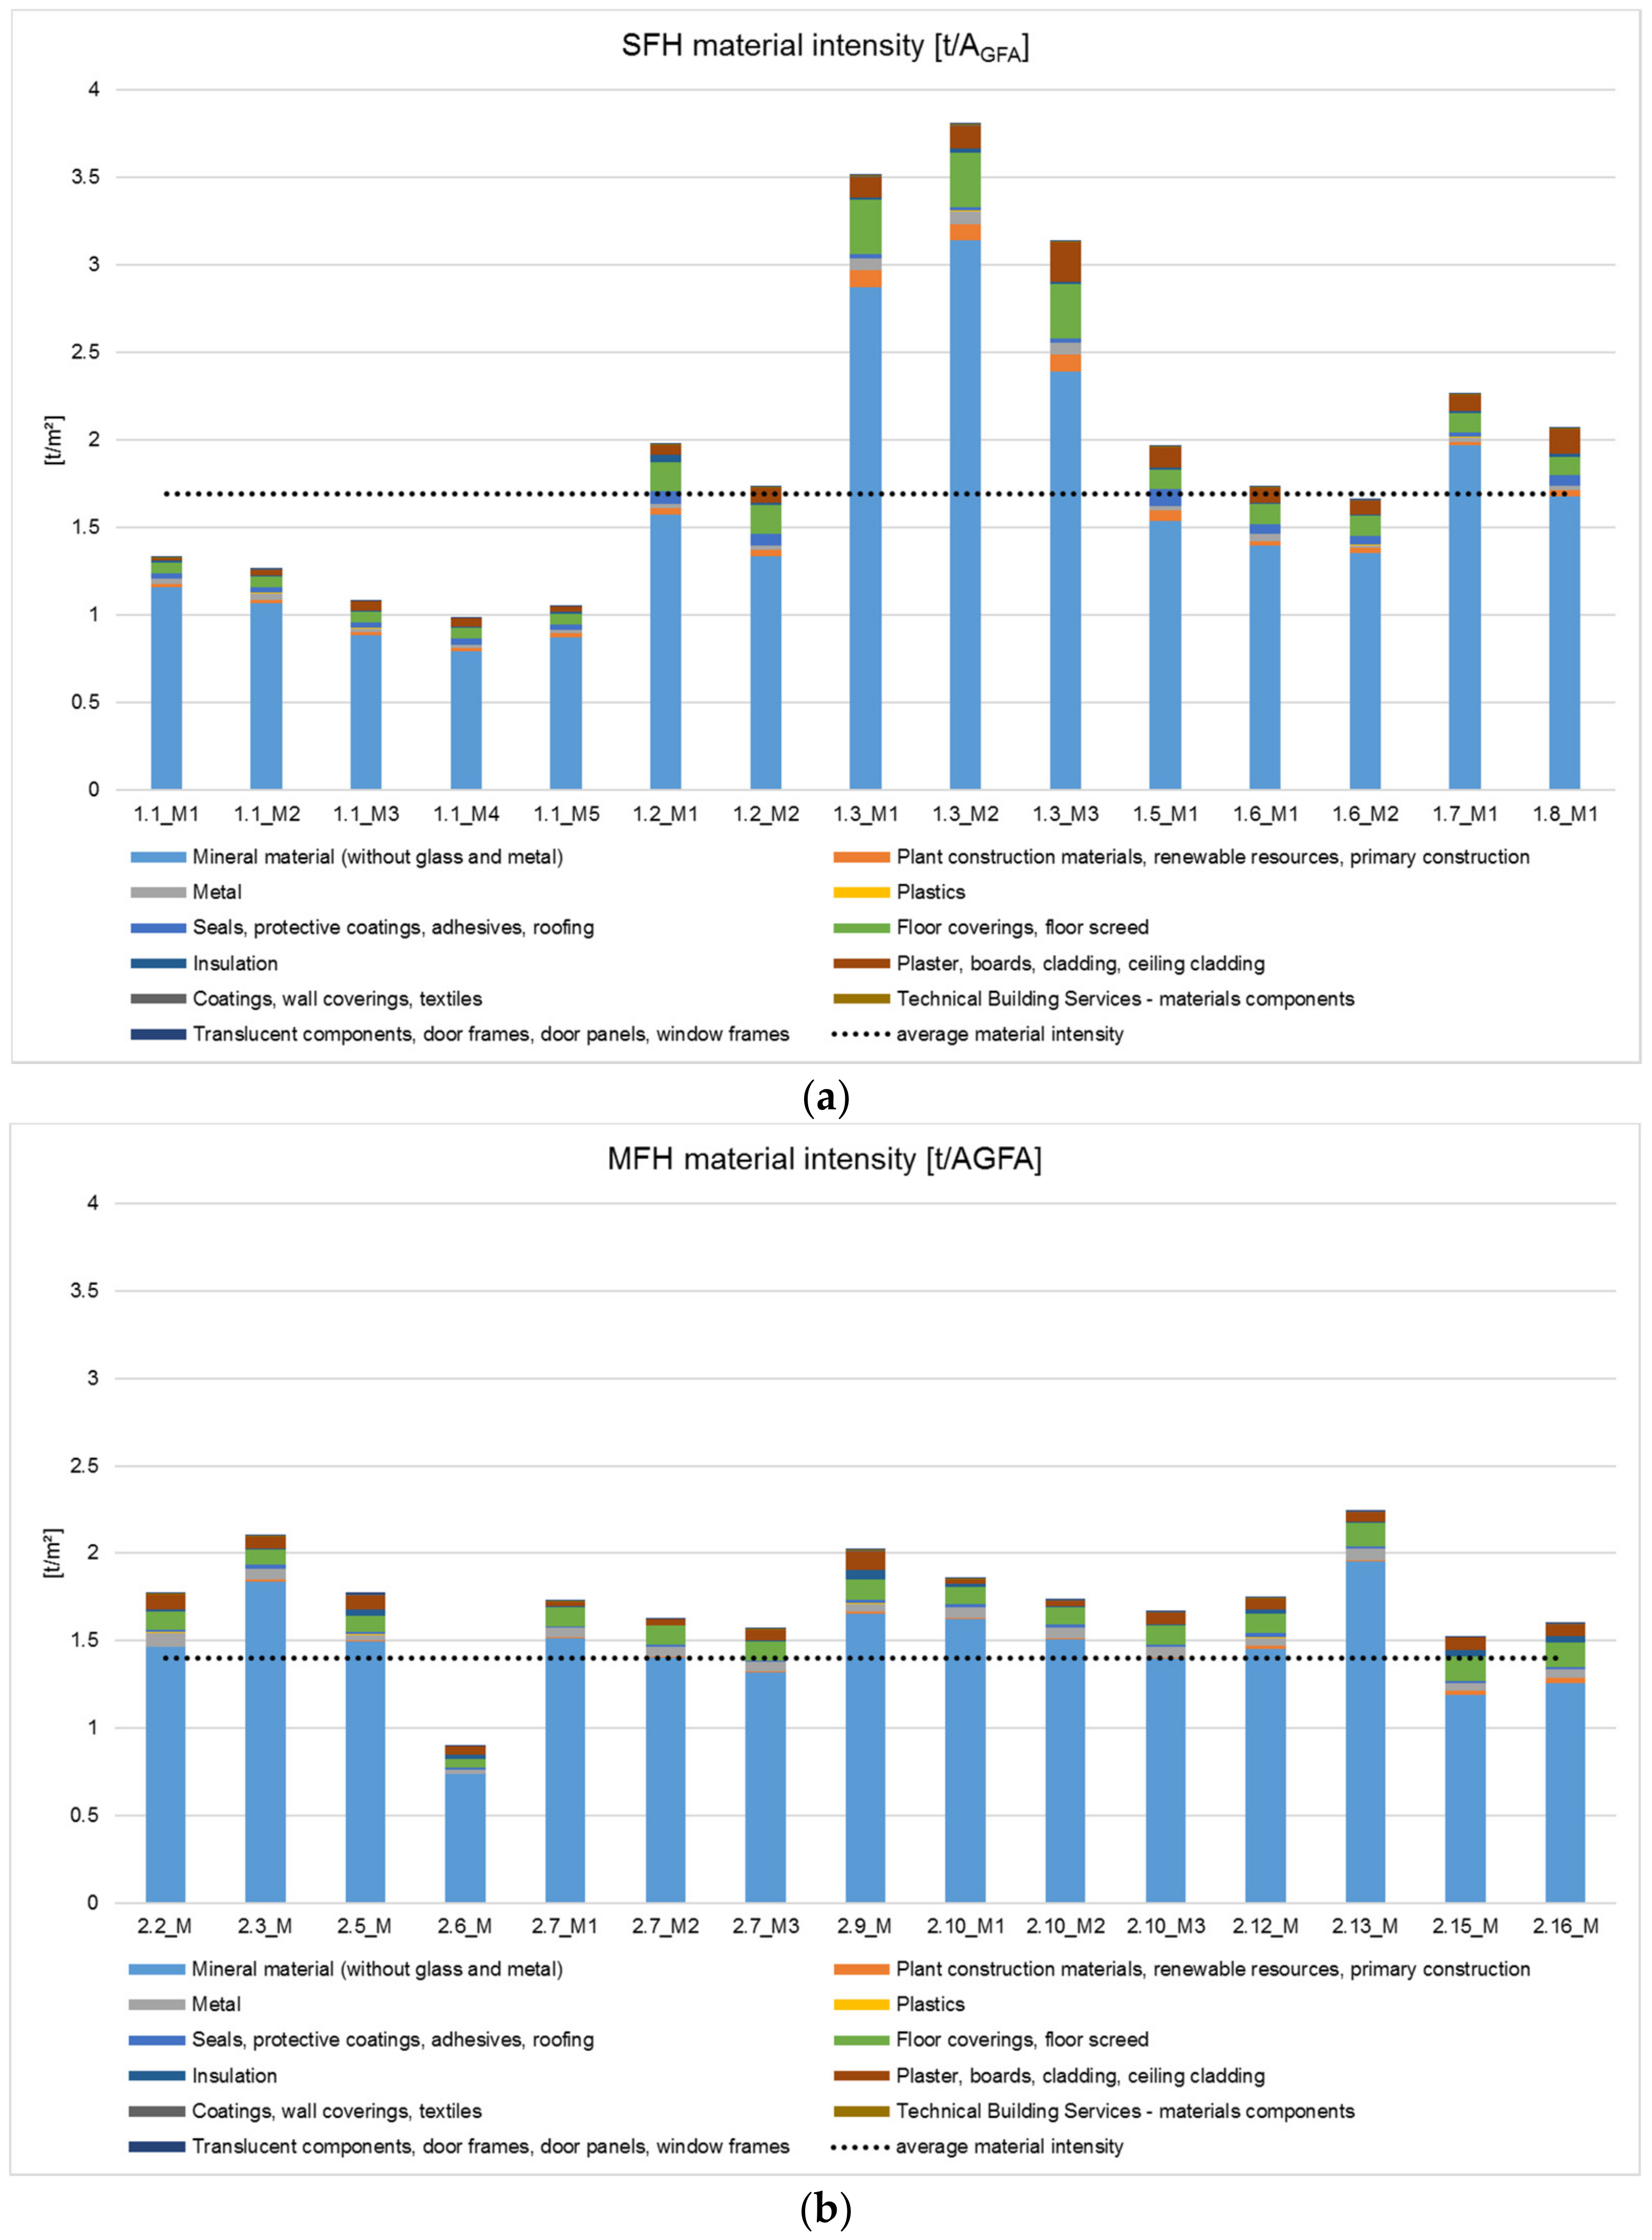
The material values provided by Gruhler et al. [28] (data until 1990) show that the material intensity of newer constructions is decreasing. In terms of recently constructed buildings (twenty-first century), we analyzed a total of fifteen SFHs and fifteen MFHs. The results of the total material intensity are shown in the Chart 4a,b. The material intensity (a size of a mass unit for a specific material contained in a geometric unit [31] see Section 1) of the buildings were calculated during the research project “Greenhouse gas balances for timber buildings—Implementation of new requirements for life-cycle-assessments and calculation of empiric substitution factors (GHG—timber buildings)” [57], whereby the life-cycle-assessments (LCA) for buildings were analyzed according to DIN EN15804:2012 [58]. The LCA results were verified through a critical review process. This accurate method of calculation allows for a high level of detail, and average values for SFH and MFH were calculated for eleven different categories of material. The average material intensity value for SFHs is 1.7 t/AGFA. The average material intensity value for MFHs is 1.4 t/AGFA. Based on our results, we were able to verify that the material intensity continues to decrease.
The result, however, should not lead to the false assumption that the total volume of material stock in a residential building is likewise decreasing, as the decrease in material intensity rates corresponds to an increase in the size of buildings.
4.3. Extrapolation
In a further step, we extrapolated our values to the federal state of North Rhine-Westphalia, whereby the material growth from 2008 to 2015 in the residential buildings sector was calculated in total to 54.8 megatons. The growth in the residential building sector for North Rhine-Westphalia per year is shown in Table 2 for each material category that we included in our study.
5. Outlook
This study deals with how secondary raw materials can be both localized and analyzed, in the largest urban area in Germany, on the basis of previously ascertained values and using the GIS as an integral tool, in line with the concept of urban mining. To access the available anthropogenic stock, both area-wide classification of material quantities and their regional localization is necessary.
It has been shown that the application of IWU typologies is suitable for the determination of the construction year of each building. The application of the existing datasets of IOER [28] and the ARK methods [32] has shown that the characteristical material values are well applicable in the GIS. The interaction between the different datasets are good implementable in the GIS as the results are in similar height and comparable spatial distributions in specific material fractions.
The developed methodical procedure in this paper could provide the foundation for the identification future (re)uses of the building stock. Furthermore, the methodical procedure can be performed to analyze the recycle potential in any region.
However, it is clear that important information about toxic substances detected through construction period analysis, for example, asbestos, needs to be included in the process of information collection. Additionally, the future development of construction material composites and the use in the new constructions has to be observed, as the separation of the material composite is at the moment technically not feasible. Only with these additional attributes realistic estimation of reusable building stock is possible.
Although the material compositions of residential buildings of older construction periods have already been analyzed in previous studies, in order to keep the resource cadastral register up-to-date, it is necessary to analyze newer buildings (from 2000 onwards), and to attach the values to the existing dataset of values. Likewise, changes in the construction types in the residential building sector must be taken into account before extrapolating the existing data to a forward-looking timeframe of 30, to 50, or even to 100 years. Our values show that, on the one hand, material intensity has decreased in the building sector. On the other hand, the gross floor area (footprint) of residential buildings has increased, but the distribution of the used material fractions are the same. This rather curious finding from our study begs further investigation in terms of reasons and influence on future calculations of the building stock. Moreover, in order to fulfill the general goals on resource efficiency in 2020 and 2050, we must have a better understanding of how GIS-based datasets of the building stock can contribute to reaching resource efficiency-based climate goals, for example, through mapping both recyclable secondary material and increased resource reuse rates.
To conclude, it must not be forgotten that increasing the use of the secondary materials must offer an economic advantage to both producers (CDW/demolition industry) and consumers (contractors/owners/inhabitants). While such issues above all require political decisions, our study hopes to offer some concrete steps in the direction of achieving a circular economy.
Acknowledgments
We acknowledge support from the DFG Open Access Publication Funds of the Ruhr-Universität Bochum.
Author Contributions
The work presented in this article is a collaborative development by all of the authors.
Conflicts of Interest
The authors declare no conflict of interest.
References
- European Commission. Resource Efficiency-Environment-European Commission. 2016. Available online: http://ec.europa.eu/environment/resource_efficiency/about/challenge/index_en.htm (accessed on 18 April 2017).
- European Commission. The Communication from the Commission to the European Parliament, the Council, the European Economic and Social Committee and the Committee of the Regions. A Resource-Efficient Europe—Flagship Initiative under the EU 2020 Strategy. 2016. Available online: http://www.cbss.org/wp-content/uploads/2012/10/resource_efficient_europe_en.pdf (accessed on 18 April 2017).
- European Commission. The Communication from the Commission to the European Parliament, the Council, the European Economic and Social Committee and the Committee of the Regions. Roadmap to a Resource Efficient Europe. 2011. Available online: http://eur-lex.europa.eu/legal-content/EN/TXT/HTML/?uri=CELEX:52011DC0571&from=EN (accessed on 18 April 2017).
- The European Federation of Associations of Environmental Professionals (Ed.) Bulletin of the European Network of Environmental Professionals. The Circular Economy. ENEP Bulletin 34, 2016. Available online: http://www.efaep.org/sites/enep/files/ENEP_Bulletin%20-%20Issue%2034%20%28May-June%202016%29_0.pdf (accessed on 18 April 2017).
- Huch, M.; Matschullat, J.; Wycisk, P. (Eds.) Im Einklang mit der Erde. Geowissenschaften für die Zukunft; Springer: Berlin, Germany, 2002; ISBN 3-540-42227-7. [Google Scholar]
- Baas, L.; Krook, J.; Eklund, M.; Svensson, N. Industrial ecology looks at landfills from another perspective. Reg. Dev. Dialogue 2010, 31, 169–182. [Google Scholar]
- Brunner, P.H.; Rechberger, H. Practical Handbook of Material Flow Analysis. Advanced Methods in Resource and Waste Management Series; Lewis Publishers: Boca Raton, FL, USA, 2003; ISBN 978-1-56670-604-9. [Google Scholar]
- Krausmann, F.; Gingrich, S.; Eisenmenger, N.; Erb, K.-H.; Haberl, H.; Fischer-Kowalski, M. Growth in global materials use, GDP and population during the 20th century. Ecol. Econ. 2009, 68, 2696–2705. [Google Scholar] [CrossRef]
- Rechberger, H.; Clement, D. Urban Mining—Städtebauliche Rohstoff-Potenziale. Tagungsband Beitr. Baubetr. Bauwirtsch. Baumanag. 2011, 4, 211–217. [Google Scholar]
- European Commission. Service Contract on Management of Construction and Demolition Waste—SR1. Final Report Task 2. 2011. Available online: http://ec.europa.eu/environment/waste/pdf/2011_CDW_Report.pdf (accessed on 18 April 2017).
- European Parliament. European Waste Framework Directive. 2008/98/EG, Brussels. 2008. Available online: http://eur-lex.europa.eu/legal-content/EN/TXT/PDF/?uri=CELEX:32008L0098&from=EN (accessed on 18 April 2017).
- Hashimoto, S.; Tanikawa, H.; Moriguchi, Y. Framework for estimating potential wastes and secondary resources accumulated within an economy—A case study of construction minerals in Japan. Waste Manag. (N. Y.) 2009, 29, 2859–2866. [Google Scholar] [CrossRef] [PubMed]
- Schneider, M.; Rubli, S. Ressourcenmodell der mineralischen Baustoffe auf der Ebene Stadt Zürich. Dynamische Modellierung 1995–2050; Wertstoff-Börse GmbH: Schlieren, Switzerland, 2009. [Google Scholar]
- Bergsdal, H.; Bohne, R.A.; Brattebø, H. Projection of Construction and Demolition Waste in Norway. J. Ind. Ecol. 2007, 11, 27–39. [Google Scholar] [CrossRef]
- Stäubli, B.; Winzeler, R. Bau und Rückbau im Kanton Zürich: Modell für die Materialflüsse 1900 bis 2008. Müll und Abfall 2011, 6, 262–270. [Google Scholar]
- Flamme, S. About Urban Mining. Available online: http://urbanmining.at/about (accessed on 18 April 2017).
- Bonifazi, G.; Cossu, R. The Urban Mining concept. Waste Manag. (N. Y.) 2013, 33, 497–498. [Google Scholar] [CrossRef]
- Brunner, P.H. Urban Mining A Contribution to Reindustrializing the City. J. Ind. Ecol. 2011, 15, 339–341. [Google Scholar] [CrossRef]
- Spatari, S.; Bertram, M.; Gordon, R.B.; Henderson, K.; Graedel, T.E. Twentieth century copper stocks and flows in North America. A dynamic analysis. Ecol. Econ. 2005, 54, 37–51. [Google Scholar] [CrossRef]
- Graedel, T.E. The prospects for urban mining. Bridge 2011, 41, 43–50. [Google Scholar]
- Zhu, X. GIS and urban mining. Resource 2014, 3, 235–247. [Google Scholar] [CrossRef]
- Gordon, R.B.; Bertram, M.; Graedel, T.E. Metal stocks and sustainability. Proc. Natl. Acad. Sci. USA 2006, 103, 1209–1214. [Google Scholar] [CrossRef] [PubMed]
- Daigo, I.; Igarashi, Y.; Matsuno, Y.; Adachi, Y. Accounting for Steel Stock in Japan. ISIJ Int. 2007, 47, 1065–1069. [Google Scholar] [CrossRef]
- Fishman, T.; Schandl, H.; Tanikawa, H.; Walker, P.; Krausmann, F. Accounting for the Material Stock of Nations. J. Ind. Ecol. 2014, 18, 407–420. [Google Scholar] [CrossRef] [PubMed]
- Marcellus-Zamora, K.A.; Gallagher, P.M.; Spatari, S.; Tanikawa, H. Estimating Materials Stocked by Land-Use Type in Historic Urban Buildings Using Spatio-Temporal Analytical Tools. J. Ind. Ecol. 2016, 20, 1025–1037. [Google Scholar] [CrossRef]
- Daigo, I.; Hashimoto, S.; Matsuno, Y.; Adachi, Y. Material stocks and flows accounting for copper and copper-based alloys in Japan. Resour. Conserv. Recycl. 2009, 53, 208–217. [Google Scholar] [CrossRef]
- Tanikawa, H.; Fishman, T.; Okuoka, K.; Sugimoto, K. The Weight of Society over Time and Space. A Comprehensive Account of the Construction Material Stock of Japan, 1945–2010. J. Ind. Ecol. 2015, 19, 778–791. [Google Scholar] [CrossRef]
- Gruhler, K.; Böhm, R.; Deilmann, C.; Schiller, G. Stofflich-energetische Gebäudesteckbriefe-Gebäudevergleiche und Hochrechnungen für Bebauungsstrukturen; Leibniz Institut of Ecological Urban and Regional Development (IÖR-Schriften, 38): Dresden, Germany, 2002. [Google Scholar]
- DIN 267–1. Kosten im Bauwesen—Teil 1: Hochbau; DIN—German Institute for Standardization: Berlin, Germany, 1982.
- DIN 277–1. Grundflächen und Rauminhalte im Bauwesen—Teil 1: Hochbau; DIN—German Institute for Standardization: Berlin, Germany, 2016.
- Hashimoto, S.; Tanikawa, H.; Moriguchi, Y. Where will large amounts of materials accumulated within the economy go?—A material flow analysis of construction minerals for Japan. Waste Manag. (N. Y.) 2007, 27, 1725–1738. [Google Scholar] [CrossRef] [PubMed]
- Lichtensteiger, T.; Baccini, P. Exploration of urban stock. J. Environ. Eng. Manag. 2008, 1, 41–48. [Google Scholar]
- Schebek, L.; Schnitzer, B.; Blesinger, D.; Köhn, A.; Miekley, B.; Linke, H.J.; Lohmann, A.; Motzko, C.; Seemann, A. Material stocks of the non-residential building sector. The case of the Rhine-Main area. Resour. Conserv. Recycl. 2016. [Google Scholar] [CrossRef]
- Ortlepp, R.; Gruhler, K.; Schiller, G.; Deilmann, C. The other “half of the city”—Analysis of non-residential building stock and its materials. In Proceedings of the Smart and Sustainable Building Environment Conference 2015, Sands Expo and Convention Centre, Marina Bay Sands, Singapore, 2–4 September 2015. [Google Scholar]
- Schiller, G.; Ortlepp, R.; Krauß, N.; Steger, S.; Schütz, H.; Fernández, J.A.; Reichenbach, J.; Wagner, J.; Baumann, J. Kartierung des Anthropogenen Lagers in Deutschland zur Optimierung der Sekundärrohstoffwirtschaft; Text 83/2015, UBA-FB 002211; Umweltbundesamt: Dessau-Roßlau, Germany, 2015. [Google Scholar]
- Van Beers, D.; Graedel, T.E. The Magnitude and Spatial Distribution of In-use Copper Stocks in Cape Town, South Africa. S. Afr. J. Sci. 2003, 99, 61–69. [Google Scholar]
- Wang, T.; Müller, D.B.; Graedel, T.E. Forging the Anthropogenic Iron Cycle. Environ. Sci. Technol. 2007, 41, 5120–5129. [Google Scholar] [CrossRef] [PubMed]
- Kral, U.; Lin, C.-Y.; Kellner, K.; Ma, H.-W.; Brunner, P.H. The Copper Balance of Cities: Exploratory Insights into a European and an Asian City. J. Ind. Ecol. 2014, 18, 432–444. [Google Scholar] [CrossRef] [PubMed]
- Kohler, N.; Yang, W. Long-term management of building stocks. Build. Res. Inf. 2007, 35, 351–362. [Google Scholar] [CrossRef]
- Wallsten, B.; Magnusson, D.; Andersson, S.; Krook, J. The economic conditions for urban infrastructure mining: Using GIS to prospect hibernating copper stocks. Resour. Conserv. Recycl. 2015, 103, 85–97. [Google Scholar] [CrossRef]
- Kleemann, F.; Lederer, J.; Rechberger, H.; Fellner, J. GIS-based Analysis of Vienna’s Material Stock in Buildings. J. Ind. Ecol. 2016, 13, 368–380. [Google Scholar] [CrossRef]
- Kleemann, F.; Lehner, H.; Szczypińska, A.; Lederer, J.; Fellner, J. Using change detection data to assess amount and composition of demolition waste from buildings in Vienna. Resour. Conserv. Recycl. 2016. [Google Scholar] [CrossRef]
- Tanikawa, H.; Hashimoto, S. Urban stock over time. Spatial material stock analysis using 4d-GIS. Build. Res. Inf. 2009, 37, 483–502. [Google Scholar] [CrossRef]
- Institut Wohnen und Umwelt (Ed.) Deutsche Wohngebäudetypologie. Beispielhafte Maßnahmen zur Verbesserung der Energieeffizienz von typischen Wohngebäuden, 2nd expanded ed.; Institut Wohnen und Umwelt: Darmstadt, Germany, 2015; ISBN 978-3-941140-47-9. [Google Scholar]
- Kleeman, F.; Lederer, J.; Fellner, J. Combining GIS data sets and material intensities to estimate Vienna’s building stock. In Expanding Boundaries. Systems Thinking in the Built Environment, Proceedings of the Sustainable Built Environment (SBE) Regional Conference; Habert, G., Schlueter, A., Eds.; Vdf Hochschulverlag AG an der ETH Zürich: Zurich, Switzerland, 2016; pp. 274–278. [Google Scholar]
- Kleemann, F.; Lederer, J.; Aschenbrenner, P.; Rechberger, H.; Fellner, J. A method for determining buildings’ material composition prior to demolition. Build. Res. Inf. 2015, 44, 51–62. [Google Scholar] [CrossRef]
- Mastrucci, A.; Marvuglia, A.; Popovici, E.; Leopold, U.; Benetto, E. Geospatial characterization of building material stocks for the life cycle assessment of end-of-life scenarios at the urban scale. Resour. Conserv. Recycl. 2016. [Google Scholar] [CrossRef]
- Deilmann, C.; Krauß, N.; Gruhler, K.; Reichenbach, J. Sensitivitätsstudie zum Kreislaufwirtschaftspotenzial im Hochbau. Endbericht Stand 17 July 2014. Available online: https://www.ioer.de/fileadmin/internet/IOER_Projekte/PDF/FB_E/Endbericht_REP.pdf (accessed on 18 April 2017).
- Zhang, L.; Yuan, Z.; Bi, J. Estimation of Copper In-use Stocks in Nanjing, China. J. Ind. Ecol. 2012, 16, 191–202. [Google Scholar] [CrossRef]
- Working Committee of the Surveying Authorities of the Laender of the Federal Republic of Germany (AdV). Documentation on the Modelling of Geoinformation of Official Surveying and Mapping, 2015 (GEOInfoDoc) (Version 7.0.2). Available online: http://www.adv-online.de/Publications/AFIS-ALKIS-ATKIS-Project/binarywriterservlet?imgUid=8e1708ee-765f-8551-2357-c133072e13d6&uBasVariant=11111111-1111-1111-1111-111111111111 (accessed on 18 April 2017).
- TABULA. IEE Project TABULA, 2012–2016. Available online: http://episcope.eu/iee-project/tabula (accessed on 18 April 2017).
- EPISCOPE. Monitor Progress towards Climate Targets in European Housing Stocks. Main Results of the EPISCOPE Project: Final Project Report (Deliverable D1.2); Institut Wohnen und Umwelt GmbH: Darmstadt, Germany, 2016; ISBN 978-3-947740-56-1. Available online: http://episcope.eu/fileadmin/episcope/public/docs/reports/EPISCOPE_FinalReport.pdf (accessed on 2 June 2017).
- Regionalverband Ruhr. Lage und Geografie. Land & Leute (Lage und Geografie). 2016. Available online: http://www.metropoleruhr.de/land-leute/daten-fakten/lage-und-geografie.html (accessed on 18 April 2017).
- Bochum, Presseamt der Stadt: Bochumer Fakten/Infos. Available online: https://www.bochum.de/C125708500379A31/vwContentByKey/W277NAJW439BOLDDE (accessed on 18 April 2017).
- Bochum, Presseamt der Stadt: Die Wichtigsten Zahlen zur Bochumer Bevölkerung. Available online: https://www.bochum.de/C125708500379A31/vwContentByKey/W29GFAN9348BOCMDE (accessed on 18 April 2017).
- LWL. Internet-Portal ‘Westfälische Geschichte‘. LWL-Institut für westfälische Regionalgeschichte des Landschaftsverbandes Westfalen-Lippe (LWL). 2009. Available online: http://www.lwl.org/westfaelische-geschichte/portal/Internet/finde/langDatensatz.php?urlID=495&url_tabelle=tab_websegmente (accessed on 18 April 2017).
- Hafner, A.; Rüter, S.; Ebert, S.; Schäfer, S.; König, H.; Cristofaro, L.; Diederichs, S.; Kleinhenz, M.; Krechel, M. Treibhausgasbilanzierung von Holzgebäuden—Umsetzung neuer Anforderungen an Ökobilanzen und Ermittlung empirischer Substitutionsfaktoren (THG-Holzbau); Forschungsprojekt: 28W-B-3-054-01 Waldklimafonds. BMEL/BMUB; Universitätsverlag RUB: Bochum, Germany, 2017; ISBN 978-3-00-055101-7. Available online: http://www.ruhr-uni-bochum.de/reb/mam/content/thg_bericht-final.pdf (accessed on 2 June 2017).
- DIN EN 15804:2012. Sustainability of Construction Works—Environmental Product Declarations—Core Rules for the Product Category of Construction Products; German version EN 15804:2012+A1:2013; DIN—German Institute for Standardization: Berlin, Germany, 2014.
Figure 1.
Location of the study area in Bochum and the location of Bochum in Germany.

Figure 2.
Step-by-step model.

Figure 3.
Buildings with identifications numbers in the study area.

Figure 4.
Example of (a) External Data Catalogue and the (b) GIS implementation.

Chart 1.
Construction periodes of buildings in the study area.

Chart 2.
Result of the material mass calculated using the IOER-method.

Chart 3.
Result of the material mass calculated by the ARK method.

Figure 5.
Example resource cadaster for the study area (a) with the material values for concrete determined by the IOER-method and (b) cement determined by the ARK-method.
Figure 5.
Example resource cadaster for the study area (a) with the material values for concrete determined by the IOER-method and (b) cement determined by the ARK-method.

Chart 4.
Total material intensity and average values for (a) SFHs and (b) MFHs.


Table 1.
Materials by method.
| IOER-Method [28] | stucco, floor screed, mortar | concrete | building brick | building slabs | wood, wooden composite | thermal insulation |
| roofing | screed, sealing sheeting | other materials | filling | metal | - | |
| ARK-Method [32] | gravel/sand | marl/clay | cement | timber | copper | - |
Table 2.
Material stock growth of the residential building stock during 2008–2015 in North Rhine-Westphalia for each material group in ton (t) per year.
Table 2.
Material stock growth of the residential building stock during 2008–2015 in North Rhine-Westphalia for each material group in ton (t) per year.
| Years | Mineral Material (Without Glass and Metal) | Plant Construction Materials, Renewable Resources, Primary Construction | Metal | Plastics | Seals, Protective Coatings, Adhesives, Roofing | Floor Coverings, Floor Screed | Insulation | Plaster, Boards, Cladding, Ceiling Cladding | Coatings, Wall Coverings, Textiles | Technical Building Services-Materials Components | Translucent Components, Door frames, Door panels, Window Frames |
|---|---|---|---|---|---|---|---|---|---|---|---|
| 2008 | 5,564,641 | 104,957 | 147,636 | 7,725 | 116,250 | 460,762 | 56,420 | 274,994 | 7,970 | 12,197 | 12,687 |
| 2009 | 4,896,650 | 92,744 | 129,619 | 6,793 | 102,648 | 405,749 | 49,557 | 242,242 | 7,022 | 10,725 | 11,126 |
| 2010 | 5,106,554 | 95,146 | 136,375 | 7,106 | 105,612 | 421,930 | 52,051 | 251,571 | 7,286 | 11,217 | 11,757 |
| 2011 | 5,359,704 | 100,965 | 142,295 | 7,443 | 111,853 | 443,696 | 54,372 | 264,781 | 7,673 | 11,751 | 12,232 |
| 2012 | 5,742,926 | 104,892 | 154,979 | 8,021 | 116,846 | 472,883 | 59,033 | 281,506 | 8,143 | 12,658 | 13,429 |
| 2013 | 5,917,697 | 106,426 | 160,959 | 8,288 | 118,890 | 485,997 | 61,218 | 288,961 | 8,351 | 13,076 | 13,999 |
| 2014 | 6,633,780 | 110,845 | 186,884 | 9,409 | 125,556 | 538,288 | 70,613 | 318,255 | 9,159 | 14,830 | 16,520 |
| 2015 | 5,936,566 | 99,278 | 167,180 | 8,419 | 112,435 | 481,777 | 63,172 | 284,862 | 8,198 | 13,269 | 14,776 |
© 2017 by the authors. Licensee MDPI, Basel, Switzerland. This article is an open access article distributed under the terms and conditions of the Creative Commons Attribution (CC BY) license (http://creativecommons.org/licenses/by/4.0/).
Share and Cite
MDPI and ACS Style
Oezdemir, O.; Krause, K.; Hafner, A. Creating a Resource Cadaster—A Case Study of a District in the Rhine-Ruhr Metropolitan Area. Buildings 2017, 7, 45. https://doi.org/10.3390/buildings7020045
AMA Style
Oezdemir O, Krause K, Hafner A. Creating a Resource Cadaster—A Case Study of a District in the Rhine-Ruhr Metropolitan Area. Buildings. 2017; 7(2):45. https://doi.org/10.3390/buildings7020045
Chicago/Turabian StyleOezdemir, Oezlem, Karina Krause, and Annette Hafner. 2017. "Creating a Resource Cadaster—A Case Study of a District in the Rhine-Ruhr Metropolitan Area" Buildings 7, no. 2: 45. https://doi.org/10.3390/buildings7020045
Note that from the first issue of 2016, this journal uses article numbers instead of page numbers. See further details here.